Traffic Impact Area Detection and Spatiotemporal Influence Assessment for Disaster Reduction Based on Social Media: A Case Study of the 2018 Beijing Rainstorm

 ,
,  ,
,
Abstract
:1. Introduction
1.1. Extracting Multi-Dimensional Disaster-Related Information to Help Detect Traffic Impact Areas
1.2. Spatiotemporal Influence Assessment of Disasters
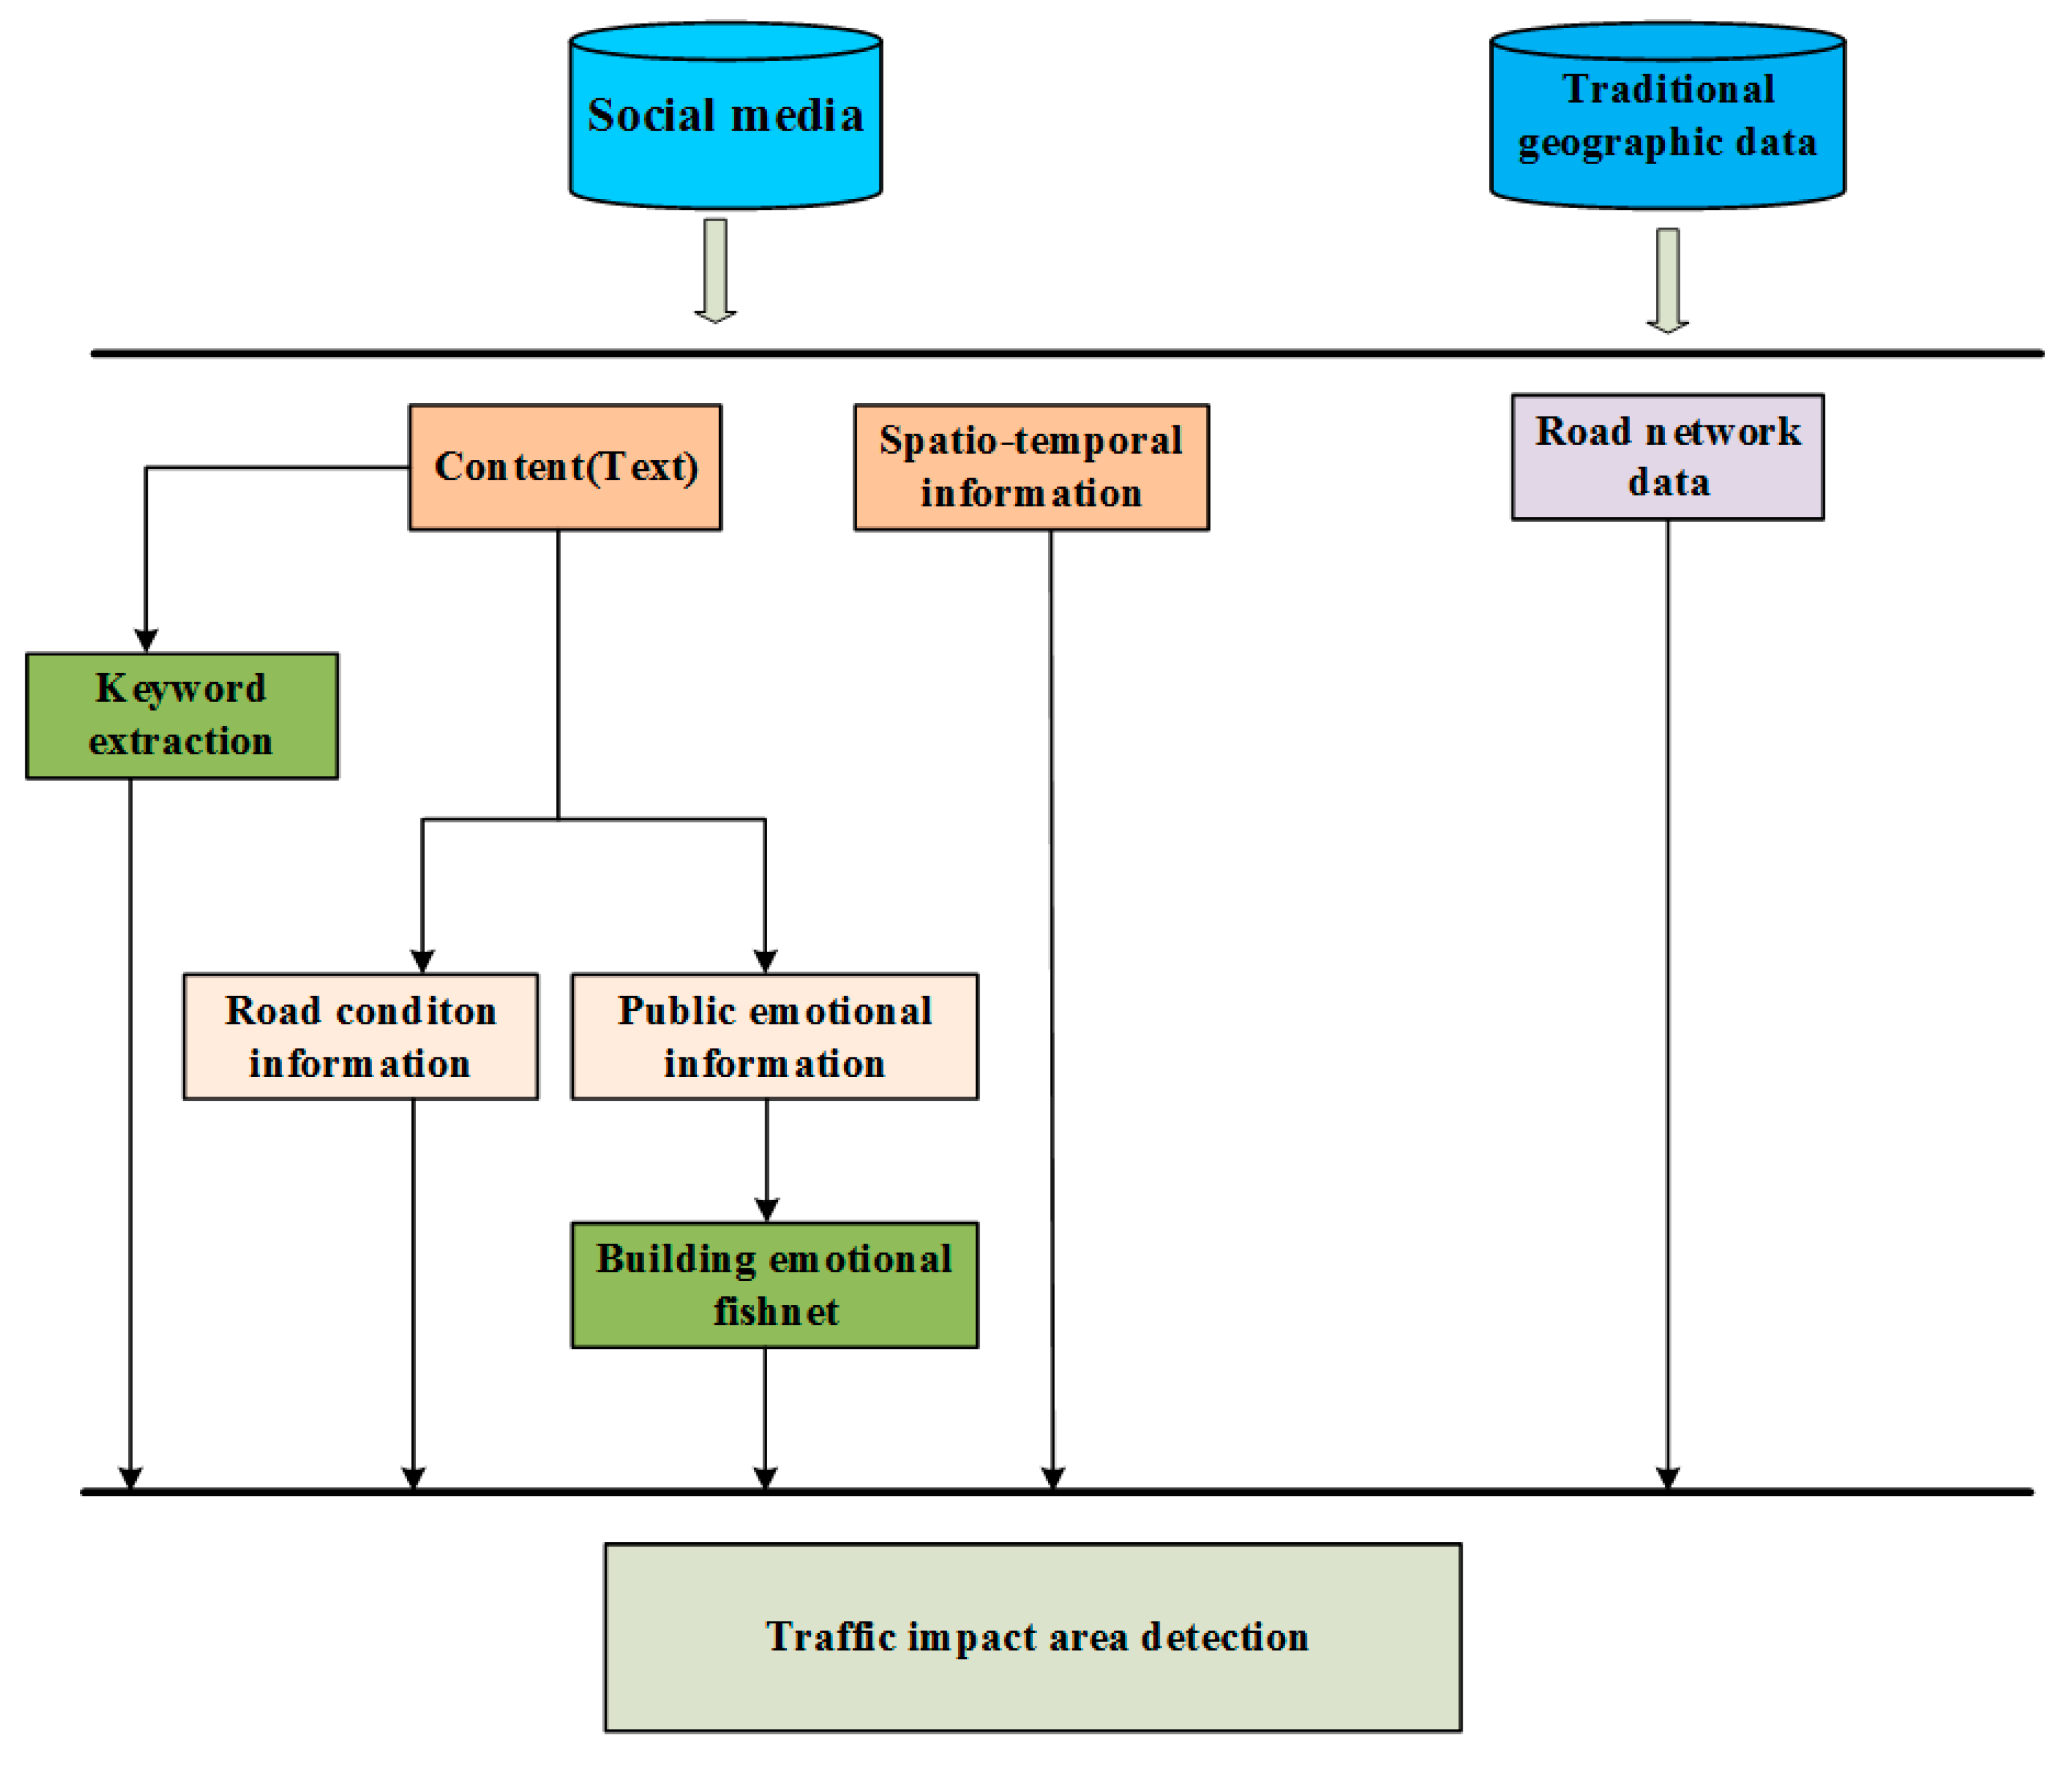
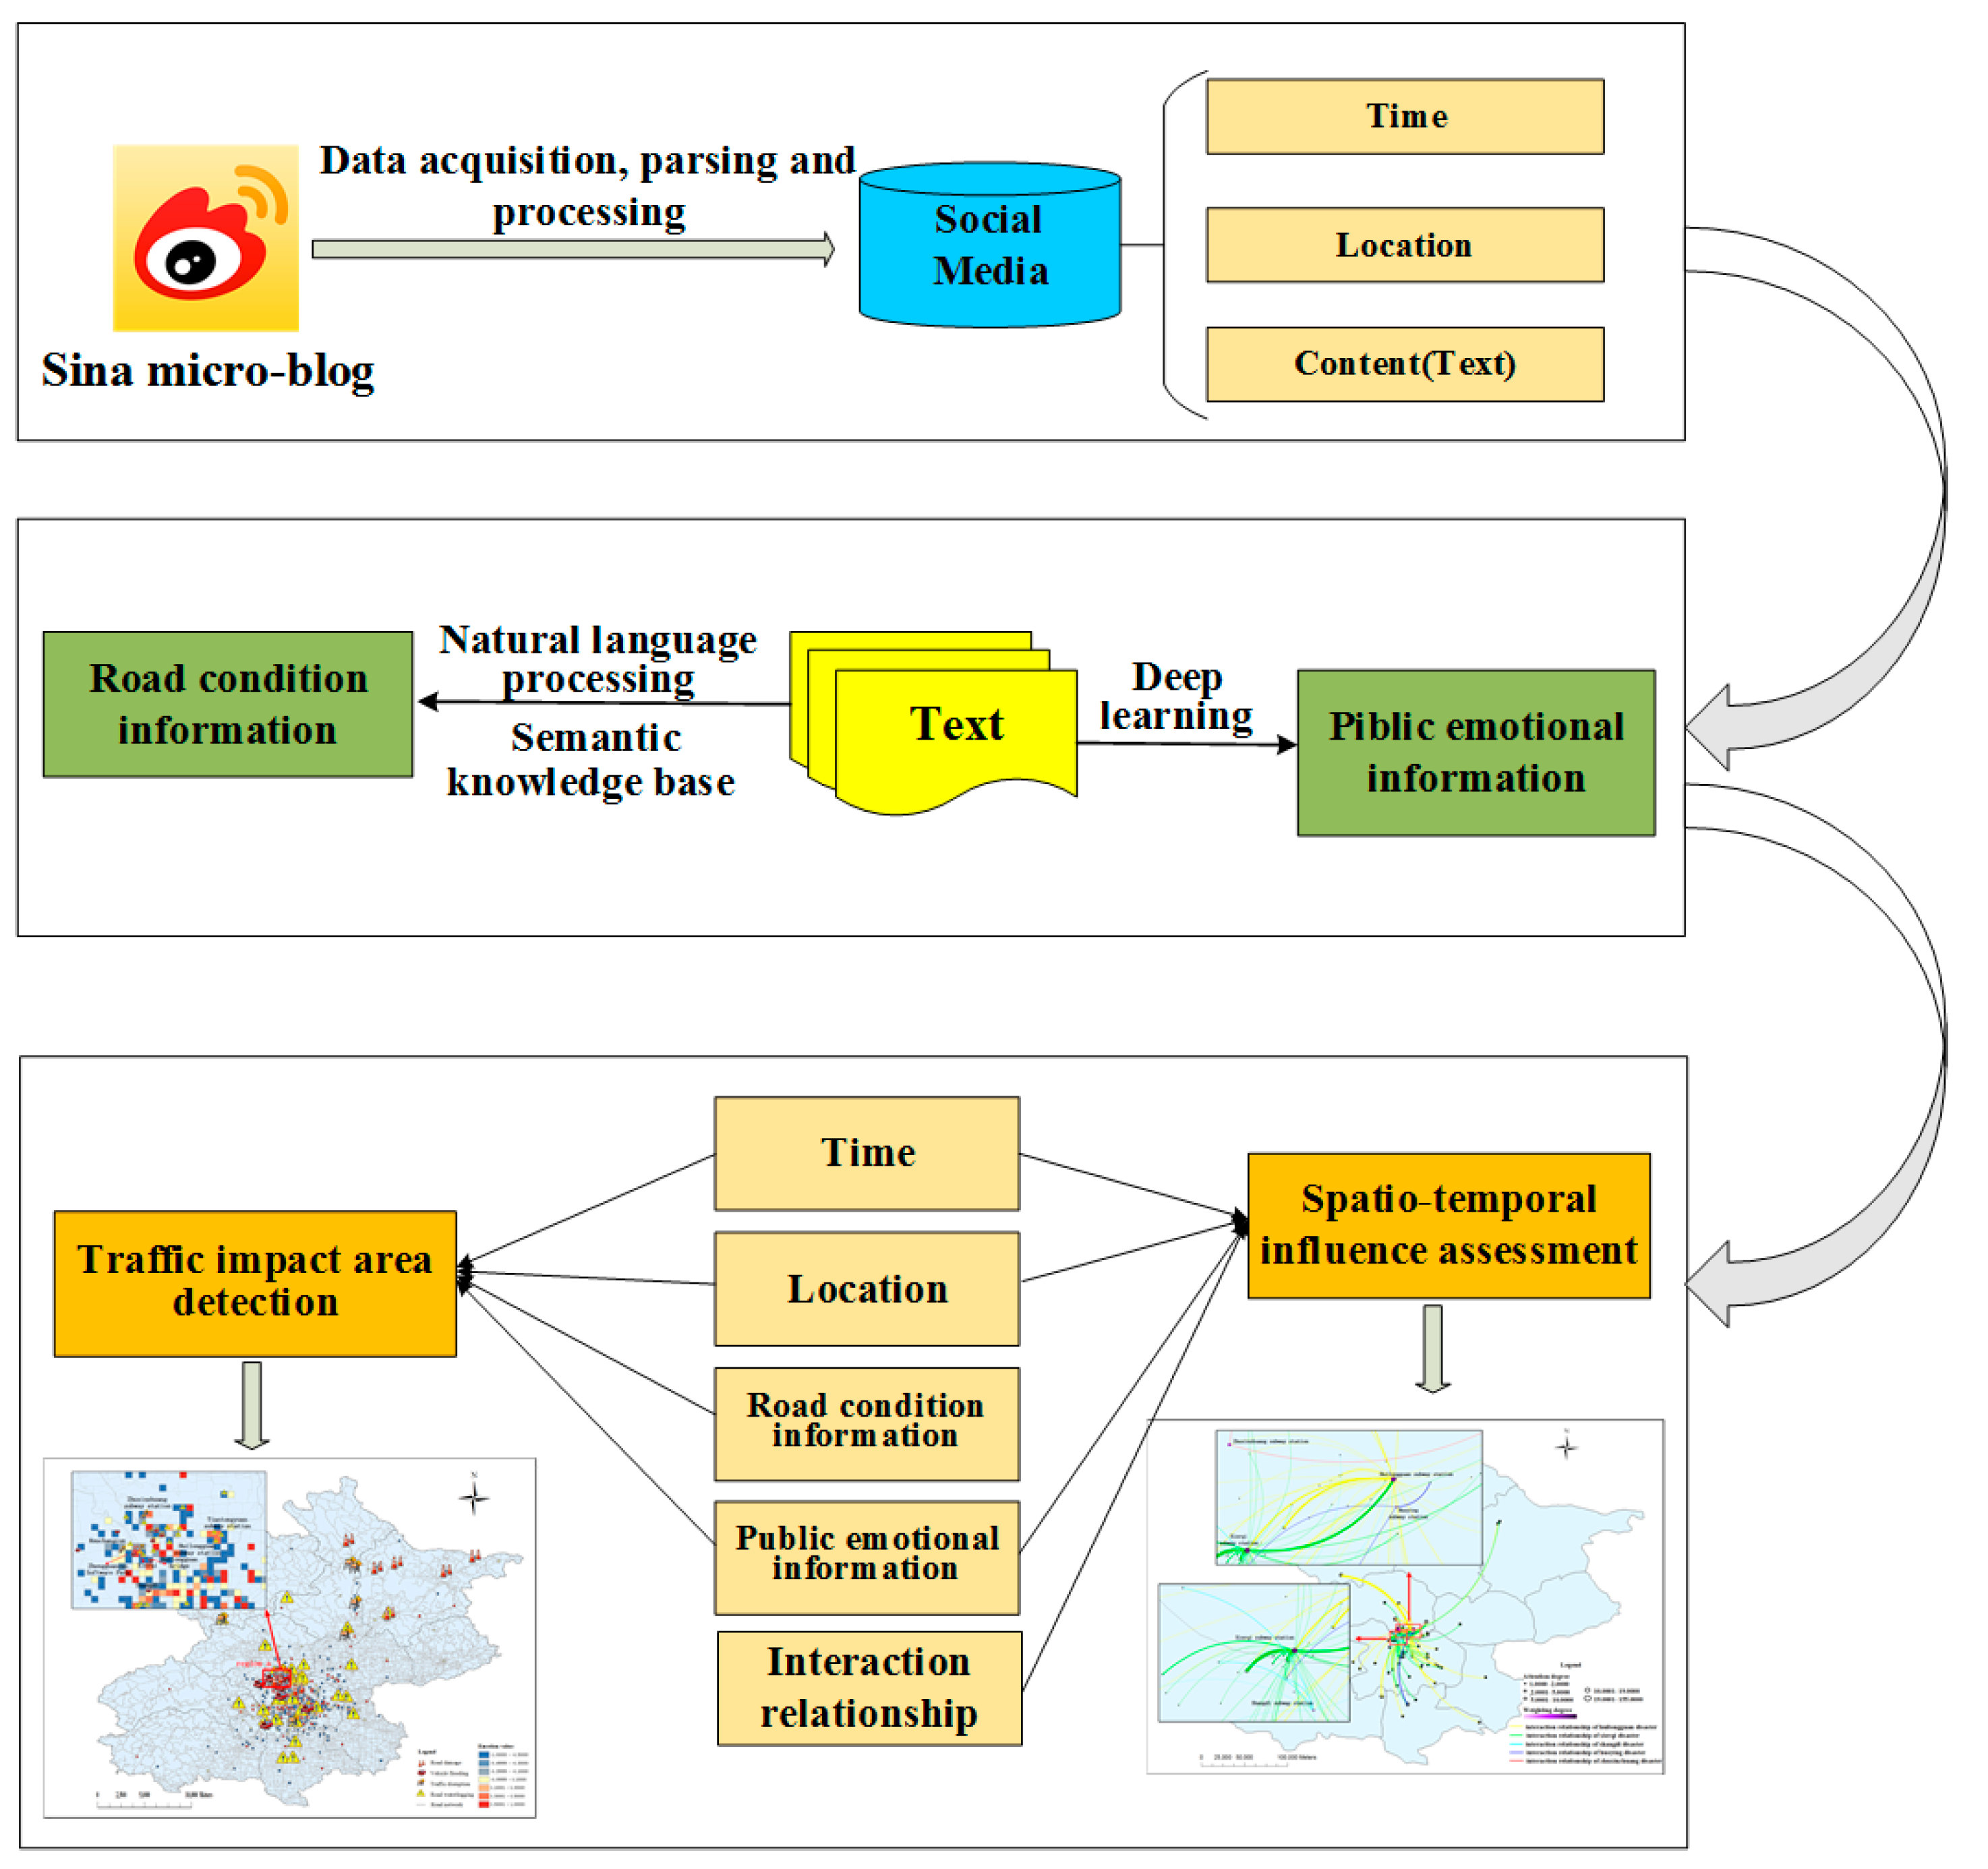
2. Methodology
2.1. Social Media Data Acquisition, Parsing, and Processing
2.1.1. Data Acquisition and Parsing
2.1.2. Data Processing
2.2. Traffic Impact Information Mining from Social Media Text
2.2.1. Fine-Grained Road Condition Information Extraction
2.2.2. Public Emotion Information Extraction
2.3. Detection Method of Traffic Impact Areas Based on Multi-Source Disaster-Related Data
2.4. Construction of a Spatiotemporal Influence Assessment Model of Disasters
3. Results
3.1. Traffic Impact Information Extraction Results
3.1.1. Experimental Corpus Processing
3.1.2. Experimental Environment
3.1.3. Experimental Results
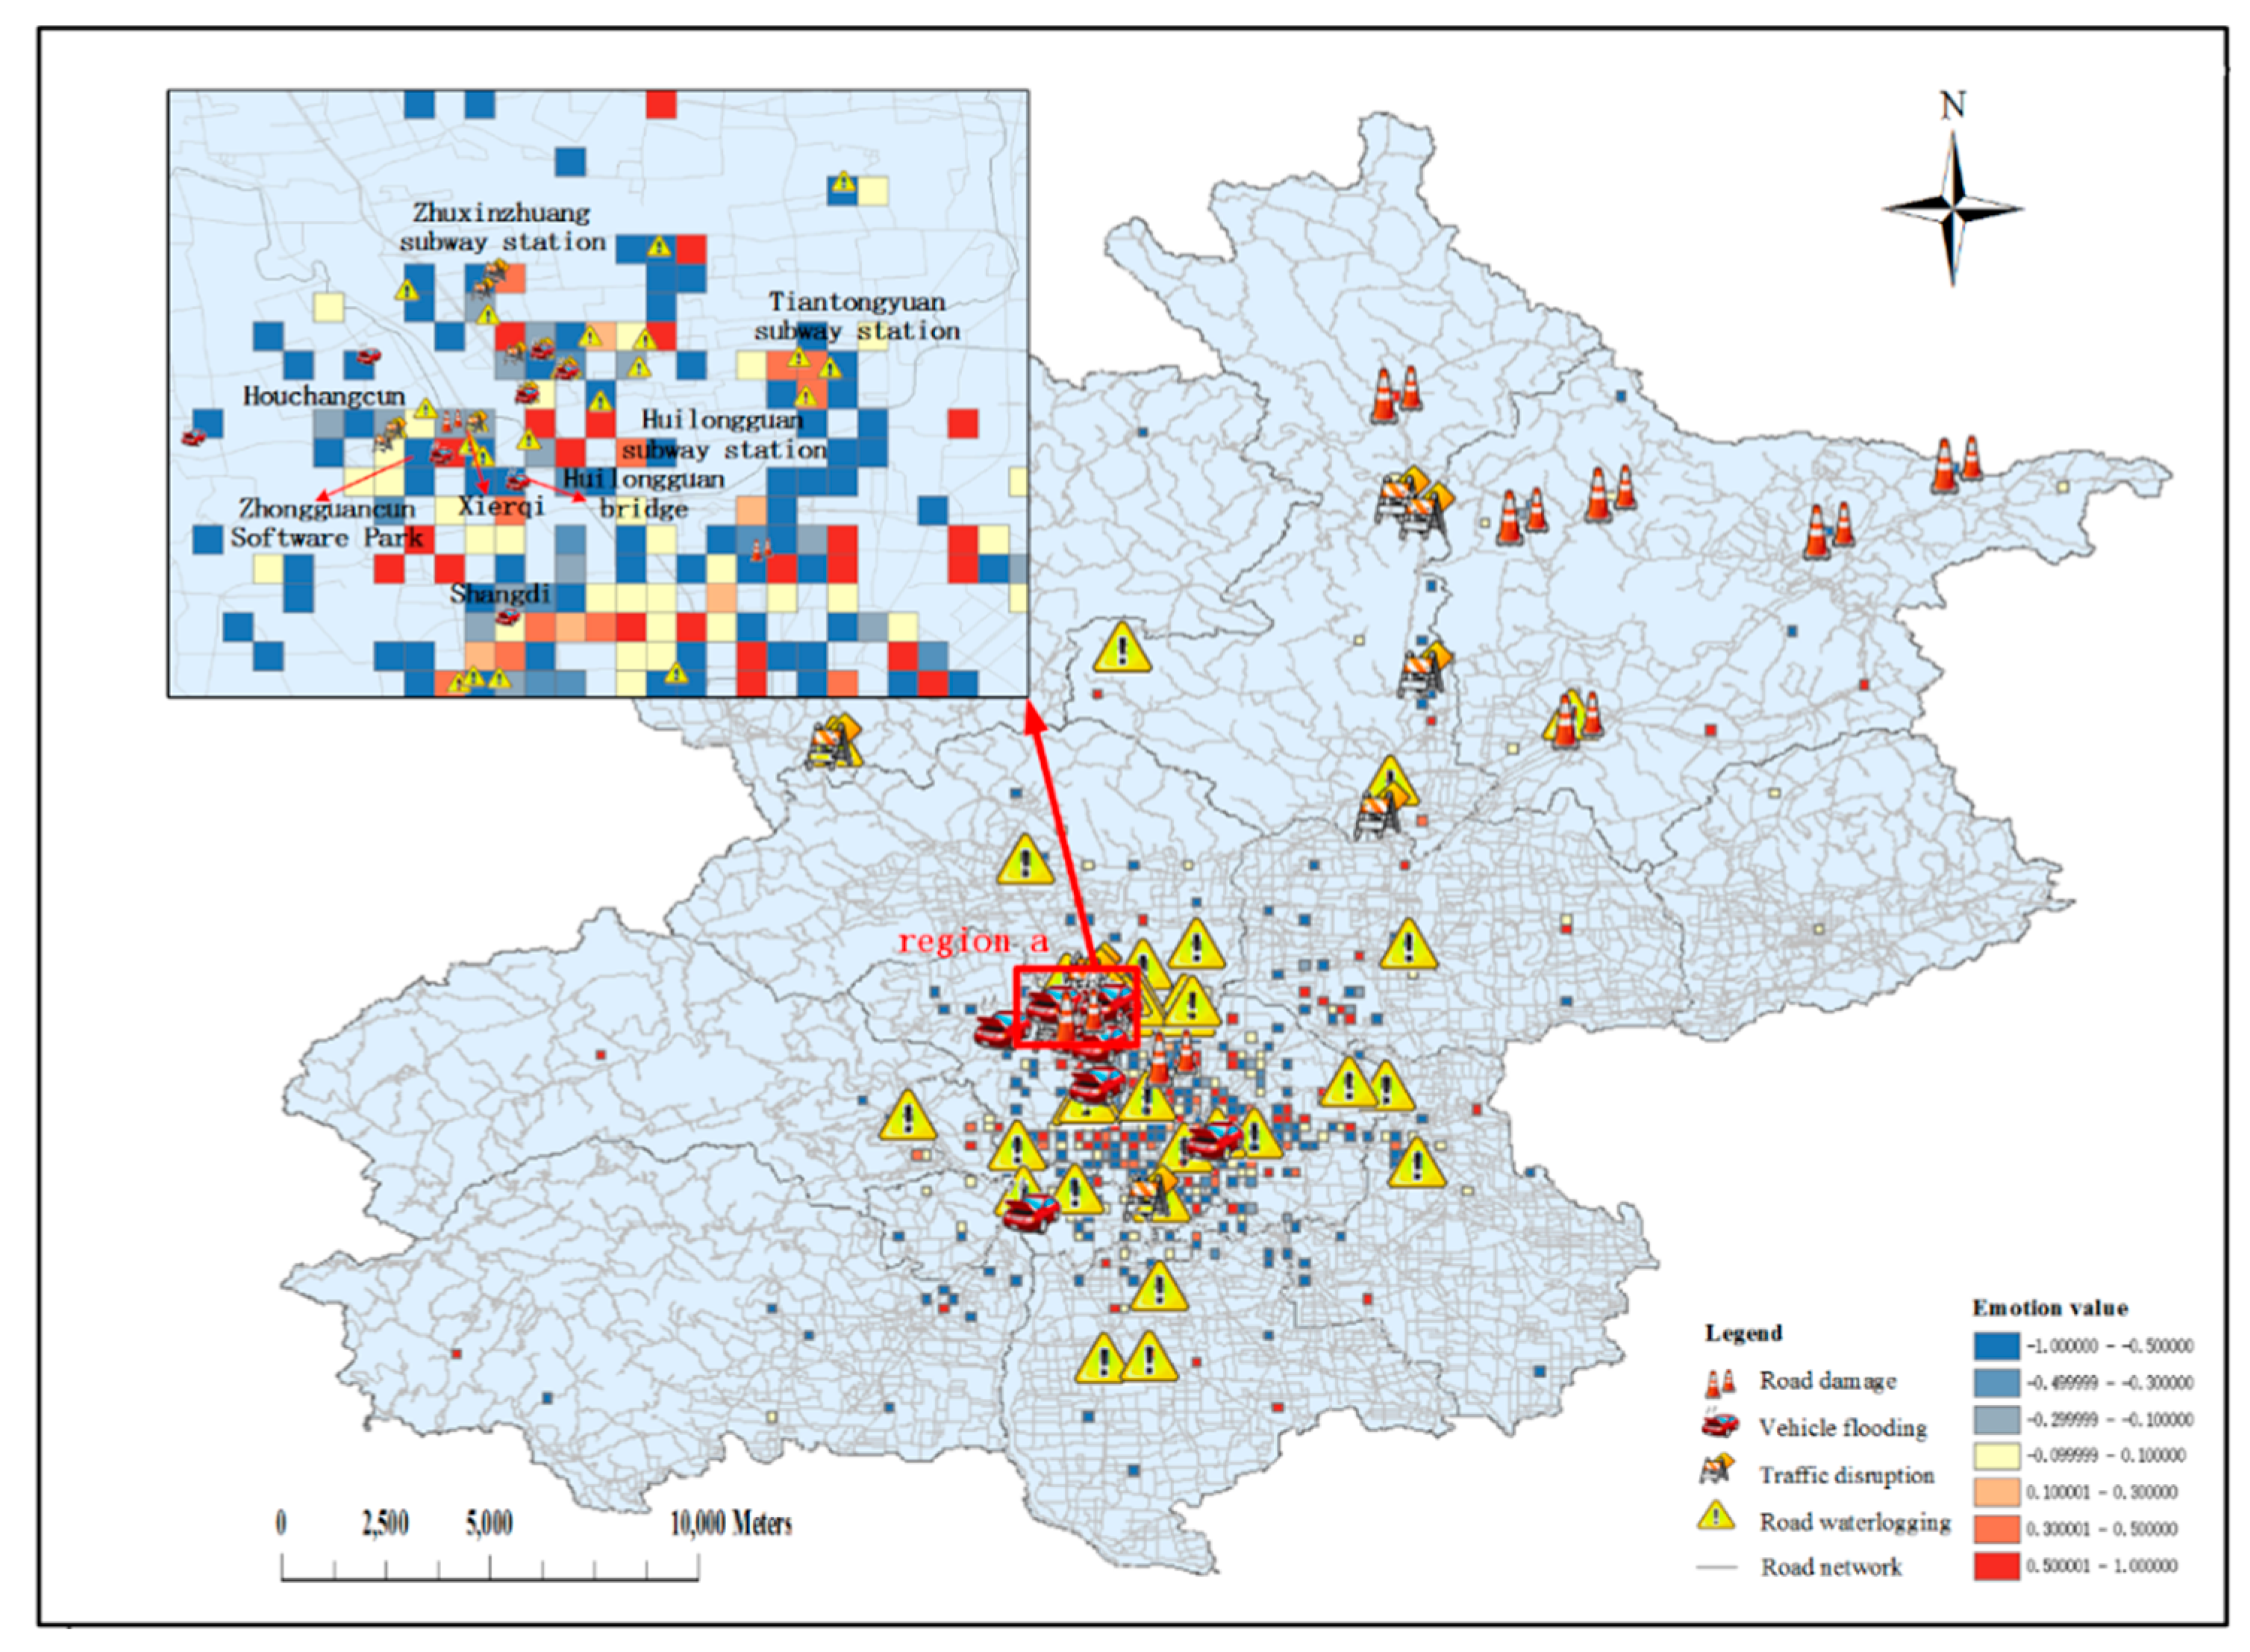
3.2. Detection of Urban Traffic Impact Areas
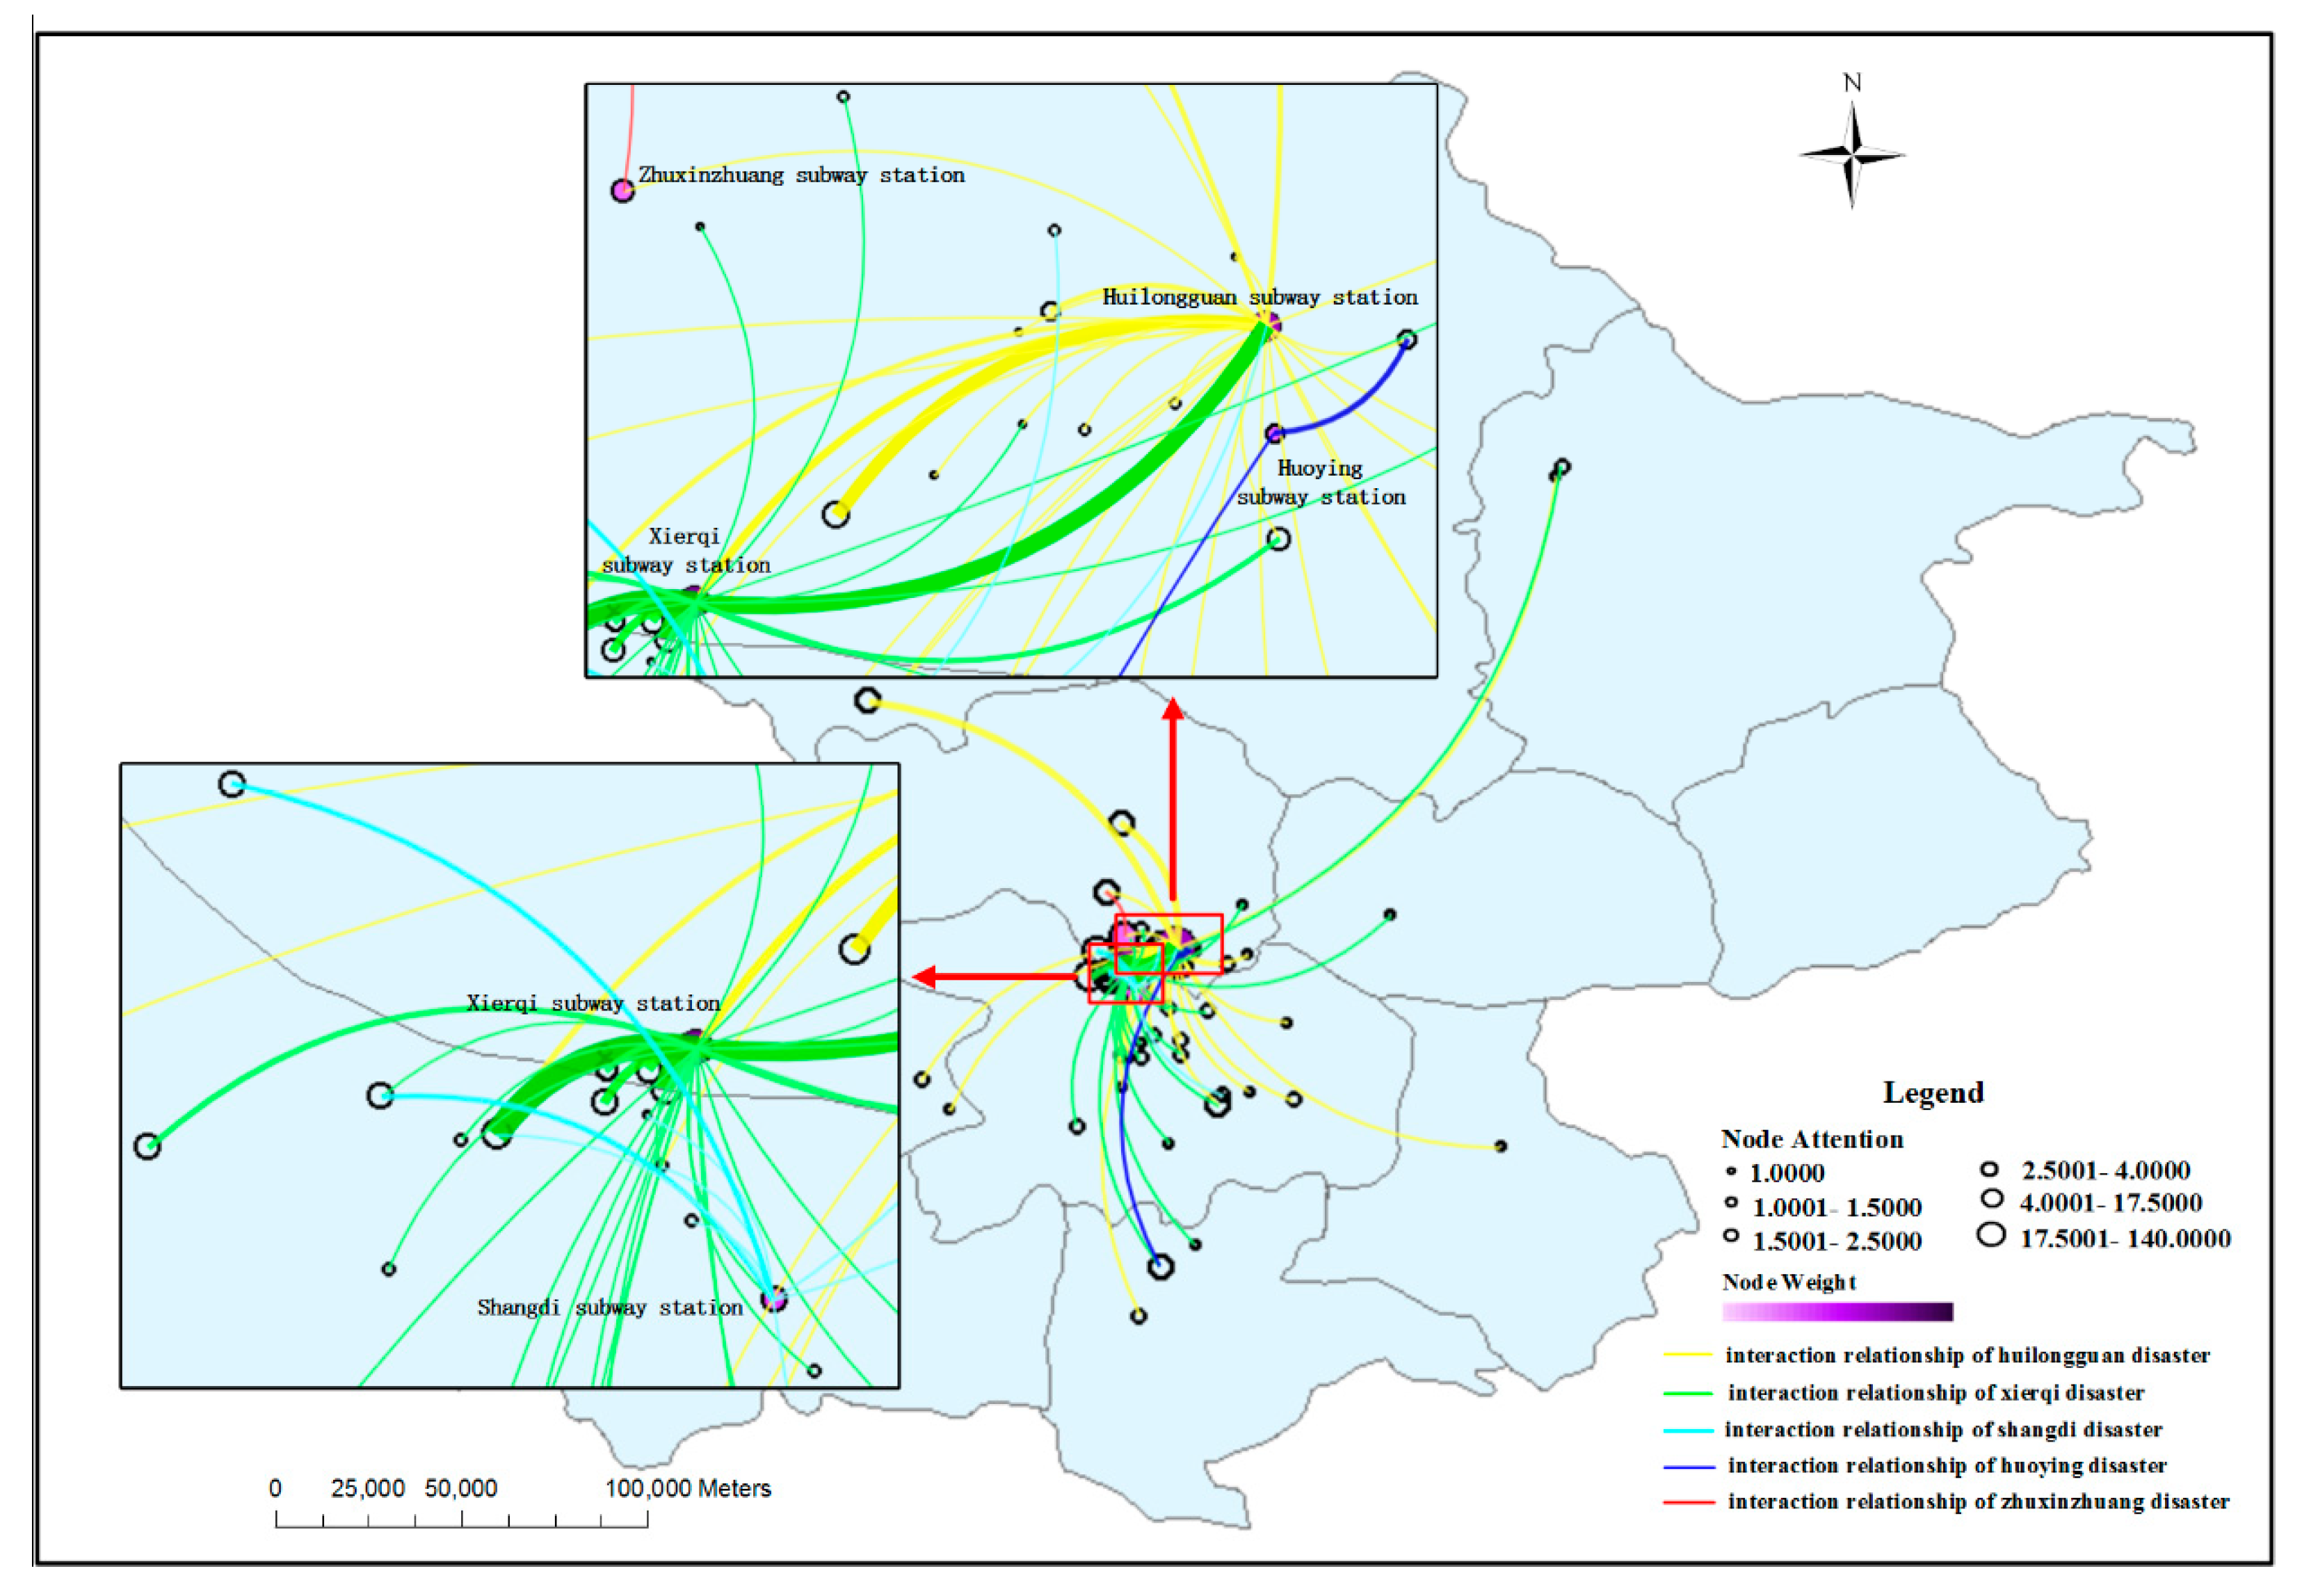
3.3. Spatiotemporal Influence Assessment of Disasters
4. Discussion
4.1. Discussion on Extraction Accuracy of Disaster-Related Information
 ... ”. The two texts have similar structures, but the former belongs to the neutral category and the latter belongs to the negative category. Thus, in our next study, we will consider introducing artificial feature engineering to improve the classification ability of the model, such as extracting various categories of emojis from the training text data and labeling them with emotional weights to guide the model for classification calculations.
 4.2. Discussion on the Results of Disaster Spatiotemporal Analysis
5. Conclusions and Future Work
Author Contributions
Funding
Conflicts of Interest
References
- Hess, L.L.; Melack, J.M.; Simonett, D.S. Radar detection of flooding beneath the forest canopy: A review. Int. J. Remote Sens. 1990, 11, 1313–1325. [Google Scholar] [CrossRef]
- Townsend, P.A.; Walsh, S.J. Modeling floodplain inundation using an integrated GIS with radar and optical remote sensing. Geomorphology 1998, 21, 295–312. [Google Scholar] [CrossRef]
- Heipke, C. Crowdsourcing geospatial data. ISPRS J. Photogramm. Remote Sens. 2010, 65, 550–557. [Google Scholar] [CrossRef]
- Goodchild, M.F. Citizens as sensors: The world of volunteered geography. GeoJournal 2007, 69, 211–221. [Google Scholar] [CrossRef] [Green Version]
- UNISDR. Making Development Sustainable: The Future of Disaster Risk Management; Global Assessment Report on Disaster Risk Reduction; United Nations Office for Disaster Risk Reduction (UNISDR): Geneva, Switzerland, 2015. [Google Scholar]
- Chae, J.; Thom, D.; Jang, Y.; Kim, S.; Ertl, T.; Ebert, D.S. Public behavior response analysis in disaster events utilizing visual analytics of microblog data. Comput. Graph. 2014, 38, 51–60. [Google Scholar] [CrossRef]
- Fohringer, J.; Dransch, D.; Kreibich, H.; Schröter, K. Social media as an information source for rapid flood inundation mapping. Nat. Hazards Earth Syst. Sci. 2015, 15, 2725–2738. [Google Scholar] [CrossRef] [Green Version]
- Li, Z.; Wang, C.; Emrich, C.T.; Guo, D. A novel approach to leveraging social media for rapid flood mapping: A case study of the 2015 South Carolina floods. Cartogr. Geogr. Inf. Sci. 2018, 45, 97–110. [Google Scholar] [CrossRef]
- Sakaki, T.; Okazaki, M.; Matsuo, Y. Earthquake shakes Twitter users: Real-time event detection by social sensors. In Proceedings of the 19th International Conference on World Wide Web, Raleigh, NC, USA, 26–30 April 2010; pp. 851–860. [Google Scholar]
- Gruebner, O.; Lowe, S.R.; Sykora, M.; Shankardass, K.; Subramanian, S.; Galea, S. A novel surveillance approach for disaster mental health. PLoS ONE 2017, 12, e0181233. [Google Scholar] [CrossRef] [Green Version]
- Neppalli, V.K.; Caragea, C.; Squicciarini, A.; Tapia, A.; Stehle, S. Sentiment analysis during Hurricane Sandy in emergency response. Int. J. Disaster Risk Reduct. 2017, 21, 213–222. [Google Scholar] [CrossRef] [Green Version]
- Yang, T.; Xie, J.; Li, G.; Mou, N.; Li, Z.; Tian, C.; Zhao, J. Social Media Big Data Mining and Spatio-Temporal Analysis on Public Emotions for Disaster Mitigation. ISPRS Int. J. Geo-Inf. 2019, 8, 29. [Google Scholar] [CrossRef] [Green Version]
- Wang, Z.; Ye, X. Social media analytics for natural disaster management. Int. J. Geogr. Inf. Sci. 2018, 32, 49–72. [Google Scholar] [CrossRef]
- Kim, J.; Hastak, M. Social network analysis: Characteristics of online social networks after a disaster. Int. J. Inf. Manag. 2018, 38, 86–96. [Google Scholar] [CrossRef]
- Kogan, M.; Palen, L.; Anderson, K.M. Think local, retweet global: Retweeting by the geographically-vulnerable during Hurricane Sandy. In Proceedings of the 18th ACM Conference on Computer Supported Cooperative Work & Social Computing, Vancouver, BC, Canada, 14–18 March 2015; ACM: New York, NY, USA, 2015; pp. 981–993. [Google Scholar]
- Glasgow, K.; Fink, C. From push brooms to prayer books: Social media and social networks during the London riots. Ischools 2013, 155–169. [Google Scholar] [CrossRef]
- Laylavi, F.; Rajabifard, A.; Kalantari, M. Event relatedness assessment of Twitter messages for emergency response. Inf. Process. Manag. 2017, 53, 266–280. [Google Scholar] [CrossRef]
- Fang, J.; Hu, J.; Shi, X.; Zhao, L. Assessing disaster impacts and response using social media data in China: A case study of 2016 Wuhan rainstorm. Int. J. Disaster Risk Reduct. 2019, 34, 275–282. [Google Scholar] [CrossRef]
- Wang, Y.; Wang, T.; Ye, X.; Zhu, J.; Lee, J. Using Social Media for Emergency Response and Urban Sustainability: A Case Study of the 2012 Beijing Rainstorm. Sustainability 2016, 8, 25. [Google Scholar] [CrossRef]
- Wu, X.; Cao, Y.; Xiao, Y.; Guo, J. Finding of urban rainstorm and waterlogging disasters based on microblogging data and the location-routing problem model of urban emergency logistics. Ann. Oper. Res. 2018, 1–32. [Google Scholar] [CrossRef]
- Schnebele, E.; Cervone, G.; Waters, N. Road assessment after flood events using non-authoritative data. Nat. Hazards Earth Syst. Sci. 2014, 14, 1007–1015. [Google Scholar] [CrossRef] [Green Version]
- Croitoru, A.; Crooks, A.; Radzikowski, J.; Stefanidis, A. Geosocial gauge: A system prototype for knowledge discovery from social media. Int. J. Geogr. Inf. Syst. 2013, 27, 2483–2508. [Google Scholar] [CrossRef]
- Kryvasheyeu, Y.; Chen, H.; Moro, E.; Van Hentenryck, P.; Cebrian, M. Performance of social network sensors during Hurricane Sandy. PLoS ONE 2015, 10, e0117288. [Google Scholar] [CrossRef] [Green Version]
- Bhonde, R.; Bhagwat, B.; Ingulkar, S.; Pande, A. Analyzing and modeling real-world phenomena with complex networks: A survey of applications. Adv. Phys. 2011, 60, 329–412. [Google Scholar]
- Dorogovtsev, S.N.; Mendes, J.F. Evolution of networks. Adv. Phys. 2002, 51, 1079–1187. [Google Scholar] [CrossRef] [Green Version]
- Costa, L.d.F.; Rodrigues, F.A.; Travieso, G.; Villas Boas, P.R. Characterization of complex networks: A survey of measurements. Adv. Phys. 2007, 56, 167–242. [Google Scholar] [CrossRef] [Green Version]
- Yang, T.F.; Xie, J.B.; Li, Z.Y. A method of typhoon disaster loss identification and classification using micro-blog information. J. Geo-Inf. Sci. 2018, 20, 906–917. [Google Scholar]
- Kaushik, C.; Mishra, A. A scalable, lexicon based technique for sentiment analysis. arXiv 2014, arXiv:1410.2265. [Google Scholar] [CrossRef] [Green Version]
- Bhonde, R.; Bhagwat, B.; Ingulkar, S.; Pande, A. Sentiment Analysis Based on Dictionary Approach. Int. J. Emerg. Eng. Res. Technol. 2015, 3, 51–55. [Google Scholar]
- Cheng, Q.; Li, T.M.; Kwok, C.-L.; Zhu, T.; Yip, P.S. Assessing suicide risk and emotional distress in Chinese social media: A text mining and machine learning study. J. Med. Internet Res. 2017, 19, e243. [Google Scholar] [CrossRef]
- Hussain, A.; Cambria, E. Semi-supervised learning for big social data analysis. Neurocomputing 2018, 275, 1662–1673. [Google Scholar] [CrossRef]
- Belkov, D.; Purtov, K.; Kublanov, V. Influence of different feature selection approaches on the performance of emotion recognition methods based on SVM. In Proceedings of the 2017 20th Conference of Open Innovations Association (FRUCT), St. Petersburg, Russia, 3–7 April 2017; pp. 40–45. [Google Scholar]
- Narayanan, V.; Arora, I.; Bhatia, A. Fast and accurate sentiment classification using an enhanced Naive Bayes model. In Proceedings of the International Conference on Intelligent Data Engineering and Automated Learning, Hefei, China, 20–23 October 2013; Springer: Berlin/Heidelberg, Germany, 2013; pp. 194–201. [Google Scholar]
- Zhang, X.; Zhao, J.; LeCun, Y. Character-level convolutional networks for text classification. In Proceedings of the Advances in Neural Information Processing Systems, Montreal, QC, Canada, 7–12 December 2015; pp. 649–657. [Google Scholar]
- Jozefowicz, R.; Vinyals, O.; Schuster, M.; Shazeer, N.; Wu, Y. Exploring the limits of language modeling. arXiv 2016, arXiv:1602.02410. [Google Scholar]
- Statistics, D. Available online: http://www.beijing.gov.cn/renwen/bjgk/rk/rktj/t1548301.htm (accessed on 10 December 2019).
- Mou, N.; Yuan, R.; Yang, T.; Zhang, H.; Tang, J.J.; Makkonen, T. Exploring spatio-temporal changes of city inbound tourism flow: The case of Shanghai, China. Tour. Manag. 2020, 76, 103955. [Google Scholar] [CrossRef]
- Li, Z.; Xu, M.; Shi, Y. Centrality in global shipping network basing on worldwide shipping areas. GeoJournal 2015, 80, 47–60. [Google Scholar] [CrossRef]
- Yang, T.; Xie, J. A social media-based dataset of typhoon disasters. Sci. Data Bank 2018. [Google Scholar] [CrossRef]
- Abadi, M.; Agarwal, A.; Barham, P.; Brevdo, E.; Chen, Z.; Citro, C.; Corrado, G.S.; Davis, A.; Dean, J.; Devin, M.; et al. Tensorflow: Large-scale machine learning on heterogeneous distributed systems. arXiv 2016, arXiv:1603.04467. [Google Scholar]
- Gelernter, J.; Mushegian, N. Geo-parsing messages from microtext. Trans. GIS 2011, 15, 753–773. [Google Scholar] [CrossRef]
- Le, Q.; Mikolov, T. Distributed representations of sentences and documents. In Proceedings of the International Conference on Machine Learning, Beijing, China, 21–26 June 2014; pp. 1188–1196. [Google Scholar]
- Oh, O.; Kwon, K.H.; Rao, H.R. An Exploration of Social Media in Extreme Events: Rumor Theory and Twitter during the Haiti Earthquake. In Proceedings of the Icis Thirty-First International Conference on Information Systems, St. Louis, MO, USA, 12–15 December 2010; Volume 231, pp. 7332–7336. [Google Scholar]
- Tausczik, Y.R.; Pennebaker, J.W. The Psychological Meaning of Words: LIWC and Computerized Text Analysis Methods. J. Lang. Soc. Psychol. 2010, 29, 24–54. [Google Scholar] [CrossRef]
- Fink, C.; Piatko, C.D.; Mayfield, J.; Finin, T.; Martineau, J. Geolocating Blogs from Their Textual Content. In Proceedings of the AAAI Spring Symposium: Social Semantic Web: Where Web 2.0 Meets Web 3.0, Stanford, CA, USA, 23–25 March 2009; pp. 25–26. [Google Scholar]
- Lingad, J.; Karimi, S.; Yin, J. Location extraction from disaster-related microblogs. In Proceedings of the 22nd International Conference on World Wide Web, Rio de Janeiro, Brazil, 13–17 May 2013; pp. 1017–1020. [Google Scholar]
- Ji, Z.; Sun, A.; Cong, G.; Han, J. Joint recognition and linking of fine-grained locations from tweets. In Proceedings of the 25th International Conference on World Wide Web, Montreal, QC, Canada, 11–15 April 2016; pp. 1271–1281. [Google Scholar]


| Road Network Traffic Impact Level | Category | Feature Word Pairs | Example Sentence |
|---|---|---|---|
| Level 4 | road damage | [公路-冲毁] ([Road-Destroyed]), etc. | 密云很多公路都被暴雨洪水冲毁了. (Many roads in Miyun in Beijing have been destroyed by the rainstorm.) |
| Level 3 | vehicle flooding | [汽车-淹没] ([Car-Flooded]), etc. | 回龙观桥下, 不少汽车被淹没. (Under the Huilongguan bridge, many cars were flooded.) |
| Level 2 | traffic disruption | [路段-封闭] ([Road section-Closed]), etc. | 北京市怀柔区河防口路段封闭! (The road section of Hefangkou in Huairou district is closed.) |
| Level 1 | road waterlogging | [路面-积水] ([Road-Puddles]), etc. | 雨后路面全是积水啊! (The road was filled with puddles from the rain!) |
| Road Condition Information Category | P | R | F-1 |
|---|---|---|---|
| Road damage | 90.13% | 72.50% | 80.35% |
| Vehicle flooding | 86.75% | 80.00% | 83.24% |
| Traffic disruption | 73.81% | 72.09% | 72.94% |
| Road waterlogging | 79.49% | 77.50% | 78.48% |
| Emotional Category | P | R | F-1 |
|---|---|---|---|
| Positive | 87.38% | 82. 97% | 85.62% |
| Neutral | 72.88% | 84. 49% | 78.26% |
| Negative | 85.37% | 76. 06% | 80.47% |
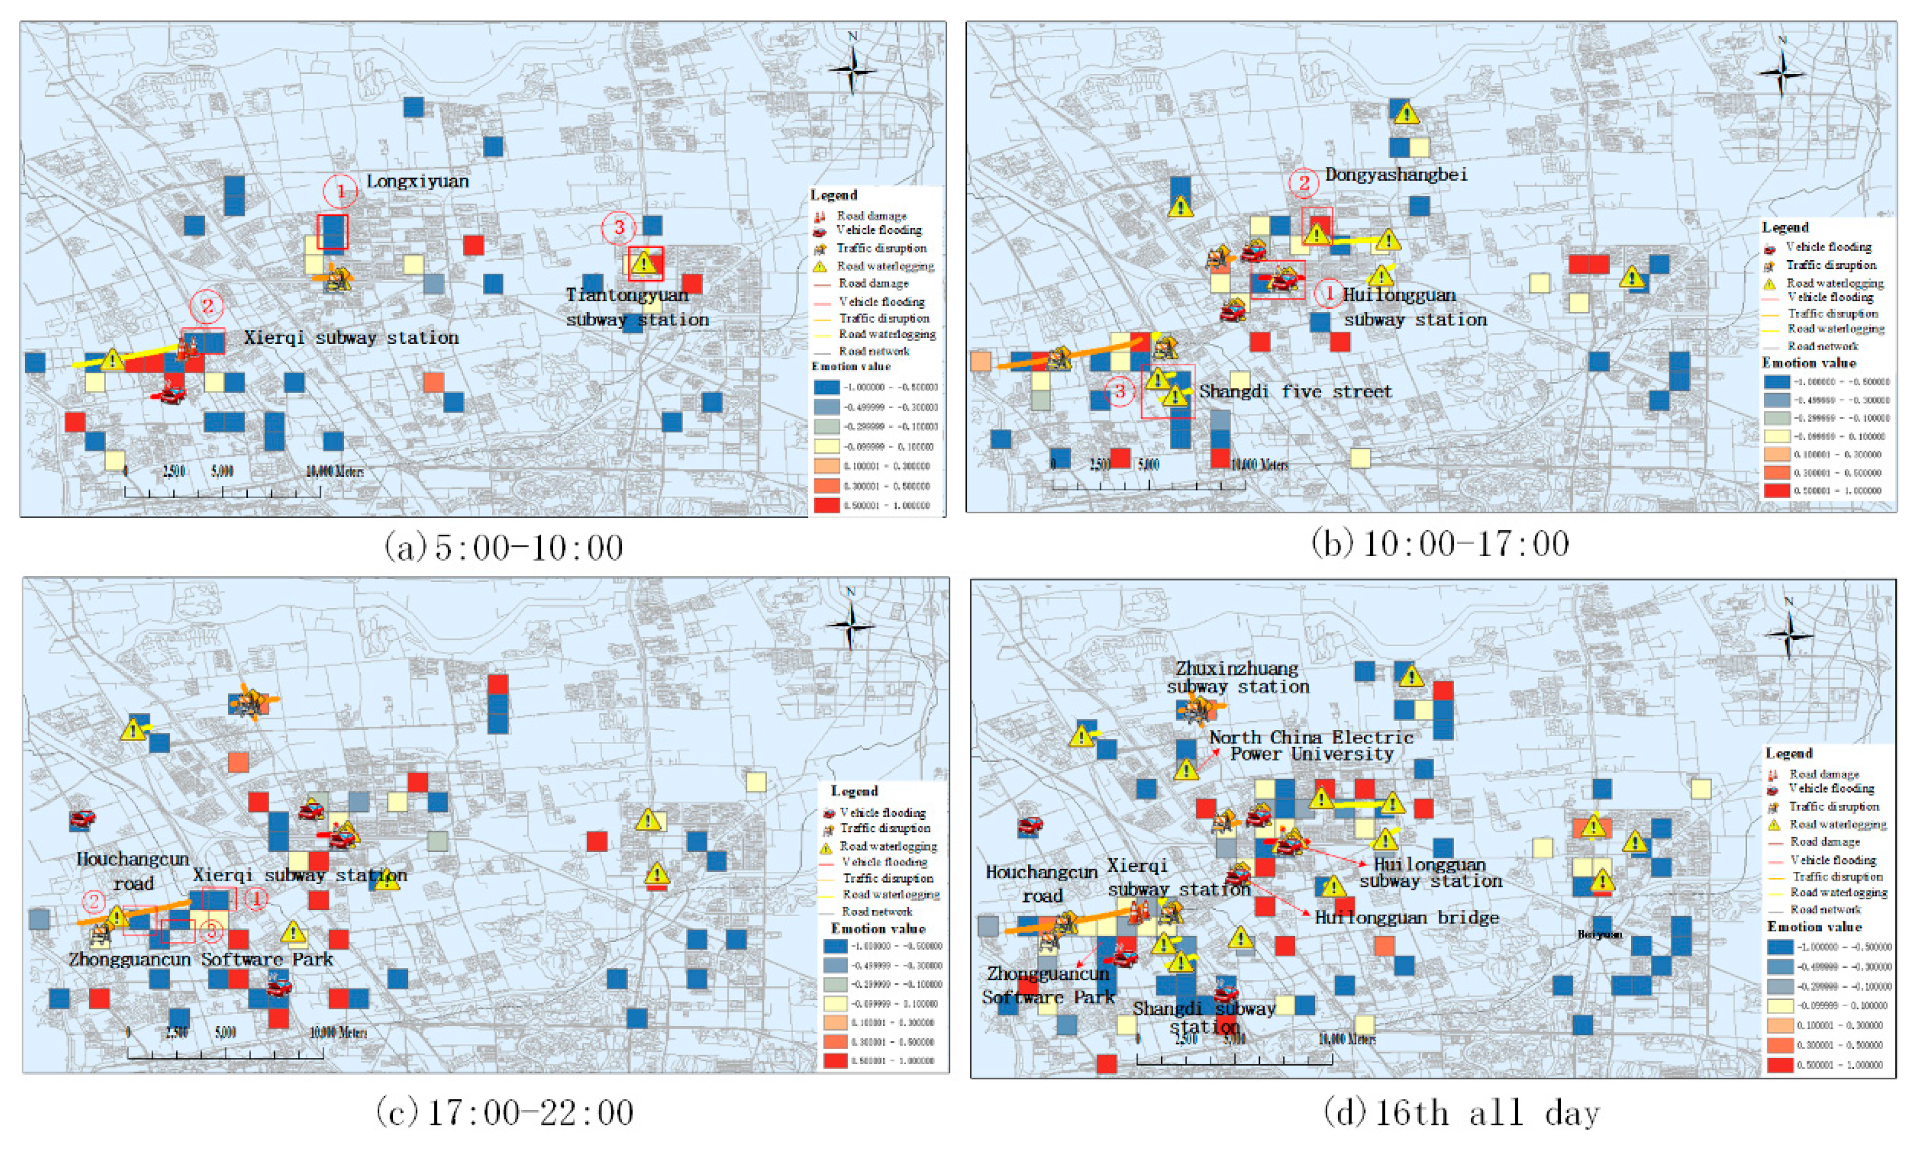
| Region | Major Emotion Category | Road Condition Information | Regional Category | Keyword |
|---|---|---|---|---|
| region 1 (Figure 4a) | negative | residential area | 暴雨 (rainstorm), 担心 (worry), 上班 (go to work), etc. | |
| region 2 (Figure 4a) | negative | traffic disruption | traffic station | 看海 (see the sea), 游泳 (swimming), 堵 (congestion), 迟到 (be late), etc. |
| region 3 (Figure 4a) | positive | road waterlogging | traffic station | 大雨 (heavy rain), 好久不见 (long time no see), etc. |
| region 1 (Figure 4b) | negative | vehicle flooding, road waterlogging | traffic station | 车辆 (vehicle), 淹没 (submerge), 安全 (security), etc. |
| region 2 (Figure 4b) | positive | traffic, disruption, road waterlogging | residential area | 积水 (ponding), 清除 (eliminate), 辛苦 (toilsome), etc. |
| region 3 (Figure 4c) | negative | road waterlogging | road | 积水 (ponding), 淹没 (flood), 通行 (traffic), etc. |
| region 1 (Figure 4c) | negative | traffic station | 回家 (go home), 船 (boat), 下雨 (rain), 拥堵 (congestion), etc. | |
| region 2 (Figure 4c) | negative | office zone | 下班 (go off work), 回家 (go home), 下雨 (rain), 讨厌 (hate), etc. | |
| region 3 (Figure 4c) | positive | road waterlogging | road | 拥堵 (congestion), 回家 (go home), 下雨 (rain), etc. |
© 2020 by the authors. Licensee MDPI, Basel, Switzerland. This article is an open access article distributed under the terms and conditions of the Creative Commons Attribution (CC BY) license (http://creativecommons.org/licenses/by/4.0/).
Share and Cite
Yang, T.; Xie, J.; Li, G.; Mou, N.; Chen, C.; Zhao, J.; Liu, Z.; Lin, Z. Traffic Impact Area Detection and Spatiotemporal Influence Assessment for Disaster Reduction Based on Social Media: A Case Study of the 2018 Beijing Rainstorm. ISPRS Int. J. Geo-Inf. 2020, 9, 136. https://0-doi-org.brum.beds.ac.uk/10.3390/ijgi9020136
Yang T, Xie J, Li G, Mou N, Chen C, Zhao J, Liu Z, Lin Z. Traffic Impact Area Detection and Spatiotemporal Influence Assessment for Disaster Reduction Based on Social Media: A Case Study of the 2018 Beijing Rainstorm. ISPRS International Journal of Geo-Information. 2020; 9(2):136. https://0-doi-org.brum.beds.ac.uk/10.3390/ijgi9020136
Chicago/Turabian StyleYang, Tengfei, Jibo Xie, Guoqing Li, Naixia Mou, Cuiju Chen, Jing Zhao, Zhan Liu, and Zhenyu Lin. 2020. "Traffic Impact Area Detection and Spatiotemporal Influence Assessment for Disaster Reduction Based on Social Media: A Case Study of the 2018 Beijing Rainstorm" ISPRS International Journal of Geo-Information 9, no. 2: 136. https://0-doi-org.brum.beds.ac.uk/10.3390/ijgi9020136