Article

Visualization, Spatiotemporal Patterns, and Directional Analysis of Urban Activities Using Geolocation Data Extracted from LBSN

1
School of Communication & Information Engineering, Shanghai University, Shanghai 200444, China
2
Institute of Smart City, Shanghai University, Shanghai 200444, China
3
Institut de Géographie Alpine (IGA), Université Grenoble Alpes, Grenoble 38100, France
*
Author to whom correspondence should be addressed.
ISPRS Int. J. Geo-Inf. 2020, 9(2), 137; https://0-doi-org.brum.beds.ac.uk/10.3390/ijgi9020137
Submission received: 17 December 2019 / Revised: 30 January 2020 / Accepted: 6 February 2020 / Published: 24 February 2020
(This article belongs to the Special Issue Measuring, Mapping, Modeling, and Visualization of Cities)

Abstract

:
Location-based social networks (LBSNs) have rapidly prevailed in China with the increase in smart devices use, which has provided a wide range of opportunities to analyze urban behavior in terms of the use of LBSNs. In a LBSN, users socialize by sharing their location (also referred to as “geolocation”) in the form of a tweet (also referred to as a “check-in”), which contains information in the form of, but is not limited to, text, audio, video, etc., which records the visited place, movement patterns, and activities performed (e.g., eating, living, working, or leisure). Understanding the user’s activities and behavior in space and time using LBSN datasets can be achieved by archiving the daily activities, movement patterns, and social media behavior patterns, thus representing the user’s daily routine. The current research observing and analyzing urban activities behavior was often supported by the volunteered sharing of geolocation and the activity performed in space and time. The objective of this research was to observe the spatiotemporal and directional trends and the distribution differences of urban activities at the city and district levels using LBSN data. The density was estimated, and the spatiotemporal trend of activities was observed, using kernel density estimation (KDE); for spatial regression analysis, geographically weighted regression (GWR) analysis was used to observe the relationship between different activities in the study area. Finally, for the directional analysis, to observe the principle orientation and direction, and the spatiotemporal movement and extension trends, a standard deviational ellipse (SDE) analysis was used. The results of the study show that women were more inclined to use social media compared with men. However, the activities of male users were different during weekdays and weekends compared to those of female users. The results of the directional analysis at the district level reflect the change in the trajectory and spatiotemporal dynamics of activities. The directional analysis at the district level reveals its fine spatial structure in comparison to the whole city level. Therefore, LBSN can be considered as a supplementary and reliable source of social media big data for observing urban activities and behavior within a city in space and time.

1. Introduction

Social media has dramatically expanded in popularity around the world and produced a massive amount of social media big data with the association of a spatial context (human dynamics and mobility behaviors within the urban context) to check-ins and posts. Historically, to study urban activities behavior, traditional methods (i.e., survey, census) [1,2] were adopted, but these methods are more expensive and laborious, and too often result in data sparsity, which in turn requires longer processing time. Due to these limitations, traditional methods are considered to be less effective for studying urban activities behavior.
For urban activities behavior, precise measures and indictors are required along with a spatially unambiguous methodology, as urban activities behavior are considered to be related to multiple dimensions: urban and environmental topographies and human activity. Big data [3,4] (i.e., location-based social networks (LBSNs) and points of interest (POI))—characterized by high volumes of data, comprising geolocations, and being readily open-source—are providing an opportunity for spatially unambiguous methodologies to measure human activities behavior. In LBSNs, users can announce their geolocation and activity performed based on the venue type and venue category as a check-in [5]. This geolocation-based social media check-in phenomenon generates a massive amount of data, also referred to as social media big data [6]. Regardless of the fundamental limitations (i.e., biases in sex, low sampling rates, and biases in venue location and venue type) of researching human check-in and urban activities behavior [7], LBSN check-in data can uncover urban activities behavior in space and time. LBSN data, including geolocation, venue location, and venue type, are available at a much lower cost in comparison to the aforementioned traditional methods when observing and analyzing urban activities behavior.
The development of LBSNs has progressed rapidly due to the integration of smartphones, which allow for the fast sharing of information about what, where, why, and with whom users share information. The sharing of a users’ current location and their ability to discover their friends’ locations has raise concerns related to user privacy [8,9]. However, LBSN privacy primarily depends on the legislative and business-oriented actors involved in data sharing. Although privacy is an individual issue, some of the personal data are shared unintentionally or willingly by the user [10,11]. Sometimes, data are deliberately or voluntarily made public by users [12]. Thus, LBSN data offer new dimensions for observing urban activities behavior and can be helpful for creating new analysis methods as well as representing urban activities behavior. A variety of studies [13,14,15] were conducted to examine the demographics and spatial context of users and to identify the factors that lead different users (men and women) to use social media. These studies highlighted some of the motivations that can influence the change in behavior of the use of social media networks between users (men and women). Smith [16] showed that women are more inclined to use social media for increased levels of connectivity with their families compared to men. Muscanell and Guadagno [17] showed that male users are more inclined to use social media for forming new relationships, whereas female users are more inclined to use it for relationship maintenance.
In terms of social media in relation to different urban activities, slightly different behavior (usage patterns and motivation) is observed between sexes. Hwang and Choi [18] explored the online behavior of college students on Weibo and the motivations of usage by sex, and suggested that Weibo acts as a tool for searching for information about social concerns and benefits. Saleem et al. [19] explored prominent locations of use and introduced a method for determining location influence, with the ability to reach out geographically using LBSN data. They proposed a memory-efficient algorithm that provided in an efficient and scalable process for gathering diverse sets of locations with a broad geographical spread. Research based on social media evidence showed that positive effects are observed in a male user’s potential involvement when searching for useful information related to entertainment and expressiveness; however, the positive effects observed in female users are for meeting new people and entertainment [20].
Historically, research based on urban geography and activities behavior related to the Weibo dataset has been limited in comparison to Facebook and Twitter. However, this research started to increase in China as of 2015, mainly focusing on the characteristics of people in scenic spots, for example, analyzing the spatiotemporal distribution and spatial autocorrelation of tourists with different attributes in the scenic area [21]. Urban perception research explored the positive and negative attitudes of people toward urban style using the semantic analysis method [22]; for work-life balance, the relationship between home and work was tested in the space and time of check-ins and land use classification [23]; the work-life balance and commuting scenario was analyzed by spatial clustering method [24]. Research on city (group) spaces and hotspots has mainly focused on the internal structure and dynamics of urban land-use patterns [25], the characteristics of city (group) residents, spatiotemporal variation [26,27], and hotspots in the city [28]. Various studies were conducted using LBSN datasets to observe human check-in and activities behavior under domains like privacy [11,29,30], sex differences [31], geographic spaces [32], urban emotions [33], activity location choice, urban green space [34], and lifestyle patterns [35,36]. Other studies [37,38,39,40,41,42] focused on observing human mobility patterns and analyzing check-in data for location prediction and venue tagging in the city using LBSN datasets. Li and Chen [43] analyzed the user’s profile, characteristics, and activities in the form of correlations and social graphs to study and better understand user motivations for sharing their real-world location. Ebrahimpour et al. [44] reviewed and compared the current analysis of multisource crowd approaches. The survey provided the basics of crowd analysis by considering video, spatio-temporal, and social media approaches for crowd analysis. Wakamiya et al. [45] proposed a novel spatial visualization system based on the Twitter dataset for uncovering the collective spatial attention and interest of users not at, but rather toward, different locations to answer the following questions: What do users collectively talk about when they refer to specific geographical places? What do users at a specific place commonly talk about when they refer to another geographical place?
Research based on urban activity space and behavior began to emerge in the 1960s [46,47], which mainly focused on the spatially distributed population [48,49] and the geography over time to better understand humans in terms of behavior and land use and their relationships over time. This research on urban activity space and behavior encouraged our research on urban activities behavior using LBSN data. The current studies based on daily urban activities in space and time [50,51] observed, e.g., living space, referred to as residence (spatial structure of the living space and the diversity mechanism [52,53]); workspace, referred to as professional; and leisure space, referred to as sports and leisure (focuses on the evolution of leisure time–space characteristics [54] and public leisure space selection and activity path [55,56]). Therefore, along the lines of the research mentioned above, the LBSN dataset not only documents the daily lives, activity patterns, and social media usage behavior of users, but also provides spatiotemporal patterns and dynamics that are related to the daily routines and behavior of users. The LBSN dataset also reflects the current rapid urbanization of the city. In this direction, we aimed to investigate the spatiotemporal information related to check-ins to identify and determine urban activities behavior. The simple hypothesis is that people are often likely to follow a typical daily routine: e.g., go to work, eat at some preferred restaurant, and go shopping and return home.
We explored the LBSN data to observe urban activities behavior in space and time using Sina Weibo (referred as “Weibo” [57]), the most famous Chinese microblog that is considered the Chinese version and replacement of Facebook launched by Sina Corporation [58] in 2009. By the third quarter of 2017, Weibo had 376 million monthly active users (MAU) and 172 million daily active users (DAU), where 93% of the active users used mobile devices to access Weibo [59,60]. This enormous number of users were attracted worldwide due to fast information sharing and check-in features [61]. Therefore, if we have enough data to observe distinctive human activities behaviors, this knowledge can be analyzed to study human daily activities behavior. However, others [62,63,64,65] explored the LBSN datasets to examine people’s daily check-ins, activities behavior, and mobility patterns in different cities. Most of the existing literature focused on Facebook and Twitter rather than Weibo. Therefore, our findings serve to fill this research gap by focusing on the most popular Chinese local social network site, Weibo. Previous studies [18,20] analyzed sex-based activities behavior in Weibo and suggested that female users are more inclined to use Weibo to provide helpful information to others. Another motivation of our research was that existing studies have not thoroughly analyzed sex-based urban activities behavior on Sina Weibo usage, especially in Shanghai, China. The contributions of our study are as follows:
  • We used a practical approach to study sex-based urban activities behavior in Shanghai, China, using geo-tagged posts from Weibo.
  • We examined urban activities density to explore the spatiotemporal distribution of activities using kernel density estimation kernel density estimation (KDE). The geographically weighted regression geographically weighted regression (GWR) method was used to observe the sex-based relationship between check-ins and associated activities, and standard deviational ellipse standard deviational ellipse (SDE) analysis was used to observe spatial directional trends of activities in the study area.
The motivations for using Weibo may differ between male and female users as, in Shanghai, 48.3% of the population is male and 51.7% is female. However, statistics show that 50.10% of Weibo users are men and 49.90% are women [66] and is considered one of the most popular social media platforms in China due to the unavailability of Facebook and Twitter. According to statistics [67], 72% of the total Sina Weibo users are aged from 20–35 years, among whom the majority of users are in their 20s [18]. Hence, by analyzing the spatiotemporal information of the Weibo dataset, we can explore urban activities’ behavior. This line of research can help improve our understanding of urban activities behavior by considering LBSN data (a source of social media big data) as supplementary to rather than a substitute of traditional data sources when making policy decisions [68] associated with urban planning [69] and city functions [70].
The rest of the paper is organized as follows: 
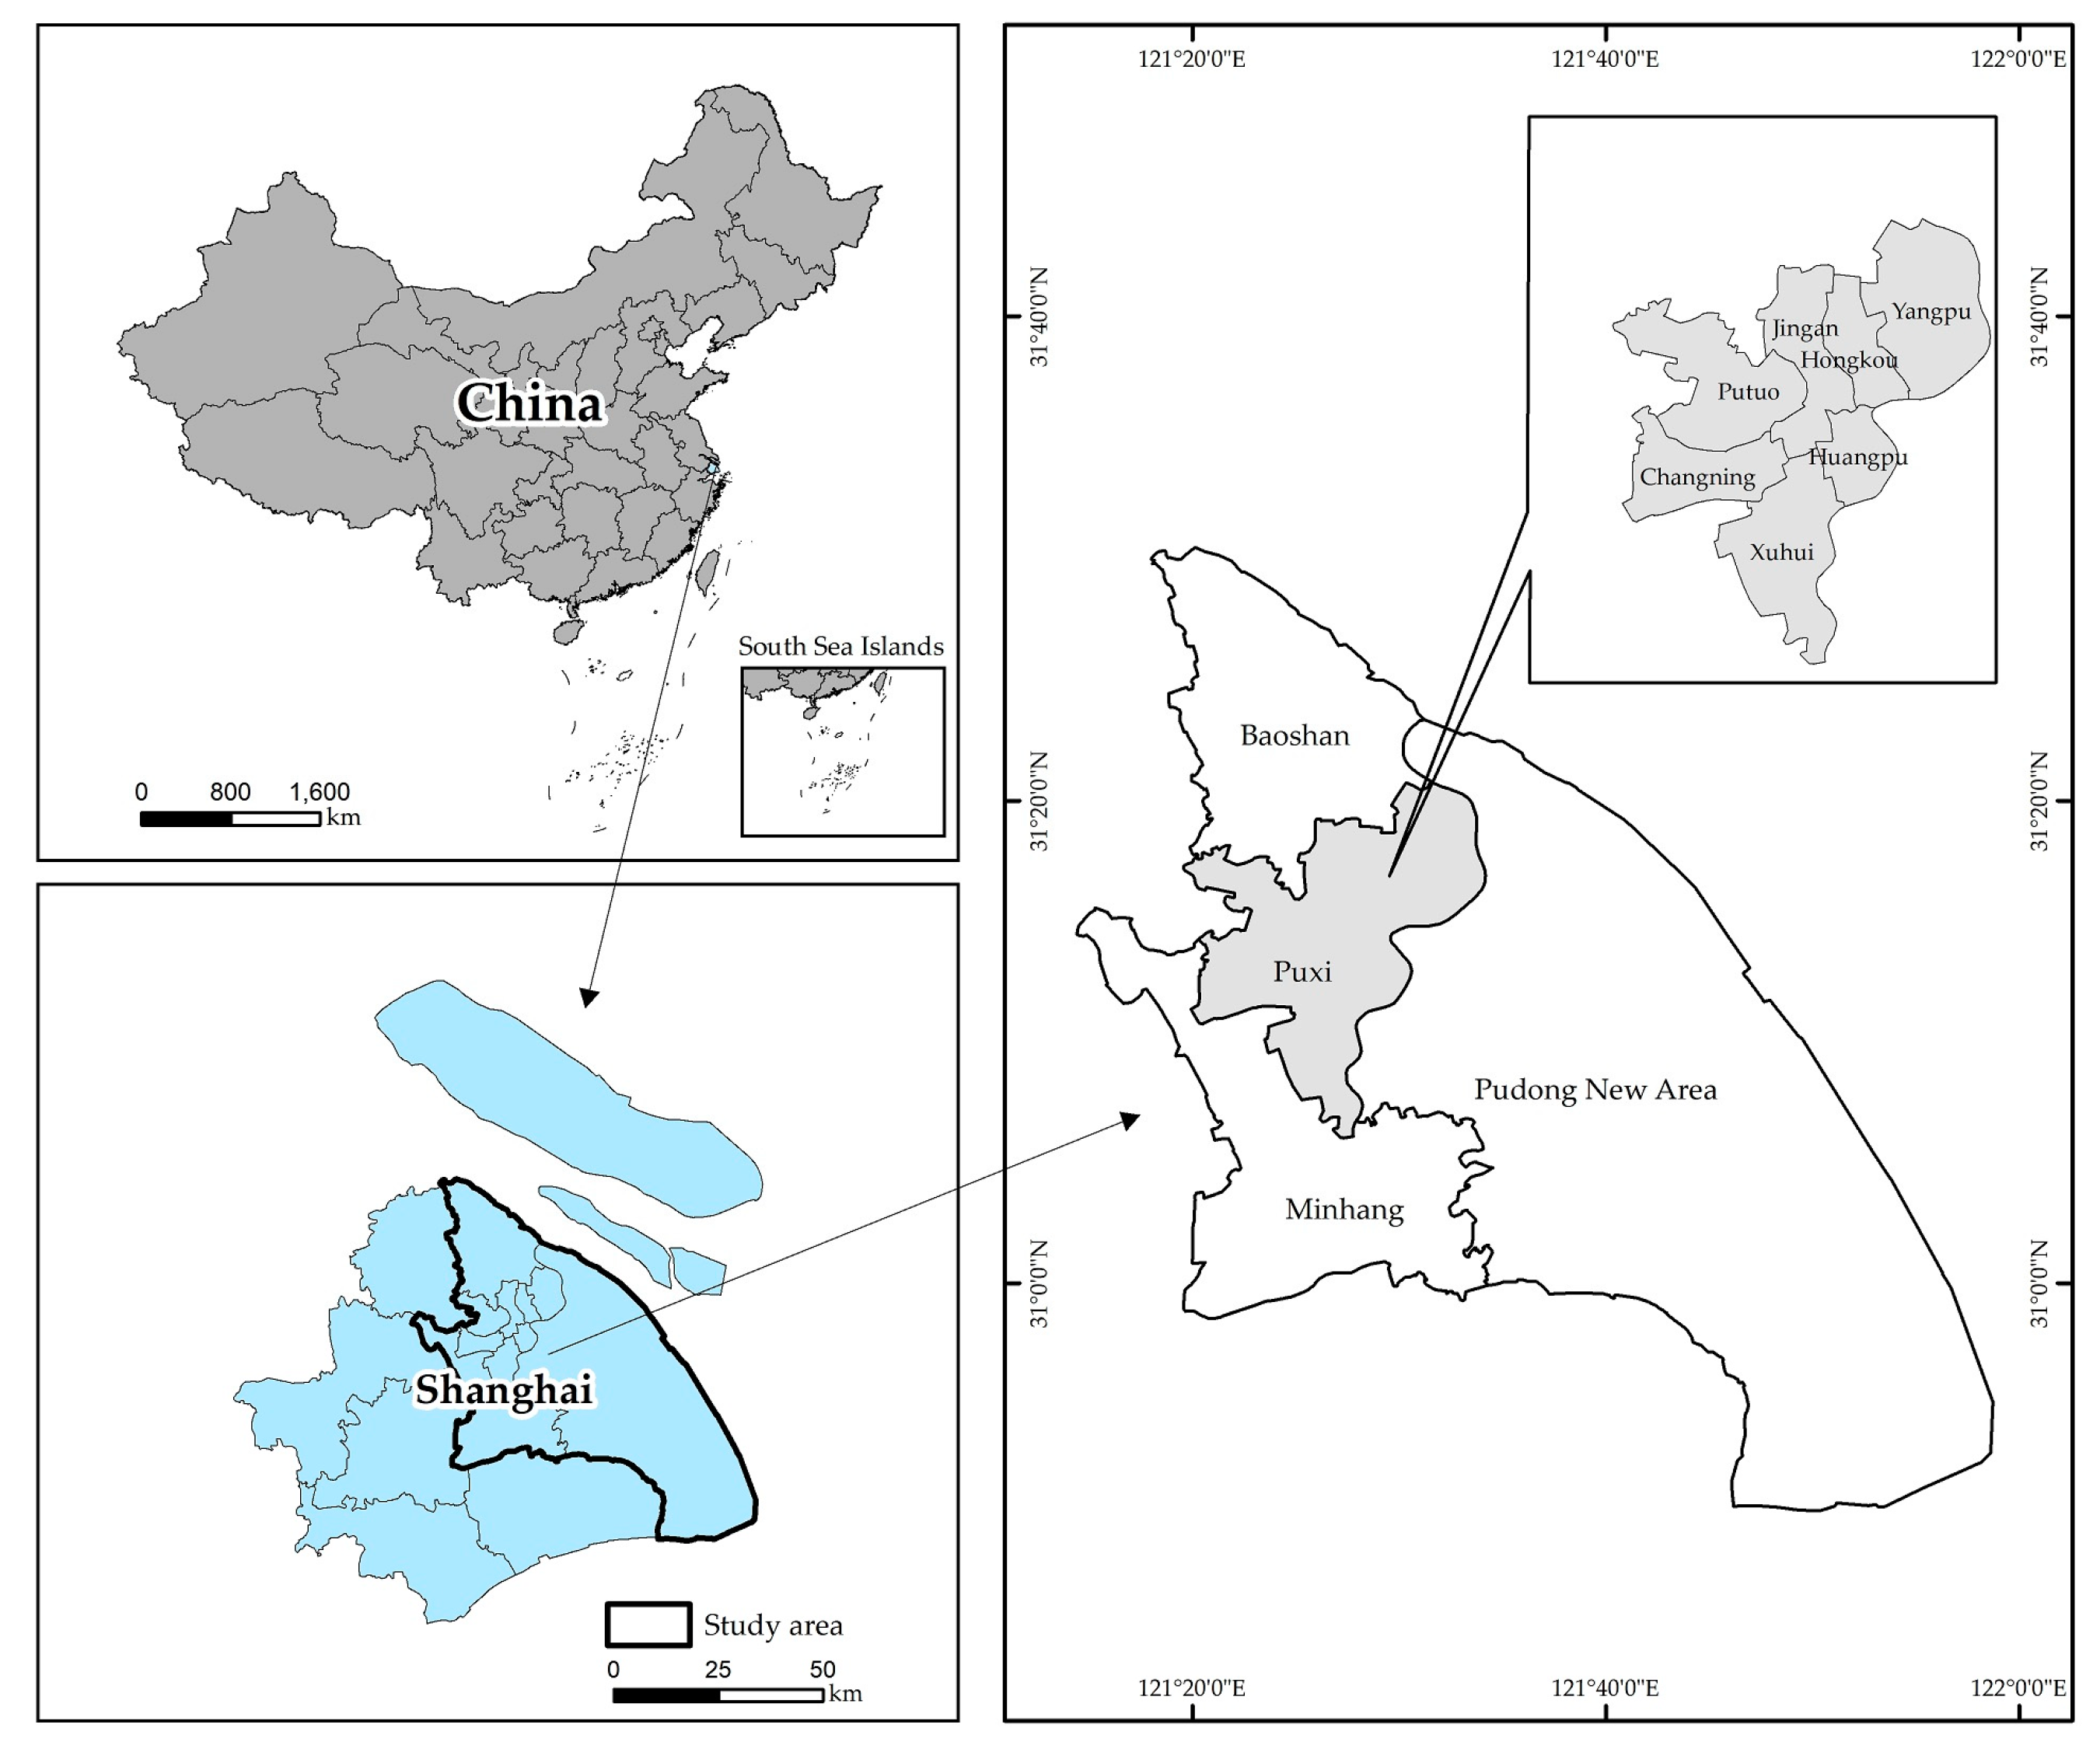
Section 2 defines the area of study and dataset. Section 3 describes the methodology. Section 4 presents the experimental results. Finally, Section 5 concludes the paper with a proposal for future research.

2. Study Area and Data

2.1. Study Area

Shanghai, China (30°40′–31°53′ N and 120°52′–122°12′ E [71]) is situated on the eastern edge of the Yangtze River Delta, which has a total area of 8359 km2. In 2015, Shanghai had a GDP of USD $366 billion [72], income per capita of USD $7333, with disposable income per capita of USD $7788 for urban residents, and USD $3412 income per capita for rural residents [73]. Shanghai, an international center for trade, tourism, and fashion has a population of around 24.15 million, an agricultural land area of 317,926 ha, construction land area of 301,709.27 ha, and an unused land area 193,564.46 ha, which is considered a highly dense and populated community.
In 2016, the Shanghai municipal government divided Shanghai into 16 county-level divisions that include 15 districts (Baoshan, Changning, Fengxian, Hongkou, Huangpu, Jiading, Jingan, Jinshan, Minhang, Pudong New Area, Putuo, Qingpu, Songjiang, Xuhui, and Yangpu) and one county, Chongming [74], with 106 towns, 2 townships, and 106 sub-districts in the township level division; 4463 communities and 1571 administrative villages in the village level divisions. Historically, Huangpu West, and now Puxi (Figure 1), included seven districts (Changning, Hongkou, Huangpu, Jingan, Putuo, Xuhui, and Yangpu), which are referred to as the city center of Shanghai [75], and Baoshan and Minhang districts are considered the suburban area based district connected to the city center.

2.2. Data Source

2.2.1. Check-In Data

In the current study, we used the Weibo dataset during January to December 2017 from Shanghai, China, as it contains information like a unique user ID, time and date of the check-in, geolocation (longitude and latitude), venue type, venue category, and sex, which were collected via web or mobile applications [76]. A total of 921,581 anonymized records of geo-tagged check-ins related to the study area were acquired. The LBSN dataset could therefore archive the day-to-day activity patterns and behaviors toward using social media, and present the spatiotemporal trends of daily life [77]. An example of a typical Weibo check-in is shown in Table 1.

2.2.2. POI Data

In China, the point of interest (POI) categories are classified in accordance with land use. However, POI data have the following advantages over check-in and land use data: POI data have greater flexibility because point data are easy to transform into arbitrary scales; in POI data, a user’s preferences and social interactions can be characterized by social interactions instead of land use types; and POI data have much finer statistical granularity.
The POI dataset used in the current study were attained from a web-based mapping platform, “AutoNavi.” In total, 123,658 POIs are attained, and we categorized the points into 10 activity categories (Table 2) based on the geolocation and type of the visited locations (but not limited to) obtained from Weibo check-in. About 95.6% of the check-ins were associated with the category information; the rest of the check-ins with no valid match with the categories were considered invalid.

3. Methodology

We analyzed the Weibo-based geolocation dataset (January–December 2017) from Shanghai, China containing information like the unique user ID, sex, time, day, venue type, venue category, and geolocation. 
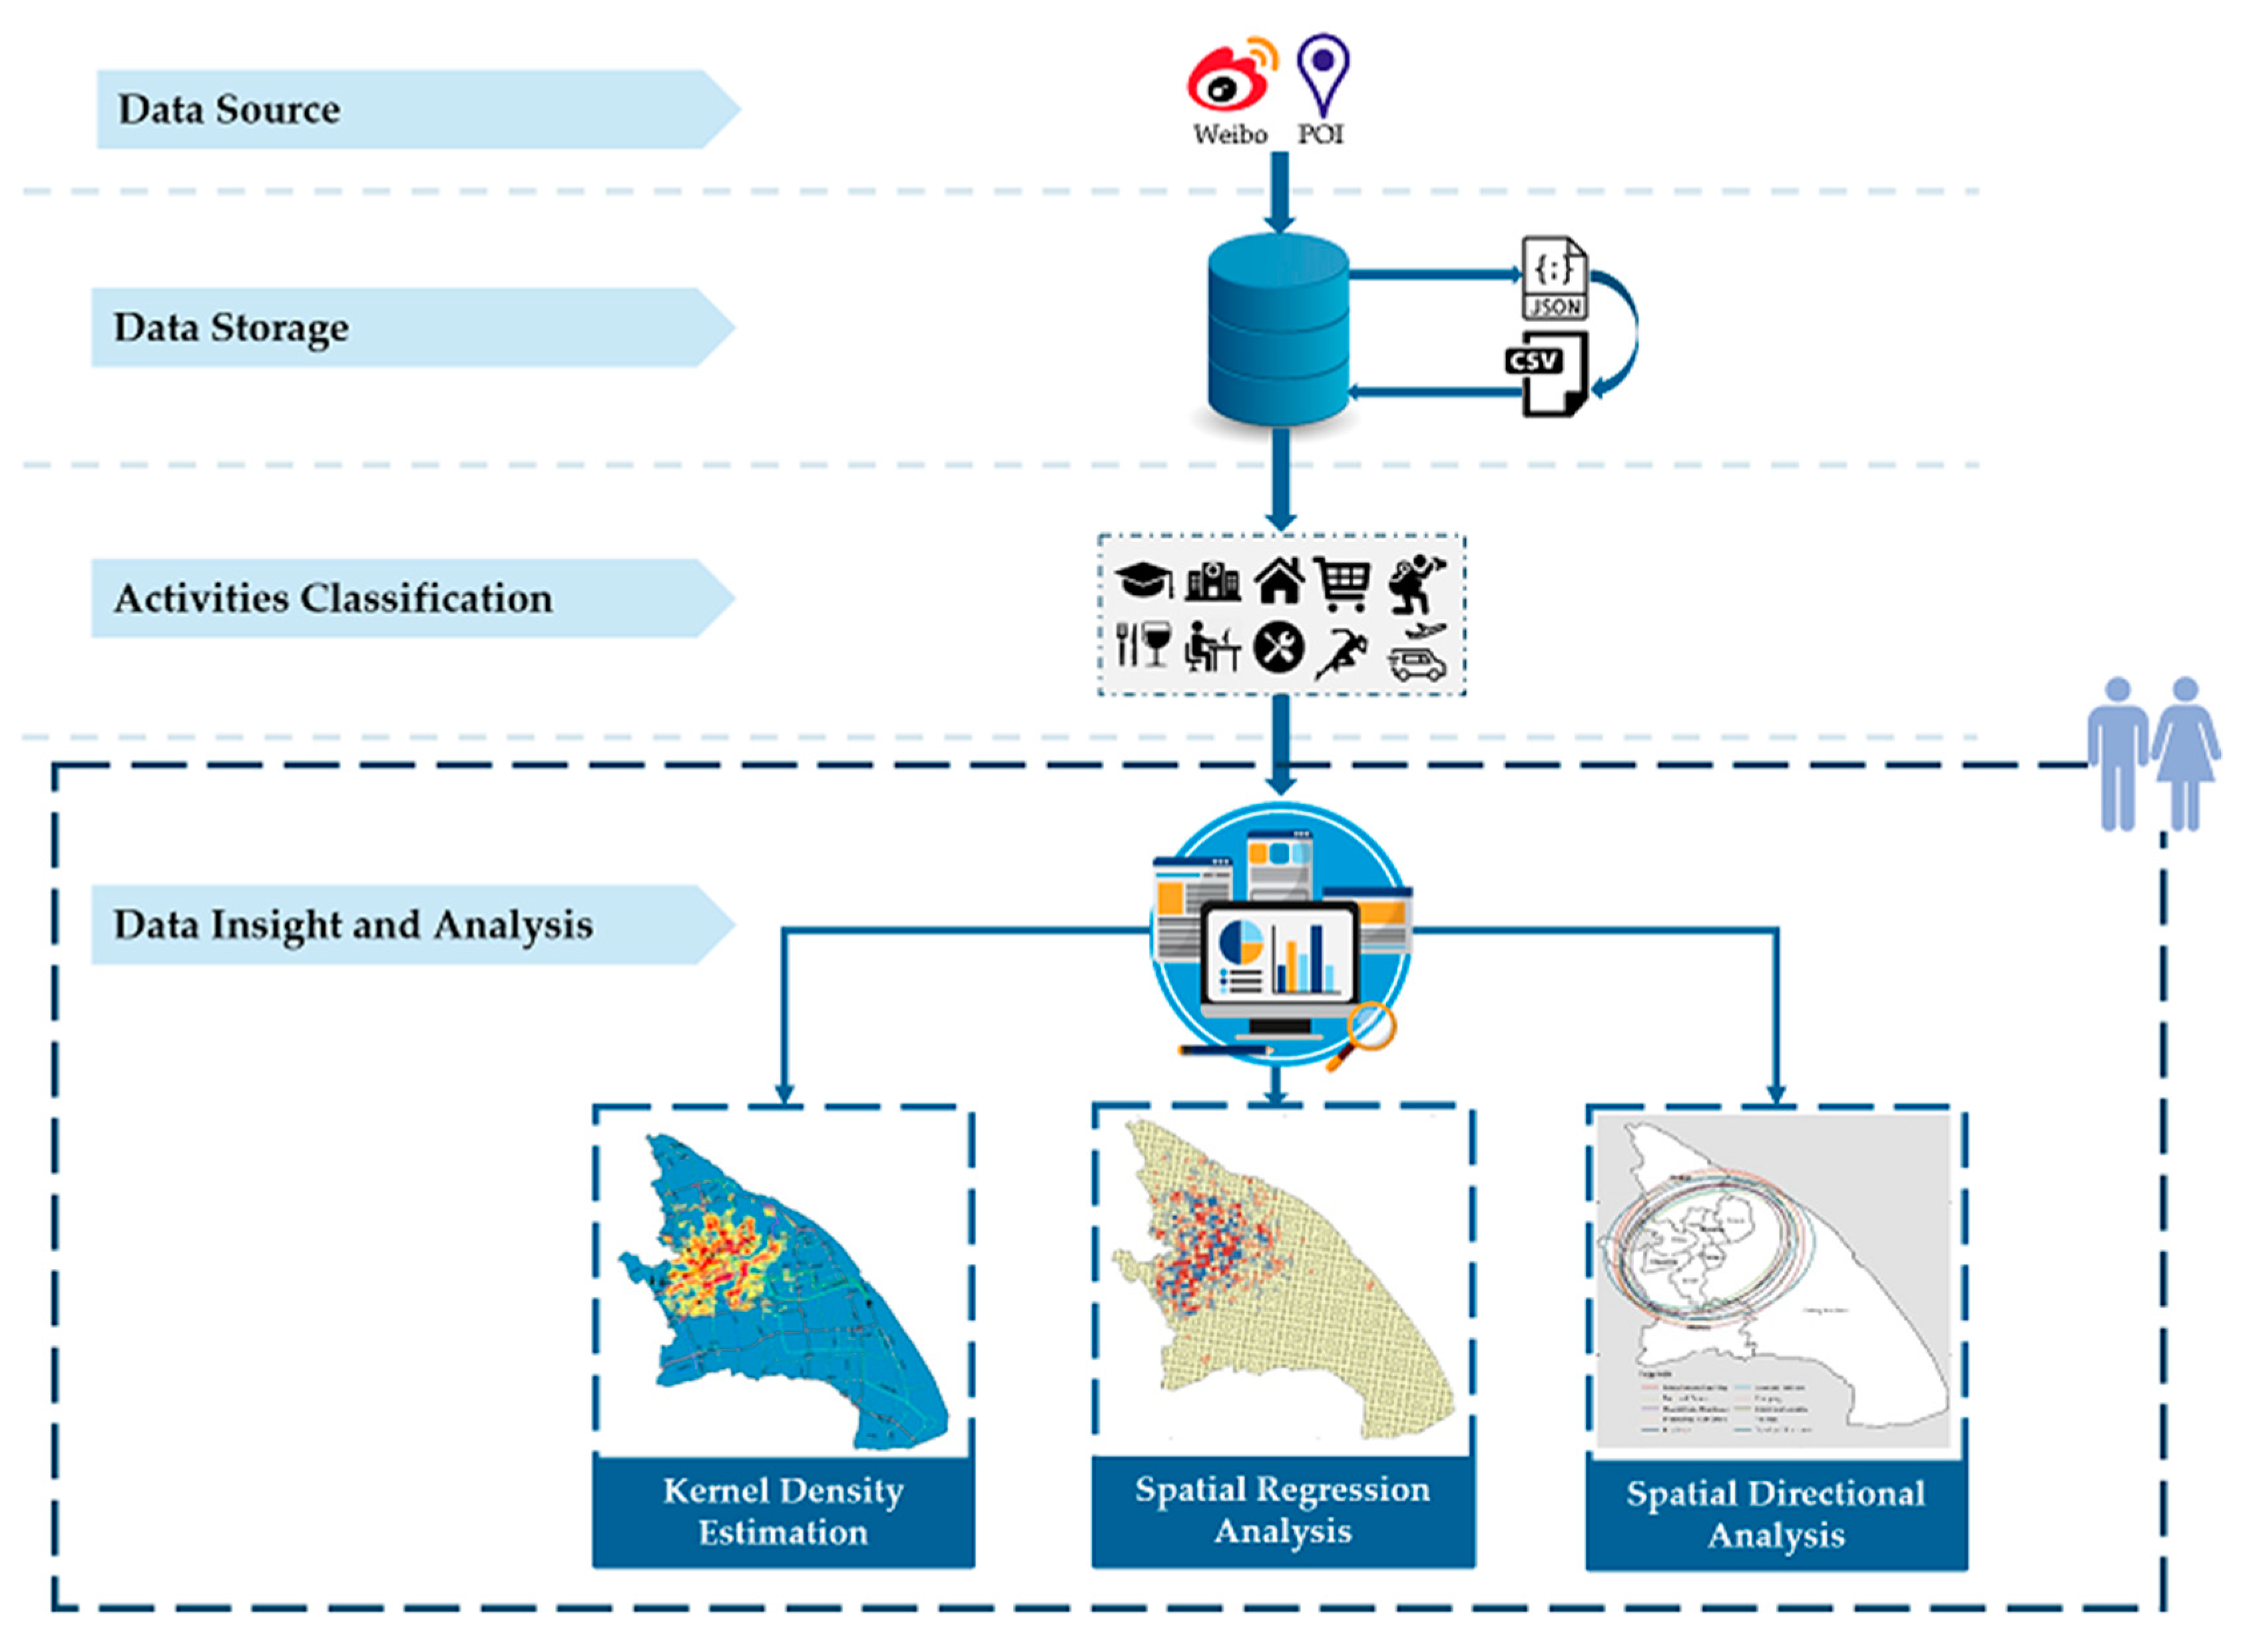
Figure 2 presents the activities analytics framework, where the LBSN data analysis methodology involves the two stages: collection, storage, and analysis of LBSN data. The download of Weibo data was the main task in the data collection and storage stage, which was achieved by using a python-based Weibo application programming interface (API) an open interface of Sina Weibo [78], which resulted in separate files in JavaScript Object Notation (JSON) format. However, JSON is used as a standard data format and is considered a dominant programming language with the availability of public modules (reading and writing) [79,80]. All the check-ins downloaded in multiple JSON files were then transformed into a single comma-separated values (CSV) format file to list the check-ins according to space and time.
However, in the data analysis stage, the critical task is to mine and investigate the features of LBSN data. During data pre-processing, invalid records were excluded by considering four criteria:
(1)
Full availability of information, i.e., user ID, date, time, sex, venue type, venue category, and location (longitude and latitude). The missing check-in information was added by comparing the information with POI, and accurately identifying the check-in location with high similarity, unifying the standard format, and re-integrating the information.
(2)
The geolocation of the records in the study area concerning the POI location.
(3)
The range of records within the set date and the prescribed time for the sampled data.
(4)
Every user checked-in twice in a month. We deleted multiple or duplicate data with the same time, same location, and similar content, and specified that a check-in location performed by the same user on the same day counted as one check-in.
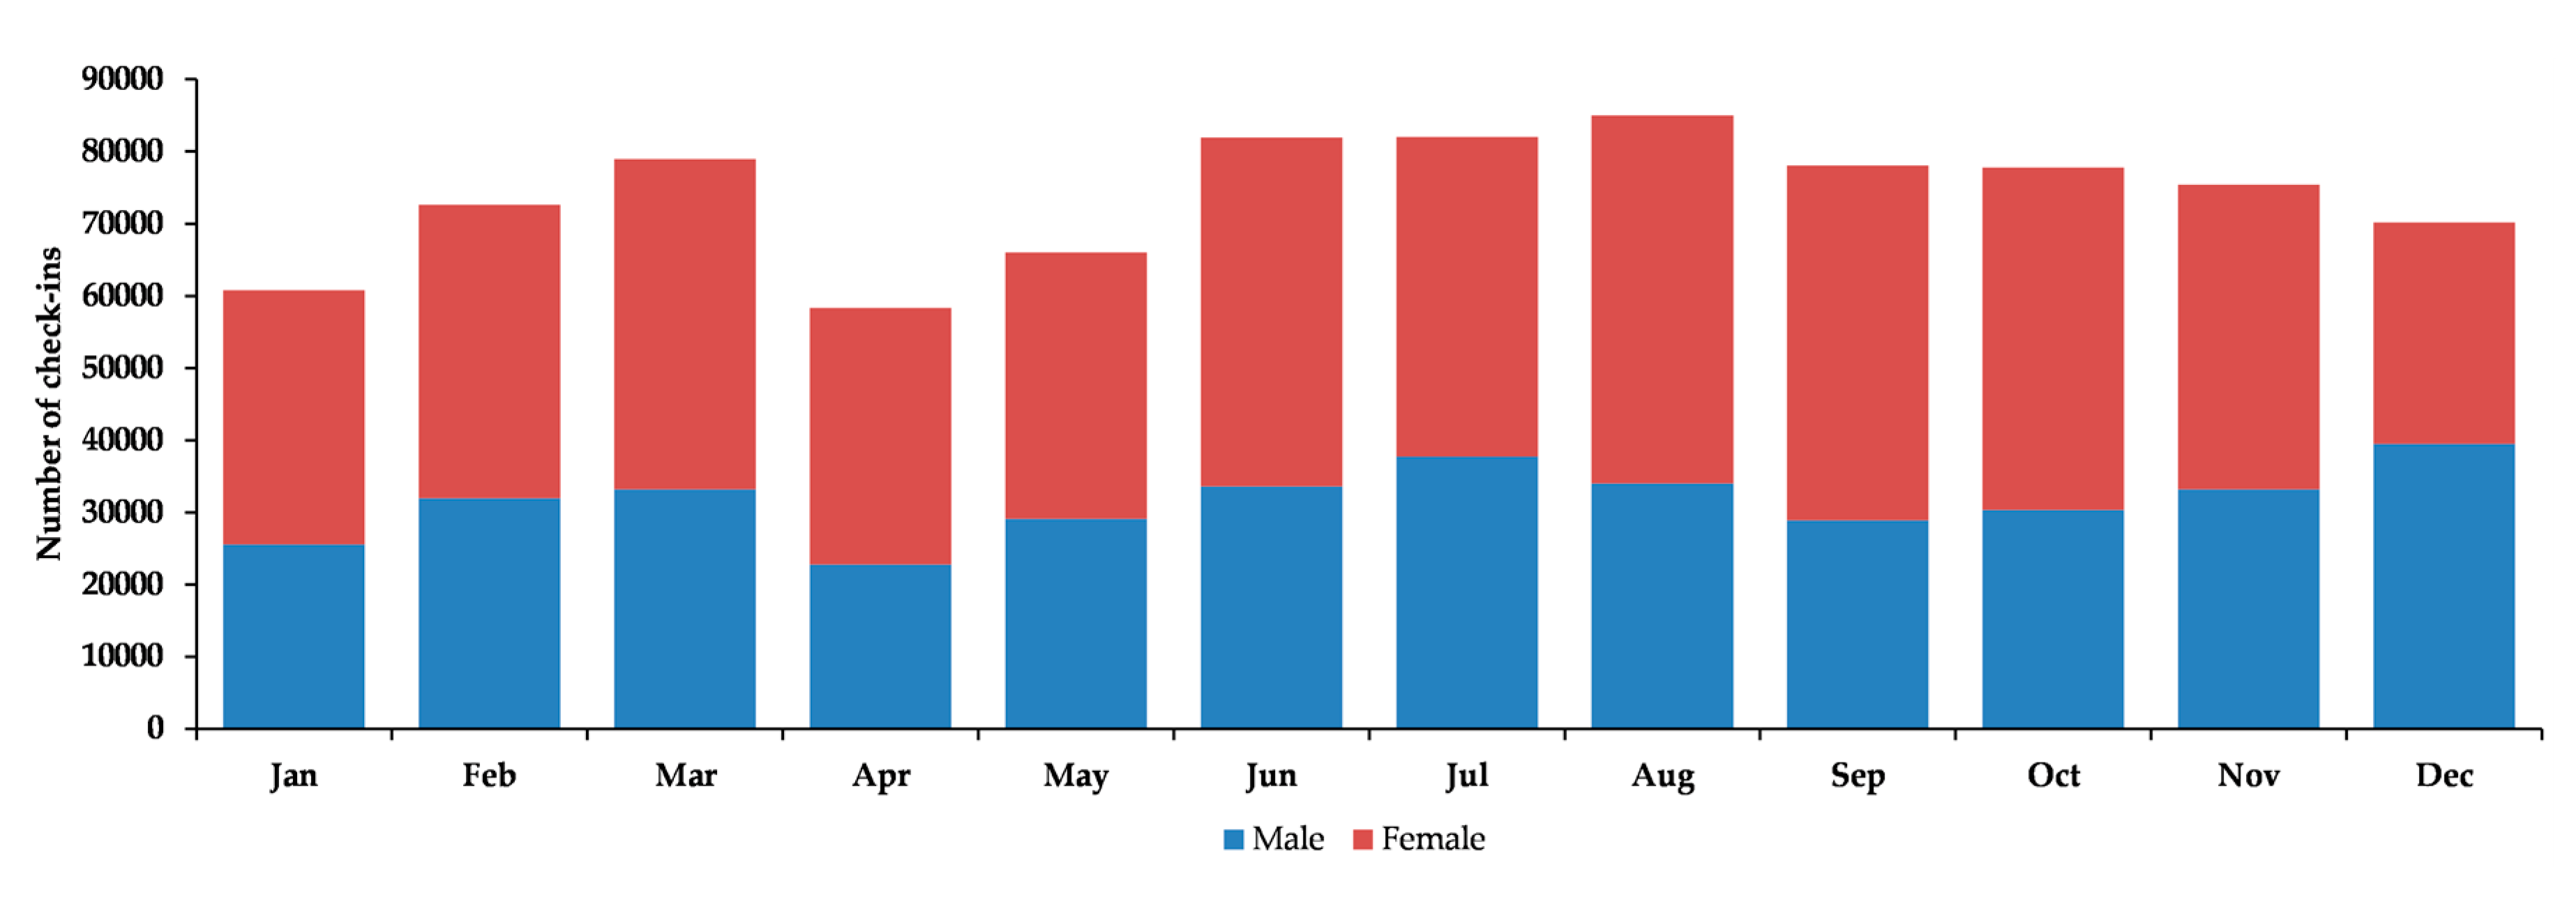
From 921,581 anonymized check-in records, 887,008 check-in records of activities were obtained after pre-processing for data noise, incomplete records, and invalid and fake users related to POI association and study area. The distribution of check-ins based on months and sex is shown in Figure 3. Finally, in the data insight stage, we mined and further investigated the features related to LBSN check-in data by considering geolocation, time, venue type, venue category, and sex.

3.1. Kernel Density Estimation

In the current study, to estimate the density function and to observe the spatial patterns of activities, kernel density estimation (KDE) [81,82,83] was used before detecting the status of activity hotspots. KDE is a popular spatial tool [41,42,84,85] used to examine numerous aspects (e.g., usage behavior, boundary defining, activities association, and mobility patterns) of LBSN data and data features, which are relative to the destination and time of the location. KDE helps researchers to observe and analyze the sparse distribution of activities and destinations, and to examine the spatial distribution in communities based on neighborhoods. For spatially distributed events in time, KDE can be used to identify the fine density of events [86] to create a finer surface that better exemplifies the density of the events.
To calculate the fine density of activities at location a, let fKD be a density function at geolocation a and A is a set of activities related to the check-ins data:
A = {a1,……, an}
where the geolocation of the activity 1 < i < n: ai = <x,y>, where i is individual, and t is time.
f K D ( a | A , h ) = 1 n   i = 1 n K h ( a , a i )
K h ( a ,   a i ) = 1 2 π h exp ( 1 2   ( a     a i ) t h 1 ( a     a i ) )  
where a is the geolocation of an activity in dataset A with bandwidth h. To produce fine density around activities dataset A at point ai, we assumed the value of bandwidth h depends on the estimated density fKD. However, in the density estimation, bandwidth (larger/smaller) is assumed to be a vital parameter; too fine a density is produced with a large bandwidth, whereas abrupt changes occur with small bandwidth [87]. Therefore, constantly setting the bandwidth in comparison with the density surface results in achieving the optimal bandwidth. The subsequent density estimate fKD is interdependent on bandwidth h. To construct the density estimate and calculate the value of bandwidth h, the data-driven approach for the log-probability was used, which is given as follows:
L ( h ) =   1 a t i = 1 a t l o g   f K D ( a i | A , h )
where at represents the events and ai are data points in dataset A.

3.2. Geographically Weighted Regression (GWR)

To observe the spatial regression to estimate the local parameters by considering the spatial nonstationarity, GWR analysis was used, which is given as follows:
y i = β 0 ( u i , v i )   +   k β k ( u i , v i ) x ik   +   ε i
where the geolocation of the observation is represented as (ui, vi), the value of the intercept is represented as β0(ui, vi), the kth variable of observation i for the estimated parameter is expressed as βk(ui, vi), and the error term is represented as εi.
However, the estimated coefficients may differ in space, and the observation i near the observed data is more effective compared to the data beyond i from βk(ui, vi), which is represented as follows:
β k ( u i , v i ) = ( X T W ( u i , v i ) X ) 1 X T W ( u i , v i ) Y
where the diagonally distributed matrix, the weighting matrix, is represented as W(ui, vi). For the observation i neighbors, the GWR is partly dependent on the estimated bandwidth, where the bandwidth for an area with more check-ins is large compared to the small areas that have fewer check-ins. The minimum Akaike information criterion (AIC) for the GWR model [88] was used to calculate the suitable bandwidth.

3.3. Standard Deviational Ellipse (SDE)

In the current study, we used a spatial directional analysis technique named standard deviational ellipse (SDE), which is a popular geographic information system (GIS) tool, and describes the bivariate distribution of the features (central tendency, dispersion, and directional trends) first proposed by Lefever [89]. The parameters of SDE include the center of the ellipse, axis (major and minor) of the ellipse, and the orientation angle of the ellipse (also referred to as azimuth). Equation (7) is used to calculate the axis (major and minor) of the SDE, and the relative relationships of the axis (major and minor) of the ellipse represent the flattening degree. Equation (8) calculates the direction of the orientation angle trend, and Equation (9) calculates the standard deviations of the axis (major and minor) of the ellipse for the SDE. The major axis of the ellipse for the SDE is demarcated as the leading direction to observe the deviation trend [89], and the spatially distributed region for the distribution of the check-ins formed for the axis (major and minor) of the ellipse. The ellipse center of SDE ( X ¯ w , Y ¯ w ) is calculated as:
{ X ¯ w = i = 1 n w i x i i = 1 n w i Y ¯ w = i = 1 n w i y i i = 1 n w i
where the geolocation for activities is i and the total number of activities is n; xi and yi are the geometric center coordinates of activities to represent the spatial location of check-in; w i is the corresponding weight; ( x ˜ i , y ¯ i ) denote the coordinate’s deviation from the spatial location of each object to the ellipse center of SDE ( X ¯ w , Y ¯ w ). The orientation angle θ of SDE is calculated as follows:
tan θ = ( i = 1 n w i 2 x ˜ i 2     i = 1 n w i 2 y ¯ i 2 )   +   ( i = 1 n w i 2 x ˜ i 2     i = 1 n w i 2 y ¯ i 2 ) 2   +   4 i = 1 n w i 2 x ˜ i 2 y ¯ i 2 2 i = 1 n w i 2 x ˜ i y ¯ i .
The standard deviations of the ellipse σ x and σ y in the x and y directions are calculated as follows:
{ σ x = i = 1 n ( w i x ˜ i cos θ     w i y ¯ i sin θ ) i = 1 n w i 2 σ y = i = 1 n ( w i x ˜ i sin θ     w i y ¯ i cos θ ) i = 1 n w i 2 .
In the current study, we calculated SDEs for different activities to observe the spatial orientation and direction, and the temporal activities behavior for trends.

4. Results and Discussion

4.1. Density Variation and Distribution of Activities

In the current study, we used the geolocation-based check-in dataset, which was obtained from Weibo, and analyzed the density of activities using KDE. 
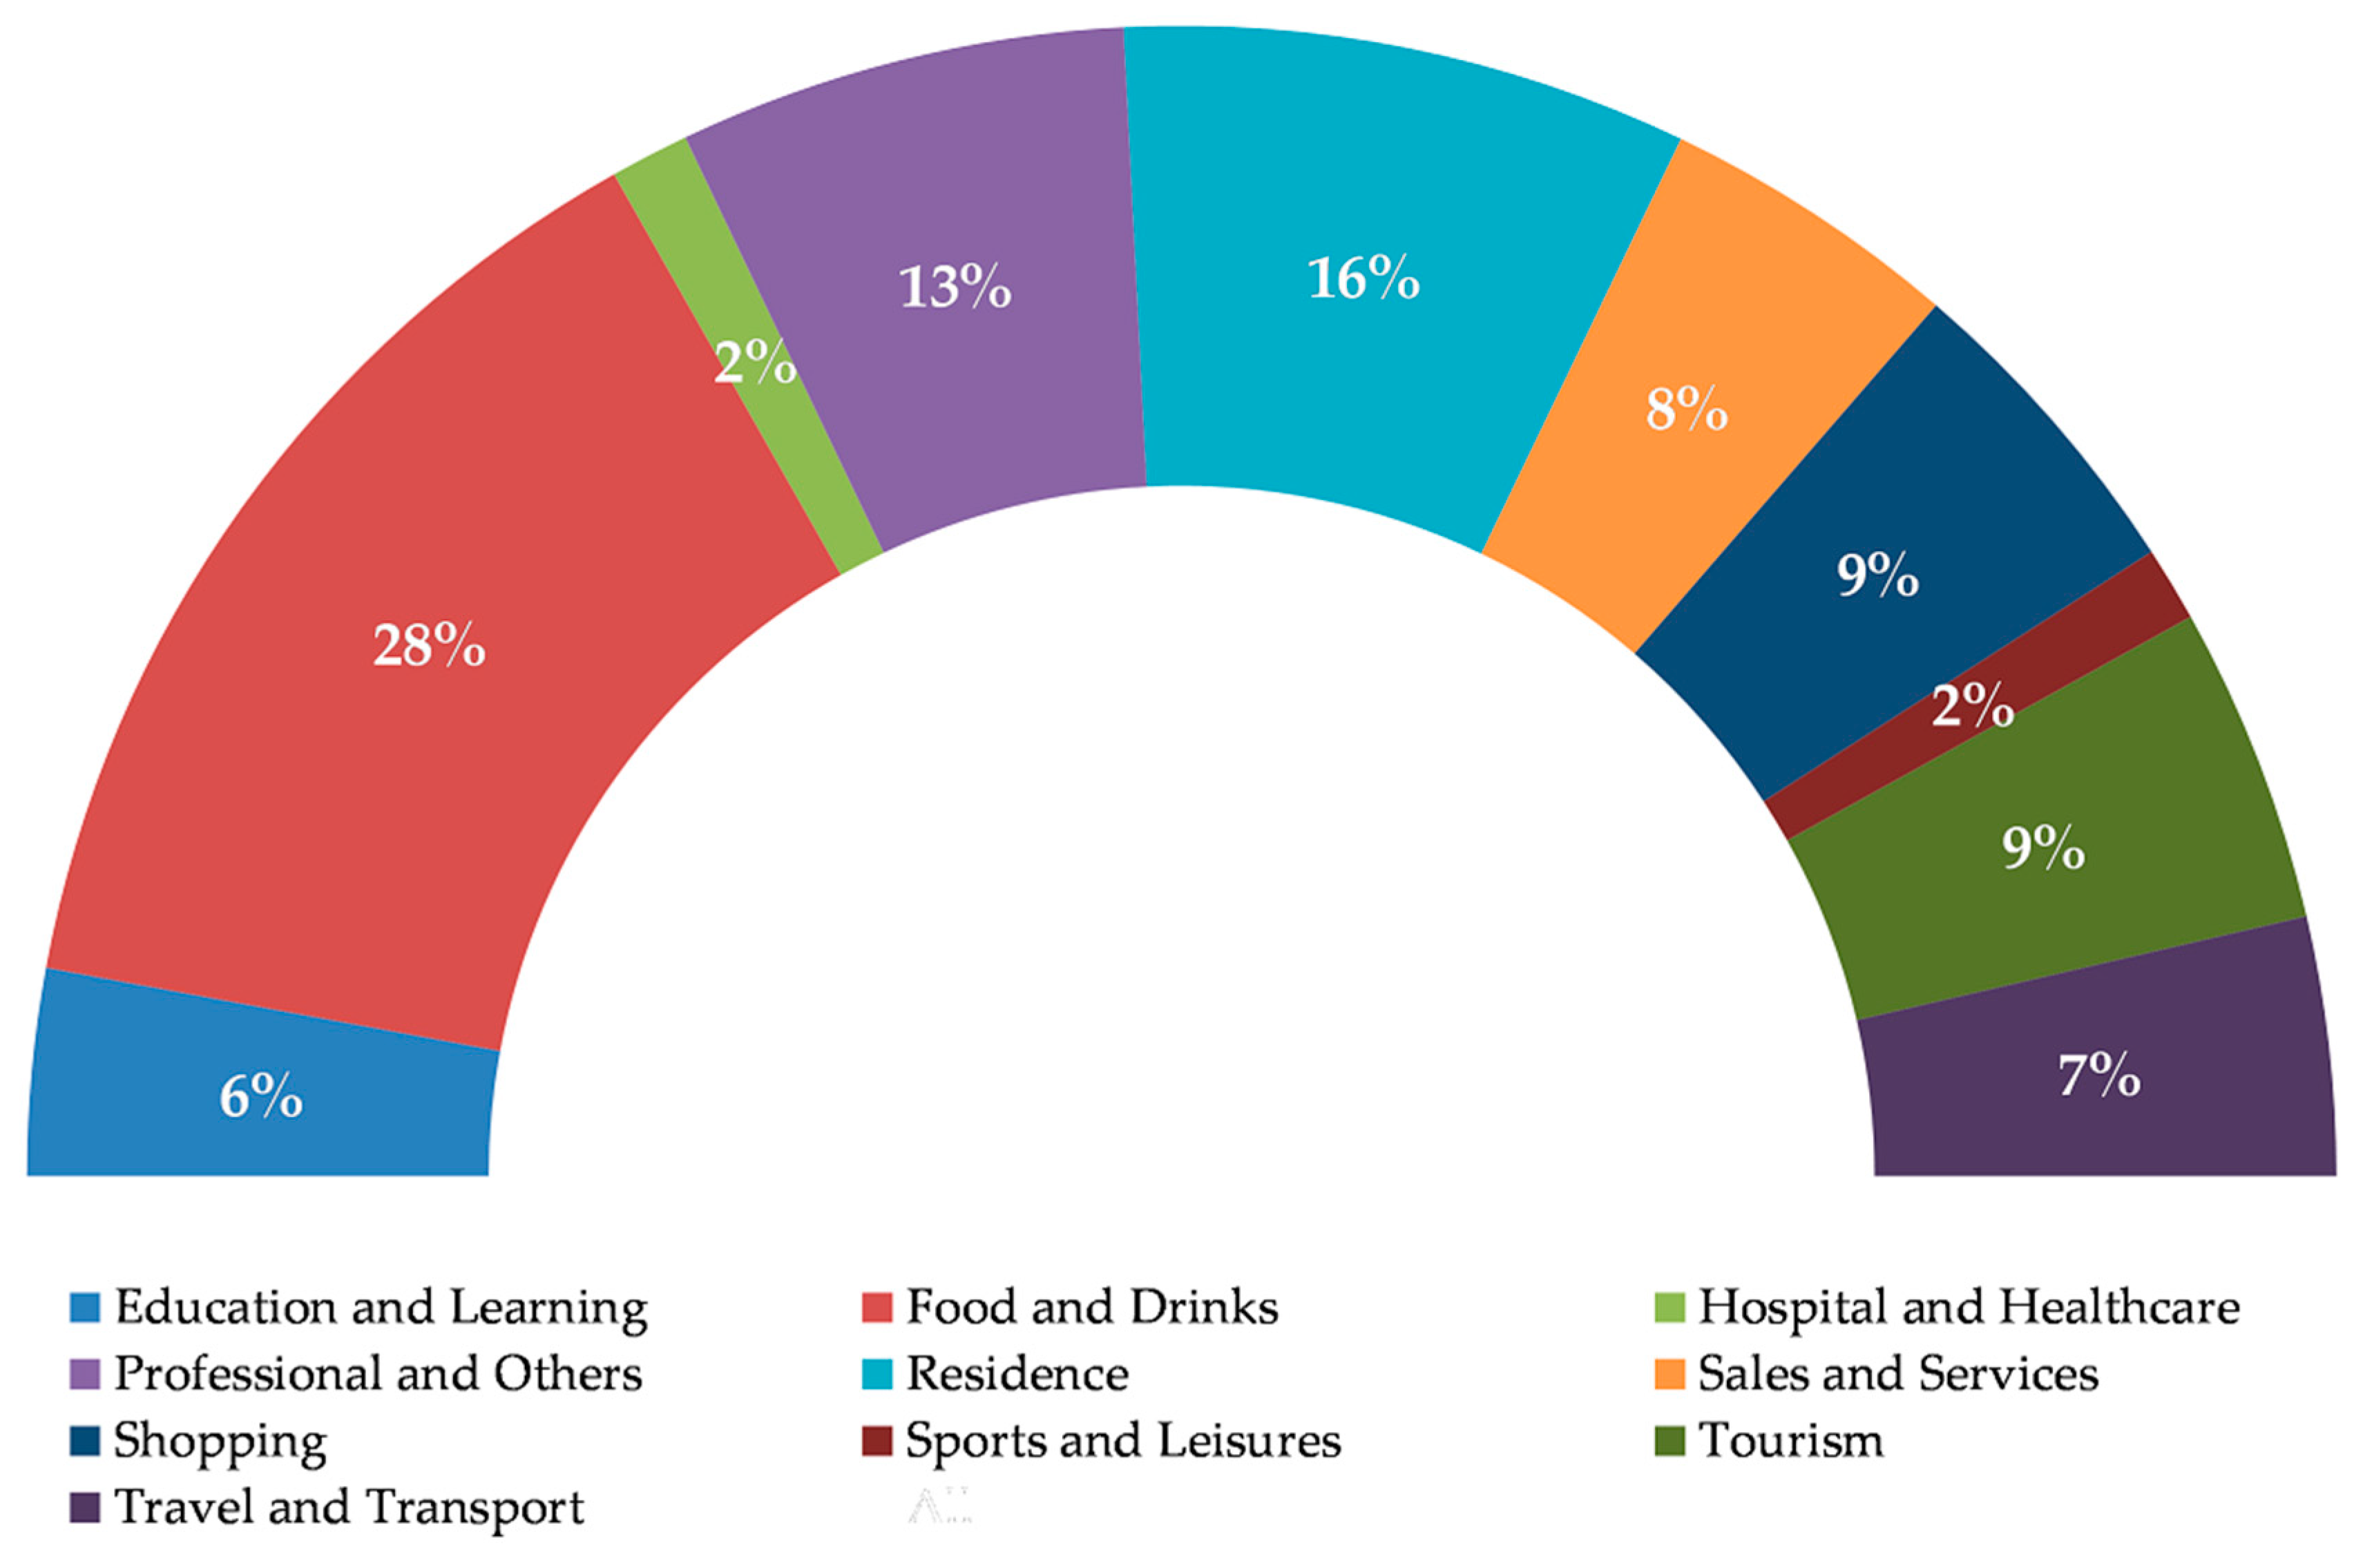
Figure 4 presents the overall check-in distribution of activities in Shanghai. A significant amount of check-ins in Shanghai was associated with activities related to Food and Drink (28%), Residence (16%), and Professional and Others (13%). Generally, more time was spent at home than at food and drink locations (e.g., restaurants, coffee shops). The high amount of check-ins at food and drink facilities may be because they provide free Internet access.
Figure 5 presents the distribution of activities during weekdays and weekends, illustrating that the distribution of activities related to Education and Learning, Hospital and Healthcare, and Professional and Others was high during weekdays and very low during weekends compared to the activities associated with Food and Drink, Residence, Sales and Services, Shopping, Sports and Leisure, Tourism, and Travel and Transport.
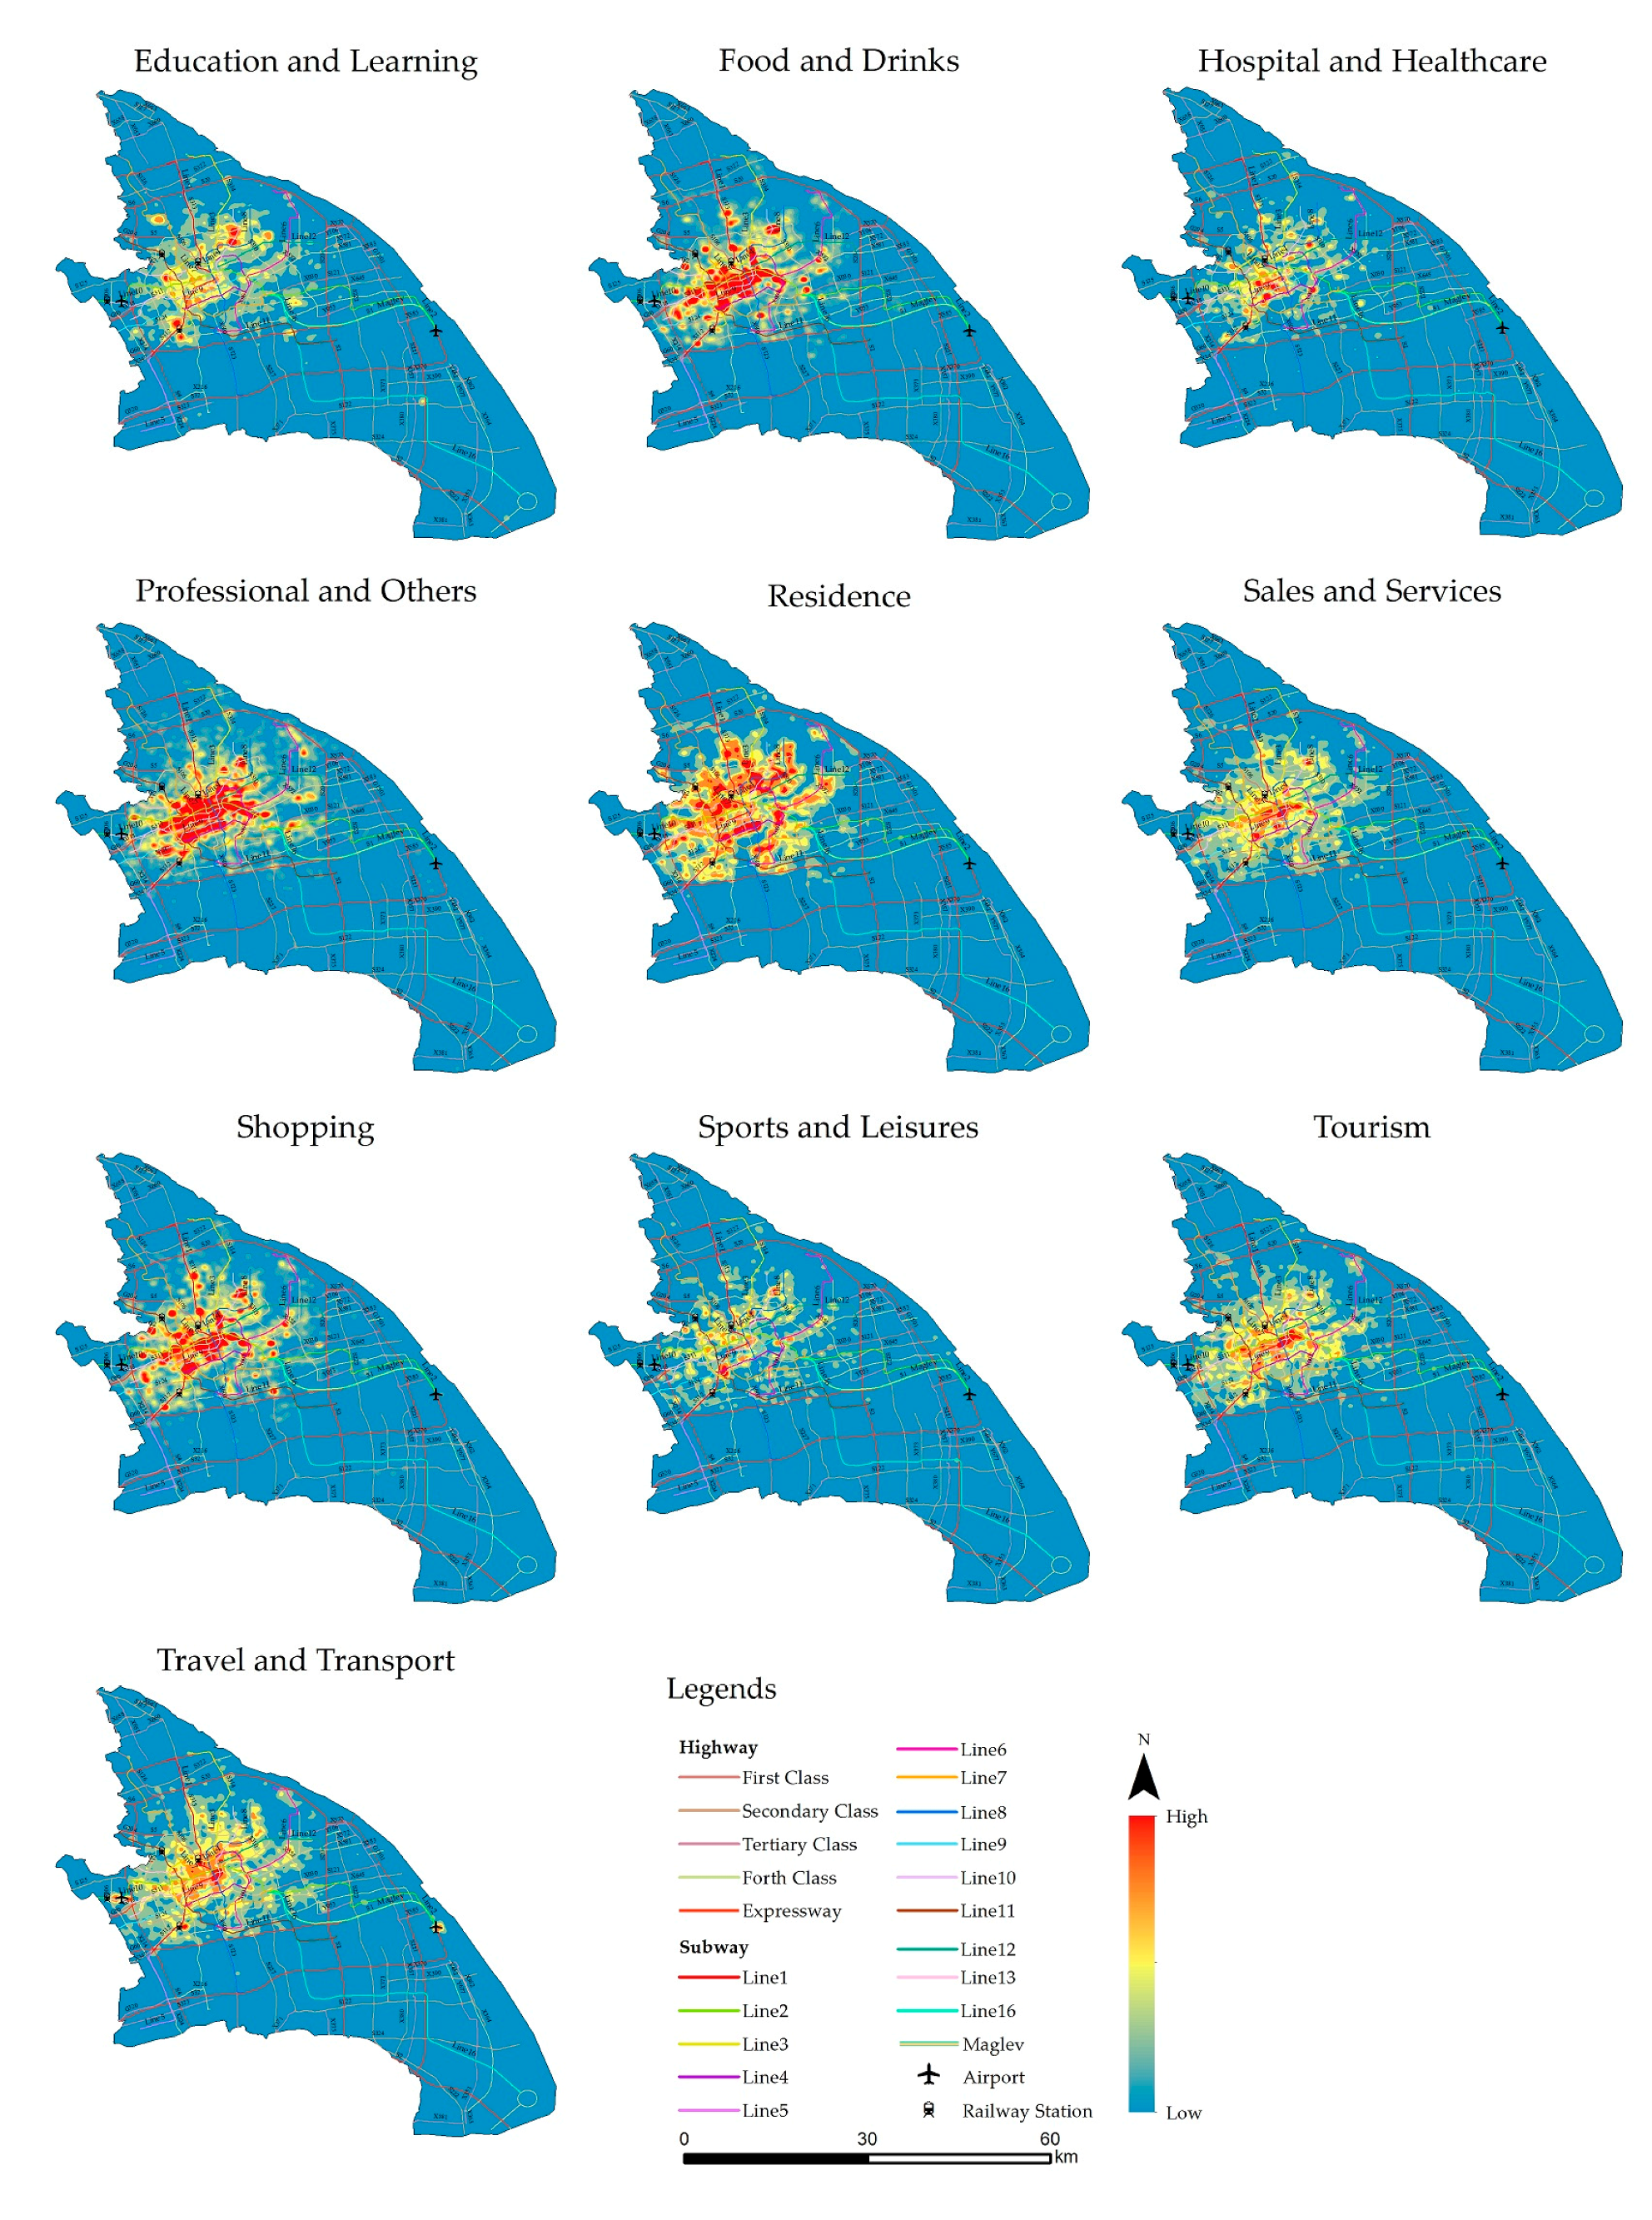
Figure 6 presents the kernel densities of activities in Shanghai. The check-in densities for Education and Learning, Hospital, Healthcare, and Sports and Leisure were relatively low and dispersed over the study area.
The check-in densities for Sales and Services, and Tourism were dense in the city center, and low density dispersed amongst the rest of the study area. A high check-in density for Travel and Transport was observed alongside the subway and railway stations, and the airport, but dispersed in the city near highways due to the Shanghai Bus Rapid Transit (BRT) network. However, the check-in density of Professional was high in the city center, but Food and Drink, Residence, and Shopping were dense in the city center as well as in the suburban areas (Baoshan and Minhang districts). Hence, Figure 6 shows that Food and Drink, Residence, and Shopping are directly connected with the simple assumption that more Food and Drink, and Shopping facilities exist near the residential areas, which resulted in the high density of these activities in almost the same pattern. Generally, increasing numbers of people are preferring to live near the communities where they have easy access to service, i.e., transport, health, entertainment.
To investigate the activities behavior, we analyzed the data based on sex during weekdays and weekends in Shanghai. 
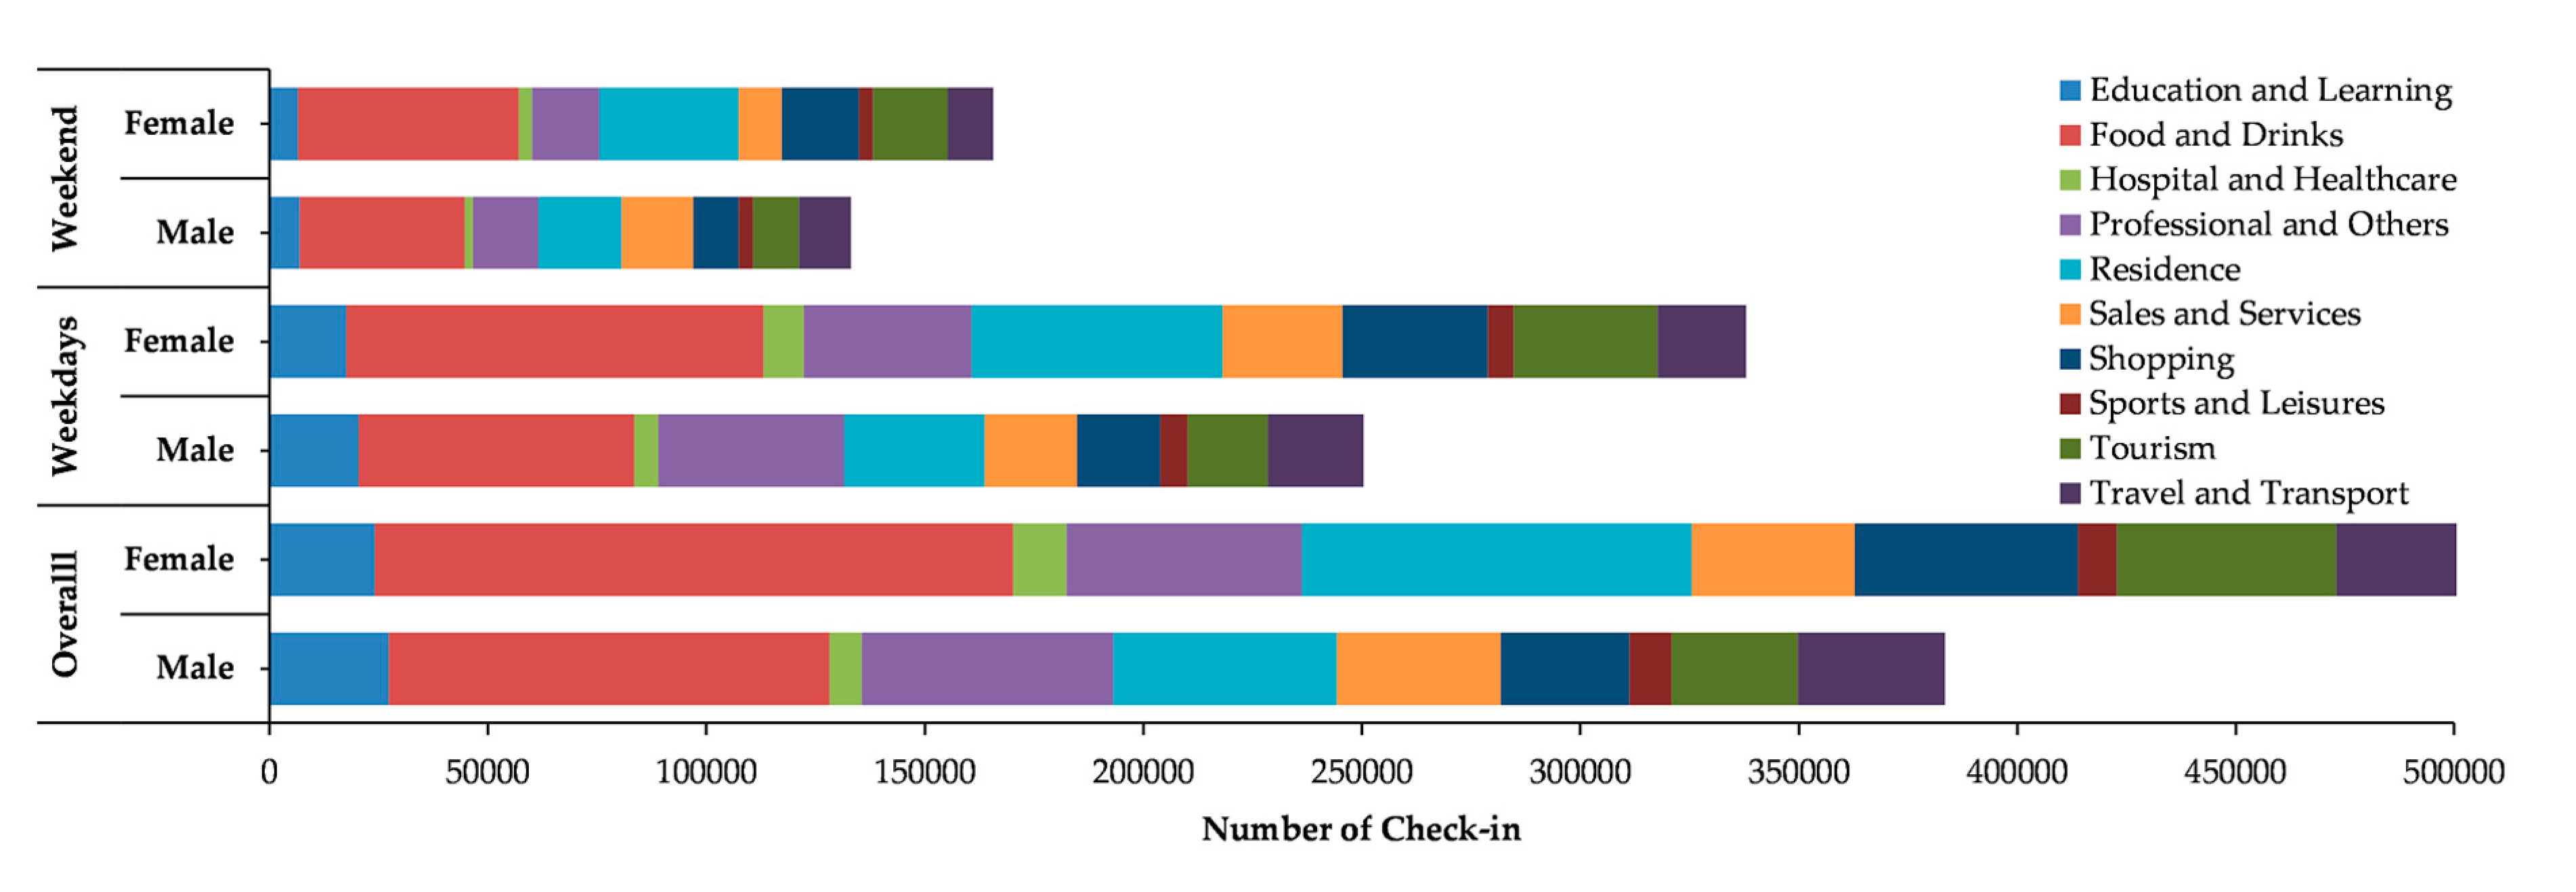
Figure 7 presents the sex-based check-in distribution of activities in Shanghai during the weekdays and weekends. Female users used Weibo more when performing activities related to Food and Drink, Hospital and Healthcare, Residence, Shopping, and Tourism. However, men were more inclined to use Weibo when performing activities related to Education and Learning, Professional and Others, Sales and Services, and Travel and Transport. However, we observed that during weekdays, men were more inclined to use Weibo when performing the activities related to Education and Learning, Professional and Others, and Travel and Transport, whereas women were more inclined to use Weibo when performing the activities related to Food and Drink, Hospital and Healthcare, Residence, Sales and Services, Shopping, and Tourism. We observed that during the weekends, male users were more inclined to use Weibo when performing activities related to Sales and Services compared to weekdays and female users for the rest of the activities.
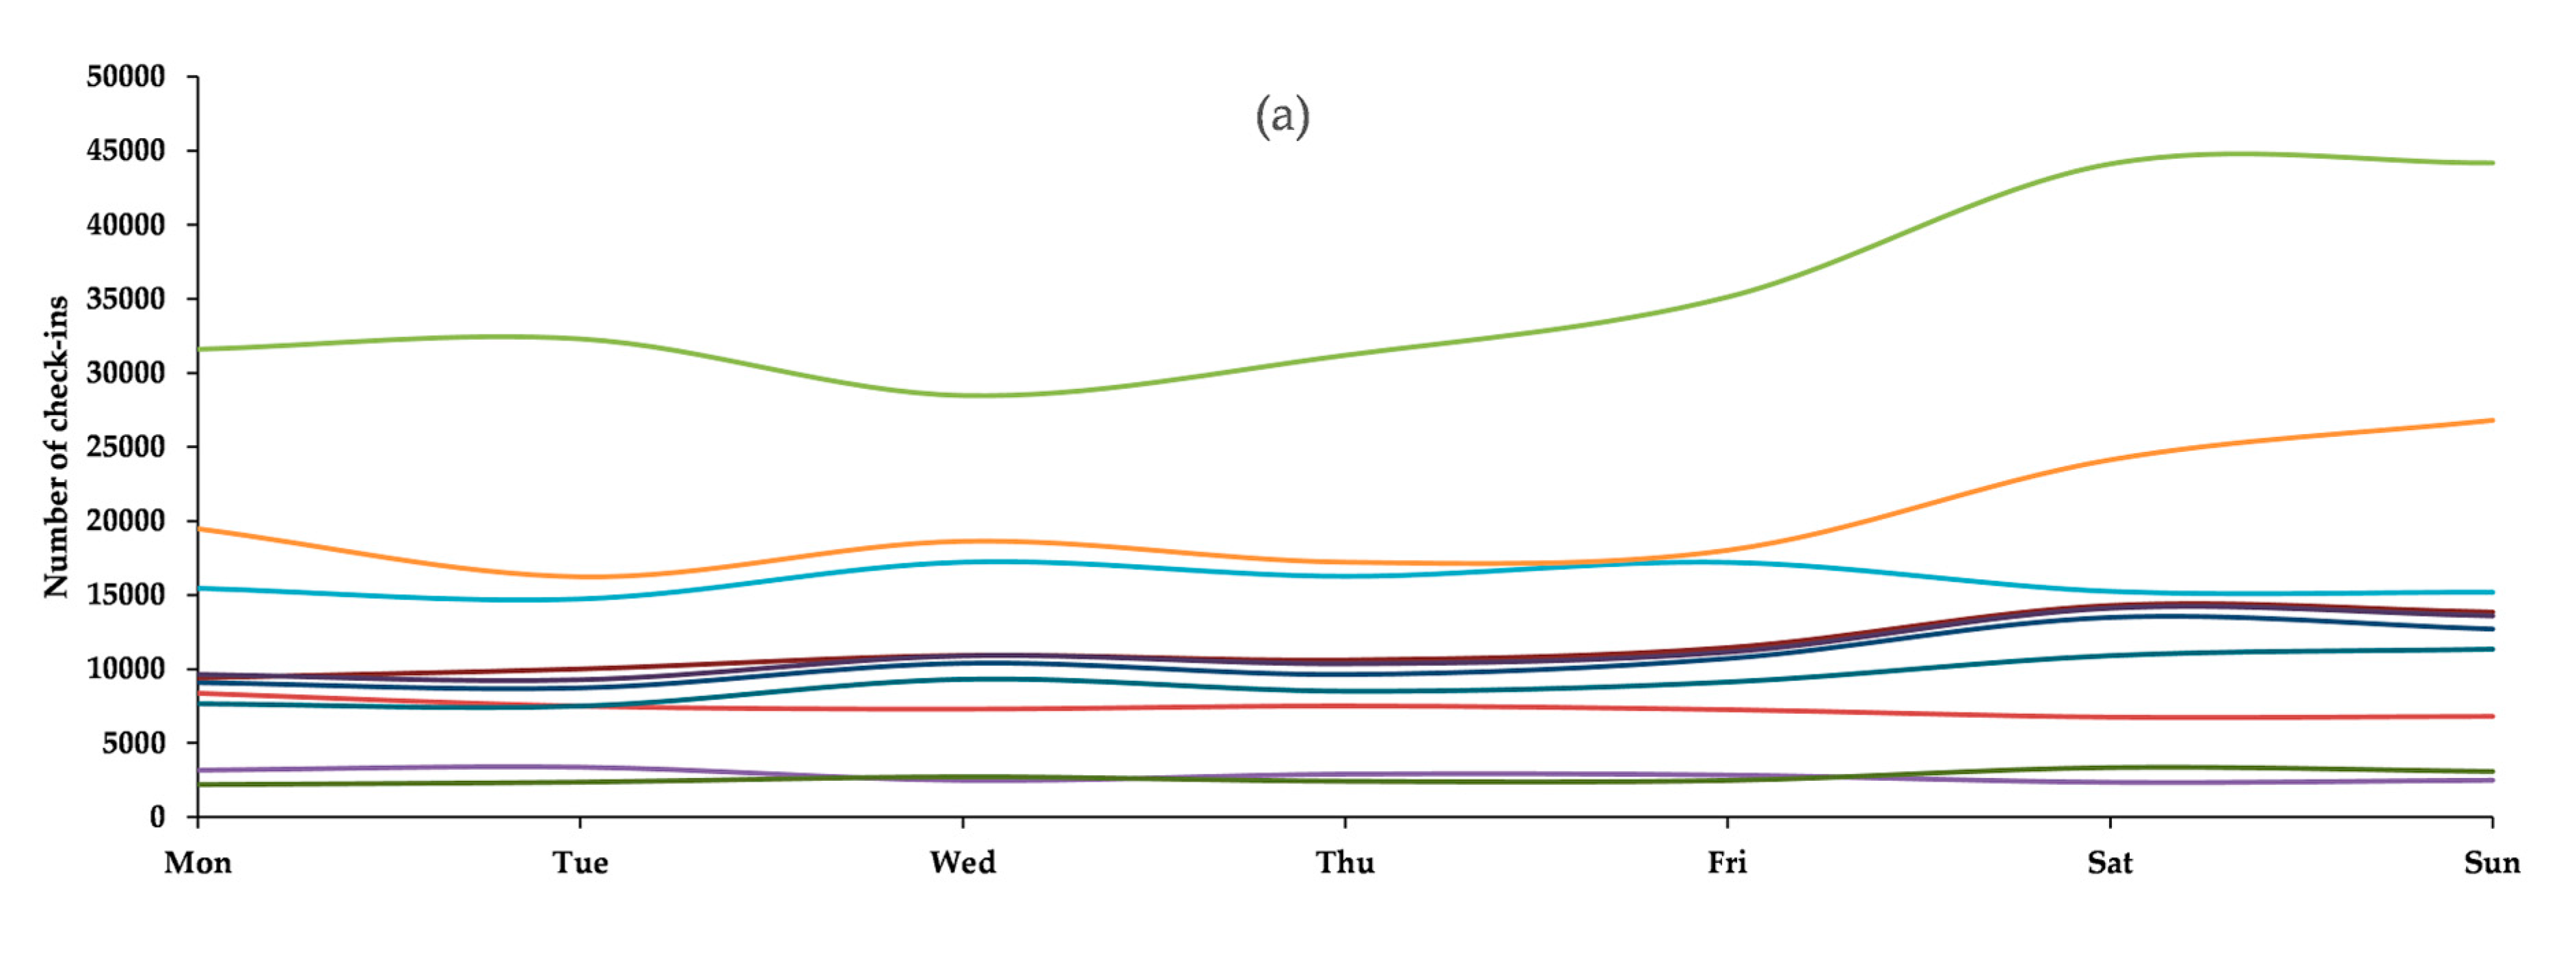
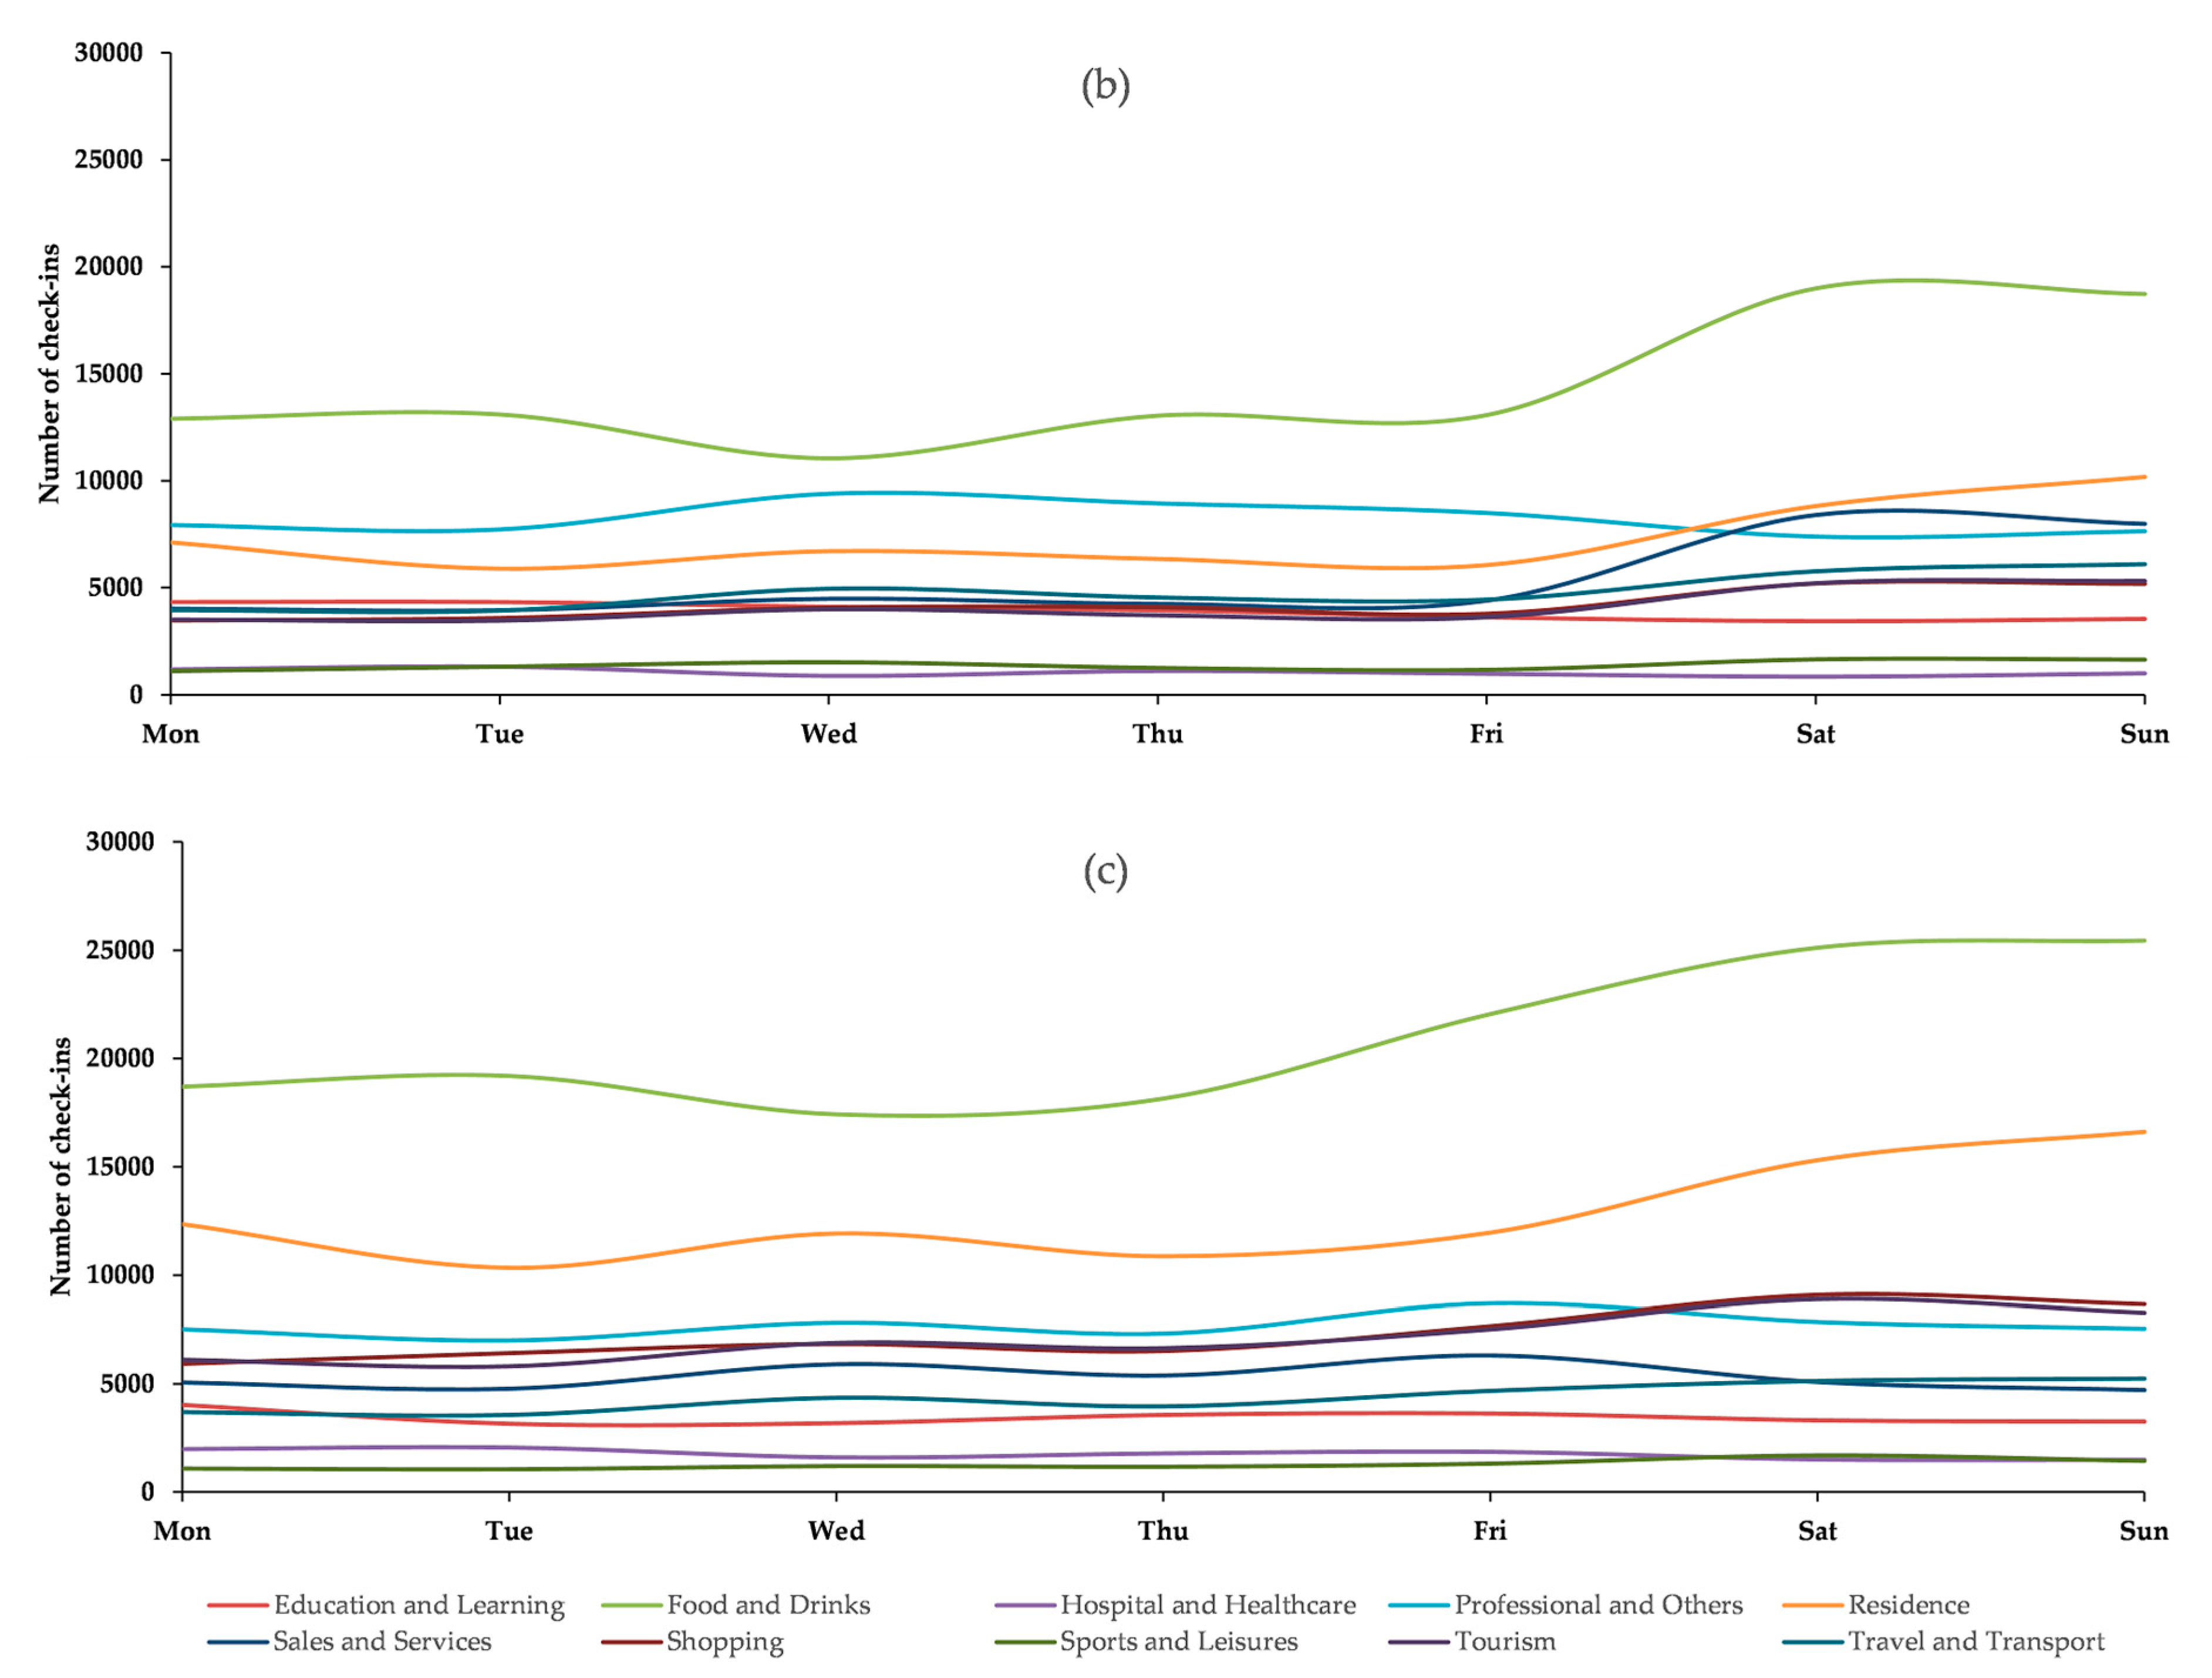
Figure 8a depicts the weekly activities trends. The trend for Food and Drink and Residence started increasing on Fridays and continued until Sunday, whereas the trend for Professional started to decline from Friday and continued to decrease until Sunday. However, Figure 8b,c present the sex-based weekly activities trend, where male users’ activities trends for Food and Drink, Residence, and Sales and Services were consistent during weekdays but tended to rise during the weekend, but the trend for Professional and Others tended to decline during the weekends. However, for female users, the activities trends for Food and Drink, Residence, Shopping, and Tourism rose during the weekends compared to weekdays.
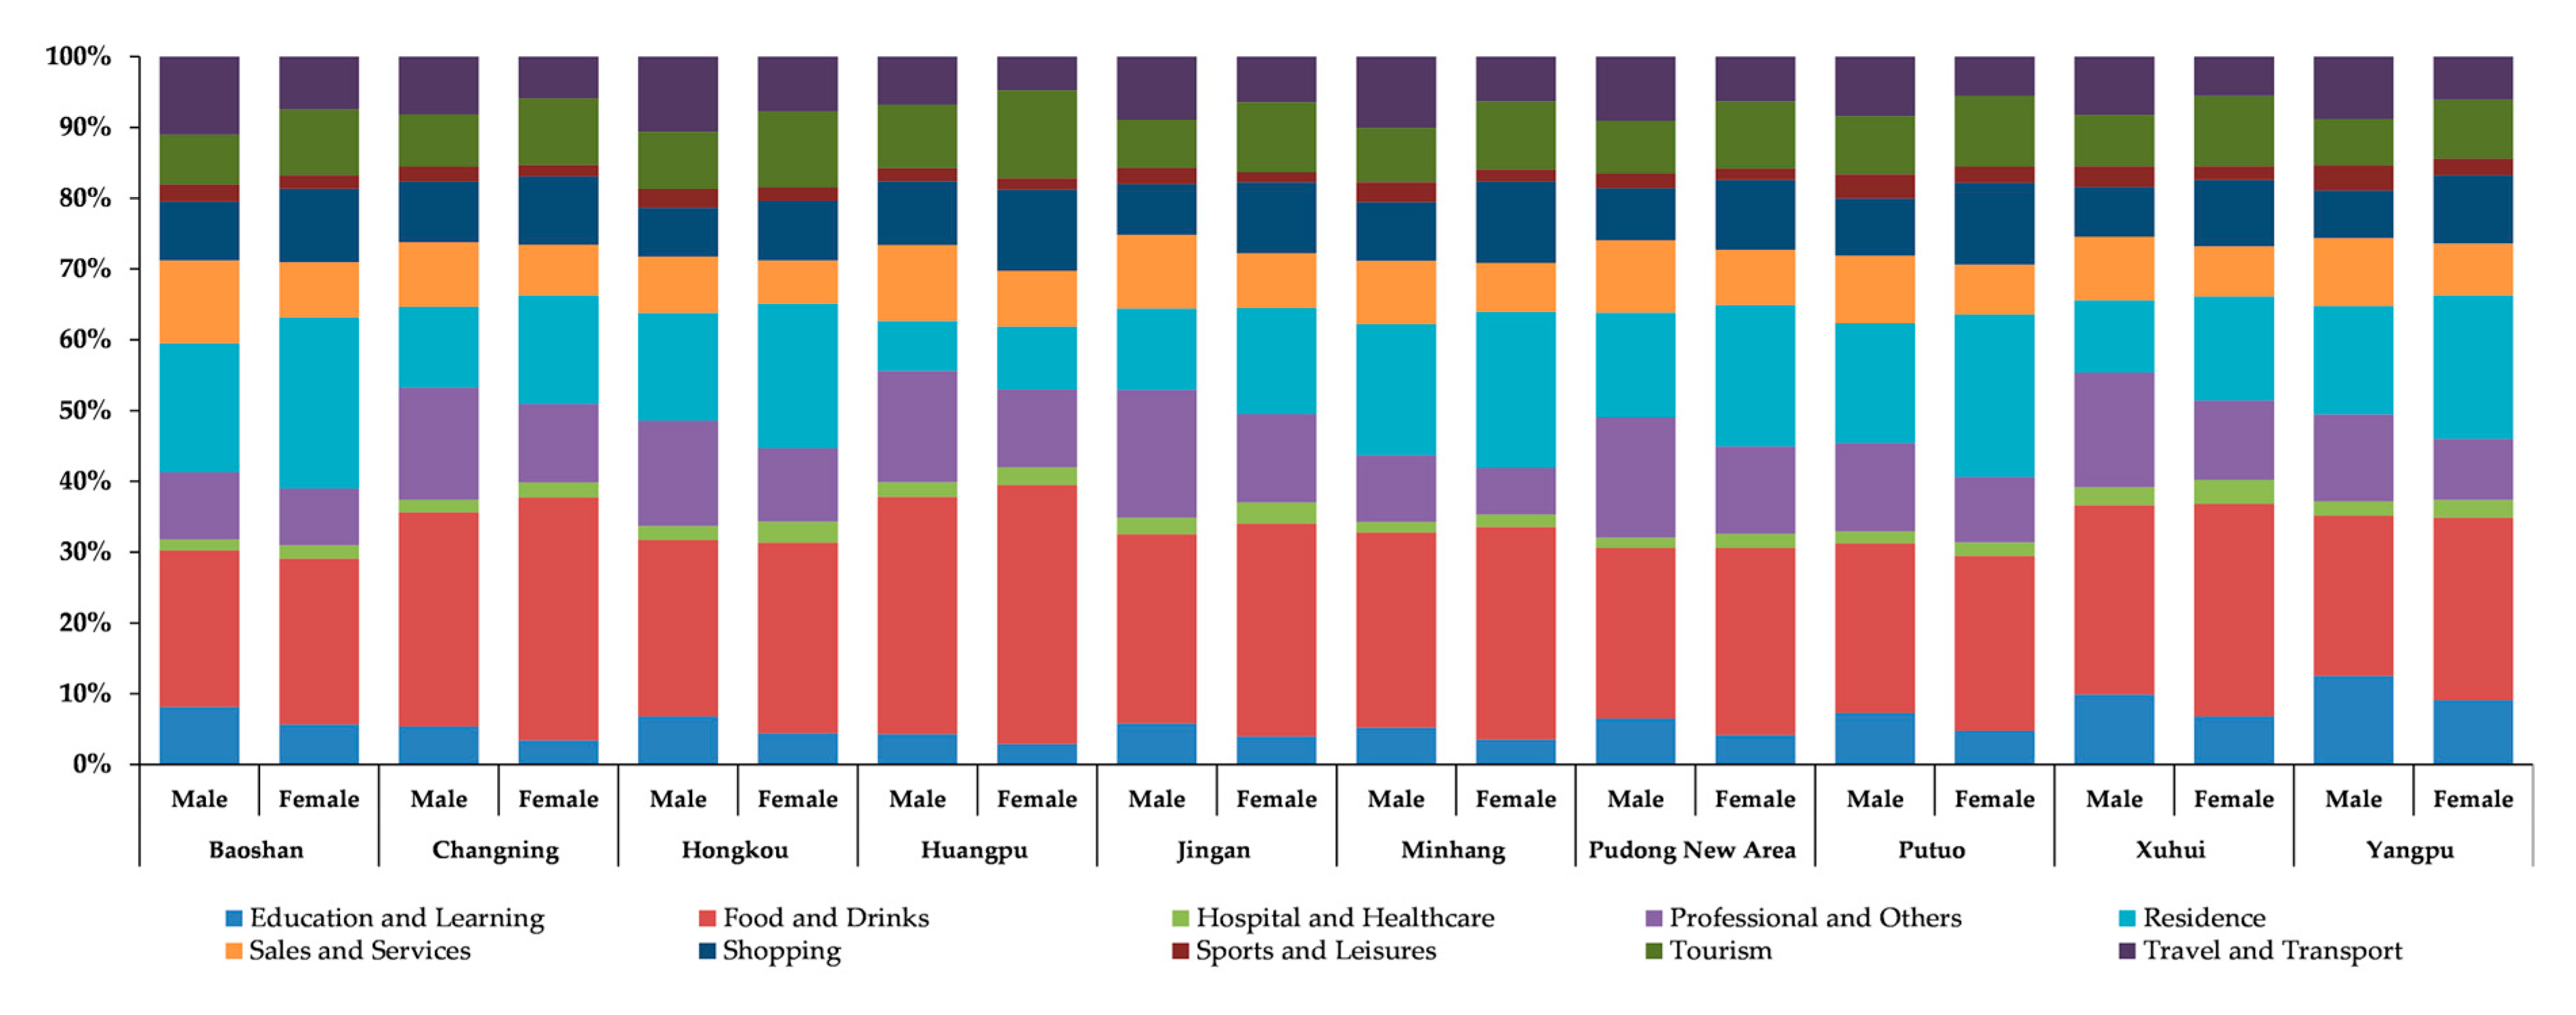
Figure 9 presents the district activities distribution by men and women in Shanghai, where check-in distribution of Professional and Others was relatively high in the city center districts. The check-in distribution of Food and Drink was high in Changning and Huangpu districts compared to the other districts. Suburban districts (Baoshan and Minhang) had a high distribution of check-ins related to Food and Drink and Residence compared to the city center districts. Noticeable differences based on sex were observed in the Pudong New Area district.
In Shanghai, to observe the activities based on the check-in trend, we measured the sex-based temporal trend of activities. In Figure 10a–c, increasing activities trends can be observed from 05:30 to 09:30 and 13:00 to 22:30, especially for Food and Drink, Residence, and Professional and Others. However, in Figure 10a,b, a decreasing activities trend is observed for Professional and Others after 20:00. An increasing activities trend can be observed for male and female users related to activities Food and Drink and Residence after 15:00.
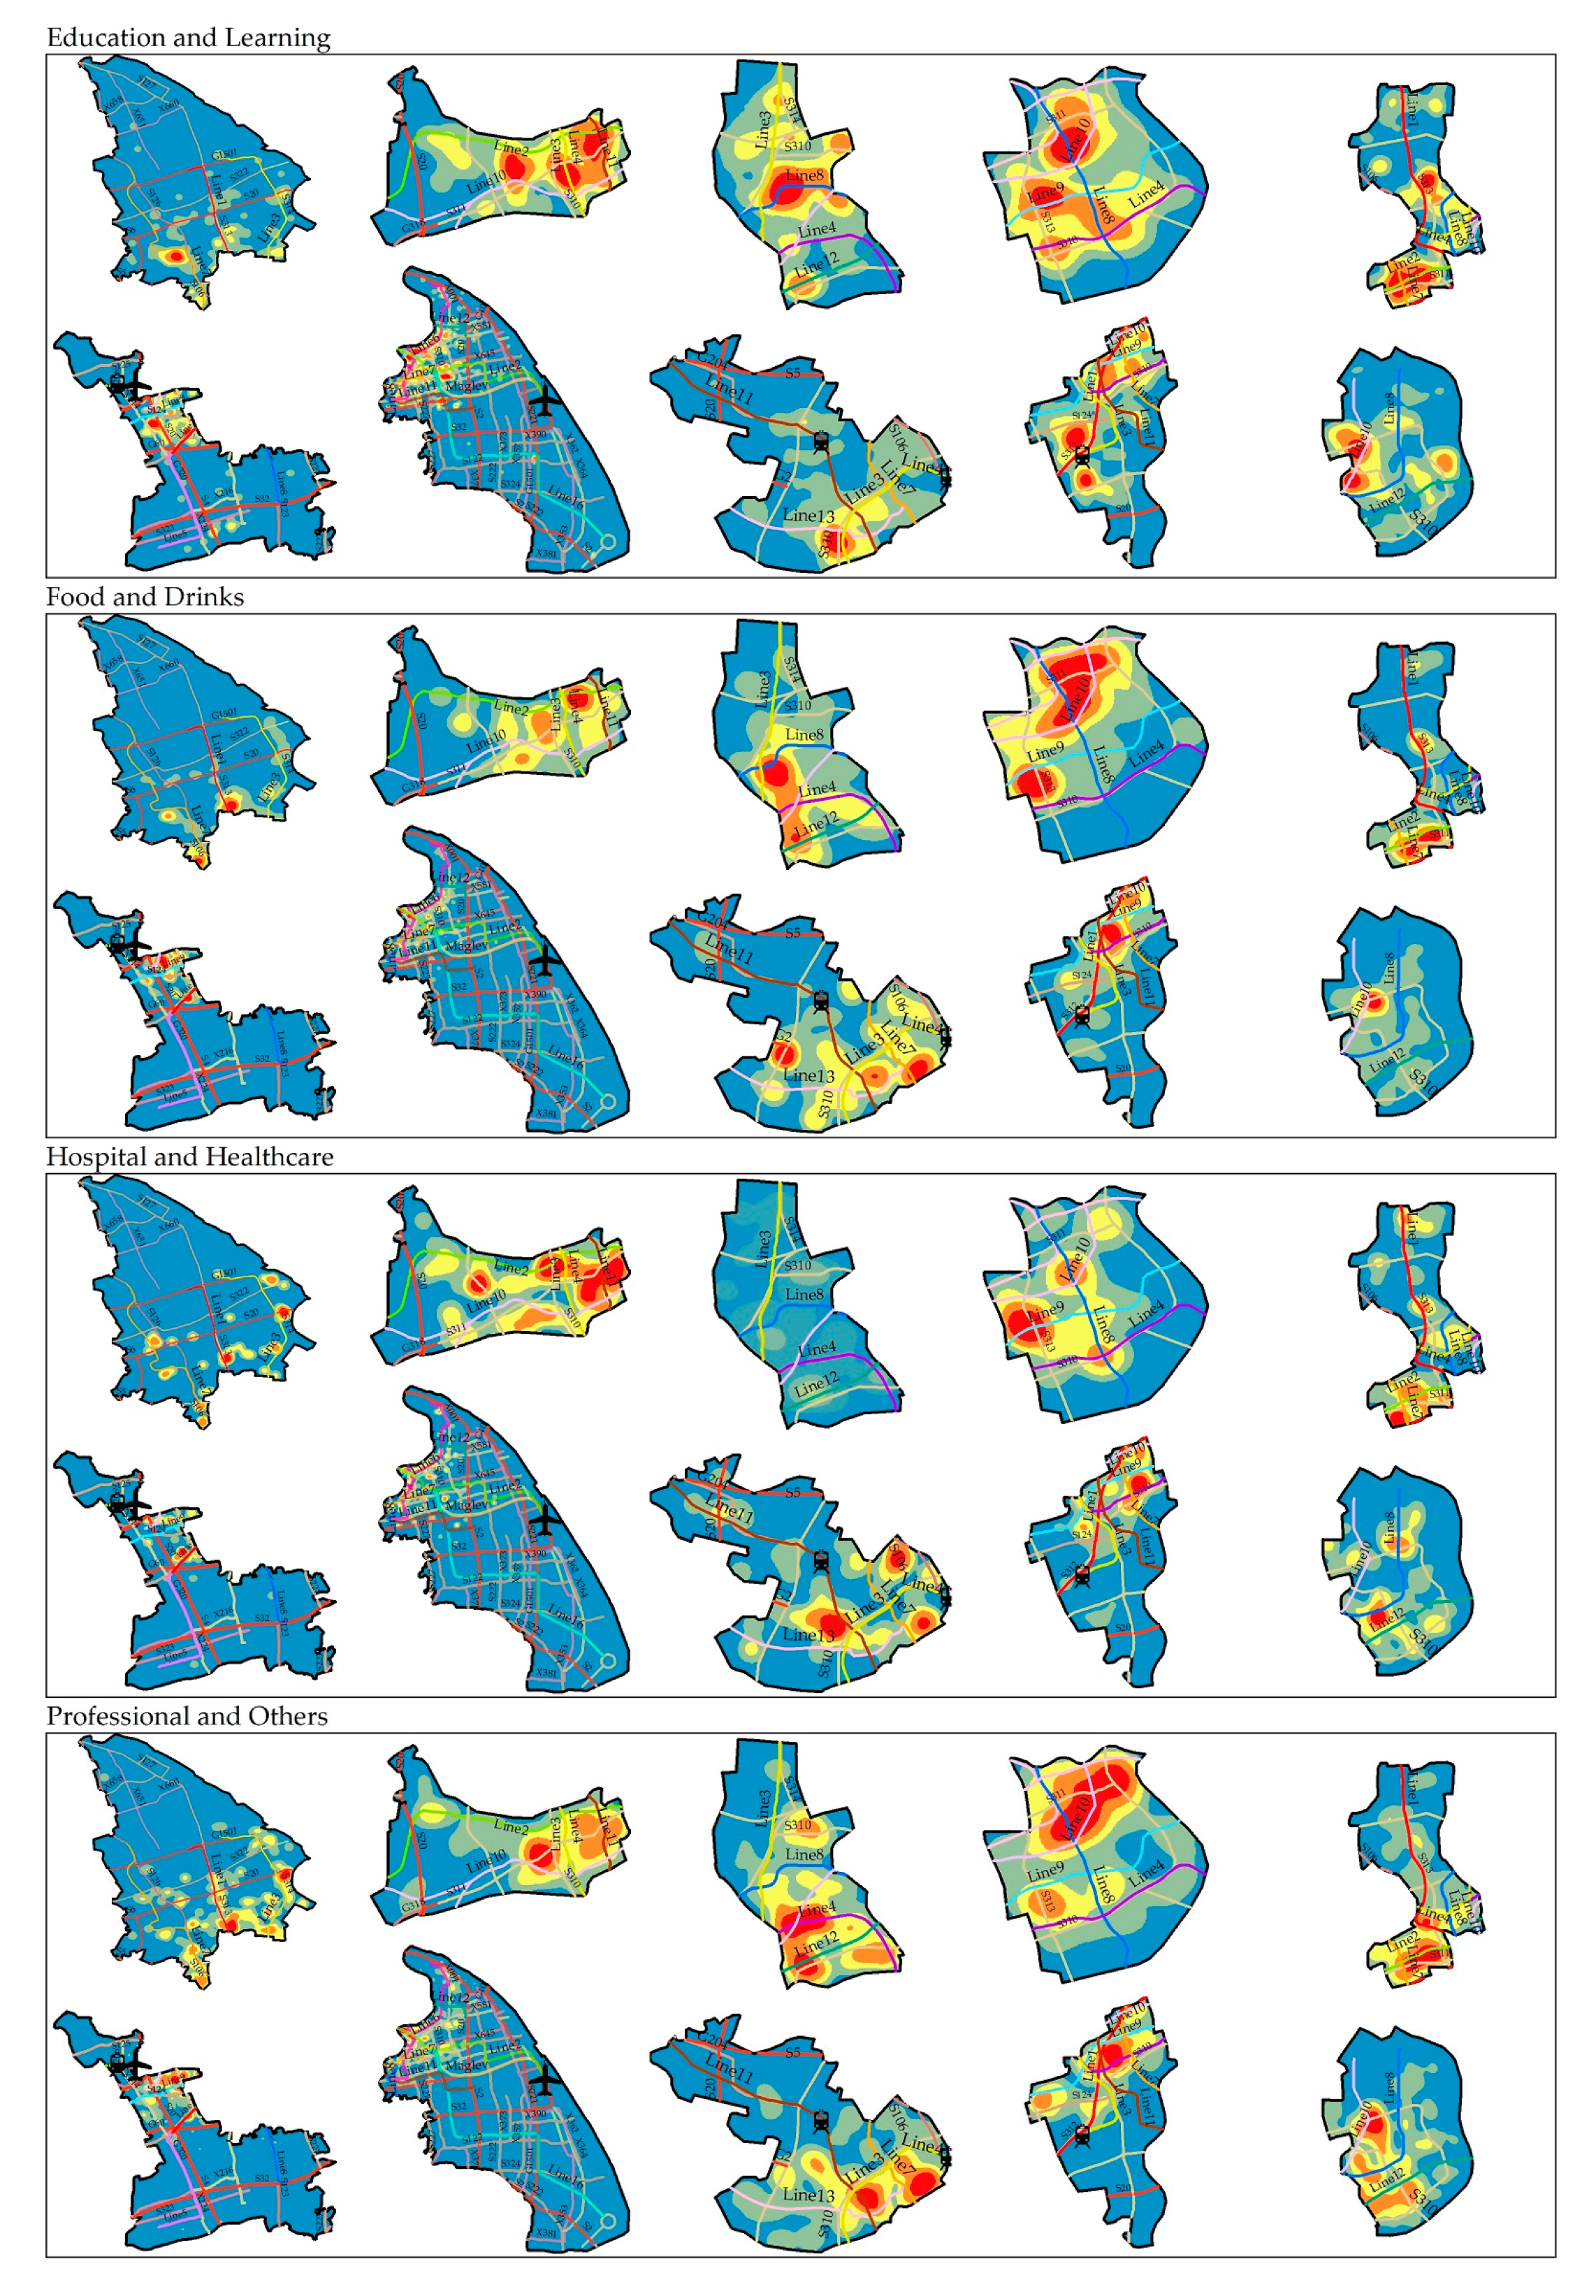
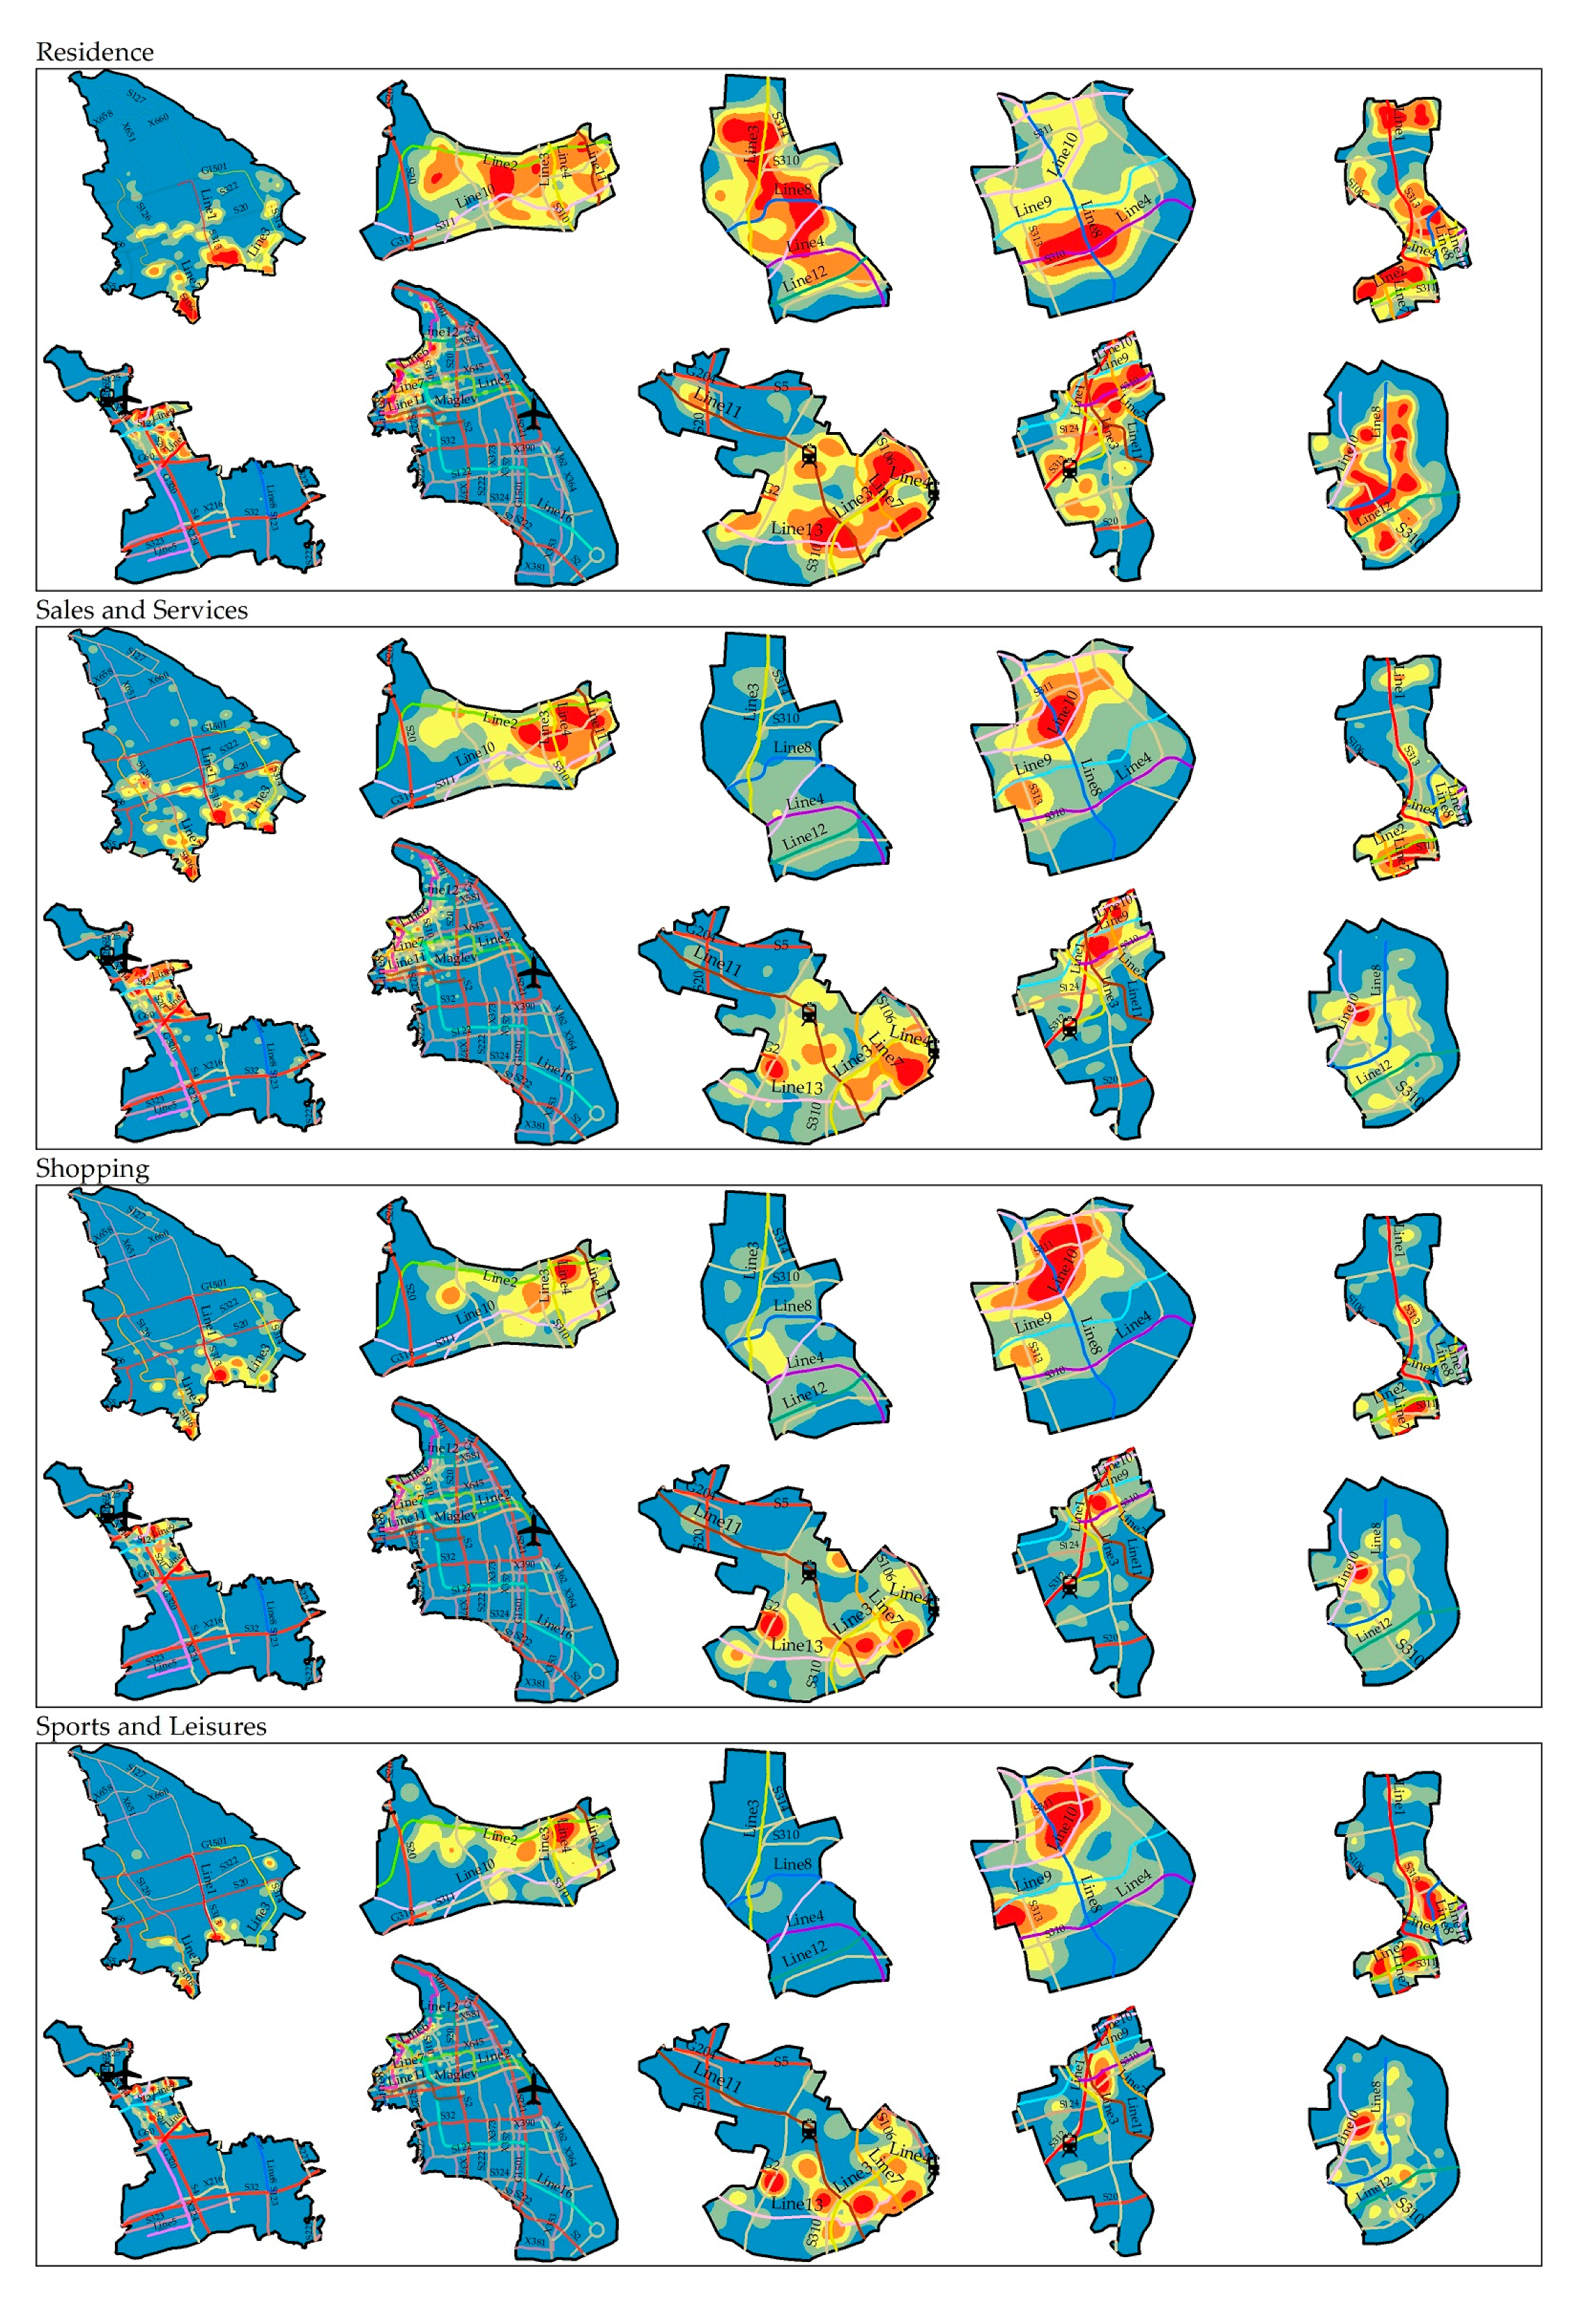
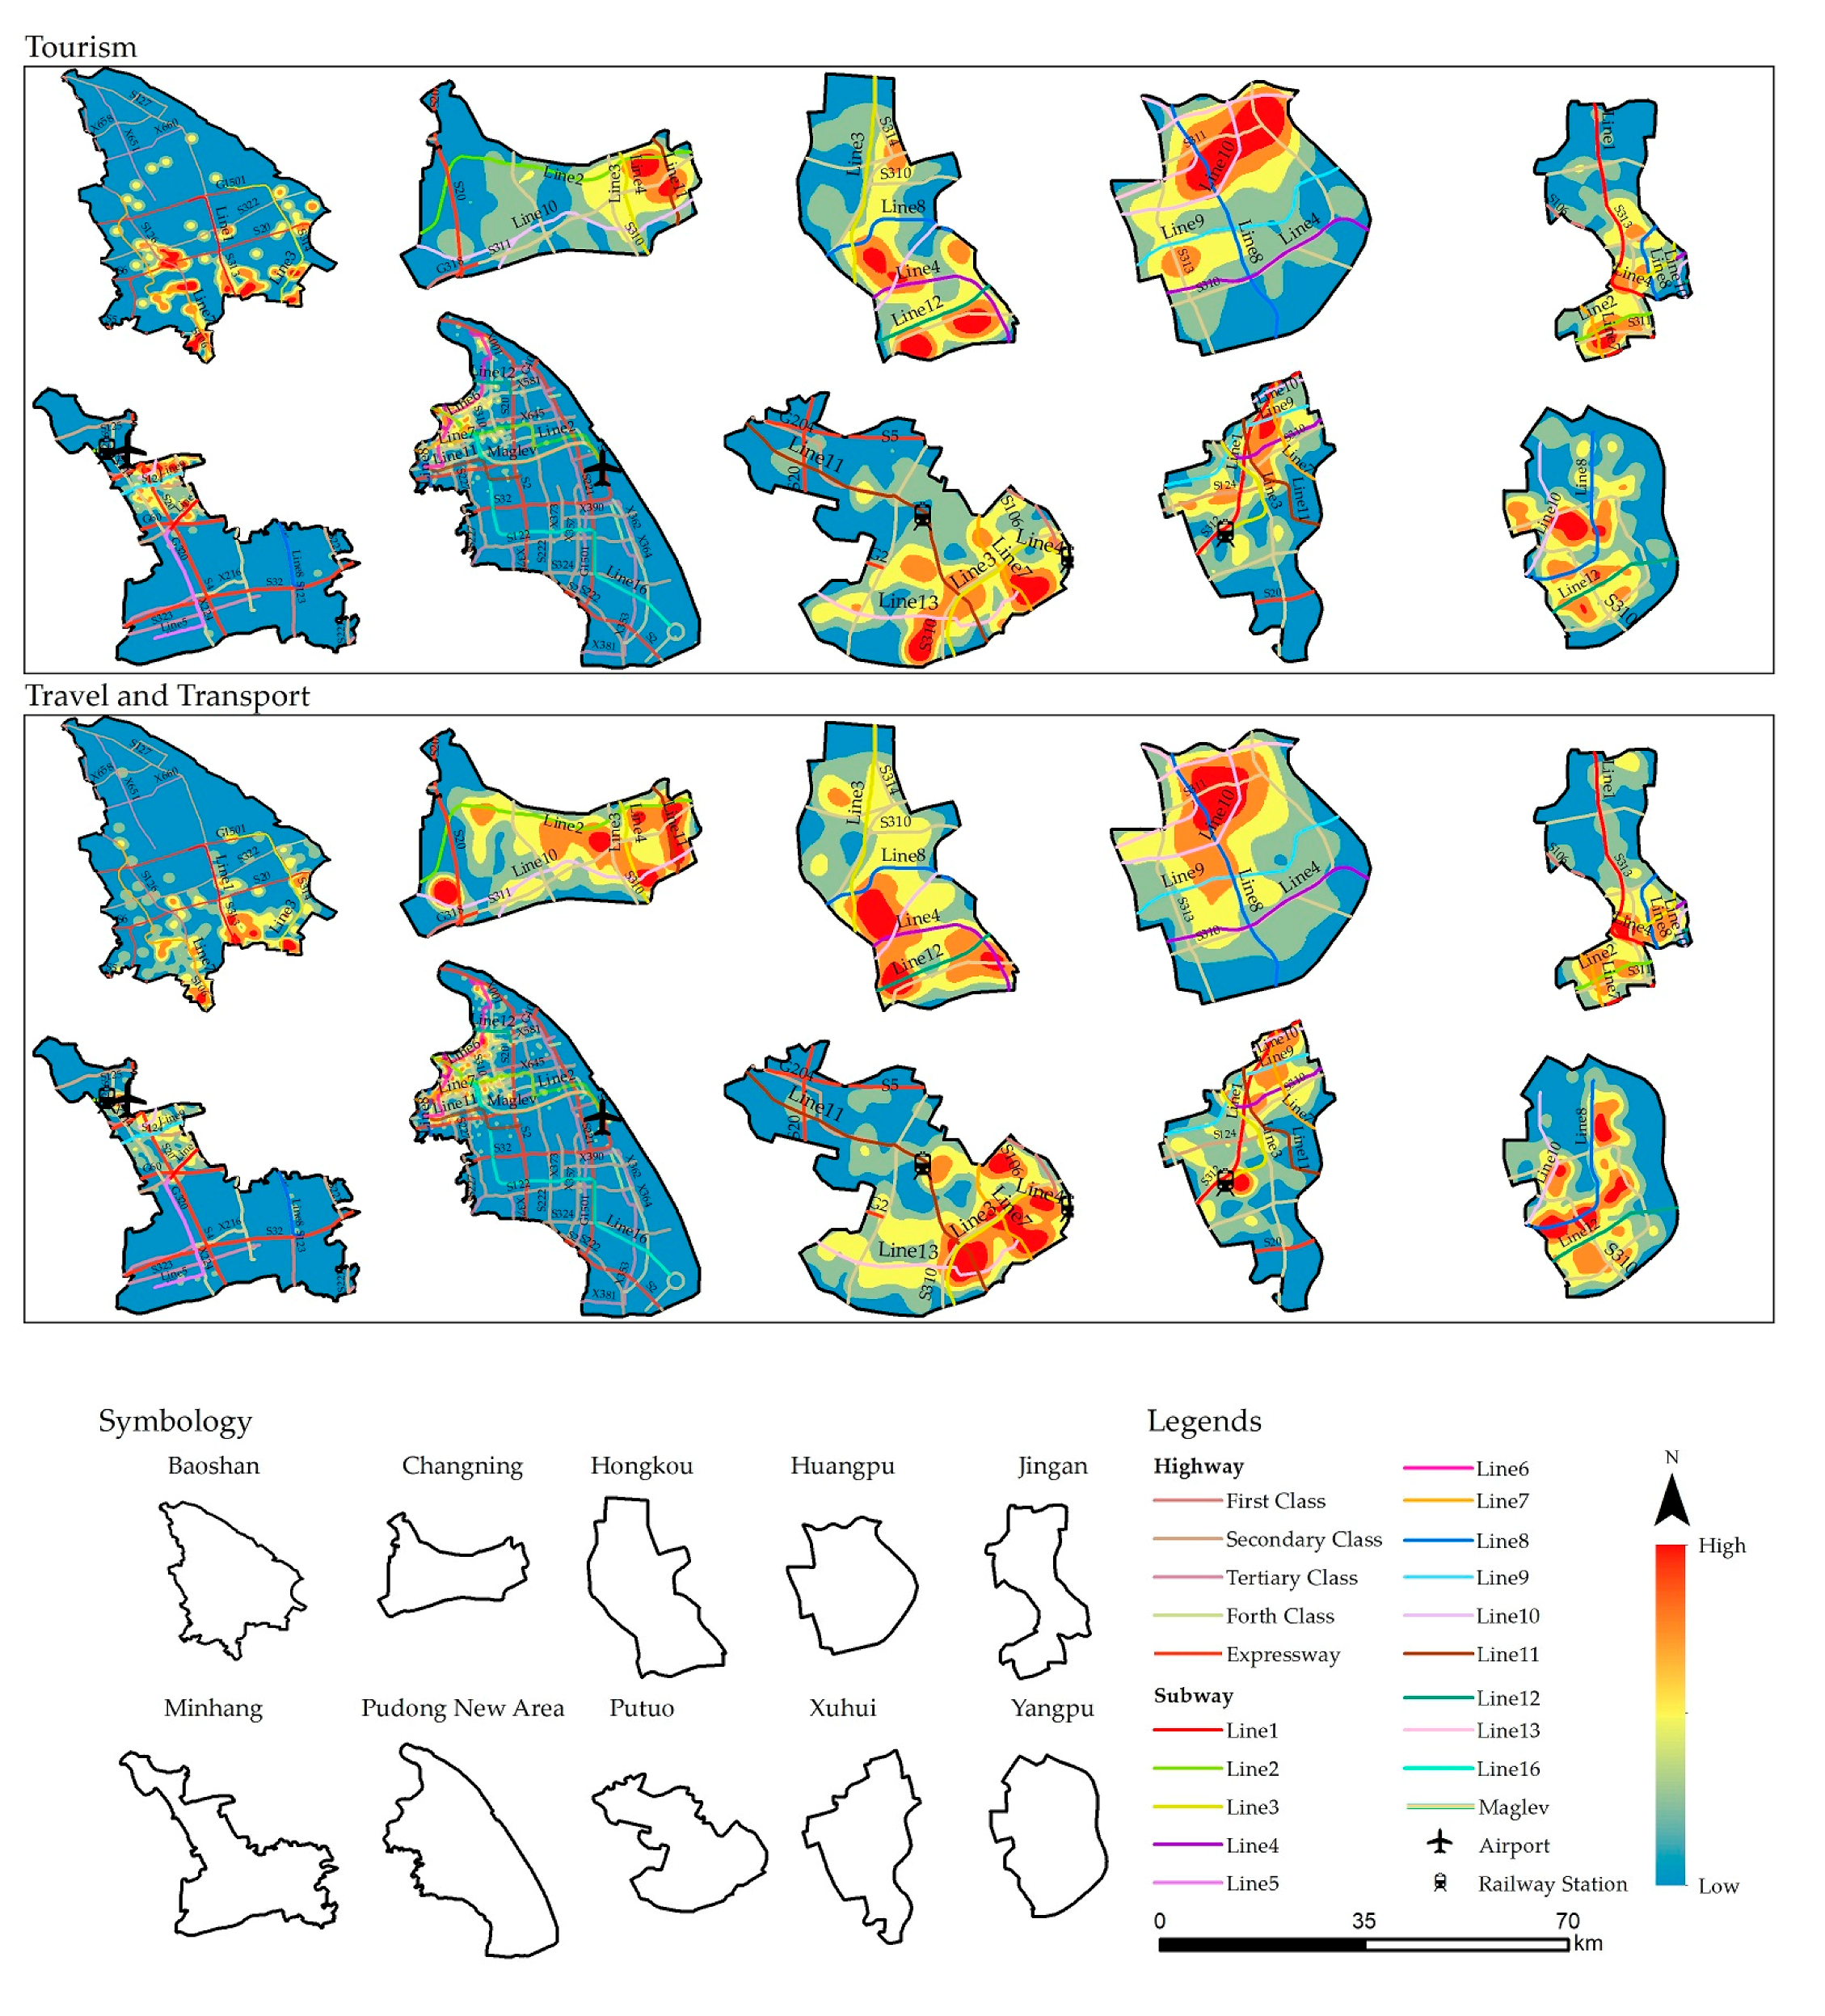
Figure 11 reveals the kernel densities of check-ins related to activities in the districts of Shanghai, where the suburban districts (Baoshan and Minhang) had a high distribution of check-ins associated with Food and Drink and Residence compared to the city center districts, supporting the results of Figure 9.
Finally, the results of LBSN data in the current section showed that the city center has a relatively high density variation of activities compared to suburban districts. However, a high density variation of activities related to Food and Drink and Residence was observed in suburban districts (Baoshan and Minhang). A high density variation of activities was found near the district borders.

4.2. Spatial Regression Analysis

The GWR results for activities performed in Shanghai by men and women during weekdays and weekends are presented in Table 3. All selected variables were significant at the 1% level. The coefficient of determination (R2) values were 0.9993 and 0.9975, denoting that the selected variables can explain 99.9% and 99.7% of the variation in the check-in on weekdays and weekends, with optimal spatiotemporal bandwidths of 0.954 and 0.966 for weekdays and weekends, respectively. The variation trends of activities for men and women during weekdays varied due to a higher number of check-ins by the women compared to men (Figure 12). The variation trends of activities for men and women during the weekends are roughly the same due to the increased number of check-ins by the men as compared to weekdays.
Figure 12 shows the average spatial change tendencies of the parameter estimates for check-ins, which were pivotal and focus factors in this study. We also manually set zero as a threshold to distinguish between the positive and negative effects of the general tendencies and nuances of check-ins by men and women. The impact of check-ins by the women in Shanghai was mostly higher than 0.5 Standardised residual (StdResid) compared to men. The greater the StdResid, the higher the check-in frequency by women.
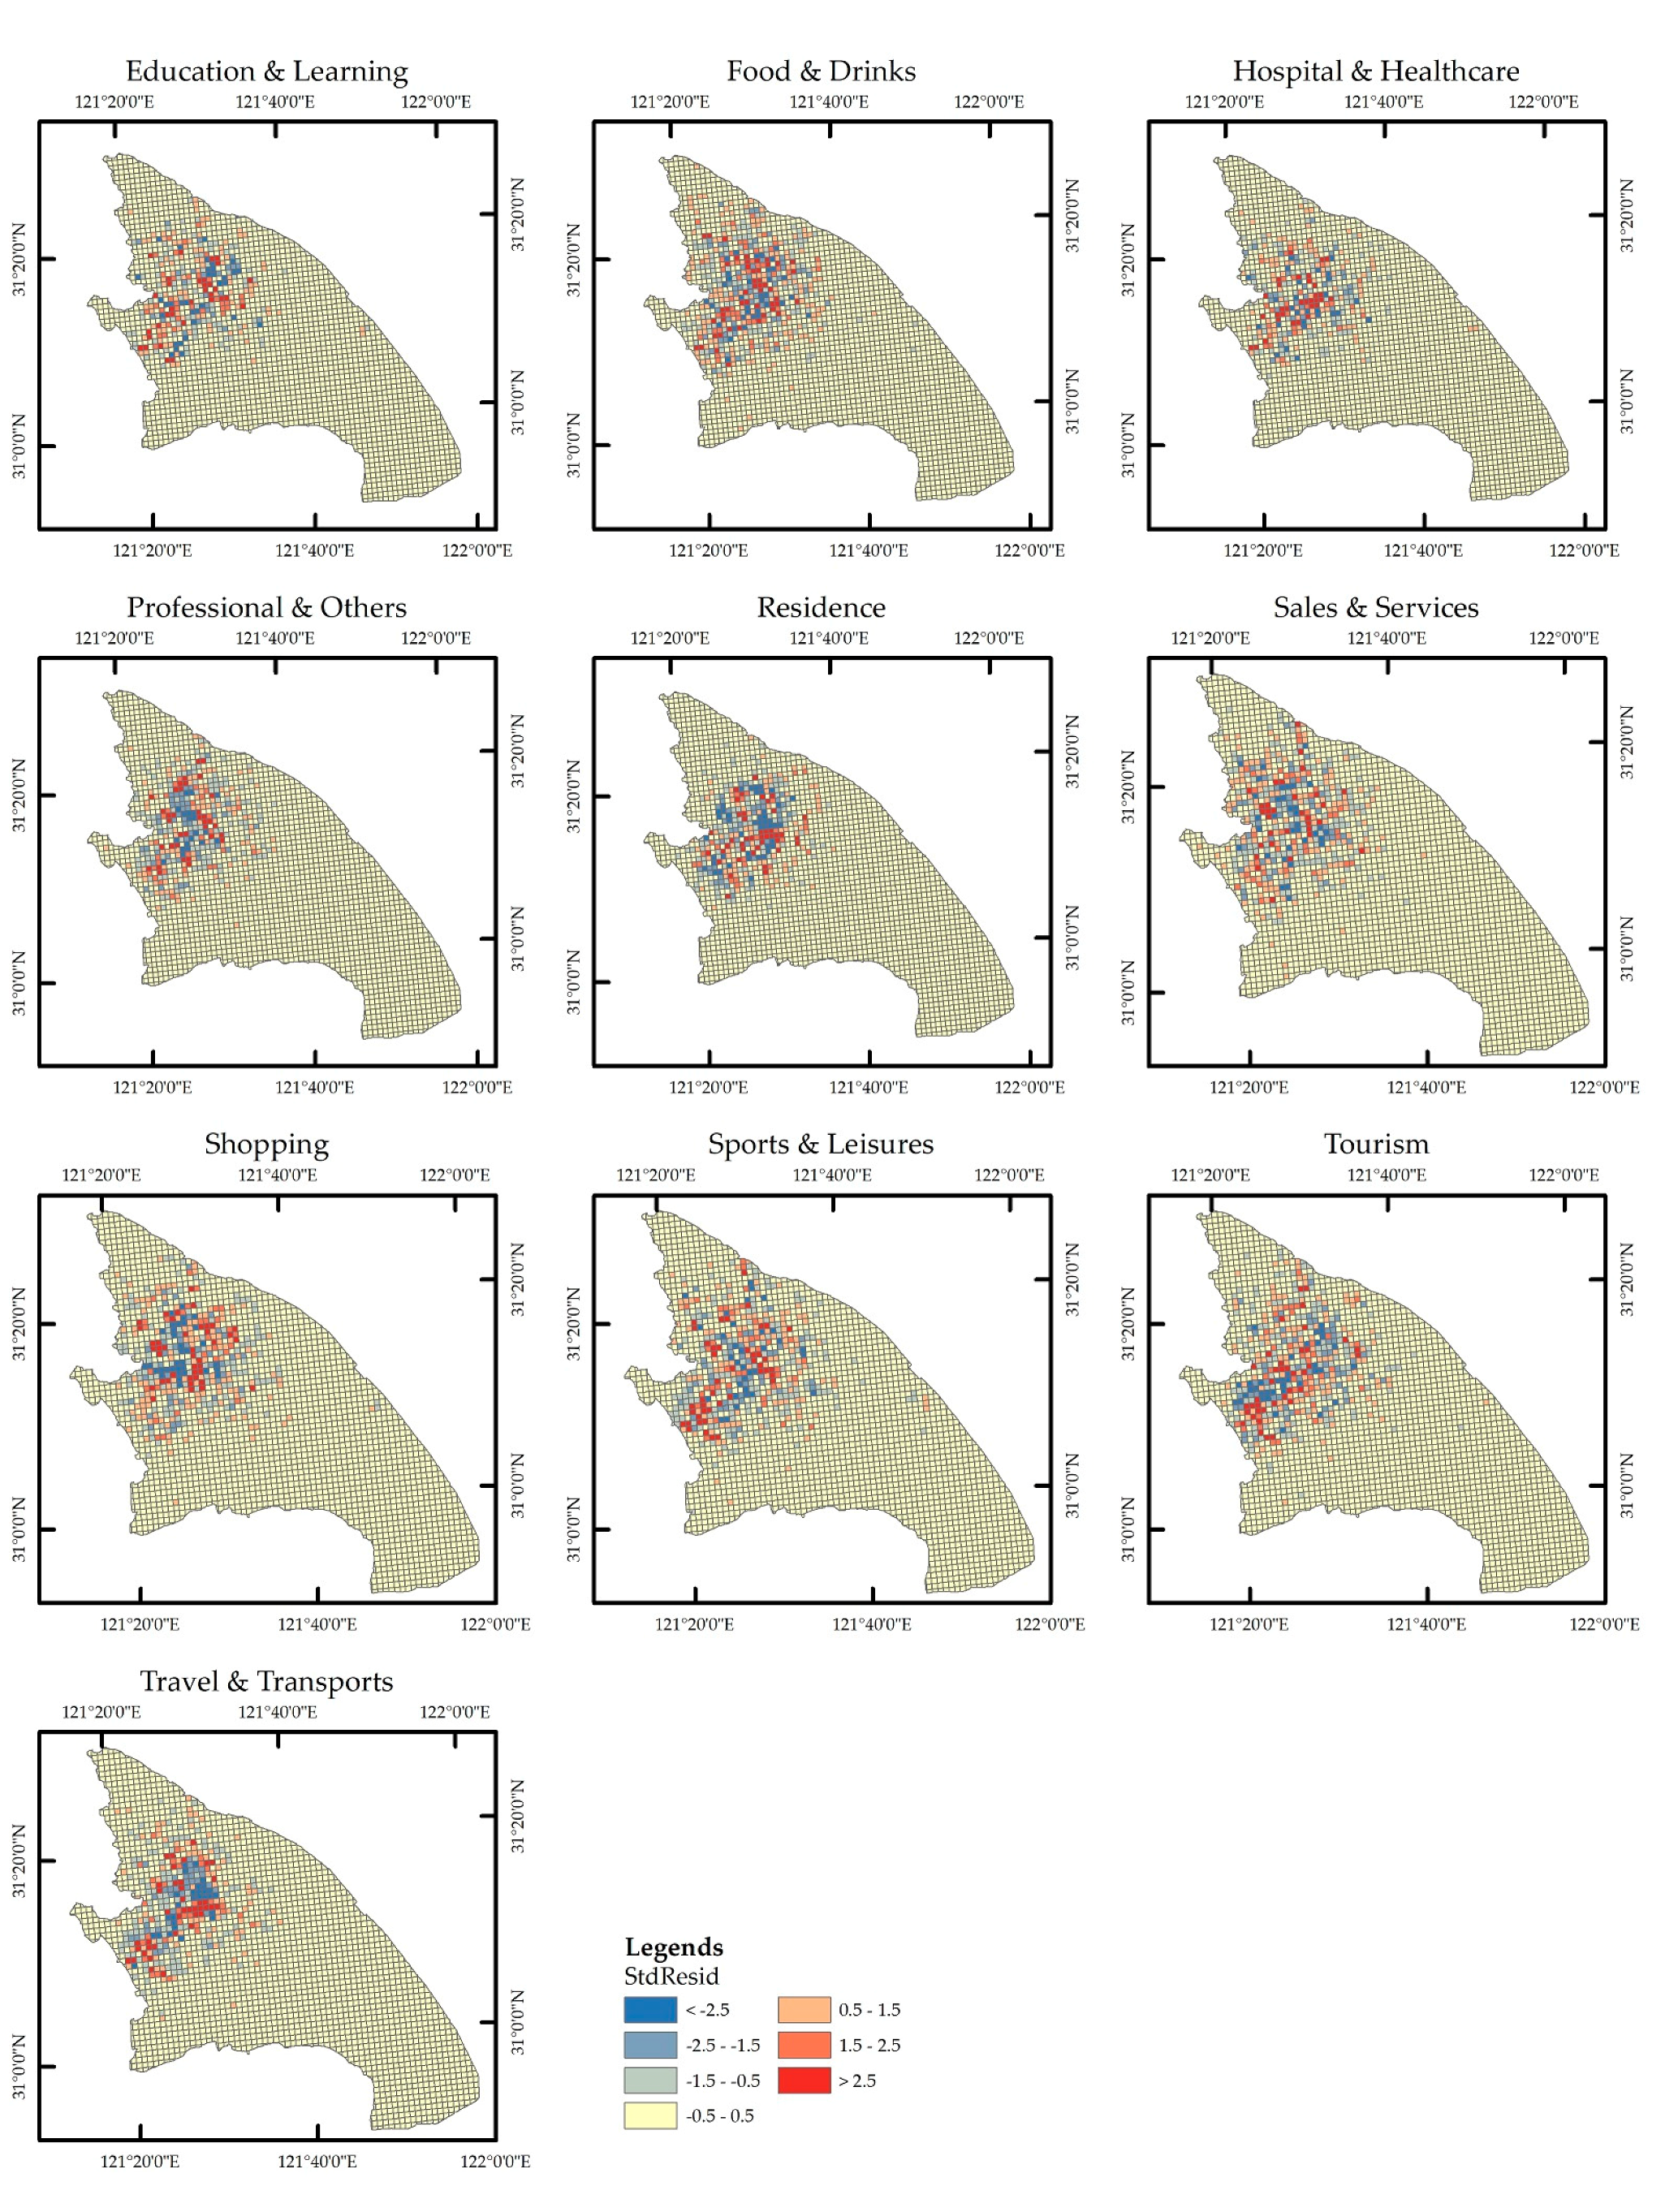
Table 4 presents the GWR results for activities performed in Shanghai by men and women. All selected variables were significant at the 1% level. The R2 values were 0.9950 and 0.9283, denoting that the selected variables explained 99.5% and 92.8% of the variation in the check-in for men and women in Shanghai, with optimal spatiotemporal bandwidths of 0.389 and 0.389, respectively. The variation trends of activities by men and women were quite different for most of the activities due to the higher number of check-ins by women in Shanghai.
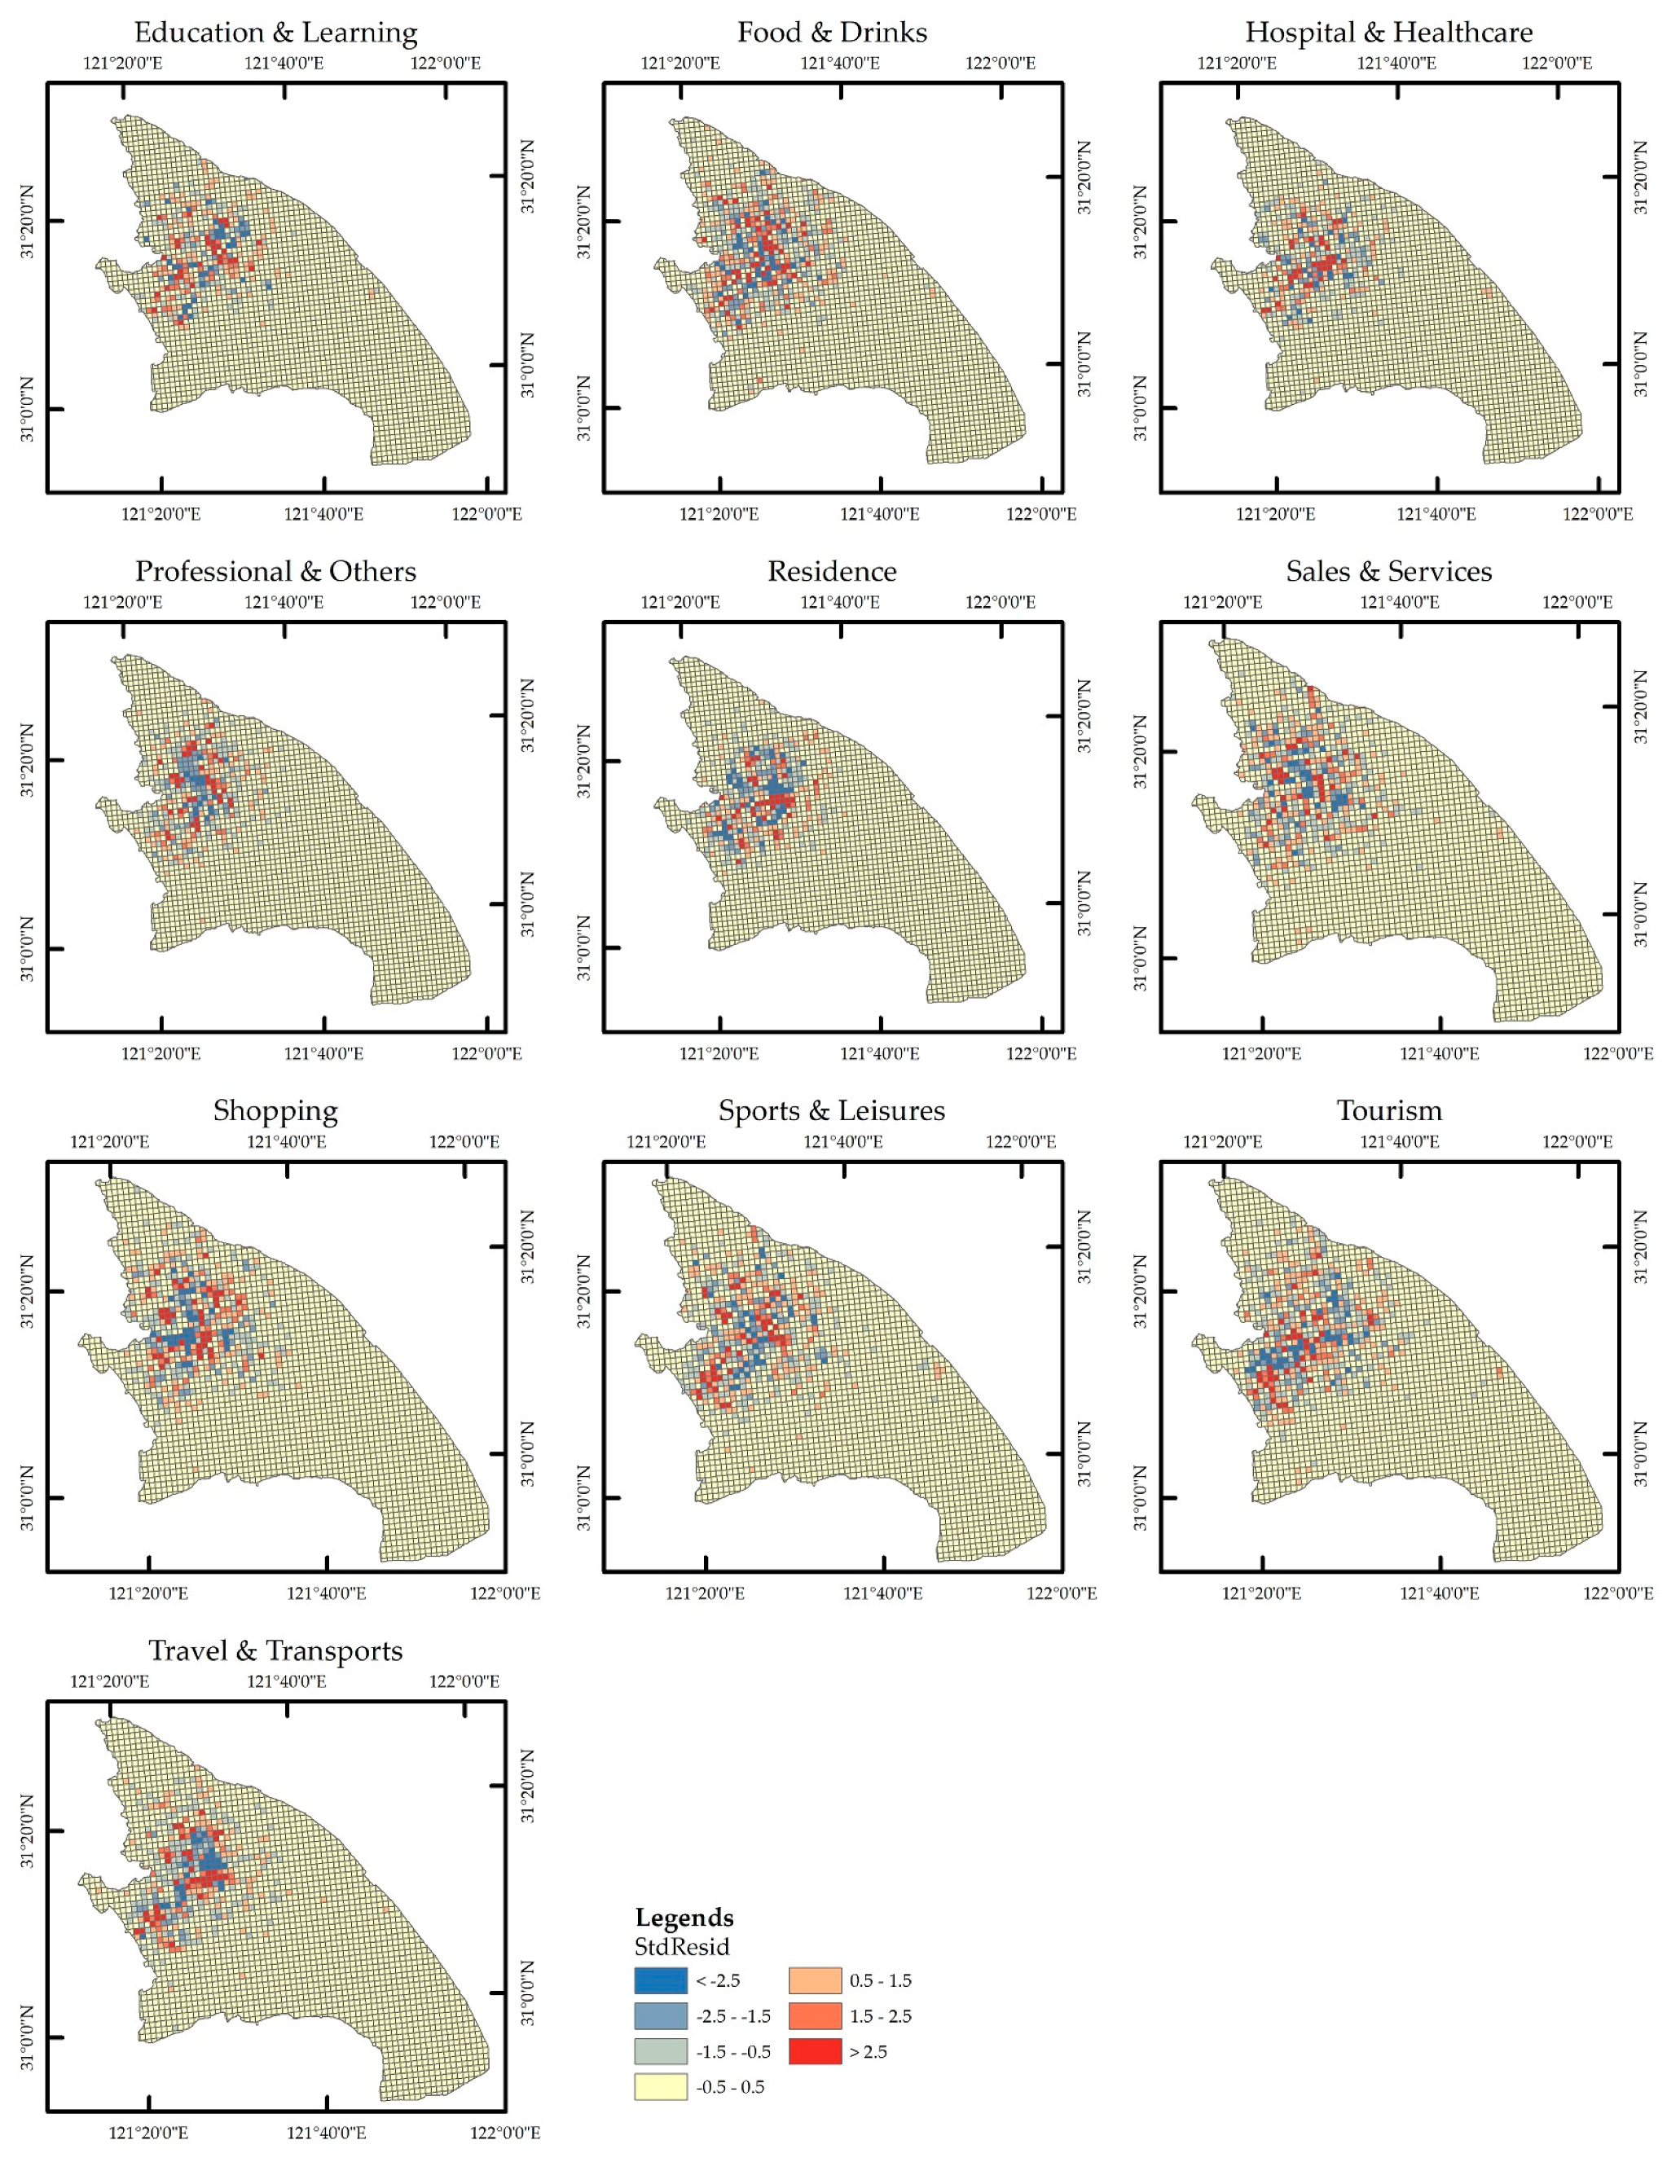
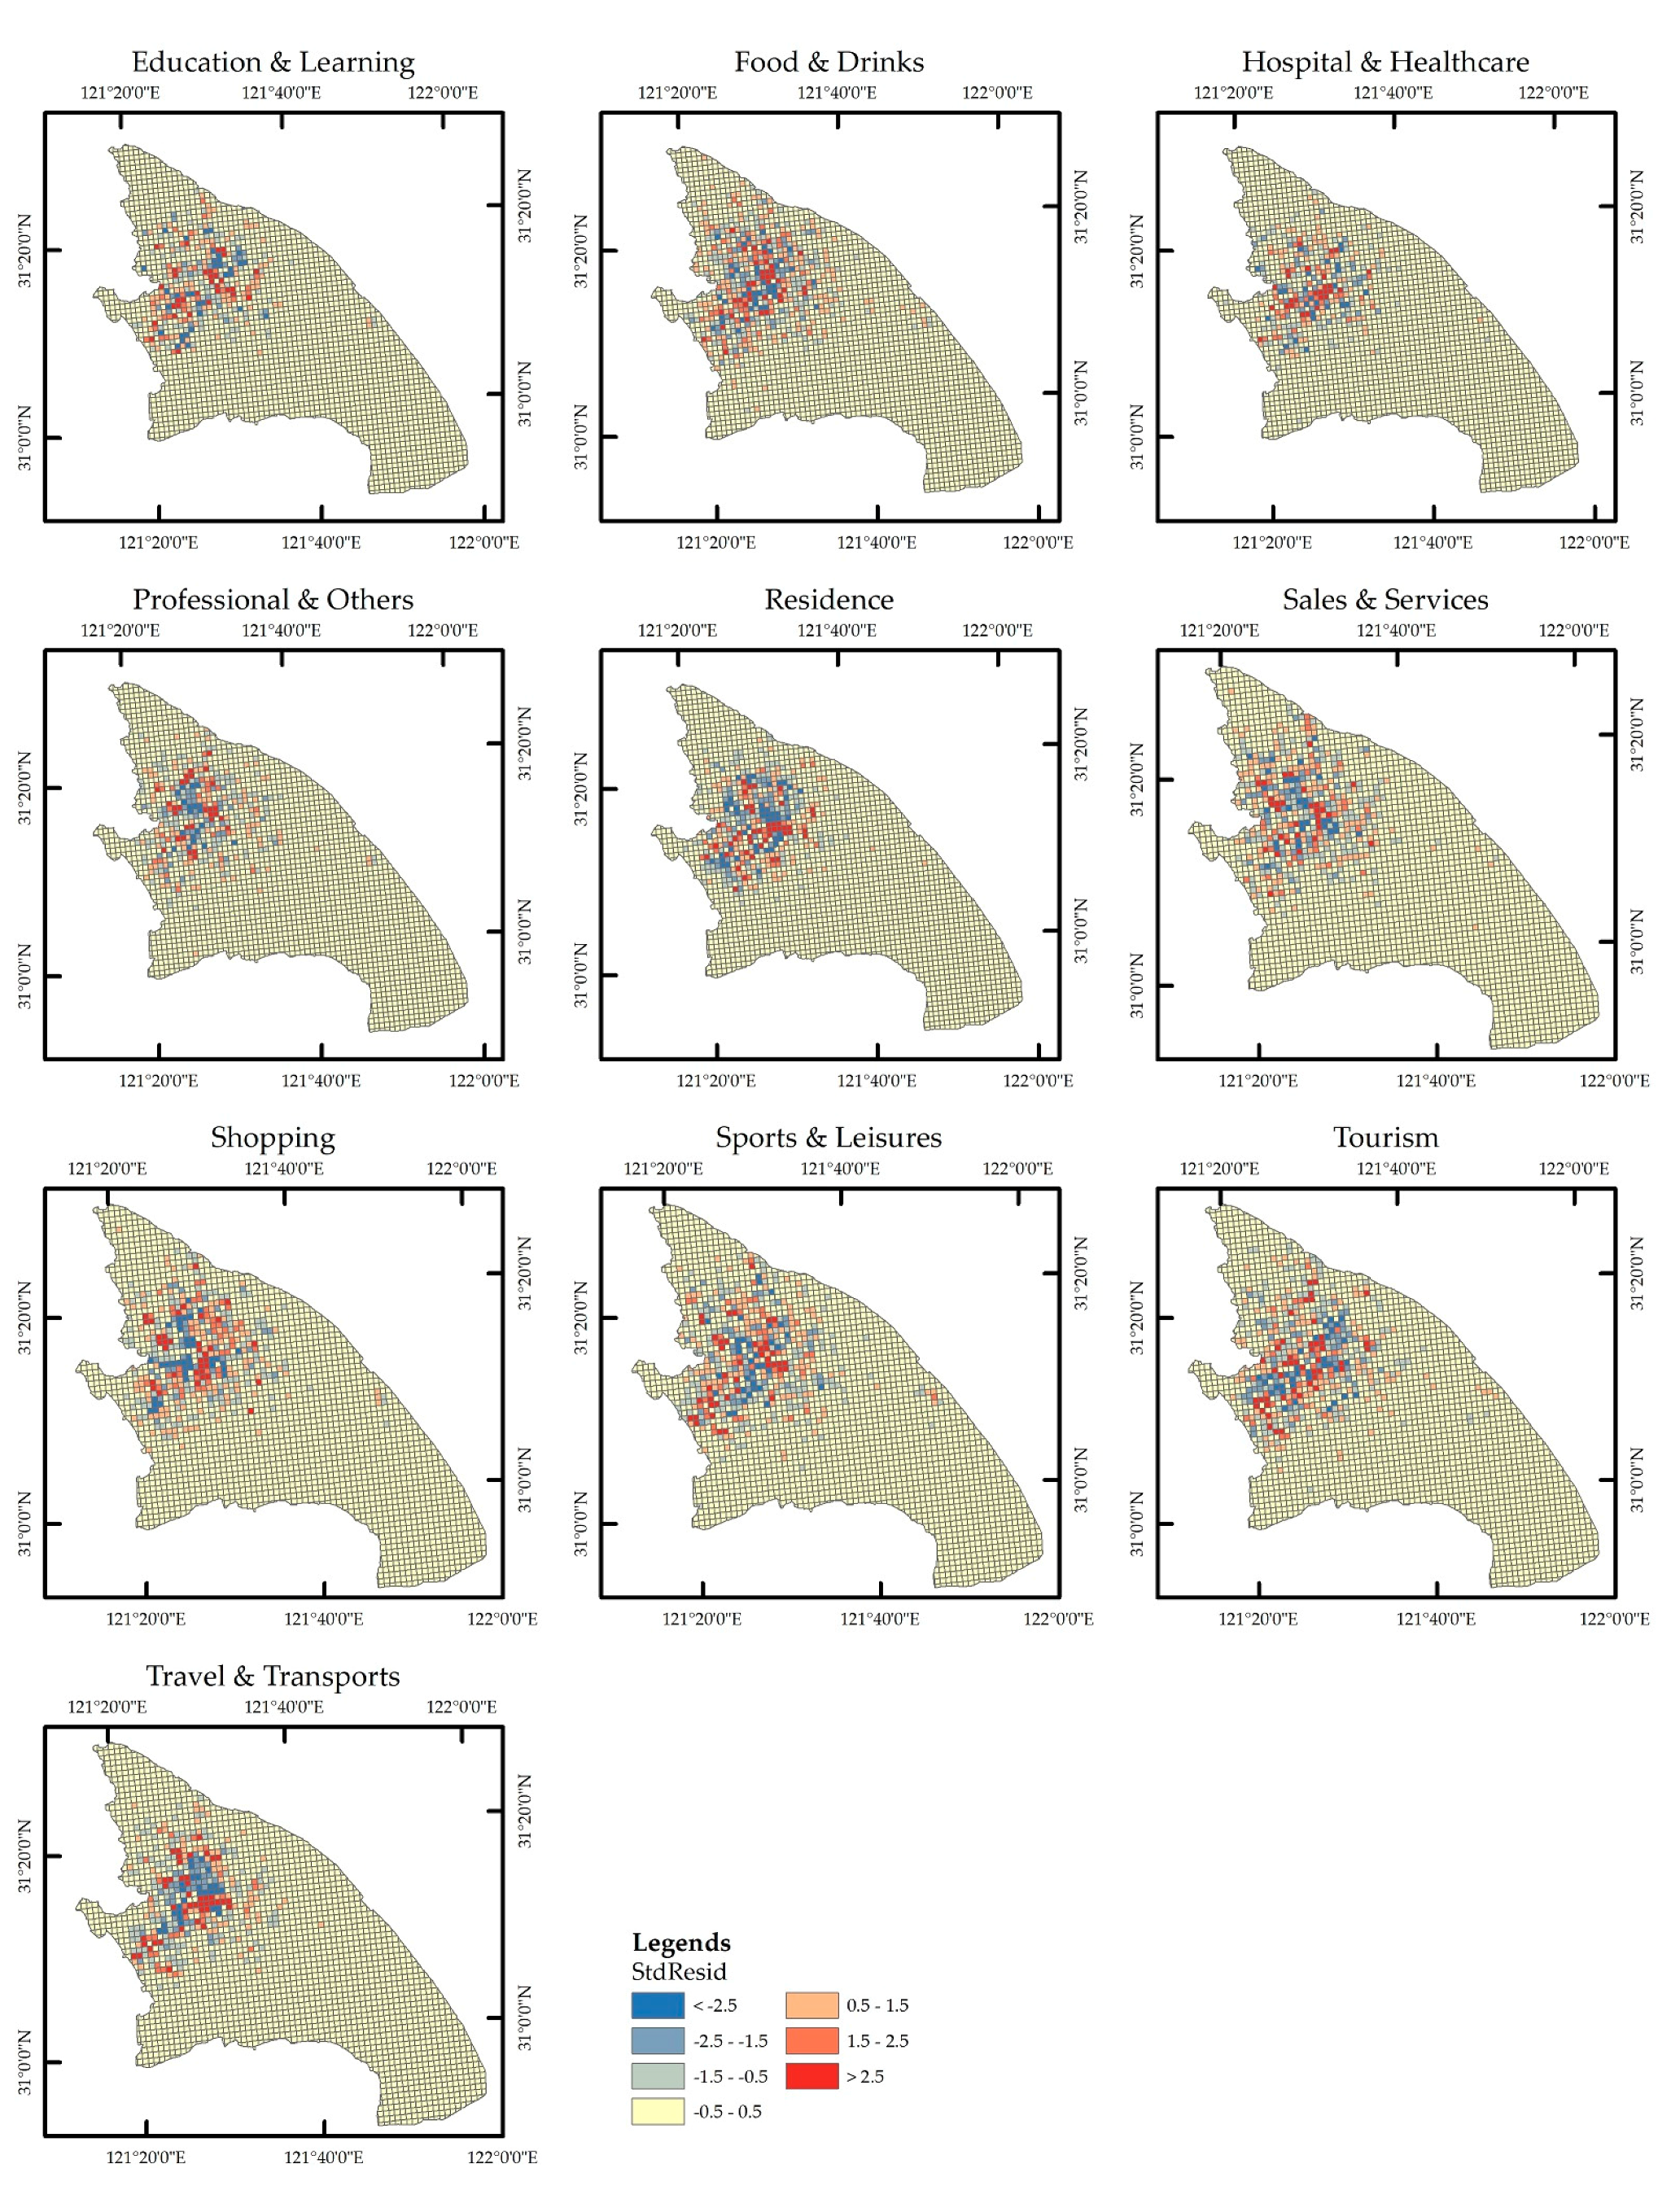
Figure 13 and Figure 14 show the average spatial change tendencies of the parameter estimates for check-ins by men and women. The effects of check-ins are mostly higher than 0.5 StdResid by women in Shanghai. However, the impact of check-ins by the women in Shanghai was mainly higher than 0.5 StdResid compared to men due to a high number of check-ins during weekdays. We also observed that the women’s check-ins were mostly scattered in Shanghai compared to men’s.
Table 5 presents the GWR results for activities performed in Shanghai during weekdays and weekends. All selected variables were significant at the 1% level. The 
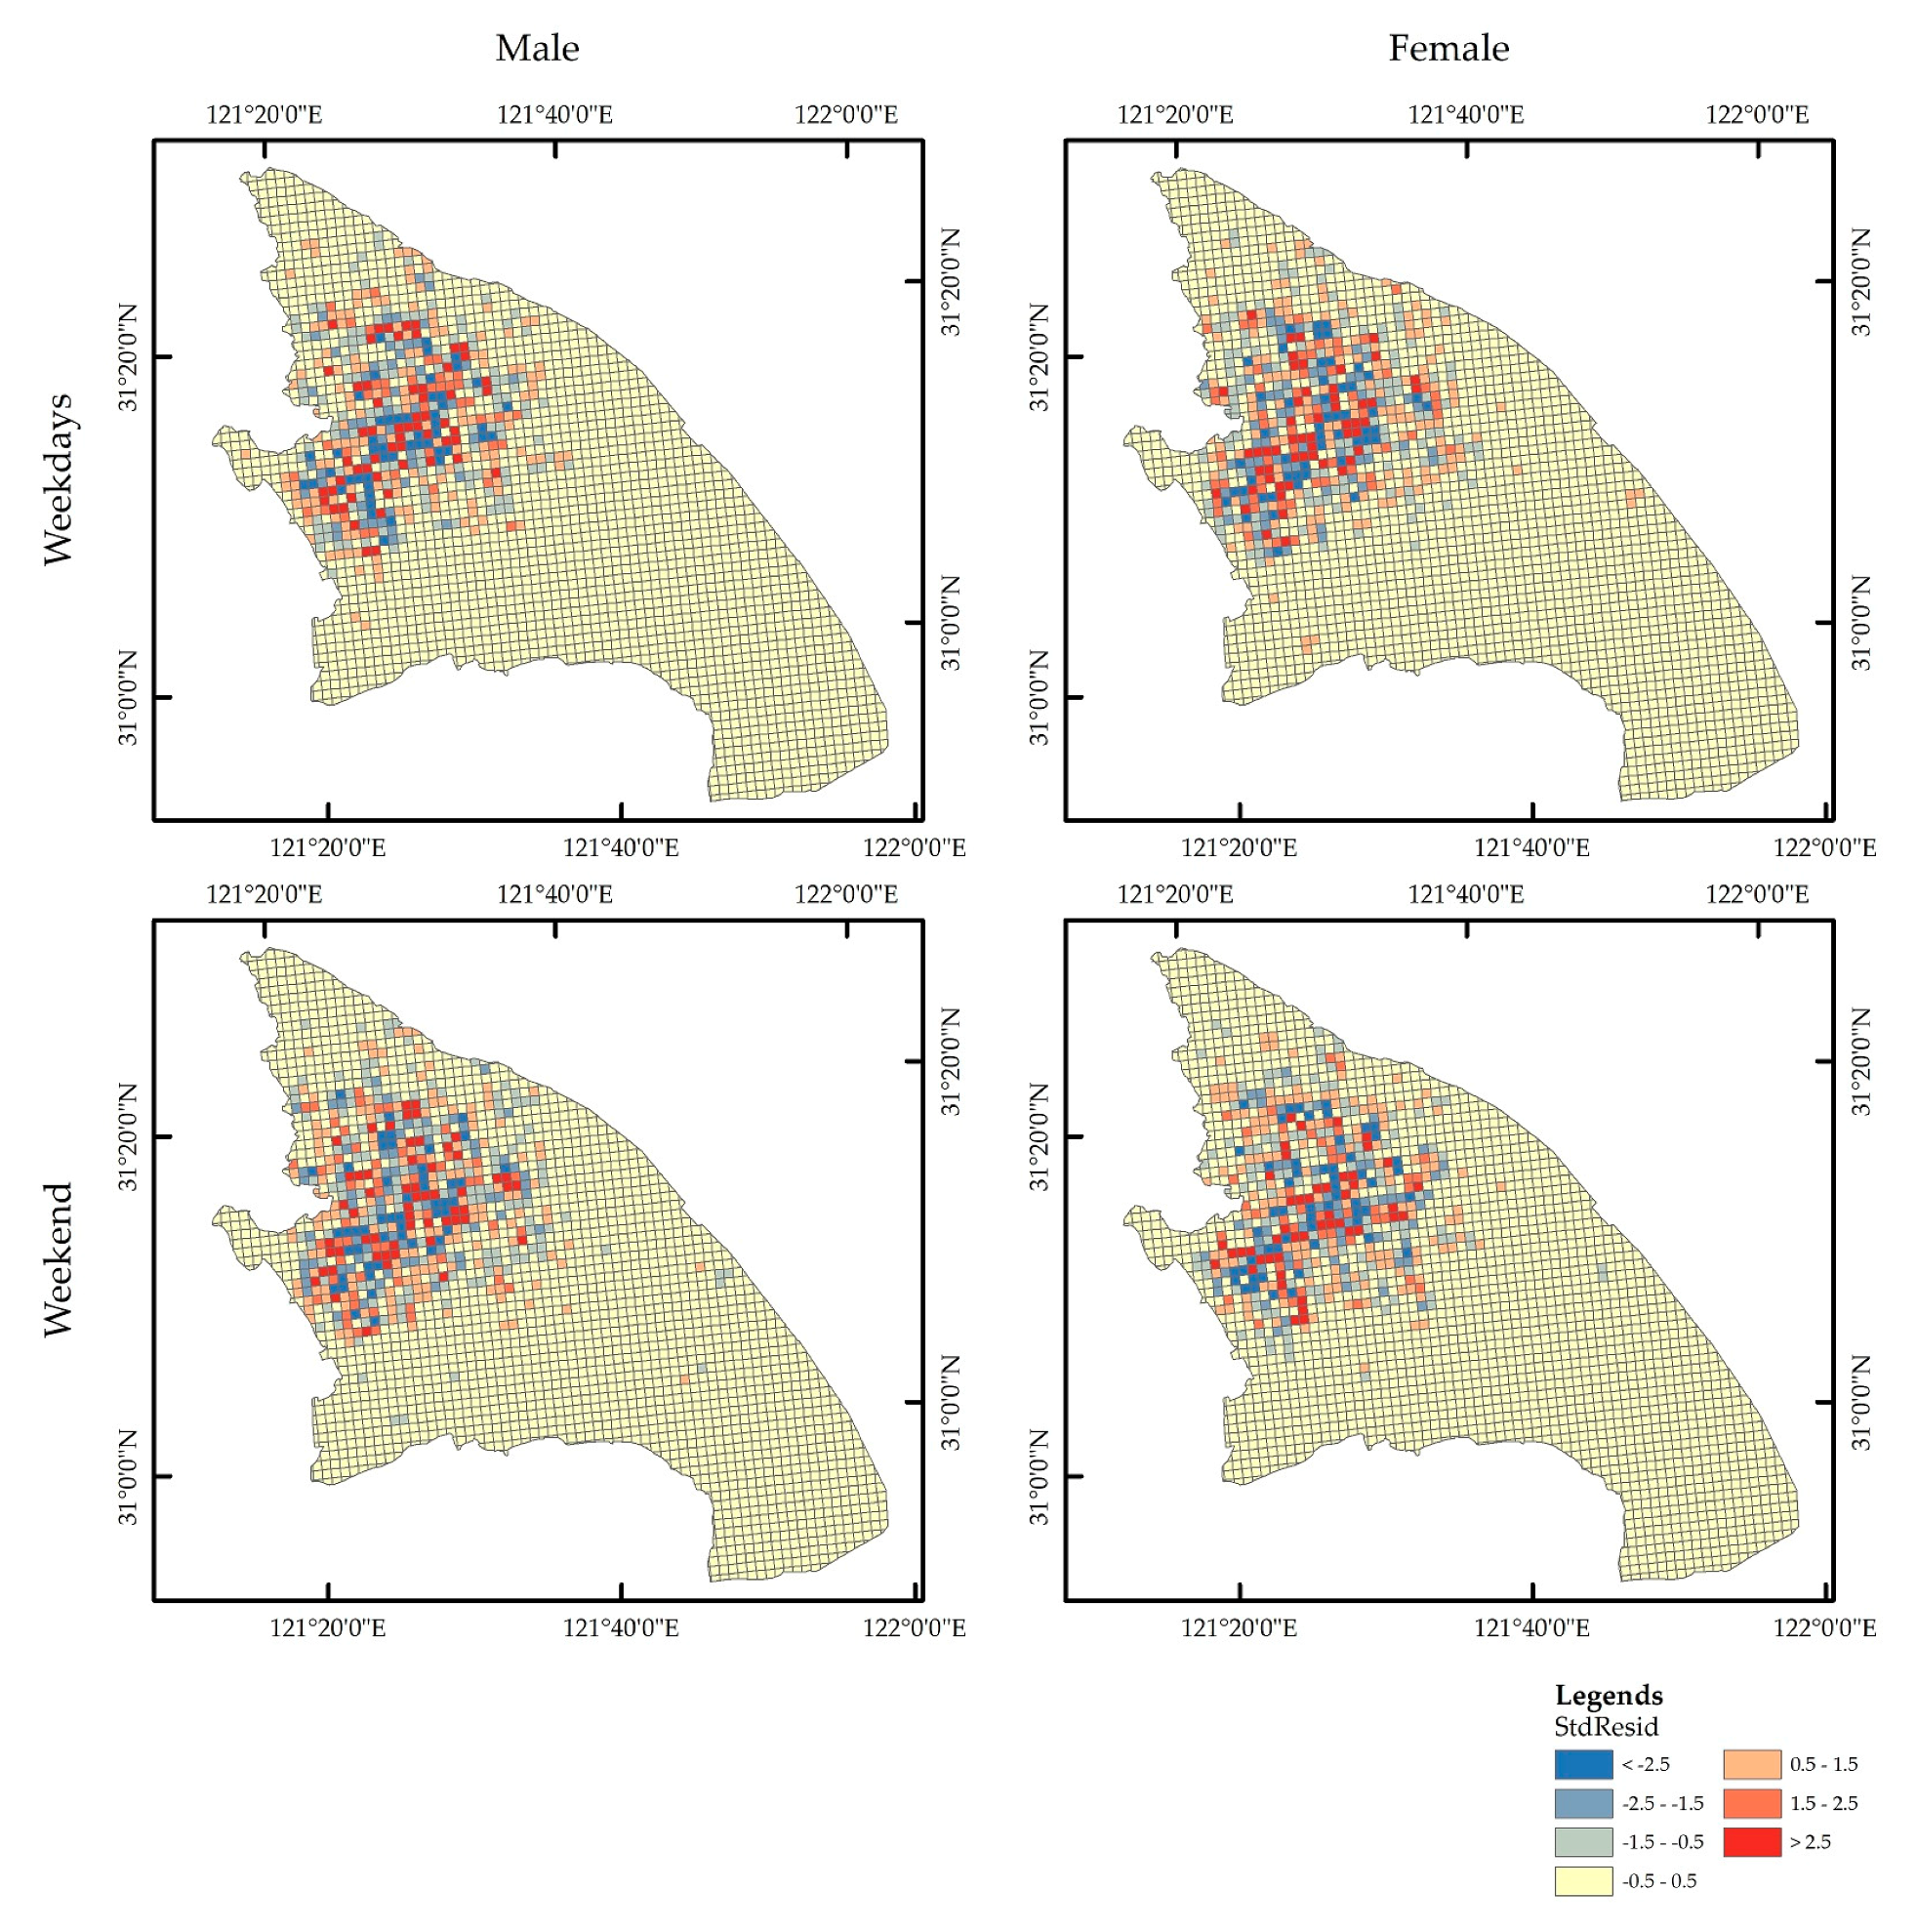
R2 values were 0.9311 and 0.9277, denoting that the selected variables explained 93.1% and 92.7% of the variation in the check-ins in Shanghai during weekdays and weekends, with optimal spatiotemporal bandwidths of 0.3895 and 0.3895, respectively. The variation trends during weekdays were quite different due to the higher number of check-ins by women compared to men. The variation trends during the weekends were almost the same for both men and women in Shanghai due to the higher number of check-ins by men in the city center compared to weekdays.
Figure 15 and Figure 16 show the average spatial change tendencies of the parameter estimates for check-ins during weekdays and weekends. The effects of check-ins during weekdays in Shanghai were mostly higher than 0.5 StdResid and were more scattered compared to weekends. The impact of check-ins during the weekends in Shanghai was mainly higher than 0.5 StdResid and more toward the city center compared to the weekdays.
Finally, from the results mentioned above, overall, the urban areas including the city center had positive effects on check-in frequency during the weekends, whereas the suburban areas districts mostly had adverse effects.

4.3. Spatial Directional Analysis

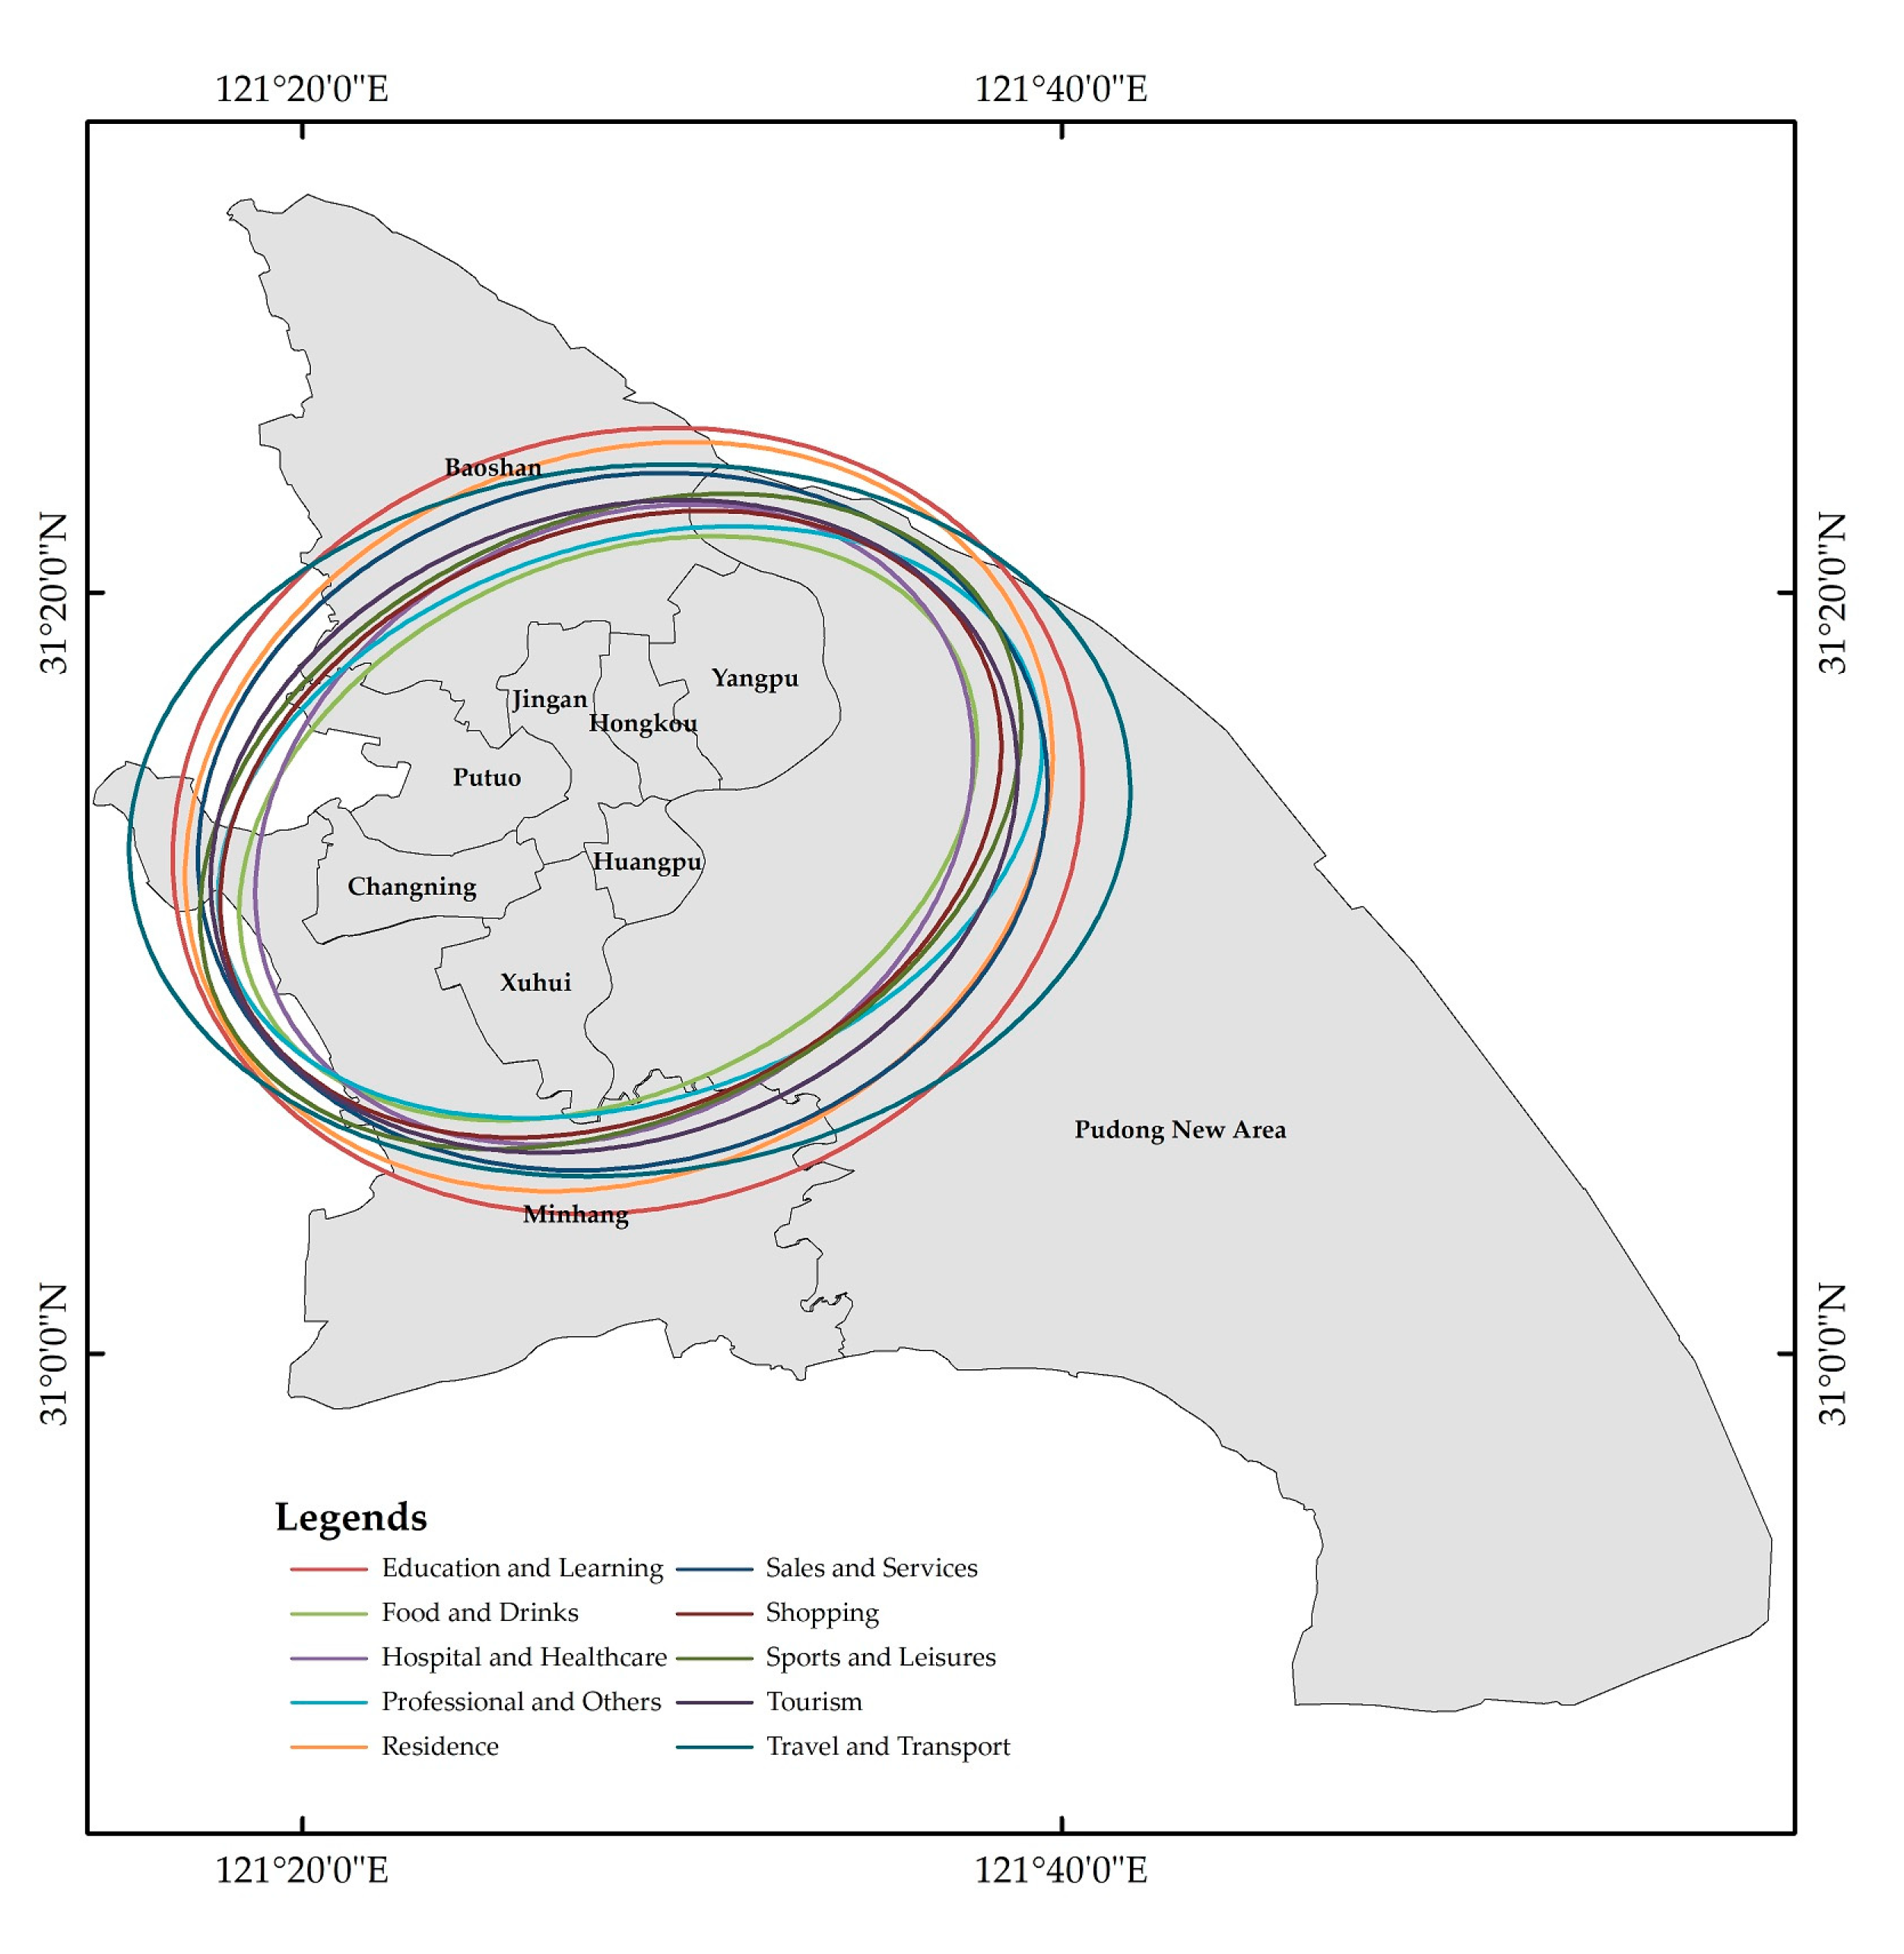
The overall spatial pattern change of activities across Shanghai was determined through standard deviational ellipse (SDE) analysis. Figure 17 shows the overall spatial pattern change of activities in Shanghai, where the major axis indicates the direction and minor axis indicates the range of the data distribution. The trajectory of the center shows a linear movement of activities in a clockwise direction toward the northeast, also exhibiting apparent orientation and direction of activities in the study area. Table 6 presents the features of SDE regarding major and minor axes, azimuth, and flattering for activities in Shanghai. For Education and Learning, Hospital and Healthcare, and Residence, the azimuth laid between 41° and 45°. Education and Learning, with a 1136.73 km2 area and a minor axis of 18.13 km; and Residence with a 1024.20 km2 area and minor axis 16.67 km, produced the larger eccentricity of the SDE. The larger eccentricity of the SDE indicates that the check-ins related to Education and Learning and Residence are more scattered in the city and cover more of the suburban area (Baoshan and Minhang). For Food and Drink, with a 658.63 km2 area, Professional and Others with a 752.76 km2 area, Sales and Services with a 940.70 km2 area, Shopping with a 757.61 km2 area, Sports and Leisure with an 822.73 km2 area, and Tourism with an 828.02 km2 area, we observed a clockwise shift toward (city center) the northeast, where the azimuth lies between 53° and 64°. However, Figure 13 shows that for Travel and Transport, a significant clockwise shift occurred with large eccentricity toward the city center with azimuth 79°, 1133.65 km2 area, and minor axis of 17.11 km.
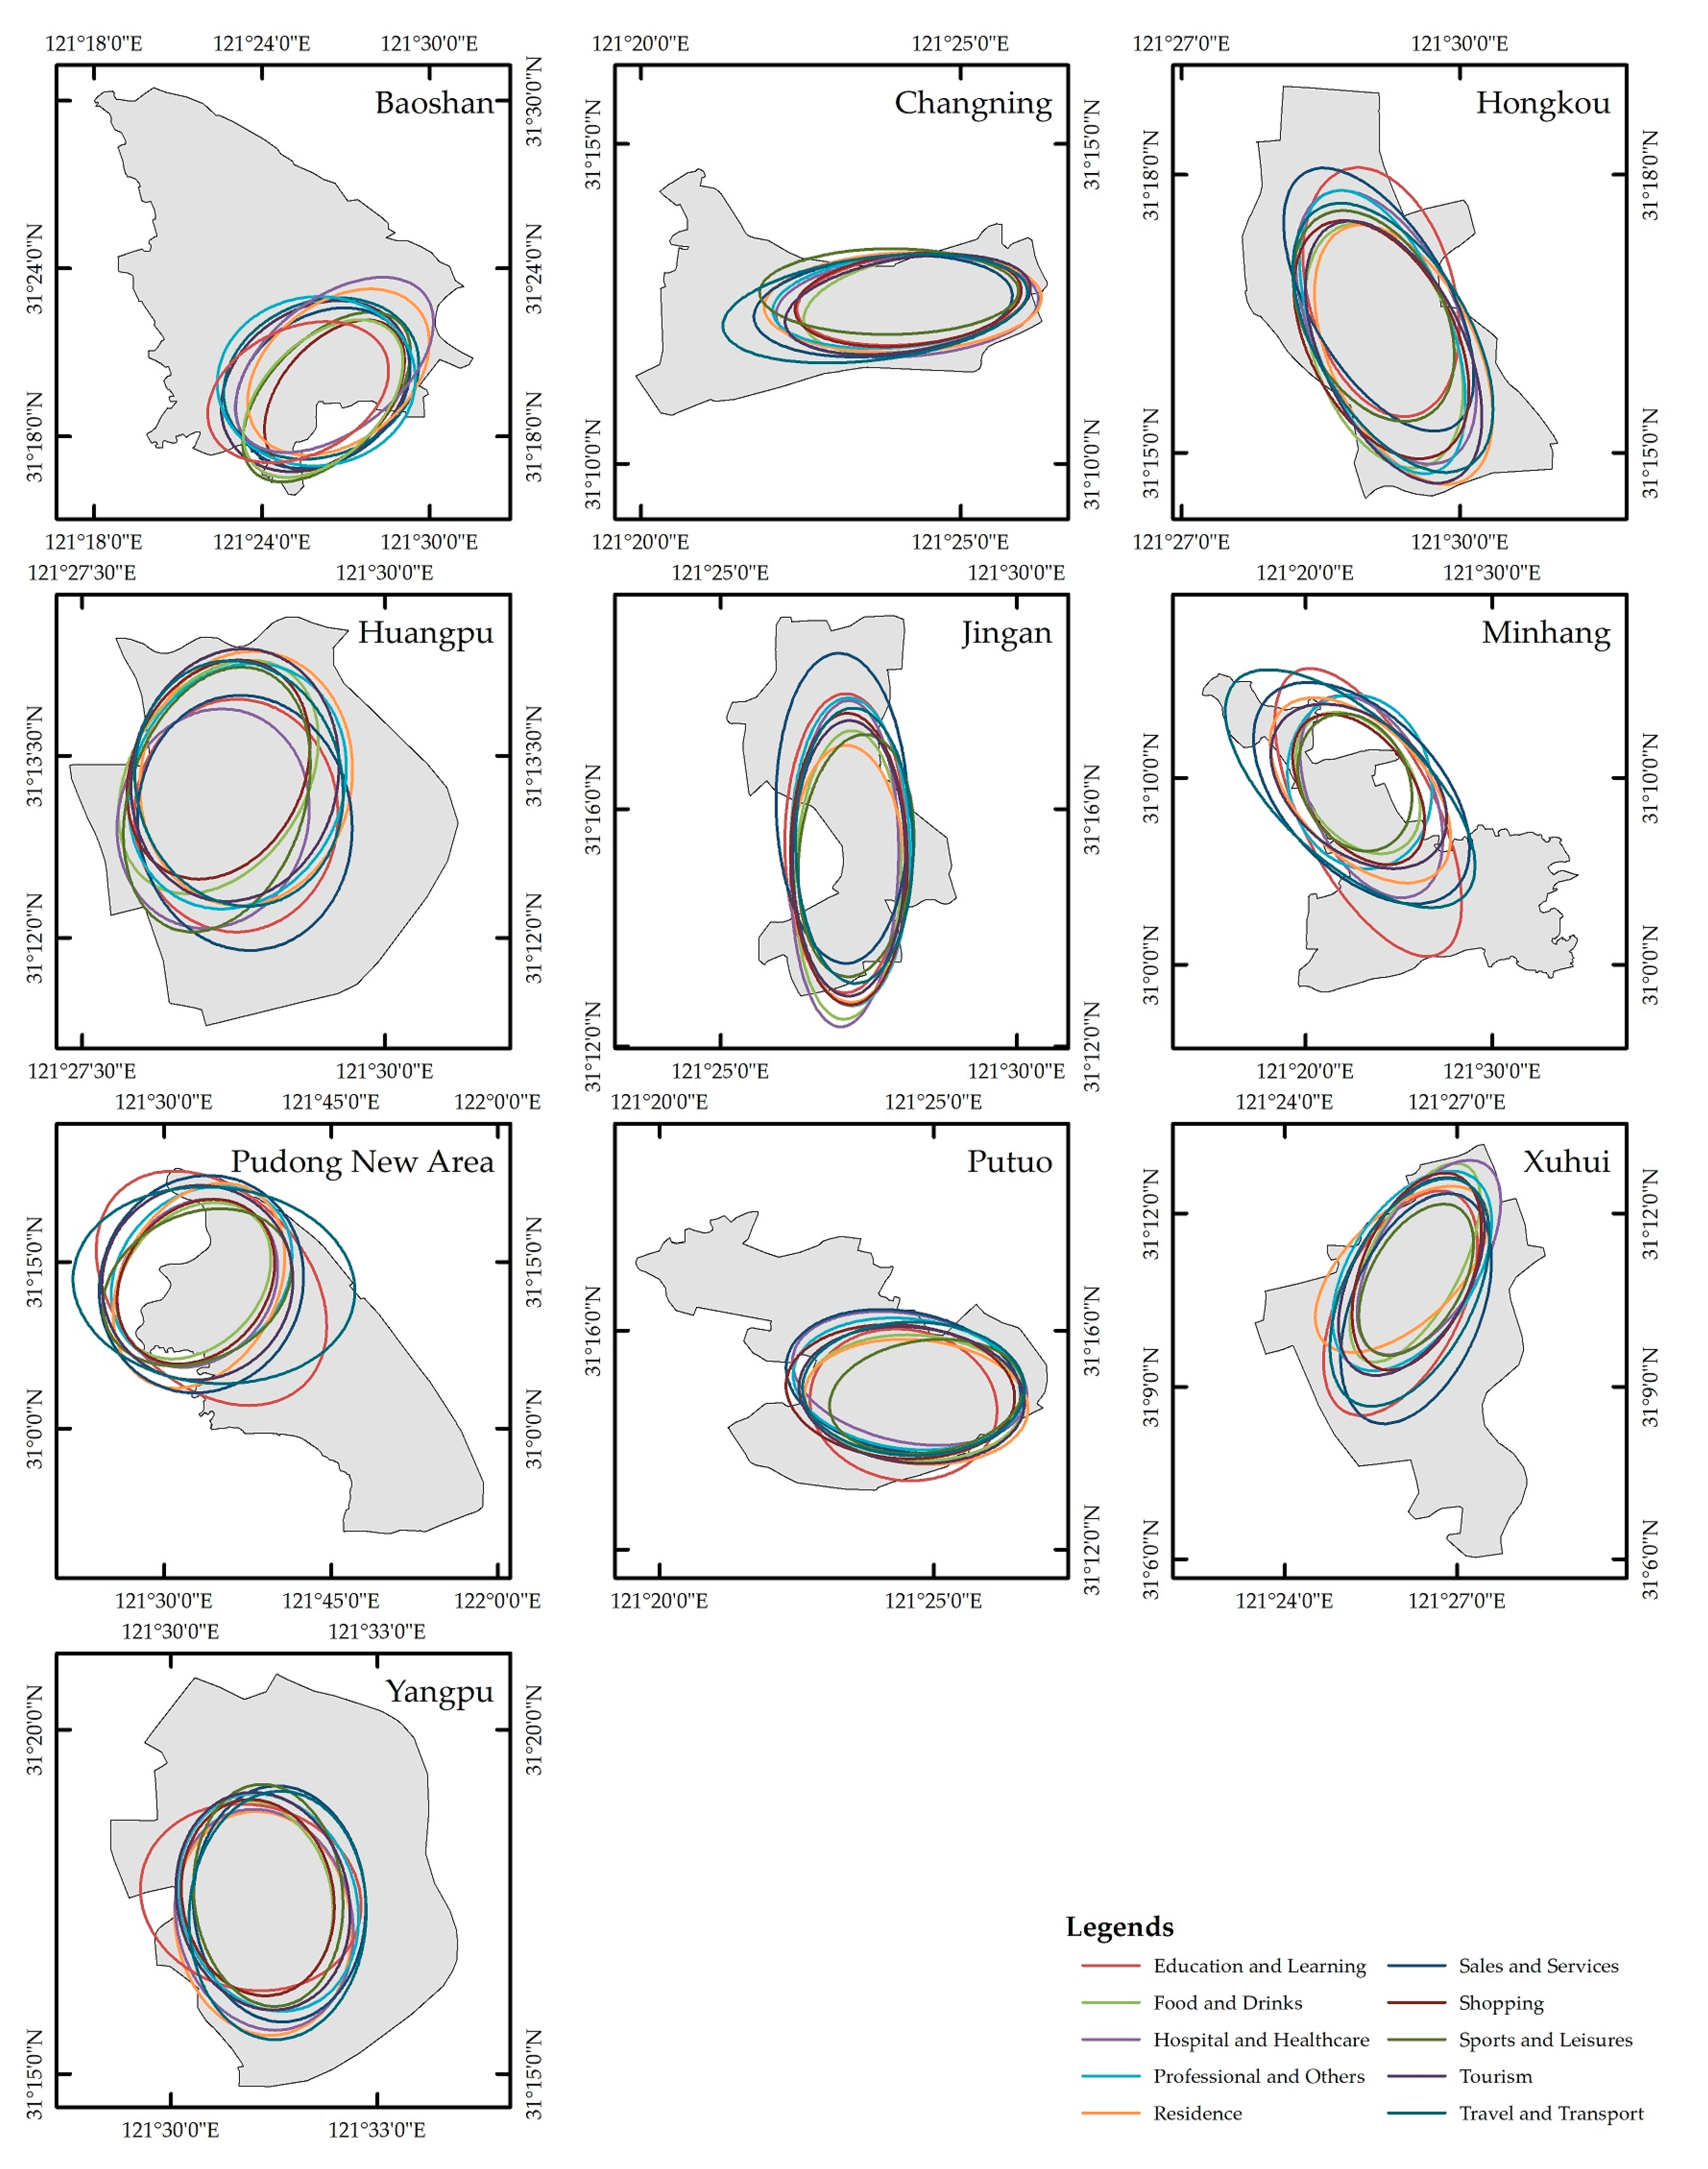
Figure 18 shows the district SDEs for the overall spatial pattern of activities of 10 districts in Shanghai. The SDEs of districts were significantly different from the whole study area due to differences in size and structure. Figure 18 and Table 7 show that the overall spatial pattern and linear movement for activities were almost the same in Changning, Hongkou, Putuo, Xuhui, and Yangpu districts. Large differences were observed for Travel and Transport compared to other activities. However, in Yangpu district, a totally different behavior was observed, with a linear movement in a clockwise direction toward the northeast by a rotating azimuth of 131° (Table 7).
In Baoshan, which is considered a suburban area, for Food and Drink, Residence, Shopping, and Sports and Leisure, the azimuth laid between 33° and 38° with an apparent linear movement toward the clockwise direction, covering most of the suburban area. For Hospital and Healthcare, Professional and Others, and Tourism, the azimuth laid between 40° and 44°; for Education and Learning and Travel and Transport, the azimuth laid between 52° and 55° with a linear movement toward the northeast in the clockwise direction and toward the city center.
In Huangpu, for Education and Learning, Food and Drink, Hospital and Healthcare, Professional and Others, Sales and Services, Shopping, Sports and Leisure, and Tourism, the azimuth laid between 1° and 24° with a linear movement toward the north-east in the clockwise direction. However, for Residence and Travel and Transport, the apparent change in the azimuth between 174° to 177° toward the southeast was observed, demonstrating the shift in these activities away from the city center. In Jingan, for Education and Learning, Professional and Others, Sales and Services, Shopping, Tourism, and Travel and Transport, the azimuth laid between 173° to 180° with a linear movement toward the southeast in a clockwise direction. However, for Food and Drink, Hospital and Healthcare, Residence, and Sports and Leisure, the apparent change in the azimuth between 1° to 5° toward the northeast was observed, demonstrating the shift of these activities away from the city center toward the suburban Baoshan district.
In Minhang, which is also considered a suburban district, the azimuth laid between 140° and 173° with a linear movement toward the southeast in a clockwise direction toward the suburban areas and away from the city center. In Pudong New Area, which is considered the business center of Shanghai, for Food and Drink, Hospital and Healthcare, Professional and Others, Residence, Sales and Services, and Shopping, the azimuth laid between 21° to 31° with a linear movement toward northeast in a clockwise direction. For Sports and Leisure, the azimuth shifted to 55° with a linear progression toward the northeast in a clockwise direction compared to the activities mentioned above. However, for Education and Learning and Travel and Transport, an apparent shift in the azimuth occurred to 179° and 99° with a linear movement toward the southeast in a clockwise direction.
In summary, because check-in data are raw and imprecise for determining the movement of activities from one destination to another, they data cannot precisely indicate the exact nature of the progression of users among the districts. Combining LBSN and POI data could help to better understand central tendency, dispersion, and directional trends of human activities behavior at city and district levels.

5. Conclusions

In this study, we conducted a spatiotemporal investigation of sex-based differences in human activities behavior to explore hourly and daily check-in patterns, as well as during weekdays and weekends. The results showed that in almost all Shanghai districts, women are more likely to consume social media compared to men during the weekdays. However, during the weekends, nearly the same check-in trend was observed for both men and women. The city center was found to have a high density of check-ins near the subways and highways.
Supplementing the prior research on check-in behavior, we considered LBSN data as a supplement rather than a substitute for traditional data sources for observation of, for example, human mobility, activity analysis, defining city boundary, and social issues in a city. Additionally, compared with other traditional data sources, the LBSN dataset has some advantages, including low cost and high spatial precision, and some disadvantages, including sex prejudice, a low frequency of sampling, and location type prejudice. The spatiotemporal dynamics of SDE based on city and district scales exhibited different human behaviors. On the city scale, we observed an activities behavior trend toward the city center in northeast direction. However, the activities behavior trend on the district scale was significantly different from that at a city scale. In general, the movement rate and direction of SDE for different districts were different for various activities, which may be related to the spatial distribution of check-ins. Based on the results of the current study, the LBSN dataset is a novel source of big data that has the potential to provide a new outlook as a supplement for observing human activities behavior and sex differences in space and time. The findings could help policymakers to define policies regarding the supply of services (i.e., transport, health, entertainment) by highlighting the check-in hotspots in the city.
We only focused on an analysis of the spatiotemporal dynamics patterns of human activities using LBSN data. The results revealed that different activities had different change characteristics in various directions on different scales, which could help with evaluating urban development trends of the city. Further studies could analyze the influence of change in human activities behavior and spatiotemporal dynamic patterns of urbanization to better understand the city’s development. The factors that influence the change of urban activities behavior in space and time could be examined.

Author Contributions

Muhammad Rizwan, Wanggen Wan, and Luc Gwiazdzinski conceived the research; Muhammad Rizwan and Wanggen Wan designed the research; and Muhammad Rizwan performed the simulations. Muhammad Rizwan and Wanggen Wan wrote the article, Muhammad Rizwan and Luc Gwiazdzinski proofread the article for language editing. All authors read and approved the final manuscript.

Funding

This research was funded by the National Natural Science Foundation of China (61711530245), partially supported by the project of the Shanghai Science and Technology Commission (18510760300).

Conflicts of Interest

The authors declare no conflict of interest.

References

  1. Edwards, A.; Housley, W.; Williams, M.; Sloan, L.; Williams, M. Digital social research, social media and the sociological imagination: Surrogacy, augmentation and re-orientation. Int. J. Soc. Res. Methodol. 2013, 16, 245–260. [Google Scholar] [CrossRef]
  2. Bryman, A. Social Research Methods; Oxford University Press: Oxford, UK, 2016. [Google Scholar]
  3. Erl, T.; Khattak, W.; Buhler, P. Big Data Fundamentals; Prentice Hall: Upper Saddle River, NJ, USA, 2016. [Google Scholar]
  4. Gandomi, A.; Haider, M. Beyond the hype: Big data concepts, methods, and analytics. Int. J. Inf. Manag. 2015, 35, 137–144. [Google Scholar] [CrossRef] [Green Version]
  5. Lu, E.H.-C.; Chen, C.-Y.; Tseng, V.S. Personalized Trip Recommendation with Multiple Constraints by Mining User Check-in Behaviors. In Proceedings of the 20th International Conference on Advances in Geographic Information Systems, Redondo Beach, CA, USA, 6–9 November 2012; ACM: New York, NY, USA, 2012; pp. 209–218. [Google Scholar]
  6. Stieglitz, S.; Mirbabaie, M.; Ross, B.; Neuberger, C. Social media analytics—challenges in topic discovery, data collection, and data preparation. Int. J. Inf. Manag. 2018, 39, 156–168. [Google Scholar] [CrossRef]
  7. Tsou, M.-H. Research challenges and opportunities in mapping social media and big data. Cartogr. Geogr. Inf. Sci. 2015, 42, 70–74. [Google Scholar] [CrossRef]
  8. Furini, M.; Tamanini, V. Location privacy and public metadata in social media platforms: Attitudes, behaviors and opinions. Multimed. Tools Appl. 2015, 74, 9795–9825. [Google Scholar] [CrossRef] [Green Version]
  9. Li, H.X.; Zhu, H.J.; Du, S.G.; Liang, X.H.; Shen, X.M. Privacy leakage of location sharing in mobile social networks: Attacks and defense. IEEE Trans. Dependable Secur. Comput. 2018, 15, 646–660. [Google Scholar] [CrossRef]
  10. Kumar, S.; Saravanakumar, K.; Deepa, K. On privacy and security in social media—A comprehensive study. Procedia Comput. Sci. 2016, 78, 114–119. [Google Scholar]
  11. Vicente, C.R.; Freni, D.; Bettini, C.; Jensen, C.S. Location-related privacy in geo-social networks. IEEE Internet Comput. 2011, 15, 20–27. [Google Scholar] [CrossRef] [Green Version]
  12. Fuchs, C. Social Media: A Critical Introduction; Sage: London, UK, 2017. [Google Scholar]
  13. Zhang, L.; Pentina, I. Motivations and usage patterns of weibo. Cyberpsychol. Behav. Soc. Netw. 2012, 15, 312–317. [Google Scholar] [CrossRef] [PubMed] [Green Version]
  14. Pentina, I.; Basmanova, O.; Zhang, L. A cross-national study of twitter users’ motivations and continuance intentions. J. Mark. Commun. 2016, 22, 36–55. [Google Scholar] [CrossRef]
  15. Kim, H.-S. A study on use motivation of sns and communication behavior. J. Korea Acad. Ind. Coop. Soc. 2012, 13, 548–553. [Google Scholar]
  16. Smith, A. Why americans use social media. Pew Internet Am. Life Proj. 2011, 1–11. [Google Scholar]
  17. Muscanell, N.L.; Guadagno, R.E. Make new friends or keep the old: Sex and personality differences in social networking use. Comput. Hum. Behav. 2012, 28, 107–112. [Google Scholar] [CrossRef]
  18. Hwang, H.S.; Choi, E.K. Exploring sex differences in motivations for using sina weibo. Ksii Trans. Internet Inf. Syst. 2016, 10, 1429–1441. [Google Scholar]
  19. Saleem, M.A.; Kumar, R.; Calders, T.; Xie, X.; Pedersen, T.B. Location Influence in Location-Based Social Networks. In Proceedings of the Tenth ACM International Conference on Web Search and Data Mining, Cambridge, UK, 6–10 February 2017; ACM: New York, NY, USA, 2017; pp. 621–630. [Google Scholar]
  20. Chun, M.-H. The affective/cognitive involvement and satisfaction according to the usage motivations of social network services. Manag. Inf. Syst. Rev. 2012, 31, 21–39. [Google Scholar]
  21. He, X.; Li, Z.; Li, Q.; Chen, Z.; She, Y. On the spatio-temporal characteristics of tourists in scenic areas based on digital footprint-a case study of tourists in zhangjiajie. J. Nat. Sci. Hunan Norm. Univ. 2018, 41, 11–17. [Google Scholar]
  22. Zheng, Y.; Jizhen, L.; Bingrong, L.; Min, C. Perception and evaluation of cityscape characteristics using semantic analysis on microblog in the main urban area of chongqing municipality. Prog. Geogr. 2017, 36, 1058–1066. [Google Scholar]
  23. Zhao, P.; Cao, Y. Jobs-housing balance comparative analyses with the lbs data: A case study of beijing. Beijing Da Xue Xue Bao 2018, 54, 1290–1302. [Google Scholar]
  24. Xu, Y.; Shaw, S.L.; Zhao, Z.L.; Yin, L.; Lu, F.; Chen, J.; Fang, Z.X.; Li, Q.Q. Another tale of two cities: Understanding human activity space using actively tracked cellphone location data. Ann. Am. Assoc. Geogr. 2016, 106, 489–502. [Google Scholar]
  25. Lei, C.C.; Zhang, A.; Qi, Q.W.; Su, H.M.; Wang, J.H. Spatial-temporal analysis of human dynamics on urban land use patterns using social media data by sex. ISPRS Int. J. Geo Inf. 2018, 7, 358. [Google Scholar] [CrossRef] [Green Version]
  26. Li, L.; Yang, L.; Zhu, H.; Dai, R. Explorative analysis of wuhan intra-urban human mobility using social media check-in data. PLoS ONE 2015, 10, e0135286. [Google Scholar] [CrossRef] [PubMed]
  27. Hao, J.; Zhu, J.; Zhong, R. The rise of big data on urban studies and planning practices in china: Review and open research issues. J. Urban Manag. 2015, 4, 92–124. [Google Scholar] [CrossRef] [Green Version]
  28. Huang, Y.; Liu, Z.; Nguyen, P. Location-Based Event Search in Social Texts. In Proceedings of the 2015 International Conference on Computing, Networking and Communications (ICNC), Garden Grove, CA, USA, 16–19 February 2015; IEEE: Piscataway, NJ, USA, 2015; pp. 668–672. [Google Scholar]
  29. Benson, V.; Saridakis, G.; Tennakoon, H. Information disclosure of social media users: Does control over personal information, user awareness and security notices matter? Inf. Technol. People 2015, 28, 426–441. [Google Scholar] [CrossRef] [Green Version]
  30. Strater, K.; Richter, H. Examining Privacy and Disclosure in a Social Networking Community. In Proceedings of the 3rd Symposium on Usable Privacy and Security, Pittsburgh, PA, USA, 18–20 July 2007; ACM: New York, NY, USA, 2007; pp. 157–158. [Google Scholar]
  31. Stefanone, M.A.; Huang, Y.C.; Lackaff, D. Negotiating Social Belonging: Online, Offline, and In-between. In Proceedings of the HICSS, Kauai, HI, USA, 4–7 January 2011; pp. 1–10. [Google Scholar]
  32. Boyd, D.M.; Ellison, N.B. Social network sites: Definition, history, and scholarship. J. Comput. Mediat. Commun. 2007, 13, 210–230. [Google Scholar] [CrossRef] [Green Version]
  33. Resch, B.; Summa, A.; Sagl, G.; Zeile, P.; Exner, J.-P. Urban emotions—Geo-semantic emotion extraction from technical sensors, human sensors and crowdsourced data. In Progress in Location-Based Services 2014; Springer: Berlin/Heidelberg, Germany, 2015; pp. 199–212. [Google Scholar]
  34. Ullah, H.; Wan, W.G.; Haidery, S.A.; Khan, N.U.; Ebrahimpour, Z.; Luo, T.H. Analyzing the spatiotemporal patterns in green spaces for urban studies using location-based social media data. ISPRS Int. J. Geo Inf. 2019, 8, 506. [Google Scholar] [CrossRef] [Green Version]
  35. Hasan, S.; Ukkusuri, S.V.; Zhan, X. Understanding social influence in activity location choice and lifestyle patterns using geolocation data from social media. Front. Ict 2016, 3, 10. [Google Scholar] [CrossRef] [Green Version]
  36. Yuan, Y.; Wang, X. Exploring the effectiveness of location-based social media in modeling user activity space: A case study of weibo. Trans. Gis 2018, 22, 930–957. [Google Scholar] [CrossRef]
  37. Humphreys, L. Mobile social networks and urban public space. New Media Soc. 2010, 12, 763–778. [Google Scholar] [CrossRef] [Green Version]
  38. Roche, S. Geographic information science i: Why does a smart city need to be spatially enabled? Prog. Hum. Geogr. 2014, 38, 703–711. [Google Scholar] [CrossRef]
  39. Scellato, S.; Noulas, A.; Lambiotte, R.; Mascolo, C. Socio-spatial properties of online location-based social networks. ICWSM 2011, 11, 329–336. [Google Scholar]
  40. Rizwan, M.; Mahmood, S.; Wanggen, W.; Ali, S. Location based social media data analysis for observing check-in behavior and city rhythm in shanghai. In Proceedings of the 4th International Conference on Smart and Sustainable City, ICSSC 2017, Shanghai, China, 5–6 June 2017; Institute of Electrical and Electronics Engineers Inc.: Shanghai, China, 2018; pp. 5–8. [Google Scholar]
  41. Rizwan, M.; Wan, W. Big data analysis to observe check-in behavior using location-based social media data. Information 2018, 9, 257. [Google Scholar] [CrossRef] [Green Version]
  42. Rizwan, M.; Wan, W.G.; Cervantes, O.; Gwiazdzinski, L. Using location-based social media data to observe check-in behavior and sex difference: Bringing weibo data into play. ISPRS Int. J. Geo Inf. 2018, 7, 196. [Google Scholar] [CrossRef] [Green Version]
  43. Li, N.; Chen, G. Analysis of a location-based social Network. In Proceedings of the International Conference on Computational Science and Engineering, 2009. CSE’09, Vancouver, BC, Canada, 29–31 August 2009; IEEE: Piscataway, NJ, USA, 2009; pp. 263–270. [Google Scholar]
  44. Ebrahimpour, Z.; Wan, W.G.; Cervantes, O.; Luo, T.H.; Ullah, H. Comparison of main approaches for extracting behavior features from crowd flow analysis. ISPRS Int. J. Geo Inf. 2019, 8, 440. [Google Scholar] [CrossRef] [Green Version]
  45. Wakamiya, S.; Jatowt, A.; Kawai, Y.; Akiyama, T. Analyzing global and pairwise collective spatial attention for geo-social event detection in microblogs. In Proceedings of the 25th International Conference Companion on World Wide Web, Montreal, QC, Canada, 11–15 May 2016; International World Wide Web Conferences Steering Committee: Geneva, Switzerland, 2016; pp. 263–266. [Google Scholar]
  46. Cullen, I.G. Human geography, regional science, and the study of individual behaviour. Environ. Plan. A 1976, 8, 397–409. [Google Scholar] [CrossRef]
  47. Hägerstrand, T. Reflections on “what about people in regional science?”. In Papers of the Regional Science Association; Springer: Berlin/Heidelberg, Germany, 1989; pp. 1–6. [Google Scholar]
  48. Nilsson, L.; Gil, J. The signature of organic urban growth. In The Mathematics of Urban Morphology; Springer: Berlin/Heidelberg, Germany, 2019; pp. 93–121. [Google Scholar]
  49. Anderson, J.E. Cubic-spline urban-density functions. J. Urban Econ. 1982, 12, 155–167. [Google Scholar] [CrossRef]
  50. Zhao, K.; Tarkoma, S.; Liu, S.; Vo, H. Urban human mobility data mining: An overview. In Proceedings of the 2016 IEEE International Conference on Big Data (Big Data), Washington, DC, USA, 5–8 December 2016; IEEE: Piscataway, NJ, USA, 2016; pp. 1911–1920. [Google Scholar]
  51. Weijing, Z.; De, W. Urban space study based on the temporal characteristics of residents’ behavior. Prog. Geogr. 2018, 37, 1106–1118. [Google Scholar]
  52. Chunshan, Z.; Renze, L.; Dandan, D. Evolution and mechanism of the residential spatial structure from 2000 to 2010 in guangzhou. Geogr. Res. 2015, 34, 1109–1124. [Google Scholar]
  53. Jian, F.; Yizhi, X. Characteristics of residential space of development zone and formation mechanism: An investigation of beijing economic-technological development area. Prog. Geogr. 2017, 36, 99–111. [Google Scholar]
  54. Nam, T.; Pardo, T.A. Conceptualizing smart city with dimensions of technology, people, and institutions. In Proceedings of the 12th Annual International Digital Government Research Conference: Digital Government Innovation in Challenging Times, College Park, MD, USA, 12–15 June 2011; ACM: New York, NY, USA, 2011; pp. 282–291. [Google Scholar]
  55. Frändberg, L. Paths in transnational time-space: Representing mobility biographies of young swedes. Geogr. Ann. Ser. BHum. Geogr. 2008, 90, 17–28. [Google Scholar] [CrossRef]
  56. Johnson, A.J.; Glover, T.D. Understanding urban public space in a leisure context. Leis. Sci. 2013, 35, 190–197. [Google Scholar] [CrossRef]
  57. Weibo. Available online: http://www.weibo.com (accessed on 2 January 2020).
  58. Sina Corporation. Available online: http://www.sina.com.cn/ (accessed on 2 January 2020).
  59. Sina Weibo Q4 2017 Financial Report. Available online: http://ir.weibo.com/financial-information/quarterly-results (accessed on 13 February 2018).
  60. The 41st Statistical Report on Internet Development in China; China Internet Network Information Center (CNNIC): Beijing, China, 2018; pp. 48–49.
  61. Liu, Y.Q.; Zhang, F.Z.; Wu, F.L.; Liu, Y.; Li, Z.G. The subjective wellbeing of migrants in Guangzhou, China: The impacts of the social and physical environment. Cities 2017, 60, 333–342. [Google Scholar] [CrossRef]
  62. Hasan, S.; Zhan, X.; Ukkusuri, S.V. Understanding Urban Human Activity and Mobility Patterns Using Large-Scale location-based data from online social media. In Proceedings of the 2nd ACM SIGKDD international workshop on urban computing, Chicago, IL, USA, 11–14 August 2013; ACM: New York, NY, USA, 2013; p. 6. [Google Scholar]
  63. Bao, M.; Yang, N.; Zhou, L.; Lao, Y.; Zhang, Y.; Tian, Y. The spatial analysis of weibo check-in data: The case study of wuhan. In Geo-Informatics in Resource Management and Sustainable Ecosystem; Springer: Berlin/Heidelberg, Germany, 2013; pp. 480–491. [Google Scholar]
  64. Preoţiuc-Pietro, D.; Cohn, T. Mining User Behaviours: A Study of Check-in Patterns in Location Based Social Networks. In Proceedings of the 5th Annual ACM Web Science Conference, Paris, France, 2–3 May 2013; ACM: New York, NY, USA; pp. 306–315. [Google Scholar]
  65. Abbasi, A.; Rashidi, T.H.; Maghrebi, M.; Waller, S.T. Utilising Location Based Social Media in Travel Survey Methods: Bringing Twitter Data into the Play. In Proceedings of the 8th ACM SIGSPATIAL International Workshop on Location-Based Social Networks, Washington, DC, USA, 3 November 2015; ACM: New York, NY, USA; p. 1. [Google Scholar]
  66. Sabrina. Sina Weibo User Demographics Analysis in 2013. Available online: https://www.chinainternetwatch.com/5568/what-weibo-can-tell-you-about-chinese-netizens-part-1/ (accessed on 21 December 2019).
  67. Statistical Report on Internet Development in China. Available online: https://cnnic.com.cn/IDR/ReportDownloads/201411/P020141102574314897888.pdf (accessed on 17 March 2019).
  68. He, W.; Wang, F.K.; Akula, V. Managing extracted knowledge from big social media data for business decision making. J. Knowl. Manag. 2017, 21, 275–294. [Google Scholar] [CrossRef]
  69. Gao, X.; Yu, W.; Rong, Y.; Zhang, S. Ontology-based social media analysis for urban planning. In Proceedings of the Computer Software and Applications Conference (COMPSAC), 2017 IEEE 41st Annual, Turin, Italy, 4–8 July 2017; IEEE: Piscataway, NJ, USA, 2017; pp. 888–896. [Google Scholar]
  70. Shelton, T.; Poorthuis, A.; Zook, M. Social media and the city: Rethinking urban socio-spatial inequality using user-generated geographic information. Landsc. Urban Plan. 2015, 142, 198–211. [Google Scholar] [CrossRef]
  71. Li, J.H.; Fang, W.; Wang, T.; Qureshi, S.; Alatalo, J.M.; Bai, Y. Correlations between socioeconomic drivers and indicators of urban expansion: Evidence from the heavily urbanised Shanghai metropolitan area, China. Sustainability 2017, 9, 1199. [Google Scholar] [CrossRef] [Green Version]
  72. Gu, X.K.; Tao, S.Y.; Dai, B. Spatial accessibility of country parks in shanghai, china. Urban For. Urban Green. 2017, 27, 373–382. [Google Scholar] [CrossRef]
  73. Jiang, Y.; Shi, X.; Zhang, S.; Ji, J. The threshold effect of high-level human capital investment on china’s urban-rural income gap. China Agric. Econ. Rev. 2011, 3, 297–320. [Google Scholar] [CrossRef]
  74. Xiong, X.; Jin, C.; Chen, H.; Luo, L. Using the fusion proximal area method and gravity method to identify areas with physician shortages. PLoS ONE 2016, 11, e0163504. [Google Scholar] [CrossRef]
  75. Shen, J.; Kee, G. Shanghai: Urban development and regional integration through mega projects. In Development and Planning in Seven Major Coastal Cities in Southern and Eastern China; Springer: Berlin/Heidelberg, Germany, 2017; pp. 119–151. [Google Scholar]
  76. Campagna, M. Social media geographic information: Why social is special when it goes spatial. In European Handbook of Crowdsourced Geographic Information; Capineri, C., Haklay, M., Eds.; Ubiquity Press: London, UK, 2016; pp. 45–54. [Google Scholar]
  77. Wang, Y.; Wang, T.; Ye, X.; Zhu, J.; Lee, J. Using social media for emergency response and urban sustainability: A case study of the 2012 Beijing rainstorm. Sustainability 2015, 8, 25. [Google Scholar] [CrossRef]
  78. Weibo Api. Available online: http://open.weibo.com/wiki/API (accessed on 9 December 2019).
  79. Fernandes, R.; D’Souza, R. Analysis of product twitter data though opinion mining. In Proceedings of the India Conference (INDICON), 2016 IEEE Annual, Bangalore, India, 16–18 December 2016; IEEE: Piscataway, NJ, USA, 2016; pp. 1–5. [Google Scholar]
  80. Batrinca, B.; Treleaven, P.C. Social media analytics: A survey of techniques, tools and platforms. Ai Soc. 2015, 30, 89–116. [Google Scholar] [CrossRef] [Green Version]
  81. Silverman, B.W. Algorithm as 176: Kernel density estimation using the fast fourier transform. J. R. Stat. Soc. Ser. C Appl. Stat. 1982, 31, 93–99. [Google Scholar] [CrossRef]
  82. Bowman, A.W. An alternative method of cross-validation for the smoothing of density estimates. Biometrika 1984, 71, 353–360. [Google Scholar] [CrossRef]
  83. Silverman, B.W. Density Estimation for Statistics and Data Analysis; Routledge: Abingdon-on-Thames, UK, 2018. [Google Scholar]
  84. Wu, C.; Ye, X.; Ren, F.; Wan, Y.; Ning, P.; Du, Q. Spatial and social media data analytics of housing prices in Shenzhen, China. PLoS ONE 2016, 11, e0164553. [Google Scholar] [CrossRef] [PubMed]
  85. Lichman, M.; Smyth, P. Modeling human location data with mixtures of kernel densities. In Proceedings of the 20th ACM SIGKDD International Conference on Knowledge Discovery and Data Mining—KDD ‘14, New York, NY, USA, 24–27 August 2014; ACM: New York, NY, USA, 2014; pp. 35–44. [Google Scholar]
  86. Xie, Z.; Yan, J. Kernel density estimation of traffic accidents in a network space. Comput. Environ. Urban Syst. 2008, 32, 396–406. [Google Scholar] [CrossRef] [Green Version]
  87. Wang, Y.; He, H. Spatial Data Analysis Method; Science Press: Beijing, China, 2007. [Google Scholar]
  88. Fotheringham, A.S.; Brunsdon, C.; Charlton, M. Geographically Weighted Regression; John Wiley & Sons, Limited West Atrium: West Sussex, UK, 2003. [Google Scholar]
  89. Lefever, D.W. Measuring geographic concentration by means of the standard deviational ellipse. Am. J. Sociol. 1926, 32, 88–94. [Google Scholar] [CrossRef]
Figure 1. Map of Shanghai, China.
Ijgi 09 00137 g001
Figure 2. Activities behavior analytics.
Ijgi 09 00137 g002
Figure 3. Sex-based monthly check-in distribution in Shanghai.
Ijgi 09 00137 g003
Figure 4. Check-in distribution of activities in Shanghai.
Ijgi 09 00137 g004
Figure 5. Sex-based distribution of activities during weekdays and weekend.
Ijgi 09 00137 g005
Figure 6. Kernel density of activities in Shanghai.
Ijgi 09 00137 g006
Figure 7. Sex-based check-in distribution of activities in Shanghai.
Ijgi 09 00137 g007
Figure 8. Check-in trend of activities during a week in Shanghai: (a) overall and for (b) men (c) and women.
Ijgi 09 00137 g008aIjgi 09 00137 g008b
Figure 9. District wise activities distribution by men and women in Shanghai.
Ijgi 09 00137 g009
Figure 10. Temporal trend of activities in Shanghai: (a) overall, (b) men, (c) and women.
Ijgi 09 00137 g010
Figure 11. Kernel densities of activities in districts of Shanghai.
Ijgi 09 00137 g011aIjgi 09 00137 g011bIjgi 09 00137 g011c
Figure 12. Spatial distribution of check-ins by men and women during weekdays and weekend.
Ijgi 09 00137 g012
Figure 13. Spatial distribution of activities by the men in Shanghai.
Ijgi 09 00137 g013
Figure 14. Spatial distribution of activities by the women in Shanghai.
Ijgi 09 00137 g014
Figure 15. Spatial distribution of activities during weekdays in Shanghai.
Ijgi 09 00137 g015
Figure 16. Spatial distribution of activities during the weekends in Shanghai.
Ijgi 09 00137 g016
Figure 17. Standard deviational ellipses (SDEs) for activities in Shanghai.
Ijgi 09 00137 g017
Figure 18. SDEs of activities in districts of Shanghai.
Ijgi 09 00137 g018
Table 1. Example of Weibo check-in.
Status_idUser_idUser_nameMonthDateTimeYearSexLonLat
3943172612597320#### *#### *03133:02:122017m121.3969531.39848
Venue_typeVenue_descriptionAddress
Coffee shopStarbucks coffeeJufengyuan Road, Baoshan District
* for information privacy, data are represented as “#.”
Table 2. Activities classification.
Activity CategoryType of Visited Location
Education and LearningUniversity, college, high school, primary school, kindergarten school, language institute, etc.
Food and DrinkCoffee corner, restaurant, fast food, pizza shop, burger shop, cafe, steakhouse, bakery, ice cream parlor, breakfast, taco place, gourmet shop, tea room, etc.
Hospital and HealthcareHospital (public and private), private clinic, dental clinic, body care, hair transplant, etc.
Professional and OthersOffice (public and private), co-working space, startup space, shared business space, design and fashion studio, etc.
ResidenceLiving space, home (private), residential community, residential space (apartment/condo), etc.
Sales and ServicesAutomotive repair shop, car wash, wooden and metal works, sanitary works, pest control, dry cleaning, etc.
ShoppingSuper-mart, grocery store, shopping plaza, pharmacy shop, bookstore, shopping mall, fish and farmers market, hair salon, fashion and boutique, miscellaneous shop, etc.
Sports & LeisurePark, gym, playground, dog run, zoo, botanical garden, aquarium, playing field, pubs and nightclub, bars and cafe, karaoke television (KTV), entertainment, theater, opera and concert hall, dance studio, casino and bar, event space, etc.
TourismScenic spot, beach, port, ancient street and town, mountain, ancient temple and building, markets, etc.
Travel and TransportAirport, railway station, bus stand, subway, taxi stand, parking, toll gate, highways, etc.
Table 3. Estimated geographically weighted regression (GWR) parameters by men and women during weekdays and weekends.
WeekdaysWeekend
SexMinMeanMaxSDp-ValueMinMeanMaxSDp-Value
Male0113.818714.89379.960.000 ***064.544989.18217.470.000 ***
Female0147.7111003.70483.980.000 ***071.795674.03235.960.000 ***
Diagnostic information:Diagnostic information:
Moran’s I0.3175Moran’s I0.3194
R20.9993R20.9975
AIC−68,484.82AIC−68,786.29
Bandwidth0.9544Bandwidth0.9663
*** represents a significance level of 1%.
Table 4. Estimated GWR parameters of activities for men and women in Shanghai.
MenWomen
MinMeanMaxSDp-ValueMinMeanMaxSDp-Value
Education and Learning08.45861.8932.620.000 ***07.65699.9428.810.000 ***
Food and Drinks036.243302.18135.020.000 ***053.765242.56199.710.000 ***
Hospital and Healthcare03.25249.3111.460.000 ***04.73303.9515.930.000 ***
Professional and Others026.792669.3999.060.000 ***023.572145.5285.770.000 ***
Residence025.571284.3477.790.000 ***036.711884.00109.620.000 ***
Sales and Services017.711537.8960.610.000 ***019.281570.3564.830.000 ***
Shopping024.802072.4582.160.000 ***034.392598.20112.000.000 ***
Sports and Leisure06.58697.6226.220.000 ***06.12650.6424.040.000 ***
Tourism011.68912.5440.310.000 ***014.471584.6750.070.000 ***
Travel and Transport017.281646.9662.990.000 ***018.811878.8568.690.000 ***
Diagnostic information:Diagnostic information:
Moran’s I0.1976Moran’s I0.1951
R20.9950R20.9283
AIC27,713.35AIC28,837.71
Bandwidth0.3895Bandwidth0.3895
*** represents a significance level of 1%.
Table 5. Estimated GWR parameters of activities in Shanghai during weekdays and weekends.
WeekdaysWeekends
MinMeanMaxSDp-ValueMinMeanMaxSDp-Value
Education and Learning012.851134.6547.220.000 ***03.25330.5113.090.000 ***
Food and Drinks058.405628.32217.050.000 ***031.602916.42117.870.000 ***
Hospital and Healthcare06.30447.3021.360.000 ***01.68109.125.960.000 ***
Professional and Others037.933619.44138.910.000 ***012.441195.4745.730.000 ***
Residence038.281902.59114.950.000 ***024.001263.7672.560.000 ***
Sales and Services022.641822.2375.500.000 ***014.351286.0149.850.000 ***
Shopping037.462912.18123.250.000 ***021.731758.4770.960.000 ***
Sports and Leisure07.53714.3529.160.000 ***05.17633.9121.070.000 ***
Tourism016.451509.1956.560.000 ***09.70762.7233.620.000 ***
Travel and Transport023.692255.2485.650.000 ***012.401200.5945.980.000 ***
Diagnostic information:Diagnostic information:
Moran’s I0.1977Moran’s I0.1512
R20.9311R20.9277
AIC29,269.47AIC26,619.19
Bandwidth0.3895Bandwidth0.3895
*** represents a significance level of 1%.
Table 6. SDE features on the major axis, minor axis, area, azimuth, and flattering for activities in Shanghai.
ActivityMajor Axis (km)Minor Axis (km)Area (km2)Orientation (°)Flattering
Education and Learning19.9518.131136.73451.10
Food and Drink16.9012.41658.63541.36
Hospital and Healthcare16.8813.51716.02411.25
Professional and Others18.1513.20752.76641.37
Residence19.5616.671024.20451.17
Sales and Services18.3316.33940.70581.12
Shopping17.7013.63757.61541.30
Sports and Leisure18.8613.89822.73531.36
Tourism17.8014.81828.02561.20
Travel and Transport21.0917.111133.65791.23
Table 7. SDE features on major and minor axes, area, azimuth, and flattering in districts of Shanghai.
Baoshan
ActivityMajor Axis (km)Minor Axis (km)Area (km2)Orientation (°)Flattering
Education and Learning5.624.0371.21551.39
Food and Drink5.923.5365.54371.68
Hospital and Healthcare6.954.0788.89441.71
Professional and Others6.194.2682.88411.45
Residence5.734.4279.66381.30
Sales and Services5.675.5298.39531.03
Shopping5.483.1854.80331.72
Sports and Leisure6.463.5071.06371.84
Tourism6.154.7391.41401.30
Travel and Transport5.904.9090.91521.20
Changning
Major Axis (km)Minor Axis (km)Area (km2)Orientation (°)Flattering
Education and Learning2.891.2911.76842.24
Food and Drink2.741.3411.55782.04
Hospital and Healthcare3.271.4414.75862.28
Professional and Others3.451.4315.51882.41
Residence3.231.4314.52842.26
Sales and Services3.181.3313.31852.39
Shopping2.831.3211.73842.15
Sports and Leisure3.221.2412.53902.60
Tourism3.101.3413.06802.31
Travel and Transport3.821.4817.78822.58
Hongkou
Major Axis (km)Minor Axis (km)Area (km2)Orientation (°)Flattering
Education and Learning2.521.259.931692.01
Food and Drink2.491.239.611662.03
Hospital and Healthcare2.851.2911.531612.22
Professional and Others2.711.2810.861602.13
Residence2.831.2210.861562.32
Sales and Services2.931.1810.851642.48
Shopping2.491.2810.041601.94
Sports and Leisure2.191.228.411601.80
Tourism2.741.2510.741602.20
Travel and Transport2.871.3612.241572.12
Huangpu
Major Axis (km)Minor Axis (km)Area (km2)Orientation (°)Flattering
Education and Learning1.771.339.9311.33
Food and Drink1.861.199.61241.57
Hospital and Healthcare1.681.2511.53101.35
Professional and Others1.941.3910.8661.40
Residence1.951.4010.861771.39
Sales and Services1.901.3910.85151.36
Shopping1.711.1410.04171.49
Sports and Leisure2.061.168.41141.77
Tourism1.931.3610.7471.42
Travel and Transport1.881.3612.241741.39
Jingan
Major Axis (km)Minor Axis (km)Area (km2)Orientation (°)Flattering
Education and Learning4.661.6223.751782.88
Food and Drink4.511.4220.1223.17
Hospital and Healthcare5.091.4423.0423.54
Professional and Others4.011.5219.201802.63
Residence4.841.7726.9212.73
Sales and Services4.811.6024.141783.01
Shopping4.551.5622.321782.91
Sports and Leisure3.791.5318.2552.47
Tourism4.301.5120.411732.84
Travel and Transport4.301.5721.241752.73
Minhang
Major Axis (km)Minor Axis (km)Area (km2)Orientation (°)Flattering
Education and Learning15.235.76275.681582.64
Food and Drink7.444.62108.071551.61
Hospital and Healthcare10.445.25172.211611.99
Professional and Others8.656.08165.251731.42
Residence10.475.76189.491451.82
Sales and Services12.457.00273.931461.78
Shopping8.074.65117.981521.74
Sports and Leisure6.934.64101.011651.49
Tourism9.246.04175.311421.53
Travel and Transport14.416.57297.551402.19
Pudong New Area
Major Axis (km)Minor Axis (km)Area (km2)Orientation (°)Flattering
Education and Learning20.9814.41949.461491.46
Food and Drink13.809.94430.76311.39
Hospital and Healthcare14.3111.04496.20221.30
Professional and Others15.5112.04586.64291.29
Residence17.5911.35627.55211.55
Sales and Services18.0814.50823.4391.25
Shopping14.1910.54469.84251.35
Sports and Leisure14.7311.54533.94501.28
Tourism16.1413.62690.5951.18
Travel and Transport20.1916.211028.10991.25
Putuo
Major Axis (km)Minor Axis (km)Area (km2)Orientation (°)Flattering
Education and Learning2.762.5121.781181.10
Food and Drink3.192.1221.21951.50
Hospital and Healthcare3.472.1423.381061.62
Professional and Others3.252.0921.38981.56
Residence3.462.3425.441051.48
Sales and Services3.372.1923.231001.54
Shopping3.332.2523.54971.48
Sports and Leisure2.841.8916.85791.50
Tourism3.292.2823.58991.44
Travel and Transport3.222.2522.81911.43
Xuhui
Major Axis (km)Minor Axis (km)Area (km2)Orientation (°)Flattering
Education and Learning3.811.7120.50222.22
Food and Drink3.411.3013.96242.62
Hospital and Healthcare3.371.5115.95262.23
Professional and Others3.181.6316.23401.95
Residence3.821.8221.83182.10
Sales and Services3.441.7819.28271.93
Shopping3.271.5515.90192.12
Sports and Leisure2.581.3010.56251.98
Tourism3.371.6417.43242.05
Travel and Transport3.841.8322.08222.10
Yangpu
Major Axis (km)Minor Axis (km)Area (km2)Orientation (°)Flattering
Education and Learning2.632.4119.911311.10
Food and Drink2.631.7814.711711.48
Hospital and Healthcare2.982.0218.951721.47
Professional and Others3.012.0219.151751.49
Residence3.171.9819.741791.60
Sales and Services2.952.0318.811691.45
Shopping2.641.7514.511741.51
Sports and Leisure2.981.7116.061771.74
Tourism2.941.9818.281721.48
Travel and Transport3.332.0421.3521.63

