Article

Analysis of Spatial Interaction between Different Food Cultures in South and North China: Practices from People’s Daily Life

1
School of Geographic Science, Nanjing Normal University, Nanjing 210023, China
2
Key laboratory of Virtual Geographic Environment, Ministry of Education, Nanjing Normal University, Nanjing 210023, China
3
State Key Laboratory Cultivation Base of Geographical Environment Evolution (Jiangsu Province), Nanjing 210023, China
*
Author to whom correspondence should be addressed.
ISPRS Int. J. Geo-Inf. 2020, 9(2), 68; https://0-doi-org.brum.beds.ac.uk/10.3390/ijgi9020068
Submission received: 19 December 2019 / Revised: 10 January 2020 / Accepted: 19 January 2020 / Published: 21 January 2020

Abstract

:
An important component of research in cultural geography involves the exploration and analysis of the laws of regional cultural differences. This topic has considerable significance in the discovery of distinctive cultures, protection of regional cultures, and in-depth understanding of cultural differences. In recent years, with the “spatial turn” of sociology, scholars have focused increasing attention to implicit spatial information in social media data, as well as the social phenomena and laws they reflect. Grasping sociocultural phenomena and their spatial distribution characteristics through texts is an important aspect. Using machine learning methods, such as the popular natural language processing (NLP) approach, this study extracts hotspot cultural elements from text data and accurately detects the spatial interaction patterns of specific cultures, as well as the characteristics of emotions toward non-native cultures. Through NLP, this study examines cultural differences among people from South and North China by analyzing 6128 answers to the question, “What are the differences between South and North China that you ever know?” posted on the Zhihu Q&A platform. Moreover, this study probes individuals’ emotions and cognition of cultural differences between South and North China in three aspects, namely, spatial interaction patterns of hotspot cultural elements, components of hotspot cultures, and emotional characteristics under the influence of cultural differences between the two regions. Results reveal that: (1) people from North and South China exhibit considerable differences in recognizing each other’s culture; (2) among numerous cultural differences, food culture is the most popular; and (3) people tend to have a negative attitude toward food cultures that differ from their own. These factors can shed light on regional cultural differences and help address cultural conflicts. In addition, this study provides effective solutions from a macro perspective, which has been challenging for new cultural geography.

Graphical Abstract

1. Introduction

Numerous novel cultural phenomena have emerged along with changes and developments in society. The study of social culture from a geographical perspective has received increasing attention from geographers. Moreover, cultural geography, as an important branch of human geography, has undergone a gradual development process. Looking back at its development, several scholars believe that it has undergone a transformation from conventional cultural geography to new cultural geography, which has become mainstream in cultural geography studies [1,2]. Others hold that “new” and “old” are two different research ideas [3]. The latter point of view informs the present study. Meanwhile, we believe that the bottom-up cultural view and the cultural meaning of daily lives and social practices, which are emphasized in new cultural geography, are of great importance to the field [4,5]. Previous studies from the perspective of new cultural geography have mostly focused on analyzing cultural phenomena at the micro level. In addition, new cultural geography seems ineffective in analyzing macro cultural phenomena. Furthermore, several scholars believe that the study of macro cultural phenomena from the perspective of geography has returned to the traditional research framework of cultural geography [2,6,7]. A primary reason for this belief is that, with respect to macro cultural phenomena, obtaining data to express meanings, values, and discourse in a specific social context on a large scale is difficult for past technologies. However, such concerns are the primary focus of new cultural geography [8,9]. In recent years, with the rise of large-data technology, a large number of new acquisition and analysis approaches have emerged for social data production, social and cultural data acquisition, and analysis. Such methods can provide infinite possibilities and opportunities for the study of new cultural geography from the macro level [7,10]. Typical social and cultural data resources include social media data from Twitter, Weibo, and Zhihu. Users’ opinions on a certain social phenomenon can be extracted from large amounts of social media data, and the attitudes of specific groups toward daily life can be analyzed [11,12]. The emergence of artificial intelligence and increasingly mature machine learning technologies, such as natural language processing (NLP), has provided additional scientific approaches for word analysis, opinion extraction, and emotional analysis based on the big data of social texts [13,14,15]. Such advancements are advantageous to macro cultural phenomenon research launched under the framework of new cultural geography.
New cultural geography stresses that culture is a product of the proactive construction of different social groups, rather than a crystallization of human civilization as identified by a few experts or elites [6,7,10]. An interesting example states that, from the perspective of cultural geography, local and cross-regional differences between South and North China are primarily reflected in the cultural differences in between. From the perspective of new cultural geography, such cultural differences originate from variations in daily life and practices, which have certain specific meanings and values. The study of how daily life constructs an individual’s experience of space and place covers several aspects, including food, language, customs, and so on [16,17]. The particularities of the diets and customs of South and North China are the precise carriers of the regions’ genuine local cultures. In crossing different regions, such as when people from the North go to the South, or vice versa, food cultures and dialects become quite prominent. Under the framework of new cultural geography, conflicts will occur between local and external cultures, thereby giving birth to a series of local experiences and labeling some places with certain cultural elements [18]. Thus, the question becomes: how can these cultural elements in daily life be sensed from the bottom to the top?
In the past, cultural geographers have effectively analyzed people’s impression of places through questionnaires and interviews [19,20]. To a certain extent, perceptions of cultural element characteristics have mainly been obtained through interviews or questionnaire data. At the same time, the theory of the cultural image was introduced to cultural geography research [21]. Image as a psychological concept was first proposed by American scholar Boulding, K.E in 1956 [22]. In 1965, the concept was introduced by Reynolds to tourism research [23]. Nearly at the same time, Kevin Lynch proposed a research method for city image [24,25], which involves people’s emotions about a city [26]. In its gradual development, city image was extended from the physical environment of a city to cultural images containing non-material elements, such as city culture [27]. The two images above belong to the same concept, which is closely related to human thinking. Moreover, they are ideas and scenarios of perceived objects in our mind. From the perspective of culture, a cultural image can be treated as a cultural symbol that represents the way people perceive the culture of things. Using survey and interview data as core materials, scholars have explored the connotation of tourism culture from the perspective of cultural image [28,29]. Several scholars have also attempted to study the genuine identity of ethnic cultures on the basis of cultural image [30]. In summary, cultural image theory has been successfully introduced into the study of cultural geography, especially in urban geography and tourism geography, which emphasize cultural characteristics.
The emergence of big data has brought new opportunities for research related to cultural image. In recent years, based on various social media data, local and international scholars have conducted numerous studies on the cultural images of cities and tourist destinations [31,32]. Social media data feature large user samples and rapid update frequencies and contain people’s emotions. Most of the contents come from the actual feelings and opinions of people from their daily life and practices. Most important, these data contain location information. In other words, topic words can be extracted from massive social media data for emotion analysis. In addition, topic words can be positioned and spatially clustered to realize the quantitative, automated, and spatialized construction of meaning maps and comprehensively sense feedback on various aspects of daily life from people from different regions. Moreover, NLP has made remarkable progress in text-based perspective extraction, topic word extraction, and in the semantic analysis of emotions [33,34,35]. Abundant samples are available for place name extraction and type recognition, which can provide data and a basis for the analysis methods in this study, and substantially promote the feasibility of the analysis.
The perception and analysis of cultural image based on information, such as social media data, comply with the research mode of new cultural geography. This research mode emphasizes bottom-up cultural meanings and value systems from people’s daily life and practices. This study adopts the geography-related topic Q&A data from Zhihu, which is the largest Q&A platform in China, as its main data source. In addition, it tries to construct the cognition of cultural differences between South and North China through text analysis, part-of-speech (POS) tagging, proper noun extraction, and topic word clustering using NLP. Finally, it performs emotion analysis under the influence of cultural differences between South and North China [36,37,38].

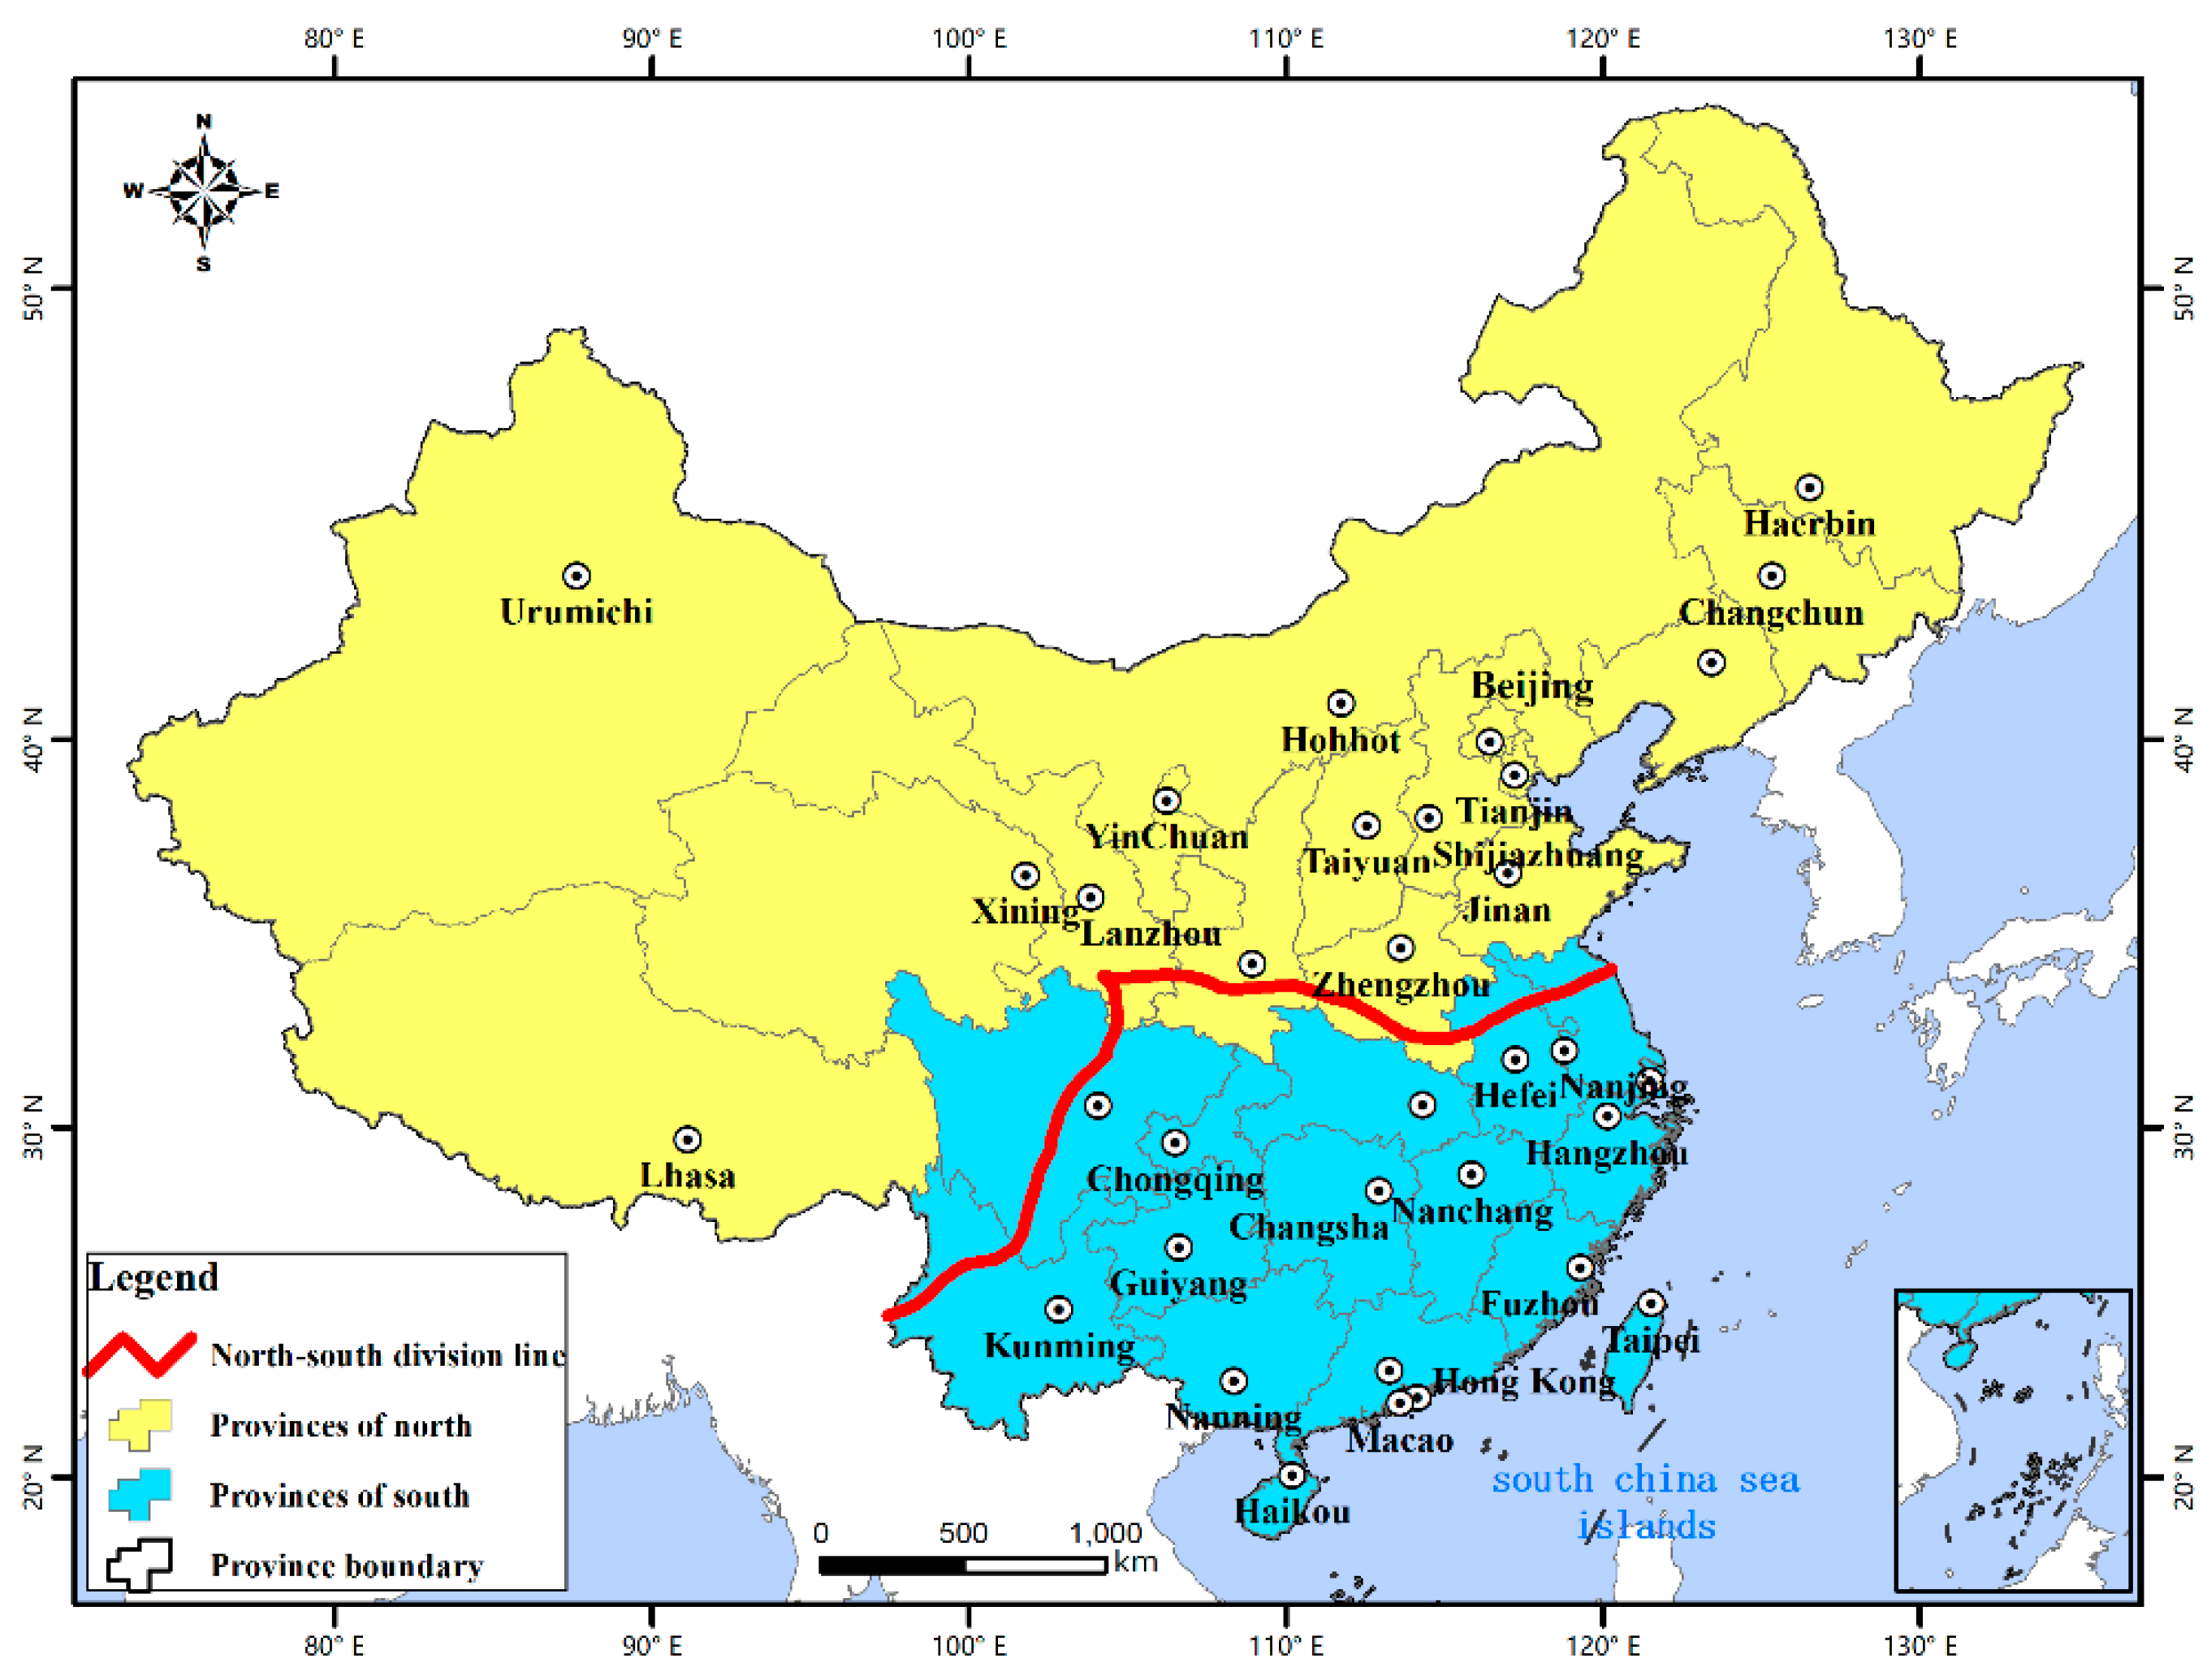
2. Study Area and Data Description
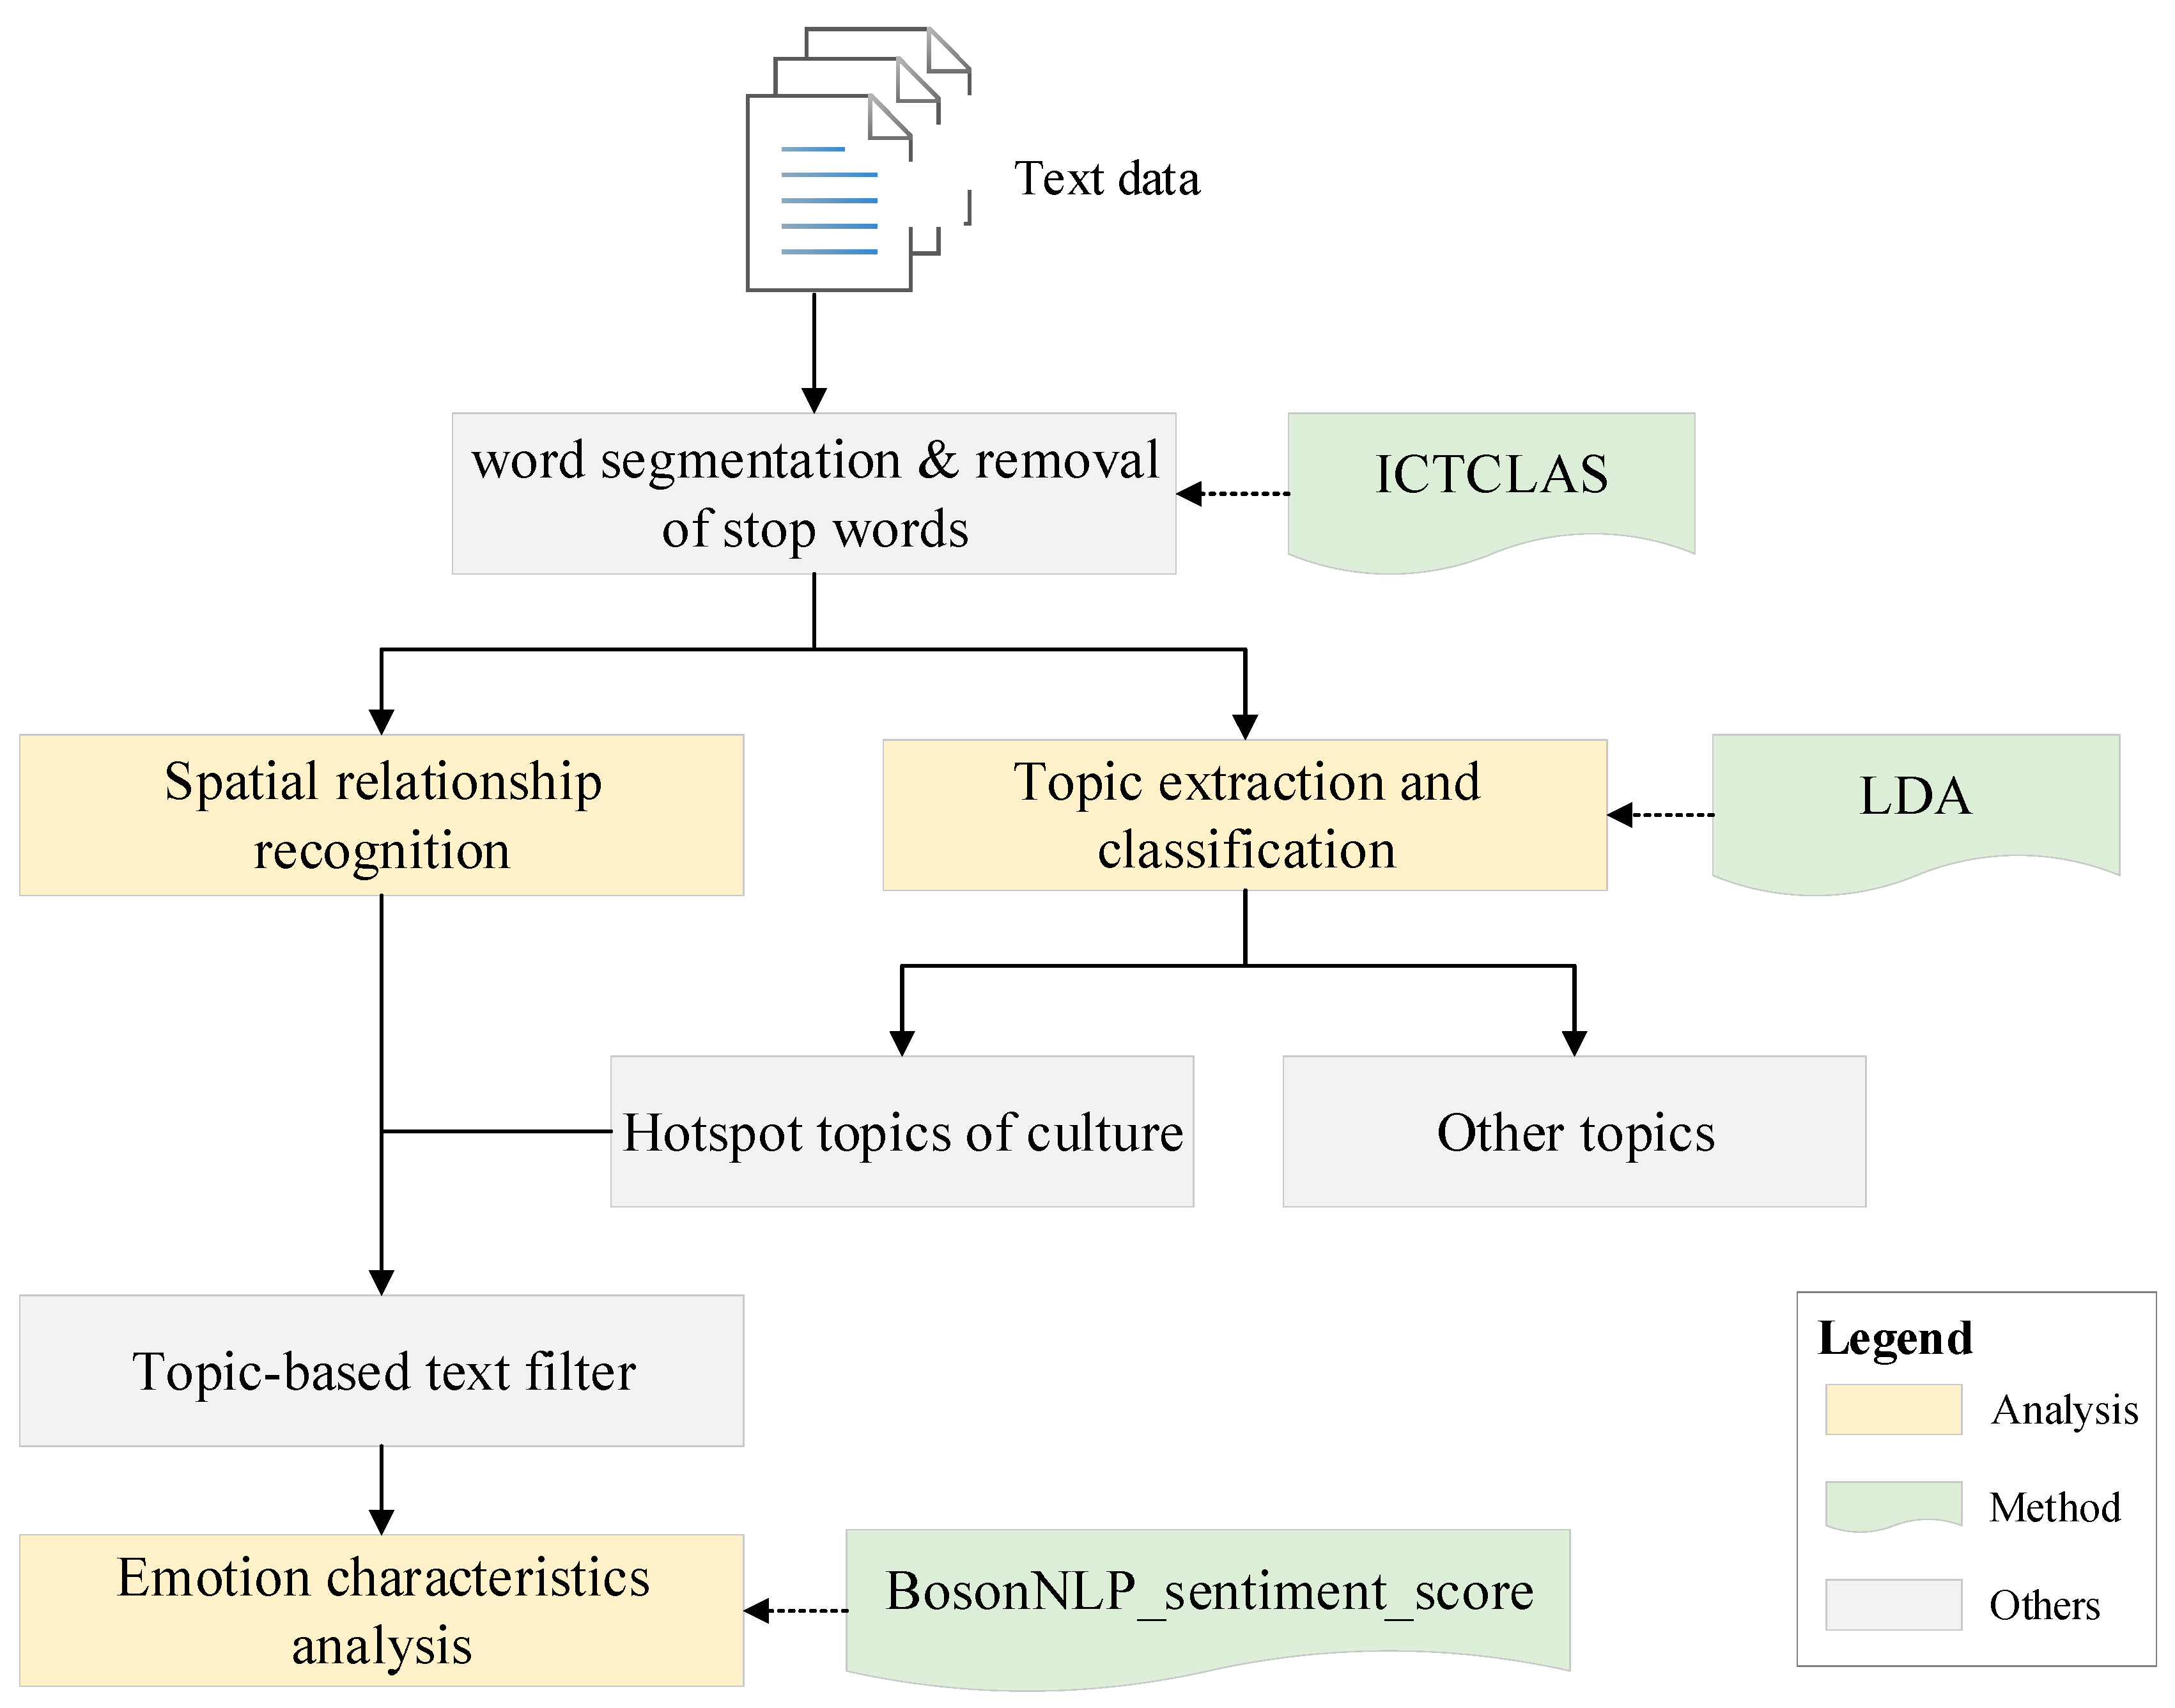
This study takes the entire territory of China as its study area, as shown in Figure 1. The core topic of the study involves the interaction of and differences in food cultures between South and North China. Thus, distinguishing the North from the South from certain geographical perspectives is necessary to avoid ambiguity regarding the concept of northern and southern regions, which may affect the analysis results. In China, a widely recognized North–South division line exists, which runs through the whole of East and West China [39,40], as indicated by the red line in Figure 1. Furthermore, the publicly recognized North–South division line is not only substantiated and recognized objectively by geographers, but also topically widely accepted by the people [41,42].
The research data of this study are drawn from 7212 answers to a popular question on Zhihu that asks, “What are the differences between South and North China that you ever know?” Zhihu is currently the largest knowledge-based Q&A community in China. According to the official statistics as of September 2017, Zhihu had more than 100 million registered users and 26 million active daily users. Data collection was performed in February 2018. Several answers had been hidden in the site owing to violations of relevant provisions. Thus, the actual number of answers used in this study is 6128, which accounts for 93.23% of the total number of comments.

3. Methodology

This paper includes three main parts, that is, topic data analysis and statistics, spatial modeling analysis of the cultural topic data, and organization of the geoscience information map method and its visualized expression. Topic data analysis and statistics mainly covered unsupervised word segmentation, word statistics, corpus training, word classification and statistics, and so on. Spatial modeling and analysis of the cultural topic data primarily involved statistical data analysis through spatial analysis and modeling to explore spatial distribution characteristics and laws. Finally, cognition hotspots of southern and northern cultures, as well as hotspot cultural elements are visualized using a geoscience information map. In addition, emotional analysis was performed on words using NLP. The specific workflow of data processing and analysis is shown in Figure 2.

3.1. Text Preprocessing

In terms of preprocessing, this study mainly introduces regionalization from two aspects, that is, Chinese word segmentation techniques and the removal of stop words. Most of the replies and comments in Zhihu are in Chinese. Words are the smallest meaningful units of speech. In contrast to English, which uses space as a natural delimiter, Chinese takes characters as basic units without distinguishing marks between words. Thus, word segmentation is fundamental and essential in Chinese for emotion analysis. Mature Chinese word segmentation systems include the Institute of Computing Technology, Chinese Lexical Analysis System (ICTCLAS) by the Chinese Academy of Sciences, the Information Retrieval Laboratory Lexical Analysis System (IRLAS), which was developed by Harbin Institute of Technology, and the Simple Chinese Words Segmentation (SCWS), which was developed based on C language. This study adopts the ICTCLA, which was developed by the Chinese Academy of Sciences [43]. This system includes the following four features: (1) using cascading Hidden Markov Model(HMM), the ICTCLAS places Chinese lexical analysis into a unified framework, which can improve word segmentation accuracy; (2) it supports multithreaded calls, which can improve the speed of word segmentation; (3) the system can recognize not only simplified and traditional Chinese but also English words and symbols; and (4) it allows users to add a customized dictionary of emotions to the word segmentation dictionary to increase performance stability.
Stop words, also known as function words, are a class of words that have no actual meaning. In this study, in the semantic analysis of Zhihu’s comment texts, stop words refer to form words, prepositions, pronouns, and other irrelevant characters, with high or low appearances in the text. Take frequent words such as “#,” “@,” and “http://” in the Zhihu text as an example. Such words have no practical meaning and are irrelevant to the analysis of emotions. Therefore, filtering stop words before text analysis is necessary.

3.2. Spatial Interaction Patterns among Different Cultures

3.2.1. Place Name Relation Inference

In the text data, several users use the names of prefecture-level cities to indicate location, while others use province and regional names (e.g., Northeast, Northwest, and so on), which is unavoidable. To solve this problem, this paper uses prefecture-level cities as the basic analysis unit in designing rules for NLP. However, when place names appear as provinces, we use provincial capital cities to indicate the provinces where the prefecture-level cities are located. When place names appear, we use the center (center of gravity) of an area to represent them. When multiple place names with inclusive relationships appear simultaneously, we chose the lowest level to represent them. Place names in China are divided into three levels. Level 1 indicates regions (e.g., northwest and southeast regions or Jiangsu, Zhejiang, and Shanghai regions); level 2 denotes provinces (e.g., Jiangsu and Anhui); and level 3 represents cities (e.g., Nanjing, Chongqing, and Guilin). These levels are used as our place name pool. However, when discussing South–North differences, the text may involve a large number of place names, and the relationships among the place names are complicated. The complex relationships among multiple place names make reasoning extremely challenging. By analyzing a large amount of Zhihu text, we observed two main relationships among place names, namely, inclusion and parallel relations. Next, taking the actual text content of Zhihu as an example, this study briefly explains the relationship among place names. For example, Heilongjiang, Northeast, and the North in Table 1 are inclusion relations, while Beijing, Xi’an, Suzhou, Nanjing, and Xiamen in Table 2 belong to parallel relations.

3.2.2. Classification of Hot Cultural Topics

Topic classification can effectively detect hidden information behind massive texts and has considerable significance for text information detection, such as topic detection and text classification. Latent Dirichlet allocation (LDA) is a document topic model that includes three levels, namely, document, topic, and word. The model can identify latent topic information in large document sets or corpus using unsupervised machine learning techniques [44,45]. The main idea involves treating each document as a mixed distribution of topics and each topic as a probability distribution of words. The process of generating a text using the LDA model is as follows:
(1)
Sampling is performed on the Dirichlet distribution, whose hyperparameter is α, to generate topic distribution θ i of document d i .
(2)
The following three operations are performed for each word in d i . First, sampling is performed on multinomial distribution θ i , representing topics, to generate its corresponding topic Z i j . Second, sampling is performed on the Dirichlet distribution, whose hyperparameter is β , to generate topic Z i j ’s corresponding to word distribution Ψ Z i j . Third, sampling is performed on multinomial distribution Ψ Z i j , representing words, to generate word W i j .
This study uses a topic class identified by LDA as the input of the emotion analysis of Zhihu users and employs a topic coherence index to evaluate the topic quality of the LDA modeling [46]. Topic coherence obtains a topic score by calculating semantic similarities among high-score words in a topic, specifically, c o h e r e n c e ( V ) = ( v i , v j ) V s c o r e ( v i , v j , ϵ ) , where V is a set of words describing a topic, and ϵ is a smoothing factor to ensure that the returned score is a real number. In addition, this study employs the UMasstopic coherence evaluation method proposed by Mimno et al. to evaluate topic quality [47]. The equation of the UMass score is s c o r e ( v i , v j , ϵ ) = l o g D ( v i , v j ) + ϵ D ( v j ) (2), where D ( v i , v j ) is the total number of Weibo texts containing words vi and vj, and D(vj) is the total number of Weibo texts containing word v j . This study uses the topic coherence score to determine the most appropriate number of topics [46].
After processing and analysis using the LDA model, we find that differences between the North and South mainly include staple foods, snacks, salutations, tastes, clothing, accents, the weather, festivals, and so on. Moreover, several topics, such as staple foods, can be merged. Meanwhile, snacks, tastes, and so on can be combined as diet, and so on. This study divides relevant topics into 15 categories, such as location, geographical object, place name, animal, dialect, costume, climate, emotion, body parts, body characteristics, living habit, time, diet, and plants, as shown in Table 3.

3.2.3. Emotion Analysis

After a topic is created in Zhihu by a forum administrator, only netizens interested in the topic will respond or write a comment. Hence, most of the responses and comments are related to the topic. Correctly extracting sentiment words in the evaluation is key to emotion analysis. The dictionary method is one of the most important techniques for emotion analysis. The basic idea involves using sentences as research units, separately performing emotion analysis on each sentence of an article, then summarizing and analyzing all sentiment words to determine whether or not the emotion in the article is positive. If the positive sentiments outweigh the negative sentiments, then the comment is classified as positive; otherwise, it is negative. To enhance the accuracy of the results, we score the words in the dictionary. Scores for positive sentiments, such as, like, good, willing to try, agree with, and so on, are set as positive values. Scores for negative sentiments, such as dislike, tastes awful, hard to understand, horrified, oppose, and so on, are set as negative values. The value of words showing a neutral attitude, such as neutral, does not care, not interested, and so on, is set to zero. In addition, different words show different sentiment intensities, and the stronger the sentiment, the greater the absolute value.
In the dictionary method, the selection of sentiment words and identification of new words are the most important factors. To improve analysis accuracy, this study adopts the BosonNLP_sentiment_score, in which each entry consists of a word and a score [48]. The words and scores are derived from millions of sentiment annotated data from data sources, such as Weibo, the news, forums, and so on, and a wide range of non-standardized terms have been recorded, such as new online words. Negative words and degree adverbs are combined for sentiment semantic analysis and comprehensive scoring. A positive score indicates positive emotions, while a negative score indicates negative emotions. A score of 0 indicates neutral emotions. After sentiment scores on Zhihu on comments regarding food and cultural differences between North and South China are obtained, we can get a quadruplet consisting of origin, destination, food, and score. Origin represents a person’s hometown, while destination indicates a place that a person is commenting on. Food is the object of the evaluation, while score denotes the score of the corresponding sentiment.

4. Results

The analysis results include three main parts, namely, the spatial distribution patterns of cultural interactions between the North and South, hot cultural topics, and analysis of the emotional characteristics of cultural food differences between the North and South. The first part mainly analyzes areas of concern mentioned by people. The second part extracts topic words using NLP, determines topics based on high-frequency topic words, and selects elements related to culture as hot cultural characteristics. Analysis of emotional characteristics involves classification and analysis of sentiment-related topic words. Finally, the emotion polarity category of each word is analyzed to quantitatively examine the degree of influence (positive and negative) of North–South cultural differences on people.

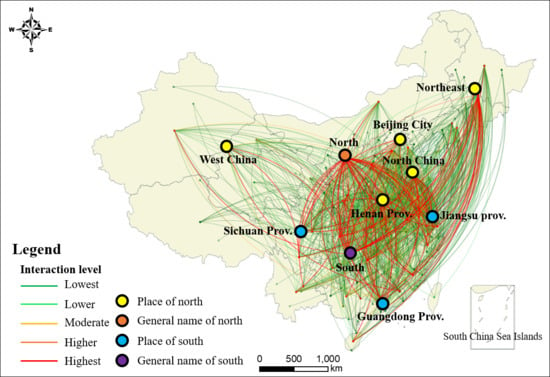
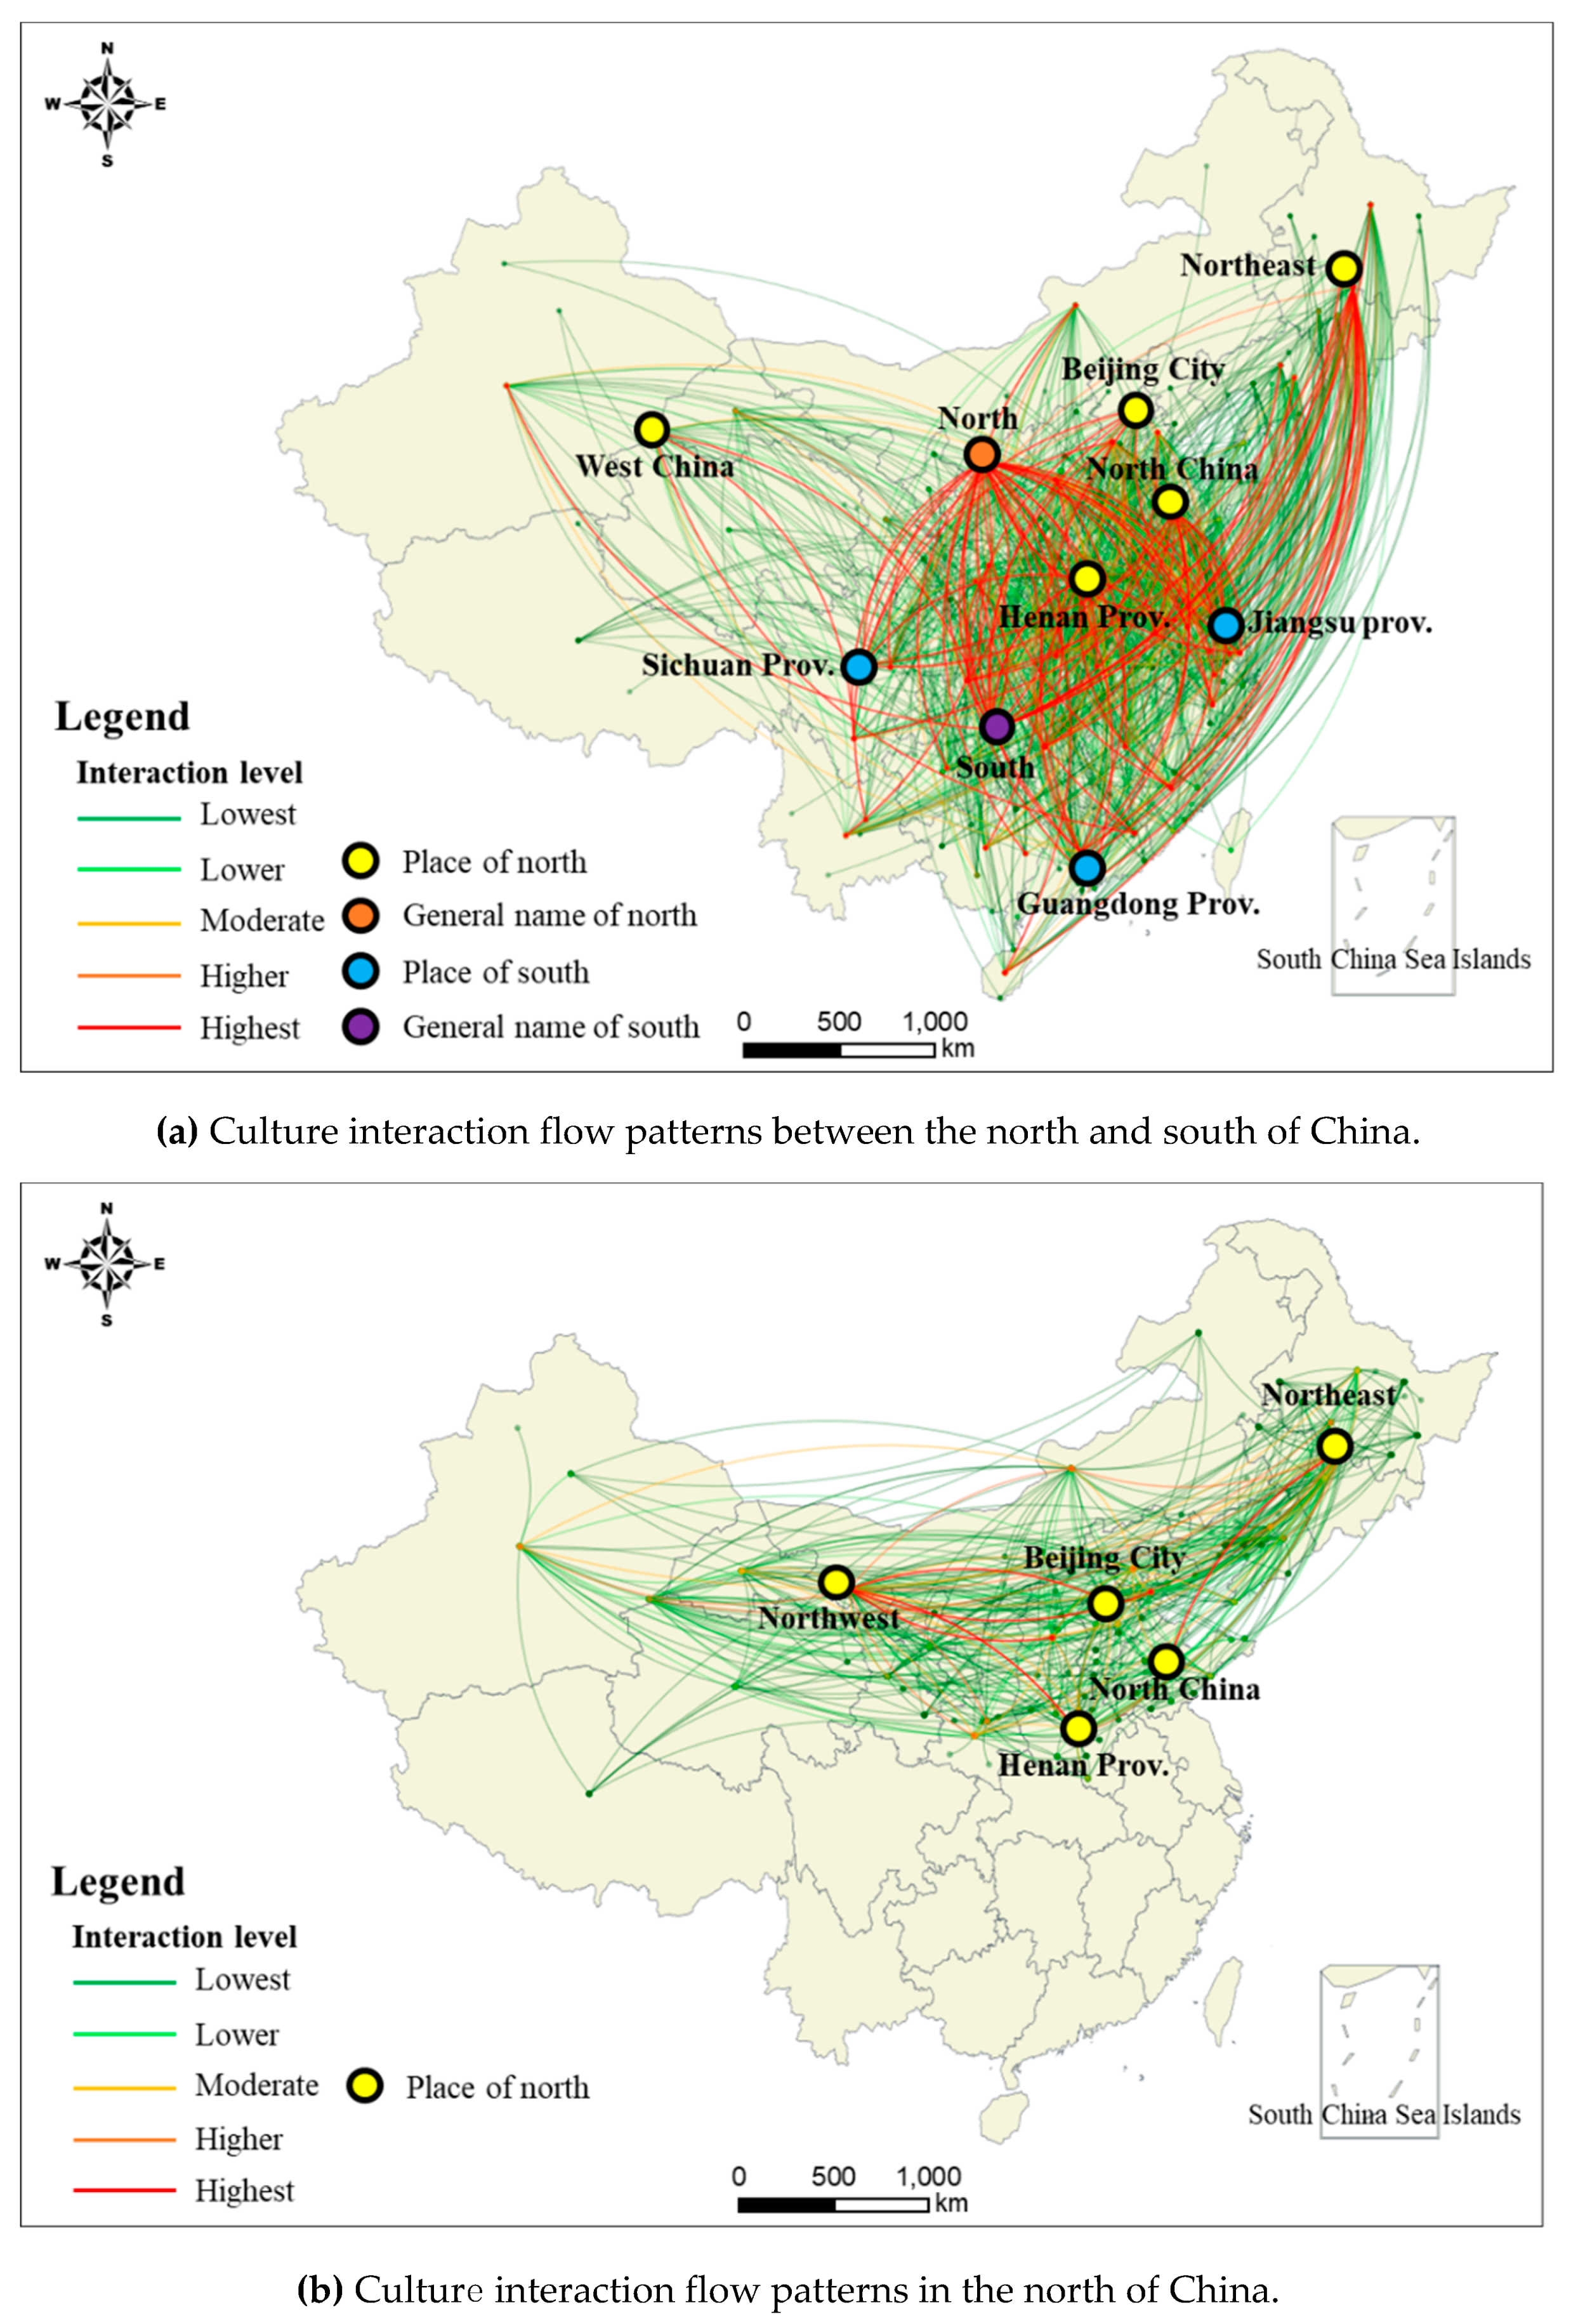
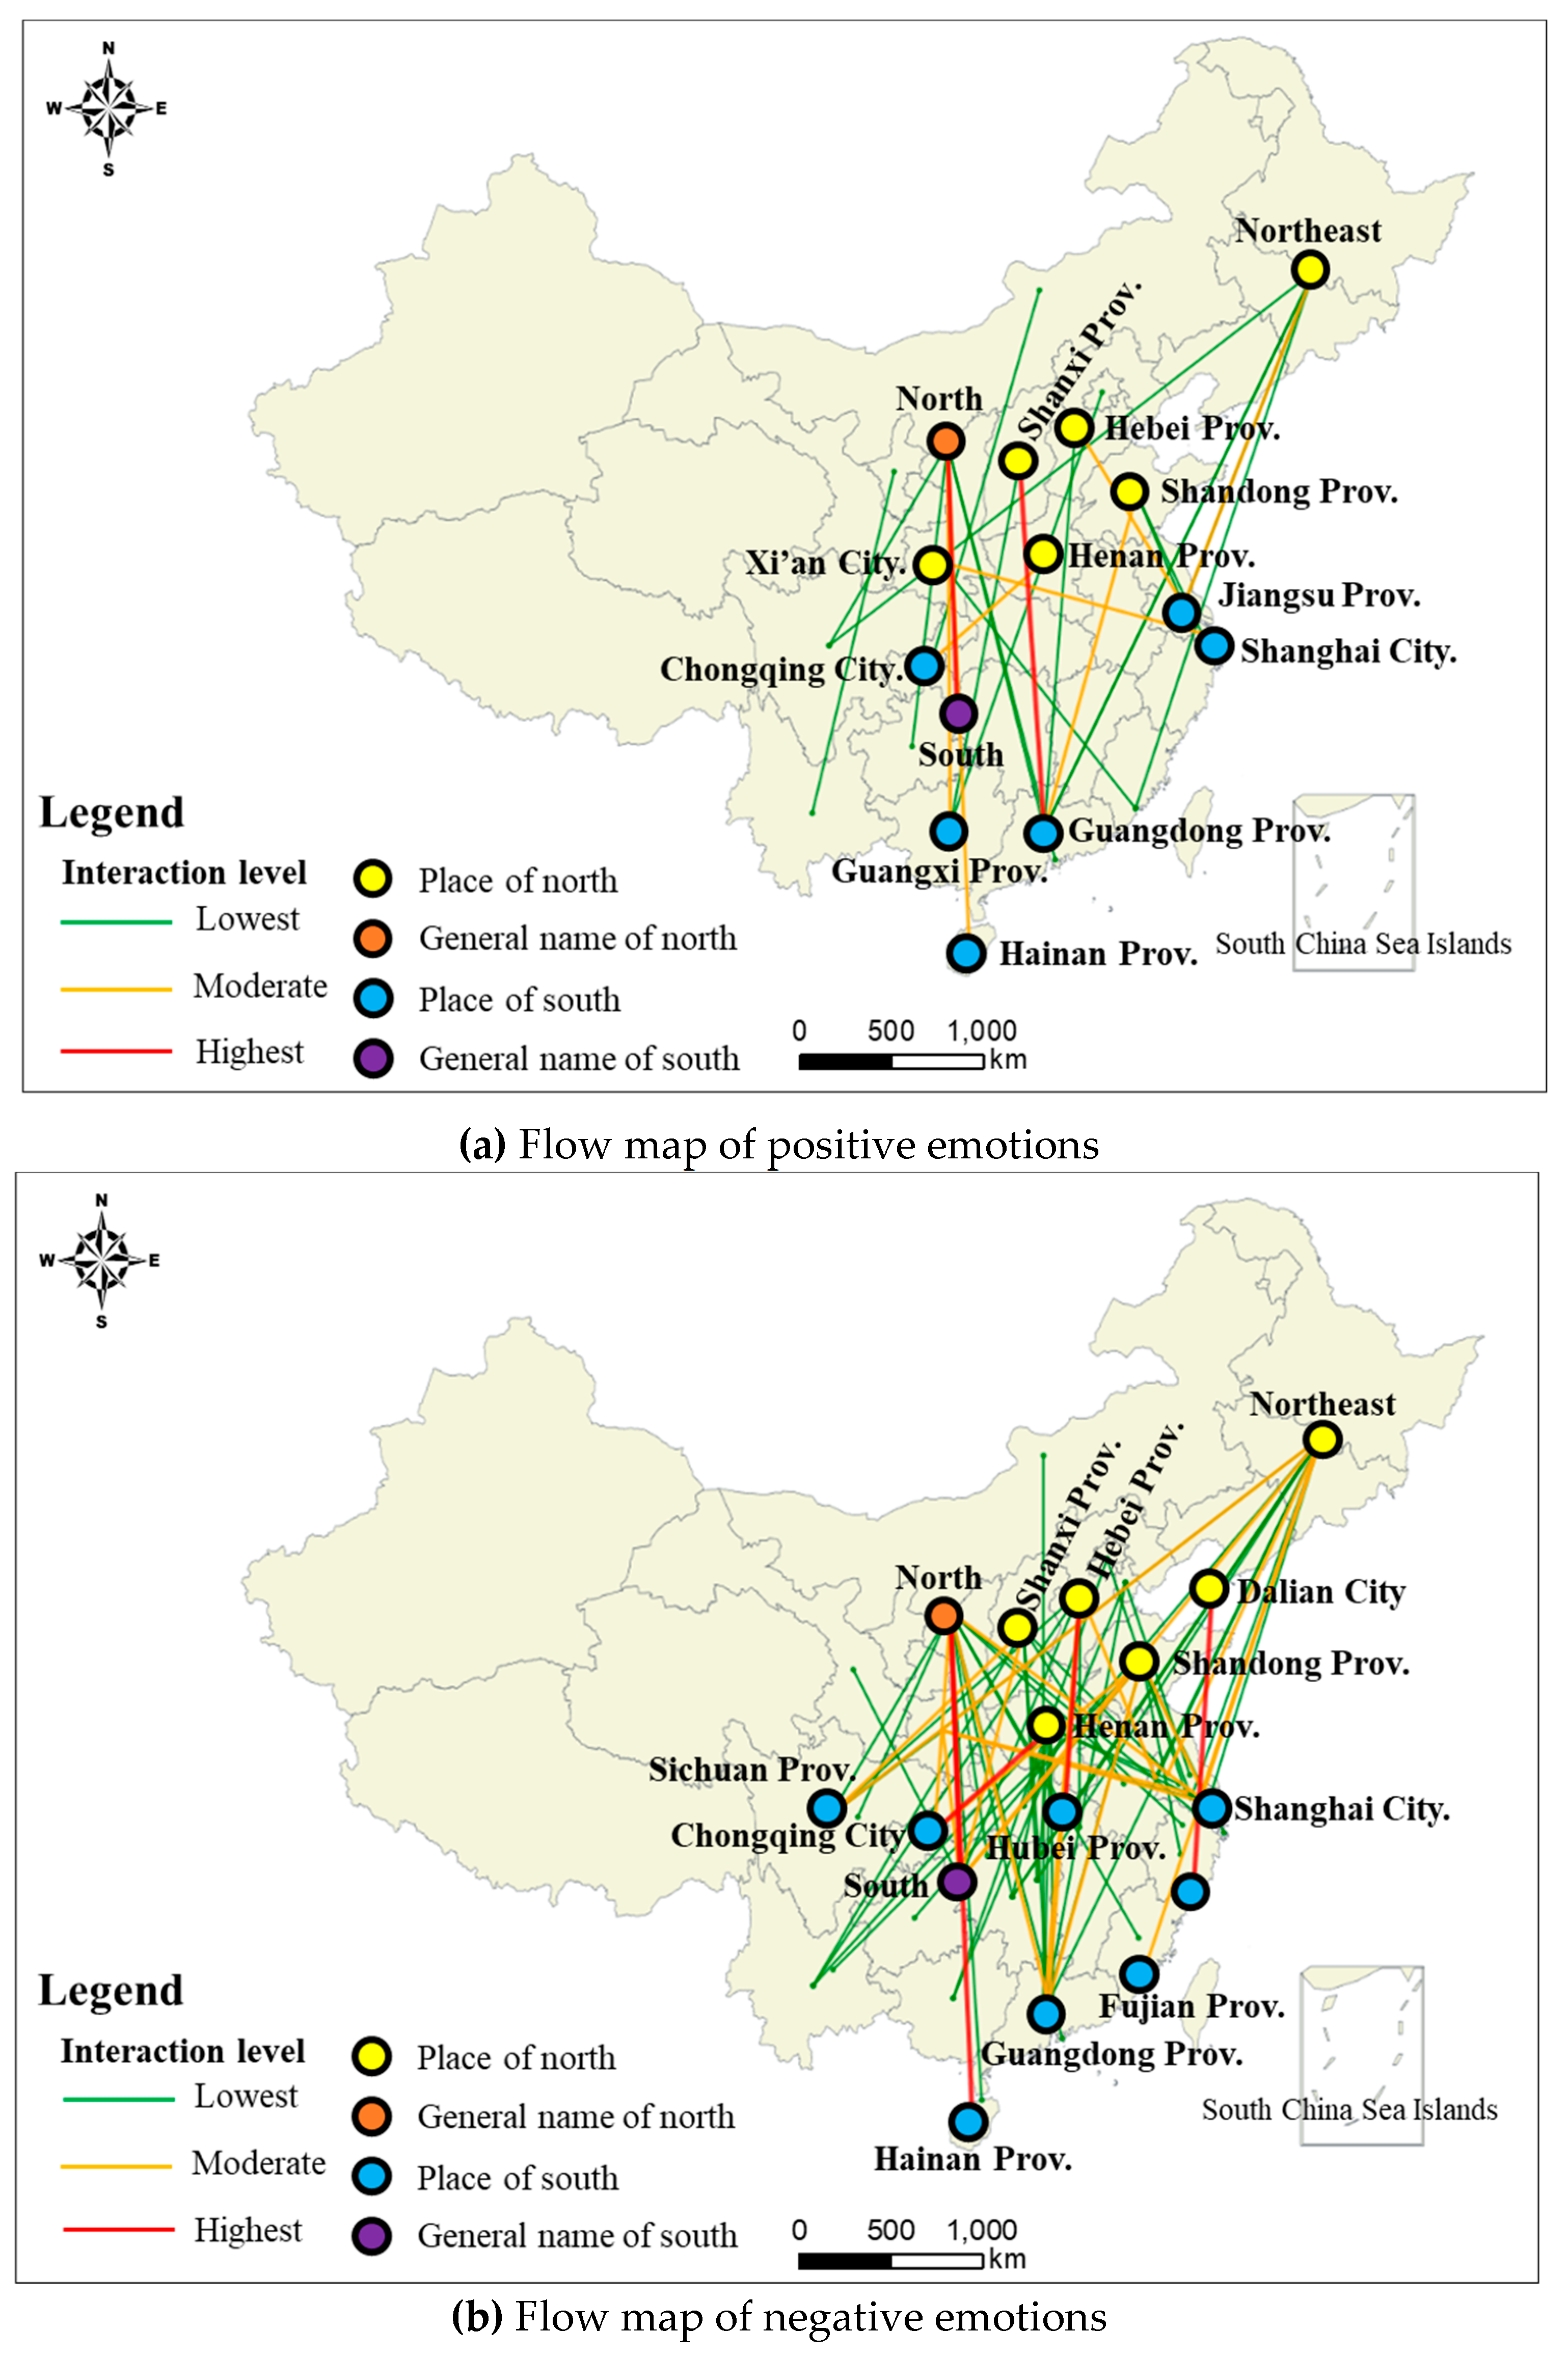
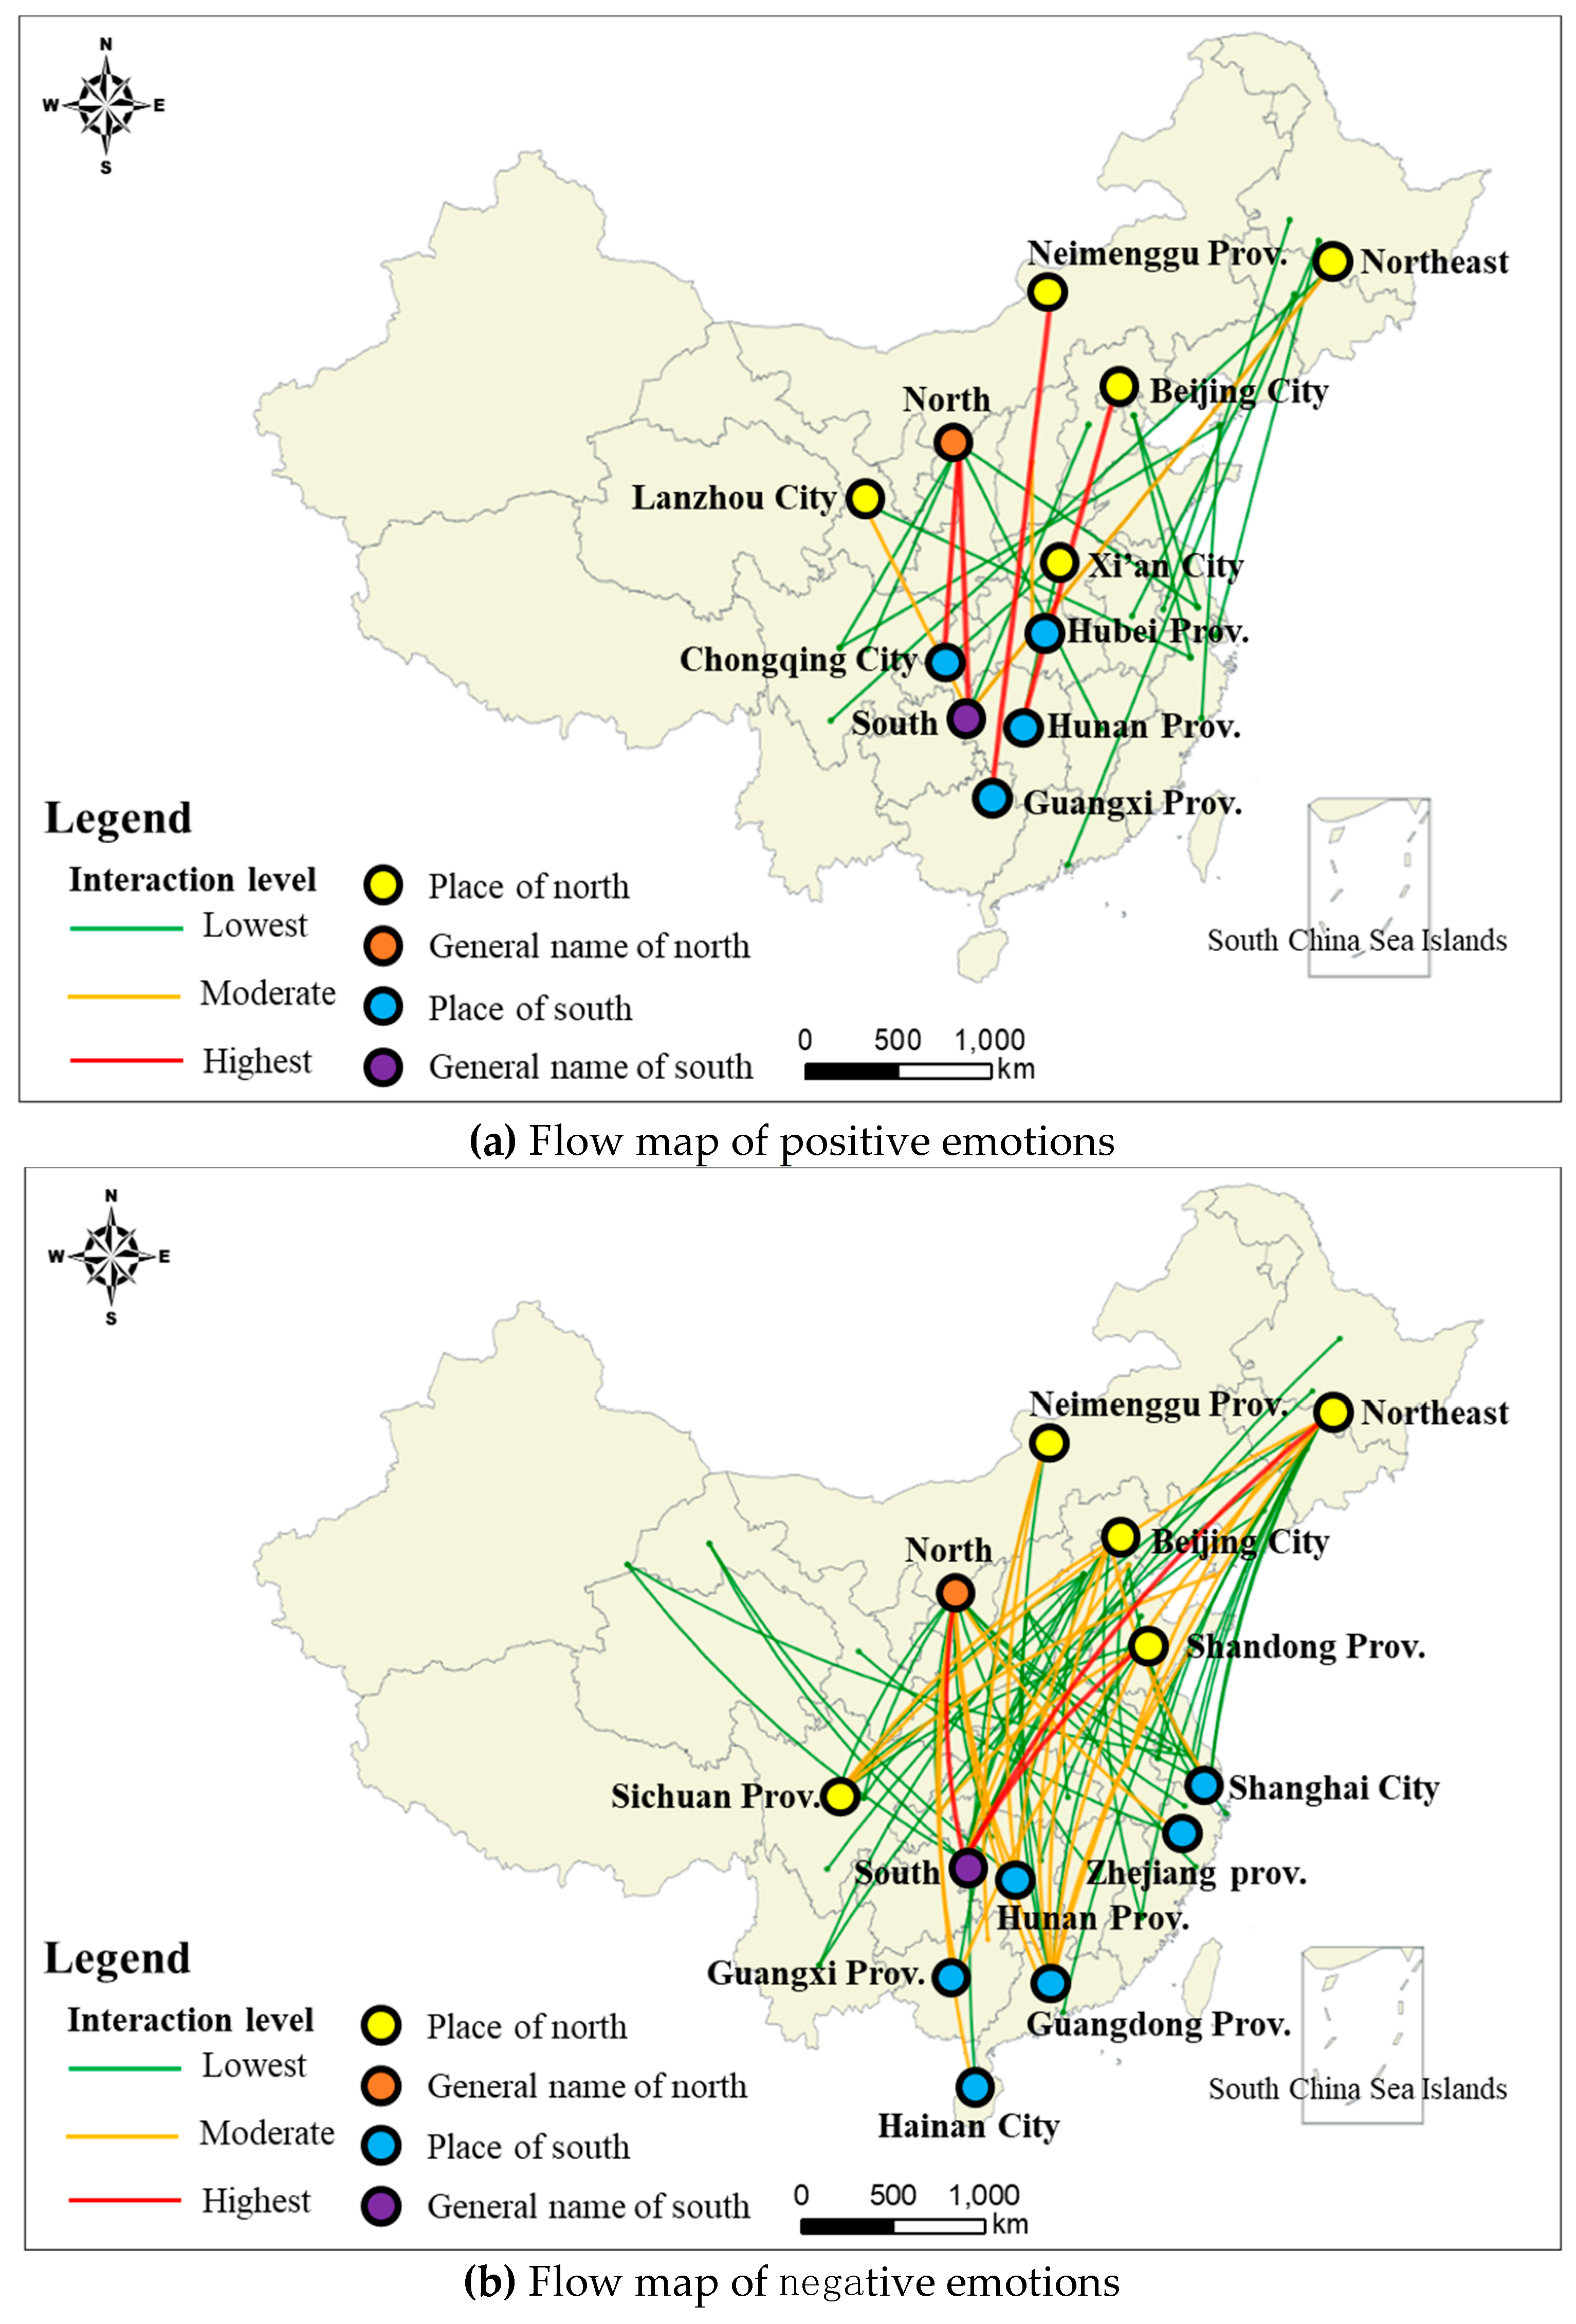
4.1. Spatial Distribution Patterns of Cultural Interactions between North and South

Analysis reveals that the cultural concept of the South-North division line is not fixed. This line can be an objective North–South division line, which had been proposed by Chinese geographers and widely accepted by the people, and a subjective division line. For example, Guangdong and Jiangsu belong to South China. However, a few Cantonese believe that they are the real southerners and thus consider Jiangsu as belonging to North China. Another example involves people from the northwest, who believe that Shandong, which is located in North China, belongs to South China. Thus, in terms of cultural interactions between the South and North and their hotspot flow patterns, this study performs analysis from objective and subjective aspects. Objectively, the analysis focuses primarily on detecting cultural interaction hotspot flow patterns in areas on both sides of the division line, as shown in Figure 3a. Subjectively, the analysis focuses on internal hotspot flow patterns on both sides of the division line, as shown in Figure 3b,c.
Figure 3a shows five hot cultural interaction zones in the North, namely, Beijing at the city level, Henan at the provincial level, and North, Northwest, and Northeast China at the regional levels. In addition, the figure shows four hot zones in the South, namely, Jiangsu, Sichuan, and Guangdong at the provincial level and South China at the regional level. An interesting grading and hotspot detection finding is that most of the hotspot zones in the North are at the regional level while those in the South are mostly at the provincial level. Further investigation on the patterns between hotspot zones in the North and South reveals several interesting laws. Two primary interaction patterns are found, namely, discrete interaction flow and aggregated interaction flow patterns. A few people answered the question by directly using general South and North terms to describe the differences between the two regions. However, the flow patterns they formed differ. For example, as shown in Figure 3a, the orange hotspot, which represents the North, forms a relatively discrete hotspot interaction flow pattern with the South. However, the purple hotspot, which represents the South, forms an aggregated flow pattern with the North. Other hotspots include the Southeast in the North forming aggregated flow patterns with Guangdong in the South, while Guangdong forms several patterns with other spots in the North.
Compared to Figure 3a, which indicates objective South–North differences and their cultural interaction hotspot flow patterns Figure 3b,c show subjective differences and cultural interaction hotspot flow patterns. Figure 3b demonstrates interaction flow patterns among regions north of the division line. Figure 3c shows interaction flow patterns among regions south of the division line. Meanwhile, Figure 3b shows that the Northeast, which belongs to the North, forms a strong interaction flow pattern with North China’s interaction flow pattern. Additionally, the Northwest forms a strong interaction pattern with North China and Henan. Compared with Figure 3b, more hotspot zones are formed in Figure 3c. Moreover, among strong hotspot interaction flow patterns, Guangdong has formed a strong hotspot flow pattern with nearly all the other hotspot zones, which is consistent with the view of Canton that, except for Guangdong, all the regions belong to the North.

4.2. Hotspot Cultural Topics

A total of 16 topic categories is obtained using NLP for topic word extraction. The type number, topic category, word example, and ratio of the number of topic words to the total number of topic words in each topic are shown in Table 3. Several of the topic categories are strongly related to culture, such as diet, dialect, and so on. However, a few are less relevant to culture, such as climate, plants, and so on. Next, the study briefly discusses certain topics with high frequencies. Table 3 suggests that diet-related topics strongly associated with culture account for 37% of the total topic words. Apparently, people are most concerned with differences in food culture between the South and North that they profoundly experience in daily life. The topic with the second most topic words is place names, which partly reflects that conversations on diet are related to geography. The high frequency of emotion words indicates that people tend to express their attitude when talking about differences between the South and North. In addition, the numerous topics on lifestyle, climate, and environment mean that people are concerned with differences in such topics in between the South and North. The frequency of animal-related topics is higher than that related to plants, which may be because people interact more with animals, thereby leading to deeper impressions.

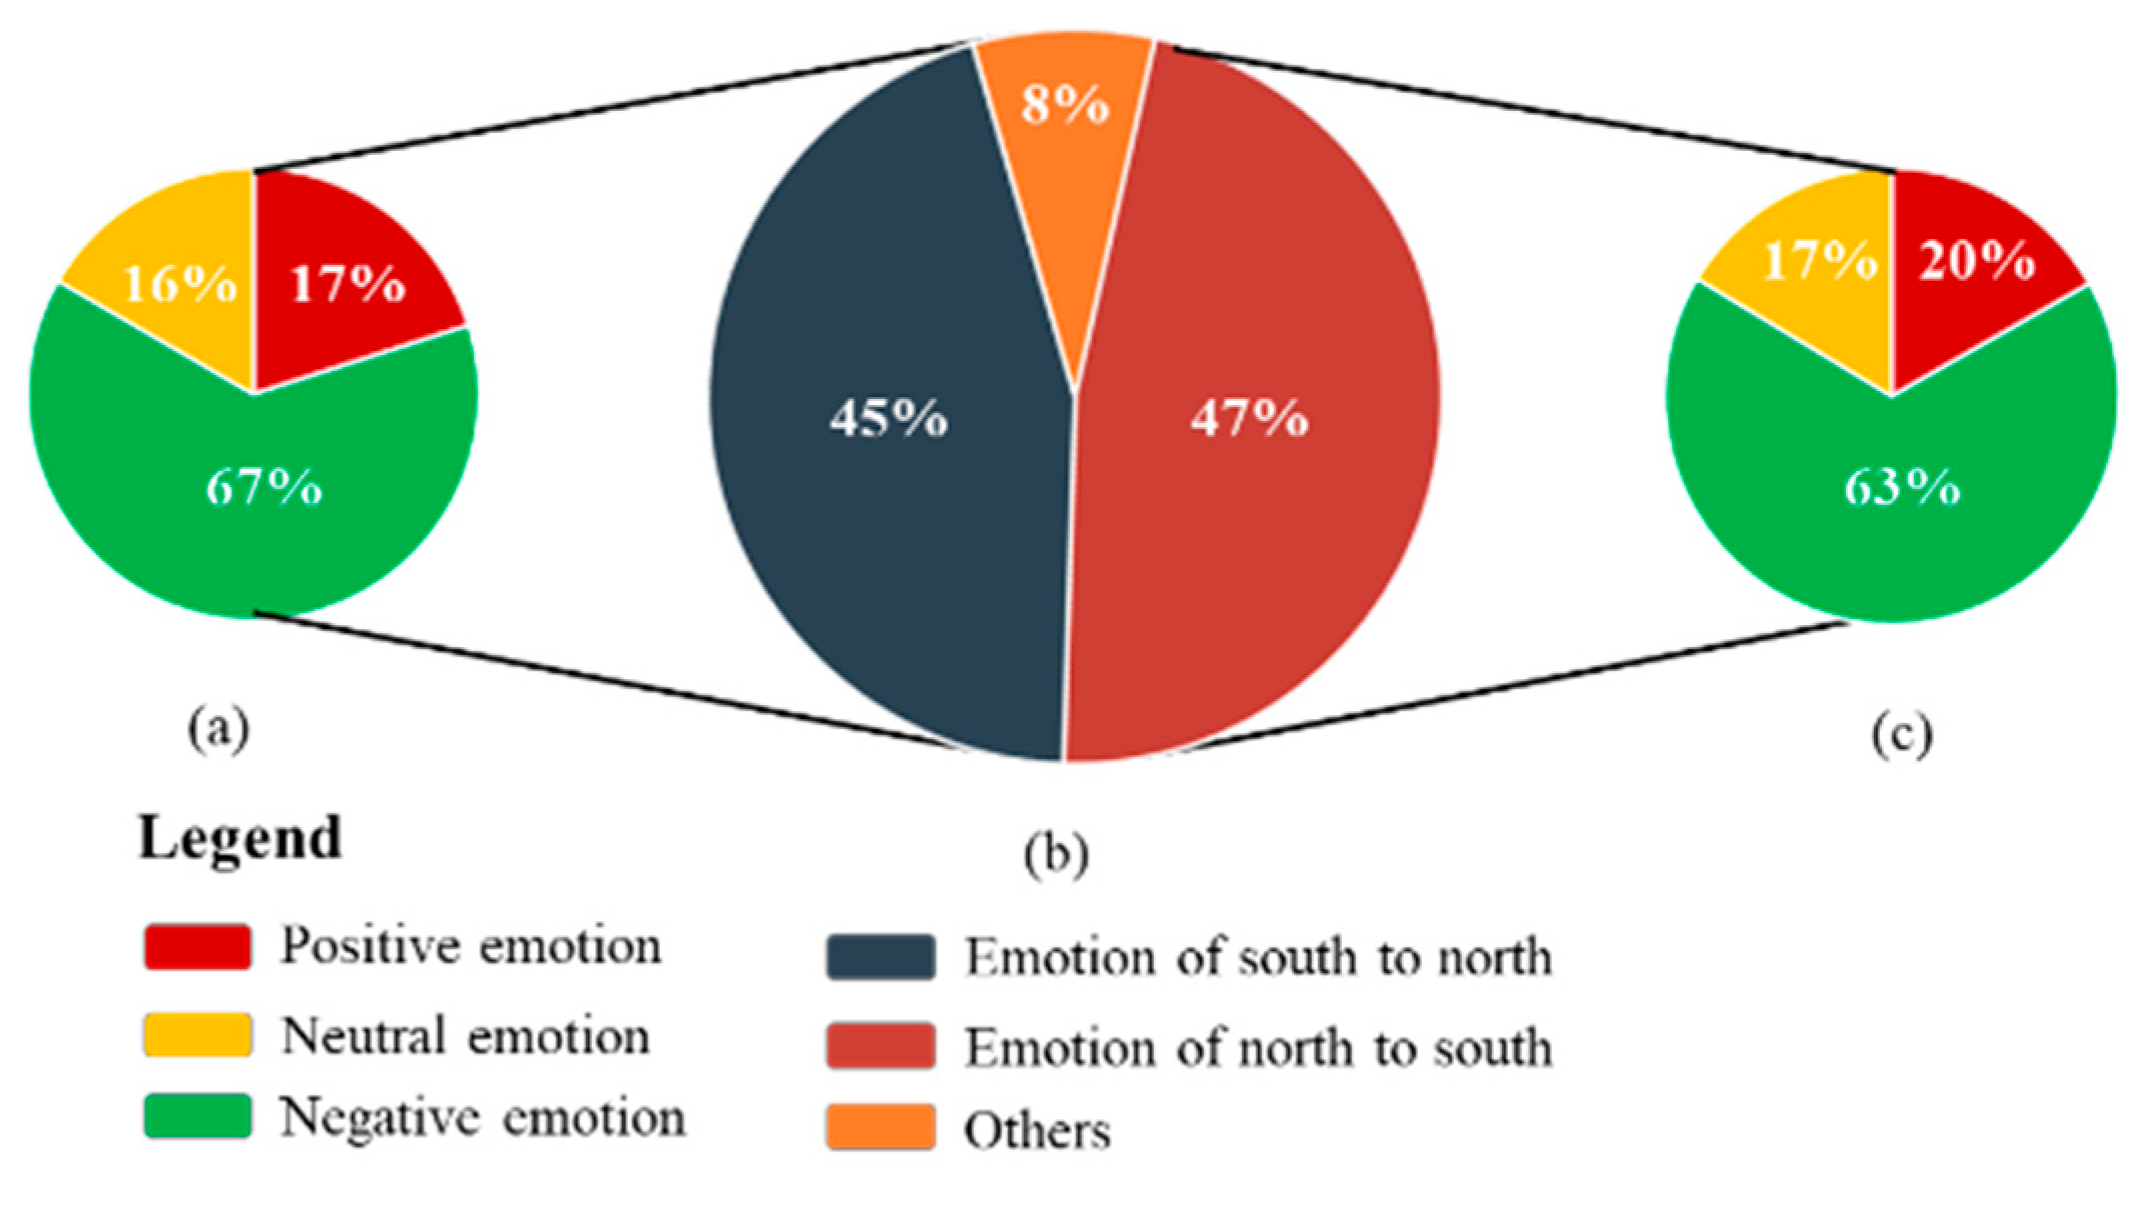
4.3. Analysis of Emotional Characteristics Based on Cultural Food Differences between North and South

We examine whether the attitude of people from the South to the food culture of the North, or vice versa, or the attitude of people from the North and South toward their own food cultures will show positive, negative, or neutral emotions. According to the analysis in the previous section, cultural food differences between the North and South are the most popular topics. Thus, we mainly analyzed emotional characteristics under the influence of cultural food differences between the South and North, and the results are shown in Figure 4 We mainly analyzed southerners’ attitudes toward the food culture of the North, northerners’ attitudes toward the food culture of the South, and the attitudes of people from the South and North toward their own food cultures (marked as “Others” in the Figure 4). The percentages are shown in Figure 4b, which illustrates that people from the North and South have limited discussions about their own food cultures, thereby accounting for only 8% of the total results. The extraction results of the other two types are analyzed here. Figure 4a,c are the ratio diagrams of southerner’s emotions to the food culture of the North and northerner’s emotions to the food culture of the South, respectively Figure 4a suggests that most southerners show negative emotions toward the food culture of the North, thereby accounting for approximately 67%. Positive and neutral emotions account for similar small percentages, which are 17% and 16%, respectively. The percentages of the three emotions of northerners toward the food culture of the South, as shown in Figure 4c, are similar to those in Figure 4a, thereby indicating that people tend to show resistance when encountering a food culture that differs from their own.
The above analysis shows only emotional characteristics under the influence of cultural food differences, but cannot detect the spatial distribution patterns and relationships of various emotions. Thus, we tried to construct an emotion flow map to reveal the spatial distribution and spatial interaction patterns of different types of emotions through spatial visualization. Figure 5 and Figure 6 show the spatial distribution and interaction patterns of the three emotions of southerners toward the food culture of the North and those of northerners toward the food culture of the South, respectively. Each emotion flow map consists of several emotion flows, which in turn consist of three elements, including the origin region node of the flow, the destination region node of the flow, and the connecting line between the flows. The color of the line indicates the strength of the emotion flow. When referring to the South and North, some people adopted the names of cities, while others used the names of provinces. However, more people directly refered to the regional names of the South and North. In Figure 5, yellow indicates a province or city in the North, while blue indicates a province or city in the South. Orange is the general term of the entire zone, which is located in the center of the North, while purple is the general term of the South, which is likewise located in the center of the entire region. Numerous people used “North” and “South” when referring to the regions in each emotion flow map, and the flow patterns between the North and South were strong.
Figure 5a shows that Shanxi people exhibit strong positive emotions toward the food of Guangdong, and other strong positive emotions include Shaanxi’s emotions toward Jiangsu, Xi’an’s emotions toward Jiangsu, and so on. Figure 5b demonstrates that, compared with the positive emotions in Figure 5a, its coverage is broader. Moreover, compared with the rest of the North, the Northeast shows more negative emotions toward the food of the South, and many northern regions show negative emotions toward the food of Guangdong and Shanghai. Compared with Figure 5a,b, few northerners have a neutral attitude toward the food culture of the South, as shown in Figure 5c. Overall, regardless of whether positive or negative emotions are involved, in terms of food culture, Guangdong is the most prominent province, which not only has strong flow patterns but also a wide influence on the North.
Apart from the strong positive emotion flows between general South and North regions, Figure 6a exhibits other pronounced positive emotions shown by the hinterland areas of the South, namely, central southern areas, such as Hunan and Hubei, toward the food culture of the North. By contrast, only a few discussions exist on southerners’ positive attitudes toward the food culture of the Northwest. Discussions on the Northeast also mainly focused on the Yangtze River Delta, which is near the region. Compared with Figure 6a, southern regions that show negative emotions toward the food culture of the North are mainly coastal regions, such as Shanghai, Zhejiang, Guangdong, and Hainan. A comparison between Figure 6a,b shows that, regardless of whether positive or negative attitudes are involved, discussions were mainly about the Northeast, the Inner Mongolia Autonomous Region, and Beijing. The main reason for such a pattern in Beijing and the Northeast is the large number of colleges and universities and their developed economy [49,50]. By contrast, Inner Mongolia trails behind in terms of colleges and universities and the economy. However, as Inner Mongolia is a tourist destination with distinctive ethnic characteristics and amazing grassland landscapes, such a pattern is formed. Figure 6c indicates that, except for the emotional flow patterns between the regions generally referred to as the South and North, Guangdong’s neutral attitude flow toward the Northeast is strong.

5. Discussion and Conclusion

5.1. Discussion

5.1.1. Fuzziness of Place Name Symbols

Although this study can extract place names easily from the text data, the diversity and inaccuracy of the expressions employed by the users may lead to several deviations in terms of the scale of extracted place names. For example, Guangzhou might be called Guangdong Province, South China, Cantonese, and so on. In addition, extracting place names in various forms completely and correctly is difficult for the current NLP. These two factors result in the certain fuzziness of place name symbols extracted in this study. For instance, in describing differences between the South and North, a user from Shenyang (city) may use different expressions to refer to his/her residence, such as Shenyang (city), Liaoning (province), Northeast China, or even the North. These variations may lead to the multiscale issue of polysemy for the same place names. In this study, specific place names were employed to be consistent with the most specific place name symbol used by the respondents. Specifically, the processing strategy presented in Section 3.2 was designed to solve this problem. In addition, several nouns that are not place names may also be used to refer to a certain area. For example, Canton refers to Guangdong. These words also appear as pronouns of place names in the text data. If these words are not in the corpus as a place name, then they will be omitted and missed, thereby reducing the accuracy of the analysis results.

5.1.2. Precision of Semantic Parsing

A few texts occasionally compared a place from the South with multiple northern places when expressing cultural differences between the two regions, or vice versa. Moreover, such texts may even compare multiple northern places with multiple southern places. The first two situations can be well addressed using the solution described in Section 3.1, which provides specific explanations and examples. Regarding the third situation, we have adopted a generalized approach. Specifically, if multiple places belong to the same administrative area at the upper level, then this administrative area at the upper level was used instead. Although such treatment has addressed the issue to a certain extent, its main drawback involves the reduction of location accuracy of place names.

5.1.3. Influence of Personal Attributes of the Sample Data on Analysis Results

The socio-spatial practice of culture and the production of cultural space are the results of the collective construction of multiple social groups. Therefore, the data samples used for analysis need to be broadly representative. In addition to the sample data covering an entire area in space, the attributes of the sample data respondents should also be diverse. For example, the data should include a relatively balanced sample of men and women, as well as high- and low-income groups and urban and rural users. The Zhihu data used in this paper were collected in 2017. According to official statistics, the number of Zhihu users reached approximately 100 million in 2017. Zhihu is a Q&A community with the largest number of users and the most active daily activities in China. Thus far, the question used in this study has been viewed 93,315,823 times, which shows that it is an interesting and popular topic. The respondents were selected randomly according to gender, income, and other aspects. Moreover, they came from different regions, which guarantees the representativeness of the data to a certain extent. The number of users with a large base was enough to show that Zhihu is widely recognized by the people. Hence, to a certain extent, these factors ensure the randomness and breadth of the user group represented by the data sample.

5.2. Conclusion and Future Direction

This study took cultural differences between South and North China as a perception target and 6128 answers to the question, "What are the differences between South and North China that you ever know?” on Zhihu, which is the biggest knowledge Q&A platform in China, as the main data source. Moreover, it analyzed and extracted words from texts using NLP, focusing on place names, words related to culture, and emotional words. In addition, this research collected statistics and analyzed hotspot interaction flow patterns, hotspot cultural elements, and the main emotions on the differences between the North and South using clustering. The main conclusions are provided below.
(1) First, southerners tend to use more ambiguous and larger place names to refer to cultural features common in the north. By contrast, people from the North tend to use specific areas with small scopes to define the cultural characteristics of the South, which indicates differences in the cognition of other cultures between people from the South and North.
(2) Second, analysis of many types of hotspot topics related to differences between the South and North revealed that differences in food culture are the most relevant topics, thereby showing that food culture plays an essential role in people’s daily life, as well as culture production.
(3) Finally, the analysis of the emotional characteristics of southerners and northerners towards each other’s food cultures reveals that they tend to show negative emotions toward the other’s food culture. This shows that when different cultures interact, they often show exclusion rather than appreciation of each other’s culture. In the books Clash of Civilizations and Remaking of World Order [51], Samuel Huntington, who is a professor in International Relations at Harvard University, stated that the reason behind conflicts among countries and regions in the current world is not because of religions or the economy but because of conflicts among different cultures.
However, instead of coming into being naturally, cultures are generated under the influence of social environments. In other words, as long as people understand certain cultures, they will inevitably adapt to or even accept such cultures subtly. When people in different regions conflict due to differences in customs, eating habits, and so on, they should learn as much as possible about each other’s culture, so as to understand cultural differences and promote identity. Moreover, the interaction and collision of cultures will facilitate the spread and integration of cultures.
This study has made efforts to apply novel data of cultural cognition and quantitative analysis methods. However, shortcomings exist, and thus conducting research on cultural significance, value judgment, and emotional attachment, as well as the identity of relevant cultural elements from the perspective of new cultural geography, is crucial. For example, further analysis could specifically identify which characteristics belong to northern cultural symbols and which belong to southern cultural symbols and detect each emotional word generated in a cross-regional process. Thus, such topics require further investigation. The research results in this paper show objectively that the food culture conflict between southerners and northerners in China does exist.

Author Contributions

Conceptualization, Haiping Zhang and Xingxing Zhou; Data curation, Yi Huang; Formal analysis, Haiping Zhang and Xingxing Zhou; Methodology, Xingxing Zhou; Software, Yi Huang; Visualization, Haiping Zhang; Writing—original draft, Haiping Zhang and Yi Huang; Writing—review & editing, Xingxing Zhou and Yi Huang. All authors have read and agreed to the published version of the manuscript.

Funding

This research was funded by [Jiangsu Natural Science Foundation of Youth] Grant No. [BK20160893].

Conflicts of Interest

The authors declare no conflicts of interest.

References

  1. Lopez, J.J.R. The symbolic appropriated territory, an updated tradition in the new cultural geography. Rev. Geogr. Venez. 2018, 59, 434–447. [Google Scholar]
  2. Cresswell, T. New cultural geography-an unfinished project? Cult. Geogr. 2010, 17, 169–174. [Google Scholar] [CrossRef]
  3. Jackson, P. New directions in cultural geography revisited. Area 2016, 48, 367–370. [Google Scholar] [CrossRef]
  4. Cresswell, T.; Mitchell, D. Cultural Geography: A Critical Introduction. Econ. Geogr. 2002, 34, 334–339. [Google Scholar] [CrossRef]
  5. Goheen, P.G. Cultural geography: A critical introduction. Ann. Assoc. Am. Geogr. 2001, 91, 572–573. [Google Scholar]
  6. Brazeau, R. The cultural geography of revolution. Ir. Stud. Rev. 2019, 27, 442–446. [Google Scholar] [CrossRef]
  7. Peach, C. Social geography: New religions and ethnoburbs—Contrasts with cultural geography. Prog. Hum. Geog. 2002, 26, 252–260. [Google Scholar] [CrossRef] [Green Version]
  8. Cook, I. A new vocabulary for cultural-economic geography? Dialogues Hum. Geogr. 2019, 9, 83–87. [Google Scholar] [CrossRef]
  9. Zimmerer, K.S. Cultural ecology: At the interface with political ecology—The new geographies of environmental conservation and globalization. Prog. Hum. Geog. 2006, 30, 63–78. [Google Scholar] [CrossRef]
  10. Steinbrink, M.; Aufenvenne, P. On othering and mainstreamisation of new cultural geography. Some scientometric observations. Mitt. Osterr. Geogr. G 2017, 159, 83–104. [Google Scholar]
  11. Turan, Y.; Cekic, A. Coping with loneliness: Loneliness, religious coping, religiosity, life satisfaction and social media usage. Cumhur. Ilah. Derg. 2018, 22, 1711–1745. [Google Scholar]
  12. Orben, A.; Dienlin, T.; Przybylski, A.K. Social media’s enduring effect on adolescent life satisfaction. Proc. Natl. Acad. Sci. USA 2019, 116, 10226–10228. [Google Scholar] [CrossRef] [PubMed] [Green Version]
  13. Andrade, C.S.; Santos, M.Y. Sentiment analysis with text mining in contexts of big data. Int. J. Technol. Hum. Interact. 2017, 13, 47–67. [Google Scholar] [CrossRef]
  14. Naji, M.; Daoudi, N.; Ajhoun, R. Spatio-Temporal Context for Improving Sentiment Analysis Accuracy. In Proceedings of the 2018 6th International Conference on Multimedia Computing and Systems (ICMCS), Rabat, Morocco, 10–12 May 2018; pp. 390–395. [Google Scholar]
  15. Majumder, N.; Hazarika, D.; Gelbukh, A.; Cambria, E.; Poria, S. Multimodal sentiment analysis using hierarchical fusion with context modeling. Knowl. Based Syst. 2018, 161, 124–133. [Google Scholar] [CrossRef] [Green Version]
  16. Chera, M. Food culture: Anthropology, linguistics, and food studies. Soc. Anthropol. 2018, 26, 579–581. [Google Scholar] [CrossRef]
  17. Tolia-Kelly, D.P. The geographies of cultural geography III: Material geographies, vibrant matters and risking surface geographies. Prog. Hum. Geogr. 2013, 37, 153–160. [Google Scholar] [CrossRef] [Green Version]
  18. Edvardsson, B.; Enquist, B.; Johnston, R. Co-creating customer value through hyperreality in the prepurchase service experience. J. Serv. Res. 2005, 8, 149–161. [Google Scholar] [CrossRef]
  19. Kandra, S.; Ghosh, M. Environmental perception: Image based analysis of people’s impression of places. Int. J. Appl. Environ. Sci. 2017, 12, 1223–1239. [Google Scholar]
  20. Mirnig, N.; Strasser, E.; Weiss, A.; Tscheligi, M. Studies in Public Places as a Means to Positively Influence People’s Attitude towards Robots; International Conference on Social Robotics; Springer: Heidelberg, Germany, 2012; pp. 209–218. [Google Scholar]
  21. Portugali, J. On the relations between cognitive maps and images of cities. Cogn. Process. 2018, 19, S6. [Google Scholar]
  22. Boulding, K.E. The image: Knowledge in life and society. J. Political Econ. 1957, 54, 112–113. [Google Scholar]
  23. Reynolds, W.H. The role of the consumer in image building. Calif. Manag. Rev. 1965, 7, 69–76. [Google Scholar] [CrossRef]
  24. Filomena, G.; Verstegen, J.A.; Manley, E. A computational approach to the image of the city. Cities 2019, 89, 14–25. [Google Scholar] [CrossRef]
  25. Chapman, E.H.; Lynch, K. The Image of the City. J. Aesthet. Art Crit. 1962, 11, 46–68. [Google Scholar]
  26. Guo, C.C. The important relationship between environment design and city image. In Proceedings of the 2018 7th International Conference on Social Science, Education and Humanities Research, Sanya, China, 25–27 November 2018; pp. 31–34. [Google Scholar]
  27. Oshimi, D.; Harada, M. Host residents’ role in sporting events: The city image perspective. Sport Manag. Rev. 2019, 22, 263–275. [Google Scholar] [CrossRef]
  28. Li, J.J.; Lu, Y. Chinese culture in tourist research: A review and comparison of Chinese and English studies in 1993–2012. Tour. Rev. 2016, 71, 118–134. [Google Scholar] [CrossRef]
  29. Wong, I.A.; McKercher, B.; Li, X.P. East meets west: Tourist interest in hybrid culture at postcolonial destinations. J. Travel Res. 2016, 55, 628–642. [Google Scholar] [CrossRef]
  30. Beriault, M.; Laurier, C.; Guay, J.P. Allegiance to gang culture: The role of ethnic identity among young offenders in the montreal area. Criminologie 2017, 50, 287–310. [Google Scholar]
  31. Oh, D.E.S. Social life in social media. Fudan J. Hum. Soc. Sci. 2018, 11, 119–122. [Google Scholar] [CrossRef]
  32. Hawi, N.S.; Samaha, M. The relations among social media addiction, self-esteem, and life satisfaction in university students. Soc. Sci. Comput. Rev. 2017, 35, 576–586. [Google Scholar] [CrossRef]
  33. Ly, T.; Pamer, C.; Dang, O.; Brajovic, S.; Haider, S.; Botsis, T.; Milward, D.; Winter, A.; Lu, S.; Ball, R. Evaluation of natural language processing (NLP) systems to annotate drug product labeling with meddra terminology. J. Biomed. Inform. 2018, 83, 73–86. [Google Scholar] [CrossRef]
  34. Moreno, D.C.; Vargas-Lombardo, M. Design and construction of an NLP based knowledge extraction methodology in the medical domain applied to clinical information. Healthc. Inform. Res. 2018, 24, 376–380. [Google Scholar] [CrossRef]
  35. Purks, J.L.; Harris, M.; Anderson, K.E.; Shoulson, I. Natural language processing (NLP) of verbatim consequence patient-reported outcomes highlight functional ability as important to patients. Neurotherapeutics 2018, 15, 1192. [Google Scholar]
  36. Xu, G.X.; Meng, Y.T.; Qiu, X.Y.; Yu, Z.H.; Wu, X. Sentiment analysis of comment texts based on bilstm. IEEE Access 2019, 7, 51522–51532. [Google Scholar] [CrossRef]
  37. Basiri, M.E.; Ghasem-Aghaee, N.; Naghsh-Nilchi, A.R. Exploiting reviewers’ comment histories for sentiment analysis. J. Inf. Sci. 2014, 40, 313–328. [Google Scholar] [CrossRef]
  38. Liu, L.Z.; Liu, H.; Wang, H.S.; Song, W.; Lu, J.L. The study of sentiment analysis on Chinese comment texts. In Proceedings of the 2014 5th IEEE International Conference on Software Engineering and Service Science (Icsess), Beijing, China, 27–29 June 2014; pp. 397–401. [Google Scholar]
  39. Qi, W.; Liu, S.H.; Zhao, M.F.; Liu, Z. China’s different spatial patterns of population growth based on the hu line. J. Geogr. Sci. 2016, 26, 1611–1625. [Google Scholar] [CrossRef]
  40. Wang, F.H.; Liu, C.L.; Xu, Y.P. Analyzing population density disparity in china with GIS-automated regionalization: The hu line revisited. Chin. Geogr. Sci. 2019, 29, 541–552. [Google Scholar] [CrossRef] [Green Version]
  41. Chen, M.X.; Gong, Y.H.; Li, Y.; Lu, D.D.; Zhang, H. Population distribution and urbanization on both sides of the hu Huanyong line: Answering the premier’s question. J. Geogr. Sci. 2016, 26, 1593–1610. [Google Scholar] [CrossRef]
  42. Hu, Z.C.; Wang, Y.L.; Liu, Y.S.; Long, H.L.; Peng, J. Spatio-temporal patterns of urban-rural development and transformation in east of the hu Huanyong line, china. ISPRS Int. J. Geo-Inf. 2016, 5, 24. [Google Scholar] [CrossRef] [Green Version]
  43. Li, X.D.; Zhang, C. Research on enhancing the effectiveness of the Chinese text automatic categorization based on ictclas segmentation method. In Proceedings of the 2013 IEEE 4th International Conference on Software Engineering and Service Science, Beijing, China, 23–25 May 2012; pp. 267–270. [Google Scholar]
  44. Tajbakhsh, M.S.; Bagherzadeh, J. Semantic knowledge LDA with topic vector for recommending hashtags: Twitter use case. Intell. Data Anal. 2019, 23, 609–622. [Google Scholar] [CrossRef]
  45. Zhang, Y.L.; Eick, C.F. Tracking events in twitter by combining an LDA-based approach and a density-contour clustering approach. Int. J. Semant. Comput. 2019, 13, 87–110. [Google Scholar] [CrossRef]
  46. Stevens, K.; Kegelmeyer, P.; Andrzejewski, D.; Buttler, D. Exploring Topic Coherence over Many Models and Many Topics. In Proceedings of the Conference on Empirical Methods in Natural Language Processing, Jeju Island, Korea, 12–14 July 2012; pp. 952–961. [Google Scholar]
  47. Mimno, D.M.; Wallach, H.M.; Talley, E.M.; Leenders, M.; Mccallum, A. Optimizing Semantic Coherence in Topic Models. In Proceedings of the Conference on Empirical Methods in Natural Language Processing, Edinburgh, UK, 27–31 July 2011; pp. 262–272. [Google Scholar]
  48. Min, K.R.; Ma, C.G.; Zhao, T.M.; Li, H.Y. Bosonnlp: An ensemble approach for word segmentation and pos tagging. In Natural Language Processing and Chinese Computing; Springer: Cham, Switzerland, 2015; Volume 9362, pp. 520–526. [Google Scholar]
  49. Hong, W.; Su, Y.S. The effect of institutional proximity in non-local university-industry collaborations: An analysis based on Chinese patent data. Res. Policy 2013, 42, 454–464. [Google Scholar] [CrossRef]
  50. Fisch, C.O.; Block, J.H.; Sandner, P.G. Chinese university patents: Quantity, quality, and the role of subsidy programs. J. Technol. Transfer. 2016, 41, 60–84. [Google Scholar] [CrossRef]
  51. Huntington, S.P. The Clash of Civilizations: And the Remaking of World Order. Financ. Dev.-Engl. Ed. 1998, 25, 158–162. [Google Scholar]
Figure 1. Study area including the North-South division line.
Ijgi 09 00068 g001
Figure 2. Work flow of data processing and analysis.
Ijgi 09 00068 g002
Figure 3. Culture interaction flow pattern in China.
Ijgi 09 00068 g003aIjgi 09 00068 g003b
Figure 4. Emotion ratio pie chart under the influence of cultural differences between North and South.
Ijgi 09 00068 g004
Figure 5. Emotion flow map of people from the north and south of China.
Ijgi 09 00068 g005aIjgi 09 00068 g005b
Figure 6. Emotion flow map of people from the south and north of China.
Ijgi 09 00068 g006aIjgi 09 00068 g006b
Table 1. Sample of place name extraction with inclusion relations.
StepsResults
Zhihu textI’m from Guangdong. What struck me most when I lived in Heilongjiang was that when I passed a food street while hanging out with a friend from North ….
Place name extractionGuangdong, Heilongjiang, and the North
Place name analysisThis text contains three place name information, in which only one belongs to the South. Based on the semantics, the place name is a place of origin. The remaining two names related to the North are in an inclusion relation (North > Heilongjiang) and, based on semantics, belong to places of destination. Therefore, according to the principle of accuracy, the place name in the text can be determined as Guangdong, Heilongjiang. Based on the direct preposition “from” between Guangdong and Heilongjiang, we can infer that the Cantonese is headed to Heilongjiang.
Final result (Guangdong → Heilongjiang)
Table 2. Sample of parallel place name extraction.
StepsResult
Zhihu textI’m from Harbin, before I went to Beijing for university, I have never been out of my hometown, which has limited my experience. However, wherever I go, I am used to local food. For example, I had noodles for several days in Xi’an, and I’m still thinking of the noodles that I had at a stall in midnight. When I went to Xiamen for the first time, I exclaimed how delicious was the seafood even for me, who barely had any seafood for 20 years.
Place name extractionHarbin, Beijing, Xi’an, and Xiamen
Place name analysisThe text contains four place names, in which only one is a place of origin. The remaining three names are in a parallel relation and belong to places of destination. Therefore, we can infer that this text is about a Harbin person’s comment on the food of the other three cities.
Final result (Harbin → Beijing), (Harbin → Xi’an), and (Harbin → Xiamen)
Table 3. Topic cluster and statistics.
Category IDTopicsExampleNumber of Topical WordsRatio
1locationcanteen, dormitory, home60855.65%
2geography objectmountain, sea, Yangtze River1770.16%
3place nameNanjing, Shandong, Suzhou27,0848.10%
4animalcockroach, snake, gecko14501.35%
5dialectCantonese, Rhotic accent, accent29662.76%
6costumejacket, short sleeve, shirt19071.77%
7climatewinter, ultracold, muggy60635.63%
8emotionlike, disgusting, can not stand62975.85%
9body characteristicsstomach, skin, mouth13541.26%
10human figurefair complexion, tall, fat5340.50%
11living habitbath, clean, laundry64746.01%
12living goodstoothbrush, window, heating30722.85%
13timespring festival, summer vacation43734.06%
14foodhot pot, rice, noodles39,54836.74%
15plantsflower, grass, tree2570.24%

