1. Introduction
The study of urban spatial structure is currently one of the most popular research fields in urban geography [
1]. In the process of changes to urban spatial allocation, a good urban spatial structure can promote the coordinated and sustainable development of the relationship between human beings and urban land [
2]. However, the rapid development of a city can lead to many problems, such as the expansion of the urban scale without planning and a loose spatial structure. These will affect a number of major issues, such as the function of the city and the optimization of the industrial layout, further hindering a city’s sustainable development [
3]. Since the 1990s, due to the rapid development of information technology, new items have been added to those factors that influence the urban spatial structure, such as knowledge and information, which enhance the traditional physical production factors such as land and labor [
4]. Due to the arrival of the era of new data, an increasing amount of urban research is carried out by using a wide variety of geoscience new data. The applied data mainly focus on items such as the map POI (point of interest) data that describe the geospatial entities, GPS track data, and mobile phone signaling data related to crowd activities [
5,
6,
7,
8,
9,
10,
11,
12]. POI data, as a new spatial data source, have an important application potential. In this paper, POI refers to some geographical entity, which is closely related to human life. And in a geographic information system, POI can be a commercial outlet, a bus stop, a high-rise building, etc., which are more authentic. Therefore, POI data can largely enhance the capacity of the description of the physical location, reflect city activities, and can be effectively applied to the urban spatial structure research [
13]. Compared with traditional data, POI data not only have the advantages of a large sample and easy access, but can also represent the spatial distribution of social and economic activity intensity and functional composite utilization, and reflect more accurately urban spatial structure [
14,
15]. In this context, research on the combination of traditional urban space and geographic new data is in urgent need of empirical enrichment and theoretical expansion. In this study, three methods are used to analyze the POI data, so as to explore the urban morphology and spatial structure of Lanzhou. The nearest-neighbor index can analyze whether the POI has agglomeration characteristics, and if so, what is the degree of this agglomeration [
16]. The kernel density estimation (KDE) can analyze the spatial distribution characteristics of POI, where the distribution density is high and where is low [
17]. The location entropy can analyze the proportion of a kind of POI to the total POI in the street, and then analyze whether this kind of POI has professional advantages at the street level [
18]. Through the analysis of all POI in the city, the boundary of the city can be identified and the urban development morphology can be recognized, and the urban spatial structure can be summarized.
This study has a strong significance. On the one hand, it is of great significance to use POI data to study urban spatial structure, and then to compare and summarize the laws and characteristics of urban morphology and urban spatial structure. This can supplement the existing theoretical and empirical research on the development of urban spatial structure, by utilizing the optimization theory of urban spatial structure with local characteristics, which has an important theoretical significance. On the other hand, on the basis of POI data, the detailed spatial structure analysis of a city can provide a suitable test of urban planning, and provide a reference for the site selection of different industries, which has great significance.
2. Literature Review
Urban spatial structure can be strictly divided into the internal spatial structure and external spatial structure [
19,
20]. The urban spatial structure mentioned in this paper refers to the urban internal spatial structure, also known as the urban area structure, which is the spatial projection of various social and economic activities and functional organizations of human beings in a specific region [
21]. Before the industrial revolution, overseas research on urban spatial structure focused on summarizing the urban surface morphology [
22,
23]. From the post-industrial revolution to the end of the 19th century, it mainly focused on the reorganization and renewal of urban space [
24]. From the end of the 19th century to the 1950s, it began to focus on the study of urban functions in a space. Typical examples are Mata’s linear city [
25], Howard’s garden city [
26] and Chaney’s industrial city [
27]. Among these theories, Mata’s linear city was proposed in 1882, which is an urban structure formed by taking the transportation system as the main trunk of the city and laying out residential, production, commercial and service facilities along the traffic line; Howard’s garden city was proposed in 1903, which is an urban structure that the countryside surrounds the city and these are combined; Chaney’s industrial city was proposed in 1904, which is the first urban theory to put forward the idea of functional zoning, and still has a great influence on the overall layout planning of contemporary industrial cities. At the same time, the interpretative study of the urban spatial structure began to appear, with the concentric circle mode, fan-shaped mode and multicenter mode being the three classic modes [
28,
29,
30]. In the middle and late 20th century, the research focus gradually became the impact of information development on human residential behavior, and focused on the continuity of the urban context and the coding of the spatial structure [
31,
32,
33]. After the 1990s, research into the urban spatial structure has further developed towards globalization and information networking, while emphasizing the structural evolution of nature, space and human beings. Research into urban spatial structure in China began in the 1980s, with the introduction of foreign urban spatial structure theory, and has made rapid progress with regard to the history and mode of urban spatial evolution [
34]. From the mid-1990s to the beginning of the 21st century, Chinese scholars concentrated mainly on the evolution [
35,
36] and formation mechanism of urban spatial structure [
37,
38] and urban social spatial structure [
39,
40]. Since the beginning of the 21st century, research on urban spatial structure in China has gradually become more mature and productive. The research content usually involves a summary of the mode of the urban spatial structure in China, as well as the new urban spatial phenomena and major events brought about by globalization, informatization, networking, ecology, and the impact of major events and infrastructure construction on urban spatial structure [
41,
42,
43].
With the development of information technology and the arrival of the era of internet data, the use of new data in the study of urban spatial structure has gradually increased, and the data source has experienced a change process from traditional data to new data, and then to the combination of traditional data and new data. The use of new data in the study of urban spatial structure mainly focuses on the application of new data in research on the urban functional area division, urban hierarchy and urban social structure in foreign countries. In terms of the urban functional area division and urban hierarchy research, scholars such as Krosche and Boll [
44], Ratti et al. [
45], Tranos [
46], Lüscher [
47], Zook [
48], Krings et al. [
49] and Sagl et al. [
50], have carried out relevant research from different perspectives for the application of new data. Furthermore, in the study of the urban social spatial structure, scholars such as Wakamiya et al. [
51], Lee et al. [
52], Rock [
53] and Ming Hsiang [
54], have carried out relevant research from different perspectives for the application of new data. Domestic research mainly focuses on the application of new data in the urban spatial structure, urban hierarchical system, urban functional area division, urban social spatial structure, and commercial spatial distribution. In this regard, scholars such as Huang Weili et al. [
55,
56], Shi Ge et al. [
57], Jin Ping et al. [
58], Wang Bo et al. [
59] and Li Jiangsu et al. [
60] have carried out relevant research from different perspectives for the application of new data.
In general, research on urban spatial structure using POI data is still in its infancy. In China, the cities in the eastern developed areas are mainly selected as the case areas, while there is less research on the cities in the western underdeveloped areas. The existing research on the urban spatial structure in Northwest China mainly involves the historical evolution mechanism and development mode of the urban structure, and basically adopts traditional survey data, which are not conducive for reflecting on the actual distribution of economic entities in an urban space, and lacks the quantitative analysis of the urban spatial structure based on spatial POI data.
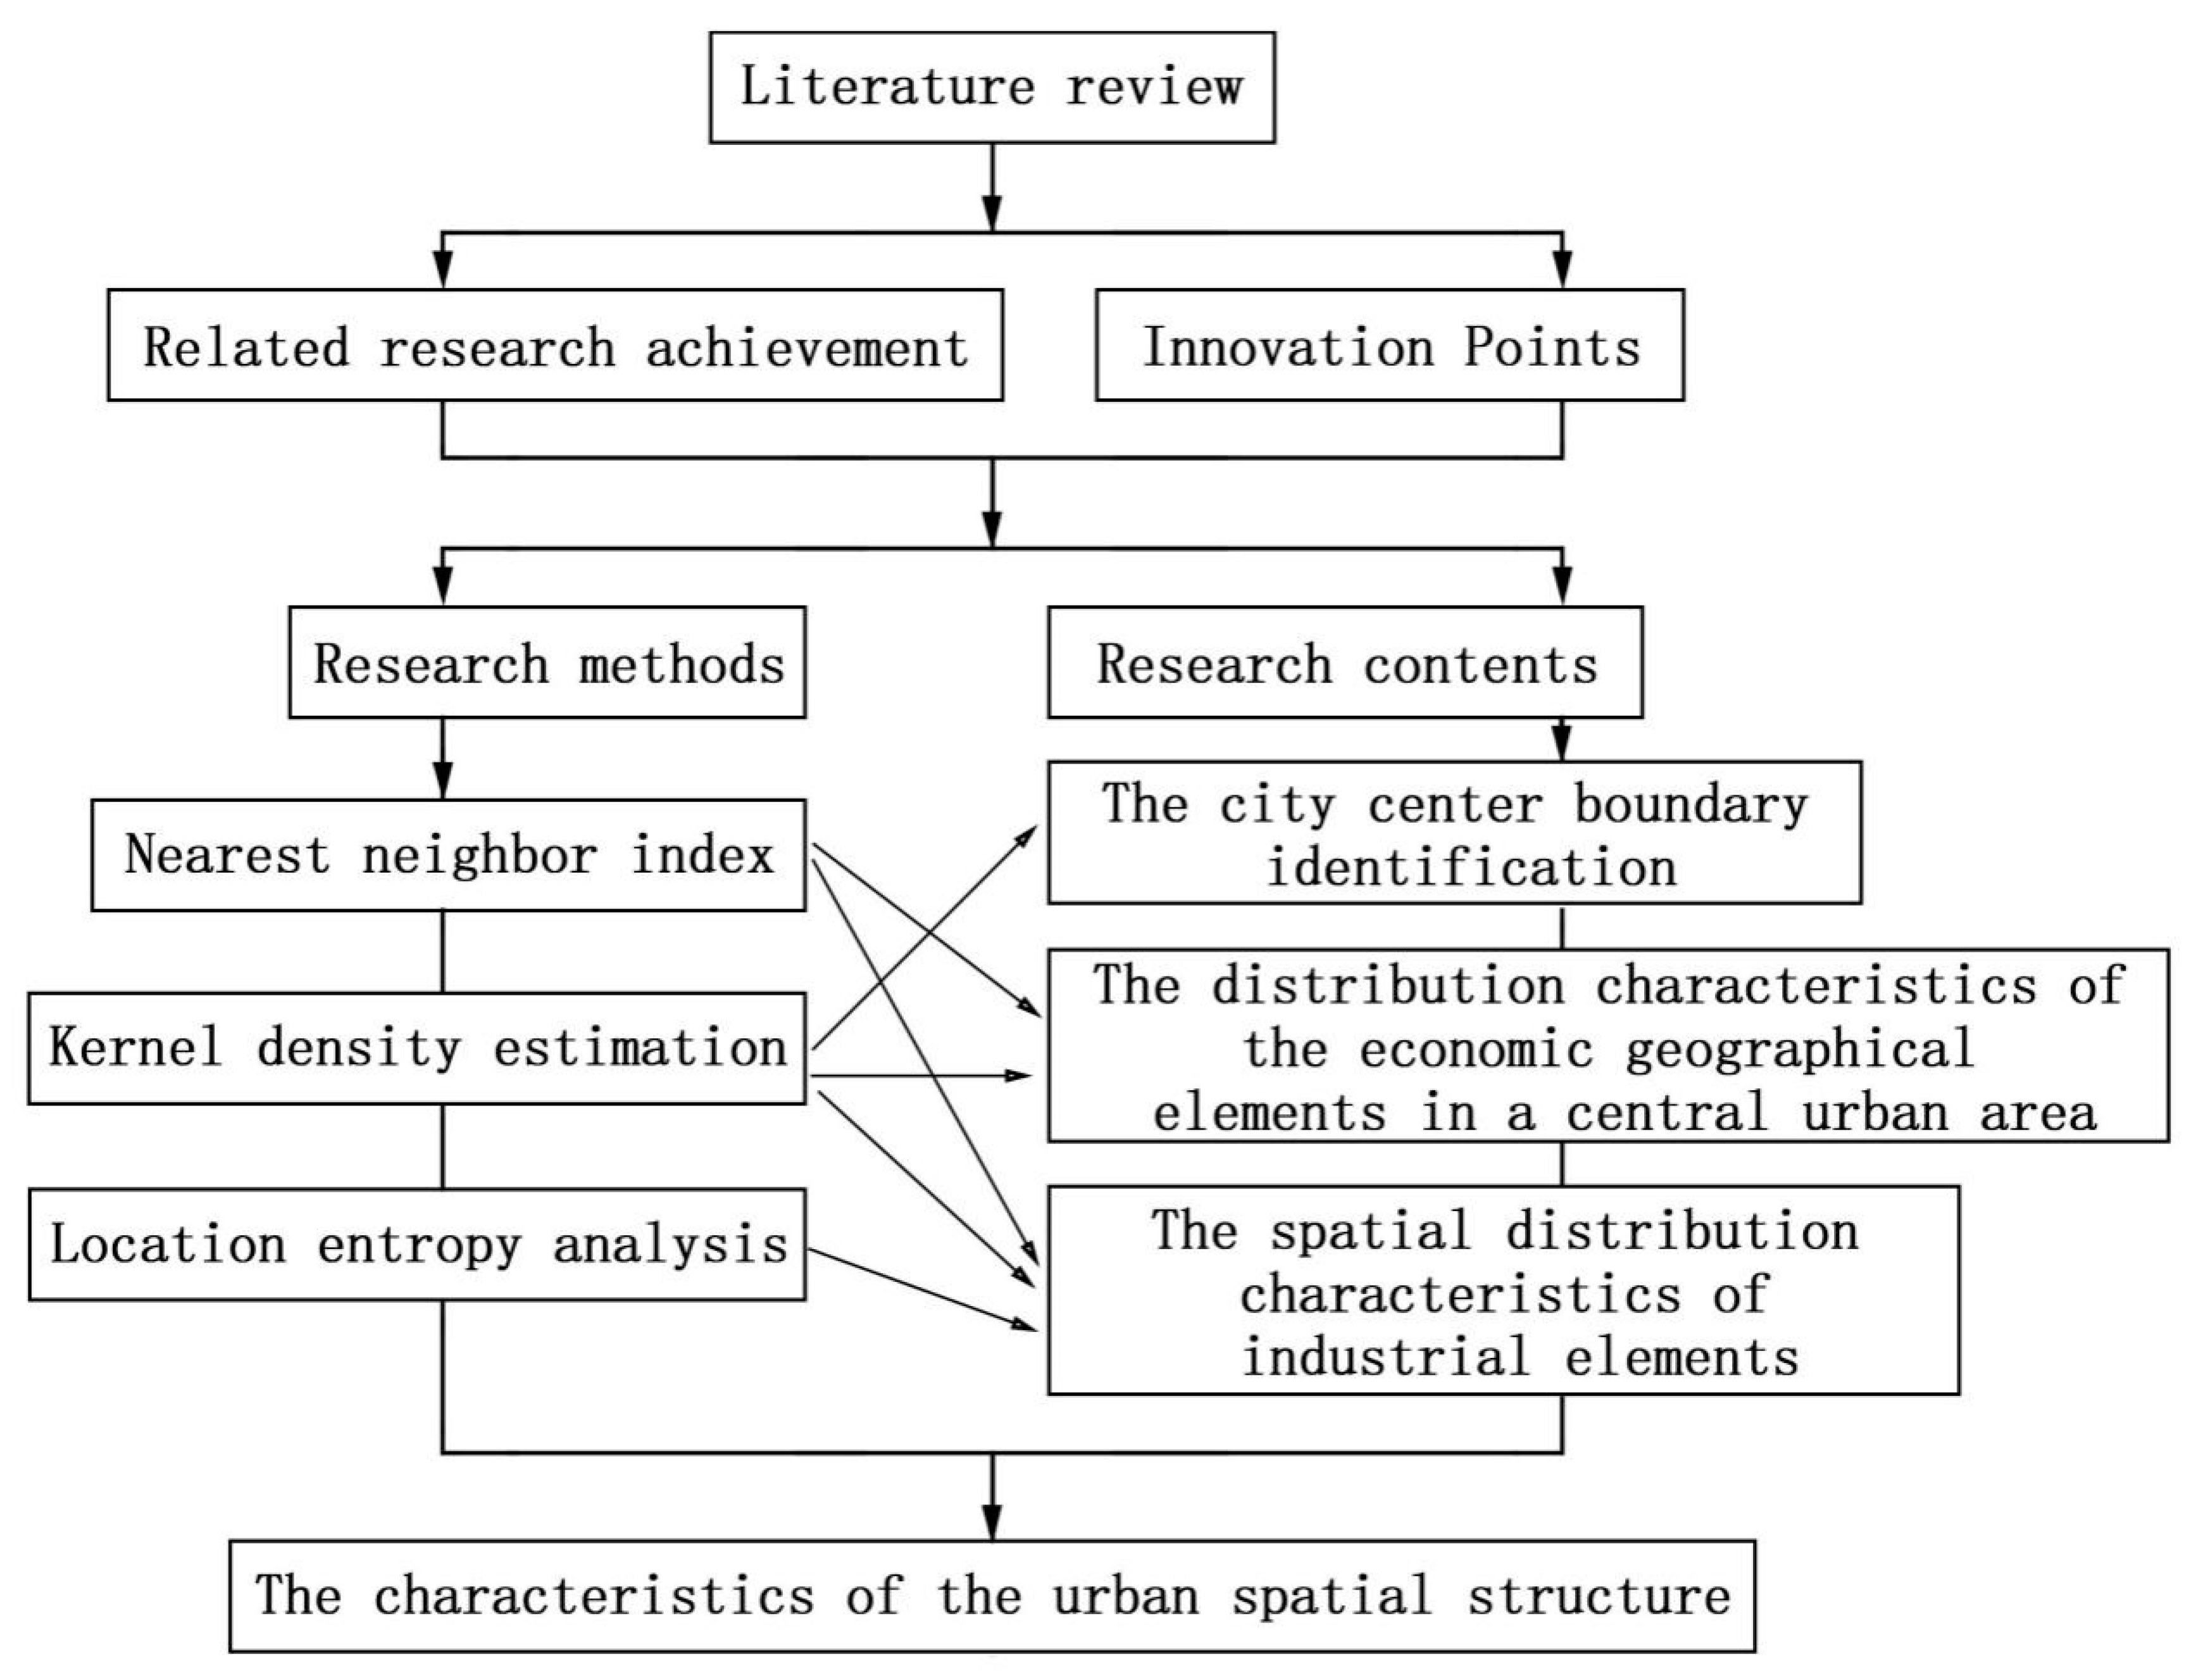
Lanzhou, one of the major cities in Northwest China, is used as a case area. By using the POI data of the POI industry classification, the nearest-neighbor index, KDE and location entropy are adopted to analyze the spatial clustering-discrete distribution characteristics of the overall economic geographical elements of the city center, the spatial distribution characteristics of the various industry elements, and the overall spatial structure characteristics of the city (
Figure 1). All of these can provide a scientific reference for the sustainable optimization of urban space.
Additionally, more innovative research can make up for the shortcomings of existing studies for the following reasons. Firstly, the basis data are innovative. POI data can represent the spatial distribution of the intensity of socio-economic activity and functional composite utilization, which have an important application value for the study of the urban internal spatial structure. Secondly, the research methods are innovative. Although the nearest-neighbor index, KDE and location entropy are also used in the existing relevant researches, only a single method is used to analyze the problem. Especially, in this research, POI data and three methods are all used at the same time to analyze the problem of urban spatial structure from different perspectives, which also confirms the research results obtained by different methods, and then the reliability of the research results is ensured. Thirdly, this is reflected in innovations in the research perspective. Through the quantitative measurement of the industry’s spatial pattern, the city’s internal spatial structure is measured from the perspective of the industrial agglomeration’s distribution, which is different from previous studies of urban spatial structure that are mostly oriented to a macro interpretation.
5. Results and Analysis
5.1. The City Center Boundary Identification
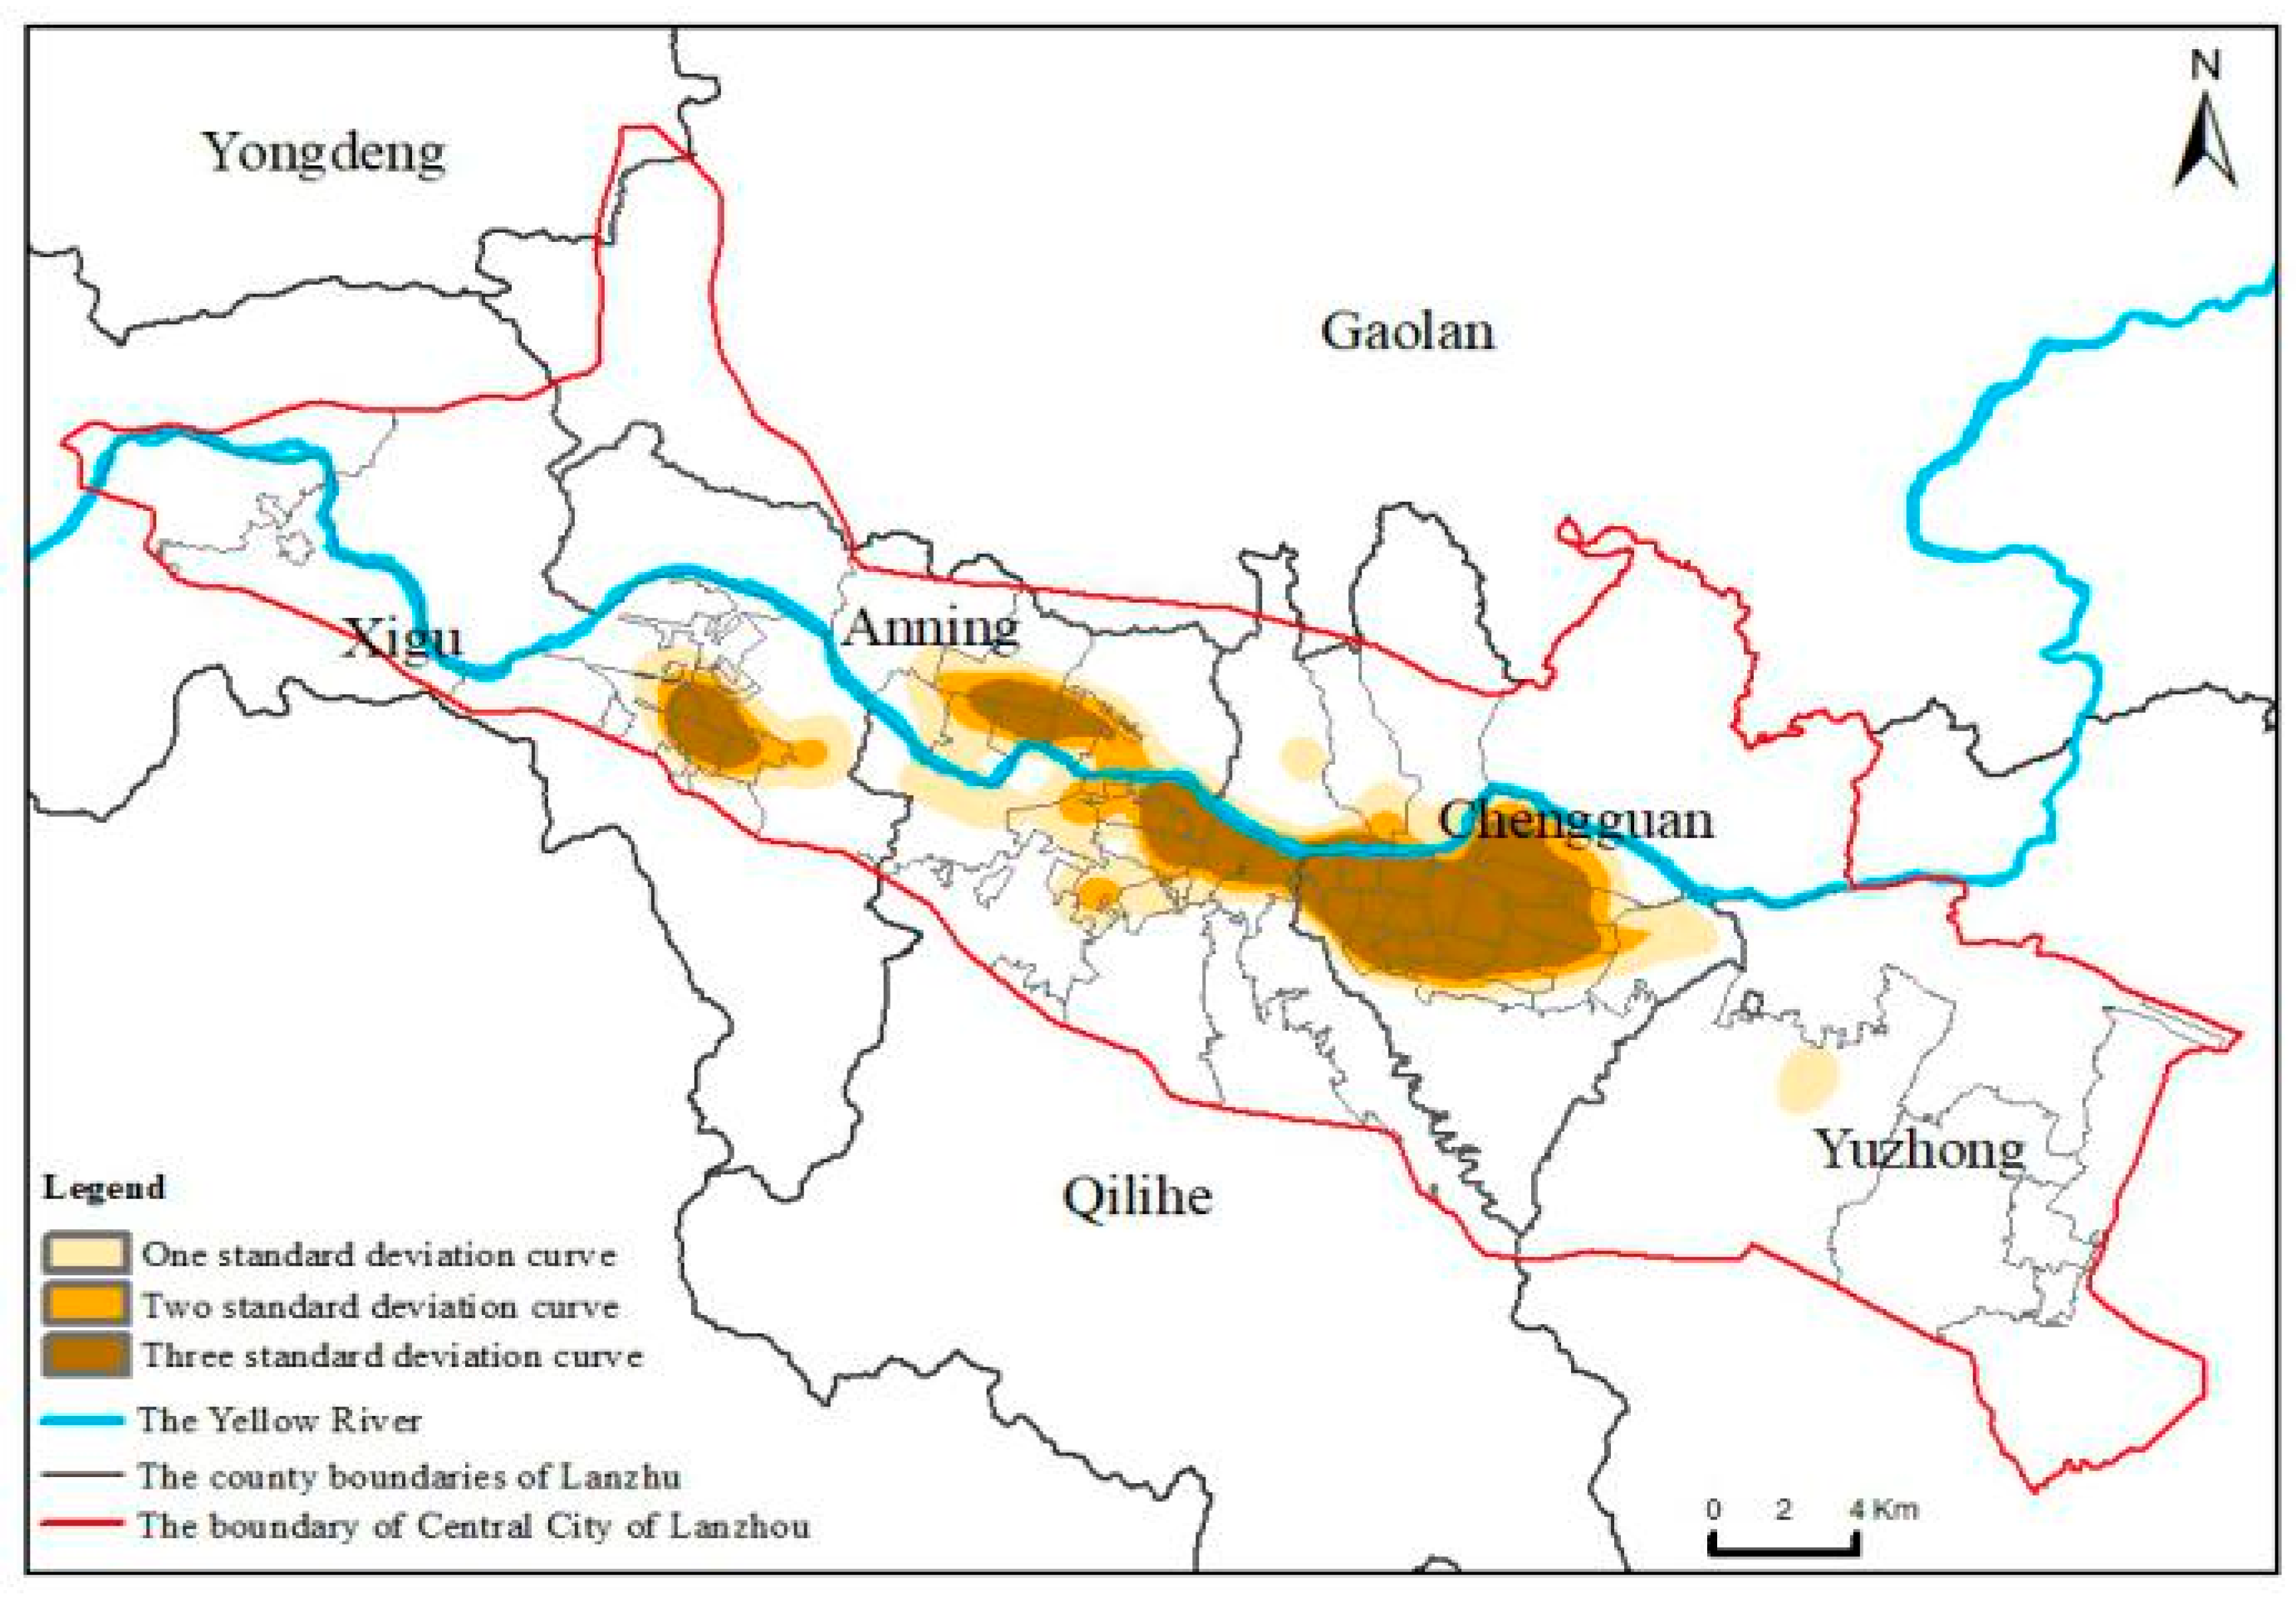
By using the ArcGIS platform, the standard deviation curve of the POI kernel density in the central urban area is established, and the boundary of the urban center is determined in combination with the actual development of the city in the study. This is conducted in order to facilitate an in-depth quantitative analysis of the layout of the various industries in the central urban area.
Based on the overall POI data of the central urban area, a kernel density analysis was carried out with a radius of 1400 m. The standard deviation surface (
Figure 3) was obtained by using one standard deviation curve, two standard deviation curves, and three standard deviation curves as threshold values. The urban center areas outlined by the three standard deviation curves are sequentially divided into urban core areas, urban central areas, and urban development areas. The area formed by the three standard deviations’ surfaces covers 71% of the POI in the central urban area, with 6% of the land area; thus three standard deviation curves are finally selected as the city center boundary. In addition, considering that the Chengguan district has far more land area and POI than other districts in the central area of the city, and combining with the urban development process of Lanzhou, it is further determined that streets such as Linxia Road, Zhangye Road and Guangwumen Road in the Chengguan district are the city’s main centers, and the Jianlan Road in the Qilihe district and the streets of Kongjiaya and Peili in the Anning District are the city’s subcenters.
5.2. The Distribution Characteristics of the Economic Geographical Elements in a Central Urban Area
5.2.1. The Overall Spatial Distribution of the Economic Geographical Elements in Central Urban Areas
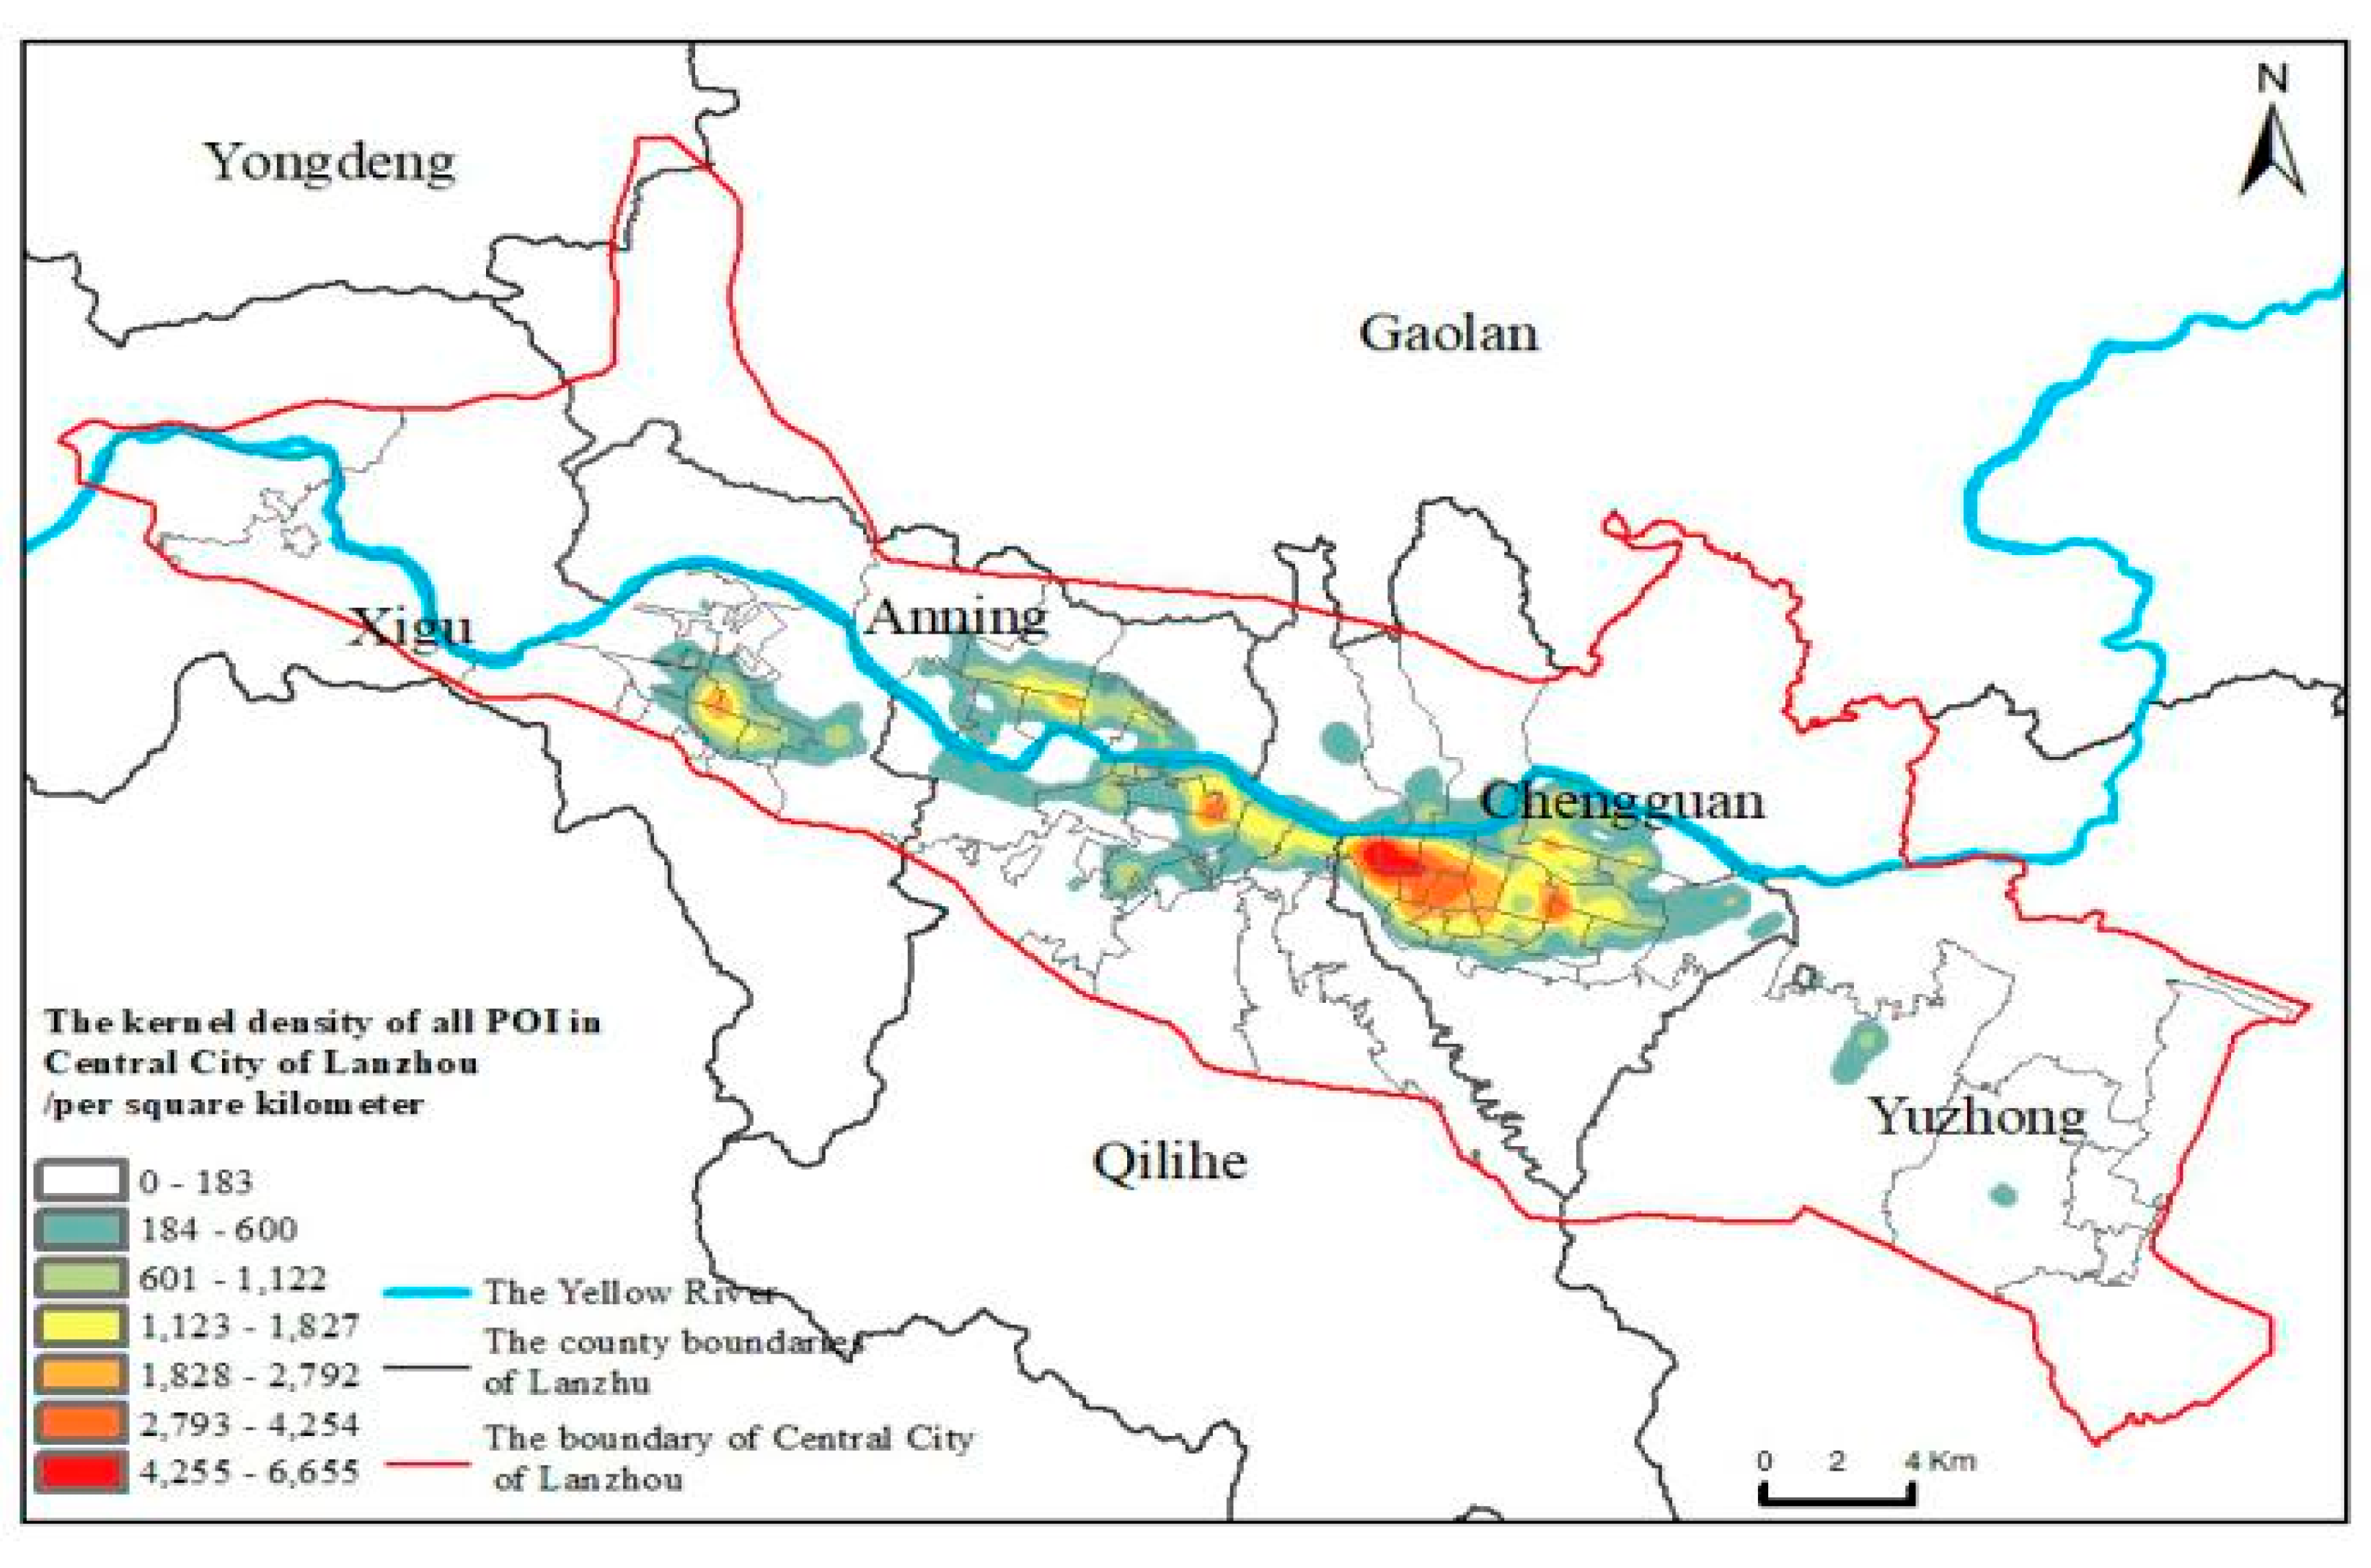
The nearest-neighbor index of the spatial distribution of all types of economic geographical elements in the central urban area of Lanzhou is 0.179 (
p < 0.01), indicating that its spatial distribution has significant agglomeration characteristics. The results of the kernel density analysis (
Figure 4) show that the density value of all types of economic geographical elements in the central urban area is between 0 and 6655 points per square kilometer, and the distribution density gradually decreases from the central area to the peripheral area. The main agglomeration center is Linxia Road and other areas in the Chengguan district, and gradually extends to the East. Moreover, there are obvious secondary agglomeration centers in Rydmore and other areas in the Chengguan district. At present, the agglomeration centers distributed along the main roads are being formed, and a small number of agglomeration “islands” in the peripheral areas are also gradually forming. As a whole, the central urban area of Lanzhou is a spatial structure of a single main center and multiple sub centers, and the city gradually expands to the East and West sides and peripheral areas along the Yellow River Valley.
5.2.2. The Spatial Distribution of the Three Industrial Economic Geographical Elements
Primary Industry
The nearest-neighbor index of the primary industry in the central urban area of Lanzhou is 0.651 (
p < 0.01), which indicates that its spatial distribution has certain central agglomeration characteristics, but the central agglomeration distribution is not obvious. The results of the kernel density analysis (
Figure 5) show that, without considering the its scale, the primary industry in the central urban area of Lanzhou is mostly distributed at the edge of the city’s built-up area, among which Xiguoyuan Street and the Weiling township in the Qilihe district are relatively concentrated, and the distribution characteristics of the large dispersion and small central agglomeration are obvious.
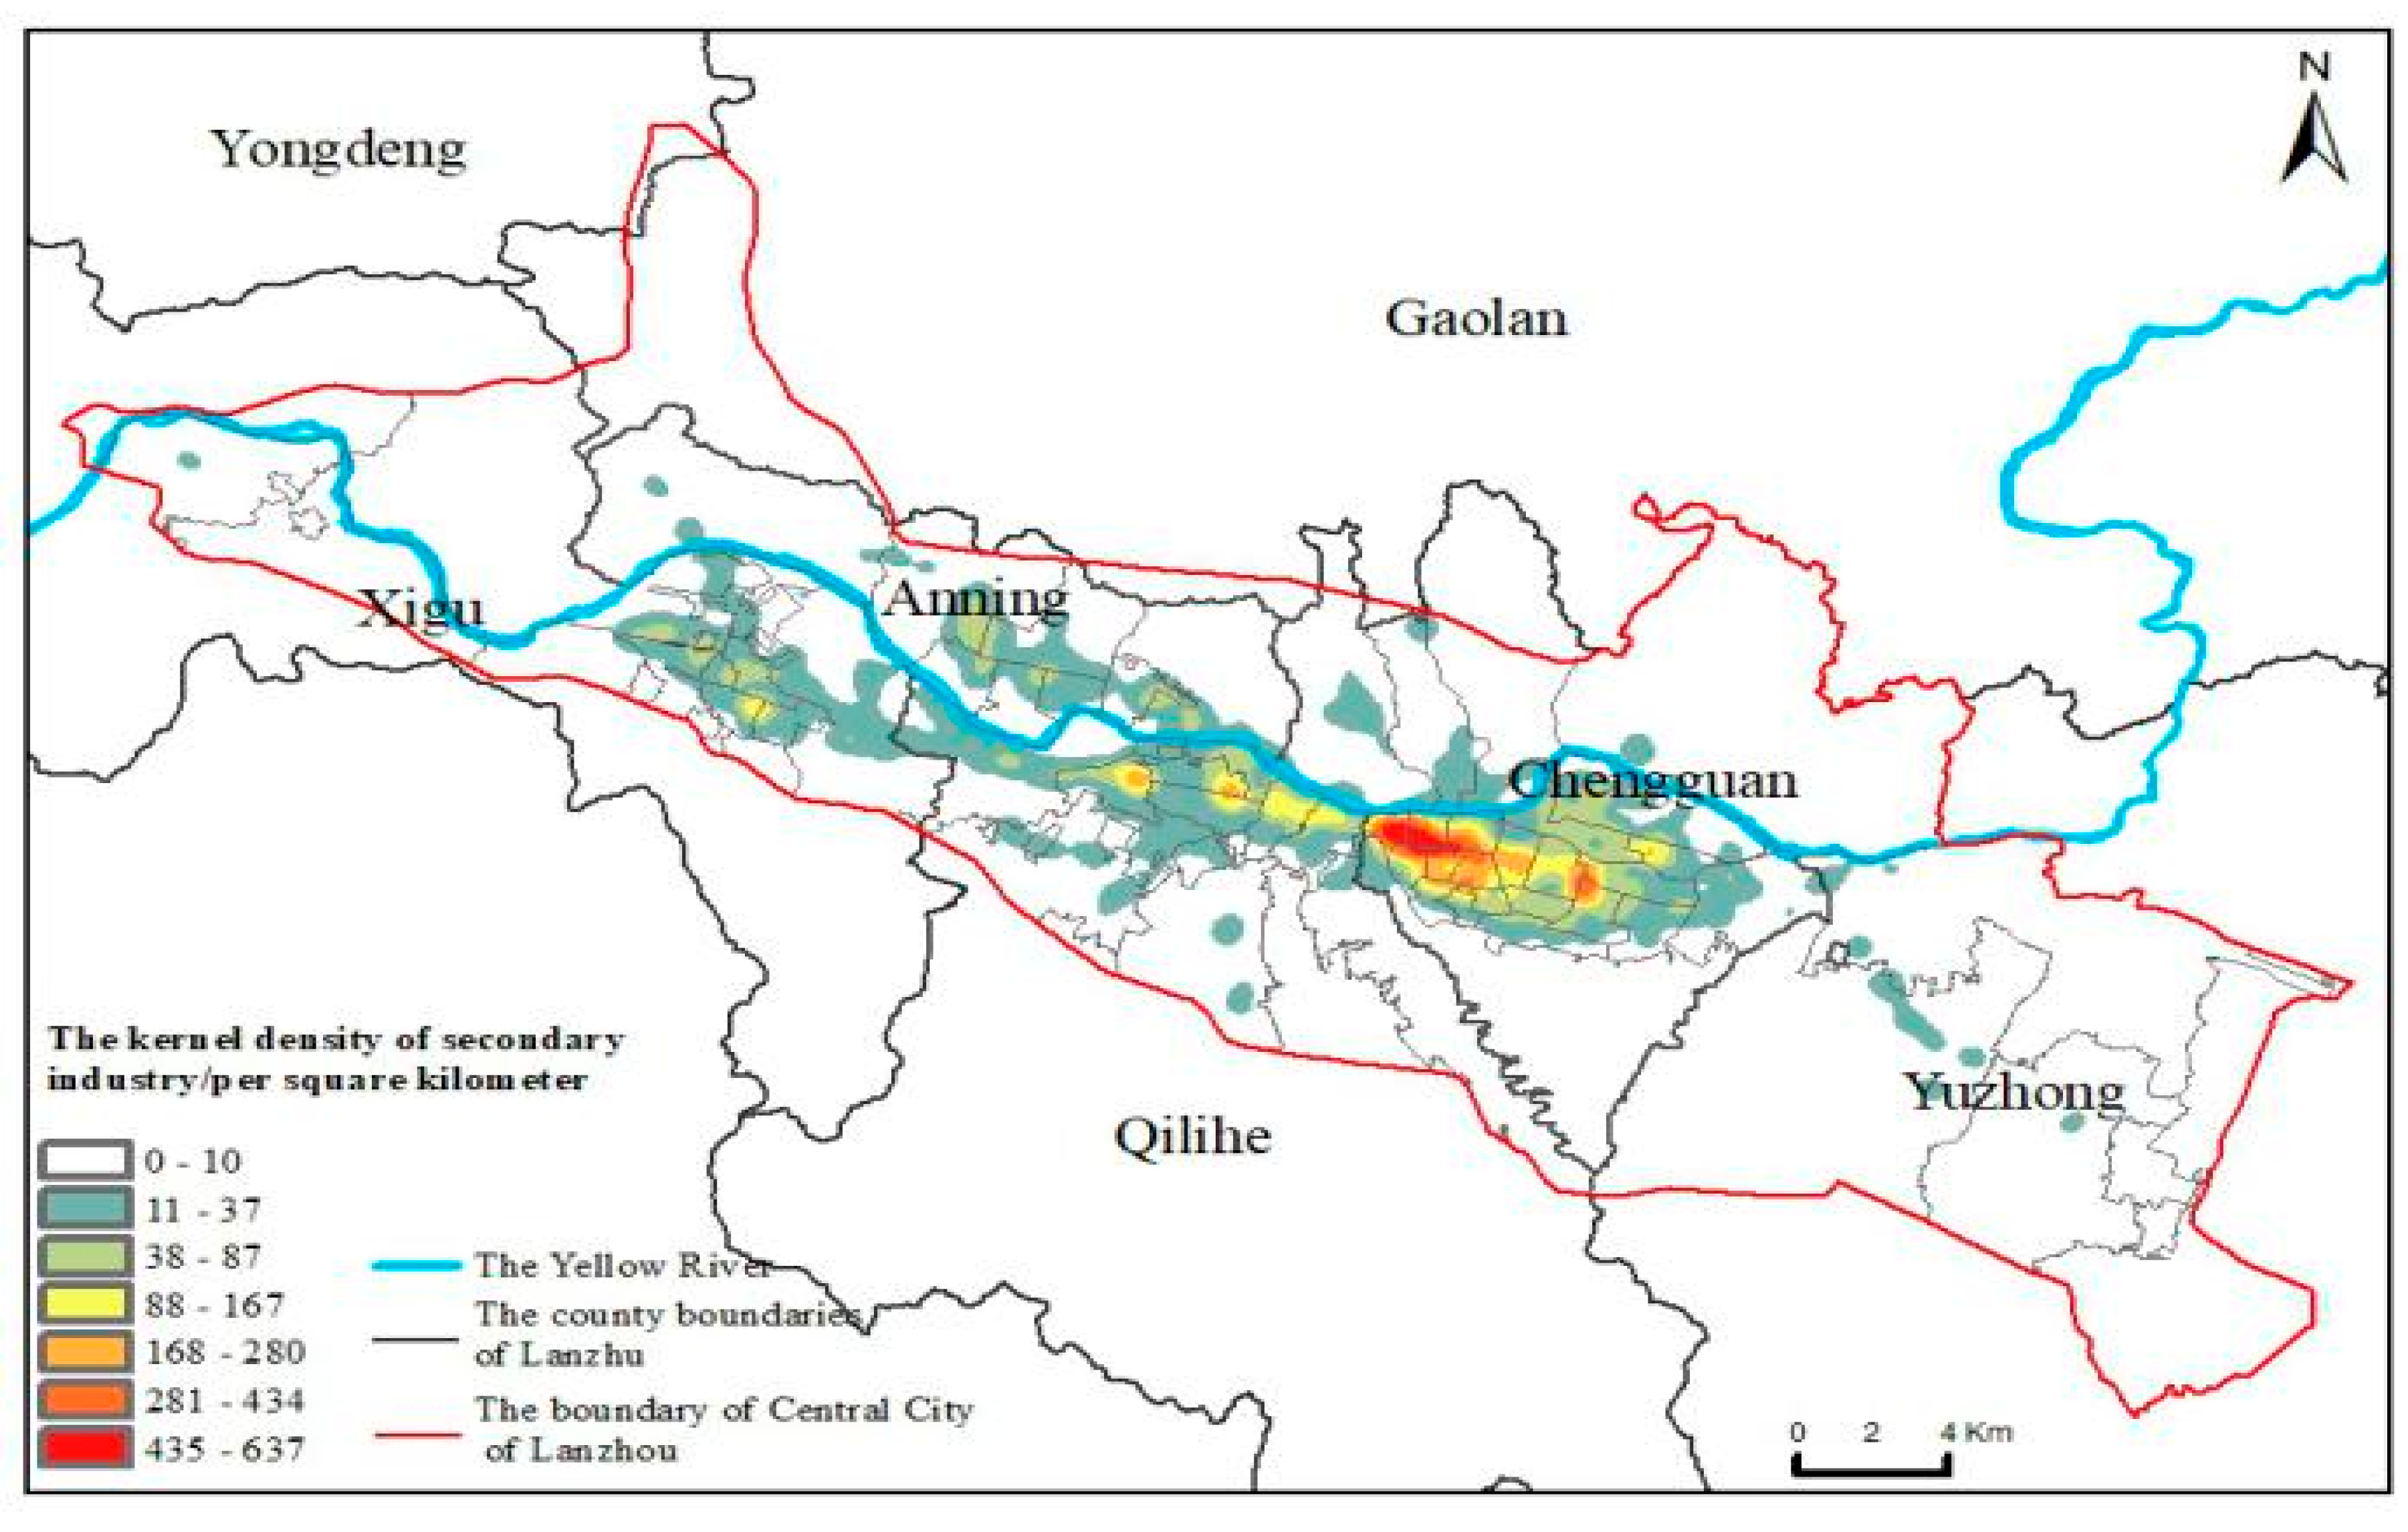
Secondary Industry
The nearest-neighbor index of the second industry in the central urban area of Lanzhou is 0.220 (
p < 0.01), indicating that its spatial distribution has obvious agglomeration characteristics. The results of the kernel density (
Figure 6) analysis show that the secondary industry in the central urban area of Lanzhou has obvious centralized distribution characteristics, among which Linxia Road and Zhangye Road in the Chengguan district are the highest kernel density areas, and other streets, such as Jiayuguan Road in the Chengguan district and Dunhuang Road in the Qilihe district, also have an obvious centralized distribution. It can be seen that, without considering its scale, second industry enterprises in the old city of Lanzhou have the largest number and the densest distribution.
Tertiary Industry
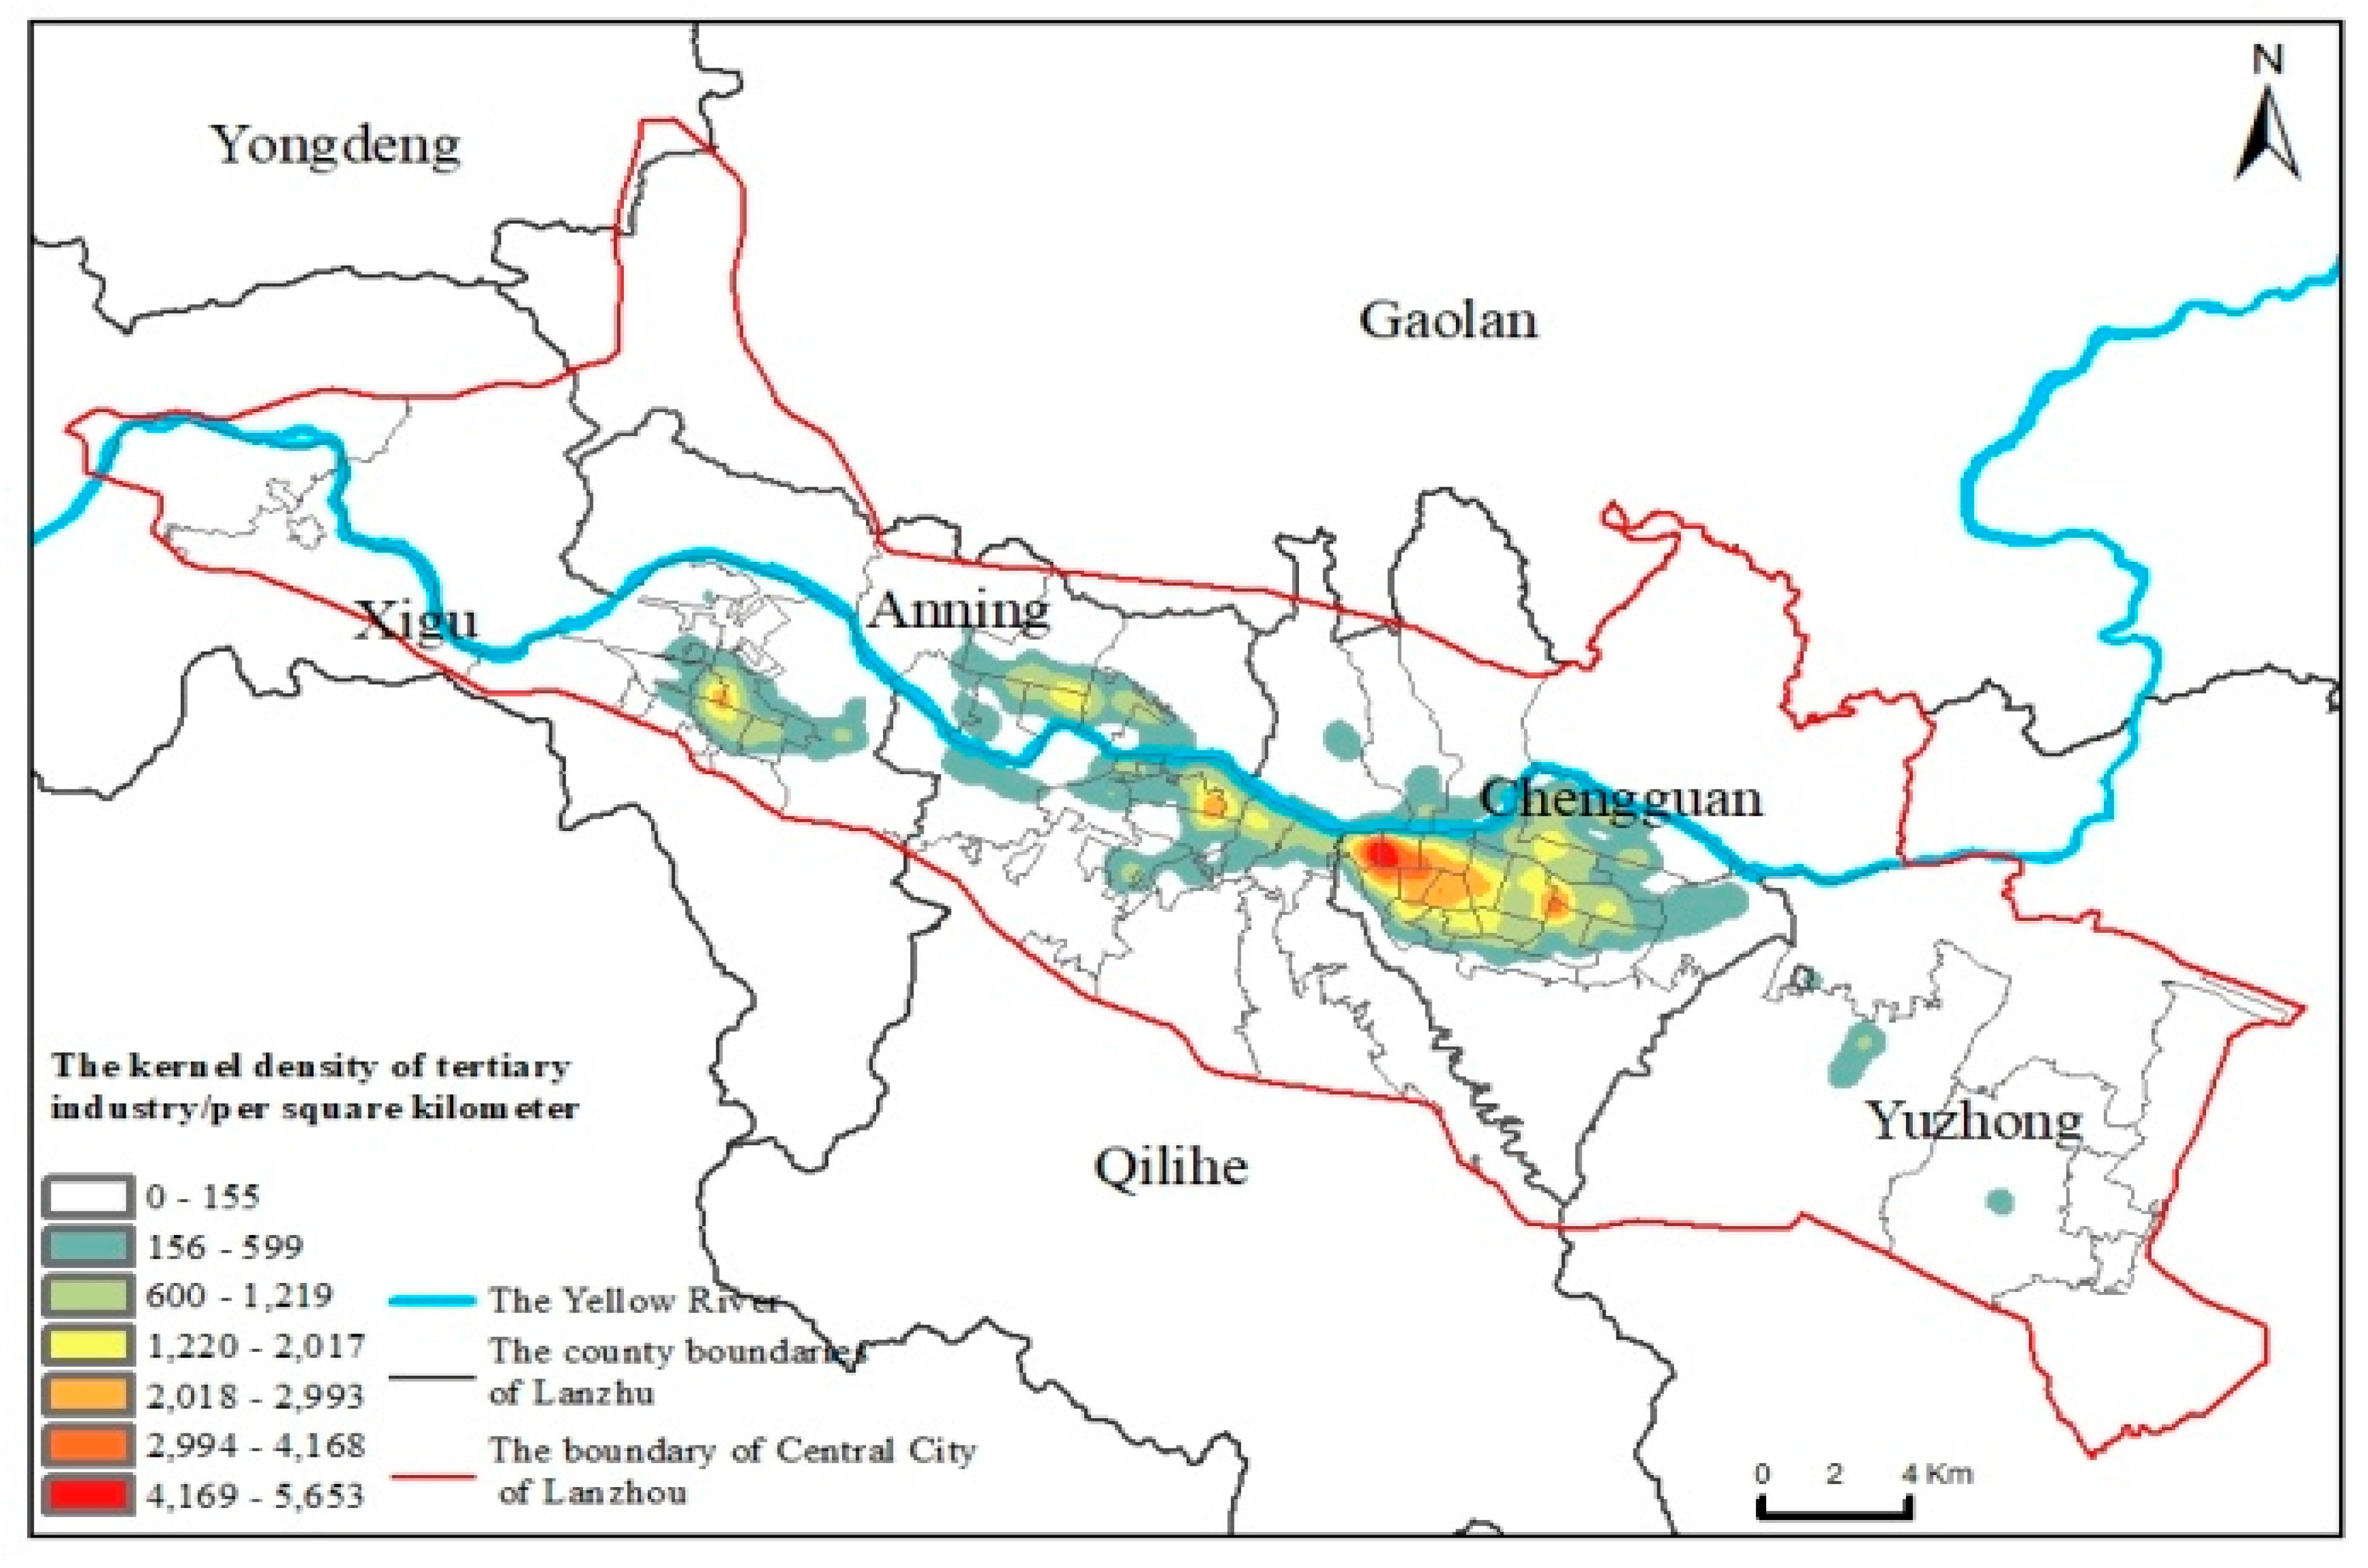
The nearest-neighbor index of the tertiary industry in the central urban area of Lanzhou is 0.150 (
p < 0.01), indicating that its spatial distribution has highly significant agglomeration characteristics. The results of the kernel density analysis (
Figure 7) show that the distribution characteristics of the tertiary industry in the central urban area of Lanzhou are obvious, among which Linxia Road and Zhangye Road in the Chengguan district are the highest kernel density areas, forming a significant agglomeration center of urban socio-economic elements, whilst other areas, such as Jiayuguan Road in the Chengguan district and Dunhuang Road in the Qilihe district, also have an obvious centralized distribution, forming a secondary agglomeration center.
5.3. The Spatial Distribution Characteristics of Industrial Elements
According to the adequacy of the number of POI obtained and the representativeness of the POI types in the economic geographical elements, the POI data of the main industries in the secondary and tertiary industries were selected for analysis. The number of POI data in the primary industry is generally less and the data type is incomplete, which mostly are forest farms and breeding farms, so the POI data from primary industry were not selected for analysis.
5.3.1. The Kernel Density Analysis of Industrial Elements
Secondary Industry
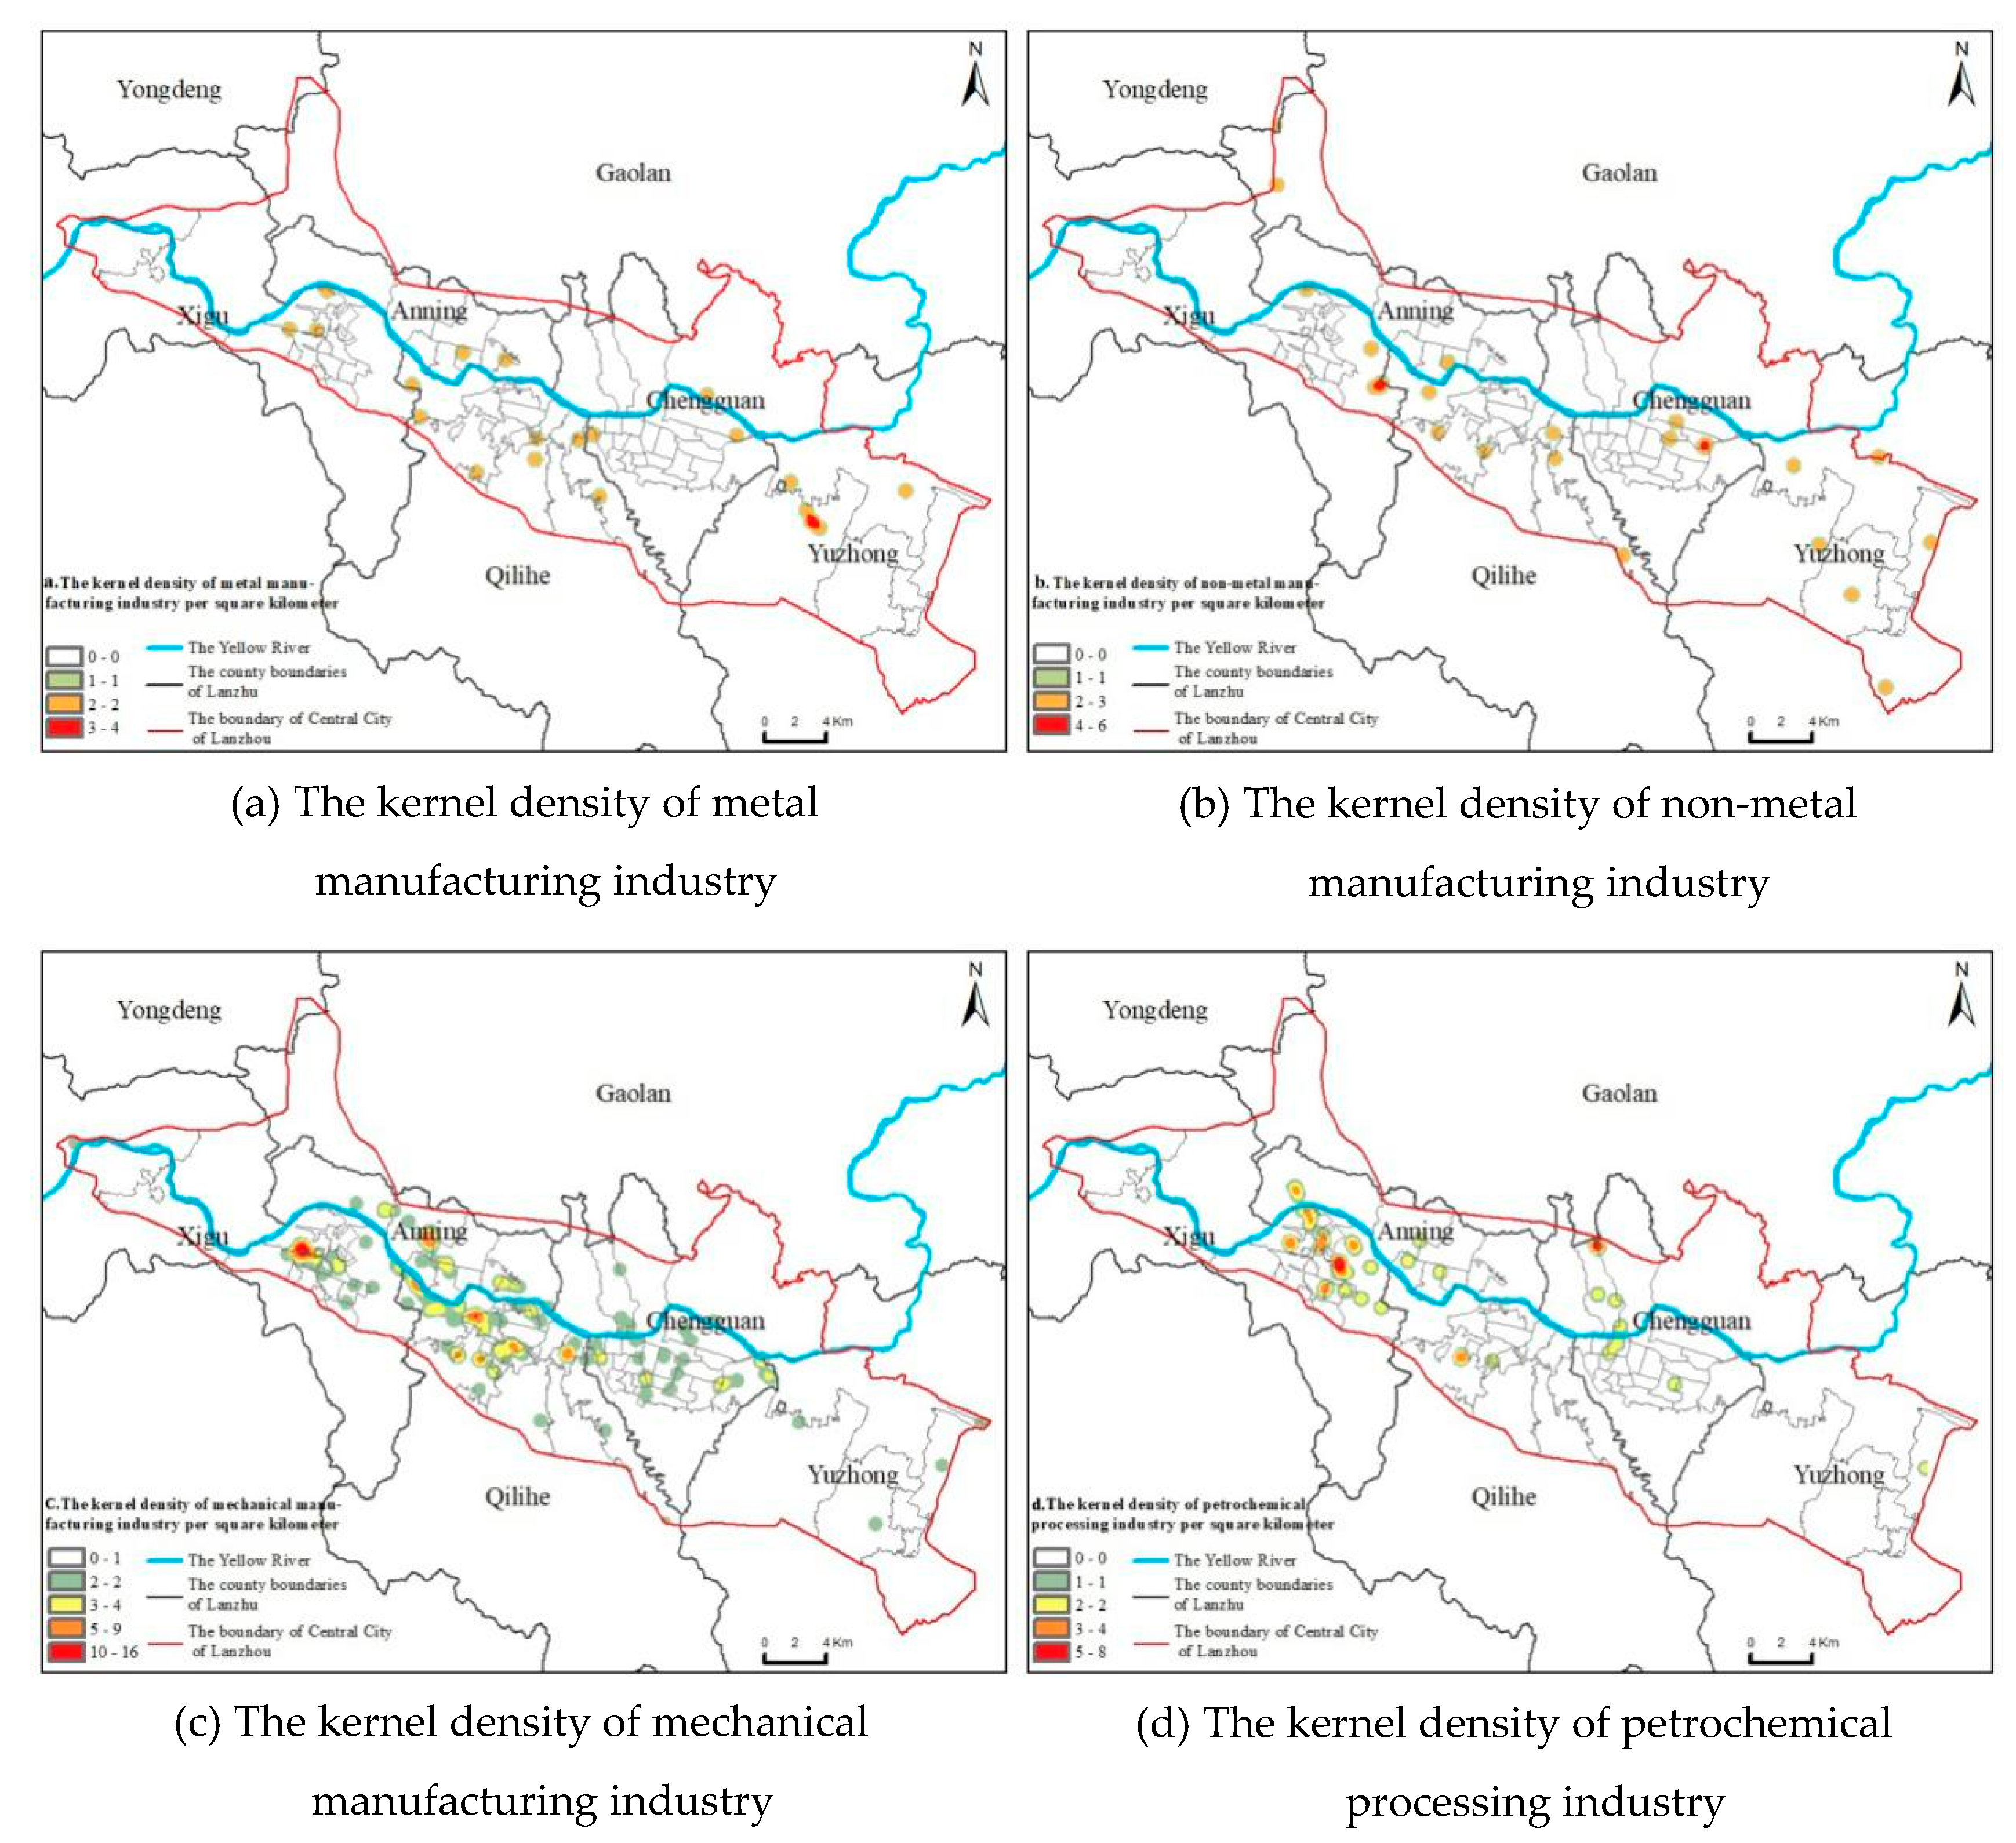
The results of the kernel density analysis of each industry in the secondary industry are shown in
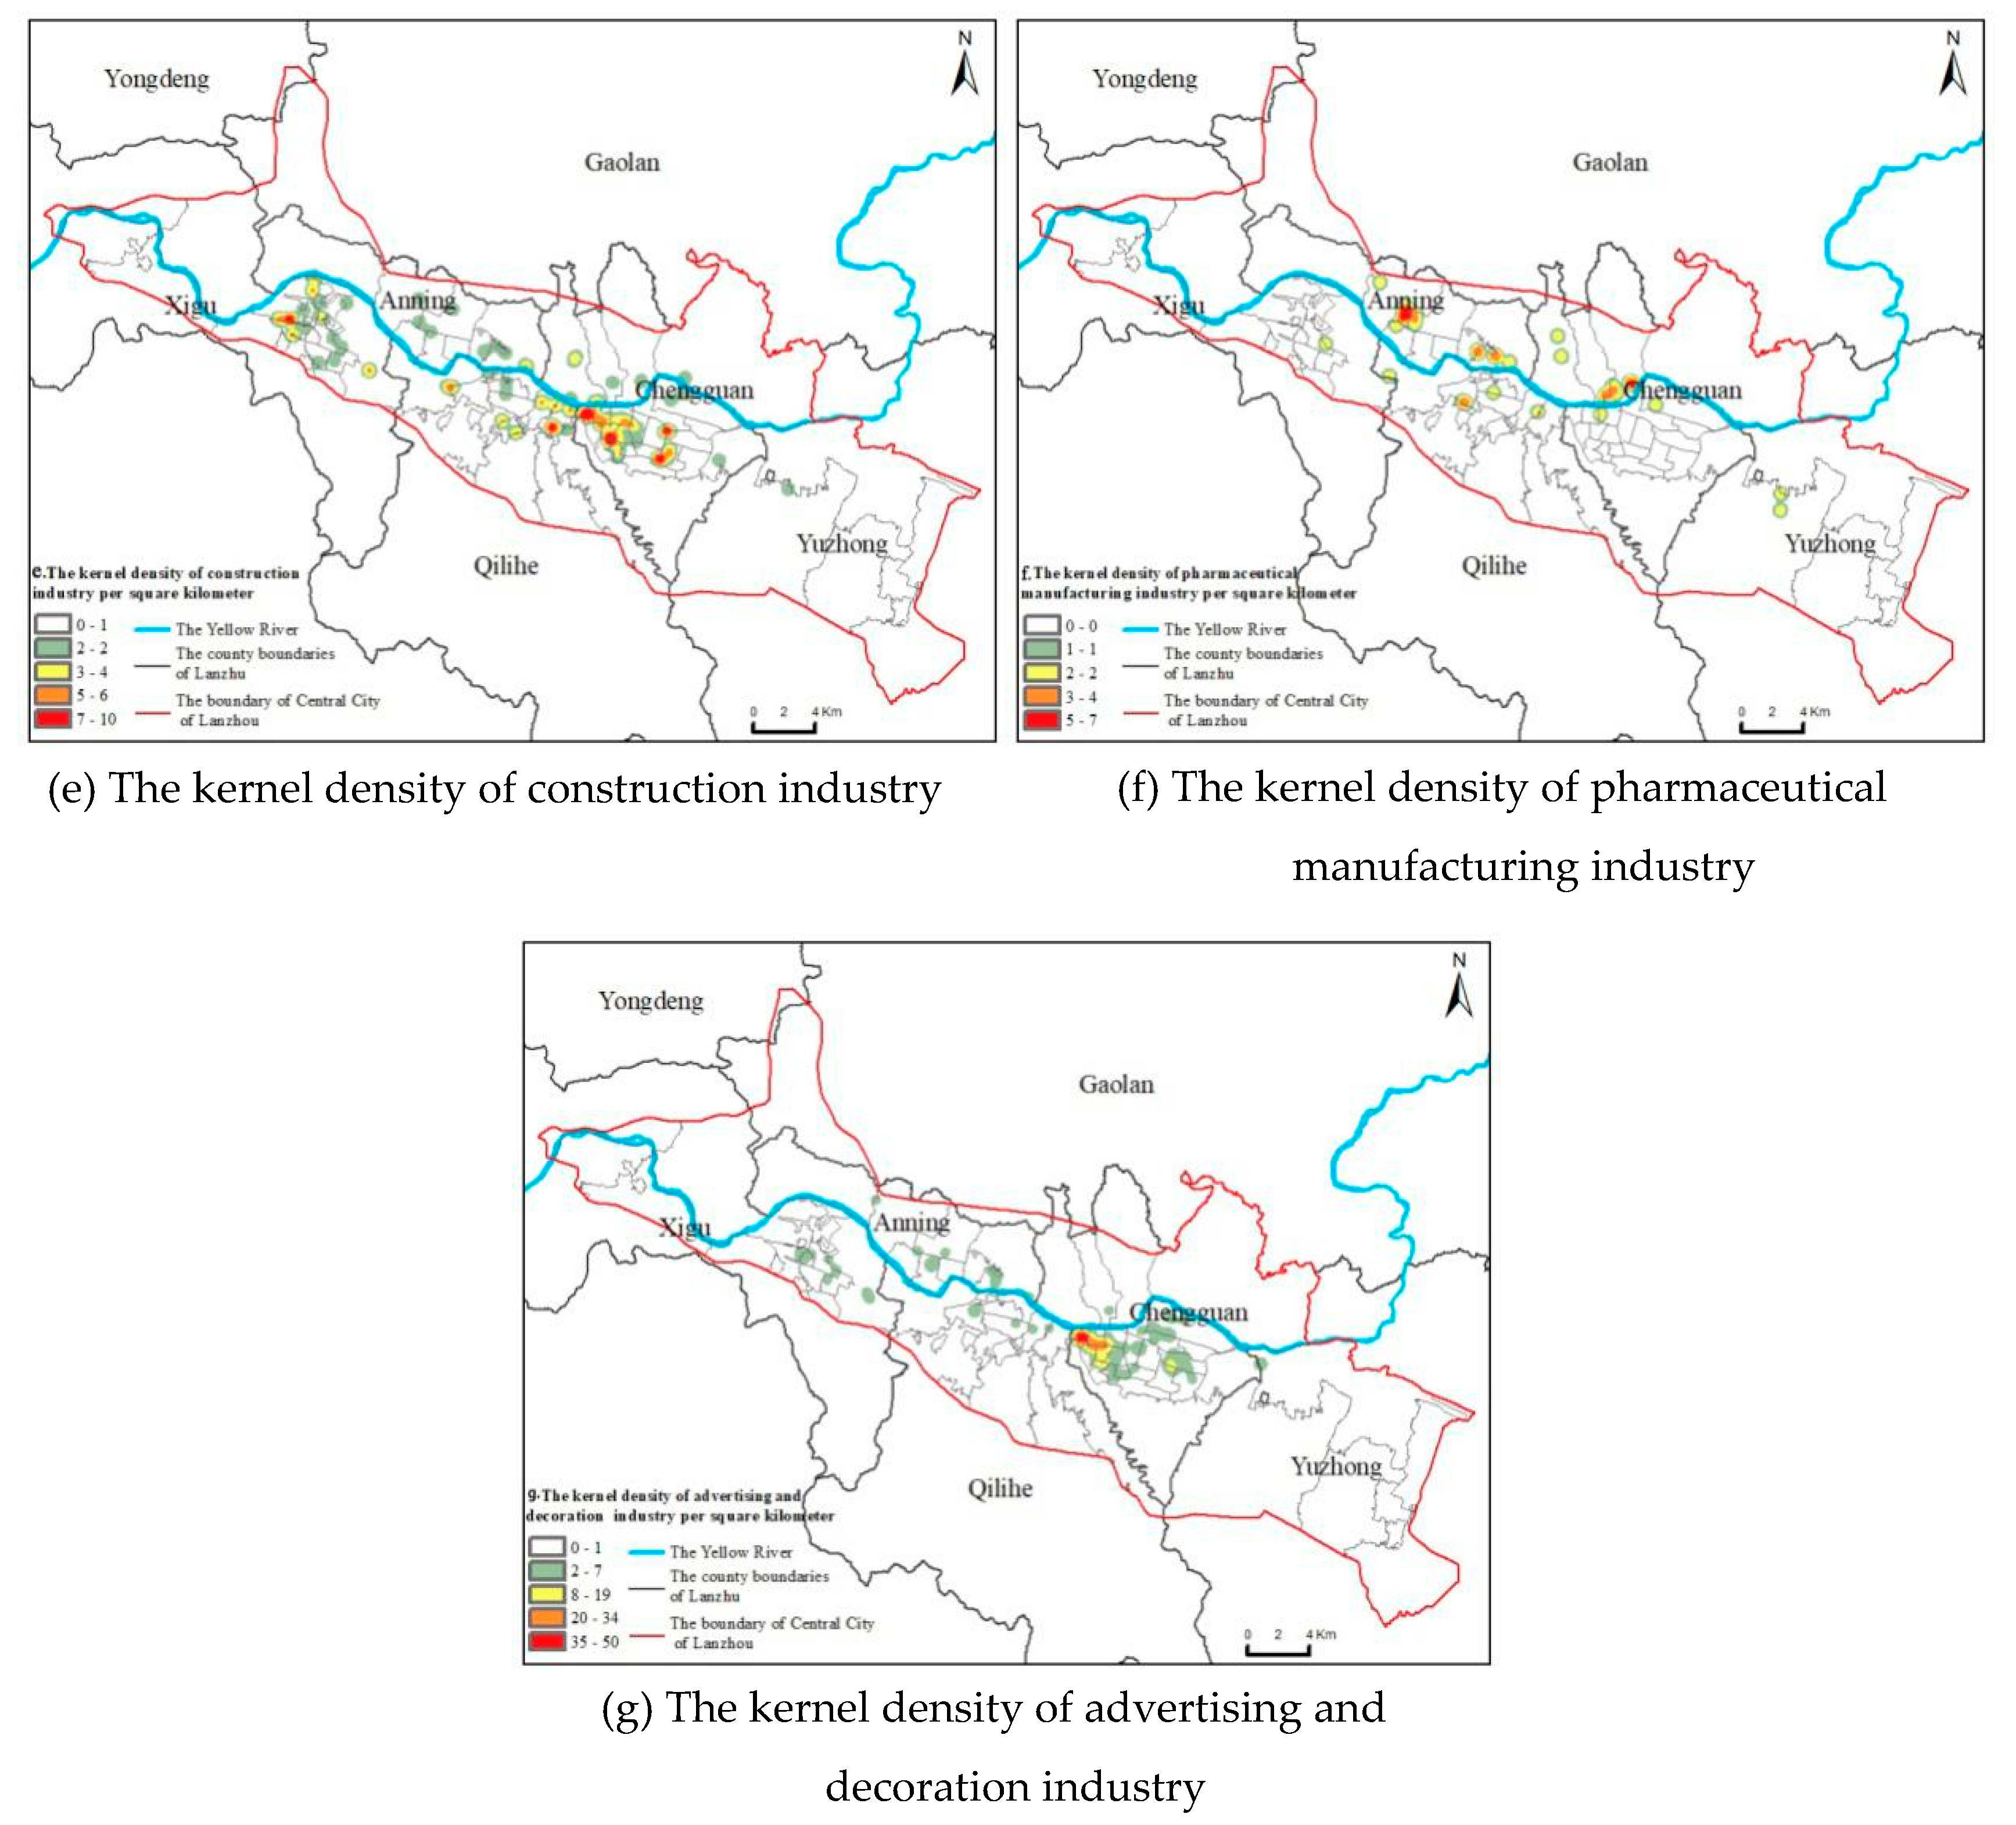
Figure 8. The density value of metal manufacturing elements is between 0 and 4 points per square kilometer, which are distributed in the central urban area but in a small number, and form an aggregation distribution in Yuzhong county. The density value of non-metal manufacturing elements is between 0 and 6 points per square kilometer, and there are more distributions in the central urban area, but it does not reflect the contiguous distribution. The density value of mechanical manufacturing industry elements is between 0 and 16 points per square kilometer, and is concentrated in Xigu district, Qilihe district and Anning district. The density value of petrochemical processing industry elements is between 0 and 8 points per square kilometer, which is mostly concentrated in Xigu district and has formed a high-density contiguous cluster distribution area. The density value of construction industry elements is between 0 and 10 points per square kilometer, which mainly presents a significant polycentric aggregation distribution in the south bank of the Yellow River in the central city. The density value of pharmaceutical manufacturing elements is between 0 and 7 points per square kilometer, which is mainly distributed in Chengguan district. The density value of advertising decoration industry elements is between 0 and 50 points per square kilometer, and the high-density area is mainly in the Chengguan district.
The results of the kernel density analysis show that the overall kernel density of all industries in the secondary industry is not high, and the trend of density diffusion along the gradient is not significant, with most of them presenting a small-scale central agglomeration distribution. The non-metallic, metallic, petrochemical, and mechanical industry elements have a high concentration distribution in the areas on the periphery of the central city. Furthermore, the petrochemical processing enterprises are mostly concentrated in the Xigu District, while the mechanical manufacturing enterprises are widely distributed. The pharmaceutical, architectural, advertising and decoration industry elements in the central area of the central city have a more concentrated distribution.
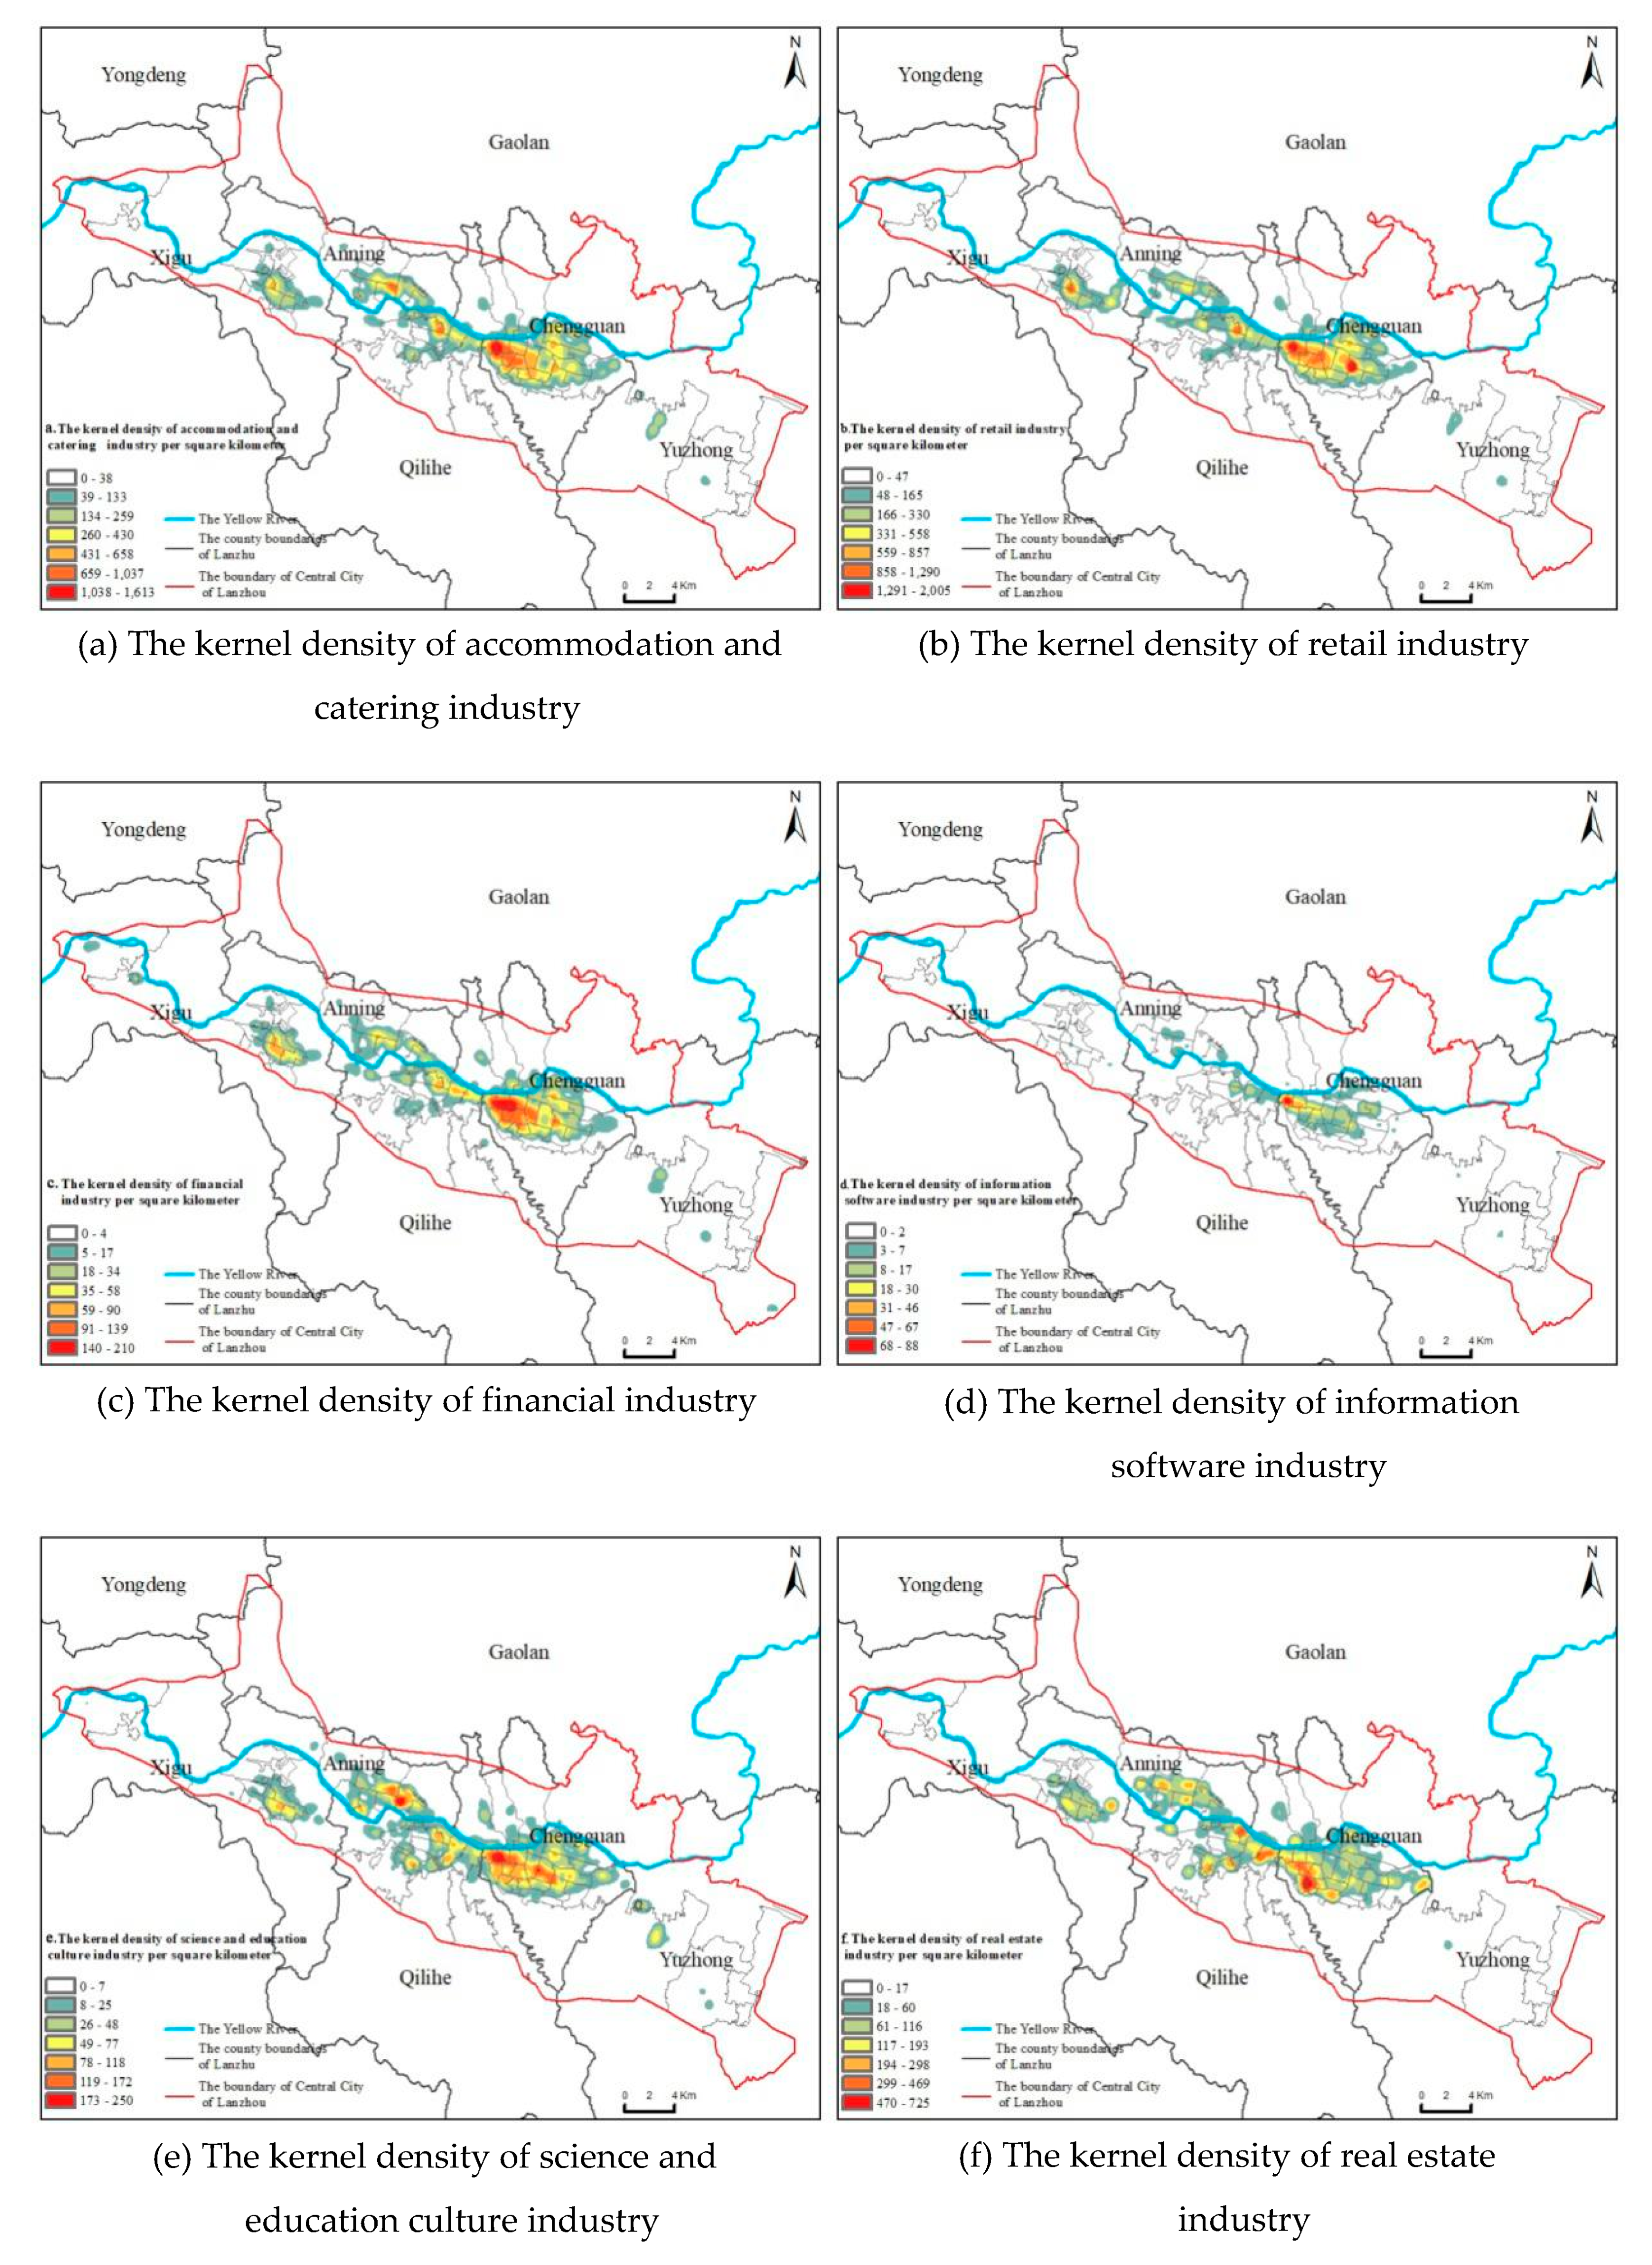
Tertiary Industry
The results of the kernel density analysis of each industry in the tertiary industry are shown in
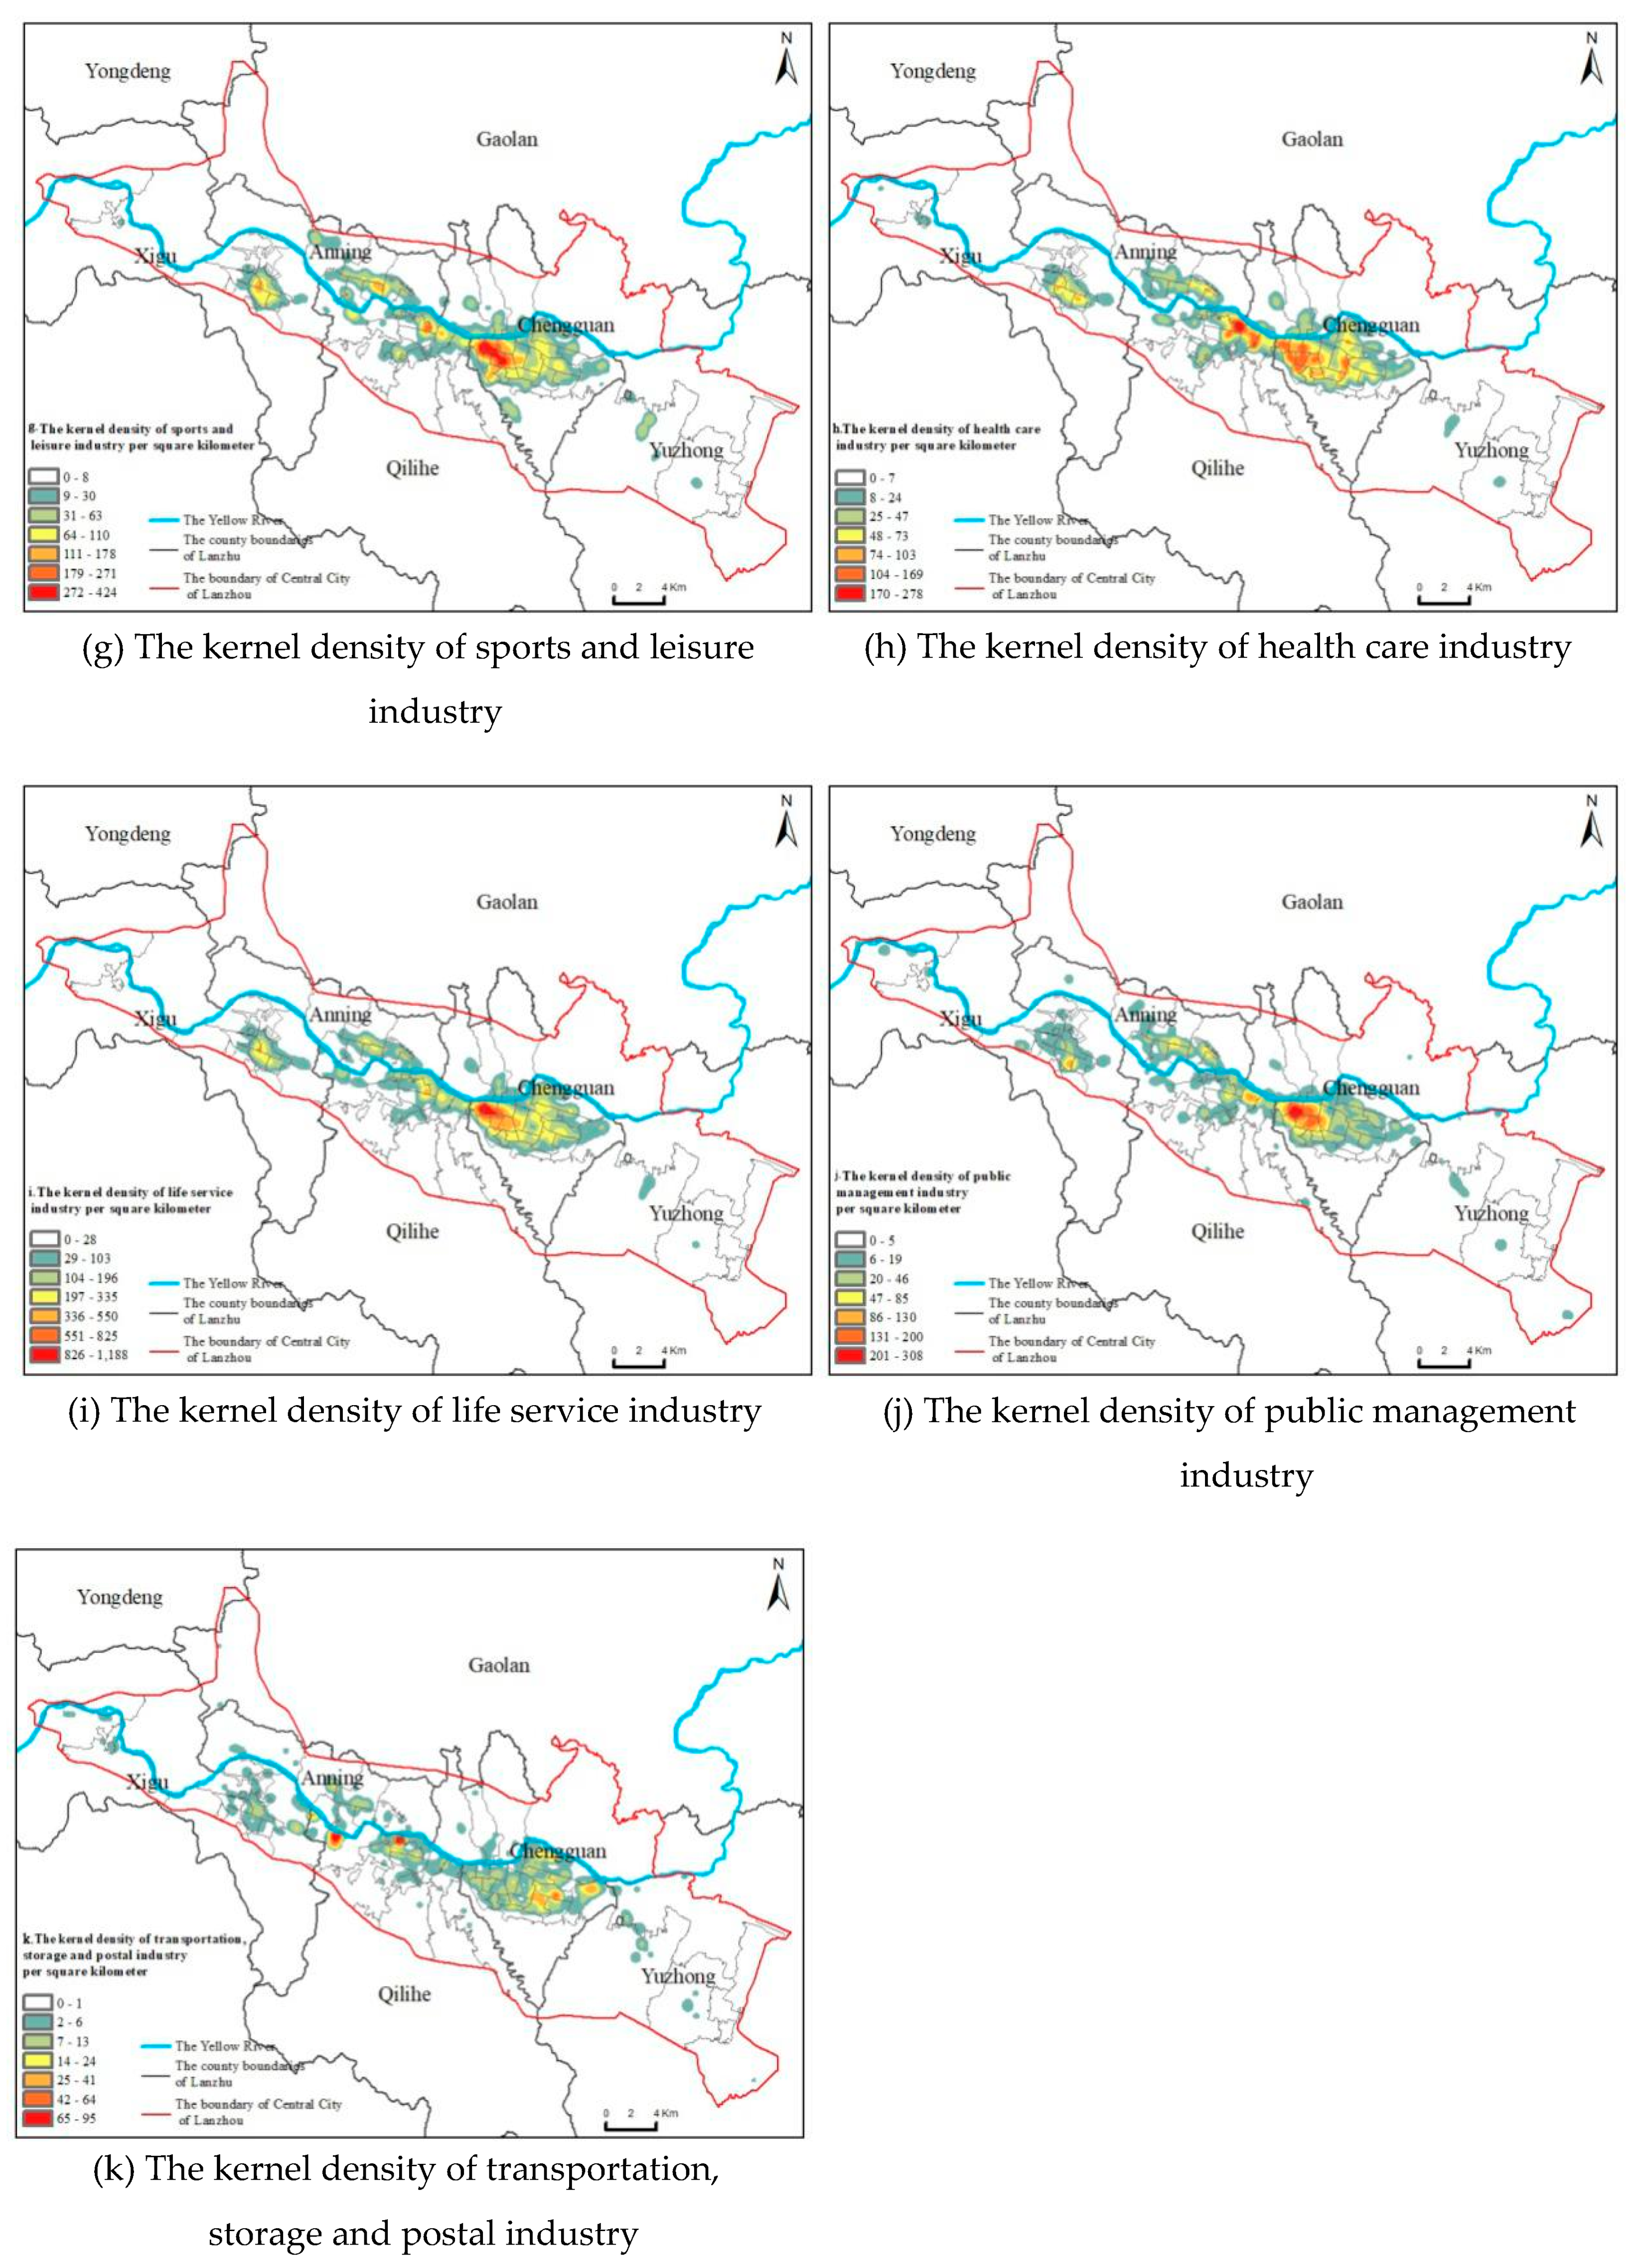
Figure 9. The density value of accommodation and catering industry elements is between 0 and 1613 points per square kilometer, and the distribution characteristics of a single main center and multiple subcenters are obvious. The density value of retail industry elements is between 0 and 2005 points per square kilometer, with obvious multicenter layout, and the highest density value is located in Chengguan district. The density value of financial industry elements is between 0 and 210 points per square kilometer, which is mainly distributed in Chengguan district. The density value of information software industry elements is between 0 and 88 points per square kilometer, which has an obvious single-center layout and significant “center–periphery” difference. The density value of science and education culture industry elements is between 0 and 250 points per square kilometer, and the highest density value is located in Anning district and Chengguan district. The density value of real estate industry elements is between 0 and 725 points per square kilometer, which has obvious spatial structure characteristics with a single main center and multiple subcenters, and the highest density value is located in Chengguan district. The density value of sports and leisure industry elements is between 0 and 424 points per square kilometer, and the core distribution is located in Chengguan district. The density value of health care industry elements is between 0 and 278 points per square kilometer, which has an obvious single main center, and the highest density value is mainly located in Qilihe district. The density value of life service industry elements is between 0 and 1188 points per square kilometer, which has an obvious single main center, and the highest density value is located in Chengguan district. The density value of public management industry elements is between 0 and 308 points per square kilometer, which has an obvious single main center, and the core distribution area is Chengguan district. The density value of transportation, storage, and postal industry elements is between 0 and 95 points per square kilometer, which is concentrated in a small area of Qilihe district.
It can be seen from the results of the kernel density analysis that the healthcare industry has a high concentration distribution in the subcenter of the central city. The transportation, storage, and postal industries are highly concentrated in the area connecting the Qilihe and Xigu districts. The rest of the industries are highly concentrated in the main center of the central city, with the information software industry having the smallest distribution.
5.3.2. The Nearest-Neighbor Analysis of Industry Elements
The results of the nearest-neighbor analysis of each industry element indicate that all industries have different degrees of agglomeration distribution. Generally speaking, in the central urban area the agglomeration degree of tertiary industry is higher than that of secondary industry. In secondary industry, the distribution of the metal manufacturing, petrochemical processing and non-metal manufacturing industries is relatively scattered, the distribution of the mechanical manufacturing, pharmaceutical manufacturing and construction industries is more concentrated, and the distribution of the advertising and decoration industry is the most concentrated. In tertiary industry, the distribution of the information software and transportation, storage, and postal industries is relatively scattered, the distribution of the real estate, science and education, culture, healthcare, and sports leisure industries is relatively concentrated, and the distribution of the retail, accommodation and catering, finance, life services, and public management industries is the most concentrated.
After removing the urban main center with some areas of the Chengguan district as the core, the nearest-neighbor analysis of the various industry elements is carried out again (
Table 2). It can be ascertained that in the secondary industry, the non-metal manufacturing, metal manufacturing, and petrochemical processing industries are mostly distributed outside the main center, and the central agglomeration distribution outside the main center is not significant. Moreover, the mechanical manufacturing and pharmaceutical manufacturing industries exhibit a more pronounced central agglomeration distribution outside the main center and the advertising and decoration and construction industries present a more prominent central agglomeration distribution in the main center. In tertiary industry, the information software, finance, science and education culture, sports and leisure, life services, and public management industries show a more significant distribution in the main center, whilst the retail, accommodation and catering, health care and transportation, storage, and postal industries have little difference in their distribution within and outside the main center. The distribution of the real estate industry outside the main center is slightly higher than that of the central city.
After further removing the urban sub-centers with some areas of Qilihe district, Anning district and Xigu district as the core, the nearest-neighbor analysis of various industry elements factor is conducted again (
Table 2). It can be seen that in the secondary industry, the non-metal manufacturing, metal manufacturing, and petrochemical processing industries are mostly distributed outside the primary and secondary centers, and the central agglomeration distribution is not significant. Furthermore, the mechanical manufacturing and pharmaceutical manufacturing industries are also mostly located outside the primary and secondary centers, but the central agglomeration distribution is significant. Finally, the advertising and decoration and construction industries have a more prominent central agglomeration distribution in the primary and secondary centers, especially in the main center. In tertiary industry, the transportation, storage, and postal industry is highly distributed outside the primary and secondary centers, while the distribution of the remaining industries is increasingly concentrated inside the primary and secondary centers, and the distribution outside the primary and secondary centers is more scattered.
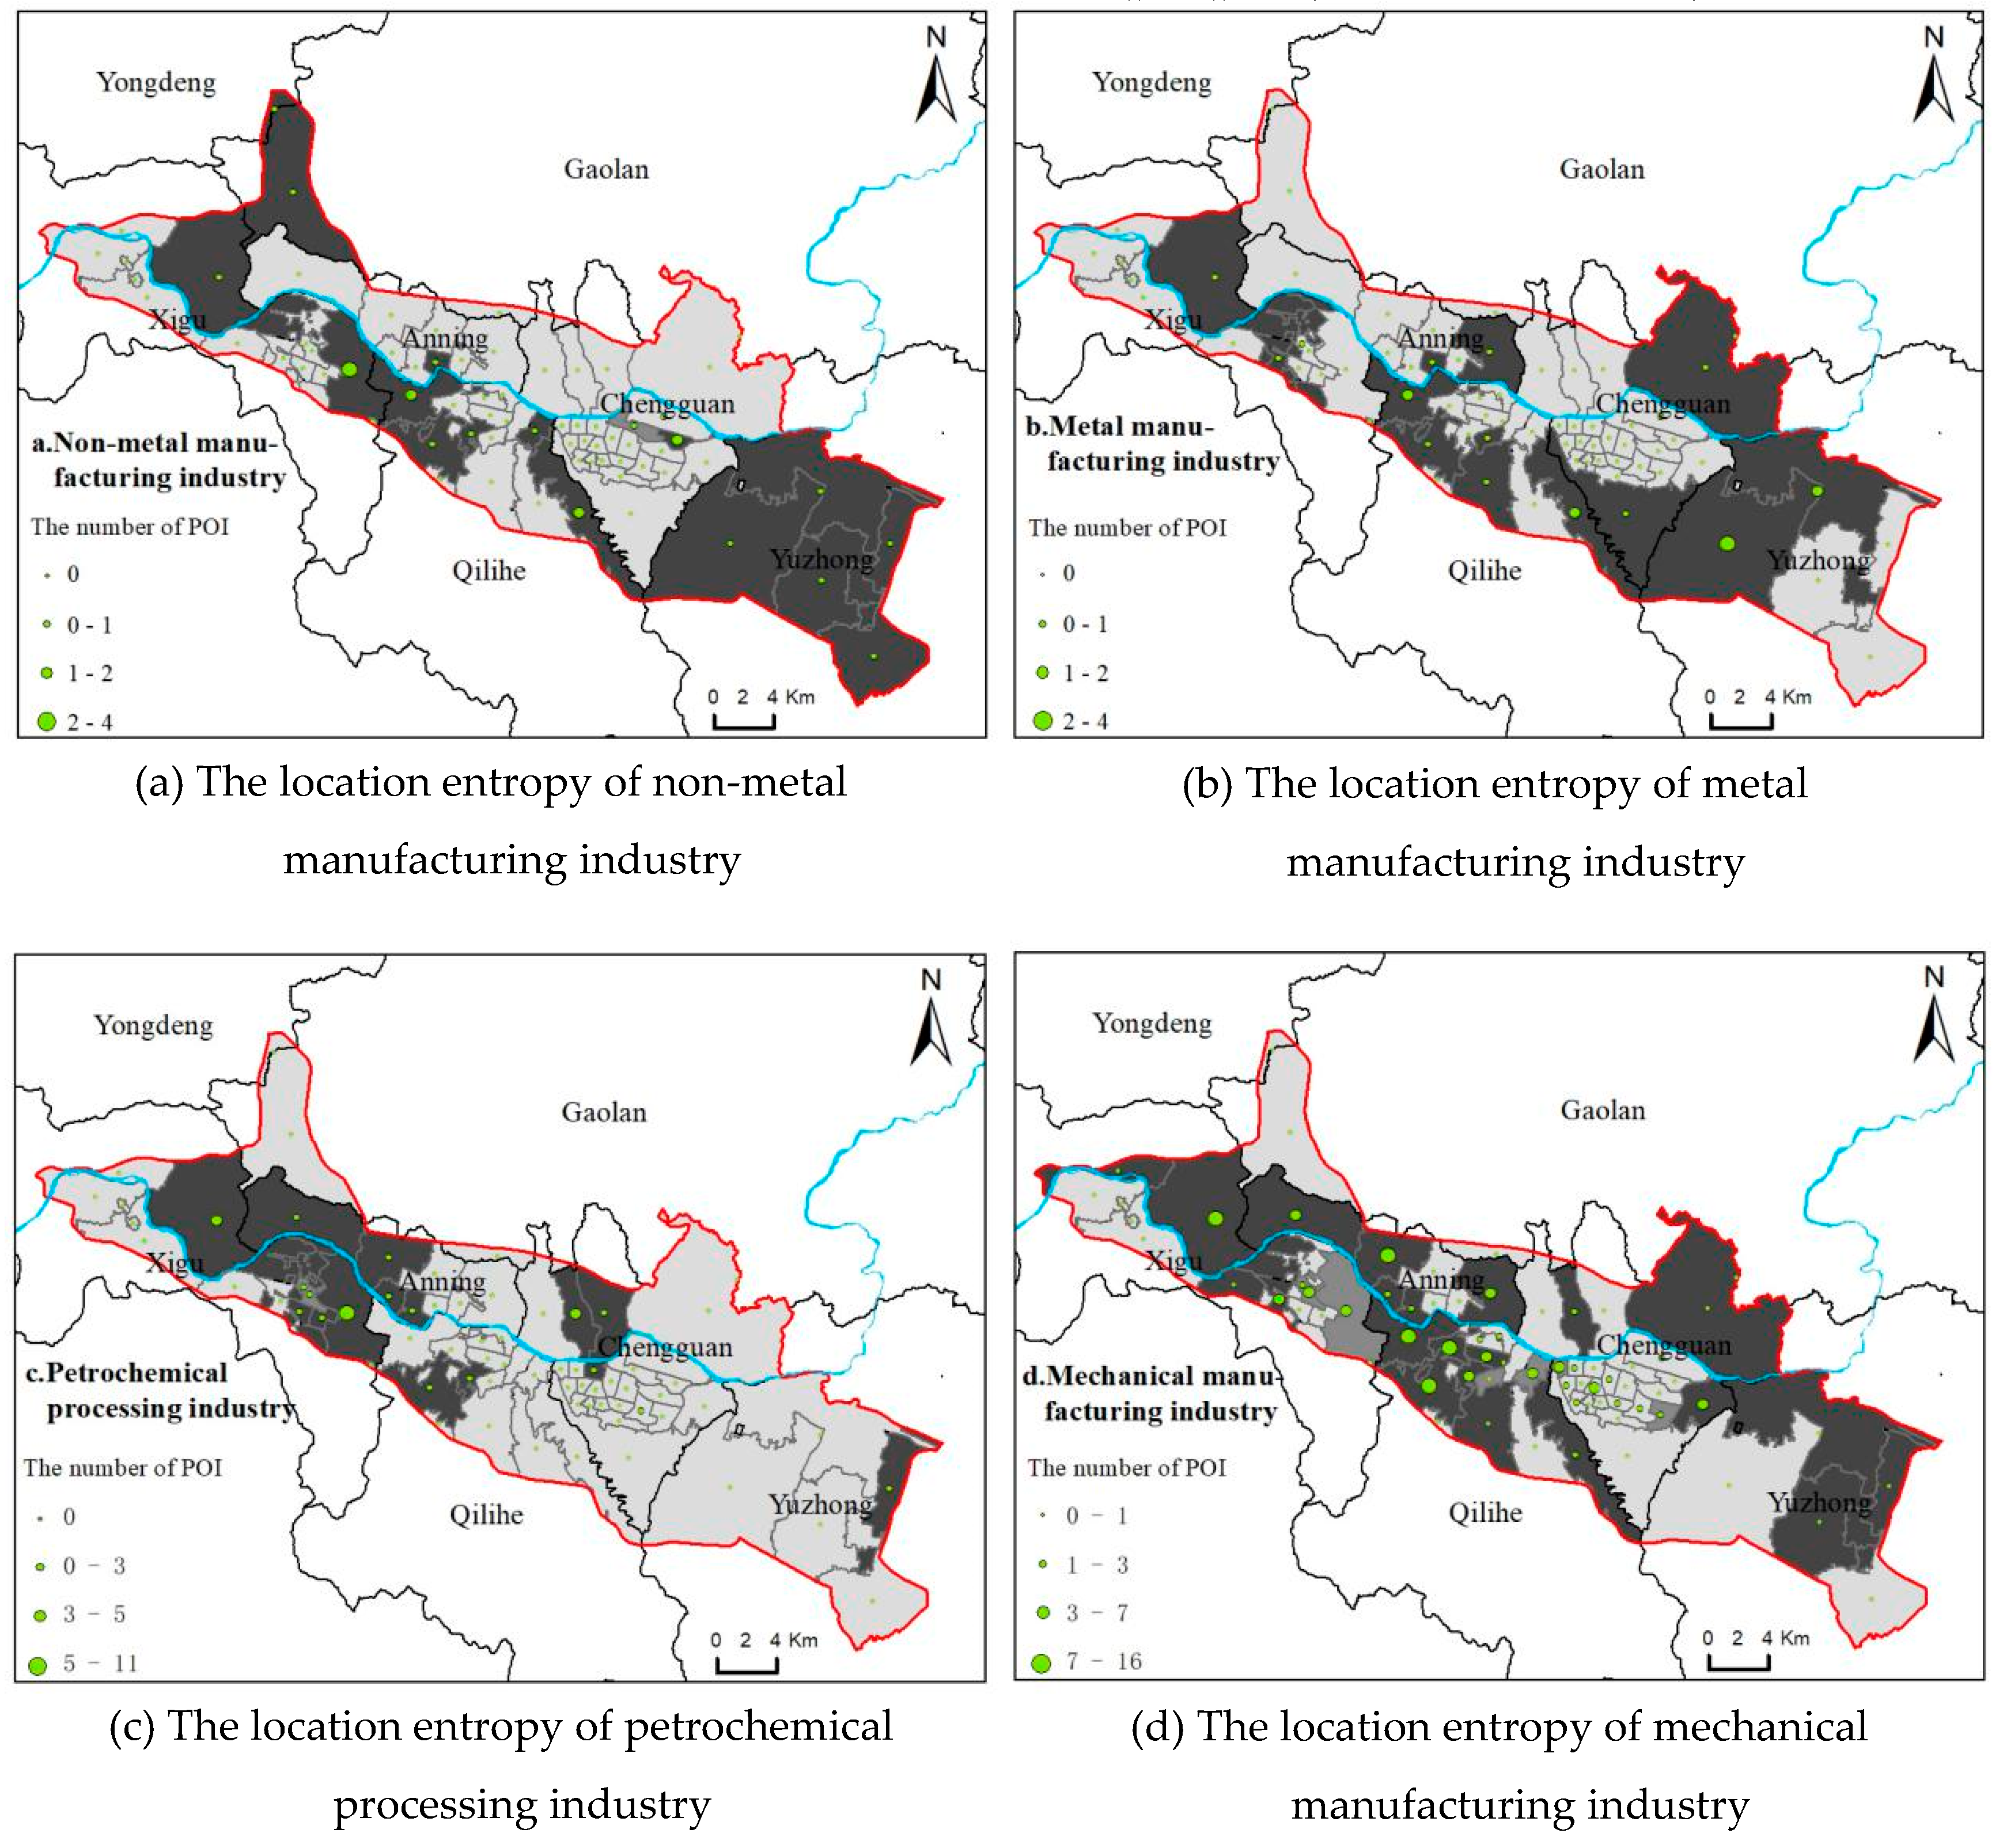
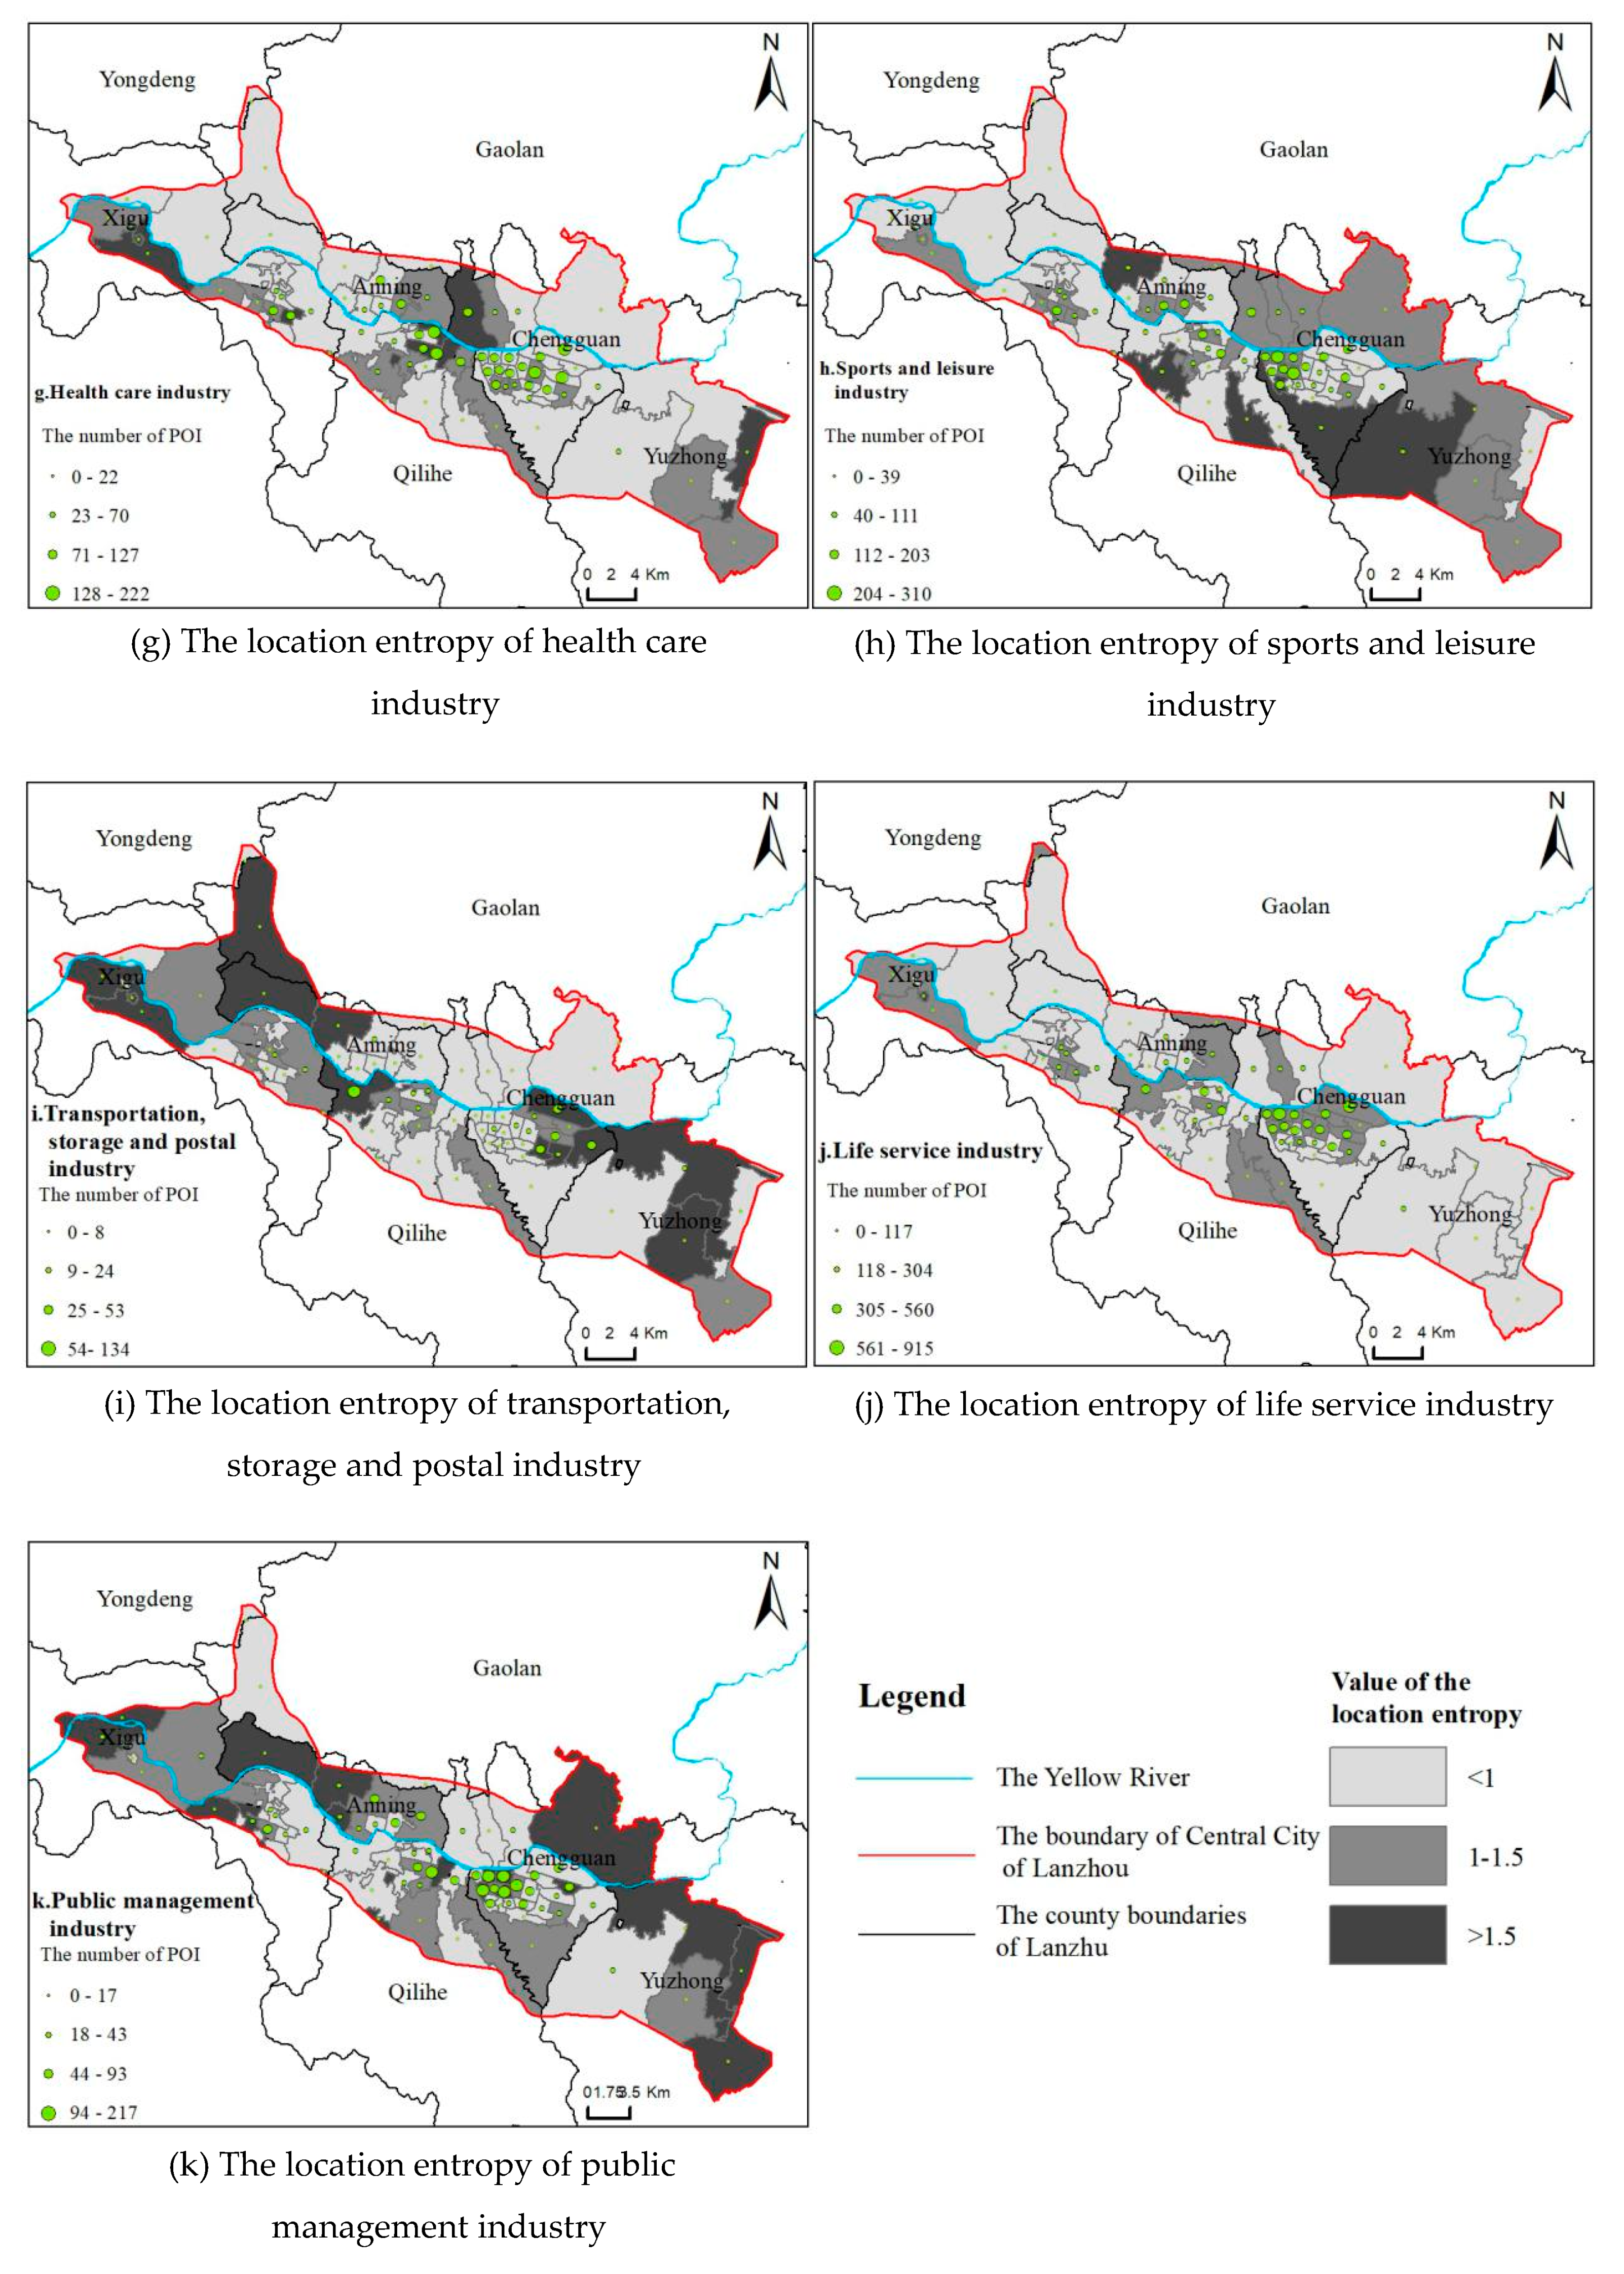
5.3.3. The Differences in Street Function Specialization
A more microscopic street unit is selected to measure location entropy (
Figure 10 and
Figure 11). The results show that there are great differences in the degree of specialization among different industries, and some specialized functional areas have been formed.
Secondary Industry
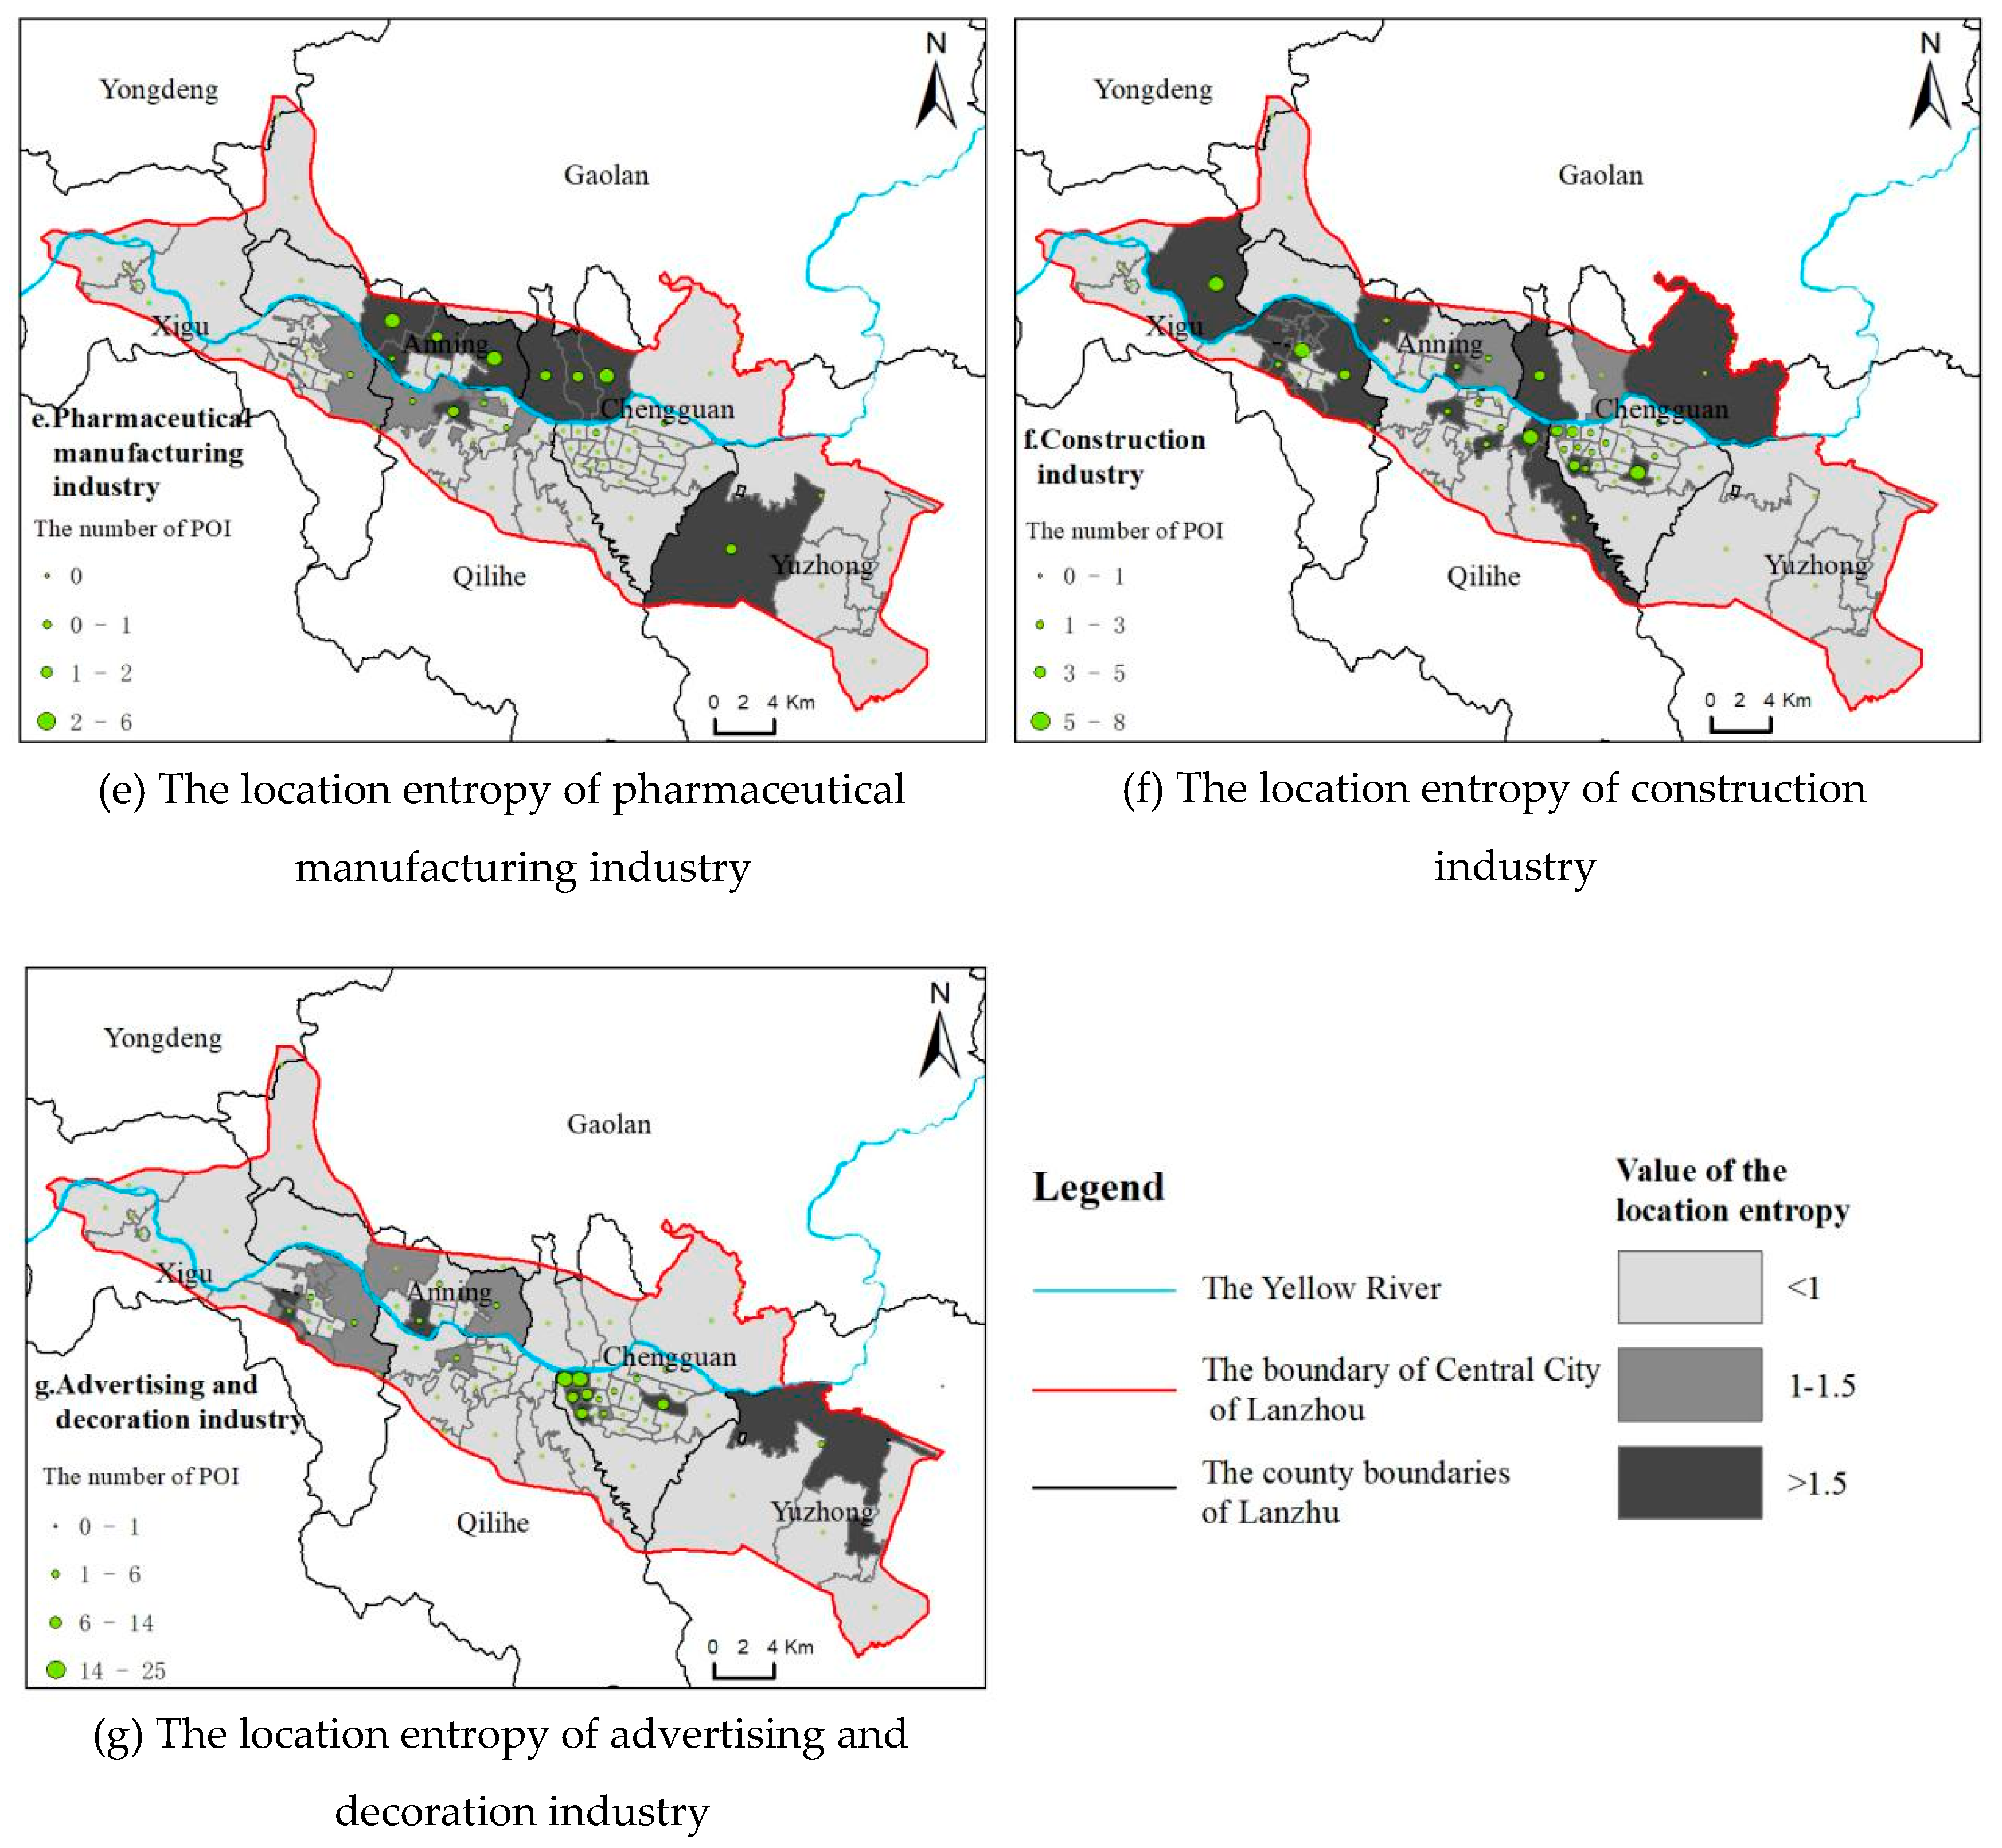
From the perspective of the industry specialization characteristics of various streets, a number of them show significant advantages in the various industries of the secondary industry, such as the petrochemical, machinery, and medicine industries of Caochang Street. There are also a few streets that exhibit significant advantages in a single industry, such as the petrochemical processing industry of Fuli Road. Furthermore, the location entropy of each industry in some streets, such as Donggang West Road, is less than 1, indicating that the developmental level of the secondary industry in these streets is relatively low, and the development of each industry is not completely mature.
Judging from the street specialization characteristics of various industries, these industries have formed a number of significant specialized functional areas, especially the most specialized streets of the mechanical processing industry, which shows that the regional specialization is more significant. In terms of spatial distribution, there are more specialized functional areas in the construction and advertising and decoration industries in the central streets of the central city, and more specialized functional areas in other industries in the streets on the periphery of the central city.
Tertiary Industry
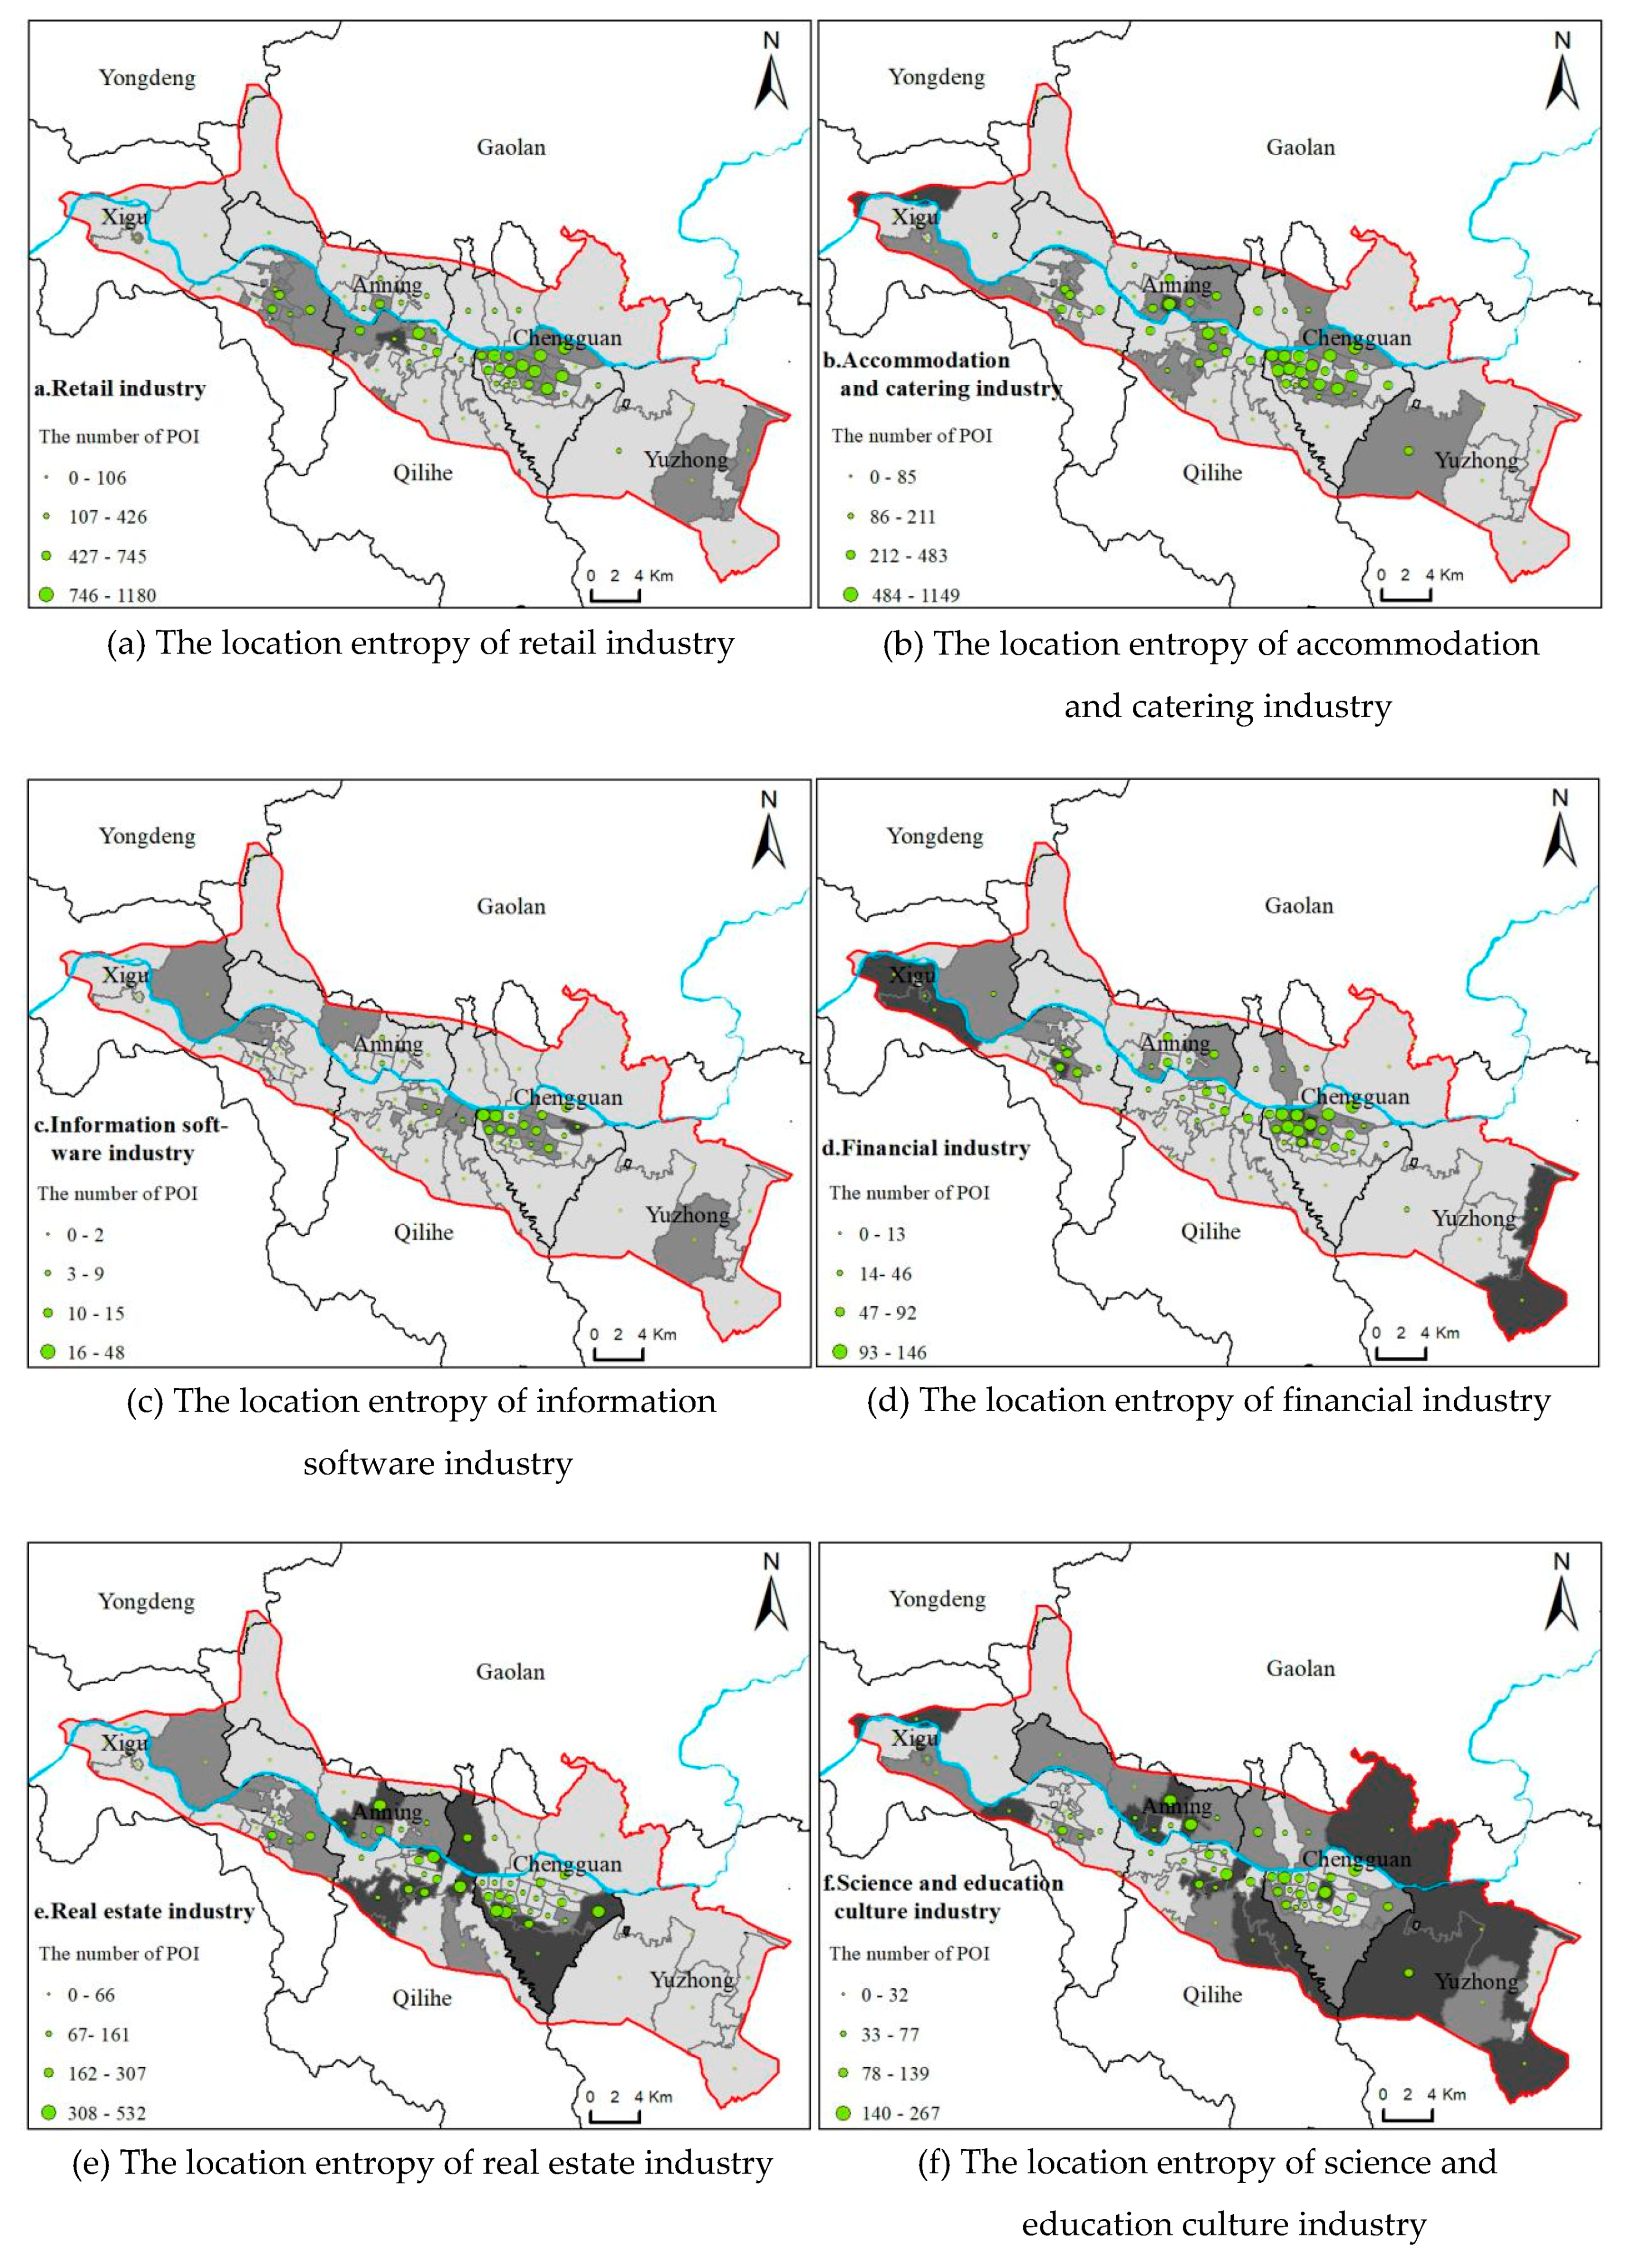
From the perspective of the industry specialization characteristics of various streets, a number of them exhibit significant advantages in the various industries of the tertiary industry; for example, the transportation, storage and postal, sports and leisure, and public management industries of Anningbao Street. There are also many streets that exhibit significant advantages for a single industry, such as the financial industry of Guangwumen Road. Furthermore, the location entropy of each industry in some streets, such as Dunhuang Road, is less than 1, indicating that the developmental level of the tertiary industry in these streets is relatively low, and the development of each industry is not completely mature.
Judging from the street specialization characteristics of various industries, in addition to the retail, life service and accommodation and catering industries, other industries have formed a number of significant specialized functional areas, which shows that the geographical specialization characteristics of these industries are more significant. In terms of spatial distribution, there are many specialized functional areas in the information software, real estate, and healthcare industries in the central streets of the central city, whilst the specialized functional areas of other industries are more in streets on the periphery of the central city.
5.4. The Characteristics of the Urban Spatial Structure
Analyzing the spatial distribution characteristics of POI of various industries in the central city of Lanzhou by using nearest-neighbor index, KDE and location entropy, the above results are obtained. Through these results, the urban spatial structure characteristics in the central city of Lanzhou are summarized.
As a whole, the central urban area of Lanzhou presents a continuous linear city spatial structure of “one main area, three subareas and multiple areas”. The “main center” is the core area of the Chengguan district. A variety of tertiary industries are located in this area and form a specialized functional area, which undertakes many functions at the city level. The “subcenter” refers to the core areas of the Qilihe district, Xigu district and Anning district, forming a secondary industry agglomeration area and undertaking various functions at the district level. The “multiple area” refers to small area centers such as the Yanchang region, Jiuzhou City and the Xiuchuan new village, which are key urban development areas. In each central area, business, entertainment and office industries occupy their core locations. Among the “one main area, three sub areas and multiple areas”, mechanical manufacturing, transportation, storage and postal, construction, and non-metal manufacturing industries are used for filling and connection, and their distribution is obvious along the various streets. It can be seen that the urban spatial structure model of the Lanzhou central city conforms to the classic model of urban development, including the core area, central area and edge zone, which forms a spatial structure pattern consistent with the relevant theories, such as differential rent theory.
6. Conclusions
The urban economic geographical elements generally present the distribution trend of center agglomeration. In respect of spatial distribution, the economic geographical elements in the central urban area of Lanzhou have obvious characteristics of central agglomeration. Many industrial elements have large-scale agglomeration centers, which have formed specialized functional areas. There is a clear “central-peripheral” difference distribution in space, with an obvious circular structure. Generally, tertiary industry is distributed in the central area, and secondary industry is distributed in the peripheral areas.
In general, a strip-shaped urban spatial structure with a strong main center, weak sub center, and multiple groups is present. The main center is the core area of the Chengguan district. Many industries are located in this area and form a specialized functional area, which undertakes many functions at the city level. The three subcenters are the core areas of the Qilihe district, Anning district, and Xigu district, forming a secondary industry agglomeration area and undertaking various functions at the district level. Multiple areas form small area centers, which are key urban cluster development areas. At present, the overall spatial structure of the city is transitioning from a multicenter structure, with a large energy level gap, to a multicenter structure with a balanced development. The marginalization of some functional elements is obvious.
Improving the complexity of urban functional space is an important goal of spatial structure optimization. By comprehensively and effectively arranging various industrial elements, strengthening the guidance of the traffic network to the urban functional space, and strengthening the links among the various regions of the city, the complexity of the urban functional space can be ultimately improved; subsequently, the optimization of the urban spatial structure can be realized to promote the sustainable development of the city.


 ,
, 


