Think Spatially With Game Engine


1
Departamento de Técnicas y Proyectos en Ingeniería y Arquitectura, Área de Ingeniería Cartográfica, Geodésica y Fotogrametría, Universidad de La Laguna, España, Escuela Politécnica Superior de Ingeniería, Carretera general de Geneto, 2. 38071, La Laguna, Tenerife, 922 318521 Islas Canarias, Spain
2
Department of Psychological & Brian Sciences, University of California Santa Barbara, 251, University of California Santa Barbara, Santa Barbara, CA 93106, USA
3
Departamento de Técnicas y Proyectos en Ingeniería y Arquitectura, Área de Expresión Gráfica en la Ingeniería, Universidad de La Laguna, Escuela Politécnica Superior de Ingeniería, Carretera general de Geneto, 2. 38071 La Laguna, Tenerife, Islas Canarias, Spain
4
Departamento de Psicología Clínica, Psicobiología y Metodología, Área de Metodología de las Ciencias del Comportamiento, Universidad de La Laguna, Sección de Psicología y Logopedia, Facultad de Ciencias de la Salud, Campus Guajara, 38071 La Laguna, Tenerife, Islas Canarias, Spain
*
Author to whom correspondence should be addressed.
ISPRS Int. J. Geo-Inf. 2020, 9(3), 159; https://0-doi-org.brum.beds.ac.uk/10.3390/ijgi9030159
Submission received: 28 December 2019
/
Revised: 18 February 2020
/
Accepted: 7 March 2020
/
Published: 9 March 2020
(This article belongs to the Special Issue Gaming and Geospatial Information)
Abstract
:Spatial thinking and spatial orientation skills are involved in tasks related to the recognition of landforms, mapping, spatial interpretation, and landscape analysis, and can be developed with specific training. Game engines can facilitate the creation of 3D virtual landforms and provide powerful rendering engines for the graphical representation of landscapes from a first-person perspective. In the present research, 27 engineering students participated in a workshop in a first-person virtual environment using landforms created with a game engine. The Spatial Thinking Ability Test and the Perspective Taking-Spatial Orientation Test measured improvement in spatial thinking and spatial orientation as a result of this workshop. The gain in spatial thinking (8.31%) is within the range observed in previous research in the field of geography using a web-based GIS strategy (7.31%–10.00%). The gain in Spatial Orientation skill (15.76%) is comparable with previous research using both first-person strategies based in urban virtual environments (14.23%), and Spatial Data Infrastructures (gains between 21.17% and 21.34%). Participants with better self-reported sense of direction had better performance on the spatial orientation test.
1. Introduction
This research analyzes the effectiveness of the Unity3D game engine for geospatial training, studying its impact on the development of spatial thinking and spatial orientation skills through user-based generation, visualization, and localization of three-dimensional landforms.
Spatial thinking is used for geospatial information processing and for decision-making in landscape analysis and design. Spatial thinking enables the resolution of spatial problems, in tasks related to interpretation and processing of 2D and 3D geospatial information, and it is central to the recognition of landforms (dunes, hills, valleys, shapes, mountains, depths, slopes, mountains, etc.). Spatial thinking combines spatial representation with reasoning about spatial relationships [1]. One component of spatial thinking is spatial orientation [2], which can be defined as the ability to stay oriented in a spatial context when objects are observed from different positions and directions [3]. This skill is also required for mapping, spatial interpretation, wayfinding, and landscape analysis.
The landforms play a relevant role in the spatial thinking and spatial orientation skills, since these landforms can be used as landmarks, defined as “any feature in the environment to which spatial thinking refers” [4,5,6,7,8]. In this context, in tasks related to geographical representation/interpretation of the land, the technologies for landform graphic representation play a relevant role in spatial reasoning. Two-dimensional maps have been the classic method for representing terrain. However, authors like Ruzinoor et al. [9] affirm that graphic representations of terrain in 3D can facilitate perception and comprehension of landforms, compared to the normal 2D map, since map reading requires an understanding of conventions and greater visualization skills, along with map-reading skills. Recent research has shown the potential of 3D tools, such as augmented reality for the graphic representation and 3D visualization of landforms in the development of spatial thinking and spatial orientation [2,10].
In the field of 3D graphic representation, another powerful tool are the game engines, which allow 3D graphic representation of terrain forms. A game engine is composed of a series of tools designed to create video games (and the scenarios in which these video games are developed). In this sense, game engines can offer a realistic virtual environment of high graphic quality for the graphic representation of geomorphological landforms, and allow the user to have a first-person experience of the environment, similar to a real-world situation. Sanchez [11] showed that video games could offer positive effects in the field of spatial thinking and visuospatial abilities. It is interesting, therefore, to research the possibilities offered by games engines for the development of spatial skills.
Considering that spatial skills can be improved with specific training [12,13], the present work reports the impact on spatial thinking and spatial orientation skill development of a workshop called “Unity3D landforms workshop”. The research hypothesis was: “Unity3D game engine can improve the spatial thinking and spatial orientation skills”. In the workshop, 27 civil engineering students of La Laguna University modeled landforms and used a first-person interface created with the Unity3D game engine to experience a first-person perspective of those landforms. In this first-person perspective, the participants needed to locate (N, S, E, and W) different landforms visible front their current position using the position of the sun.
The Spatial Thinking Ability Test (STAT) [7] measured spatial thinking improvement, and the Perspective Taking-Spatial Orientation Test (PTSOT) [14,15] measured spatial orientation skill improvement as a result of participating in this workshop. These tests were administered both before and after the training activity (pre- and post- tests). It was interesting, in turn, to check if the orientation tasks carried out in this game engine virtual environment were correlated with participants’ self-reported spatial orientation skills. For this purpose, the Santa Barbara Sense of Direction Scale (SBSOD) was used [16].
2. Spatial Thinking and Spatial Orientation
In the present research, spatial thinking and spatial orientation skills were examined in the context of 3D landform generation. Spatial thinking is needed in the recognition of these landforms and spatial orientation is used to position them with respect to N, S, E, and W, having the sun as a geographical reference.
2.1. Spatial Thinking
Gersmehl and Gersmehl [17,18] defined spatial thinking as the skills that geographers use to analyze the spatial relationships of a geographical environment. In their definition of spatial thinking, these authors included tasks related to the definition of a location, the geographic concept of the site, analysis of spatial connection (situation), spatial comparison, identification of a place in a spatial hierarchy (recognition of spatial form), recognition of spatial analogies, and design and use of a spatial model. These tasks are related with the activities carried out in the present research. Spatial thinking and modeling give rise to new approaches for studies in the field of geography, engineering, architecture, and landscape design [19]. The ability to understand and manipulate terrain graphic representations, and other spatial relationships, is a skill that is relevant to conceptualizing space, working with spatial technologies, and geographic thinking [20].
There is growing recognition in both academic and professional fields of the relevance of spatial thinking. It is an important factor in STEM (science, technology, engineering, and mathematics) fields [21,22,23], and governments, educators, and professionals in the private sector consider it to be a high-value geographic skill [24] The National Science Foundation (NSF), the National Aeronautics and Space Administration (NASA), the National Geographic Survey (NGS) and the United States Geological Survey (USGS) consider spatial thinking an important competence for students to acquire. In the European context of Higher Education, there are also numerous skills related to spatial thinking in the geographic field [25].
There was a previous work related to spatial thinking in the field of geography with pre- and post-STAT mean scores. It was a research in which the participants worked with another geographical representation environment: Geographic Information Systems (GIS). Jo, Hong, and Verma [26] performed a web-based GIS workshop with students of Texas State University and University of Georgia. Participants had no previous GIS experience. The web-based GIS activities performed were focused on typical GIS tasks, such as the organization and communication of geographic information, spatial relationships among the geographic regions (demographic, cultural, political, economic, etc.), and the application of geographical concepts to analyze world patterns, among others. They also carried out activities related to geospatial graphic representations, understanding of geographical concepts, and localization tasks. The researchers found significant gains between 1.17 (Texas State) and 1.60 (University of Georgia) between STAT pre- and post- measurements (7.31% and 10.00%, respectively), which suggests that spatial thinking is trainable. Although it cannot be compared with the activities carried out in the present research, nor with the 3D work environment, it is the only research in which results measured with the STAT have been shown.
Moreover, there was a recent research related to spatial thinking in 3D rendering environments [27] that is interesting to comment because engineering students also carried out activities related to the generation of landforms, but using other 3D tools. In this research the STAT test was not used. Participants constructed different landforms based on 2D (maps) and 3D visualizations (digital terrain models). They did it in digital and tangible format. For the digital format they used the Sketch Up software. For the tangible format (technique of manufacturing stacked slices) they used Autodesk 123D Make. The research focused on the ability to interpret in relief, measured with the Topographic Map Assessment (TMA) [28]. The results showed a significant improvement in the ability to interpret relief, with gains between 12.6% (Sketch Up) and 10.7% (AutoDesk 123 Make), respectively, of the highest possible total score of the TMA. The TMA tool, the instructions, and the TMA keys are available at https://www.silc.northwestern.edu/topographic-map-assessment-tma/.
2.2. Spatial Orientation
Spatial orientation is defined as “the ability to physically or mentally orientate oneself in space” [29] (p. 71). This spatial skill involves the ability to imagine what a scene will look like from different perspectives, that is, spatial orientation regulates the perception of visual stimuli from multiple perspectives in space [14]. Authors such as Bodner and Guay [28,29,30,31], and Linn and Petersen [30], consider spatial orientation to be a principal component of spatial thinking. In their definition of spatial thinking, Gersmehl and Gersmehl [17,18] include parameters, such as defining a location, describing conditions (the geographic concept of site), tracing spatial connections (situation), making a spatial comparison, identifying a spatial analog, and mapping spatial exceptions. These parameters are used in the visualization, interpretation, and characterization of the landforms, which in turn make up the perception of self-orientation in space.
In recent years, spatial orientation skill has also garnered academic interest. The development of spatial orientation is included in the objectives of institutions such as the National Council of Teachers of Mathematics [32] as a fundamental tool for describing and modeling the physical world. Researchers in the fields of mathematics [26,33] and geography and geospatial fields [34], recommend the inclusion of spatial orientation development in educational environments. Given the importance of spatial orientation as a component of spatial thinking, the present work also focuses on this skill, measured by the Perspective Taking-Spatial Orientation Test [14,15].
Previous studies have examined improvement on the PTSOT as a result of working with different topographical representation tools. In a report of a multi-year study carried out by Carbonell-Carrera and Hess-Medler [35], second-year engineering students used the Spatial Data Infrastructure (SDI) tool to locate positions using 2D graphic representations of the land, such as ortophotos, maps, and plans. After using the SDI tool, there were significant gains between 21.17 % (19.06°) and 21.34 % (19.21°) on the PTSOT. A significant gain of 22.37 % (20.14°) on the PTSOT test was found in other research, which allowed students to work with 2D graphic representations of landforms (maps with contour lines) and with 3D landform using Augmented Reality (AR) technology [2].
In these previous studies, participants worked with terrain using SDI and AR. In a recent research by Carbonell and Saorin [36], participants utilized a first-person urban environment using Street View, in which students relied on landmarks (e.g., characteristics of buildings, streets, etc.) to develop a sense of orientation within the environment. Experiencing this environment yielded a significant gain of 14.23% (12.81°) on the PTSOT. In non-urban open regions, the environment is full of signs, markers, mountain peaks, etc., that can be used as identifiable landmarks for human wayfinding [37,38] Spatial training within virtual open environments has not been examined to date. It is important, therefore, to study how a spatial training activity that uses a first-person virtual environment with a natural landscape may influence improvements in spatial thinking and spatial orientation.
With respect to self-reported sense of direction, there are previous studies [16,39] in which participants have experimented with spatial self-orientation using maps and through real and virtual environments. They concluded that SBSOD has a higher correlation with tasks that involve orienting oneself within a real-world environment than with the tasks related to the orientation obtained using maps or virtual environments.
3. Research Methodology
As indicated in subheading 2, spatial training within virtual open environments has not been examined to date. It is important, therefore, to study how a spatial training activity that uses a first-person virtual environment with a natural landscape may influence improvements in spatial thinking and spatial orientation. Therefore, in the workshop conducted in the present research, the participants modeled landforms with Unity 3D as a virtual open environment. Landforms are a prominent cue for orientation and determination of self-location in open environments. By viewing landforms from different points of view, people can orient themselves in the environment.
The research question of the present study was to check if working with a Unity3D game engine could improve the spatial thinking and spatial orientation skills.
3.1. Hardware and Software
When planning teaching strategies with 3D tools, an important factor to consider is the economic cost. The price of game engines is low (or even free) compared to 3D animation commercial software, which limits use of commercial products for spatial curriculum development. Unity3D (www.unity3d.com), a game engine created by Unity Technologies in Denmark, is the software used in the present research. The Unity3D open source tool, which was used in the current research, has a free license for educational use. An educational and training advantage of Unity3D is that it can run on multiplatform operating systems, including Windows, Mac, and Linux. This is a great advantage when planning teaching strategies in which students can use their own devices, according to the BYOD trend (Bring Your Own Device), included in the Higher Education New Media Consortium Horizon Report [40].
In the field of creating games and 3D simulations, Unity is one of the most used game engines (Petridis et al.). Although Unity has been used as a desktop computer application in this research, Unity also offers powerful possibilities to integrate technologies such as augmented reality and/or virtual reality in multi-platform mode such as consoles or handheld mobile devices [41]. In the field of education, Unity 3D has been used in different fields ranging from medicine [42], humanities [43], civil engineering [44], or mechatronics [45], to name a few.
Although the main functionality of Unity3D is the development of 3D video games, its powerful graphics capabilities make it a tool that can be used for professional purposes, such as for simulations, landscape graphic representation, and landscape assessing and planning. Unity3D, which can be used to develop a simulation of a real-world environment [41], provides powerful rendering engines for the graphic representation of landscapes in real time, operating in a first-person perspective view. This first-person perspective provides the user with a strong sense of (tele-) presence, similar to a real-world experience. The user has the possibility of visualizing landforms in 3D while also emulating the movement of the head and body (as it moves forward, backwards, etc.). The powerful rendering, customizable lighting, and graphic representation of the terrain, and the inclusion of numerous and powerful special effects (rain, wind, sun’s positions at certain times of the day, shadows, vegetation, rivers, lakes, texture editing, etc.) make it easy to create and edit complex landscape environments of a very realistic nature with a powerful terrain editor. The user has control of 3D objects and terrain in which she or he can visualize models and create simulations.
The system requirements are, in respect to the operating system: Windows 7 SP1+, 8, 10, 64-bit versions only; macOS 10.11+. Regarding the graphic processing unit: Graphics card with DX10 (shader model 4.0) capabilities. For the workshop, students used their own laptops. The instructor checked that all the laptops met the minimum requirements to perform the activity. In the event that the student’s computer did not meet the requirements indicated, the university has several laptops to provide the student to do the practice. In the workshop conducted in the present research it was not necessary to lend any laptop.
3.2. Spatial Measurement Tools
3.2.1. Spatial Thinking Ability Test (STAT)
The spatial thinking assessment used in this work is the standardized Spatial Thinking Ability Test (STAT), [1]. The STAT quantifies the effectiveness of teaching strategies aimed at improving spatial thinking, and was developed in the context of the American Association of Geographers Teachers’ Guide to Modern Geography (TGMG). The U.S. Education Department funded this association to develop teaching strategies and materials with the aim of improving students’ spatial thinking. Therefore, the STAT is a valid tool for measuring the impact of an introductory geospatial training program on students’ spatial thinking (see also [26]).
The Spatial Thinking Ability Test is a spatial ability battery containing eight categories (Table 1). It consists of 16 items, and the final score is the sum of the correct answers, which can range from 0 to 16. There is no established time limit for the completion of this test, although participants typically take less than 30 min to complete it [26]. The activities developed in this workshop are mainly related to categories IV and VI, which involve processes of spatial orientation and recognition of relief forms.
3.2.2. Perspective Taking Spatial Orientation Test (PTSOT)
The Perspective Taking Spatial Orientation Test [14] is a measure of spatial perspective taking performance. In this test, participants see an array of objects along with an answer circle. On each trial, participants are asked to imagine standing at one object in the array, facing a second, and then to point to a third. The participants “point” by drawing a line on the answer circle indicating the direction to the third object from the given standing position and facing direction. The performance measure is the angular error (difference between participant’s estimated angle and the correct angle formed by the three objects in the trial), so lower scores on the PTSOT indicates better performance. If a participant did not point to any target, a 90° score is assigned for that trial. This test is composed of 12 items, and the standard time limit is five minutes. This test and the instructions are available at https://www.silc.northwestern.edu/object-perspective-spatial-orientation-test/.
3.2.3. Santa Barbara Sense of Direction Scale (SBSOD)
The Santa Barbara Sense of Direction Scale (SBSOD), [16] is a self-report measure of general spatial orientation at the environmental scale of space consisting of 15 questions (Table 2) about navigational-orientation skills or preferences, which participants respond to on a Likert scale (1 to 7). Higher scores indicate that an individual believes they have a stronger sense of direction, and scores on this measure are correlated with better performance on orientation tasks [34] The SBSOD is reliable (Cronbach’s alpha 0.88) and has good validity for the study of geographic orientation. This tool is available at https://www.silc.northwestern.edu/santa-barbara-sense-of-direction-sbsod/.
3.3. Participants
Twenty-seven second year civil engineering students (6 female, 21 male), age 19–25, (M = 20.94, SD = 2.51) enrolled in a Cartography course participated in the workshop and received extra point in their Cartography course for participation. In the planning of the subject, there are mandatory and other voluntary activities. To encourage student participation in voluntary activities, their participation is rewarded with an extra point. This extra point is part of the final qualification of the subject, along with another large number of qualifications obtained in mandatory activities and final exams. The study had a Quasi-experimental Pre-test–Post-test design. The students voluntarily participated in the workshop, and were free to leave at any time. All participants signed a document called “Informed Consent” on the activity to be performed, according to the 95/46/CE European Directive and Organic Law 15/1999 of the Spanish Cabinet Office number 298. All came from the Science Baccalaureate, so they had the same academic training and none had previous experience in the use of 3D modeling and 3D-visualization tools. None of the students had taken the PTSOT, the STAT, or the SBSOD before the pre-test.
3.4. Procedure
The computer-based phase of the workshop was 9.5 h, made up of four sessions (one of half an hour and the other three hours each), and distributed over three weeks. In the first session, the participants completed the PTSOT pre-test and the STAT pre-test.
In the first hour of the second session, the instructor trained the students on five landforms: mountain, depression, divider (ridge), valley, and cols (mountain pass or saddle point). This training consisted of geographical/geomorphological definitions, accompanied by examples of graphic representations of each landform in 2D with contour line maps, and in ortophoto representation (Figure 1). Training on the definition and characterization of landforms is relevant in tasks related to geographical landscape analysis and planning [46].
In the second and third hours of the second session, the participants installed the Unity3D software on their laptops and received specific training on the commands of the application to carry out the workshop.
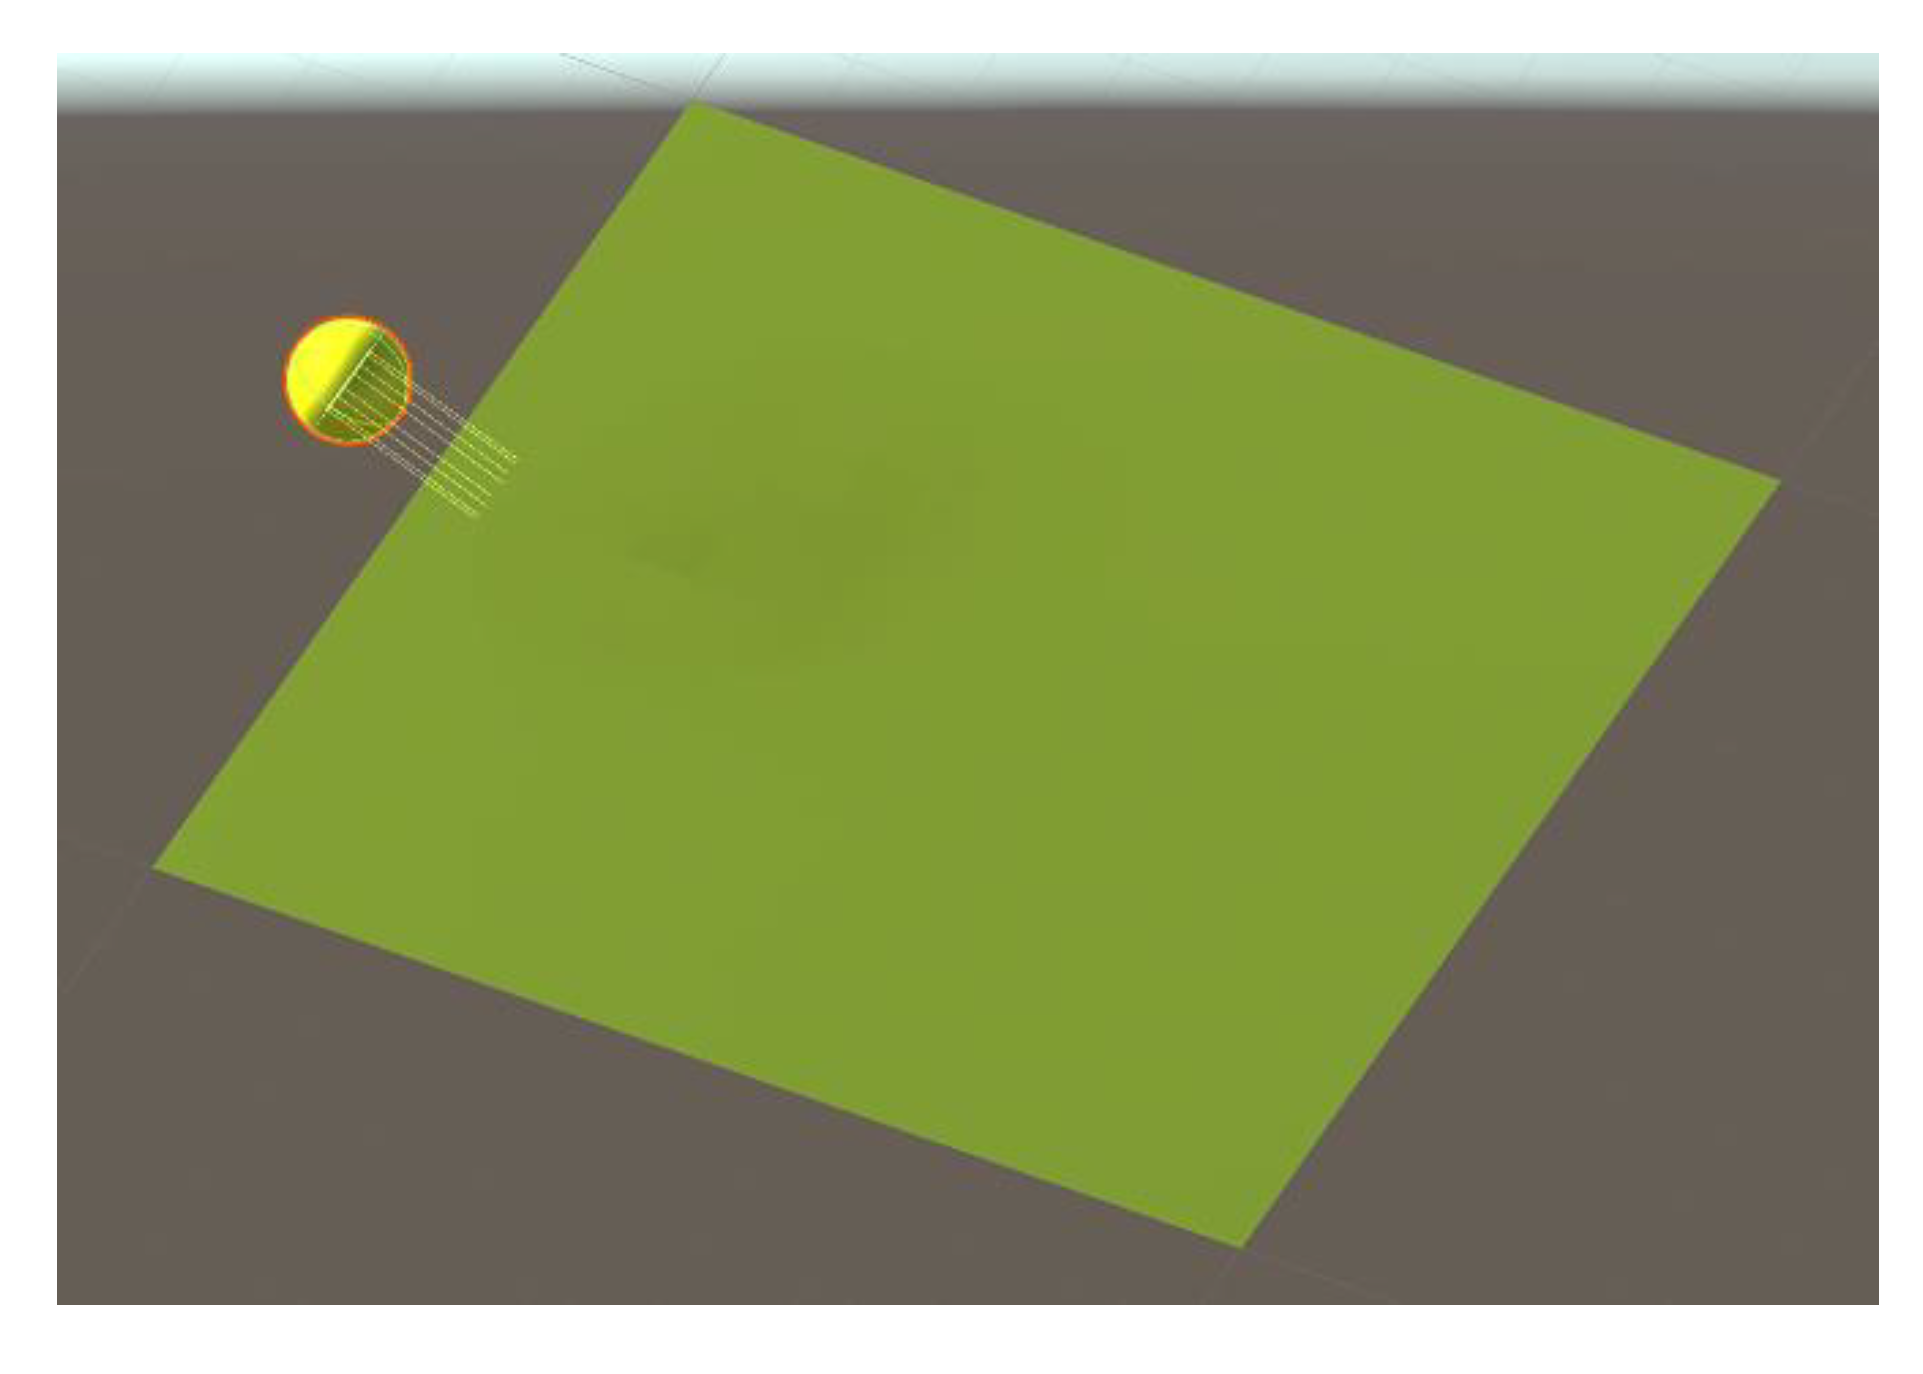
In the third session, they were given a file that contained a grid, 1 km x 1 km in area (scenario) in which the participants had to model each of the five landforms. In this grid, the sun is represented in a west position and with an inclination of 45° on the horizon line (Figure 2). This is important to note, as the position of the sun and the shadows cast within an environment establish a reference system for orientation tasks. The students used this session to model each of the five landforms in 3D, distributing them over the plot of land.
In the fourth session, the participants added different textures, materials, vegetation, trees, rivers, or lakes to develop the naturalistic elements of the graphic representation, which were included in the libraries of materials that Unity3D has by default. After completing this, the students recorded a video in which they performed a virtual tour of the different landforms. For this purpose, Unity3D allows the user to enter a character controller on the scenario. This character allows the user to travel the terrain and visualize the whole scenario as if he or she were there (first-person character controller). This type of tour (the user moves the camera) allows the user complete freedom of movement, and makes users able to access different points of view within the environment. That is, things are seen as they would be if participants were in a real environment using their first-person perspective, and the terrain is not displayed from an aerial view, as is often the case in maps. The user’s experience in the environment also interacts with the relief elements, that is, it is not possible for users to cross through trees or rocks, for example.
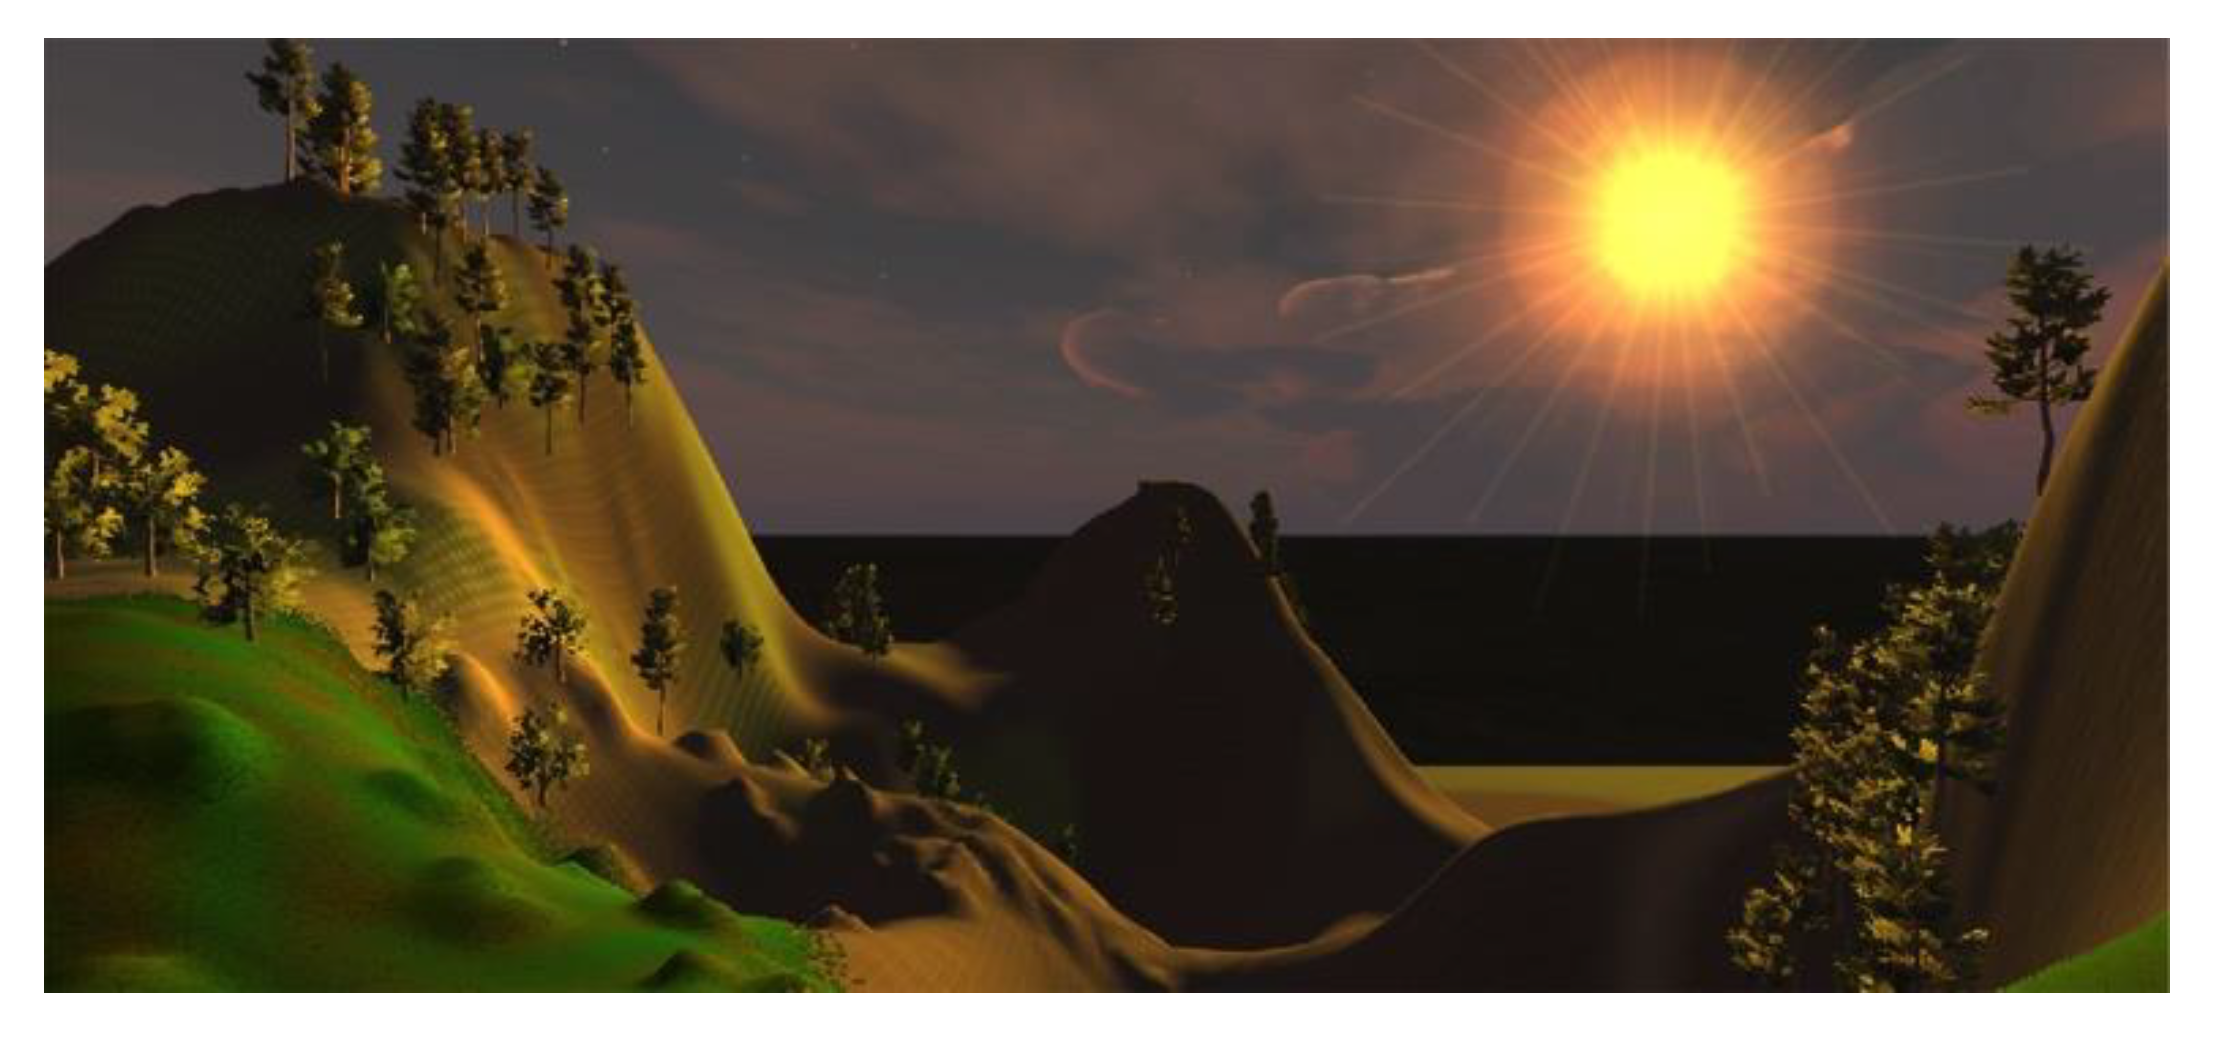
From each landform, participants were told to identify the rest of landforms that were visible from their current position/perspective. In addition to identifying the landforms, participants were told to think about and identify the position/location of the landforms (N, S, E, W), and were instructed to make use of the position of the sun for this task (Figure 3). Participants audio-recorded themselves during the workshop, describing the identification and the cardinal location of each landform.
In the final phase of the study, the students again completed the PTSOT and STAT, as well as the SBSOD. The SBSOD is a self-report of one’s spatial orientation (SOD, Sense of Direction) and was not included as a measure of improvement in spatial ability. The SBSOD was only completed once in the final session of the workshop. Table 3 shows the description of the activities performed in the workshop.
4. Results and Data Analysis
The research hypothesis was: “3D Unity3D game engine can improve the spatial thinking and spatial orientation skills.” Since different dependent variables (STAT and PTSOT) converge, it is therefore appropriate to perform a multivariate analysis. A MANOVA of repeated measures was performed on the measurements obtained with the STAT and the PTSOT including gender as an independent factor. The multivariate effect of gender is not significant (F 2, 24 = 0.815, p = 0.454, η2 = 0.06), neither its interaction with the Pre-Post factor (F 2, 24 = 0.001, p = 0.999, η2 = 0.00). That is, gender doesn’t influences the general mean scores nor at the pre-test or the post-test. The Pre-Post effect is significant for STAT (F 1,25 = 5.93, p = 0.022, η2 = 0.19) and for PTSOT (F 1,25 = 12.58, p = 0.002, η2 = 0.34). That is, both measures showed improvement after the workshop (Table 4). It is necessary to remember that, in the PTSOT, the higher the score, the poorer the performance.
Since there are several dependent variables, a repeated measure MANOVA was performed on the eight STAT Categories described previously in Table 1. The multivariate Pre-Post effect is significant (F1,26 = 11.55, p = 0.002, η2 = 0.31). Therefore, the subsequent univariate analysis of variance was performed. The univariate tests revealed that category IV (p = 0.01) and category VI (p = 0.02) showed significant differences between Pre-test and Post-test (better values in Post-test—see Table 5). The present work focuses precisely on categories IV and VI. In category IV, the participants needed to make use of spatial orientation to recognize spatial forms because they needed to properly orient themselves in situ, and graph a spatial transition [1,47]. Category VI assesses the trait of “being able to transform perceptions, representations and images from one dimension to another and the reverse” [48] (p. 4). In the activity carried out in this research, the participants needed to make use of their spatial orientation skill, as well as make transitions and graphic transformations from different points of view.
The mean score obtained in the SBSOD was 4.85 (SD = 0.78). There is no significant correlation between the PTSOT gain and SBSOD (r = 0.063). There is a small negative correlation between STAT gain and SBSOD (r = −0.372), which share 13.8% of their variance. Participants with low scores in the SBSOD show greater gains on the STAT. This can be explained by the moderate correlation between STAT at pretest and SBSOD (r = 0.546) and the moderate negative correlation of STAT pre with STAT gain, (r = −0.593) which is logical, since more profit can be obtained by starting from lower scores. There was a significant negative correlation between the PTSOT and SBSOD (r = −0.655, p < 0.001). That is, participants with lower error scores on the PTSOT, indicating better performance on the task, had higher scores on the SBSOD. The correlation between the STAT and the SBSOD (r = 0.326, p = 0.097) was not significant; suggesting that performance on these two measures is not related.
Previous research using pre-post PTSOT and STAT has shown that there are no significant gains in control groups that have not performed specific spatial training activities. In a study performed by Carbonell and Bermejo [2], 60 participants from the same population (second year civil engineering students) of the same university completed a pre-test and a post-test of the PTSOT without receiving specific training to improve spatial abilities. That is, they did not perform any task related to spatial orientation from pre- to post-test. The results showed non-significant gains in performance (a reduction of 2.62° in angular error, p-level = 0.202). Similarly, in a previous study using the STAT conducted by Jo, Hong, and Verma [26], there were no significant gains from pre- to post-test in the STAT for control participants who did not receive specific training (mean gains between 0.10 and 0.30, p > 0.05 in both studies).
5. Conclusions and Future Works
Specific strategies based on the graphic representation of terrain using game engines may be useful for training spatial thinking and spatial orientation skills. The students who participated in the workshop worked in a first-person virtual environment with landforms. As a result of this workshop, students showed a significant gain in their spatial thinking (1.33 points in the STAT, 8.31%) and spatial orientation skill (14.18° in the PTSOT, 15.76%). A limitation on the significance of this study is that only 27 students participated. This is a low number of participants and generalizations cannot be made, although these results offer valid data that can serve as a starting point for future research.
No gender differences were found in PTSOT or STAT gains. Some work has suggested that there is a sex difference in PTSOT performance [49], while others did not find differences [50]. We have not found previous information on gender data with the STAT. The gender debate in the acquisition of spatial skills, therefore, remains open.
In terms of spatial thinking acquisition, the significant gain in STAT score shown in the present work (1.33) is within the range of gains obtained with previous research using a web-based GIS training [26], with significant gains (post-test minus pre-test) between 1.17 and 1.60 points in the STAT. The present study supports the claim that although GIS is a powerful tool for the development of spatial thinking, it is not the only one [26,51]. In any case, there are few results showing a gain in spatial thinking using the STAT in the scientific literature, which is a limitation. More data (a larger and more diverse sample) is necessary to establish more concrete comparisons.
Regarding spatial orientation skill, the gain (post-test minus pre-test) obtained in the present research (14.18°, 15.76%) measured by the PTSOT, is comparable to that obtained using a first-person virtual urban environment (12.81°, 14.23%), in which the participants used characteristic properties of an urban environment, instead of landforms. The difference between these two gains is not significant (p = 0.74). These two results (12.81° and 14.18°) are smaller (with p-values between 0.02 and 0.12) than the gains obtained in previous research using SDI and AR graphic representations of the environment, which tend to show more sizeable gains between 19.06°, (21.17 %) and 19.21° (21.34%) (SDI), and 20.14° (22.37%) (AR). Related to the first-person perspective, this study presents a limitation. That a first-person perspective creates a great sense of (tele-) presence could likely be influenced by many different factors that are not directly related to the perspective being taken (e.g., visual fidelity, type of content, latency of the tracking of user input, type of user interaction with the visualization, etc.). In fact, planimetric perspectives (maps) are efficient and powerful for orientation tasks, as evidenced by the results obtained with SDI. As a future work, the influence (positive or negative) of these factors and their impact on the acquisition of spatial orientation skill could be studied. The impact of possible different previous qualification of the participants could also be analyzed, because although participants in the workshop come from a Science Baccalaureate, this does not necessarily guarantee complete homogeneity in terms of previous knowledge.
There was no significant correlation between the SBSOD and PTSOT gains, which is in concordance with the findings of Hegarty et al. [16] and Ishikawa and Montello [39], who showed that the SBSOD has a higher correlation with tasks that involve orienting oneself within a real-world environment than with the tasks related to orientation using maps or virtual environments. In the present research, the participants made use of their spatial orientation abilities in a virtual first-person environment, which could explain the non-significant correlation between SBSOD and PTSOT gain found in the present work. On the other hand, the correlation of SBSOD and post-test PTSOT is high, which means that those who have a better self-reported sense direction also have better performance on the spatial orientation test.
In conclusion, the present work found that use of the Unity3D game engine yielded significant improvement on both the spatial orientation and spatial thinking measures, although smaller than previous work using SDI and AR in spatial orientation performance. In addition, quantitative tools for measuring spatial thinking and spatial orientation can help teachers to detect possible deficiencies in these skills among students. To address these shortcomings, activities such as the one proposed in this research could be included in the planning of subjects related to the geospatial field.
Future research should continue to examine what task-based factors may be influencing spatial task performance, such as characteristics of the first-person perspective in an environment created with a game engine. Recent work (e.g., [41]) has proposed a methodology using Unity3D to represent large-scale topographic data from mixed sources of terrestrial laser scanner models and topographic map data. This methodology could be used to develop spatial training strategies, allowing students to work with landscape environments and topographic data from the real world. Moreover, within the framework of game engines, it would be interesting, as future work, to analyze the impact of location-based games (geogames) on spatial orientation skill, taking advantage of the potential offered by mobile devices.
Author Contributions
Conceptualization, Carlos Carbonell-Carrera; Jose Luis Saorin; Methodology, Jose Luis Saorin, Stephany Hess-Medler; Software, Jose Luis Saorin; Stephany Hess-Medler; Formal Analysis, Stephany Hess Medler; Peri Gunalp; Investigation, Carlos Carbonell-Carrera; Peri Gunalp; Resources, Carlos Carbonell-Carrera; Data Curation, Peri Gunalp; Carlos Carbonell-Carrera; Stephany Hess Medler; Writing-Original Draft Preparation, Carlos Carbonell-Carrera; Writing-Review & Editing, Carlos Carbonell-Carrera; Peri Gunalp; Supervision, Peri Gunalp; Carlos Carbonell-Carrera; Project Administration, Carlos Carbonell-Carrera; Funding Acquisition, Carlos Carbonell-Carrera. All authors have read and agreed to the published version of the manuscript.
Funding
Spanish Ministry of Education, Culture and Sport, within the framework of the State Program for the Promotion of Talent and its Employability in I+D+I: the State Mobility Subprogram of the State Plan for Scientific and Technical Research and Innovation 20: CAS18/00033. Resolution: 10 August 2018.
Acknowledgments
The research carried out is within the framework of action of the Spanish Ministry of Education, Culture and Sport, within the framework of the State Program for the Promotion of Talent and its Employability in I+D+i, the State Mobility Subprogram of the State Plan for Scientific and Technical Research and Innovation 2013-2016. CAS18/00033. Resolution: 10 August 2018.
Conflicts of Interest
The authors declare no conflict of interest.
References
- Lee, J.; Bednarz, R. Components of spatial thinking: Evidence from a spatial thinking ability test. J. Geogr. 2012, 111, 15–26. [Google Scholar] [CrossRef]
- Carbonell-Carrera, C.; Bermejo Asensio, L.A. Landscape interpretation with augmented reality and maps to improve spatial orientation skill. J. Geogr. High. Educ. 2017, 41, 119–133. [Google Scholar] [CrossRef]
- Fleishman, J.J.; Dusek, E.R. Reliability and learning factors associated with cognitive tests. Psychol. Rep. 1971, 29, 523–530. [Google Scholar] [CrossRef]
- Presson, C.C.; Montello, D.R. Points of reference in spatial cognition: Stalking the elusive landmark. Br. J. Dev. Psychol. 1988, 6, 378–381. [Google Scholar] [CrossRef]
- Denis, M. The description of routes: A cognitive approach to the production of spatial discourse. Cah. Psychol. Cogn. 1997, 16, 409–458. [Google Scholar] [CrossRef]
- Brosset, D.; Claramunt, C.; Saux, E. Wayfinding in natural and urban environments: A comparative study. Cartographica 2008, 43, 21–30. [Google Scholar] [CrossRef]
- Caduff, D.; Timpf, S. On the assessment of landmark salience for human navigation. Cogn. Process. 2008, 9, 249–267. [Google Scholar] [CrossRef]
- Rehrl, K.; Leitinger, S.; Gartner, G.; Ortag, F. An analysis of direction and motion concepts in verbal descriptions of route choices. In COSIT 2009: Spatial Information Theory; Hornsby, K.S., Claramunt, C., Denis, M., Ligozat, G., Eds.; Springer: Berlin, Germany, 2009; Volume 5756, pp. 471–488. [Google Scholar]
- Ruzinoor, C.M.; Mohammed Shariff, A.R.; Zulkifli, N. Using a game engine for 3D terrain visualization of GIS data: a review. In Proceedings of the 7th IGRSM International Remote Sensing and GIS Conference and Exhibition, Kuala Lumpur, Malaysia, 22–23 April 2014. [Google Scholar]
- Carbonell-Carrera, C.; Bermejo Asensio, L.A. Augmented reality as a digital teaching environment to develop spatial thinking. Cartogr. Geogr. Inf. Sci. 2017, 3, 259–270. [Google Scholar] [CrossRef]
- Sanchez, C.A. Enhancing visuospatial performance through video game training to increase learning in visuospatial science domains. Psychon. Bull. Rev. 2012, 19, 58–65. [Google Scholar] [CrossRef] [Green Version]
- Kinsey, B. Design of a CAD integrated physical model rotator. In Proceedings of the Annual Conference and Exposition Engineering Education, Nashville, TN, USA, 22–25 June 2003. [Google Scholar]
- Reber, A.S. Dictionary of Psychology; Penguin: London, UK, 2009. [Google Scholar]
- Hegarty, M.; Waller, D. A dissociation between mental rotation and perspective-taking spatial abilities. Intelligence 2004, 32, 175–191. [Google Scholar] [CrossRef]
- Kozhevnikov, M.; Hegarty, M. A dissociation between object manipulation, spatial ability and spatial orientation ability. Mem. Cogn. 2001, 29, 745–756. [Google Scholar] [CrossRef]
- Hegarty, M.; Richardson, A.E.; Montello, D.R.; Lovelace, K.; Subbiah, I. Development of a self-report measure of environmental spatial ability. Intelligence 2002, 30, 425–447. [Google Scholar] [CrossRef]
- Gersmehl, P.J.; Gersmehl, C.A. Wanted: A concise list of neurologically defensible and assessable spatial-thinking skills. Res. Geogr. Educ. 2006, 8, 5–38. [Google Scholar]
- Gersmehl, P.J.; Gersmehl, C.A. Spatial thinking by young children: Neurologic evidence for early development and “educability”. J. Geogr. 2007, 106, 181–191. [Google Scholar] [CrossRef]
- Yuan, M. 30 years of IJGIS: The changing landscape of geographical information science and the road ahead. Int. J. Geogr. Inf. Sci. 2017, 31, 425–434. [Google Scholar] [CrossRef]
- Lee, J.; Bednarz, R. Effect of GIS learning on spatial thinking. J. Geogr. High. Educ. 2009, 33, 183–198. [Google Scholar] [CrossRef]
- National Research Council. Learning to Think Spatially; National Academies Press: Washington, DC, USA, 2006.
- Solem, M.; Cheung, I.; Schlemper, M.B. Skills in professional geography: An assessment of workforce needs and expectations. Prof. Geogr. 2008, 60, 356–373. [Google Scholar] [CrossRef]
- Uttal, D.H.; Meadow, N.G.; Tipton, E.; Hand, L.L.; Alden, A.R.; Warren, C.; Newcombe, N.S. The malleability of spatial skills: A meta-analysis of training studies. Psychol. Bull. 2013, 139, 352–402. [Google Scholar] [CrossRef]
- Bednarz, R.S.; Bednarz, S.W. The importance of Spatial Thinking in an Uncertain World. In Geospatial Technologies and Homeland Security; Sui, D.Z., Ed.; Springer: Dordrecht, The Netherlands, 2008; Volume 24, pp. 315–330. [Google Scholar]
- Chueca, M.; Salcedo, F.; Ferrer, J.; Galán, L.; Olivé, J. White Paper Title Engineer Degree in Geomatics and Surveying; National Agency for Quality Assessment and Accreditation (ANECA): Madrid, Spain, 2004; pp. 118–148.
- Jo, I.; Hong, J.E.; Verma, K. Facilitating spatial thinking in world geography using web-based GIS. J. Geogr. High. Educ. 2016, 40, 442–459. [Google Scholar] [CrossRef]
- Carbonell-Carrera, C.; Hess Medler, S. 3D landform modeling to enhance geospatial thinking. ISPRS Int. J. Geo-Inf. 2019, 8, 65. [Google Scholar] [CrossRef] [Green Version]
- Jacovina, M.; Ormand, C.; Shipley, T.F.; Weisberg, S. Topographic Map Assessment. 2014. Available online: https://www.silc.northwestern.edu/topographic-map-assessment-tma/ (accessed on 15 February 2015).
- Maier, P. Spatial geometry and spatial ability: How to make solid geometry solid? In Selected Papers from the Annual Conference of Didactics of Mathematics 1996; Osnabrück, E., Cohors-Fresenborg, K., Reiss, G., Toener, G., Weigand, H., Eds.; Gessellschaft für Didaktik der Mathematik (GDM): Munich, Germany, 1996; pp. 63–75. [Google Scholar]
- Linn, M.; Petersen, A. Emergence and characterization of sex differences in spatial ability: A meta-analysis. Child Dev. 1985, 56, 1479–1498. [Google Scholar] [CrossRef] [PubMed]
- Bodner, G.; Guay, R. The Purdue visualization of rotations test. Chem. Educ. 1997, 2, 1–18. [Google Scholar] [CrossRef]
- National Council of Teachers of Mathematics. Principles and Standards for School Mathematics; NCTM: Reston, VA, USA, 2000. [Google Scholar]
- Presmeg, N.C. Research on visualization in learning and teaching mathematics: Emergence from psychology. In Handbook of Research on the Psychology of Mathematics Education; Gutiérrez, A., Boero, P., Eds.; Sense Publishers: Dordrecht, The Netherlands, 2006. [Google Scholar]
- Ishikawa, T. Satellite navigation and geospatial awareness: Long-term effects of using navigation tools on wayfinding and spatial orientation. Prof. Geogr. 2019, 71. [Google Scholar] [CrossRef]
- Carbonell-Carrera, C.; Hess Medler, S. Spatial orientation skill improvement with geospatial applications: Report of a multi-year study. ISPRS Int. J. Geo-Inf. 2017, 6, 278. [Google Scholar] [CrossRef] [Green Version]
- Carbonell-Carrera, C.; Saorin, J.L. Virtual learning environments to enhance spatial orientation. Eurasia J. Math. Sci. Technol. Educ. 2018, 14, 709–719. [Google Scholar] [CrossRef]
- Kettunen, P.; Putto, K.; Gyselinck, V.; Krause, C.M.; Sarjakoski, L.T. Perception and recall of landmarks for personal navigation in nature at night versus day. In Modern Trends in Cartography (Lecture Notes in Geoinformation and Cartography); Brus, J., Vondrakova, A., Vozenilek, V., Eds.; Springer: Cham, The Netherlands, 2015. [Google Scholar]
- Kettunen, P.; Irvankoski, K.; Krause, C.M.; Sarjakoski, L.T. Landmarks in nature to support wayfinding: The effects of seasons and experimental methods. Cogn. Process. 2013, 14, 245–253. [Google Scholar] [CrossRef]
- Ishikawa, T.; Montello, D.R. Spatial knowledge acquisition from direct experience in the environment: Individual differences in the development of metric knowledge and the integration of separately learned places. Cogn. Psychol. 2006, 52, 93–129. [Google Scholar] [CrossRef]
- Johnson, L.; Adams Becker, S.; Estrada, V.; Freeman, A. NMC Horizon Report: 2014; The New Media Consortium: Austin, TX, USA, 2014. [Google Scholar]
- Laksono, D.; Aditya, T. Utilizing a game engine for interactive 3D topographic data visualization. ISPRS Int. J. Geo-Inf. 2019, 8, 361. [Google Scholar] [CrossRef] [Green Version]
- Oak, J.W.; Bae, J.H. Development of smart multiplatform game app using UNITY3D engine for CPR education. Int. J. Multimed. Ubiquitous Eng. 2014, 9, 263–268. [Google Scholar] [CrossRef]
- Wang, D. Gamified learning through unity 3D in visualizing environments. Neural Comput. Appl. 2018, 29, 1399–1404. [Google Scholar] [CrossRef]
- Boga, S.R.C.; Kansagara, B.; Kannan, R. Integration of augmented reality and virtual reality in building information modeling: The next frontier in civil engineering education. In Mobile Technologies and Augmented Reality in Open Education; Kurubacak, G., Altinpulluk, H., Eds.; IGI Global: Hershey, PA, USA, 2018; pp. 1037–1066. Available online: https://0-www-igi--global-com.brum.beds.ac.uk/chapter/integration-of-augmentedreality-and-virtual-reality-in-building-information-modeling/178245 (accessed on 17 April 2018).
- Kucera, E.; Haffner, O.; Leskovský, R. Interactive and virtual/mixed reality applications for mechatronics education developed in unity engine. Cybern. Inform. 2018. [Google Scholar] [CrossRef]
- Florinsky, I. Digital Terrain Analysis in Soil Science and Geology; Academic Press: Amsterdam, The Netherlands, 2011. [Google Scholar]
- Gersmehl, P. Teaching Geography; The Guilford Press: New York, NY, USA, 2005. [Google Scholar]
- Golledge, R.G. The nature of geographic knowledge. Ann. Assoc. Am. Geogr. 2002, 92, 1–14. [Google Scholar] [CrossRef]
- Tarampi, M.R.; Haydari, N.; Hegarty, M. A tale of perspective taking: Sex differences in spatial ability. Psychol. Sci. 2016, 27, 1507–1516. [Google Scholar] [CrossRef]
- Coluccia, E.; Louse, G.; Brandimonte, M.A. The relationship between map drawing and spatial orientation abilities: A study of gender differences. J. Environ. Psychol. 2007, 27, 135–144. [Google Scholar] [CrossRef]
- Sinton, D.S.; Bednarz, S.; Gersmehl, P.; Kolvoord, R.; Uttal, D. The People’s Guide to Spatial Thinking; National Council for Geographic Education: Washington, DC, USA, 2013. [Google Scholar]
Figure 1.
A ridge (red line) displayed in 2D contour map (left) and in ortophoto (right).

Figure 2.
Unity3D grid performed for the activity (scenario). The sun is in west position.

Figure 3.
Example of first-person perspective. The user is in a ridge and visualizes a col (saddle point) in the West and a mountain in the North.
Figure 3.
Example of first-person perspective. The user is in a ridge and visualizes a col (saddle point) in the West and a mountain in the North.


Table 1.
Description of categories and items of the standardized Spatial Thinking Ability Test (STAT).
Table 1.
Description of categories and items of the standardized Spatial Thinking Ability Test (STAT).
| Category | Items | Description |
|---|---|---|
| I | 1,2 | Navigation from one position to another using map |
| II | 3 | Pattern recognition and its graphic representation |
| III | 4 | Comprehension of the overlay concept for geospatial representations |
| IV | 5 | Visualization spatial transitions (profile topography from a contour lines map) in which participants need to orient themselves |
| V | 6,7 | Identification and graphic representation of spatial correlations |
| VI | 8 | Interpretation of relief representations from different points of view |
| VII | 9,10,11,12 | Geometric image overlay processes |
| VIII | 13,14,15,16 | Comprehension of geographic phenomena or features through points, lines, and polygons |
Table 2.
Santa Barbara Sense of Direction Scale.
| SBSOD Questionnaire | |
|---|---|
| Q1 | I am very good at giving directions |
| Q2 | I have a poor memory for where I left things |
| Q3 | I am very good at judging distances |
| Q4 | My “sense of direction” is very good |
| Q5 | I tend to think of my environment in terms of cardinal directions (N, S, E, W) |
| Q6 | I very easily get lost in a new city |
| Q7 | I enjoy reading maps |
| Q8 | I have trouble understanding directions |
| Q9 | I am very good at reading maps |
| Q10 | I don’t remember routes very well while riding as a passenger in a car |
| Q11 | I don’t enjoy giving directions |
| Q12 | It’s not important to me to know where I am |
| Q13 | I usually let someone else do the navigational planning for long trips |
| Q14 | I can usually remember a new route after I have traveled it only once |
| Q15 | I do not have a very good “mental map” of my environment |
Table 3.
Unity3D landforms workshop activities.
| Sessions | Duration | Activity Performed |
|---|---|---|
| 1 | ½ h. | PTSOT pre-test and the STAT pre-test |
| 2 | 3 h. | 1st h.: training geographical/geomorphological definitions |
| 2nd and 3rd h.: installing Unity3D and specific training on Unity 3D commands. | ||
| 3 | 3 h. | Modeling with Unity 3D each of the five landforms |
| 4 | 3 h. | 2 h.: Adding textures, materials, vegetation, trees, rivers, lakes 1 h.: PTSOT post-test, STAT post-test and SBSOD questionnaire |
Table 4.
STAT and PTSOT average values.
| Unity3D Landforms Workshop. N = 27 Participants | |||||||||
|---|---|---|---|---|---|---|---|---|---|
| Spatial Thinking Ability Test Mean Scores (STAT) | Perspective Taking-Spatial Orientation Test Mean Scores (PTSOT) | ||||||||
| Pre (s.d.) | Post (s.d.) | Gain (s.d.) | Gain (%) | p-level | Pre (s.d.) | Post (s.d.) | Gain (s.d.) | Gain (%) | p-level |
| 10.67 (3.10) | 12.00 (2.54) | 1.33 (2.32) | 8.31% | 0.006 | 52.05° (30.14°) | 37.87° (26.20°) | 14.18° (16.97°) | 15.76% | <0.001 |
s.d. Standard deviation
Table 5.
Descriptive statistics and p-value of the eight STAT categories in pre- and post-test.
| STAT Category | Pre-test Mean (s.d.) | Post-test Mean (s.d.) | p-Value |
|---|---|---|---|
| I | 0.89 (0.29) | 0.91 (0.24) | 0.713 |
| II | 0.78 (0.42) | 0.89 (0.32) | 0.265 |
| III | 0.56 (0.51) | 0.70 (0.47) | 0.212 |
| IV * | 0.74 (0.45) | 0.96 (0.19) | 0.011 |
| V | 0.63 (0.30) | 0.65 (0.30) | 0.713 |
| VI * | 0.81 (0.40) | 1.00 (0.00) | 0.022 |
| VII | 0.48 (0.28) | 0.57 (0.28) | 0.152 |
| VIII | 0.66 (0.32) | 0.74 (0.24) | 0.185 |
| s.d. Standard deviation *Significant differences between pre- and post-test | |||
© 2020 by the authors. Licensee MDPI, Basel, Switzerland. This article is an open access article distributed under the terms and conditions of the Creative Commons Attribution (CC BY) license (http://creativecommons.org/licenses/by/4.0/).
Share and Cite
MDPI and ACS Style
Carbonell-Carrera, C.; Gunalp, P.; Saorin, J.L.; Hess-Medler, S. Think Spatially With Game Engine. ISPRS Int. J. Geo-Inf. 2020, 9, 159. https://0-doi-org.brum.beds.ac.uk/10.3390/ijgi9030159
AMA Style
Carbonell-Carrera C, Gunalp P, Saorin JL, Hess-Medler S. Think Spatially With Game Engine. ISPRS International Journal of Geo-Information. 2020; 9(3):159. https://0-doi-org.brum.beds.ac.uk/10.3390/ijgi9030159
Chicago/Turabian StyleCarbonell-Carrera, Carlos, Peri Gunalp, Jose Luis Saorin, and Stephany Hess-Medler. 2020. "Think Spatially With Game Engine" ISPRS International Journal of Geo-Information 9, no. 3: 159. https://0-doi-org.brum.beds.ac.uk/10.3390/ijgi9030159
Note that from the first issue of 2016, this journal uses article numbers instead of page numbers. See further details here.