Dynamic Online 3D Visualization Framework for Real-Time Energy Simulation Based on 3D Tiles


1
College of Information Engineering, Nanjing University of Finance and Economics, Nanjing 210023, China
2
Key Laboratory of Urban Land Resources Monitoring and Simulation, MNR, Shenzhen 518040, China
3
Division of Geoinformatics, Department of Urban Planning and Environment KTH Royal Institute of Technology, 100 44 Stockholm, Sweden
4
Department of Energy Technology KTH Royal Institute of Technology, 100 44 Stockholm, Sweden
*
Author to whom correspondence should be addressed.
ISPRS Int. J. Geo-Inf. 2020, 9(3), 166; https://0-doi-org.brum.beds.ac.uk/10.3390/ijgi9030166
Submission received: 21 December 2019
/
Revised: 27 February 2020
/
Accepted: 7 March 2020
/
Published: 11 March 2020
Abstract
:Energy co-simulation can be used to analyze the dynamic energy consumption of a building or a region, which is essential for decision making in the planning and management of smart cities. To increase the accessibility of energy simulation results, a dynamic online 3D city model visualization framework based on 3D Tiles is proposed in this paper. Two types of styling methods are studied, attribute-based and ID map-based. We first perform the energy co-simulation and save the results in CityGML format with EnergyADE. Then the 3D geometry data of these city objects are combined with its simulation results as attributes or just with object ID information to generate Batched 3D Models (B3DM) in 3D Tiles. Next, styling strategies are pre-defined and can be selected by end-users to show different scenarios. Finally, during the visualization process, dynamic interactions and data sources are integrated into the styling generation to support real-time visualization. This framework is implemented with Cesium. Compared with existing dynamic online 3D visualization framework such as directly styling or Cesium Language (CZML), a JSON format for describing a time-dynamic graphical scene, primarily for display in a web browser running Cesium, the proposed framework is more flexible and has higher performance in both data transmission and rendering which is essential for real-time GIS applications.
1. Introduction
More than 50% of the world population currently live in urban areas and it is projected that another 2.5 billion people will move to urban areas by 2050. The intensifying urbanization results in an increased demand for energy. By 2030, it is estimated that 75% of global energy consumption will be attributed to cities according to a UN report [1]. Therefore, efficient energy management and smart city development are essential pathways to sustainability. Modeling and simulation are the major tools commonly used to assess the technological and policy impacts of smart solutions, as well as to plan the best ways of shifting from current cities to smarter ones [2]. With the development of information and communication technology, it is possible to monitor cities in a more detailed level and to develop smart cities that are energy- and resource-efficient. As the development of the internet, online 3D visualization is essential to support real-time energy simulation so that the public and building owners can access their projected energy consumption status and understand the influence of their actions such as changing windows, renovating the buildings or deploying solar panels on energy consumption. Therefore, this research aims to develop a dynamic online 3D visualization framework for real-time energy simulation based on 3D tiles.
Considering the complexity of 3D city models and related data, it is desirable to simplify the 3D models especially for real-time online interaction and fast visualization using mobile devices. Meanwhile, for many smart city applications such as energy simulation results illustration, the numerous details in 3D city models such as fine geometry data and high-quality textures are not necessary. However, existing studies on 3D city model generalization mainly focused on photorealistic rendering. As the energy simulation related application is multitudinous and the data required to visualize is heterogeneous, online energy simulation requires non-photorealistic models for visualization. In addition, photorealistic 3D city models are expensive to produce, complex to rendering, enormous in volume and difficult to share. It is necessary to study non-photorealistic generalization for various applications. The bases of non-photorealistic visualization and generalization are visual variables such as geometry, texture and distribution. Therefore, based on theories of modern cartography, computer graphics and data mining, this paper proposes a non-photorealistic generalization method for 3D city models using visual variables mapping to visualize the energy simulation results. To implement the proposed method, the latest 3D Tiles structure in Cesium is employed and tested. Our main contribution is to combine the city object attributes with the multiple LoD 3D models with 3D Tiles and to implement the non-photorealistic generalization and visualization using visual variable mapping.
The rest of paper is structured as follows. Related work on energy simulation and online 3D visualization is given in Section 2. Section 3 describes the proposed framework. Section 4 explains the implementation, illustrates the visualization results of dynamic styling and discusses the advantages of the proposed framework compared with the existing methods. Section 5 draws the conclusions of the paper.
2. Related Work
With the increasing interest in energy efficiency, energy simulation has been extensively studied along with the development of computer and information technologies. It not only plays an important role for city planning and decision making of energy infrastructure construction, but also can persuade the public for economic and green energy choices such as using solar power or heat pump. Many building/city energy simulation programs have been developed in past decades for example Building Loads Analysis and System Thermodynamics (BLAST), DOE-2.1E, BSim, EnergyPlus [3], TRNSYS [4] and so on. For general building energy performance simulation, an IFC based workflow is suggested using Modelica a modelling language for complex systems [5]. For factory buildings, energy analysis is applied to improve prevailing methodologies used in the assessment of energy efficiency measures [6]. For city-level energy simulation, a Data-driven Urban Energy Simulation (DUE-S) framework is proposed to integrate a network-based machine learning algorithm (ResNet) with engineering simulation to understand how buildings consume energy on multiple temporal (hourly, daily, monthly) and spatial scales in a city (single building, block, urban) [7]. These existing energy simulation programs indicate that multiple tools is required to deal with the different aspects of building/city energy simulation [8]. Therefore, it is necessary to standardize the input and output so that they can be shared by different building/city energy simulation programs and users.
The input/output of energy simulation is city or building, for which many standards have been established such as Building Information Model (BIM) and CityGML. Kim et al. have employed BIM for building thermal energy simulation [9]. For the BIM model, two commonly adopted open standards are IFC (Industry Foundation Classes) and gbXML (green building XML). They can both be used to extract inputs for energy simulation [10,11]. While Choi and Park [12] pointed out the experience of exports is essential to apply BIM data for energy simulation. Meanwhile, the BIM model mainly concerned about single buildings, while it is necessary to analyze the energy consumption at a higher level such as city or urban and consider more factors like economy and relationship with other city objects that contain both energy producers and consumers. CityGML as one of the OGC standard for city object description has been extended for energy simulation [13,14] and city utility network [15]. Besides, CityGML covers many energy-related city objects such as water, vegetation, transportation and so on. This information is essential for comprehensive energy simulation at the city level [16].
Another essential aspect for energy simulation is real-time data integration and interaction such as weather, price and user feedback or requests. Therefore real-time GIS is necessary for energy simulation and its results visualization. In 2008, an online real-time map system was developed to support real-time GIS working with different data formats by exchanging and presenting data [17]. The real-time GIS was also applied for disseminating the hazard information and flood maps [18], smart energy utilities [19] applications and as cyberinfrastructure platforms to support multivariate visualization of data collected from distributed sensor network [20]. However, these existing systems cannot directly be applied to the 3D visualization of energy simulation, which requires the supporting for 3D buildings or city objects [21].
To increase the accessibility of 3D city models, web-based 3D visualization has attracted more and more attention to and is becoming increasingly powerful along with the development of HTML5 and browser. Based on WebGL, current mainstream web browsers such as Chrome, IE, Firefox and Safari can all render the 3D scene directly. To further facility the web 3D visualization, frameworks such as Threejs, X3DOM, and Cesium are developed to provide a javascript based APIs for user to create and modify 3D scenes without knowing the underside rendering details. Threejs, X3DOM and Cesium have been applied for visualizing energy modeling results [22,23] or climate changes [24]. Compared with Threejs and X3DOM, Cesium supports the geospatial naturally. It can integrate different maps, satellite images and geo-services such as WMTS and WMF. Therefore, it is suitable for city-level energy simulation results visualization. For 3D real-time visualization, Cesium has another advantage compared to Threejs and X3DOM, which is the multiple representation structure: 3DTiles. The data volume of 3D city models is huge which can heavily reduce the interaction response speed with users. Therefore, generalization of 3D city models to different Level of Details (LoDs) is necessary especially for web-based platforms. To organize the generalized 3D city models in different LoDs, we have to define a multiple representation usually a tree structure to implement the selection of visible models in suitable LoDs based on the current user viewpoint. While 3DTiles provide an optimized implementation that can be used to organize the 3D city models in multiple LoDs. In this paper, we propose a demonstration to automatically generalize the 3D city models and convert to the 3DTiles representation that can be directly visualized with Cesium. Different from the existing methods that focus on static visualization, the proposed framework can support the real-time animation of energy simulation results based on the visual variable mapping.
3. Methodology
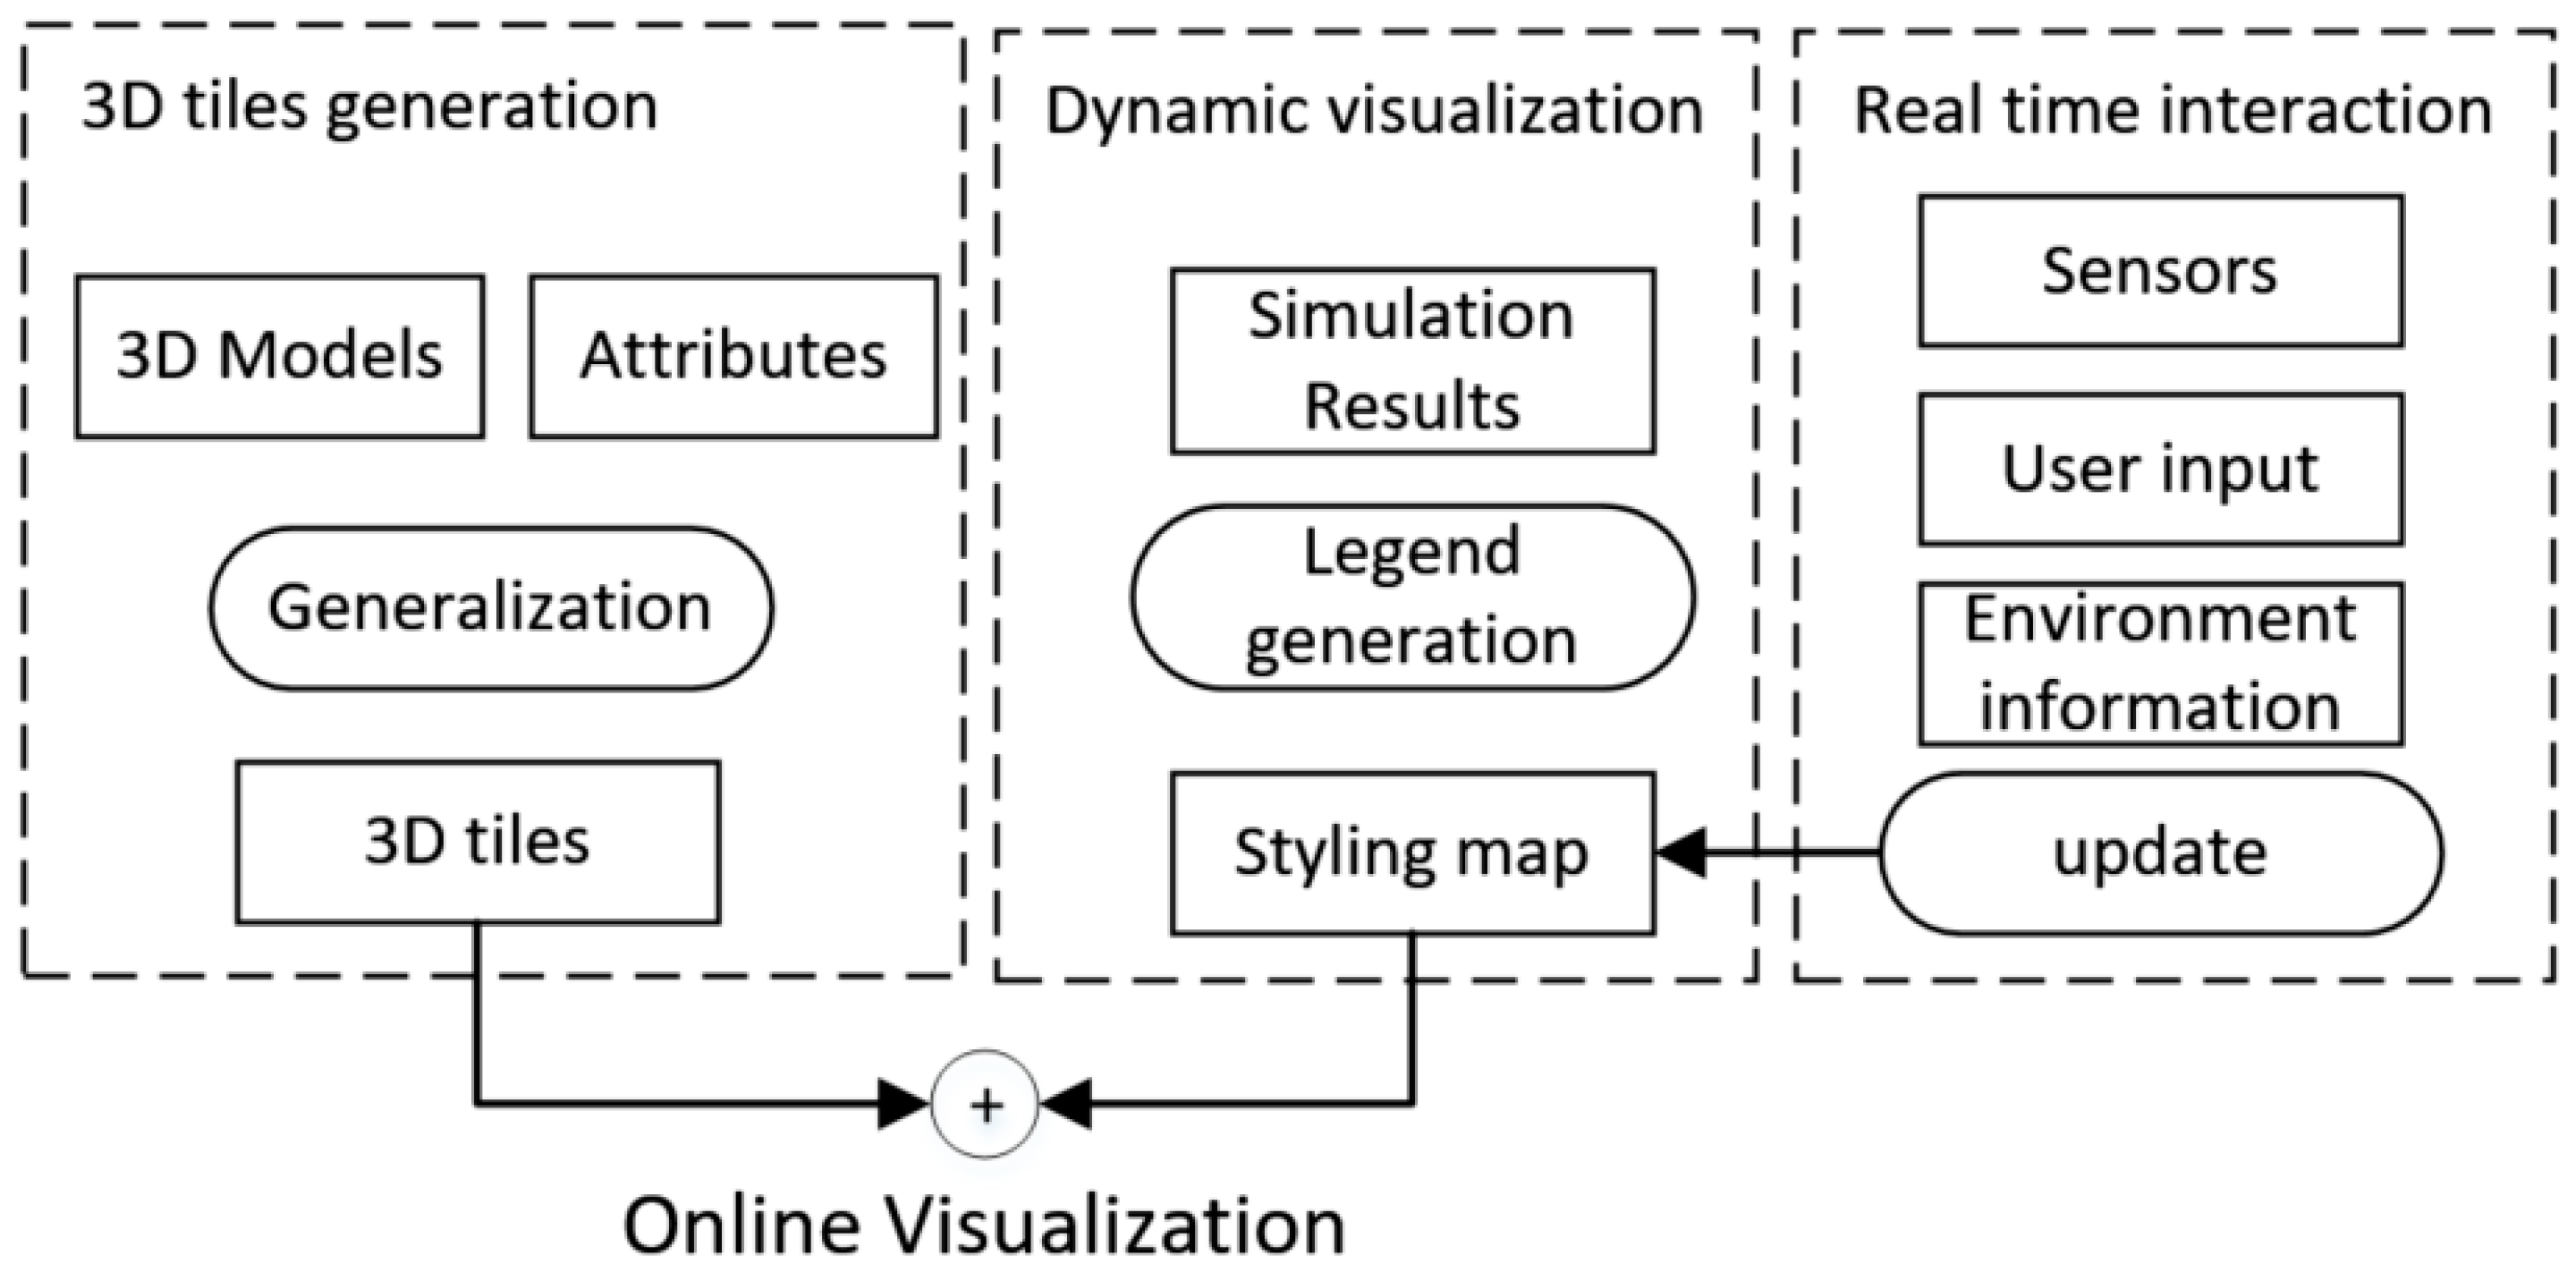
The overall online visualization framework for energy simulation includes three main parts: 3D tiles generation, dynamic visualization and real-time interaction. The workflow of the methodology is illustrated in Figure 1.
First, the non-photorealistic multiple LoD representations of 3D city are generated automatically using generalization algorithms. In this paper, we only generate the LoD0-LoD3 [25,26,27] from the detailed 3D city models since our study is focused on the city and building-level instead of indoor structure. LoD0 is the ground plan, LoD1 is the block, LoD2 is roof structure and LoD3 is model with detailed exterior. For each city object model, an ID and its geometry attributes such as height, area, location and orientation are added to a batched table of the 3D models. Based on the batched tables and 3D geometry, 3D tiles are created that include both 3D objects with attributes in the batched table and visualization strategies. Next, the dynamic styling of the 3D tiles is implemented based on the attributes in the batched table. If the styling is based on the attribute in the batched table, a mapping function is created to dynamic color the 3D objects. Otherwise, a mapping function between city object ID and color is directly generated for styling. The mapping function can be specifically defined for different applications. In this paper, we suggested an example to convert the energy consumption to the Hue value in HSV color space from 0 (red)-240 (blue). Other colormaps such as Jet, Hot Cool, etc., can be used for the styling mapping function. Finally, to support real-time data integration and visualization, the proposed framework also implements the web socket based interaction in which the real-time monitoring value such as weather conditions, energy consumption, price and etc. can be interactively integrated for analysis and/or visualization.
3.1. Multiple LoD City Models in 3Dtiles
Multiple LoD representations of 3D city model can be created by generalization algorithms such as simplification, aggregation or typification. For example, LoD1 model can be created from the LoD2/LoD3 models by first generating a simplified ground plan and then extruded it according to the building height. Then the generalized models are structured with 3Dtiles for dynamic loading and visualization in Cesium. According to 3Dtiles specification, the multiple LoD city models can be integrated and represented by different tree structures such as KDtree, Quadtree, Octree and so on. In this paper, we apply the Quadtree LoD data structure of city models based on 3Dtiles for energy simulation results visualization as shown in Figure 2.
First, the detailed 3D city models are segmented into different parts in which the total data volume is limited so that it can be transformed through the internet without too much lag. In this paper, the detailed 3D city models is the model in LoD3 with detailed wall and roof structures. The segmented parts can be windows, doors, skylights and funnels. If the model is in LoD4 and its indoor structures will be directly removed to generate its LoD3 representation. According to our experiment, each block should be around 1 MB so that it could be transmitted within 1 s even for mobile devices. The block data can contain a different number of buildings according to their LoDs. For example, one block may cover a large part of the city area if the model in LoD0, but another block may only contain one LoD3 building with detailed structures. We organize the building data in different LoDs into blocks with similar size can improve the network performance. In fact, the relationship between block size and network speed is not exactly measured, but the size of block should be less than 5 MB which can reduce the rendering speed of the browser according to our tests. We test the relationship between the loading time and size of blocks in Table 1. It is suggested that along with the increase of the block size (from 100 K to 5 M), the overall loading time is reducing. However, the big block is difficult to process and render, and also it is not necessary to cover too large a city area once. Therefore, in our test platform, the 1M size is a suitable block size.
Then, for each segmented block, a simplification algorithm is applied to generate lower LoD models. The nearby blocks are further grouped into one so that the size of the new block is also around the size limitation or 1 MB in this paper. The original blocks are tagged as the children of the new simplified block. The simplified model is expected to fully inherit the attributes of its original model, so that the dynamic styling can be implemented in the simplified models directly.
Next, the 3D city models could be further generalized with aggregation and typification operations. Besides the geometry changes, the attributes should be also generalized for the new model. For aggregation, some attributes should be calculated by summarizing, such as area, volume, number of residents, while some other attributes should be calculated by averaging/maximizing such as height, number of floors. Therefore, the generalization related to more than one building or city object should also take their semantic attributes into consideration. Usually, the aggregation and typification should be avoided to preserve the semantic information, unless the city model in the big area, for example, a whole city is required to visualized together.
Finally, the tree structure of 3Dtiles is generated according to the generalization algorithms and we could control the loading specification by changing the screen error parameter in 3D tile metadata file. The screen error parameter is also called a screen space error that is used to determine if an object is visible to the current rendering camera. It is calculated based on the size of the model and the distance to the camera. For example, a more detailed model could be loaded if the client is from PC with high-speed network, while low LoD models (LoD0-LoD2) are sent to mobile clients with wireless connections.
3.2. Styling Based on Attributes and ID Map
To visualize the energy simulation data, the mapping function from the simulation results to the visual variables of 3D city models should be first defined. In this paper, color is the mainly used visual variable. HSL color space is selected as the basic colormap from red (H = 0°) to blue (H = 240°). The attribute’s value of energy simulation are linearly converted to the H value of the color according to Formula 1 in which v is the attribute value and vmin is the minimum attributes and vmax is the maximum value of the attributes. The S and L value of the color can be a constancy value such as S = 100% and L = 50%.
H = 240*(v − vmin)/(vmax − vmin)
This default mapping can be applied to attributes such as temperature, energy consumption, energy efficiency and etc. Another visual variable can be used to show the attributes of city object is transparency. We can combine two attributes to HSL and transparency at the same time, for example, if the transparency and HSL are generated from year of build and energy loss respectively, the relationship between energy and building will be revealed. Formula (2) shows the transparency mapping function in which tmin minimum visible value.
T = (1 − tmin) *(v − vmin)/(vmax − vmin) + tmin
In 3DTiles, each model can have an attribute table including basic features such as id, area, height, volume, and also energy simulation results like electricity consumption, heat loss, sunlight exposure and so on. The dynamic styling can be implemented based on these attributes. For example, the buildings can be colored according to their height or area as described in [28].
Currently, three types of 3D model formats are defined and implemented in 3DTiles. B3DM or Batched 3D model is used to represent the standard city models such as buildings. I3DM or Instanced 3D model is designed for the same city object that could be located in many different places like trees or road lights. PointCloud is created to represent the massive point clouds for 3D visualization. In this paper, B3DM format of 3DTiles is used to represent the city models with attributes for energy simulation data visualization. In B3DM, each 3D object can be associated with an attribute table called batch table based on which styling rules can be defined.
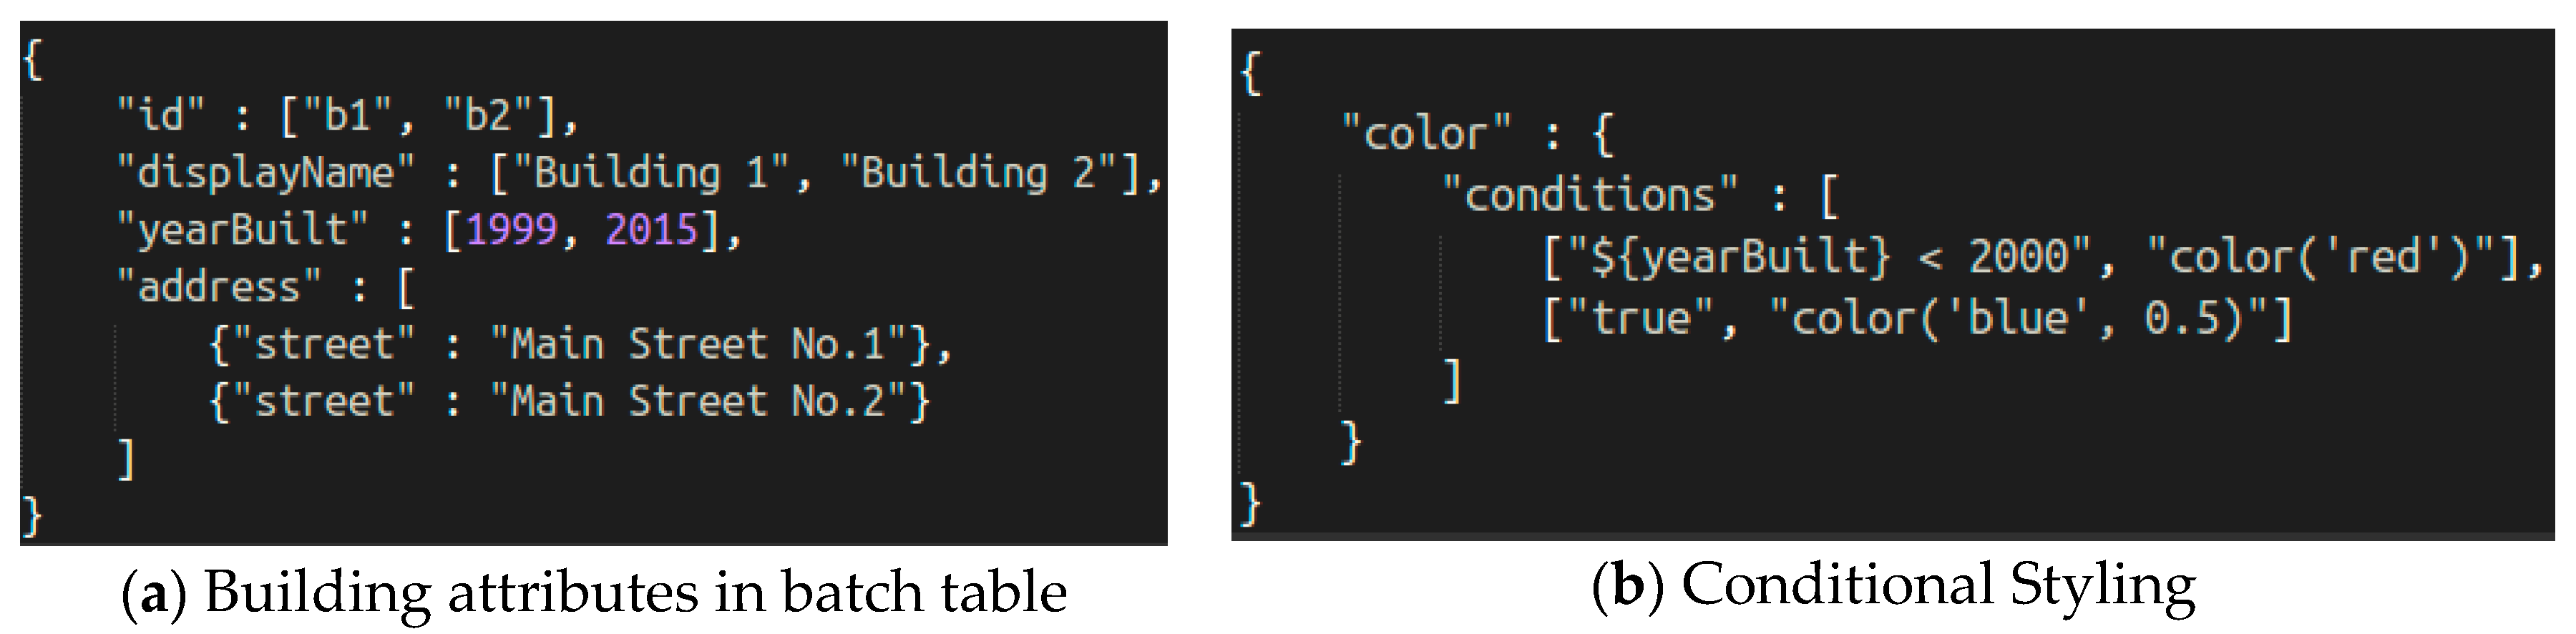
The batch table can be defined in json format that lists the attributes of each 3D objects. Figure 3 gives an example of batch table of two buildings with attributes ID, displayName, yearBuilt and address.
Based on the attributes, dynamic styling can be defined. For example, we could render the building before 2000 red and after blue by specification in client-side as shown in Figure 3b. In this paper, we focus on building energy visualization, so the simulated results of each building can be saved in the batch table and then different rendering strategies are defined to present various visualization results for different scenarios according to user request.
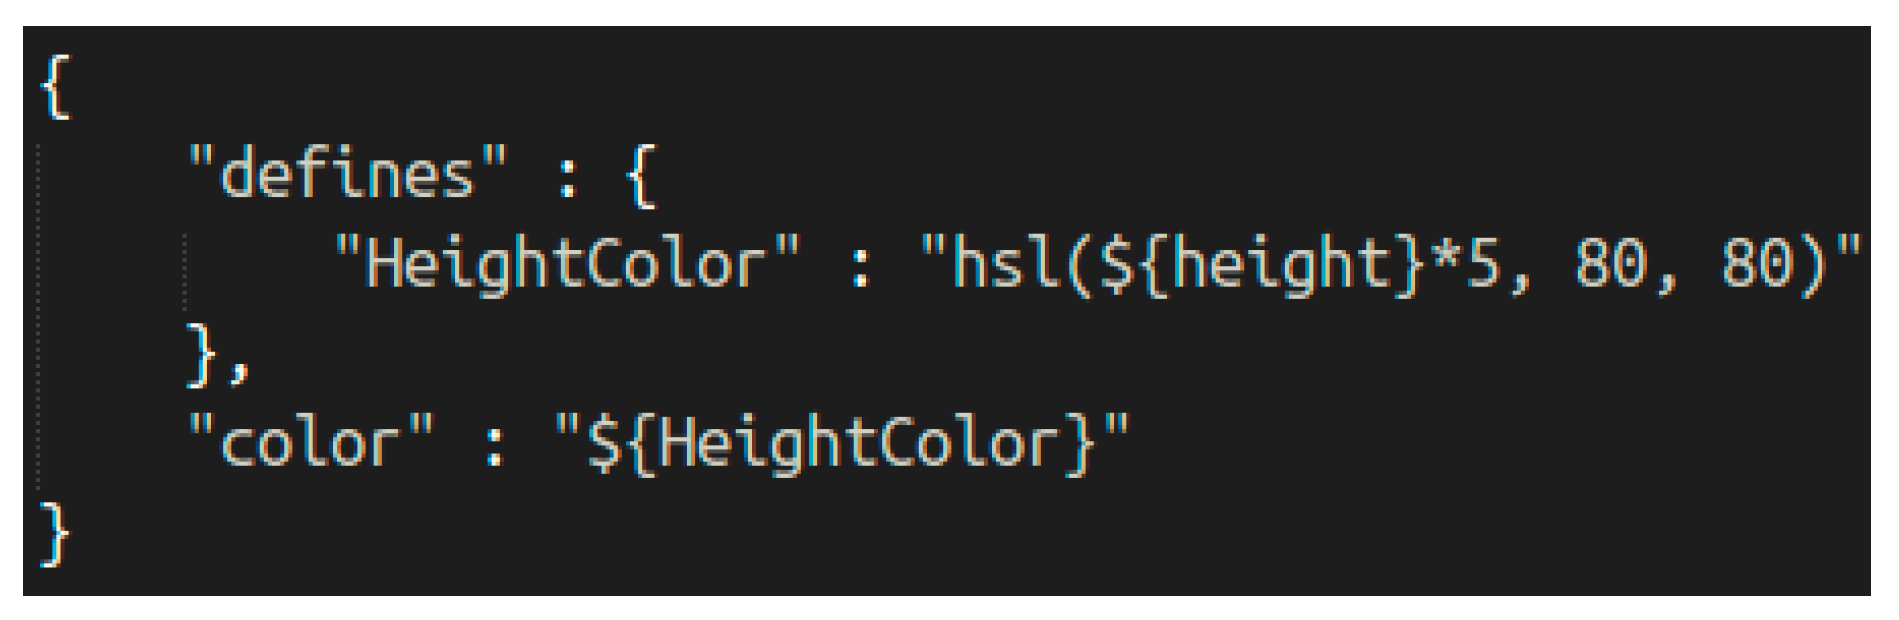
In Cesium, the server-side sends the B3DM data with attributes based on which the styling can be accomplished in client-side without further data requests from the server, which improves the user experience and reduces the computation load in the server. The client styling includes two main steps: condition definition and color mapping. Besides listing condition and its corresponding color as shown in Figure 3b, it is also supported to define the conversion function directly from attribute to color. For example, we can define a new attribute called HeightColor which is in HSL color space, and the color of each model can be directly set as the HeightColor value as shown in Figure 4. In Cesium, RGB, RGBA, HSL, HSLA color spaces are supported.
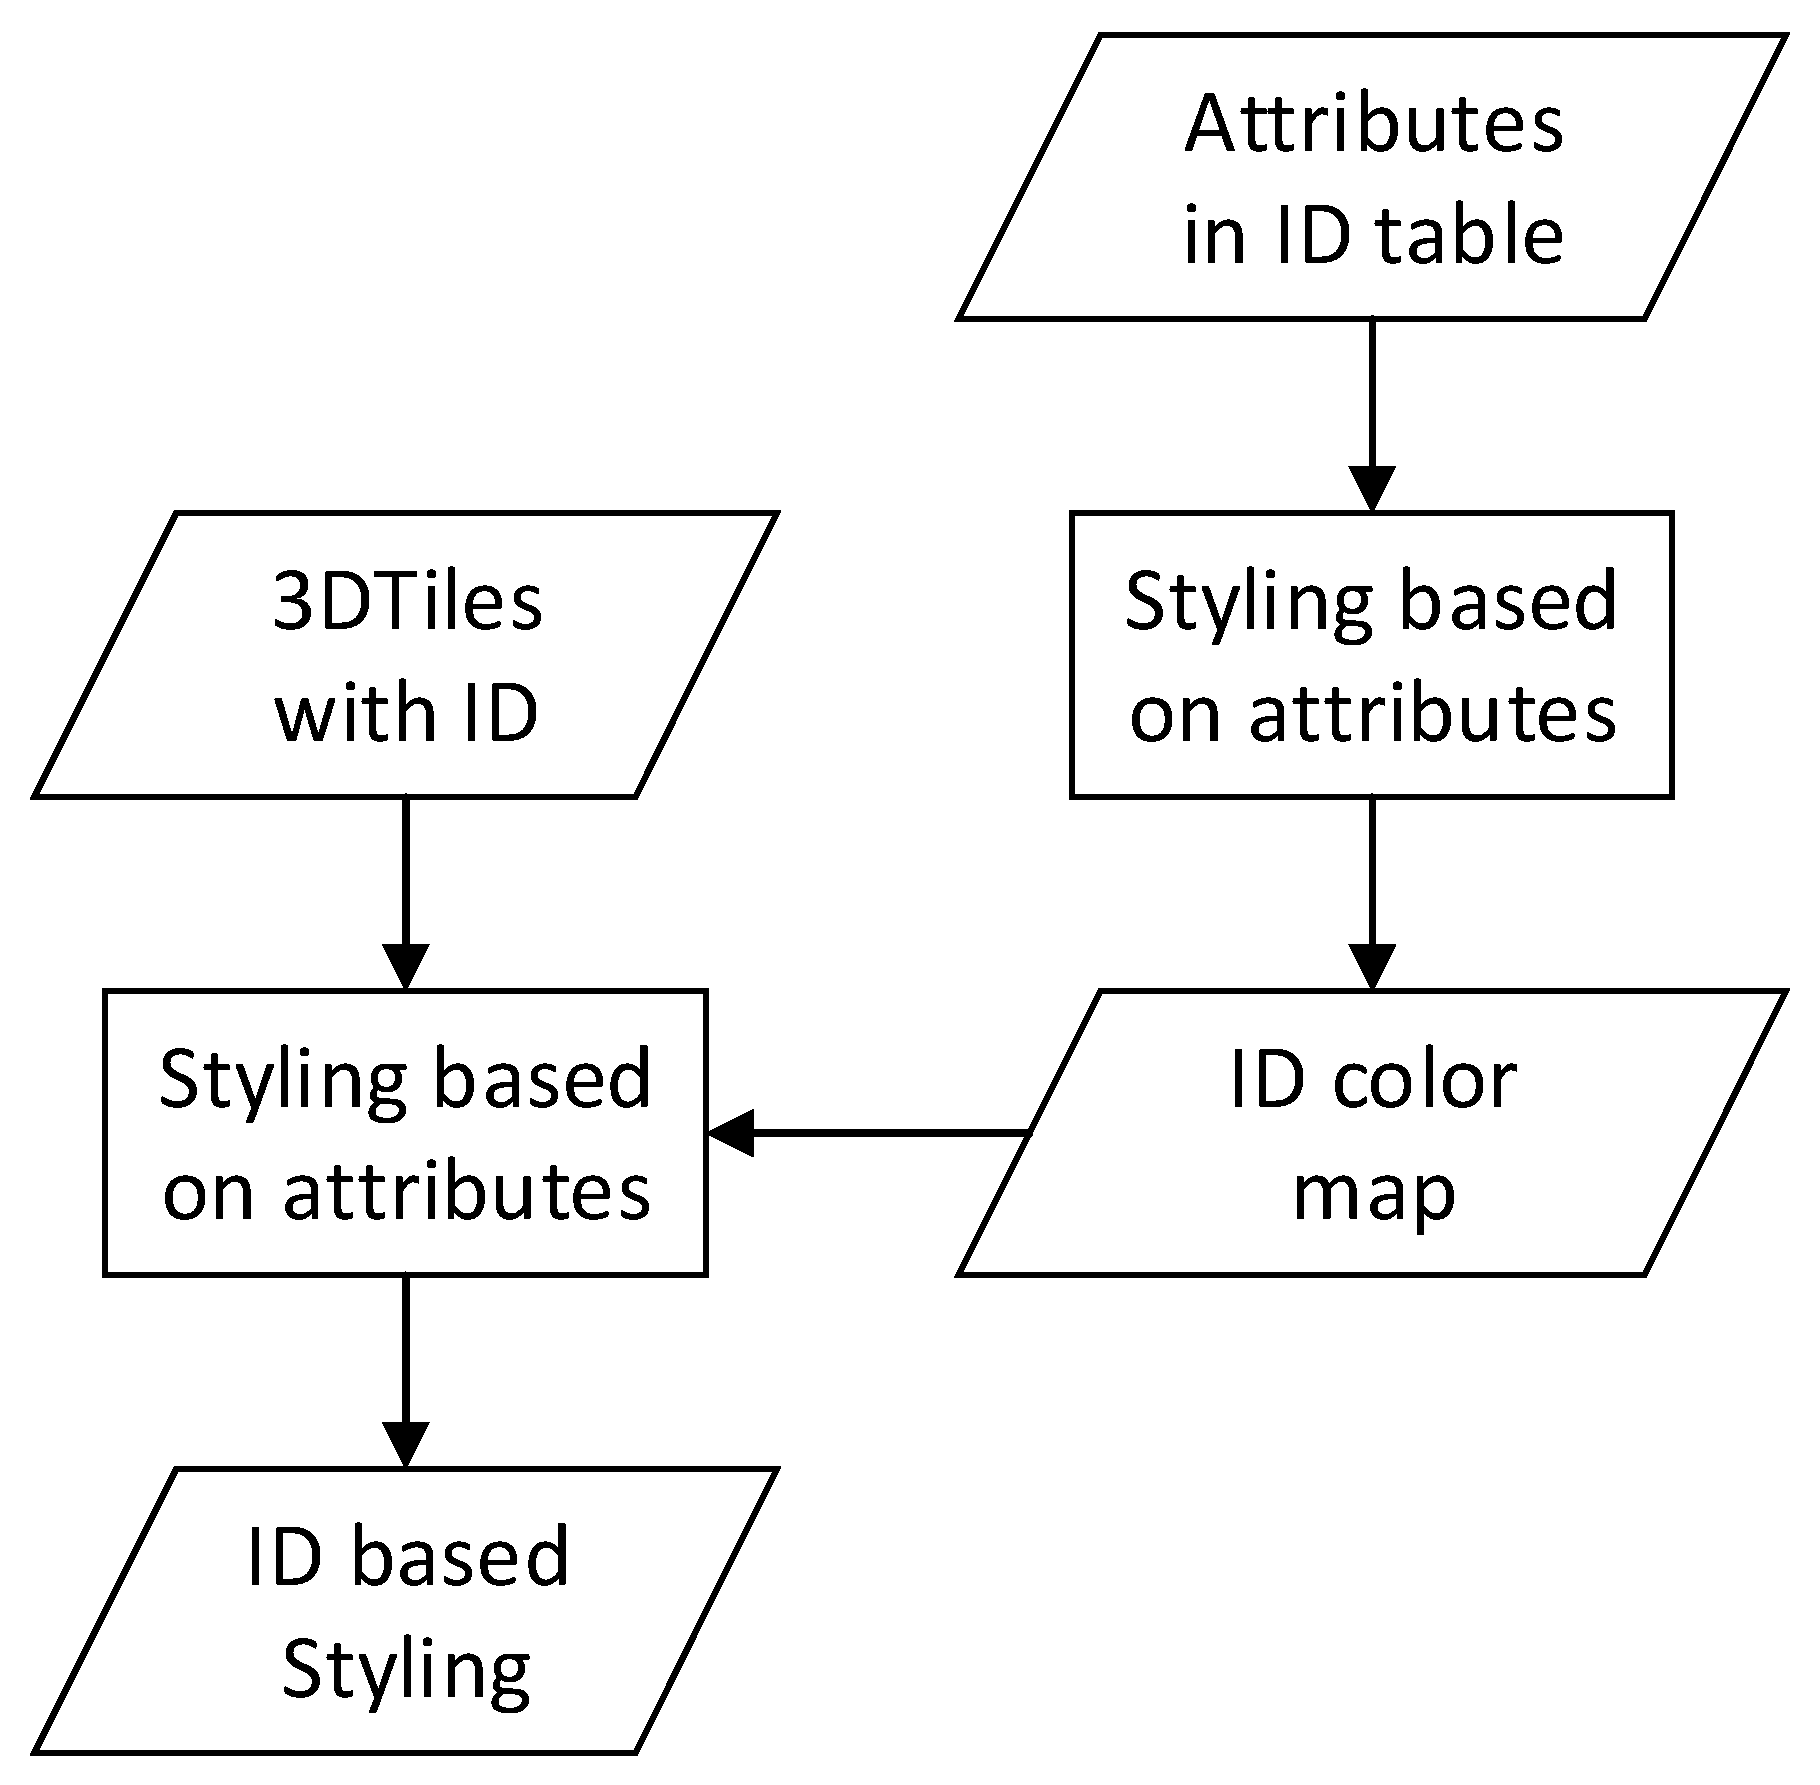
Styling based on attributes is easy to implement and fast for rendering. However, it requires to generate the 3D model with attributes. We could package the 3D model with energy simulation results, but it needs additional space and computation. Especially for big-city model with constantly changing simulation results, the load for model generation is quite high. To deal with that, the mapping by ID should be studied. In this paper, we first create an ID table containing model IDs and their attributes, then client-side reads the ID table file from the server and renders the 3D model accordingly. For each 3D model ID, a condition is generated and inserted. While the color should be directly calculated based on the attributes. Figure 5 shows the flow chart of the ID-based styling. Usually, if an attribute is stable and widely used for different visualization scenarios, it should be written into the B3DM model as a batch table, while the testing attributes can be visualized with ID map.
3.3. Animation of Energy Simulation Results
3.3.1. Dynamic Visualization of Simulation Results
Besides dynamic styling on attributes or IDs, the animation is also necessary for energy simulation to illustration the spatial-temporal changes in a period. For example, the daily heat demand of a building in a continuous year or electric power consumption in a week. Currently, Cesium supports the animation with CZML specification, however, it is not cover the 3DTiles objects. In other words, CZML can implement the dynamic styling/shape/location change of a single building model but not a whole city, except defining each building separately which dramatically reduces the performance both loading and rendering.
In this paper, we implement the animation of 3D city models directly based on the client styling of 3DTiles. The JavaScript function SetInterval() which calls a function or evaluates an expression at specified intervals is employed to perform the animation. We define a function to re-style the 3DTiles based on a globe accumulator or timer which can be updated in each around. While the intervals can also be set for frame rate adjustment according to the visualization configuration.
Corresponding to the built-in attribute and ID map strategies, the animation update function can also be implemented by two types of methods attributes based and ID map-based. For attribute-based animation, the energy simulation results are saved as an array of attributes in 3DTiles data as B3DM format. For example, the average electricity requirement of each building in one day can be saved as the “electricity_requirement = [20, 23, …, 25, 24]” to present the electricity consumption during a period such as one week or month. Then we can access the ith value by “${electricity_requirement [i]}”, and update the style accordingly. Finally, by accumulating i and updating continuously, the simulation results are dynamically visualized with animation effects.
In ID map based animation, the ID map data containing simulation results are loaded first and then for each ID the styling color is calculated based on its attributes and a condition for styling is generated and added to the current style. After that, the current style is used to update the 3DTile models. Compared with the attributes based method, ID map method is more flexible and not affect the original 3DTile models. However, the performance is reduced quite much compared directly styling with attributes in the batch table. Since in the directly styling the model is created one by one while in the batch table based styling the models are rendering together with the better optimizing. Therefore, it is suggested for a small area, the ID map can be applied while for large area dynamic visualization, the attributes based method is recommended.
3.3.2. Multiple Time Scale Dynamic Rendering
For energy simulation results visualization, the multiple time scale is necessary to demonstrate the patterns of a time-period such as daily, weekly or monthly. Meanwhile, in Cesium, a timeline object is proposed to control the current time and speed of time passing. The timeline can control the dynamic visualization of Cesium Language (CZML) objects of Cesium, but there is no support for 3DTiles animation in the existing Cesium (version 1.5.0 published in 1 October 2018). In this paper, we propose a multiple time scale dynamic rendering framework for 3DTiles using the Cesium default timeline widget.
To implement the multiple time scale rendering, three steps are designed, multiple time scale dataset generation, time scale determination and dynamic rendering. First, the multiple scale dataset can be created based on the detailed simulation output or directly generated from simulation tools by parameter setting. For example, if we have hourly-based electricity power requirements, then the daily, weekly or monthly electricity requirements can be directly calculated by summarizing, averaging or other grouping functions the figures in the respective periods. Second, for each generated dataset of a certain time scale, a descriptor is assigned for time scale determination. The descriptor is composed of a time interval, start time (s), end time (e), number of values (n), and the location of the dataset (url). The Cesium timeline widget can return two values in the interaction, speed (s) and start time (ts). Meanwhile, to control the update frequency of the SetInterval() function, a parameter f is introduced. Usually, f is set to 1 s and can be adjusted according to the application request. To select the suitable time scale file, a standard time interval (int1) is defined to represent the 1× time speed, and the descriptor with interval value closest to s*int1 will be selected as the scale file to rendering. Finally, based on the selected descriptor, the SetInterval() function will be updated according to the new rendering file indicated by the location parameter in the descriptor. The number of the initial value for rendering can be also calculated by the function n*(ts − s)/(s − e).
In Cesium, we can bind the multiple time scale rendering actions to the timeline widget. Whenever the user adjust the speed or current time in the Cesium timeline, the corresponding time scale dataset will be reloaded to the SetInterval() function to generate the dynamic visualization in multiple scales.
3.4. Real-Time Styling
For real-time GIS, it is essential to transmit and visualize information generated continuously. To implement the real-time data exchange, Websocket (a computer communications protocol, providing full-duplex communication channels over a network connection) is studied and integrated into the system. The server side is sending real-time data such as temperature, humidity, or energy consumption continuously. While the client receives data from the server and render the 3D Tile model accordingly. Meanwhile, the client can also send the requests or feedbacks to the server to control the energy simulation strategies or to get different data streaming.
After receiving data from the server, the styling is implemented accordingly. Normally, the real-time data is structured as ID table format containing 3D model ID and its attribute value which is rendered as discussed in Section 3.2. Meanwhile, we create a methodology to implement the batch table attribute-based rendering to improve the visualization performance.
Assuming from different servers, various real-time data is continuously sending to the client such as current temperature, humidity, electric price or weather condition. Then we calculate the energy simulation results or KPIs (Key Performance Indicators) such as energy efficiency, total cost and so on with the predefined expressions which can take the real-time data and attributes in the batch table as input. In 3DTiles, only basic operators (+,−,*,/,%) are supported. Therefore, the simulation KPI calculation required complex operators cannot be directly implemented. For example, we can easily get the real-time daily electricity cost based on power consumption (batch table attribute) and real-time electric price. While it is a bit complex to direct get energy consumption from real-time temperature.
Another method to get energy simulation KPIs from real-time data is to pre-calculate and save the results as arrays which are accessed by the real-time data as indexes. For example, we can simulate the electric power consumption array of building in the temperature range from −20 to 40, then when a real-time temperature data is sent from the server we can get its corresponding electricity consumption by locating the real-time temperature in the array. The index-based method can be extended to support multiple parameters and can be applied for wider scenarios. Since the results array is saved as attributes in the batch table, the size of the array should be limited so that the model can be loaded in a reasonable time. Therefore, for real-time energy simulation data visualization, the rendering strategies should be evaluated and selected based on the data frequency, size, simulation complexity, and user requirements.
3.5. DTiles Generation
The 3D city model datasets are integrated into 3DCityDB according to CityGML and the EnergyADE standards. Feature Manipulate Engine (FME), a software developed by Safe Software Company is used to convert the data from different format into CityGML and to insert data into 3DCityDB with EnergyADE extension. Based on the 3D city model database, a wrapper is implemented with Python to generate the input files for energy simulation software. In the test case, we mainly create the IDF (EnergyPlus Input Data Files) file for EnergyPlus. The simulation results are saved back to 3DCityDB with the wrapper.
Based on the 3DCityDB, a web-based GUI is created to check the city model data and define the configuration for the wrapper to generate input file of energy simulation. The generated simulation results are parsed and write back into 3DCityDB as CityGML EnergyADE format. For example, the simulated energy requirements for each day in a year can be saved in the EnergyDemand object which contains the following content: energyAmount (Time Series data), endUse and maximumLoad, energyCarrierType. The 3D visualization of energy simulation is implemented based on the 3DCityDB database.
To visualize the 3D city models, the 3DTiles should be generated. In this paper, we first read 3D geometry data from 3DCityDB and convert to OBJ format for 3D models. Meanwhile, the batch table of 3DTiles is generated for each 3D objects in the OBJ file from their attributes in CityGML database. Next a tool named obj23d-tiles is used to create the 3DTiles data in B3DM format. Based on that we create a 3DTile Meta data called tileset.json to define the visualization configuration such as geo-location and geometric error of the generated B3DM files. For big area of City, the whole models are first segmented into smaller regions and for each region a B3DM files are created. Furthermore, models in multiple regions can be generalized to support multiple LoDs. However, the attributes in batch table should be the same in different LoDs so that the dynamic visualization is in consentience in different LoDs.
4. Implementation and Results
To demonstrate the proposed real-time energy simulation results visualization framework, we implement the proposed methods within IntegrCiTy project, an EU project that aims to develop a decision-support environment for planning and integrating multi-energy networks and low-carbon resources in cities. Real-time 3D city visualization methods are employed to illustrate the effects of the simulation and to communicate with planners, decision-makers and the general public on sustainable energy planning.
4.1. System Configuration
To implement the proposed real-time visualization framework, we employ Cesium 1.5 for 3DTile server and socket.io for real-time data source. The configuration structure is shown in Figure 6. The energy simulation task is mainly implemented with TRNSYS [4] and EnergyPlus [3]. TRNSYS is a transient software tool designed to simulate the transient performance of thermal energy systems, and EnergyPlus open-source building energy modeling (BEM) engine to simulate the energy consumption of building structures. By combining TRNSYS and EnergyPlus, we can simulate the city level energy supply, transmission and usage.
In Figure 6, different types of simulation datasets such as 3D city models, energy data, city utility network, and economy (gas or electric price), weather (average temperature) or society (number of people) data are wrapped into a unified format with semantic information. CityGML is used as the data integration standard. City information such as buildings, power lines transportations and so on are first converted into the CityGML format and saved in 3DCityDB a database structured according to the CityGML schema supporting EnergyADE or Energy Application Domain Extension. Then, energy simulations can be performed based on the data that is wrapped from the CityGML database. Next, the simulation results are saved back to the CityGML database for different applications.
The Cesium is developed as a Graphic User Interface (GUI) to visualize the energy simulation results. Two types of datasets are loaded layer data and scenario data. The layer data includes imagery, vector geometry, 3DTiles and 3D model objects. While the scenario data contains how each layer should be visualized. For example, it can define the color, rendering method for each line or building object, or how the animation should be implemented. We can switch from different scenarios to demonstrate the difference between energy simulation results.
4.2. Study Area and Data Sources
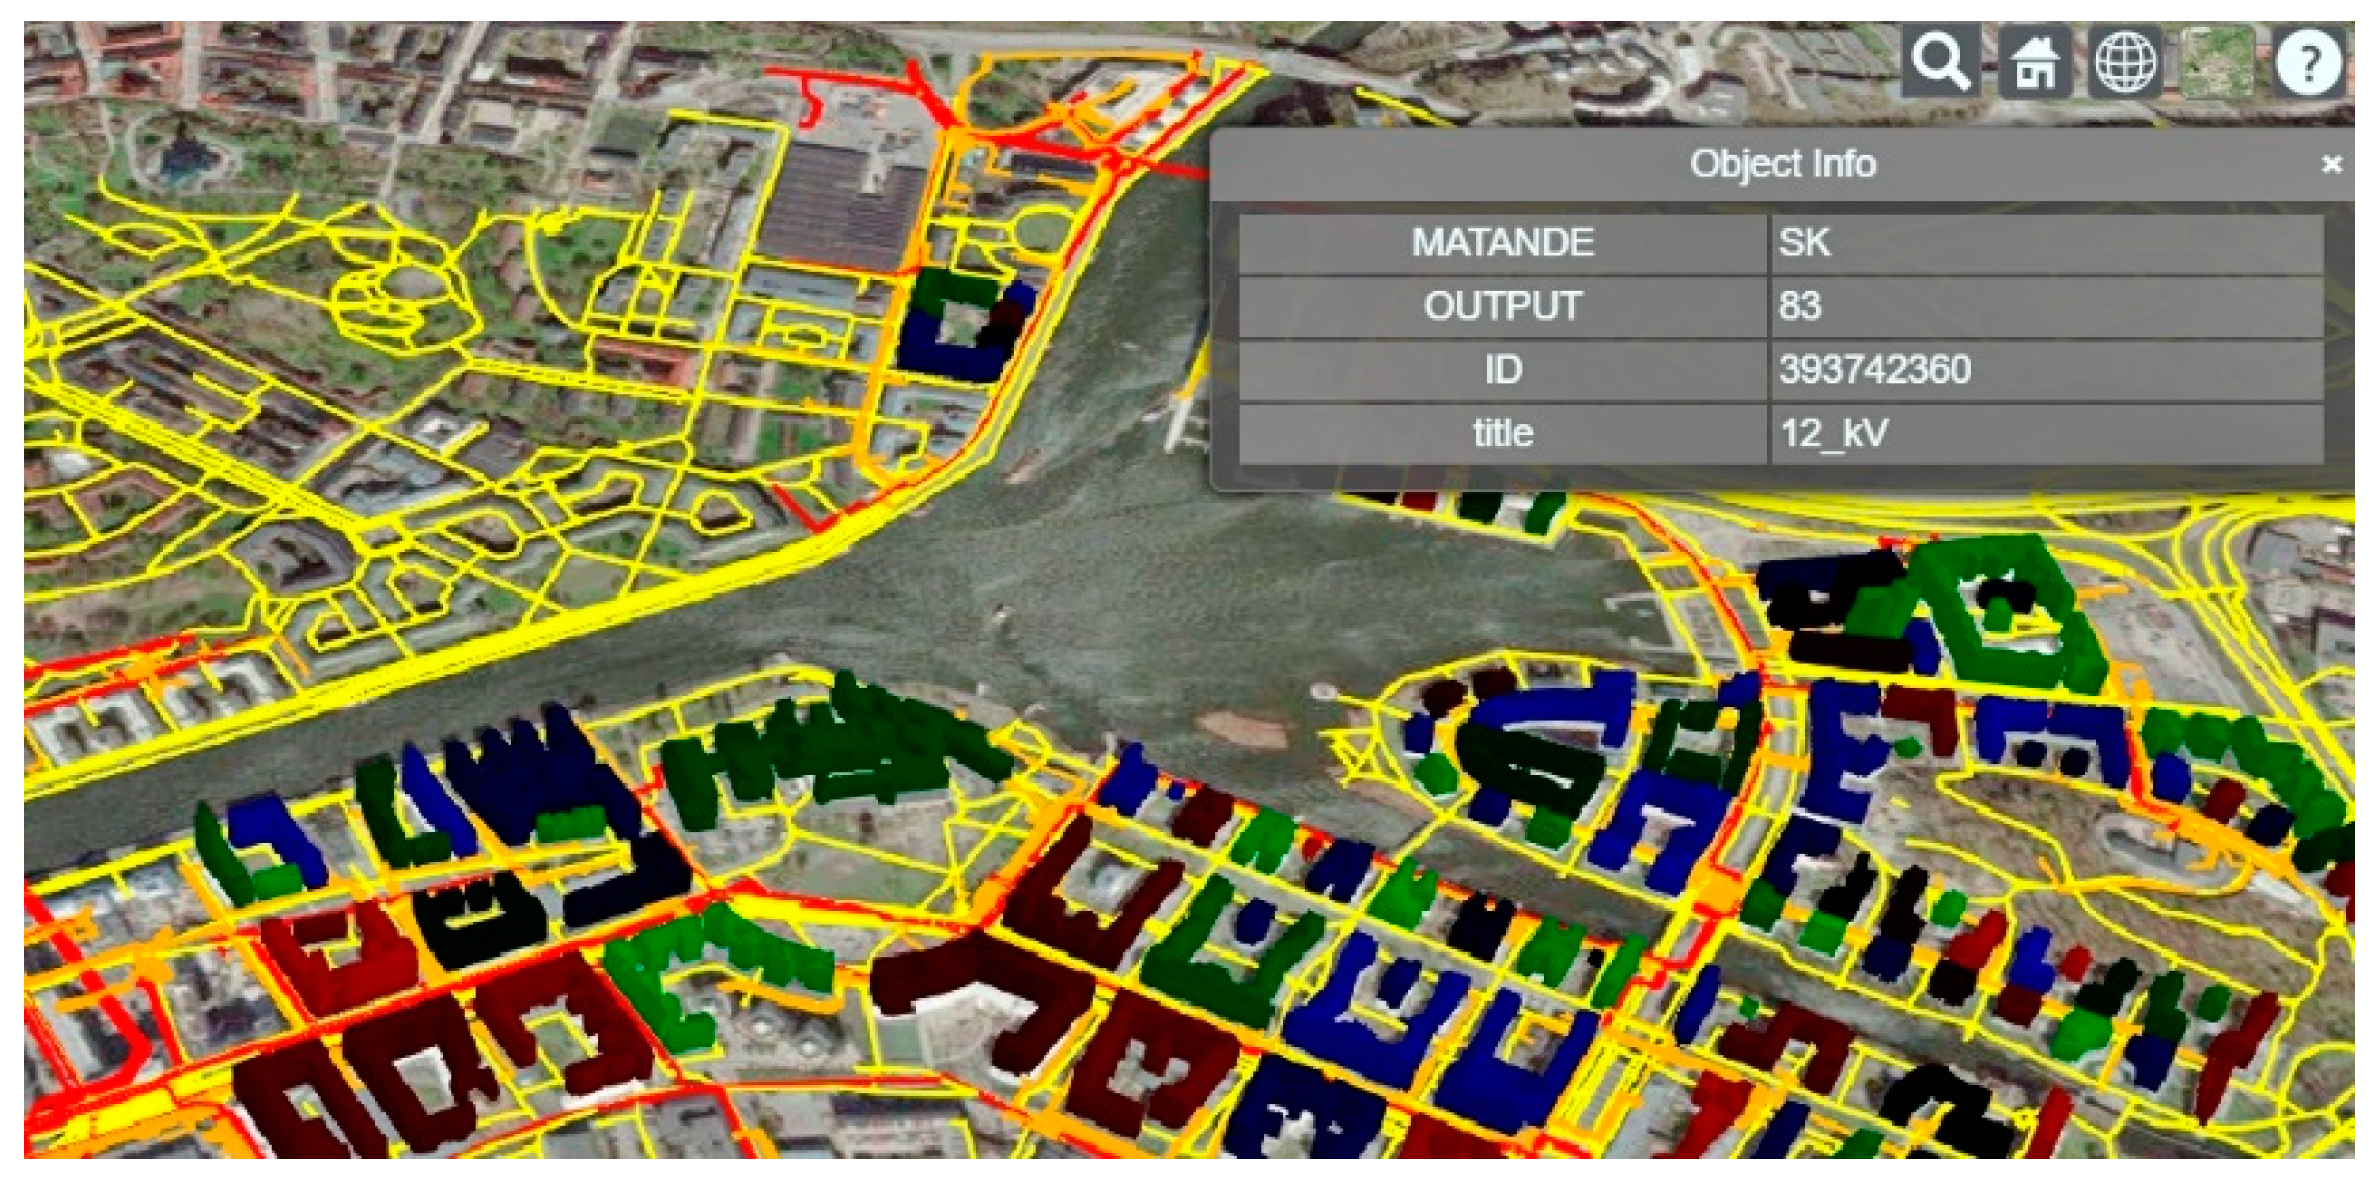
The study area is Hammarby district in Stockholm, Sweden. We collect the energy-related data and 3D models in this area from different resources. The layer data includes 155 buildings LoD2 building models of the whole area, seven typical buildings with both LoD2 and LoD3 data representing residential, school, business, and gym, road network and power lines. As shown in Figure 7, the energy simulation results indicate are average heat/electricity power requirements. Building attributes such as height, area, volume, usage, number of residents and number of companies are calculated from the 3D models or collected from open web pages. The weather condition data for one year of the Stockholm area are also collected for simulation.
4.3. 3DTiles Visualization
Figure 8 gives a demo for multiple LoD visualization. The nearby models are in LoD2 with the roof structure and the far away buildings are in LoD1 just block models with ground plan and height. In our test, the performance is not improved much since the total number of buildings are limited. For a large area, the muli-LoD of 3DTiles is essential for efficient visualization and interaction. We test our dataset by comparing the rendering time and FPS (Frame per Second) in interaction in Table 2. It is indicated that for a city block with 155 buildings, the 3DTiles structure can reduce the rendering time from 13s to 3s and increase the FPS from 5 to 22.
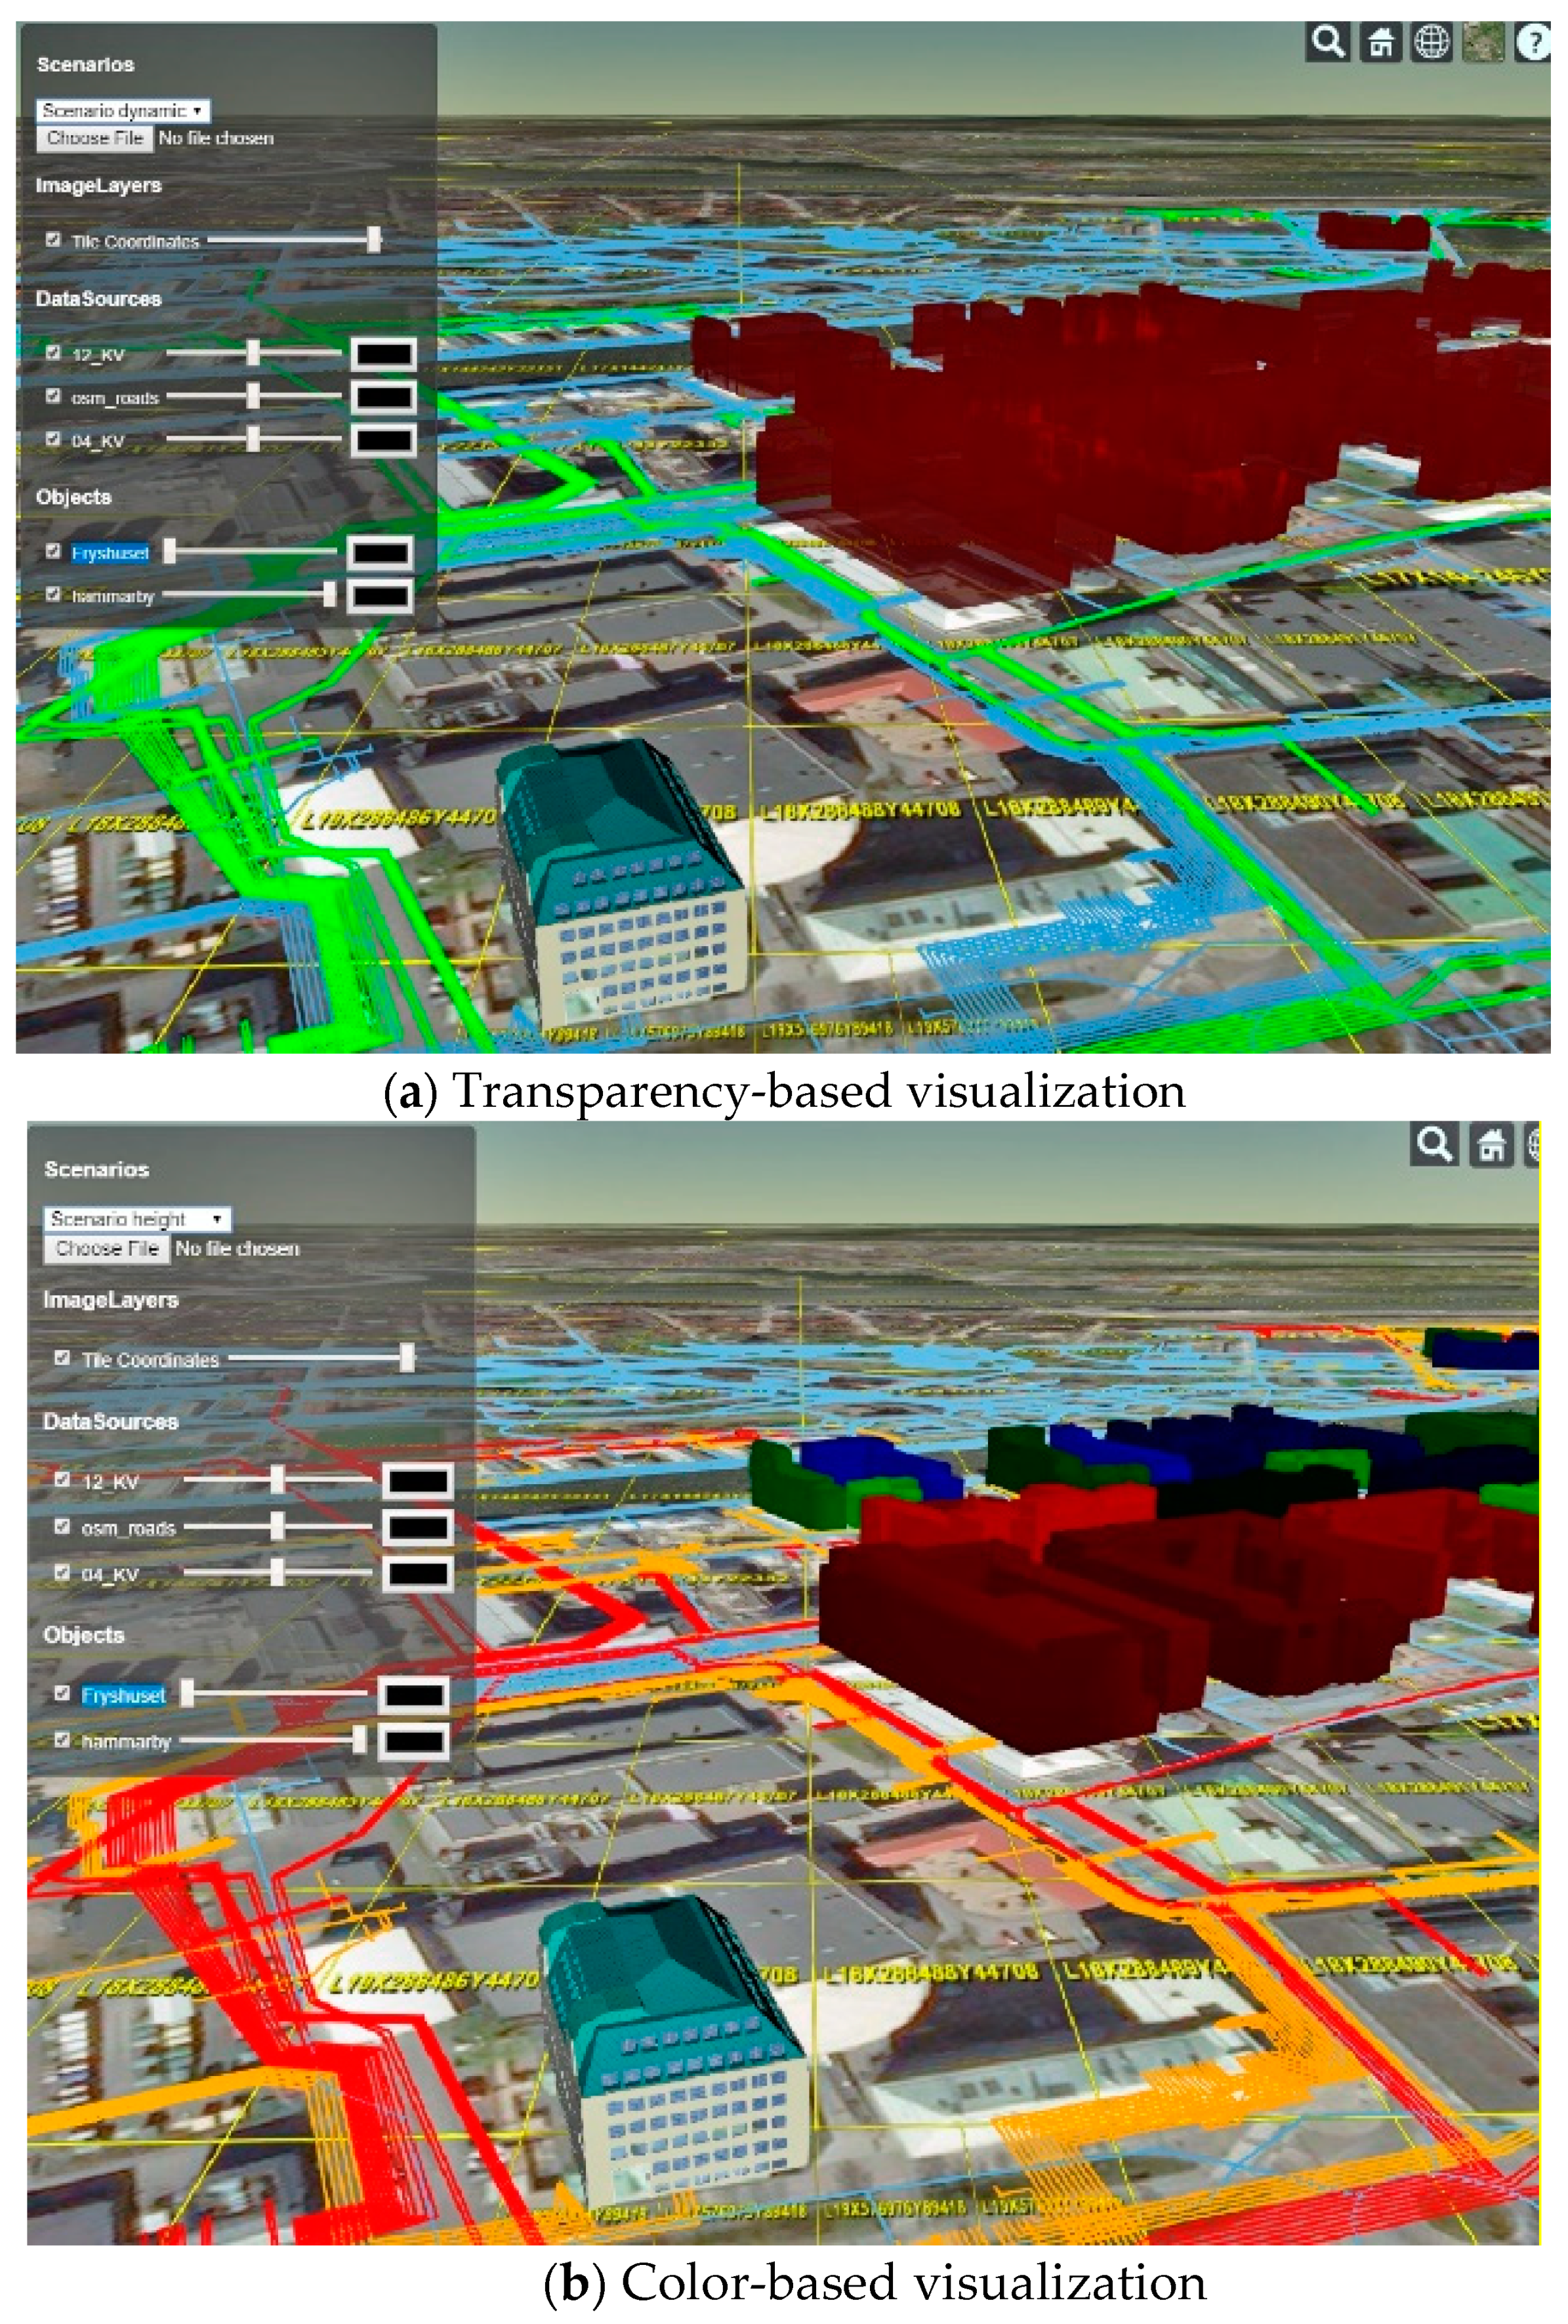
Figure 9 gives an example of combined visual mapping to color and transparency from the demo dataset. It indicates that the old buildings (opaque ones) have lower energy efficiency (red color).
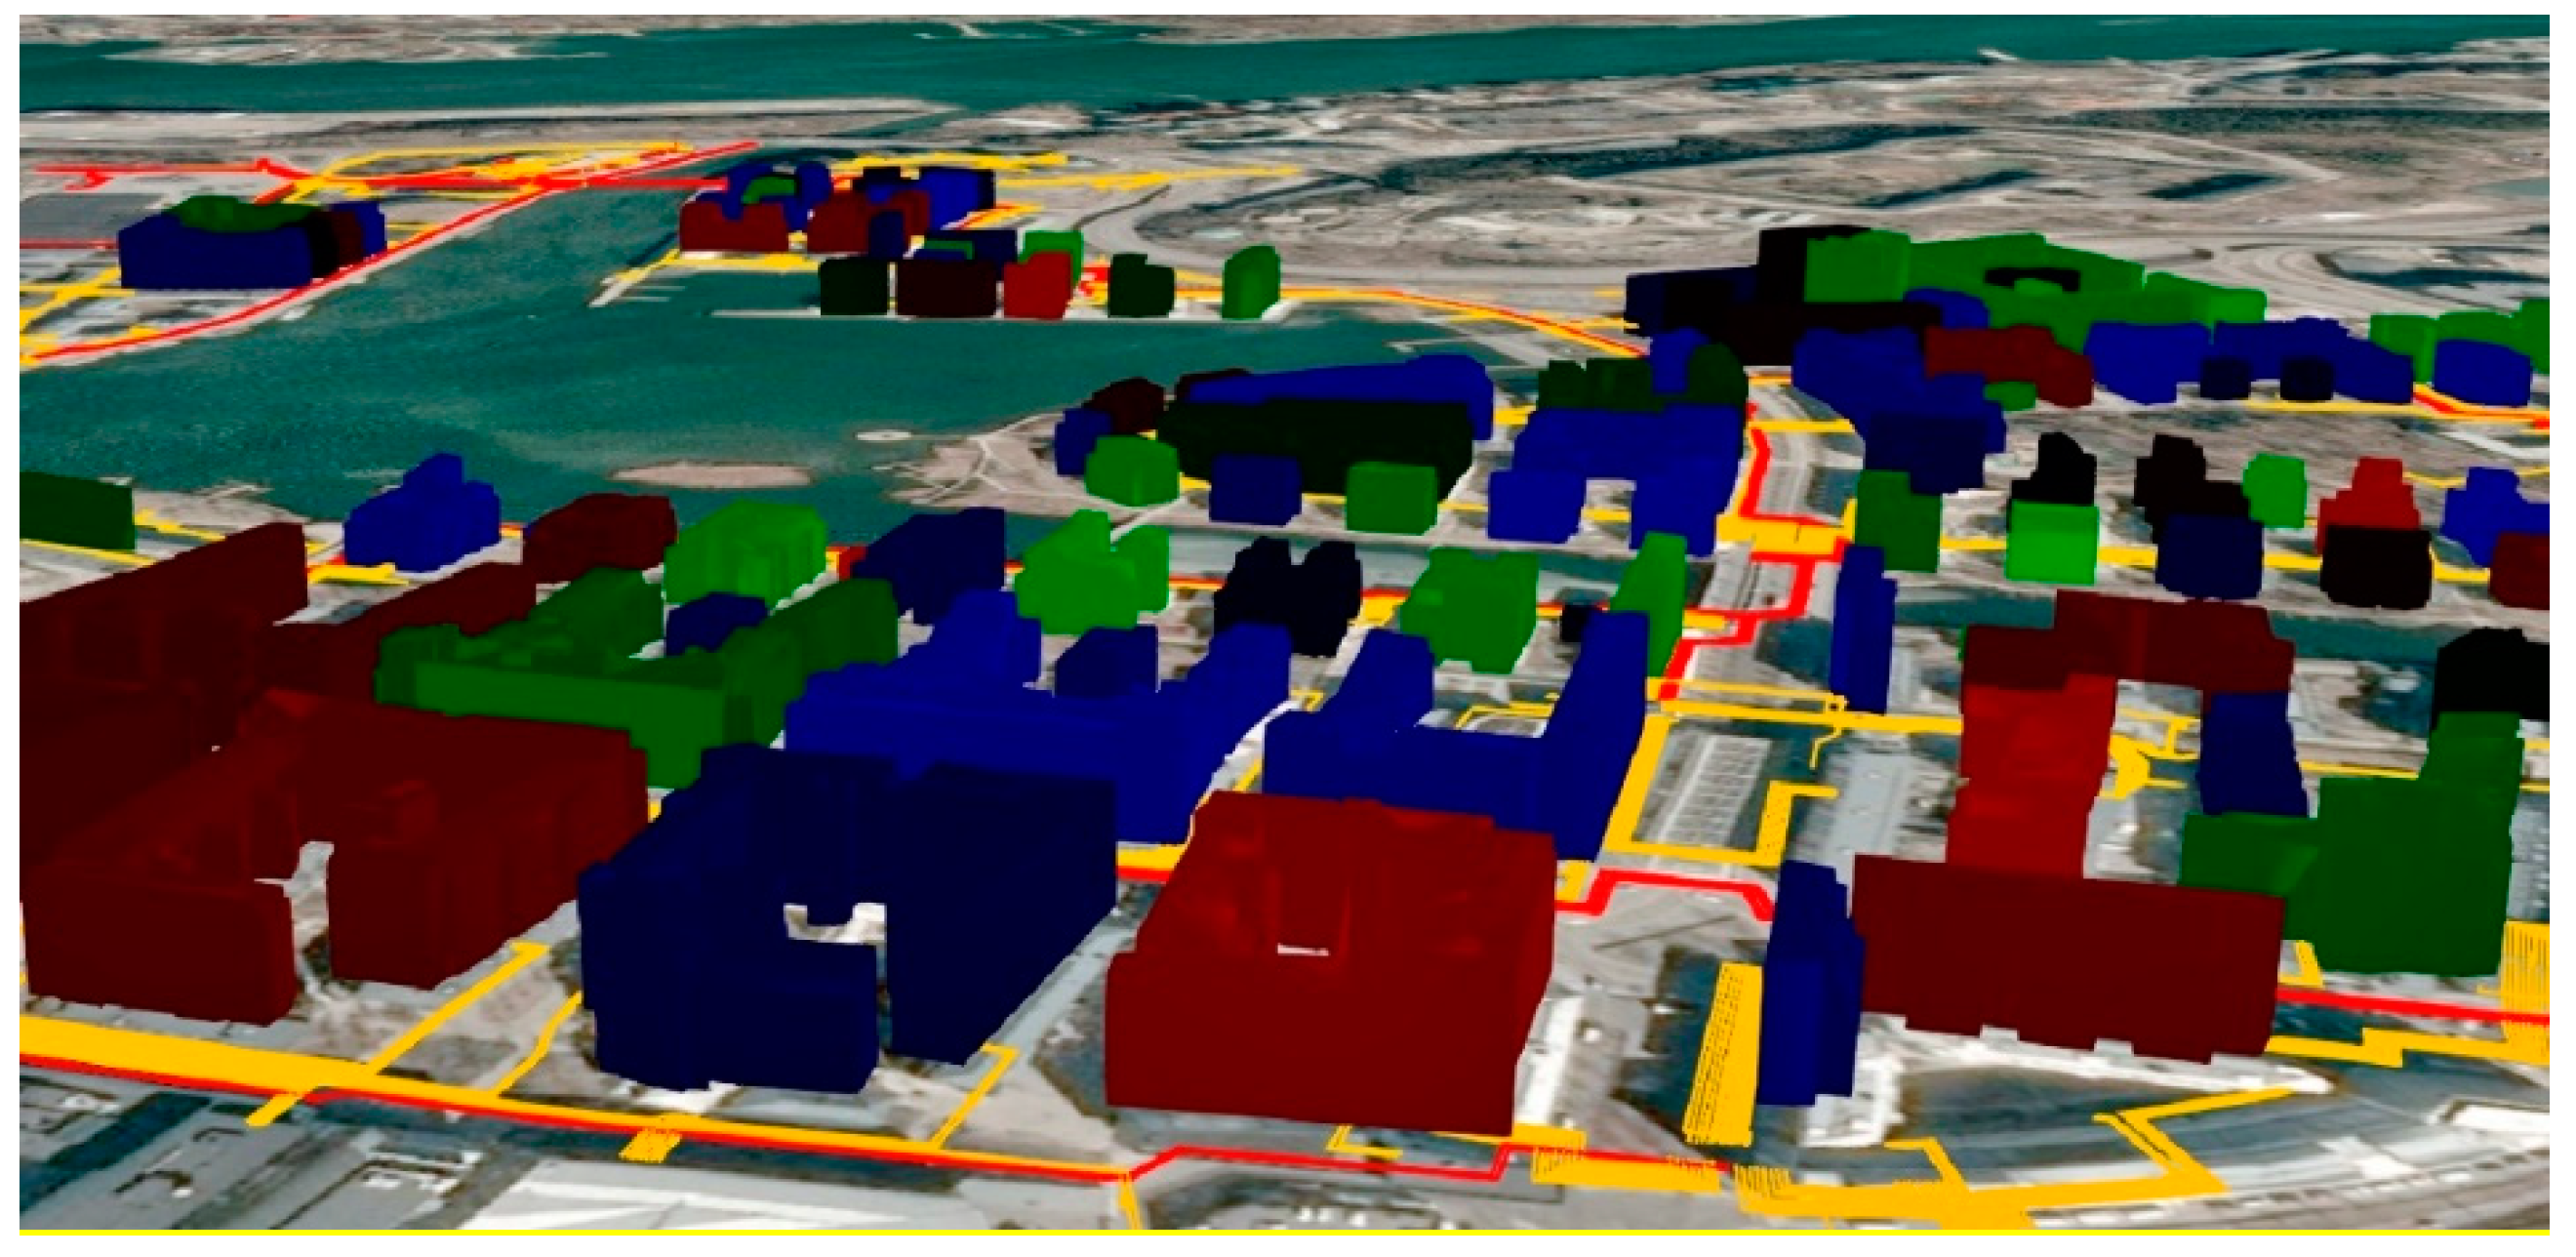
Based on 3D Tiles data, dynamic styling is used to implement the energy simulation results visualization. We create different visualizations for different scenarios by configuring styling strategies. Multiple scenarios can be loaded and switched according to user requirements as shown in Figure 10.
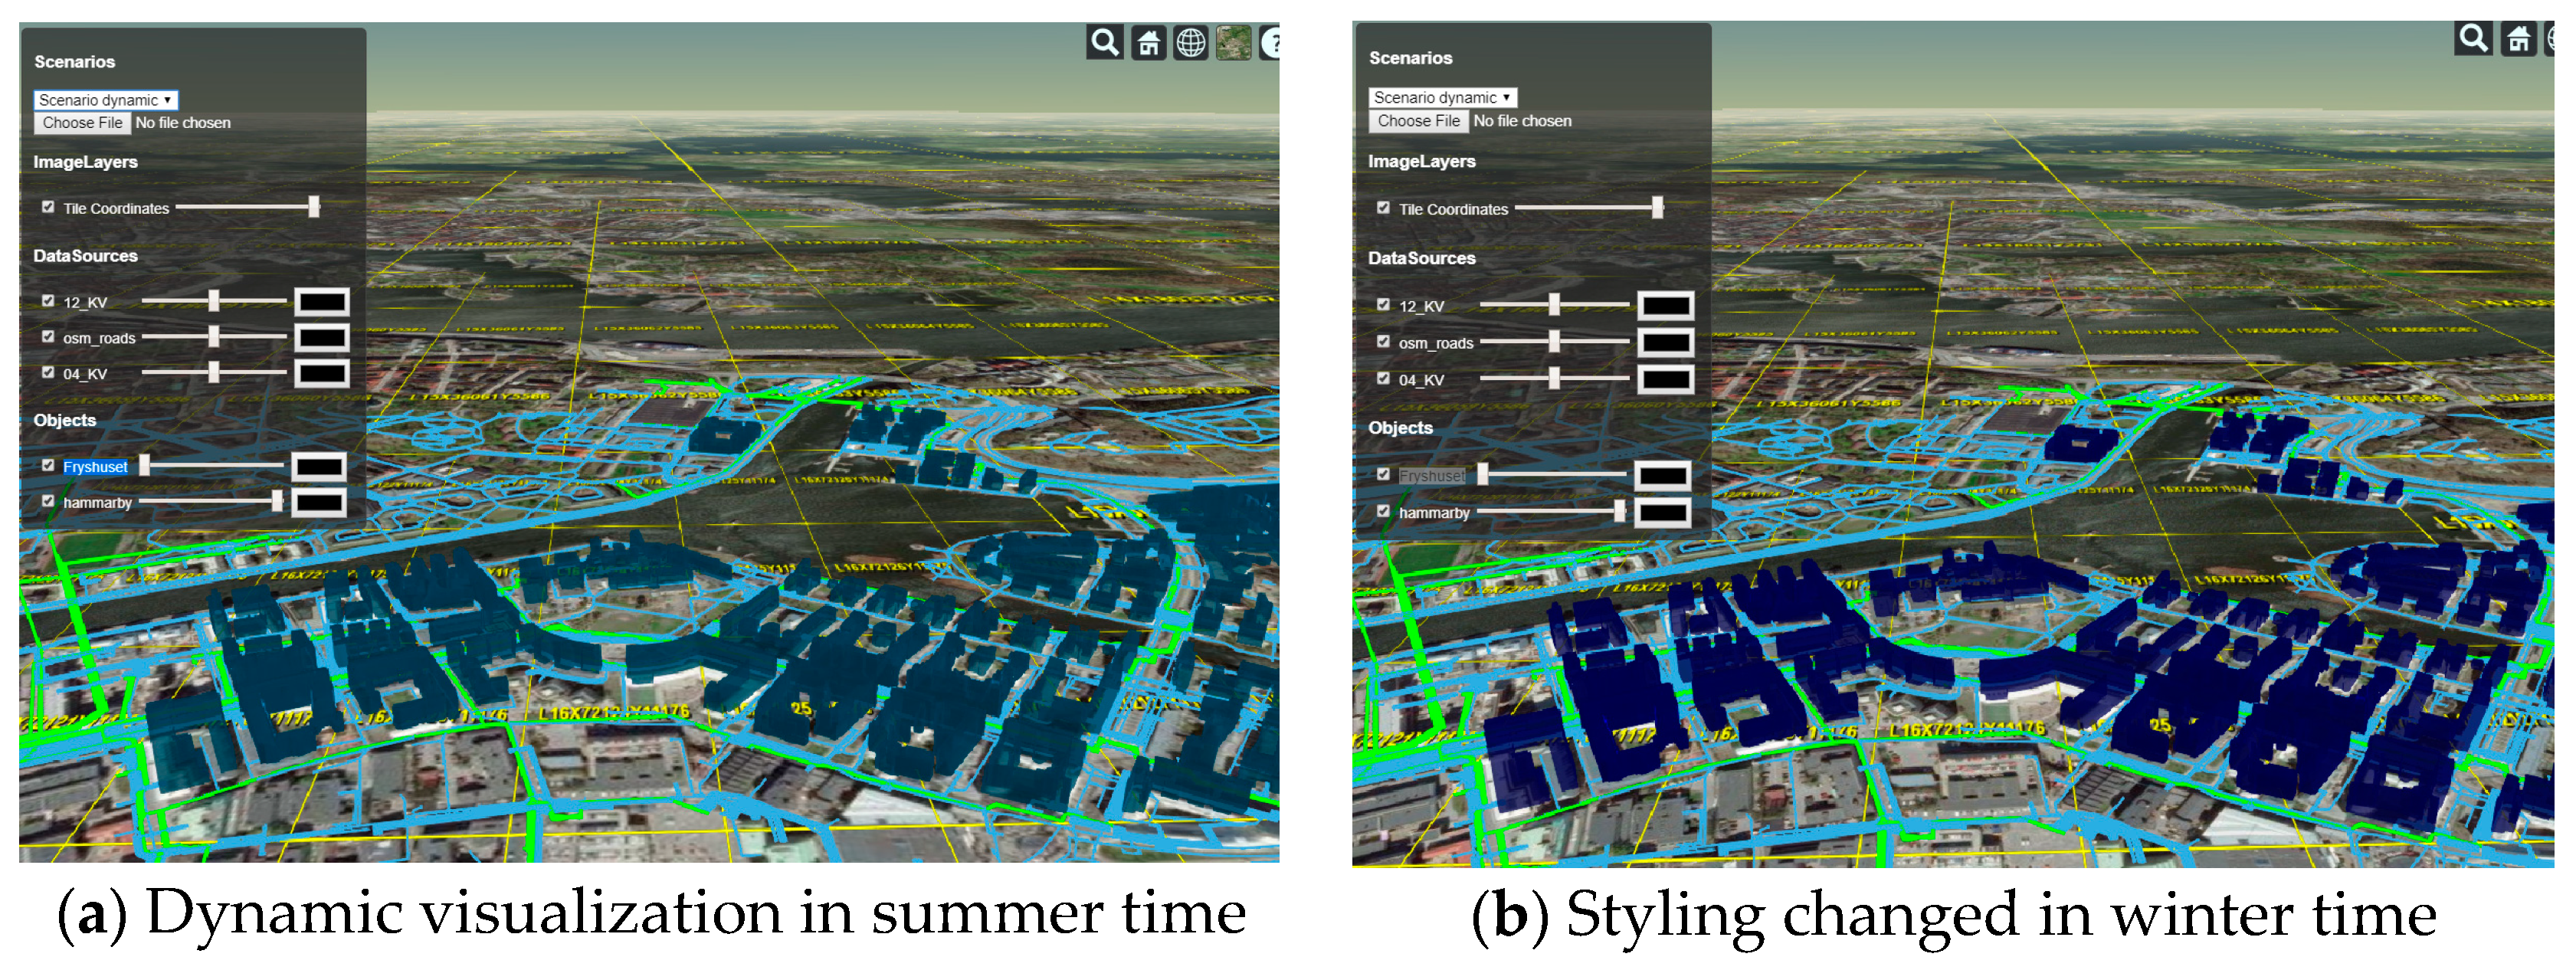
We have already implemented the style animation of a single building and 2D objects in geojson with CZML. For large city area in 3Dtiles, we can do the dynamic style animation by setting the simulation results as attributes in the 3Dtiles or a map file to each building/object ID and create the animation with setInterval function in javascript. Figure 11 gives an example of animation based on dynamic style change of 3DTiles. Figure 11a shows the overall energy consumption in summertime and Figure 11b gives the results in wintertime. They are two frames in an animation that indicates the energy consumption of the whole year.
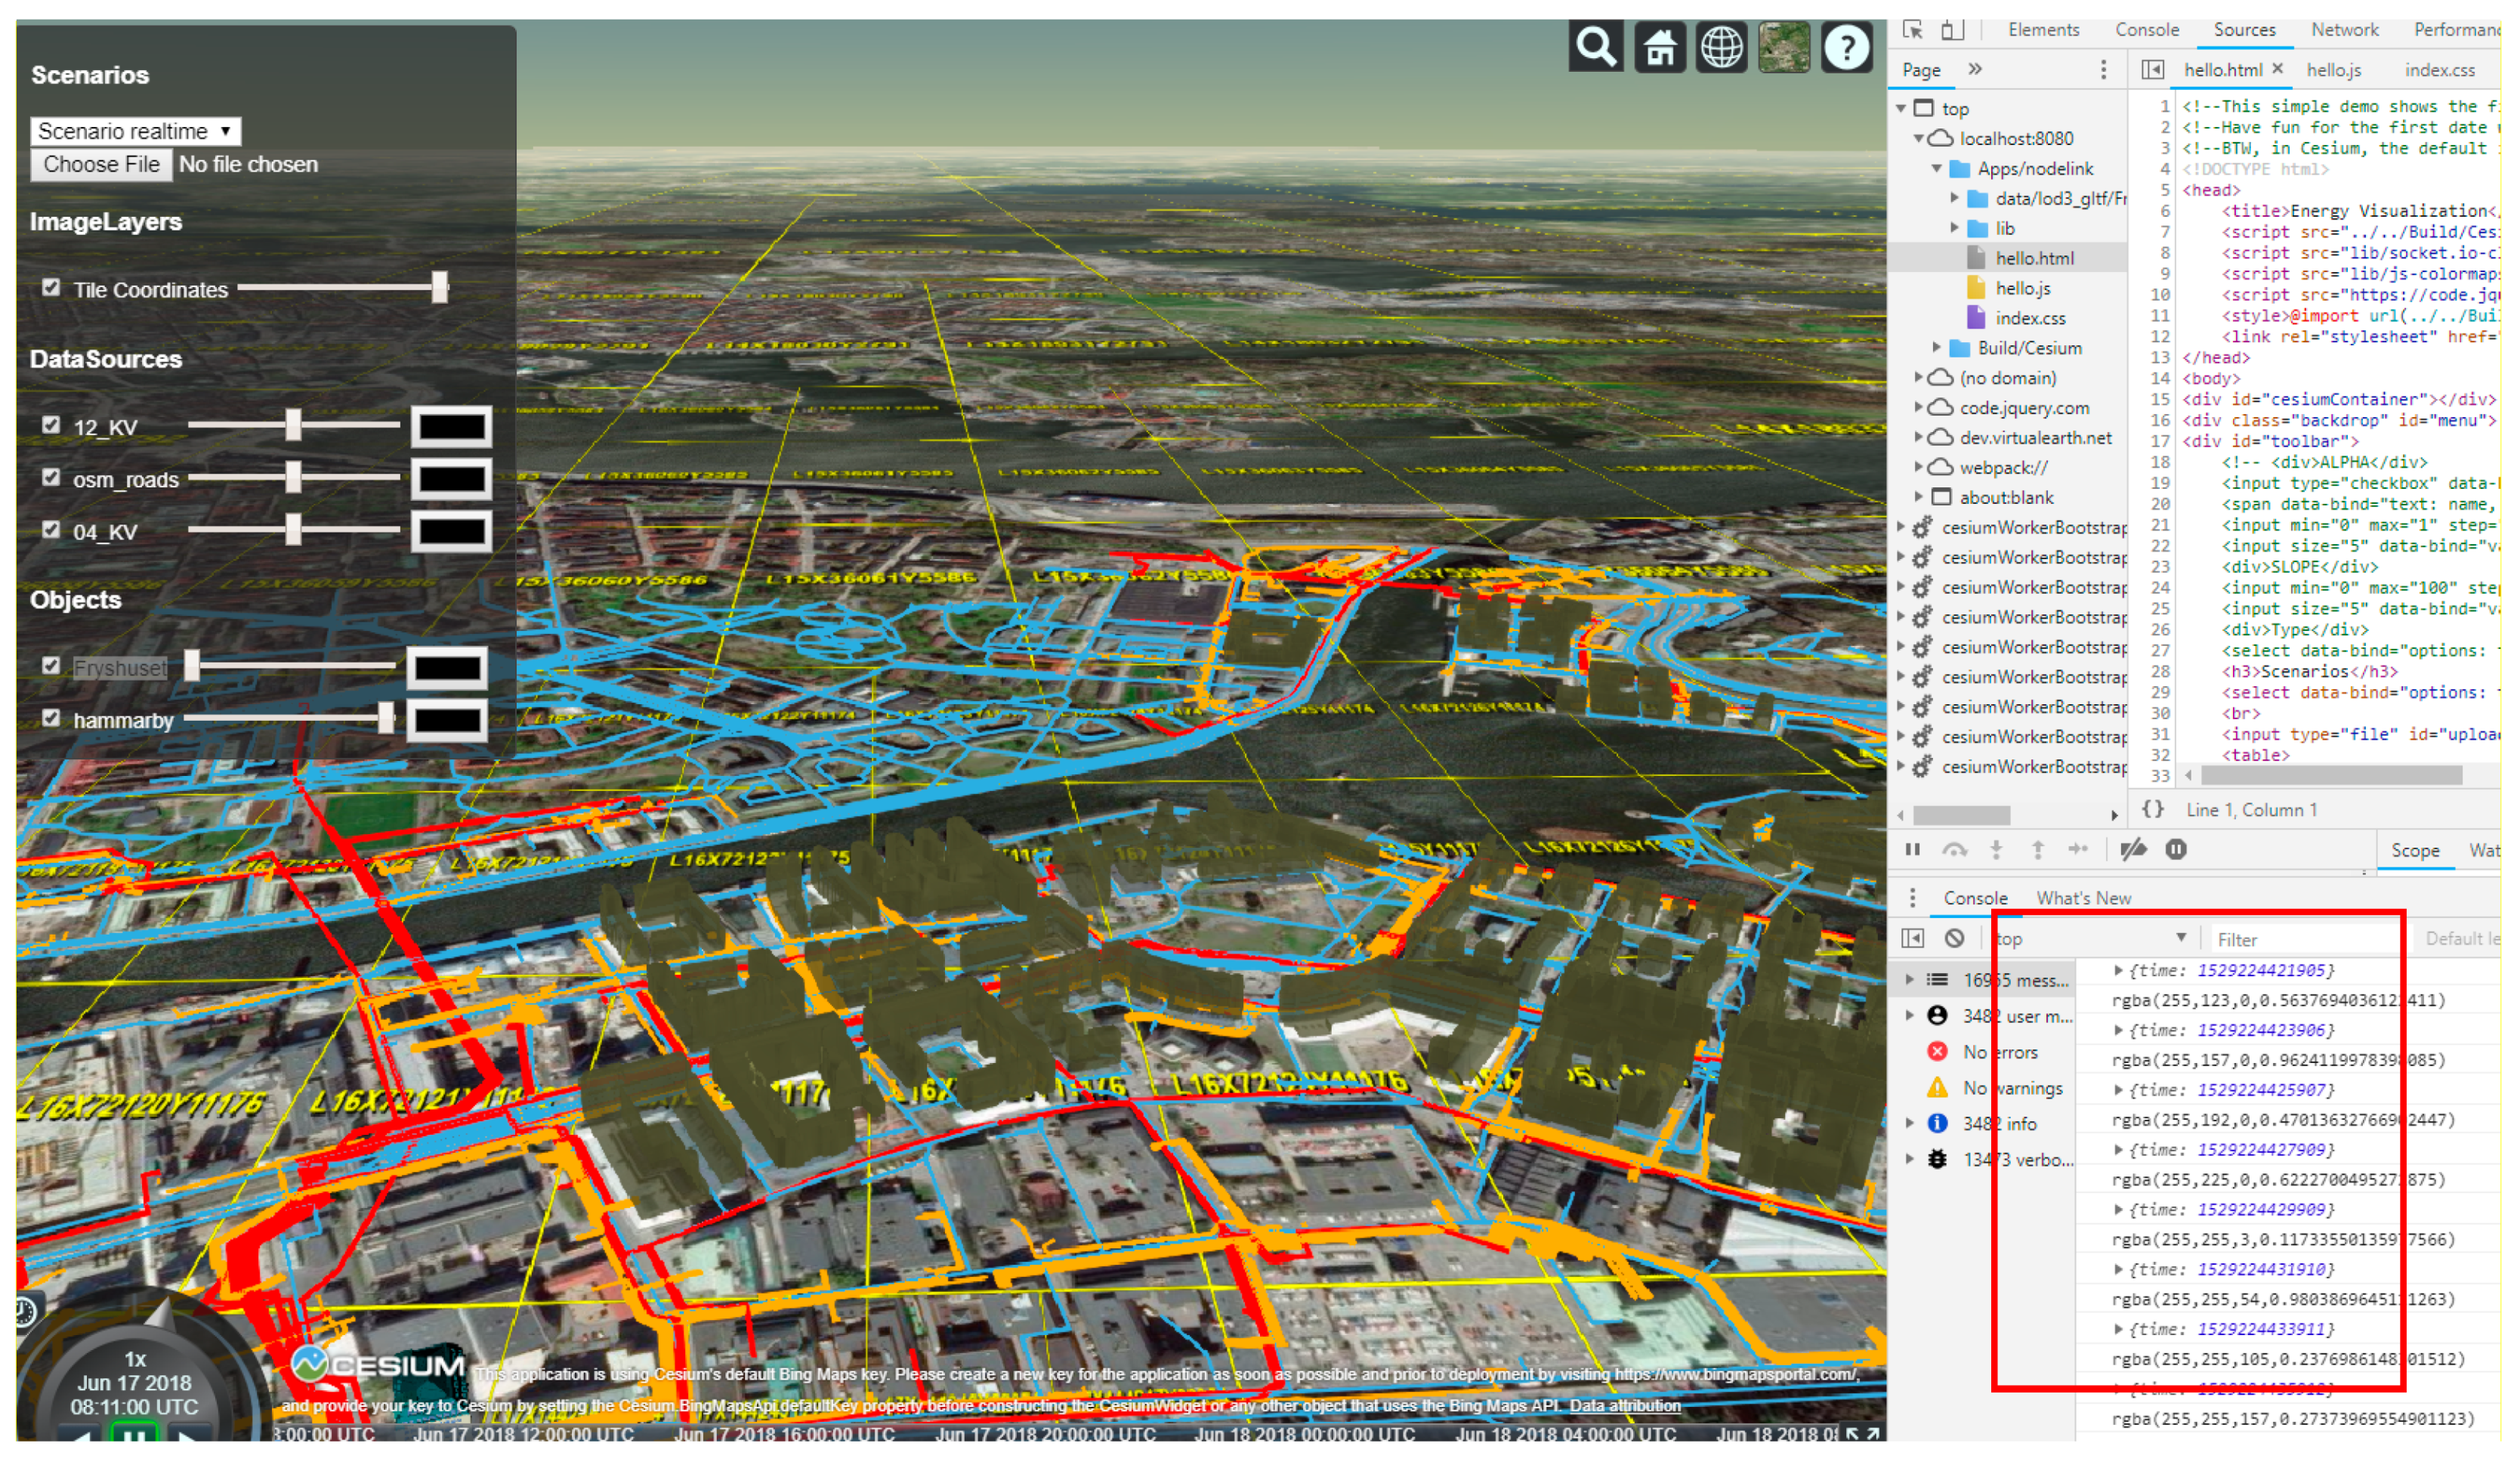
To support the real-time visualization, a websocket server is created to send data to GUI in real-time. So that the GUI can communicate with the simulation server to send requests and to receive the results that can be dynamically visualized in the GUI. Figure 12 shows the style change according to the received real-time data from the server (lower right red box).
The results show that the online real-time visualization framework is suitable for city energy simulation. Two main contributes of the paper are non-photorealistic generalization and 3D tiles-based real-time visualization. The experimental results indicate that the proposed visual variable based non-photorealistic generalization algorithm can effectively generate the multiple LoD 3D city objects to improve the visualization performance and to represent the energy simulation results reasonably; and 3D tiles based 3D models with attribute tables can support the real-time interaction.
4.4. Discussion
Photorealistic visualization used to be the main task of 3D city model-related research. Nowadays, the semantic attributes of 3D city models and the corresponding non-photorealistic visualization are becoming increasingly important especially for simulation tasks such as energy consumption [29]. To create the semantic city models for specific applications, CityGML is a suitable candidate to start, but it still has a huge gap to implement the full requests because the CityGML only contains the general attributes of city objects [30]. For example, for the energy simulation, the application domain extensions such as EnergyADE or UtilitynetworkADE can provide an enhanced CityGML with semantic information in city energy. However, it is still not enough to directly perform the simulation based on the CityGML data, there are still around 60% parameters (building inner structure, building facility, wall material and etc.) should be manually provided [31]. Therefore, it is necessary to integrate especially BIM information to perform more accurate simulation. In this paper, we cannot collect the BIM data of the test area because these buildings are built decades ago and only left the blueprint instead of BIM data, so these missing parameters are set to the default value based on the expert’s knowledge. Even though, it is essential to integrate the CityGML with professional software such as BIM, heat/power station or electric grid control system to perform city-scale energy analysis.
To better understand and interact with the complex attributes or simulation results of city models, non-photorealistic 3D visualization is one of the key technologies. Compared with traditional 2D map, 3D city models can supply more information and interactive methods, and it allows for visually integrating information from different sources such as energy, temperature, sunlight and people actives into a single framework [32]. Visual variables of 3D city models can be used to represent different attributes of city objects. In this paper, color and transparency are mainly considered. Meanwhile, the geometry visual variables such as size, height, and orientation can also be applied as visual variables. The key to using of these geometry visual variables is the parameterization of city objects. We need to represent the buildings to basic types with the transform parameters (position, scaling, and orientation) and study the rule-based 3D building modeling techniques to semantically combine the attributes information with the geometry parameters.
Dynamic visualization is essential to illustrate the real-time attributes changes and continuous simulation results in a period such as a day, month or year. Considering the complexity of 3D models, the rendering efficiency is critical. Therefore multiple representations (LoD tree, a tree structure that integrates multiple LoD representations of the 3D city models and supports the access of models of certain LoD according to the user current viewpoint) and dynamic rendering are necessary to supply the stable interaction with 3D city models. Different from video games that are manually optimized for specific dynamic visualization scenarios, 3D city models have a large volume of redundant data to cumber the rendering performance. Therefore, 3DTiles of the Cesium platform is a suitable structure to implement the LoD tree and it also supports the dynamic styling which can change the visual variables of 3D without recreating the whole model. The real-time streaming data of a city block can be dynamically visualized according to the experiment results. However, currently, the visual variable are color and transparency, the geometry visual variables such as height, size or orientation are not used because the existing city model are not parameterized, and it is also necessary to extend the 3DTiles structure to support the parameterized 3D models.
5. Conclusions
In this paper, we developed a GUI based on the Cesium framework to visualize the energy simulation results. To improve the visualization performance, the 3D city models are generalized for non-photorealistic visualization that is an essential technology for smart city applications to illustrate different types of information. We propose a strategy to map the data for visualization to the visual variables of 3D city models such as geometry, texture, topology and environment. Generalization on each visual variables are applied to speed up the data transmission and rendering. A demo project on energy simulation for sustainable city analysis is developed to show the effectiveness of the proposed method. The experimental results show that non-photorealistic generalization is essential for online 3D city related applications and can improve system performance while supplying the required visualization results.
The basic findings of the paper is that 3D city models are essential for complex urban analysis such as energy simulation; the online non-photorealistic visualization can be implemented by the multiple LoD structures supplied by 3DTiles of Cesium; Style mapping functions of 3DTiles can also be used for real-time rendering of 3D city models besides the CZML method.
Author Contributions
Methodology, Bo Mao; software, Bo Mao; writing—original draft, Bo Mao; supervision, Yifang Ban; writing—review and editing, Yifang Ban; funding acquisition, Björn Laumert, Yifang Ban, Bo Mao; investigation, Björn Laumert. All authors have read and agree to the published version of the manuscript.
Funding
This research was funded by the National Natural Science Foundation of China grant number 41671457, the Open Fund of Key Laboratory of Urban Land Resources Monitoring and Simulation, MNR, grant number KF-2019-04-016 and the IntegrCiTy project.
Acknowledgments
We thank the Stockholm City for the city models.
Conflicts of Interest
The authors declare no conflict of interest.
References
- UN. 2018 Revision of World Urbanization Prospects. Available online: https://www.un.org/development/desa/publications/2018-revision-of-world-urbanization-prospects.html (accessed on 7 February 2020).
- Calvillo, C.F.; Sánchez-Miralles, A.; Villar, J. Energy management and planning in smart cities. Renew. Sustain. Energy Rev. 2016, 55, 273–287. [Google Scholar] [CrossRef] [Green Version]
- Energyplus. Available online: https://energyplus.net/ (accessed on 7 February 2020).
- TRNSYS. Available online: http://www.trnsys.com/index.html (accessed on 7 February 2020).
- Andriamamonjy, A.; Saelens, D.; Klein, R. An automated IFC-based workflow for building energy performance simulation with Modelica. Autom. Constr. 2018, 91, 166–181. [Google Scholar] [CrossRef]
- Weeber, M.; Ghisi, E.; Sauer, A. Applying Energy Building Simulation in the Assessment of Energy Efficiency Measures in Factories. Procedia CIRP 2018, 69, 336–341. [Google Scholar] [CrossRef]
- Nutkiewicz, A.; Yang, Z.; Jain, R.K. Data-driven Urban Energy Simulation (DUE-S): A framework for integrating engineering simulation and machine learning methods in a multi-scale urban. Appl. Energy 2018, 225, 1176–1189. [Google Scholar] [CrossRef]
- Crawley, D.B.; Hand, J.W.; Kummert, M.; Griffith, B.T. Contrasting the capabilities of building energy performance simulation programs. Build. Environ. 2008, 43, 661–673. [Google Scholar] [CrossRef] [Green Version]
- Kim, J.B.; Jeong, W.; Clayton, M.J.; Haberl, J.S.; Yan, W. Developing a physical BIM library for building thermal energy simulation. Autom. Constr. 2015, 50, 16–28. [Google Scholar] [CrossRef]
- Ham, Y.; Golparvar-Fard, M. Mapping actual thermal properties to building elements in gbXML-based BIM for reliable building energy performance modeling. Autom. Constr. 2015, 49, 214–224. [Google Scholar] [CrossRef]
- Kim, H.; Shen, Z.; Kim, I.; Kim, K.; Stumpf, A.; Yu, J. BIM IFC information mapping to building energy analysis (BEA) model with manually extended material information. Autom. Constr. 2016, 68, 183–193. [Google Scholar] [CrossRef]
- Choi, J.; Park, C. Issues and limitations in BIM to BEM for Energy Simulation. J. Archit. Inst. Korea Plan. Des. 2016, 32, 223–230. [Google Scholar] [CrossRef]
- Coccolo, S.; Mauree, D.; Kämpf, J. Urban Energy Simulation Based on A New Data Model Paradigm: The CityGML Application Domain Extension Energy. A case study in the EPFL Campus of Lausanne. Available online: https://infoscience.epfl.ch/record/214774/files/p1013.pdf (accessed on 7 February 2020).
- Nouvel, R.; Bahu, J.; Robert, K.; Jérôme, K.; Piergiorgio, C.; Moritz, L.; Karl-Heinz, H.; Esteban, M.; Olivier, T.; Egbert, C. Development of the CityGML Application Domain Extension Energy for Urban Energy Simulation. In Proceedings of the 14th Conference of International Building Performance Simulation Association, Hyderabad, India, 7–9 December 2015. [Google Scholar]
- Becker, T.; Nagel, C.; Kolbe, T.H. Semantic 3D Modeling of Multi-Utility Networks in Cities for Analysis and 3D Visualization. In Progress and New Trends in 3D Geoinformation Sciences. Lecture Notes in Geoinformation and Cartography; Pouliot, J., Daniel, S., Hubert, F., Zamyadi, A., Eds.; Springer: Berlin/Heidelberg, Germany, 2013. [Google Scholar]
- Marcel, B.; Romain, N.; Parag, W.; Volker, K.; Volker, C. An Energy-Related CityGML ADE and Its Application for Heating Demand Calculation. Int. J. 3D Inf. Modeling 2015, 4, 59–77. [Google Scholar]
- Okay, O.; Dursun, S. A Web-Based Application for Real-Time GIS. In Proceedings of the XXXV ISPRS Congress, Beijing, China, 3–11 July 2008. [Google Scholar]
- Lagmay, A.M.F.A.; Racoma, B.A.; Aracan, K.A.; Alconis-Ayco, J.; Saddi, I.L. Disseminating near-real-time hazards information and flood maps in the Philippines through Web-GIS. J. Environ. Sci. 2017, 59, 13–23. [Google Scholar] [CrossRef] [PubMed]
- Nourjou, R.; Hashemipour, M. Smart Energy Utilities based on Real-Time GIS Web Services and Internet of Things. Procedia Comput. Sci. 2017, 110, 8–15. [Google Scholar] [CrossRef]
- Li, W.; Wu, S.; Song, M.; Zhou, X. A scalable cyberinfrastructure solution to support big data management and multivariate visualization of time-series sensor observation data. Earth Sci. Inform. 2016. [CrossRef]
- Sun, Y.; Li, S. Real-time collaborative GIS: A technological review. ISPRS J. Photogramm. Remote Sens. 2016, 115, 143–152. [Google Scholar] [CrossRef]
- Wendel, J.; Murshed, S.M.; Sriramulu, A.; Nichersu, A. Development of a Web-Browser Based Interface for 3D Data—A Case Study of a Plug-in Free Approach for Visualizing Energy Modelling Results. In Progress in Cartography. Lecture Notes in Geoinformation and Cartography; Gartner, G., Jobst, M., Huang, H., Eds.; Springer: Cham, Germany, 2016. [Google Scholar]
- Sturm, W.; Berndt, R.; Halm, A.; Ullrich, T.; Eggeling, E. Energy Balance: A web-based Visualization of Energy for Automotive Engineering using X3DOM. In Proceedings of the Fifth International Conference on Creative Content Technologies, Venice, Italy, 5–9 May 2013. [Google Scholar]
- Wang, S.; Li, W.; Wang, F. Web-Scale Multidimensional Visualization of Big Spatial Data to Support Earth Sciences—A Case Study with Visualizing Climate Simulation Data. Informatics 2017, 4, 17. [Google Scholar] [CrossRef] [Green Version]
- Biljecki, F.; Ledoux, H.; Stoter, J. An improved LOD specification for 3D building models, Computers. Environ. Urban Syst. 2016, 59, 25–37. [Google Scholar] [CrossRef] [Green Version]
- Tang, L.; Ying, S.; Li, L.; Biljecki, F.; Zhu, H.; Zhu, Y.; Yang, F.; Su, F. An application-driven LOD modeling paradigm for 3D building models. ISPRS J. Photogramm. Remote Sens. 2020, 161, 194–207. [Google Scholar] [CrossRef]
- Ying, S.; Chen, N.; Li, W.; Li, C.; Guo, R. Distortion visualization techniques for 3D coherent sets: A case study of 3D building property units, Computers. Environ. Urban Syst. 2019, 78, 101382. [Google Scholar] [CrossRef]
- Amato, M. 1.1 Million 3D Buildings in New York City with 3D Tiles. Available online: https://cesium.com/blog/2017/05/05/nyc-3dtiles/ (accessed on 7 February 2020).
- Biljecki, F.; Stoter, J.; Ledoux, H.; Zlatanova, S.; Çöltekin, A. Applications of 3D City Models: State of the Art Review. ISPRS Int. J. Geo-Inf. 2015, 4, 2842–2889. [Google Scholar] [CrossRef] [Green Version]
- Agugiaro, G.; Benner, J.; Cipriano, P.; Nouvel, R. The Energy Application Domain Extension for CityGML: Enhancing interoperability for urban energy simulations. Open Geospat. Data Softw. Stand. 2018, 3, 2. [Google Scholar] [CrossRef]
- Georgios, L.; Georgios, G.I.; Katsigarakis, K.; Costa, G.; Sicilia, A.; Garcia-Fuentes, M.A.; Rovas, D.V. Simulation model generation combining IFC and CityGML data. In Proceedings of the European Conference on Product and Process Modelling (ECPPM), Limassol, Cyprus, 9–11 September 2016. [Google Scholar]
- Döllner, J.; Baumann, K.; Buchholz, H. Virtual 3D City Models as Foundation of Complex Urban Information Spaces; CORP 2006 & Geomultimedia: Vienna, Austria, 2006. [Google Scholar]
Figure 1.
Real-time visualization framework for energy simulation.

Figure 2.
Creation of 3D Tiles for multi- Level of Detail (LoD) 3D city model.
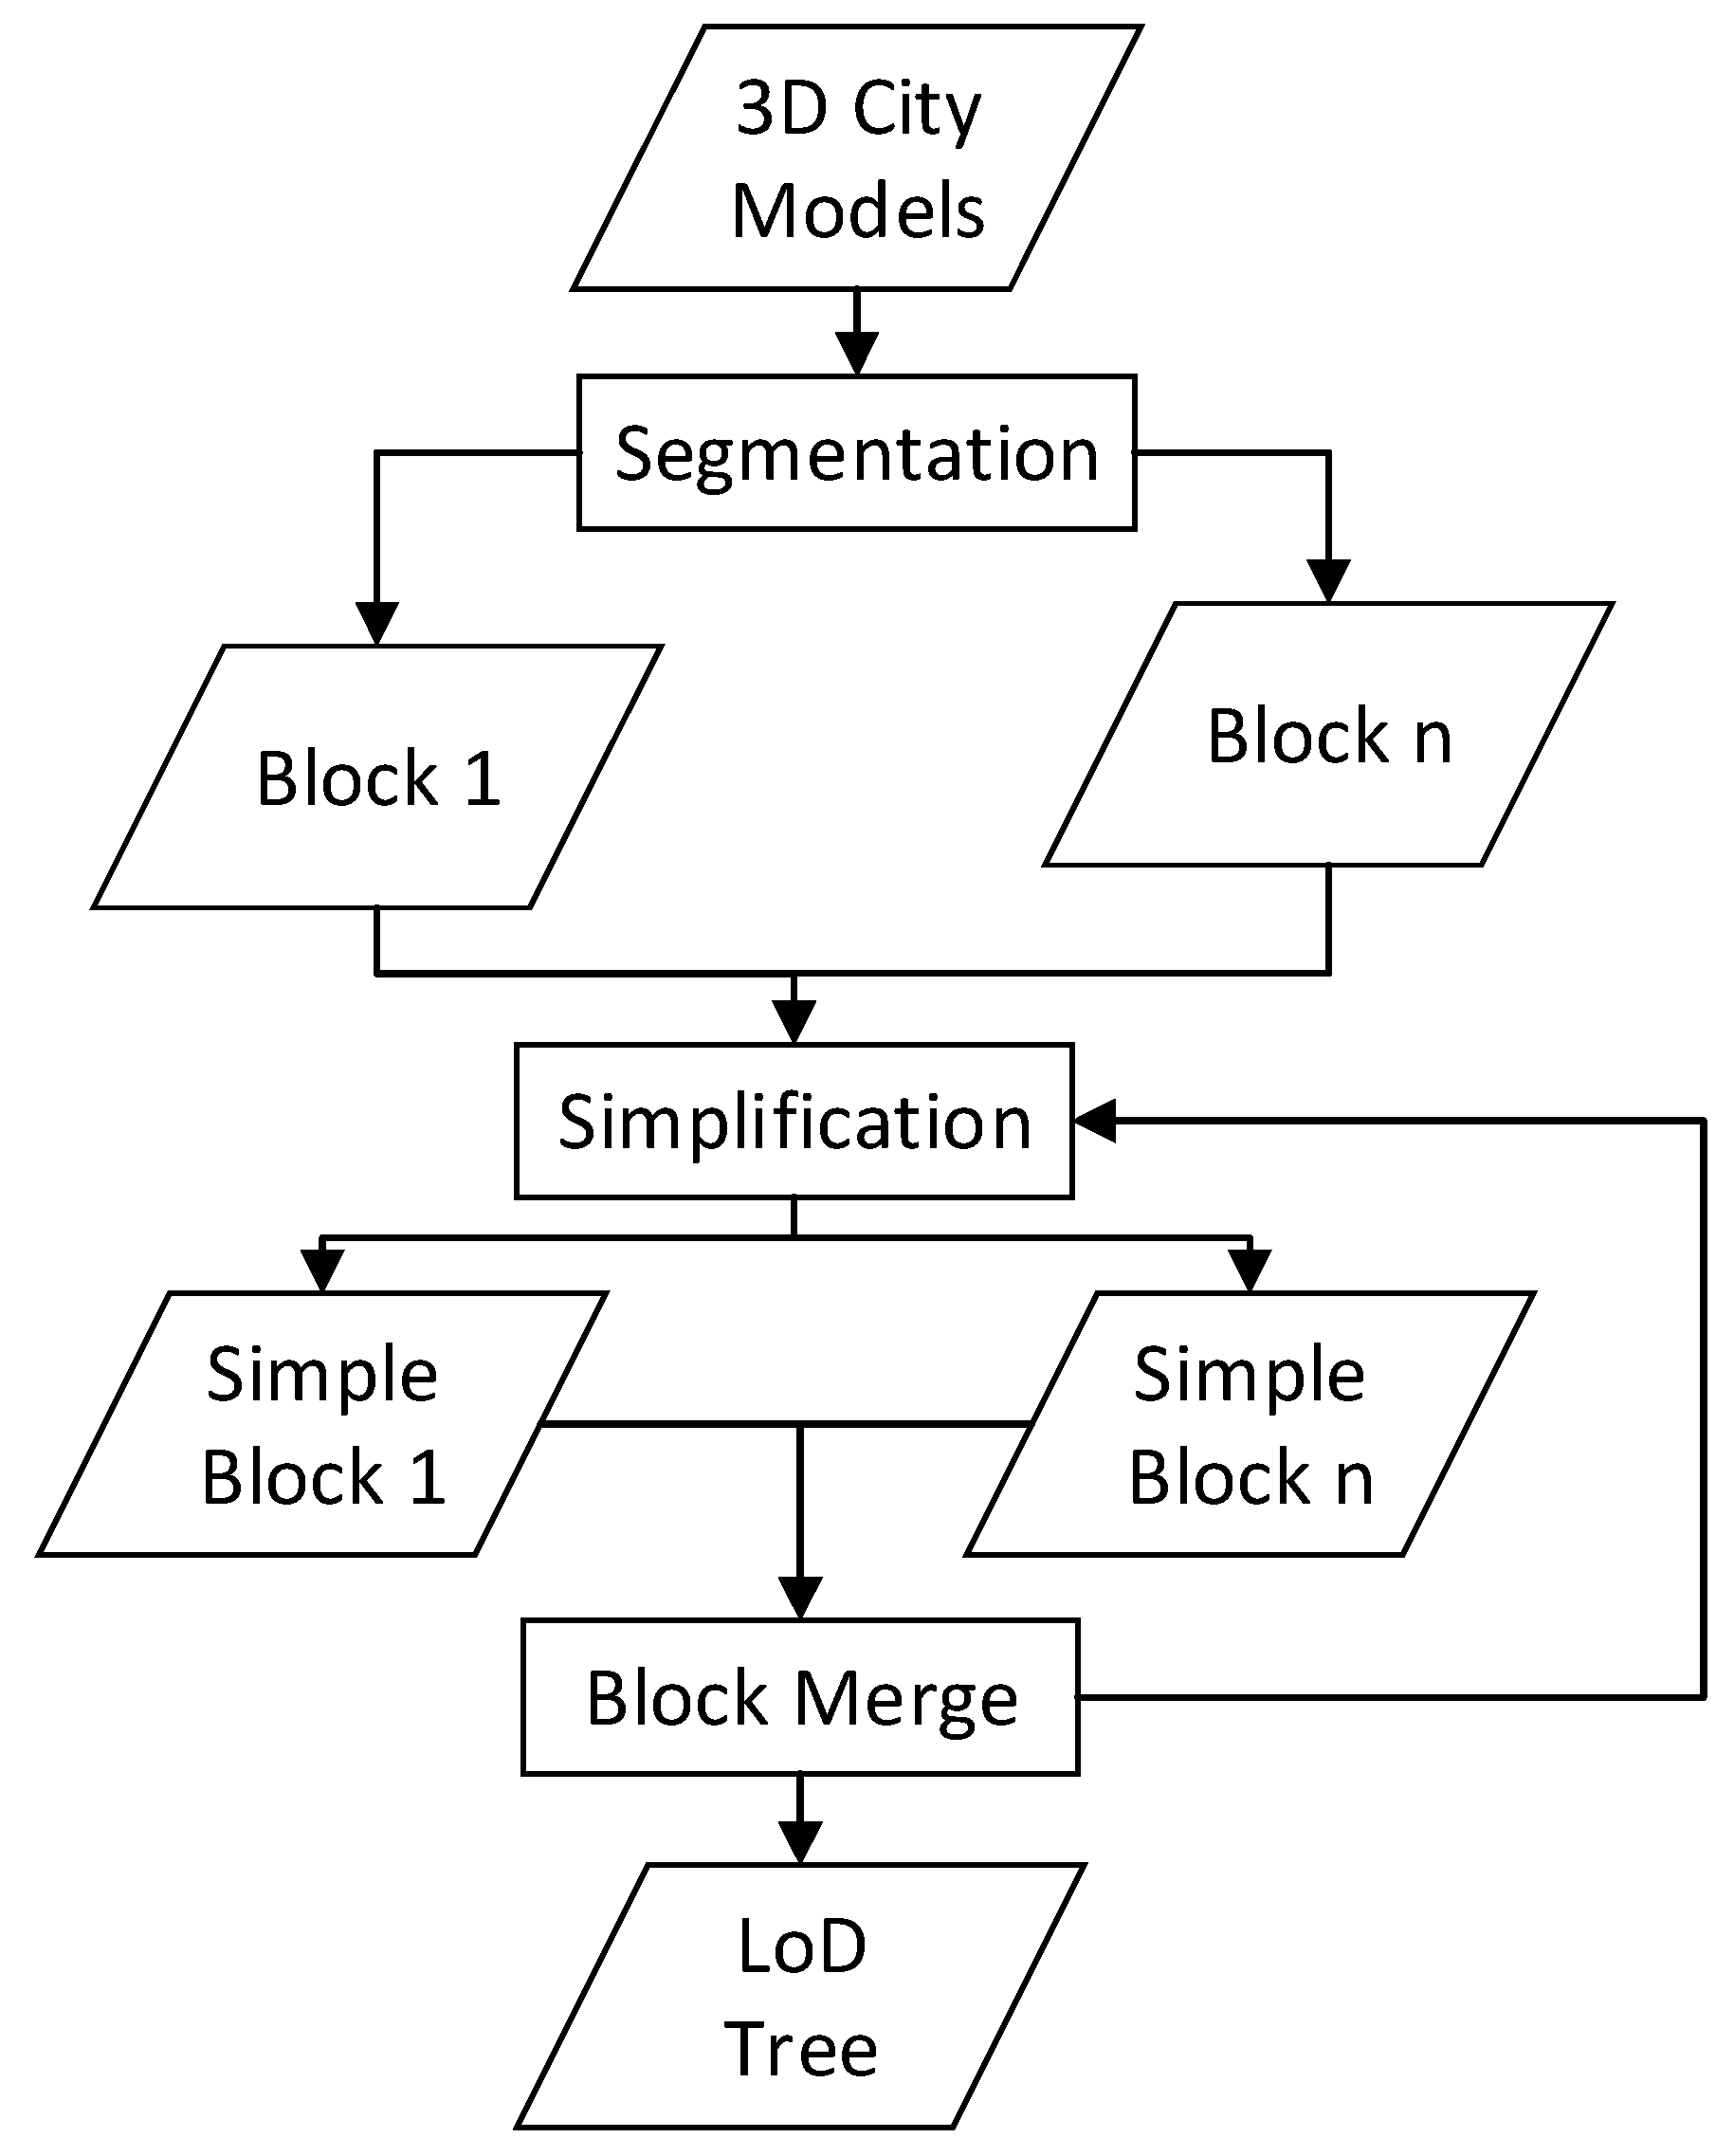
Figure 3.
Example of the batch table and styling definition.

Figure 4.
Color generation in dynamic styling.

Figure 5.
Styling based on the ID map.

Figure 6.
Framework of real-time energy simulation results visualization.
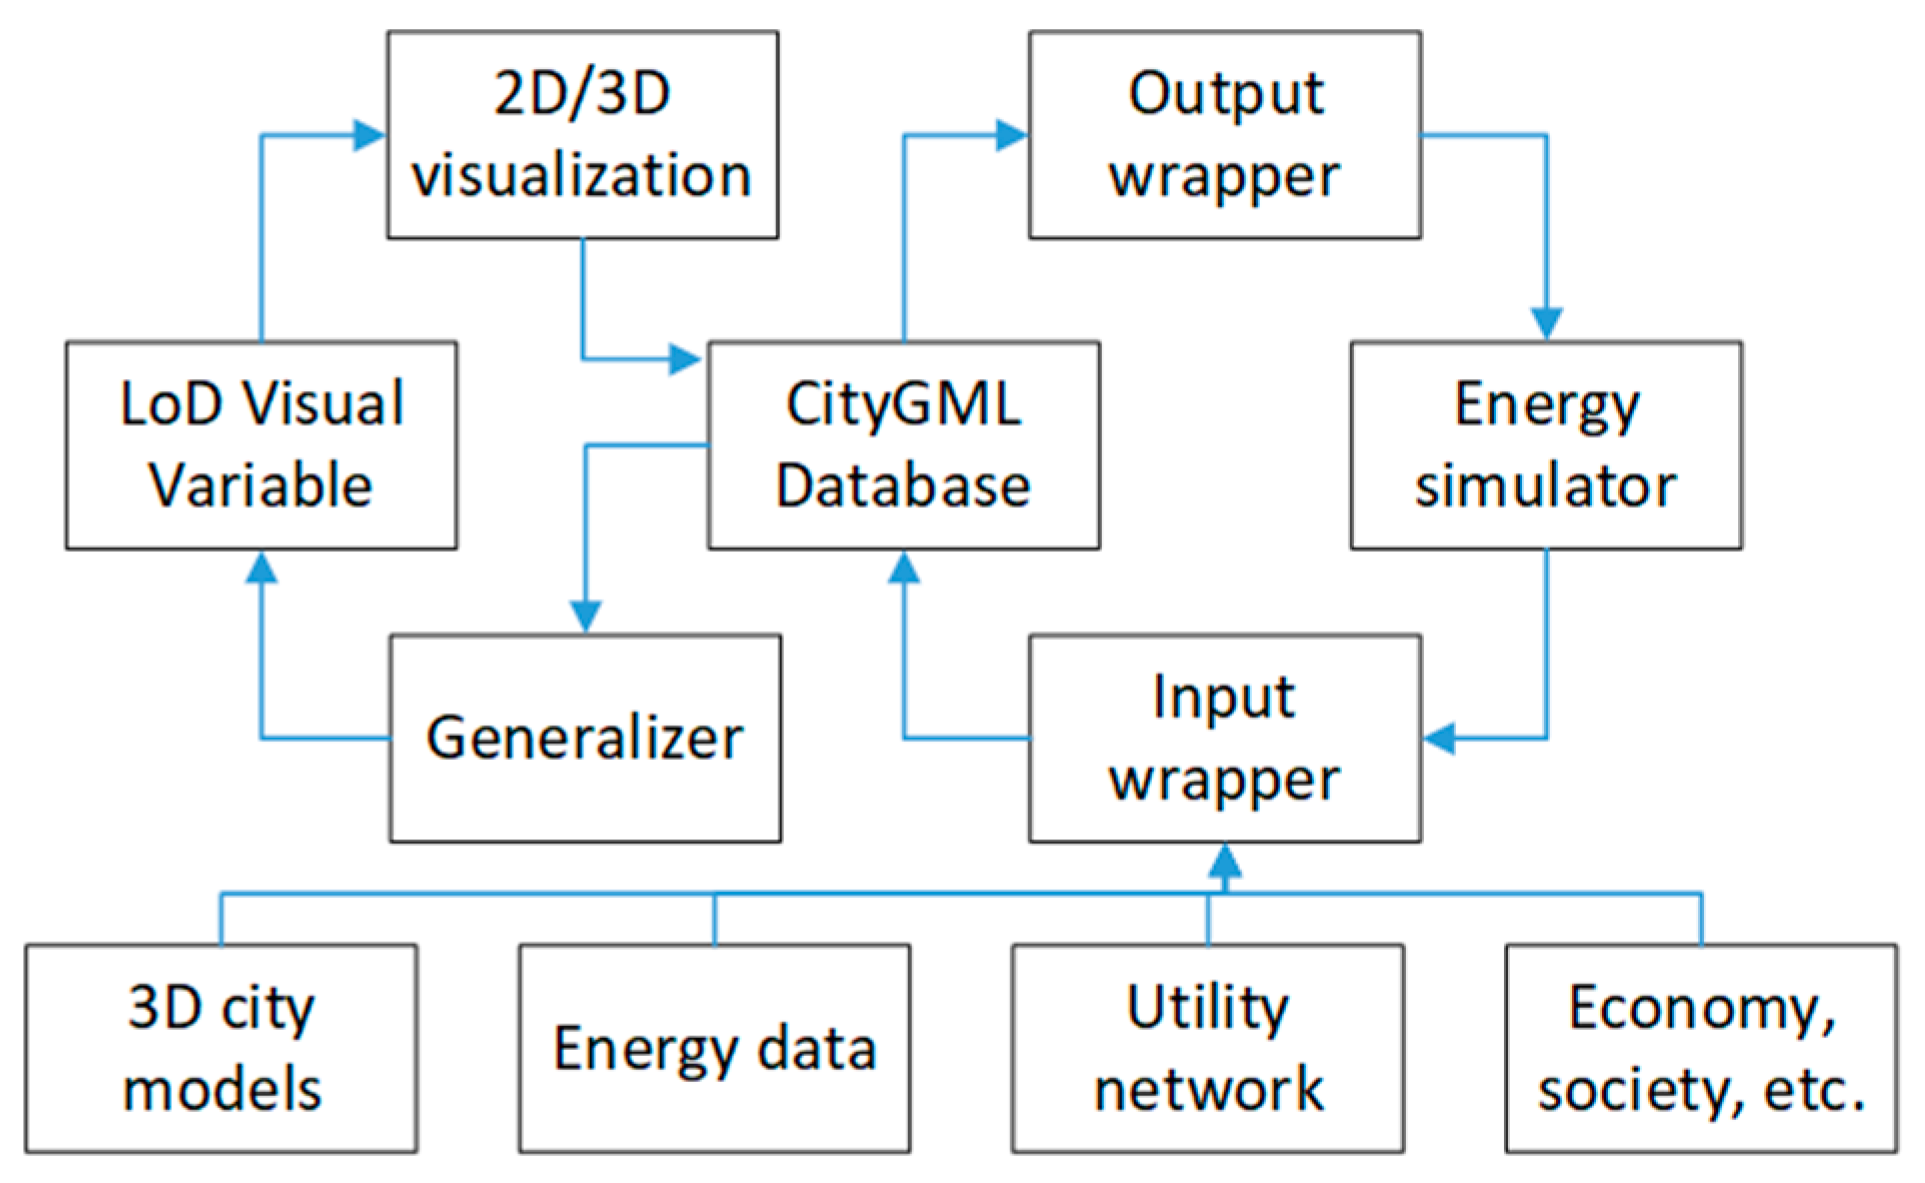
Figure 7.
Geometry data (power grid line) with attributes in geojson.

Figure 8.
Integrated visualization of different LoDs.

Figure 9.
Integrated visualization of different LoDs.
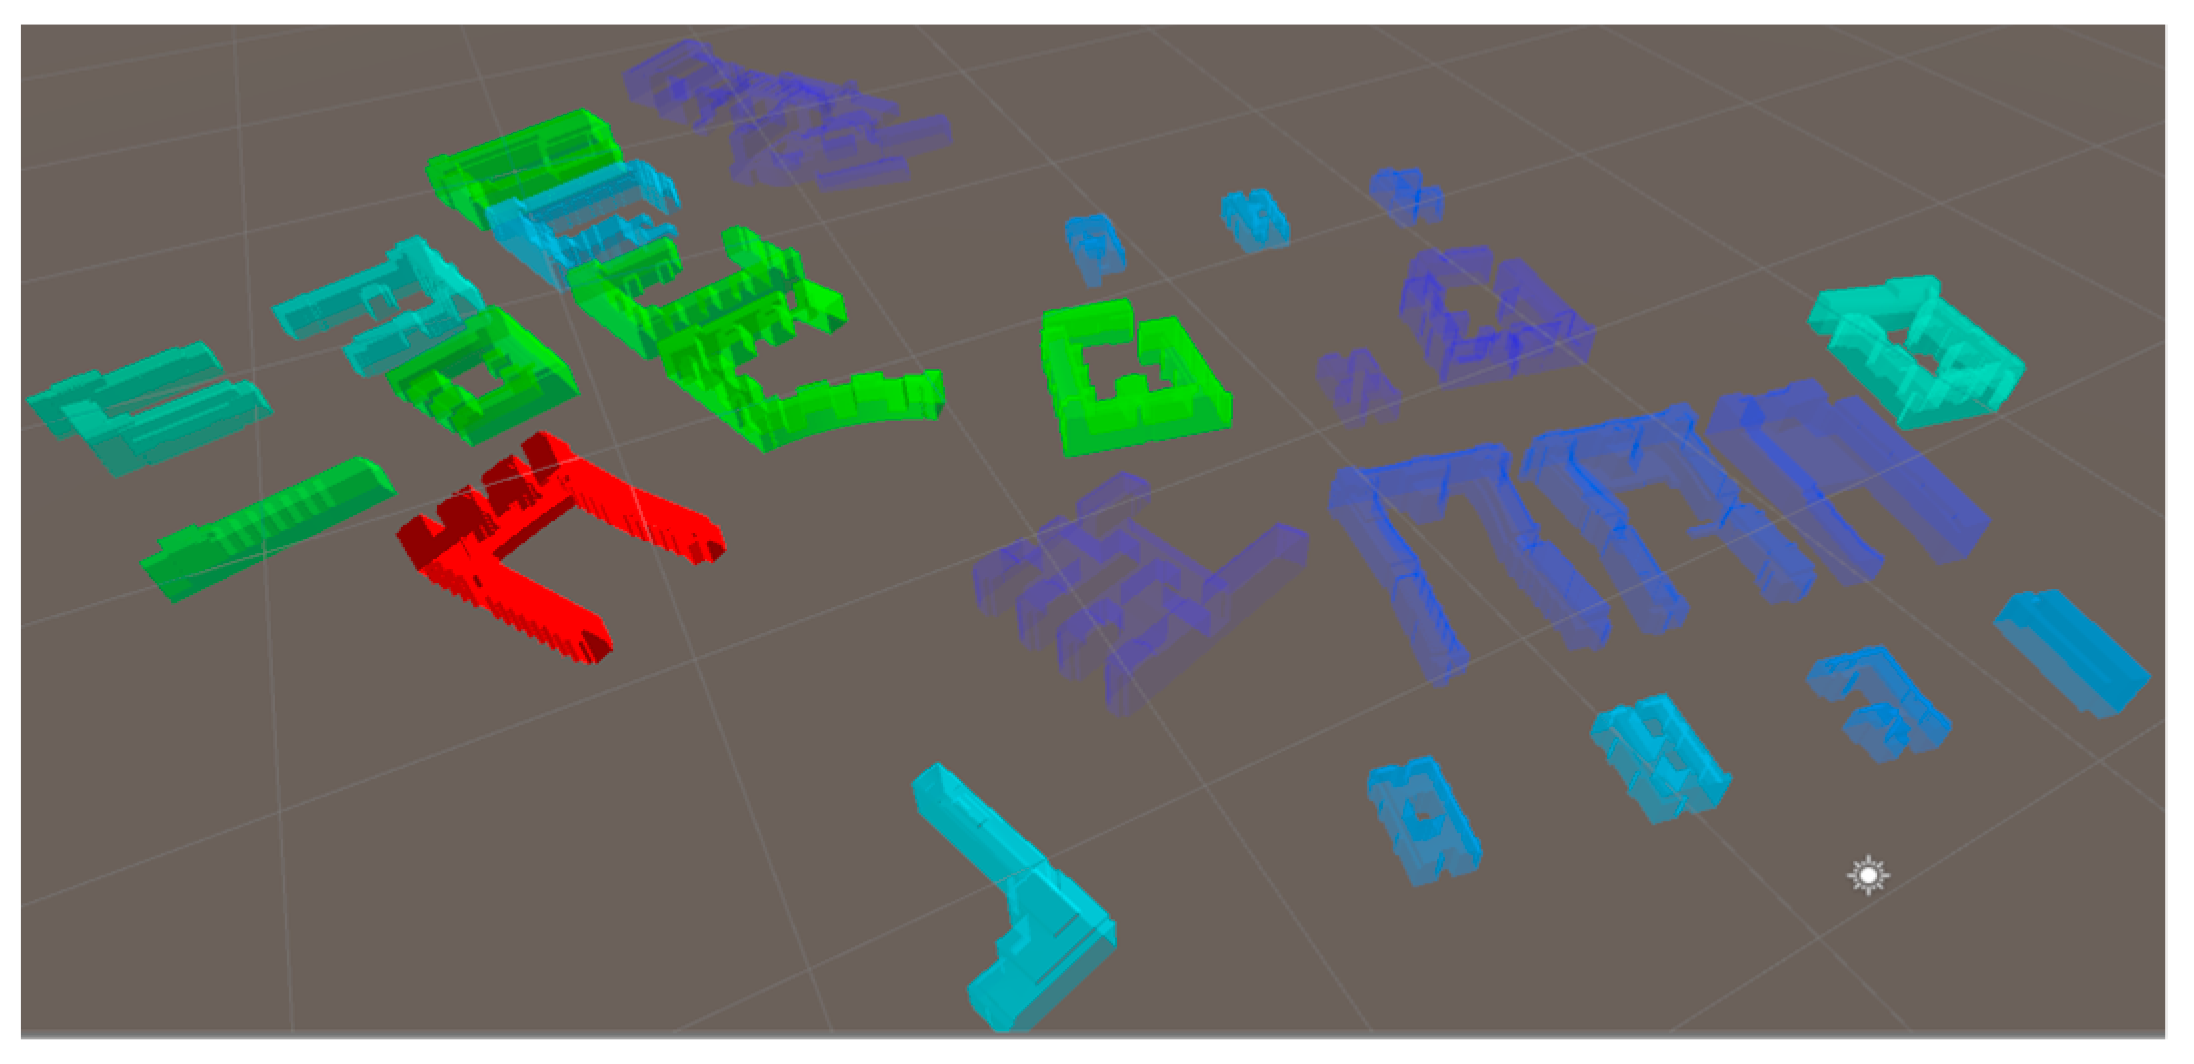
Figure 10.
Visualization changed according to the scenario.

Figure 11.
Dynamic style change of 3D city models.

Figure 12.
Real-time communication with server (received data in red box).


Table 1.
Relationship between the block size and loading time.
| Block Size | Number of Blocks | Loading Time (s) |
|---|---|---|
| 100 K | 100 | 6.8 |
| 1 M | 10 | 2 |
| 2 M | 5 | 1.7 |
| 5 M | 2 | 1.5 |
Table 2.
Rendering time and FPS (Frame per Second).
| Rendering Time (s) | Frame per Second | |
|---|---|---|
| Without 3DTiles | 13 | 5 |
| With 3D Tiles | 3 | 22 |
© 2020 by the authors. Licensee MDPI, Basel, Switzerland. This article is an open access article distributed under the terms and conditions of the Creative Commons Attribution (CC BY) license (http://creativecommons.org/licenses/by/4.0/).
Share and Cite
MDPI and ACS Style
Mao, B.; Ban, Y.; Laumert, B. Dynamic Online 3D Visualization Framework for Real-Time Energy Simulation Based on 3D Tiles. ISPRS Int. J. Geo-Inf. 2020, 9, 166. https://0-doi-org.brum.beds.ac.uk/10.3390/ijgi9030166
AMA Style
Mao B, Ban Y, Laumert B. Dynamic Online 3D Visualization Framework for Real-Time Energy Simulation Based on 3D Tiles. ISPRS International Journal of Geo-Information. 2020; 9(3):166. https://0-doi-org.brum.beds.ac.uk/10.3390/ijgi9030166
Chicago/Turabian StyleMao, Bo, Yifang Ban, and Björn Laumert. 2020. "Dynamic Online 3D Visualization Framework for Real-Time Energy Simulation Based on 3D Tiles" ISPRS International Journal of Geo-Information 9, no. 3: 166. https://0-doi-org.brum.beds.ac.uk/10.3390/ijgi9030166
Note that from the first issue of 2016, this journal uses article numbers instead of page numbers. See further details here.