A GIS-Based Multi-Criteria Decision Analysis Model for Determining Glacier Vulnerability


Department of Geomatics Engineering, Afyon Kocatepe University, 03200 Afyonkarahisar Merkez/Afyonkarahisar, Turkey
ISPRS Int. J. Geo-Inf. 2020, 9(3), 180; https://0-doi-org.brum.beds.ac.uk/10.3390/ijgi9030180
Submission received: 1 March 2020
/
Revised: 9 March 2020
/
Accepted: 20 March 2020
/
Published: 23 March 2020
(This article belongs to the Special Issue GIS-Based Analysis for Quality of Life and Environmental Monitoring)
Abstract
:Investigating the causes of the spatial heterogeneity of glacial changes offers vital information about glacial behavior and provides forecasting ability to define where glacier retreat may occur in the future. This study was designed to determine the spatial distribution of Ağrı Mountain glacier vulnerability. The main goal of the current study was to assess the forecasting capabilities of Geographical Information System (GIS)-based Multi-Criteria Decision Analysis (MCDA) for determining the location of the mountain glacier retreat. To estimate the glacier retreat, the following criteria were selected: elevation, aspect, slope, direction, and glacier surface temperature anomaly (GSTA). The entropy method was used for weighting the criteria for the evaluation of the vulnerable areas of the glacier. The results of this method clearly indicate a strong relationship between GSTA, direction, and elevation criteria and glacier retreat. The glacier vulnerability map was created by synthesizing criteria layers with their weights. The vulnerability map provided a consistency of 77.8% in the short term and 92.1% in the long term. In the study, the priority melting zones were determined and glacial retreat locations were forecasted in 10-year periods.
1. Introduction
Glacier changes are an important component of the climate system and play a key role in climate change [1]. Therefore, these changes are regarded as highly reliable indicators of global warming trends and used for early detection strategies in global climate observations. For more than a century, there has been a gradual decrease in the number of glaciers throughout the world [2]. Some glaciers have disappeared completely while many others are dramatically retreating and are predicted to disappear within a matter of decades [3].
Traditionally, glacier changes have been studied in many types of research using in situ measurements [4,5,6,7]. To date, a major part of the studies on this subject has been carried out using remote sensing techniques [8,9,10,11,12] and geographical information systems (GIS) [13,14,15,16]. With the recent developments in satellite and aerospace technologies, it is now possible for scientists to investigate challenging and extensive areas in a shorter time through remote sensing applications. Glacier changes can be analyzed using active or passive remote sensing systems. The use of passive system satellite sensors, which produce significant results in examining glacier changes, is also gradually increasing [1]. Recent advances in GIS methods have further facilitated the investigation of glacier changes, and GIS has become an increasingly important tool for such studies [17].
Major issues in remote sensing and/or GIS studies on glaciers are the temporal changes [18,19,20,21], hydrological and/or meteorological assessment [22,23,24], and the relationship between climate trend and glacier retreats [25,26]. Overall, these studies highlight the temporal changes in glaciers from past to present. However, to date, there is not enough discussion about forecasting glacier retreat. One of the biggest challenges in forecasting glacier retreat lies in the identification of possible melting regions by determining the spatial distribution of glacier vulnerability. The majority of these studies aimed to model the relationship between glacial and hydrological change. By this way was forecasted outburst flood potential [27,28], glacier lake changes [29,30], and water resource changes [31]. These studies were generally carried out on glaciers that cover extensive glacial areas and have important hydrological connections, so the main goal in these studies was the hydrological effects of glacier regressions. A neglected area in such studies is to forecast and understand the effects arising from the glacier topography and geometry. Although they are exposed to the same climatic characteristics and have no significant hydrological connection, small glaciers and ice caps in mountainous areas show heterogeneity in glacier retreats. Some of the most important reasons for this heterogeneity are local topographic and geometric effects. Results show that topographical glacier parameters exercise great controls on mutual variations and, thus, the response of the glacier to the similar climatic environment [14].
There are important studies in the literature examining these effects (elevation, slope, aspect, etc.) that cause heterogeneity on glacier retreat [14,20,32,33,34]. The previous study especially focused on the topographical analysis of glacier retreat and glaciation on Mount Agri [34]. However, these studies observed the effects one by one and/or interpreted the effects of some of them together with visual or statistical analysis. In order to model spatial heterogeneity of glaciers and forecast the future accurately, it is necessary to evaluate all these effects together with their weights. However, to the best of our knowledge, only a few studies are addressing these issues, as given below.
Strigaro et al. (2016) aimed to evaluate glacier behavior using a GIS-based simple spatialized model to obtain spatial simulations of glacial withdrawal and to evaluate future scenarios with a spatial representation. This model uses a georeferenced dataset that includes orthophotos, digital elevation models (DEMs) and boundary polygons. In the study, the Rutor glacier was chosen to assess the model. The future behavior of the Rutor glacier was simulated from 2005 to 2100 using climate scenarios [13]. Yang et al. (2015) developed a glacial numerical model using remote sensing and GIS-based spatial principle component analysis on China’s mountain glaciers. Nine factors were defined in the model as: slope, aspect, hillshade, elevation, air temperature, precipitation, glacial area change percentage, glacial type, and glacial area, describing topography, climate, and glacier characteristics. The vulnerability of glaciers to climate change was evaluated on a regional scale in the period 1961–2007 and the 2030s and 2050s [16].
An assessment of the vulnerability of glaciers to climate change provides the basis for scientific adaptation to glacial differences [16]. For this assessment, a set of factors must first be determined and then evaluated according to their importance [35]; however, it is very difficult to overcome the complexities of the phenomenon. GIS-based multi-criteria decision analysis (MCDA) plays an important role in addressing the challenges encountered in vulnerability analyses [36,37,38,39]. This study aimed to explore the use and forecasting capabilities of the GIS-based MCDA model, which is used the first time for determining vulnerable glacier zones. This case study sought to examine the changing nature of the glacier. Furthermore, the impact grades of the topographical factors on glacier retreats were analyzed. In this study, the GIS-based MCDA method was applied in the vulnerability analysis for the forecasting of glacier retreat zones in Ağrı Mountain.
2. Study Area
The study area is Ağrı Mountain, the largest glacier in Turkey classified as an ice cap. The mountain has two summits: Ataturk (5137 m) and Inonu (3898 m). For the study, the focus was on the Ataturk Summit, on which the ice cap is located, as shown in Figure 1. There is no other glacier in the immediate vicinity of Ağrı glacier. The glacier is located at the highest altitude in relation to its immediate surroundings; therefore, the effects on the glacier can be observed more precisely.
Ağrı glacier lies between 39°40’ and 39°45’ north latitude and 44°15’ and 44°20’ east longitude in Iğdır province. There has been a dramatic glacier retreat in recent years. In previous studies on glaciers in the literature, Blumental (1958) and Ciner (2004) reported that in the Pleistocene, the ice area was approximately 10 km2, and the glacier area was probably 100 km2 [40,41]. Kurter and Sungur (1980) limited the ice cap to an area of 10 km2 [42]. Sarıkaya (2012) calculated the area changes on the glacier from 1976 to 2011 using satellite images and found that 29% of the glacial surface of Ağrı melted and the average summer temperature increased continuously [43]. Yavasli et al. (2015) examined all glaciers in Turkey from the 1970s to 2013 based on satellite images. The authors reported that the main reason for the loss of the glacier area in Turkey was the increasing surface temperature [44]. Yalcin et al. (2017) evaluated the spatial–temporal changes of glaciers using the normalized difference snow index (NDSI) and a two-band ratio technique. As a result, it was reported that approximately 39% of the glaciers melted from 1987 to 2015 in the last three decades [45]. Yalcin (2019) investigated the effects of topographic features, namely aspect, slope, elevation, and direction on glaciation and glacier retreat for Ağrı Mountain. A significant spatial correlation was observed between the topographic parameters and glacier distribution. The study was focused only on the topographical analysis of glacier retreat and glaciation. Yalcin (2019) highly suggested that a model should be created to forecast future glacier retreat zones [34]. The proposed model was achieved using GIS-based MCDA in this study and the weights of the criteria that affect the glacier retreat according to the relative importance were calculated by the Entropy Method. In addition, future glacier retreat zones in Ağrı Mountain are forecasted in this paper.
3. Materials and Methods
It is necessary to know the effect of topographic structure and some meteorological factors on glacier distribution to determine the spatial patterns of glacier vulnerability. Especially in small regions (mountain ice caps) exposed to almost similar meteorological effects, the topographic structure has greater effects, which need to be evaluated together with their weights to perform a vulnerability analysis, an issue that can be considered as a spatial decision problem.
Spatial decision problems typically involve multiple, conflicting and incommensurate evaluation criteria. Individuals, decision-makers, managers, stakeholders or interest groups are typically characterized by unique preferences concerning the relative importance of criteria on the basis of which the alternatives are evaluated. The presence of these spatial decision problems led to the development of GIS-based MCDA [46]. In this study, the vulnerability of Ağrı glacier was determined using this technique. The procedure used in the study is presented in the flow diagram given in Figure 2.
Firstly, the criteria were selected according to the problem. Criteria layers and their classes were created using the data gathered from remote sensing sources on various dates. The weighting process was performed to investigate the relative importance of each criterion and each class of the criteria. The Entropy Method was used to predict the weight of each criterion. In the study, two different vulnerability maps were produced. In the first vulnerability map, which is based on 1987, glacier borders were used for validation of the model consistency. Highly vulnerable areas were considered for validation. This map was classified according to the melting area of all periods. The second vulnerability map, which is based on the 2015 glacier border, was used for forecasting future melting zones. The future priority melting regions over the last used glacier boundaries (2015) were determined according to the melting rate between 1987 and 2015. Considering that the previous melting rate continues, it was calculated that the permanent glacier will melt by 2065, so the future scenario was designed between 2015 and 2065.
Data management and analysis were performed using ArcGIS software. In this study, the remote sensing data were used to delineate the glacier boundary, create GSTA and produce a digital elevation model (DEM).
The glacier boundaries were previously delineated by the NDSI technique using LANDSAT images for five different dates: 2 August 1987, 31 August 1989, 16 August 1998, 25 August 2013, and 15 August 2015 (Yalcin 2019). In addition, four melting periods (1987–1989, 1987–1998, 1987–2013, and 1987–2015) were generated. Furthermore, the thermal infrared (TIR) bands of these data were used for producing GSTA.
The DEM generated from Shuttle Radar Topography Mission (SRTM) data was used to create elevation, slope and aspect criteria layers. The resolution of the sampled data was 30 m with <=16 m absolute vertical height accuracy, <=10 m relative vertical height accuracy and <=20 m absolute horizontal circular accuracy [47].
3.1. Decision Criteria
Decision problems depend on a set of criteria that include attributes and objectives, and should possess some properties to adequately represent multi-criteria [48]. The set of evaluation criteria can be defined by the relevant literature, analytical study, and expert opinions [49,50,51,52]. Each criterion must be comprehensive and measurable [48].
Topographic effects are the reason for heterogeneity in glacial withdrawals in mountainous regions. The results show that topographic glacier parameters exert great control over mutual variations and therefore the response of the glacier to a similar climatic environment [14]. The study area, Ağrı Glacier, is relatively small, so all the areas are exposed to the same meteorological conditions (perception, air temperature, humidity, etc.) and have no significant hydrological connection. Therefore, while determining the criteria, topographic effects were emphasized and extensive literature research was conducted.
In a previous study, it was observed that the topographic factors, such as slope, direction, aspect, and elevation, affected glacial retreat in the study area. The effects of each topographic factor on glacier regression were examined one by one [34]. Although aspect and direction criteria sound similar, there is an important nuance between them. Direction criteria indicate the direction parts of the mountain or hill, while aspect criteria refer to a surface or slope direction of a piece of land, regardless of the mountain or hill directions. For example, a piece of land is located on the south face of the mountain (direction), but the same piece of land faces the east direction (aspect). In addition, glacial melting is largely dependent on the glacial surface temperature (GST), which reflects the heat distribution and determines the amount of retreat on the glacial surface. For this reason, the correct uptake of GST in mountain glaciers is of great importance in the future development of energy–mass balance and glacial hydrology models that reflect the development of these sensitive systems. In the small regions, the heterogeneity of GSTA mostly results from the topography [53]. Therefore the GSTA criterion includes the topographical criteria and the criterion strengthens the topographical effects on the model. In light of this information, the following criteria were selected for the current study: elevation, aspect, slope, direction, and GSTA.
3.2. Evaluation Criteria
In GIS-based MCDA, each criterion should be created as a map layer in the GIS database. The layers representing the evaluation criteria associated with objectives indicate the generic nature of the criterion concept and emphasize the attribute–objective relationship(s) [52,54,55].
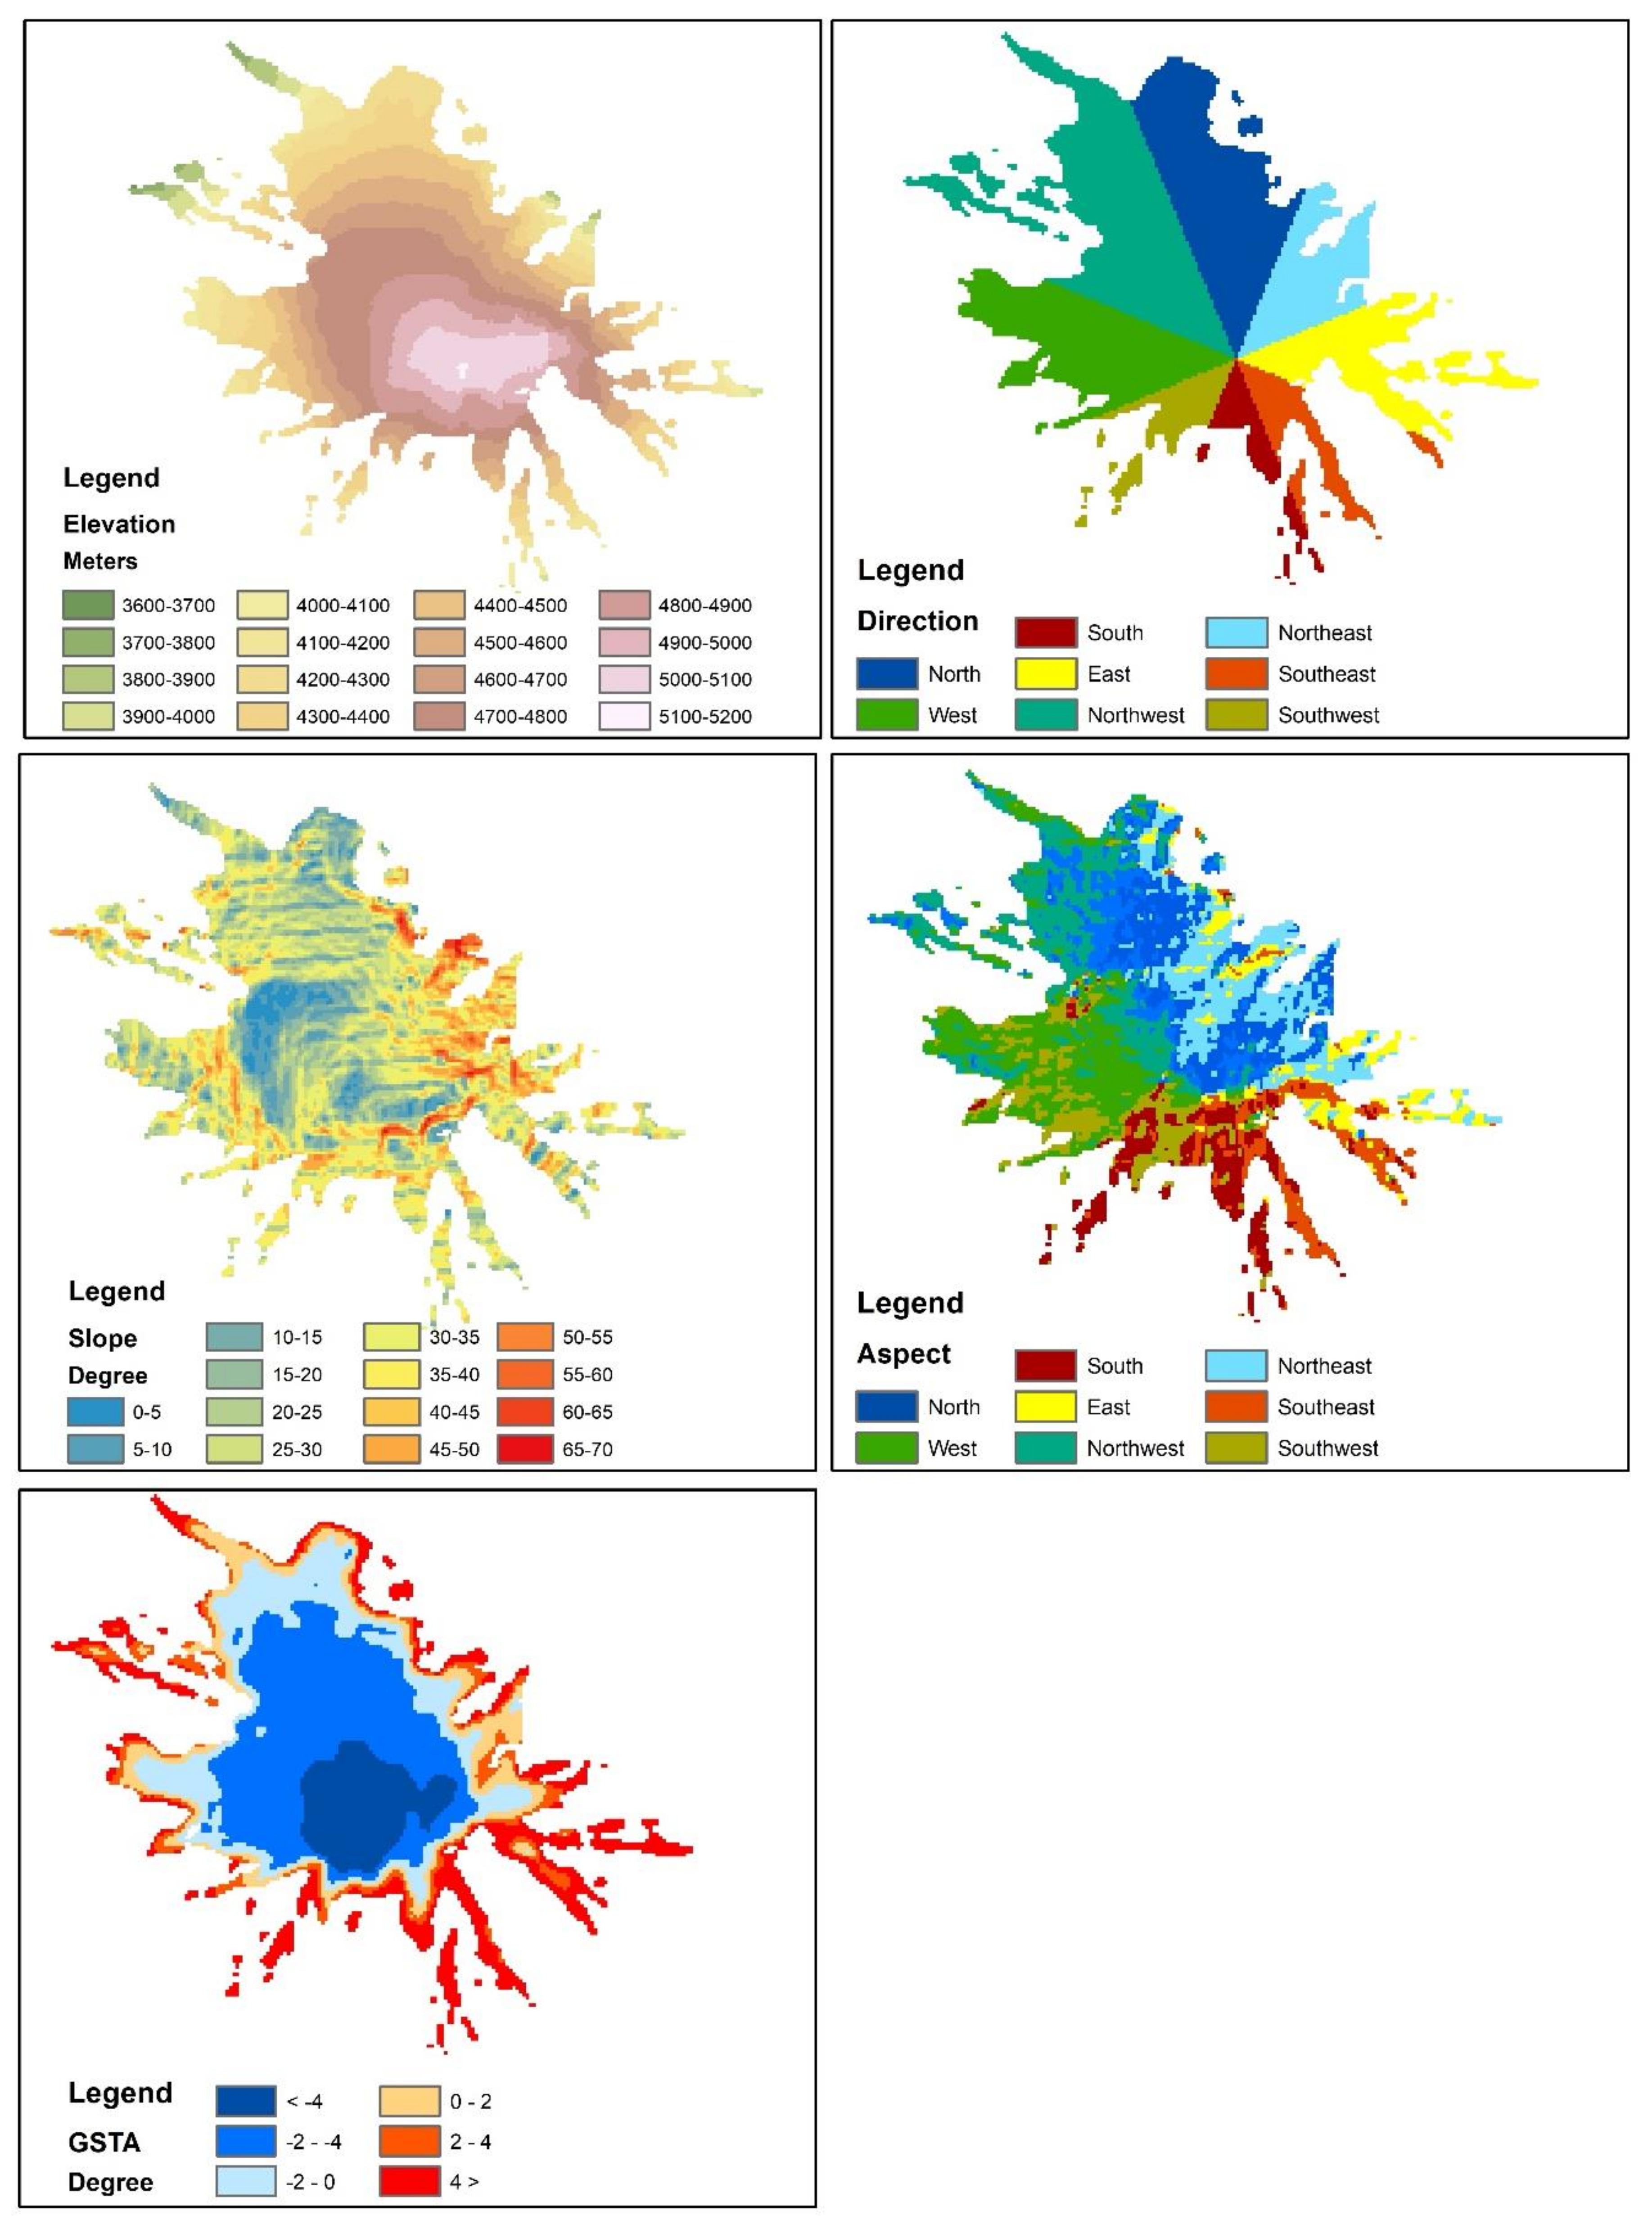
The aspect, slope and elevation criteria layers were derived from the DEM data. Firstly, the DEM data were classified into 100-meter intervals from 3686 to 5137 meters to create the elevation criteria layer. Then, the slope and aspect criteria were extracted. The aspect criteria were divided into north, south, east, west, northeast, northwest, southwest, and southwest. The slope criteria layer was classified into 14 classes at 5-degree intervals from 0 to 70 degrees. The study area was divided into eight regions as north, south, east, west, northeast, northwest, southeast, and southwest by accepting the summit of the mountain as the center. Finally, the GSTA layer was derived from the TIR bands of the LANDSAT satellite images. All the criteria layers were masked by the 1987 glacier boundary shown in Figure 3.
3.3. Weighting
The weighting methods frequently used in MCDA include trade-off analysis, ranking, rating, and pairwise comparison [35]. However, these methods are subjective since they are based on expert opinions or polls. Alternatively, the Entropy Method and the Frequency Ratio (FR) model are used to deterministically determine the weights according to the conditions of the study area on a regional scale.
FR is the ratio of the probability of an occurrence to the probability of non-occurrence for given characteristics [56,57]. For glacial melting, FR refers to the ratio of the area where the glacial retreat occurs to the total study area and the ratio of the probabilities of melting for given classes of factors.
The level of entropy represents an approximation of the normal distribution of probability. The entropy index shows the degree of irregularity in the environment. It also expresses which parameters are best suited for the development of mass movements in a natural environment [58]. The Entropy Method is often used for calculating the landslide susceptibility index [58,59,60,61]. In this study, the Entropy Method was adopted for determining the vulnerable areas of Ağrı glacier. Below are the equations used to calculate the coefficient Wj representing the weight value of the criteria as a whole.
where a and b are the domain and melting percentages and PİJ refers to FR and it also expresses as calculated probability, (PİJ) is the probability density, is the number of classes, and are entropy values, is the information coefficient, and is the weight of factors. The range of varies between 0 and 1.
3.4. Synthesizing
The pixel values of each criterion layer were multiplied by their weights and the sum of these values was calculated to produce the synthesis layer. The final glacier vulnerability map was produced using the following equation:
where is the sum of all the classes; i is the number of the particular factor map; z is the number of classes within the parametric map with the greatest number of classes; is the number of classes within a particular factor map; C is the value of the class; and is the weight of the criteria [58].
4. Results
4.1. Glacier Vulnerability Map
Firstly, the criterion layers were masked by the 1987 glacier boundary. Then, the melting areas between 1987 and 2015 were identified on these layers. The FR and Entropy Method were used to create Table 1 to present the data from all the criteria layers.
When Table 1 is examined, the classes column includes class value or definition within each criterion. The glacial area column includes the total glacier area in each class of each criterion according to the 1987 glacier borders. The glacial area ratio column includes the ratio of the glacier area in each class of each criterion to the total glacier area according to the 1987 glacier borders. The melting area column includes the melting glacier area between 1987 and 2015 in each class of each criterion. The melting area ratio column shows the ratio of melting glacier area to total melting in each class between 1987 and 2015. The FR column includes the glacial area ratio to melting area ratio in each class of each criterion; (Pij), Pij (mean), Hj, Hj (max), Ij parameters are required for weight calculation, and Wj shows the weight of each criterion.
The vulnerability map was produced by using the FR and Wj columns in Table 1. FR showed the effect of different classes on glacier regression in each criterion; a and b values were needed to calculate FR. For example, for the 3600 and 3700 meters class in the elevation criterion, a value was calculated as the ratio of glacier areas between a value of 3600 and 3700 meters to the entire glacier area (0.0002), and b value was calculated as the ratio of the melting area of the glacier areas between 3600 and 3700 meters to the entire melting area (0.0006). The ratio of b to a values indicated FR (Equation (1)). The lowest elevation class (3600–3700) had the highest FR values and the FR value decreased as the elevation increased. It was concluded that the areas at low elevations are more vulnerable to melting. (Pij) a value was obtained from the ratio of the FR value of the 3600–3700 meter class to the sum of all classes’ FR values in the elevation criterion. The next calculations were calculated for the entire criterion. For the elevation criterion, all (Pij) values were averaged and Hj was calculated by replacing (Pij) in Equation (3) (3.6308). Then, Hj (max) value was calculated by replacing the Hj value in Equation (4) (4.0). The Ij value in Equation (5) was calculated using the calculated Hj (max) and Hj values (0.0923). Finally, the Wj value was calculated by multiplying Ij and mean (Pij) values in Equation (6) (0.0058).
Wj values indicated the importance of the criteria. In order to better interpret these values, the weight (Wj) of each scale was proportional to the sum of the weights (∑W) and the relative importance of the criteria was calculated according to glacial melting (Table 2).
According to Table 2, GSTA was the most important criterion affecting the melting areas. This criterion had a much larger weight (0.49) compared to the other criteria, and the second important criterion was the direction, with a weight value of 0.26. This was followed by elevation, aspect and slope criteria. What is noteworthy here is that the direction criterion was more important than the aspect criterion in glacial melting. Table 2 was introduced only to illustrate the relative importance of each criterion, but to obtain the vulnerability map, the Wj value of Table 1 was used.
All criterion layers were reclassified according to the FR values calculated for each class of each criterion (Table 1). Thus, each criterion was re-evaluated according to the vulnerable degree of its every class. After, they were then synthesized according to Equation (8), based on their weights (Wj) obtained by the entropy method. As a result, a glacier vulnerability map was created (Figure 4).
In Figure 4, the red areas demonstrate highly vulnerable glacial areas and the blue areas show those with low vulnerability. This map was created by synthesizing the five criteria used in the study together with their weights. It can be seen in Figure 3 that only the direction criterion is regularly distributed, other criteria are irregularly spread throughout the study area. Therefore, the effects of the direction criterion can be seen in Figure 4 with its weight of 0.26. This is due to the regular spatial distribution of the direction criterion. On the contrary, the effects of other criteria cannot be seen on this map.
4.2. Validation of the Glacier Vulnerability Map
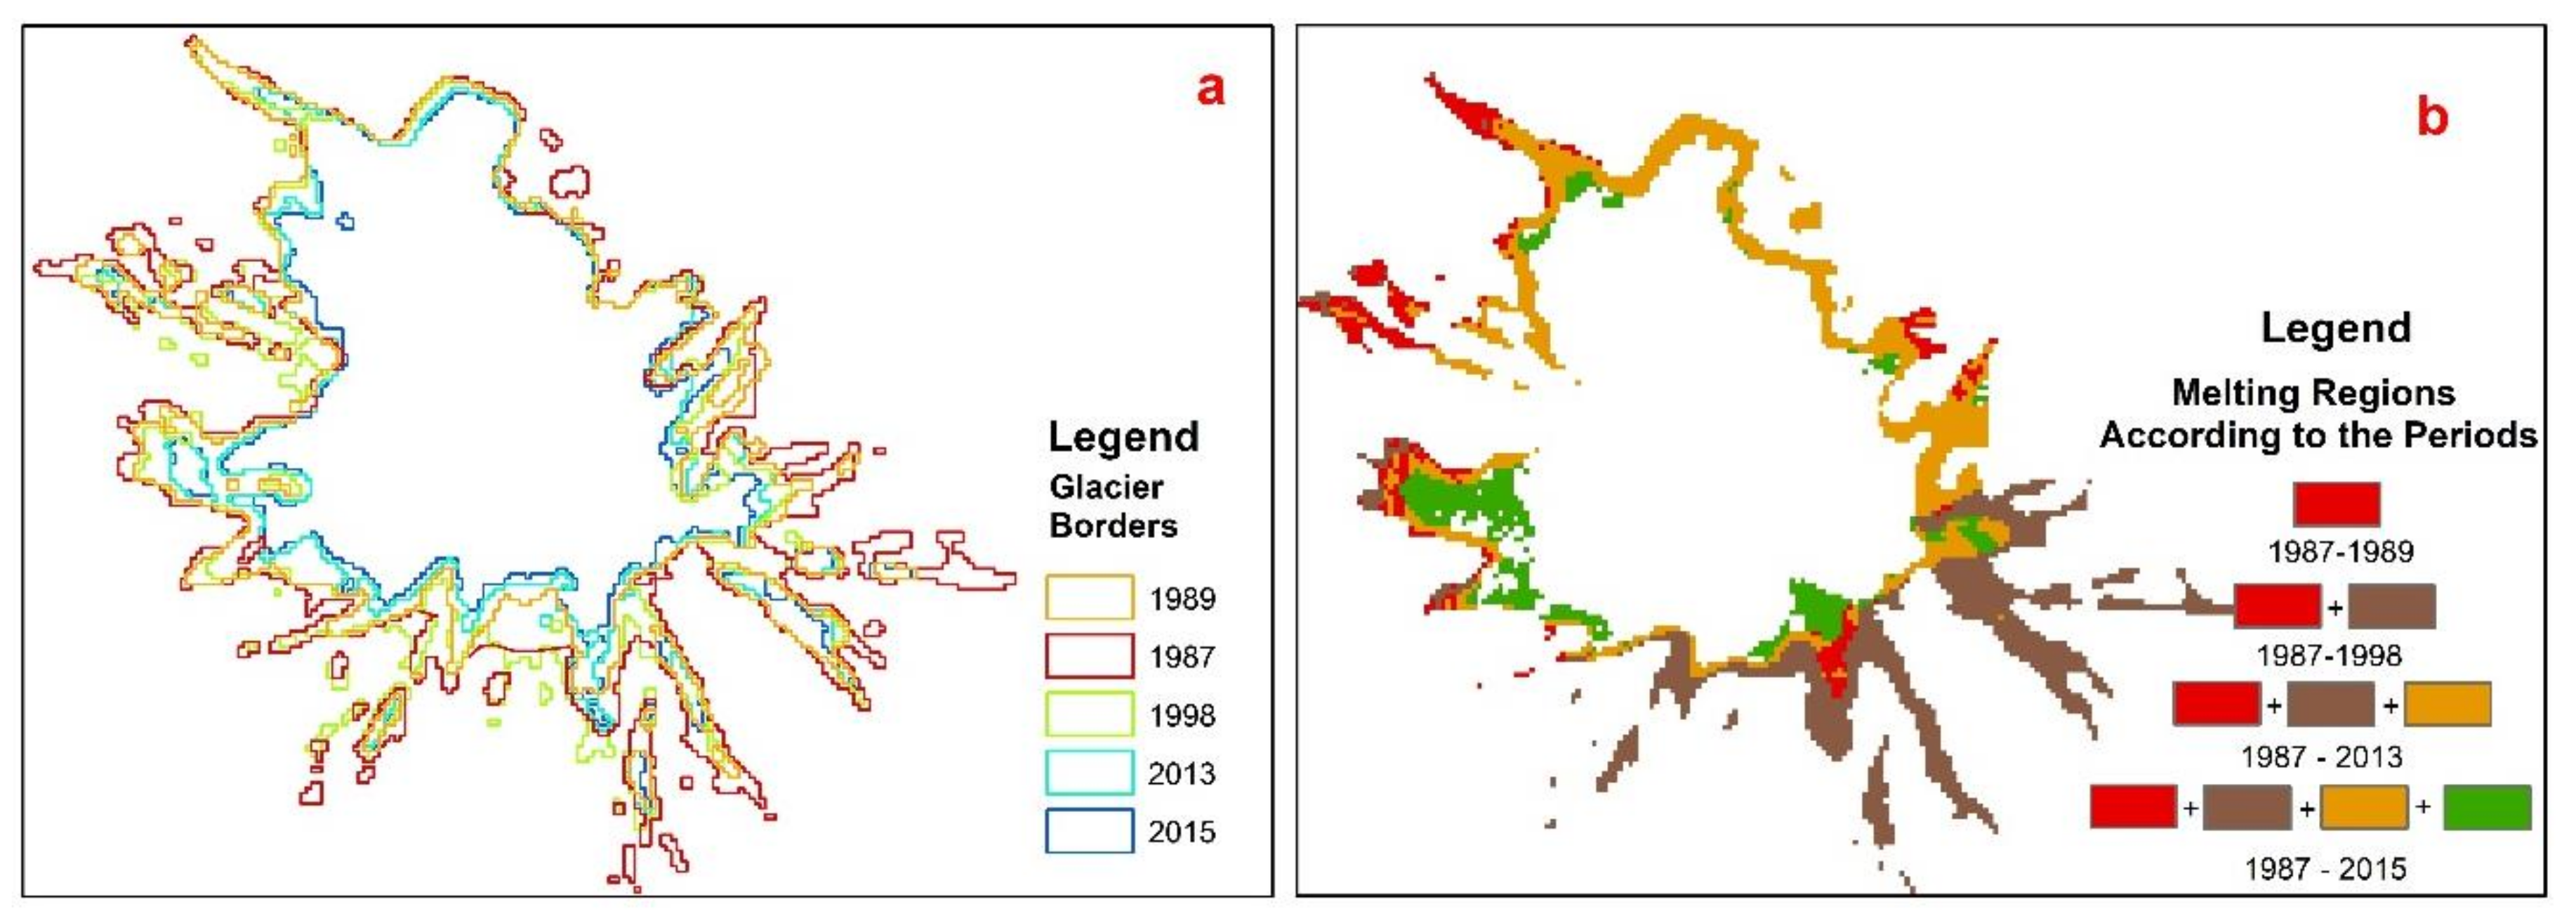
The validation processes were conducted on the delineated glacier boundaries to measure the consistency of the GIS-based MCDA model. In this process, firstly the differences between the glacier area in 1987 and the glacier areas in all other years, seen in Figure 5a, were delineated via intersection operators. Then, the glacier vulnerability map was classified based on the melting sizes in all periods (Figure 5b). For example, an area of 1571 m2 melted between 1987 and 1989, according to the delineated boundaries. Considering that the same melting area would be seen in the vulnerability map, the pixels with the highest vulnerability value covering an area of 1571 m2 were identified for the period 1987–1989, since this was the first melting period.
The delineated glacier borders shown in different colors for each year are presented in Figure 5a. The vulnerability map classified according to the size of the actual melting areas is shown in Figure 5b. Red areas demonstrate the estimated melting areas in the 1987–1989 period; the sum of the red and brown areas shows the estimated melting areas in the 1987–1998 period; the sum of the red, brown, and yellow areas shows the estimated melting areas in the 1987–2013 period; and the sum of all the colored areas shows the estimated melting in the 1987–2015 period.
The delineated melting areas and classified vulnerability map were compared by overlay analysis. Table 3 presents the results of this comparison by different periods.
When Table 3 is examined, it is seen that the overlapping areas increased as the period length increased, except for the 1987–1998 period. As is seen in the table, the melting area in 1987–1998 is less than the melting area in 1987–1989. An exceptional situation occurred in this year in that the glacial area increased in 1998 compared to the 1989 glacial area. Therefore, it is better to say that the estimation ability of the model increases as the melting area increases. In the longest period of 1987-2015, a 92.1% overlap was observed with the melting area of 3223 m2. In addition, even during the two-year melting period an overlap of 77.8% was detected.
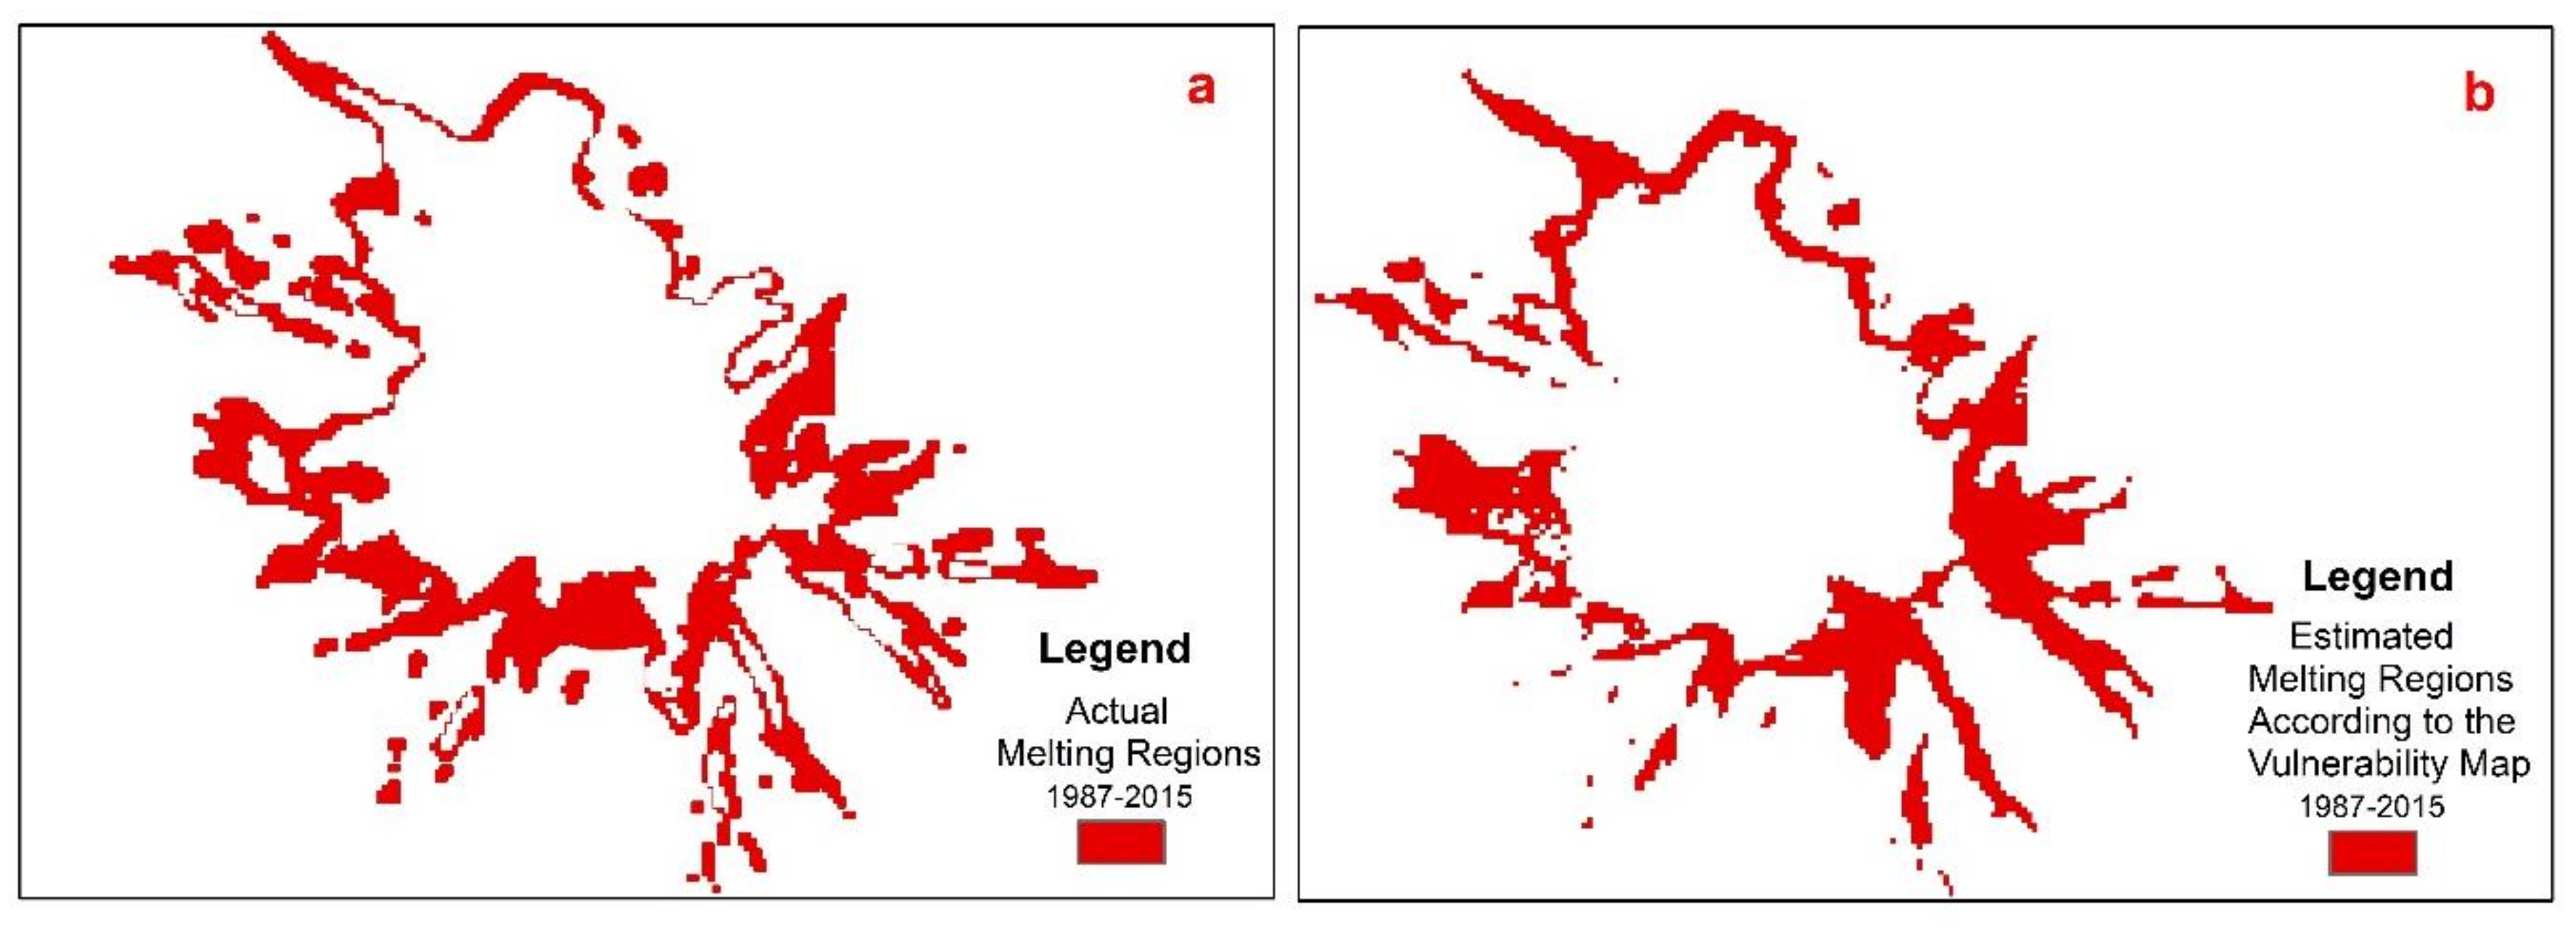
In order to make a comparison concerning the spatial distribution, the estimated and actual melting areas in the longest period (1987–2015) are given in Figure 6.
Figure 6a shows the actual melting regions in the 1987–2015 period and Figure 6b shows the melting area according to the vulnerability map produced by the GIS-based MCDA model. This figure demonstrates the consistency of the estimation capabilities of the model as a spatial pattern. Glacier withdrawals in both figure parts are shown in red color and both withdrawal areas have the same area size. Although the two forms of retreat areas are similar in general terms, there are some differences in glacier tongues. While almost all glacier tongues melted in the predicted areas, some glacial pieces have not melted on glacier tongues in actual melting areas, so there are gaps in the glacier tongues, as seen in Figure 6a. These glacial pieces are generally located in the valley on Ağrı Mountain. As a result, it was observed that the GIS-based MCDA model had an error in the estimation of glacier parts remaining in the valleys.
4.3. Future Scenarios
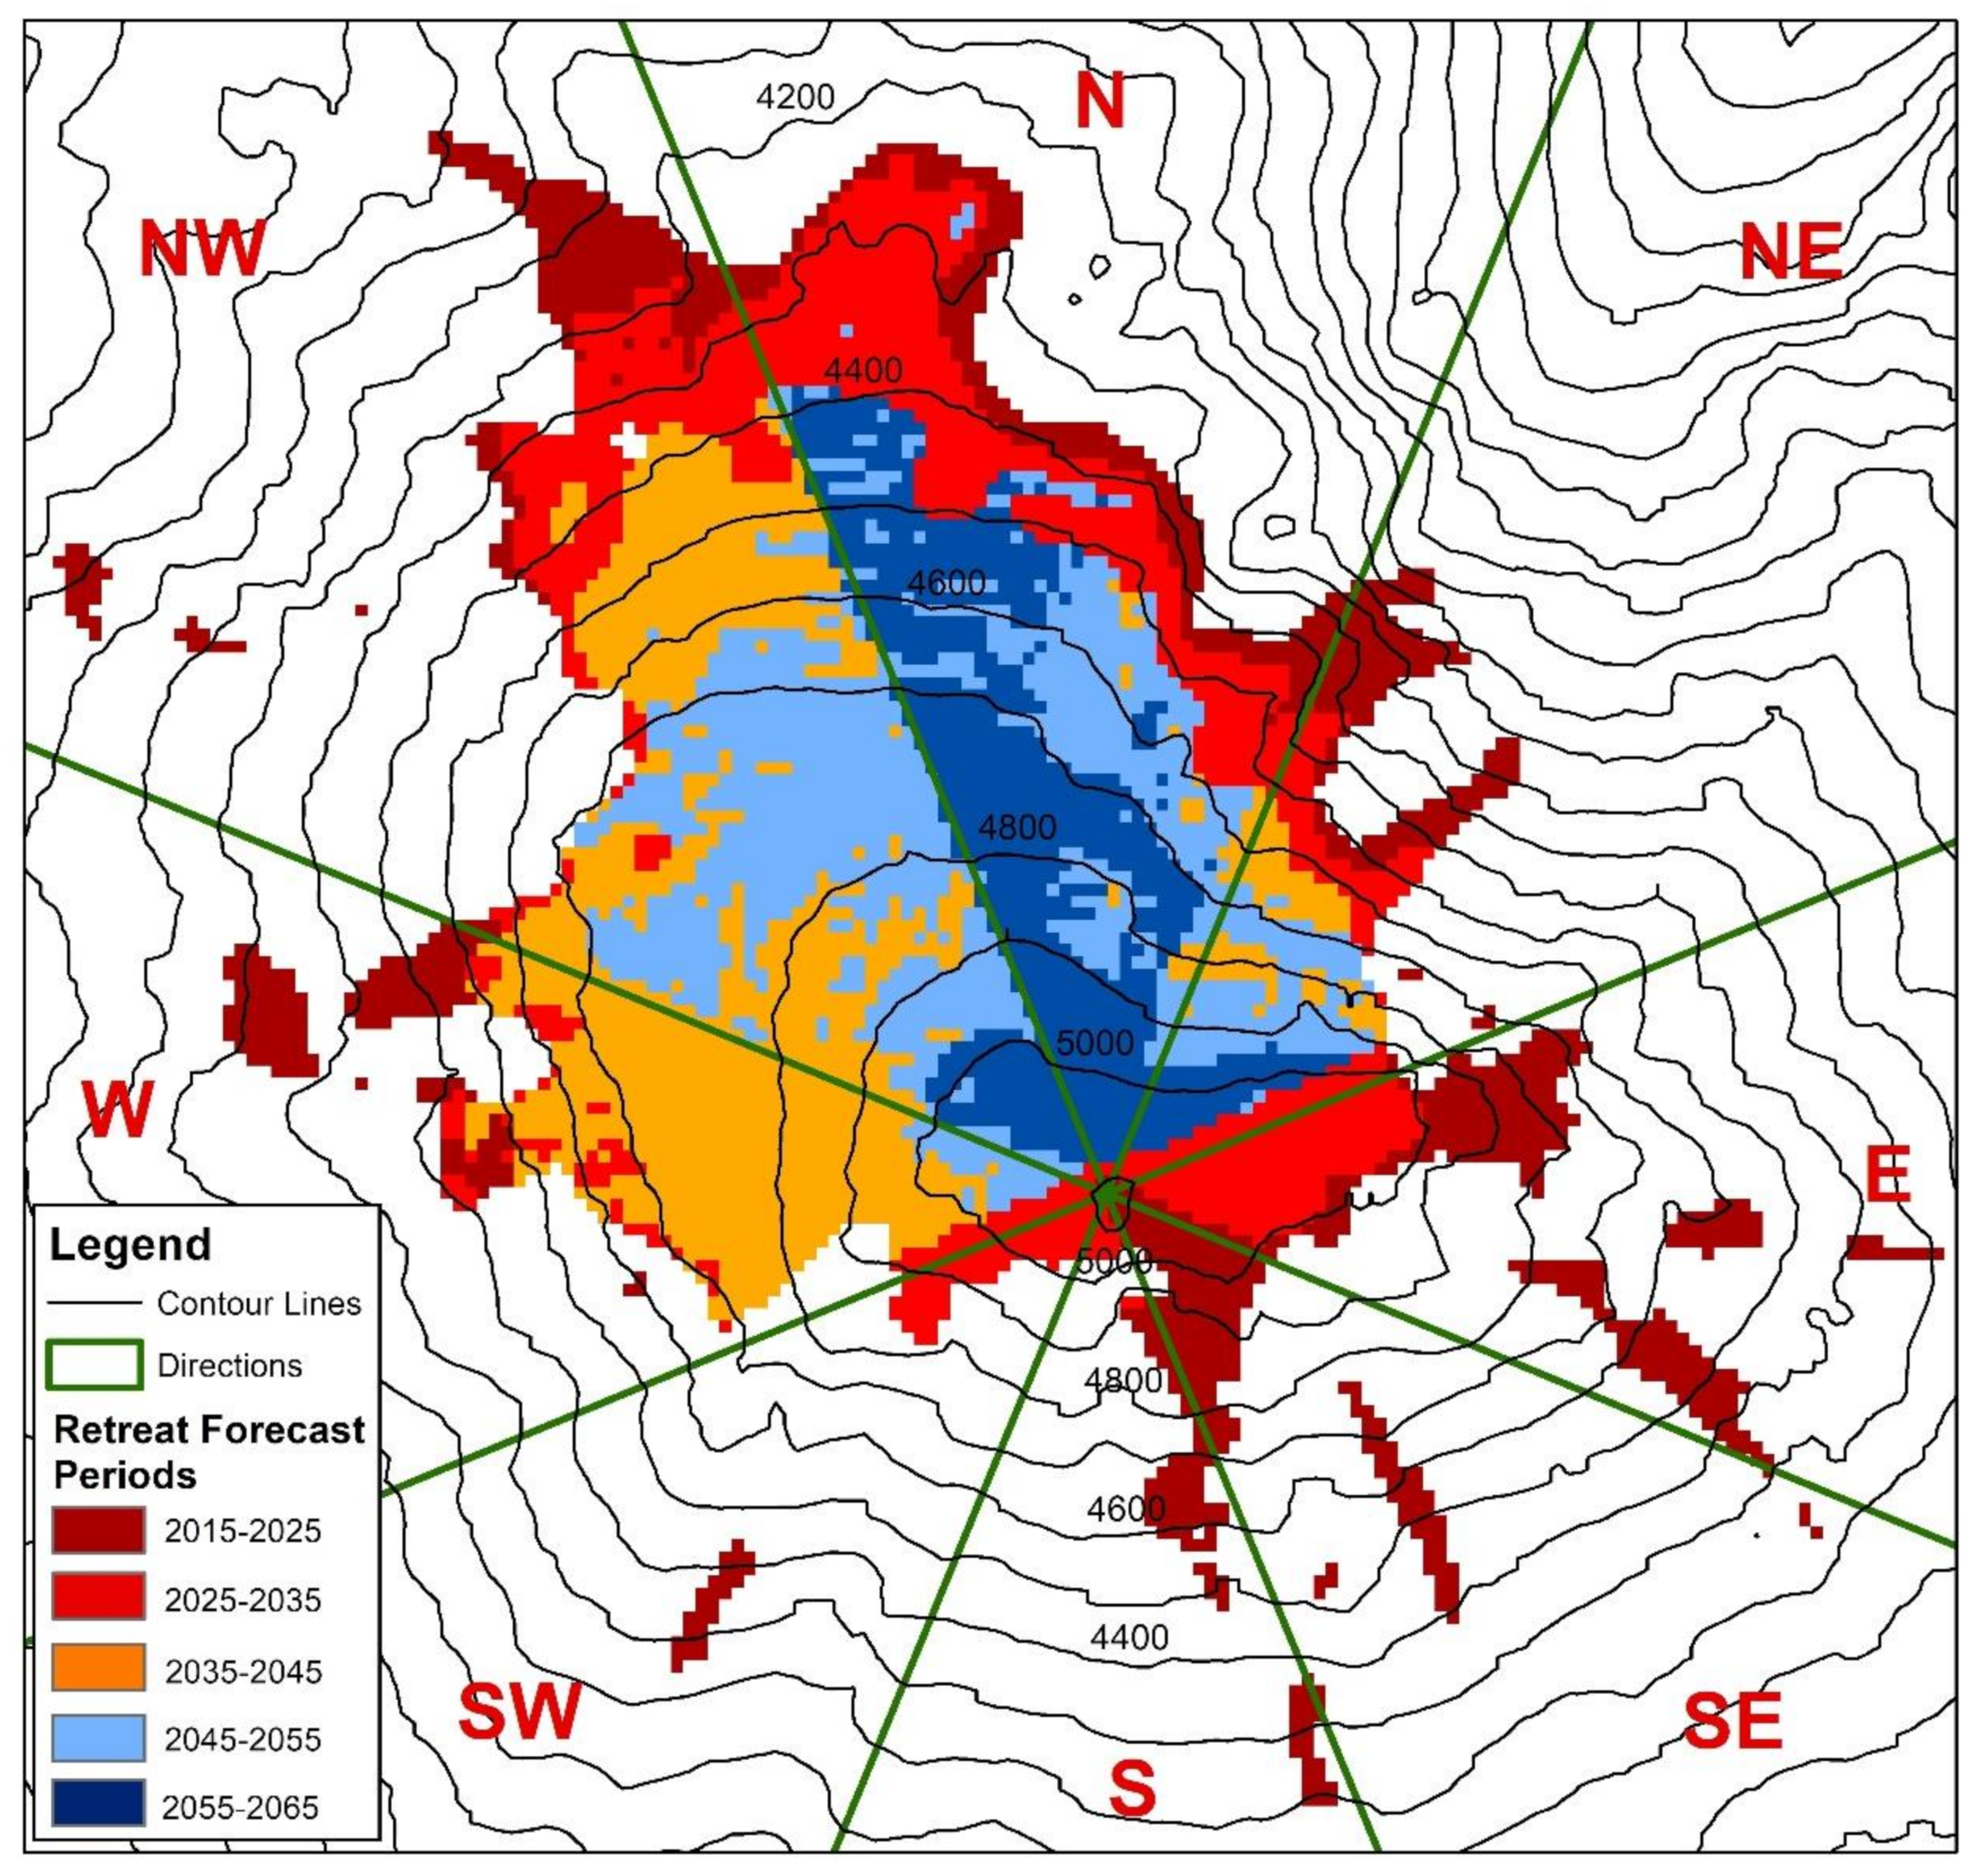
According to the glacial changes produced by NDSI between 1987 and 2015, a retreat of 3.223 km2 was detected in the Ağrı glacier over 28 years [45]. This indicated an average 1.15 km2 retreat per decade. Estimating that the average amount of change would continue in the future, the vulnerability map was masked by the glacier boundaries in 2015 to forecast melting areas for the following ten-year periods. The highest value pixels of the vulnerability map covering a 1.15 km2 area were determined for each ten-year period, which allowed forecasting the areas that could melt according to the specified periods (Figure 7).
In Figure 7, the dark red pixels indicate the areas expected to melt by 2025. Accordingly, the partial glaciers separated from the main glacial mass are expected to melt first. In the southern and eastern regions, the glacier is expected to retreat to the summit. The areas expected to completely melt by 2035 are the south, southeast, southwest and east parts of the glacier, which are shown in red. Orange areas, representing those that are expected to melt by 2045, are mostly in the west and northeast parts of the mountain. The remainder of the west part of the glacier, indicated by light blue, is forecast to melt by 2055. The remaining glacial areas, located only in the northern, northeastern and northwestern regions, are also expected to melt by 2065.
5. Discussion
Glacier fluctuations in mountain areas have been systematically observed in various parts of the world for more than a century [62] in response to an increase in average global temperature of ~0.6 °C [63]. Recent researches have shown that glaciers retreat in most areas, from poles to tropical regions, and the observed retreat is accelerated [64,65] by global warming [66]. The effects of global warming are more pronounced in the land surface areas in the mid and high latitudes of the Northern Hemisphere [67]. Ağrı Mountain, Turkey’s largest glacier (ice cap) located at the top of the mountain, is located in the mid-latitudes of the Northern Hemisphere. Dramatically, it has been rapidly melting in the last three decades, similar to other glaciers in the world [43,44,45]. According to the previous study, a retreat of 3.223 km2 was detected in the Ağrı glacier over 28 years [45]. Unfortunately, if the glacial withdrawals continue with the same acceleration, the permanent glacier will likely turn into a temporary glacier by 2065. To date, some studies have focused on the temporal changes in the Ağrı glacier [34,40,41,42,43,44,45].
It is very important to create a glacier vulnerability map to forecast retreat zones in order of priority. It is notably interesting to analyze the spatial patterns of melting zones to identify areas most vulnerable to melting, so it helps to identify changes in glacial geometry [68,69]. However, the spatial distribution of the glacier retreat does not show homogeneity and has a complex structure, especially due to topographical factors. In this study, a GIS-based MCDA approach was chosen to overcome this complexity since it is one of the most feasible ways to determine the vulnerable areas of mountain glaciers. Previously, different models were used to define the vulnerability of glaciers and successful results were achieved by these models [13,16,68]. The present study was designed to determine the spatial distribution of the vulnerability of the Ağrı Mountain glacier and assess the forecasting capabilities of the GIS-based MCDA model for determining the zones of glacier retreat in order of priority.
Firstly the criteria were decided and evaluated in the model. The relationship between topographical (aspect, direction, elevation, and slope) criteria and glacier retreat was investigated in the previous study [34]. In addition to these criteria, the GSTA criterion was used in the model. Secondly, the criteria weights were calculated using the Entropy Method and the FR model. The approach to empirical research adopted for this study is also considered as one of its important outputs. The findings have vital implications for the understanding of where glacier melting has occurred and is likely to occur in the future.
As a result of the Entropy Method, the criteria were listed according to the weight as GSTA, direction, height, aspect, and slope, respectively. The GSTA criterion was the first important criterion with the relative importance of 0.49. The result is parallel with Wu et al. (2015), who calculated the GSTA distribution of Qiyi glacier in China. It was reported in the study that glacial melting has a strong dependence on GSTA and the heterogeneity of GSTA mostly results from the topography [53]. Specifically, the Ağrı glacier is a relatively small area, so the meteorological parameters (perception, air temperature, humidity, etc.) affecting this area are almost the same. Therefore the GSTA already includes the aspect and direction (sunshine conditions) and elevation (air temperature) effects and it varies according to these criteria. The height criterion was used in almost all topographic studies of the glacier, and high correlations were found in almost all [14,16,66,70]. Furthermore, Vijay and Braun (2018) used height as the only topographic factor in their studies. They observed significant elevation variation models on a glacier scale associated with debris insulation and enhanced ice melting [71]. In the study, the height criterion was determined as the third-highest criterion with the relative importance of 0.12. One of the other factors that affect glacier vulnerability is aspect [16]. The aspect criterion was frequently used in researches on the topographic effects on mountain glaciers and the correlation was observed between mountain glacier retreat and the aspect criterion [16,66]. The aspect criterion was the fourth important criterion with the relative importance of 0.08, which is lower than the relative importance of the direction criterion, which was the second important criterion, as seen in Table 2. The direction criterion was used for the first time with this study for mountain glaciers. According to the results of the Entropy Method, it was a more important factor than the aspect criterion, which is the most noteworthy finding that emerged from this study. Lastly, the steep slopes are a common source of mass movements and can be an indicator of high geomorphic activity [28,72]. According to the relative importance, the slope criterion (0.06) had the lowest effect on glacier retreat.
The criterion data were synthesized with their weights and used to create the first vulnerability map. The map was classified according to the melting area size of the periods and then compared to the current melting areas. According to the overlay analysis, the overlap between the classified vulnerability map and the current melting area was 77.8% in the short term and 92.1% in the long term. However, when the estimated melting regions produced from the model and the actual melting regions were compared, it was seen that the model was not successful in estimating fragmented glacier parts in the valley. All in all, these results show that GIS-based MCDA provides satisfactory results in mapping glacier vulnerability areas. Additionally, the results show that the topographical factors are strongly correlated with the vulnerability of mountain glaciers, which parallels the results of similar vulnerability studies [16,68]. Yang et. al. (2015) reported that mountain glaciers in China are very vulnerable to climate change, and 41.2% of glacier areas fell to severe and very weak vulnerability levels in the period 1961–2007. This is basically explained by topographic exposure and the high sensitivity of glaciers to climate change [16]. These results are also in agreement with Wójcik and Sobota’s (2020) findings. According to the results, the spatial distribution of ablation in Irenebreen glacier was shown to depend mainly on weather conditions and also on local topographic conditions [68].
In the last part of the study, priority glacial retreat regions were forecasted for the following ten-year periods. Accordingly, the parts of the glacier in the south, southeast, southwest, and east are expected to completely melt by 2035. The west part of the glacier is expected to melt completely by 2055, and the remaining glacial areas by 2065.
This study is one of the few studies in the literature that analyzes the vulnerability of a mountain glacier using GIS-based MCDA, a new approach to determining the vulnerability areas of mountain glaciers. A limitation of this study is the spatial resolution of DEM. With higher resolution, more precise data can be obtained. In addition, the decision criteria are objective, so the selected criteria can be changed. It is hoped that the data obtained will be valuable in reducing the difficulty of forecasting glacier melting areas. In future studies, the same approach can be applied to other mountain glaciers and ice caps located elsewhere in the world.
Funding
This research was funded by Afyon Kocatepe University Scientific Research Projects Coordination Department with the project number of 16. KARIYER.170.
Acknowledgments
This study was supported by Afyon Kocatepe University Scientific Research Projects Coordination Department with the project number of 16. KARIYER.170.
Conflicts of Interest
The author declares no conflict of interest. The funders had no role in the design of the study; in the collection, analyses, or interpretation of data; in the writing of the manuscript, or in the decision to publish the results.
References
- Liu, T.; Kinouchi, T.; Ledezma, F. Characterization of recent glacier decline in the Cordillera Real by LANDSAT, ALOS, and ASTER data. Remote Sens. Environ. 2013, 137, 158–172. [Google Scholar] [CrossRef]
- Bishop, M.P.; Olsenholler, J.A.; Shroder, J.F.; Barry, R.G.; Raup, B.H.; Bush, A.B.; Copland, L.; Dwyer, J.L.; Fountain, A.G.; Haeberli, W.; et al. Global Land Ice Measurements from Space (GLIMS): Remote sensing and GIS investigations of the Earth’s cryosphere. Geocarto Int. 2004, 19, 57–84. [Google Scholar] [CrossRef]
- The National Snow and Ice Data Center (NSIDC). Glaciers and Climate Change. Available online: https://nsidc.org/cryosphere/glaciers/questions/climate.html (accessed on 24 July 2019).
- Kaser, G.; Fountain, A.; Jansson, P. A Manual for Monitoring the Mass Balance of Mountain Glaciers; UNESCO: Paris, France, 2003; p. 137. [Google Scholar]
- Tangborn, W.V.; Krimmel, R.M.; Meier, M.F. A comparison of glacier mass balance by glaciological, hydrological and mapping methods, South Cascade Glacier, Washington. Int. Assoc. Hydrol. Sci. Publ. 1975, 104, 185–196. [Google Scholar]
- Østrem, G.; Brugman, M. Glacier-Mass Balance Measurements: A Manual for Field and Office Work; NHRI Science Report; National Hydrology Research Institute: Saskatoon, SK, Canada, 1994. [Google Scholar]
- Imhof, E. The ararat. Die Alpen 1956, 32, 1–14. [Google Scholar]
- Bayr, K.J.; Hall, D.K.; Kovalick, W.M. Observations on glaciers in the eastern Austrian Alps using satellite data. Int. J. Remote Sens. 1994, 15, 1733–1742. [Google Scholar] [CrossRef]
- Paul, F. Evaluation of different methods for glacier mapping using Landsat TM. In Proceedings of the EARSeL-SIG Workshop on Land Ice and Snow, Dresden, Germany, 16–17 June 2000; Volume 16, p. 17. [Google Scholar]
- Paul, F.; Huggel, C.; Kääb, A.; Kellenberger, T.; Maisch, M. Comparison of TM-derived glacier areas with higher resolution data sets. In Proceedings of the EARSeL Workshop on Remote Sensing of Land Ice and Snow, Bern, Switzerland, 11–13 March 2002; Volume 11. [Google Scholar]
- Andreassen, L.M.; Paul, F.; Kääb, A.; Hausberg, J.E. Landsat-derived glacier inventory for Jotunheimen, Norway, and deduced glacier changes since the 1930s. Cryosphere 2008, 2, 131–145. [Google Scholar] [CrossRef] [Green Version]
- Racoviteanu, A.E.; Williams, M.W.; Barry, R.G. Optical remote sensing of glacier characteristics: A review with focus on the Himalaya. Sensors 2008, 8, 3355–3383. [Google Scholar] [CrossRef] [Green Version]
- Strigaro, D.; Moretti, M.; Mattavelli, M.; Frigerio, I.; De Amicis, M.; Maggi, V. A GRASS GIS module to obtain an estimation of glacier behavior under climate change: A pilot study on Italian glacier. Comput. Geosci. 2016, 94, 68–76. [Google Scholar] [CrossRef]
- Garg, P.K.; Shukla, A.; Jasrotia, A.S. Influence of topography on glacier changes in the central Himalaya, India. Glob. Planet. Chang. 2017, 155, 196–212. [Google Scholar] [CrossRef]
- Jones, D.B.; Harrison, S.; Anderson, K.; Selley, H.L.; Wood, J.L.; Betts, R.A. The distribution and hydrological significance of rock glaciers in the Nepalese Himalaya. Glob. Planet. Chang. 2018, 160, 123–142. [Google Scholar] [CrossRef] [Green Version]
- Yang, J.P.; Ding, Y.J.; Liu, S.Y.; Tan, C.P. Vulnerability of mountain glaciers in China to climate change. Adv. Clim. Chang. Res. 2015, 6, 171–180. [Google Scholar] [CrossRef]
- Allen, T.R. Topographic context of glaciers and perennial snowfields, Glacier National Park, Montana. Geomorphology 1998, 21, 207–216. [Google Scholar] [CrossRef]
- Lambrecht, A.; Kuhn, M. Glacier changes in the Austrian Alps during the last three decades, derived from the new Austrian glacier inventory. Ann. Glaciol. 2007, 46, 177–184. [Google Scholar] [CrossRef] [Green Version]
- Gibson, M.J.; Glasser, N.F.; Quincey, D.J.; Mayer, C.; Rowan, A.V.; Irvine-Fynn, T.D. Temporal variations in supraglacial debris distribution on Baltoro Glacier, Karakoram between 2001 and 2012. Geomorphology 2017, 295, 572–585. [Google Scholar] [CrossRef] [Green Version]
- Pandey, A.C.; Ghosh, S.; Nathawat, M.S. Evaluating patterns of temporal glacier changes in Greater Himalayan Range, Jammu & Kashmir, India. Geocarto Int. 2011, 26, 321–338. [Google Scholar]
- Bolch, T. Climate change and glacier retreat in northern Tien Shan (Kazakhstan/Kyrgyzstan) using remote sensing data. Glob. Planet. Chang. 2007, 56, 1–12. [Google Scholar] [CrossRef]
- Kumar, A.; Verma, A.; Gokhale, A.A.; Bhambri, R.; Misra, A.; Sundriyal, S.; Dobhal, D.P.; Kishore, N. Hydrometeorological assessments and suspended sediment delivery from a central Himalayan glacier in the upper Ganga basin. Int. J. Sediment Res. 2018, 33, 493–509. [Google Scholar] [CrossRef]
- Wu, F.; Zhan, J.; Wang, Z.; Zhang, Q. Streamflow variation due to glacier melting and climate change in upstream Heihe River Basin, Northwest China. Phys. Chem. Earth Parts A/B/C 2015, 79, 11–19. [Google Scholar] [CrossRef]
- Li, Z.; Shi, X.; Tang, Q.; Zhang, Y.; Gao, H.; Pan, X.; Déry, S.J.; Zhou, P. Partitioning the contributions of glacier melt and precipitation to the 1971–2010 runoff increases in a headwater basin of the Tarim River. J. Hydrol. 2020, 583, 124579. [Google Scholar] [CrossRef]
- López-Moreno, J.I.; Fontaneda, S.; Bazo, J.; Revuelto, J.; Azorin-Molina, C.; Valero-Garcés, B.; Morán-Tejeda, E.; Vicente-Serrano, S.M.; Zubieta, R.; Alejo-Cochachín, J. Recent glacier retreat and climate trends in Cordillera Huaytapallana, Peru. Glob. Planet. Chang. 2014, 112, 1–11. [Google Scholar] [CrossRef] [Green Version]
- Schauwecker, S.; Rohrer, M.; Acuña, D.; Cochachin, A.; Dávila, L.; Frey, H.; Giráldez, C.; Gómez, J.; Huggel, C.; Jacques-Coper, M.; et al. Climate trends and glacier retreat in the Cordillera Blanca, Peru, revisited. Glob. Planet. Chang. 2014, 119, 85–97. [Google Scholar] [CrossRef]
- Yan, W.; Liu, J.; Zhang, M.; Hu, L.; Chen, J. Outburst flood forecasting by monitoring glacier-dammed lake using satellite images of Karakoram Mountains, China. Quat. Int. 2017, 453, 24–36. [Google Scholar] [CrossRef]
- Mir, R.A.; Jain, S.K.; Lohani, A.K.; Saraf, A.K. Glacier recession and glacial lake outburst flood studies in Zanskar basin, western Himalaya. J. Hydrol. 2018, 564, 376–396. [Google Scholar] [CrossRef]
- Wang, X.; Siegert, F.; Zhou, A.G.; Franke, J. Glacier and glacial lake changes and their relationship in the context of climate change, Central Tibetan Plateau 1972–2010. Glob. Planet. Chang. 2013, 111, 246–257. [Google Scholar] [CrossRef]
- Viani, C.; Machguth, H.; Huggel, C.; Godio, A.; Franco, D.; Perotti, L.; Giardino, M. Potential future lakes from continued glacier shrinkage in the Aosta Valley Region (Western Alps, Italy). Geomorphology 2020, 353, 107068. [Google Scholar] [CrossRef]
- Akhtar, M.; Ahmad, N.; Booij, M.J. The impact of climate change on the water resources of Hindukush–Karakorum–Himalaya region under different glacier coverage scenarios. J. Hydrol. 2008, 355, 148–163. [Google Scholar] [CrossRef]
- Li, Y.; Li, Y. Topographic and geometric controls on glacier changes in the central Tien Shan, China, since the Little Ice Age. Ann. Glaciol. 2014, 55, 177–186. [Google Scholar] [CrossRef] [Green Version]
- Zhou, Y.; Li, Z.; Li, J.I.A. Slight glacier mass loss in the Karakoram region during the 1970s to 2000 revealed by KH-9 images and SRTM DEM. J. Glaciol. 2017, 63, 331–342. [Google Scholar] [CrossRef] [Green Version]
- Yalcin, M. The impact of topographical parameters to the glaciation and glacial retreat on Mount Ağrı (Ararat). Environ. Earth Sci. 2019, 78, 393. [Google Scholar] [CrossRef]
- Yalcin, M.; Gul, F.K. A GIS-based multi criteria decision analysis approach for exploring geothermal resources: Akarcay basin (Afyonkarahisar). Geothermics 2017, 67, 18–28. [Google Scholar] [CrossRef]
- Ouma, Y.; Tateishi, R. Urban flood vulnerability and risk mapping using integrated multi-parametric AHP and GIS: Methodological overview and case study assessment. Water 2014, 6, 1515–1545. [Google Scholar] [CrossRef]
- Ahmed, B. Landslide susceptibility mapping using multi-criteria evaluation techniques in Chittagong Metropolitan Area, Bangladesh. Landslides 2015, 12, 1077–1095. [Google Scholar] [CrossRef] [Green Version]
- Kougkoulos, I.; Cook, S.J.; Jomelli, V.; Clarke, L.; Symeonakis, E.; Dortch, J.M.; Edwards, L.; Merad, M. Use of multi-criteria decision analysis to identify potentially dangerous glacial lakes. Sci. Total Environ. 2018, 621, 1453–1466. [Google Scholar] [CrossRef] [PubMed]
- Kumar, S.; Srivastava, P.; Snehmani, K. GIS-based MCDA–AHP modelling for avalanche susceptibility mapping of Nubra valley region, Indian Himalaya. Geocarto Int. 2017, 32, 1254–1267. [Google Scholar] [CrossRef]
- Blumenthal, M.M. Vom Ağrı Dag (Ararat) zum Kaçkar Dag. Bergfahrten in nordostanatolischen Glenzlanden (From Mount Ararat to Mount Kaçkar. Mountain trip in the frontier region of northeastern Anatolia). Die Alpen 1958, 34, 125–137. [Google Scholar]
- Çiner, A. Turkish glaciers and glacial deposits. In Developments in Quaternary Sciences; Elsevier: Amsterdam, The Netherlands, 2004; Volume 2, pp. 419–429. [Google Scholar]
- Kurter, A.; Sungur, K. Present glaciation in Turkey. Int. Assoc. Hydrol. Sci. 1980, 126, 155–160. [Google Scholar]
- Sarıkaya, M.A. Recession of the ice cap on Mount Ağrı (Ararat), Turkey, from 1976 to 2011 and its climatic significance. J. Asian Earth Sci. 2012, 46, 190–194. [Google Scholar] [CrossRef]
- Yavasli, D.D.; Tucker, C.J.; Melocik, K.A. Change in the glacier extent in Turkey during the Landsat Era. Remote Sens. Environ. 2015, 163, 32–41. [Google Scholar] [CrossRef]
- Yalcin, M.; Ugur, M.A.; Polat, N.; Dereli, M.A. Gis-Based Temporal Analysis of Glacier Changes on Agri Mountain Using Landsat Data. Int. Multidiscip. Sci. GeoConf. SGEM Surv. Geol. Min. Ecol. Manag. 2017, 17, 133–140. [Google Scholar]
- Malczewski, J. GIS-based multicriteria decision analysis: A survey of the literature. Int. J. Geogr. Inf. Sci. 2006, 20, 703–726. [Google Scholar] [CrossRef]
- JPL. SRTM Mission Statistics. Available online: https://www2.jpl.nasa.gov/srtm/statistics.html (accessed on 9 August 2019).
- Malczewski, J.; Rinner, C. Multicriteria Decision Analysis in Geographic Information Science; Springer: New York, NY, USA, 2015. [Google Scholar]
- MacCrimmon, K.R. Inproving the System Design and Evaluation Process by the Use of Trade-Off Information; Memorandum RM-5877-DOT; The Rand Corporation: Santa Monica, CA, USA, 1969. [Google Scholar]
- Keeney, R.L.; Raiffa, H. Decisions with Multiple Objectives: Preferences and Value Tradeoffs; Wiley: New York, NY, USA, 1976. [Google Scholar]
- Pitz, G.F.; McKillip, J. Decision Analysis for Program Evaluators; SAGE Publications, Incorporated: Thousand Oaks, CA, USA, 1984; Volume 7. [Google Scholar]
- Malczewski, J. GIS and Multicriteria Decision Analysis; John Wiley & Sons: Hoboken, NJ, USA, 1999. [Google Scholar]
- Wu, Y.; Wang, N.; He, J.; Jiang, X. Estimating mountain glacier surface temperatures from Landsat-ETM+ thermal infrared data: A case study of Qiyi glacier, China. Remote Sens. Environ. 2015, 163, 286–295. [Google Scholar] [CrossRef]
- Eastman, J.R. IDRISI: A Grid Based Geographic Analysis System, version 4.1; Graduate School of Geography, Clark University: Worcester, MA, USA, 1991. [Google Scholar]
- Eastman, J.R.; Kyem, P.A.K.; Toledano, J.; Jin, W. GIS and Decision Making; The United Nations Institute for Training and Research (UNITAR): Geneva, Switzerland, 1993. [Google Scholar]
- Bonham-Carter, G.F. Geographic Information Systems for Geoscientists, Modeling with GIS; Pergamon Press: Oxford, UK, 1994. [Google Scholar]
- Al-Abadi, A.M. Modeling of groundwater productivity in northeastern Wasit Governorate, Iraq using frequency ratio and Shannon’s entropy models. Appl. Water Sci. 2017, 7, 699–716. [Google Scholar] [CrossRef] [Green Version]
- Bednarik, M.; Magulová, B.; Matys, M.; Marschalko, M. Landslide susceptibility assessment of the Kraľovany–Liptovský Mikuláš railway case study. Phys. Chem. Earth Parts A/B/C 2010, 35, 162–171. [Google Scholar] [CrossRef]
- Constantin, M.; Bednarik, M.; Jurchescu, M.C.; Vlaicu, M. Landslide susceptibility assessment using the bivariate statistical analysis and the index of entropy in the Sibiciu Basin (Romania). Environ. Earth Sci. 2011, 63, 397–406. [Google Scholar] [CrossRef]
- Jaafari, A.; Najafi, A.; Pourghasemi, H.R.; Rezaeian, J.; Sattarian, A. GIS-based frequency ratio and index of entropy models for landslide susceptibility assessment in the Caspian forest, Northern Iran. Int. J. Environ. Sci. Technol. 2014, 11, 909–926. [Google Scholar] [CrossRef] [Green Version]
- Wang, Q.; Li, W.; Yan, S.; Wu, Y.; Pei, Y. GIS based frequency ratio and index of entropy models to landslide susceptibility mapping (Daguan, China). Environ. Earth Sci. 2016, 75, 780. [Google Scholar] [CrossRef]
- Nesje, A.; Bakke, J.; Dahl, S.O.; Lie, Ø.; Matthews, J.A. Norwegian mountain glaciers in the past, present and future. Glob. Planet. Chang. 2008, 60, 10–27. [Google Scholar] [CrossRef]
- IPCC. Climate Change 2001: The Scientific Basis; Houghton, J.T., Ding, Y., Griggs, D.J., Noguer, M., van der Linden, P.J., Dai, X., Maskell, K., Johnson, C.A., Eds.; Cambridge University Press: Cambridge, UK, 2001. [Google Scholar]
- Barry, R.G. The status of research on glaciers and global glacier recession: A review. Prog. Phys. Geogr. 2006, 30, 285–306. [Google Scholar] [CrossRef]
- Kutuzov, S.; Shahgedanova, M. Glacier retreat and climatic variability in the Eastern Terskey–Alatoo, inner Tien Shan between the middle of the 19th century and beginning of the 21st century. Glob. Planet. Chang. 2009, 69, 59–70. [Google Scholar] [CrossRef]
- Gao, H.; Li, H.; Duan, Z.; Ren, Z.; Meng, X.; Pan, X. Modelling glacier variation and its impact on water resource in the Urumqi Glacier No. 1 in Central Asia. Sci. Total Environ. 2018, 644, 1160–1170. [Google Scholar] [CrossRef] [PubMed]
- Ding, Y.; Liu, S.; Li, J.; Shangguan, D. The retreat of glaciers in response to recent climate warming in western China. Ann. Glaciol. 2006, 43, 97–105. [Google Scholar] [CrossRef] [Green Version]
- Wójcik, K.A.; Sobota, I. Spatial and temporal changes in ablation, distribution and evolution of glacial zones on Irenebreen, a small glacier of the High Arctic, Svalbard. Polar Sci. 2020, 23, 100503. [Google Scholar] [CrossRef]
- Da Silva, A.B.; Arigony-Neto, J.; Braun, M.; de Almeida Espinoza, J.M.; Costi, J.; Janã, R. Spatial and temporal analysis of changes in the glaciers of the Antarctic Peninsula. Glob. Planet. Chang. 2019, 184, 103079. [Google Scholar] [CrossRef]
- Narama, C.; Kääb, A.; Duishonakunov, M.; Abdrakhmatov, K. Spatial variability of recent glacier area changes in the Tien Shan Mountains, Central Asia, using Corona (~1970), Landsat (~2000), and ALOS (~2007) satellite data. Glob. Planet. Chang. 2010, 71, 42–54. [Google Scholar] [CrossRef]
- Vijay, S.; Braun, M. Early 21st century spatially detailed elevation changes of Jammu and Kashmir glaciers (Karakoram–Himalaya). Glob. Planet. Chang. 2018, 165, 137–146. [Google Scholar] [CrossRef] [Green Version]
- Peduzzi, P. Landslides and vegetation cover in the 2005 North Pakistan earthquake: A GIS and statistical quantitative approach. Nat. Hazards Earth Syst. Sci. 2010, 10, 623–640. [Google Scholar] [CrossRef]
Figure 1.
Study Area (Ağrı glacier).
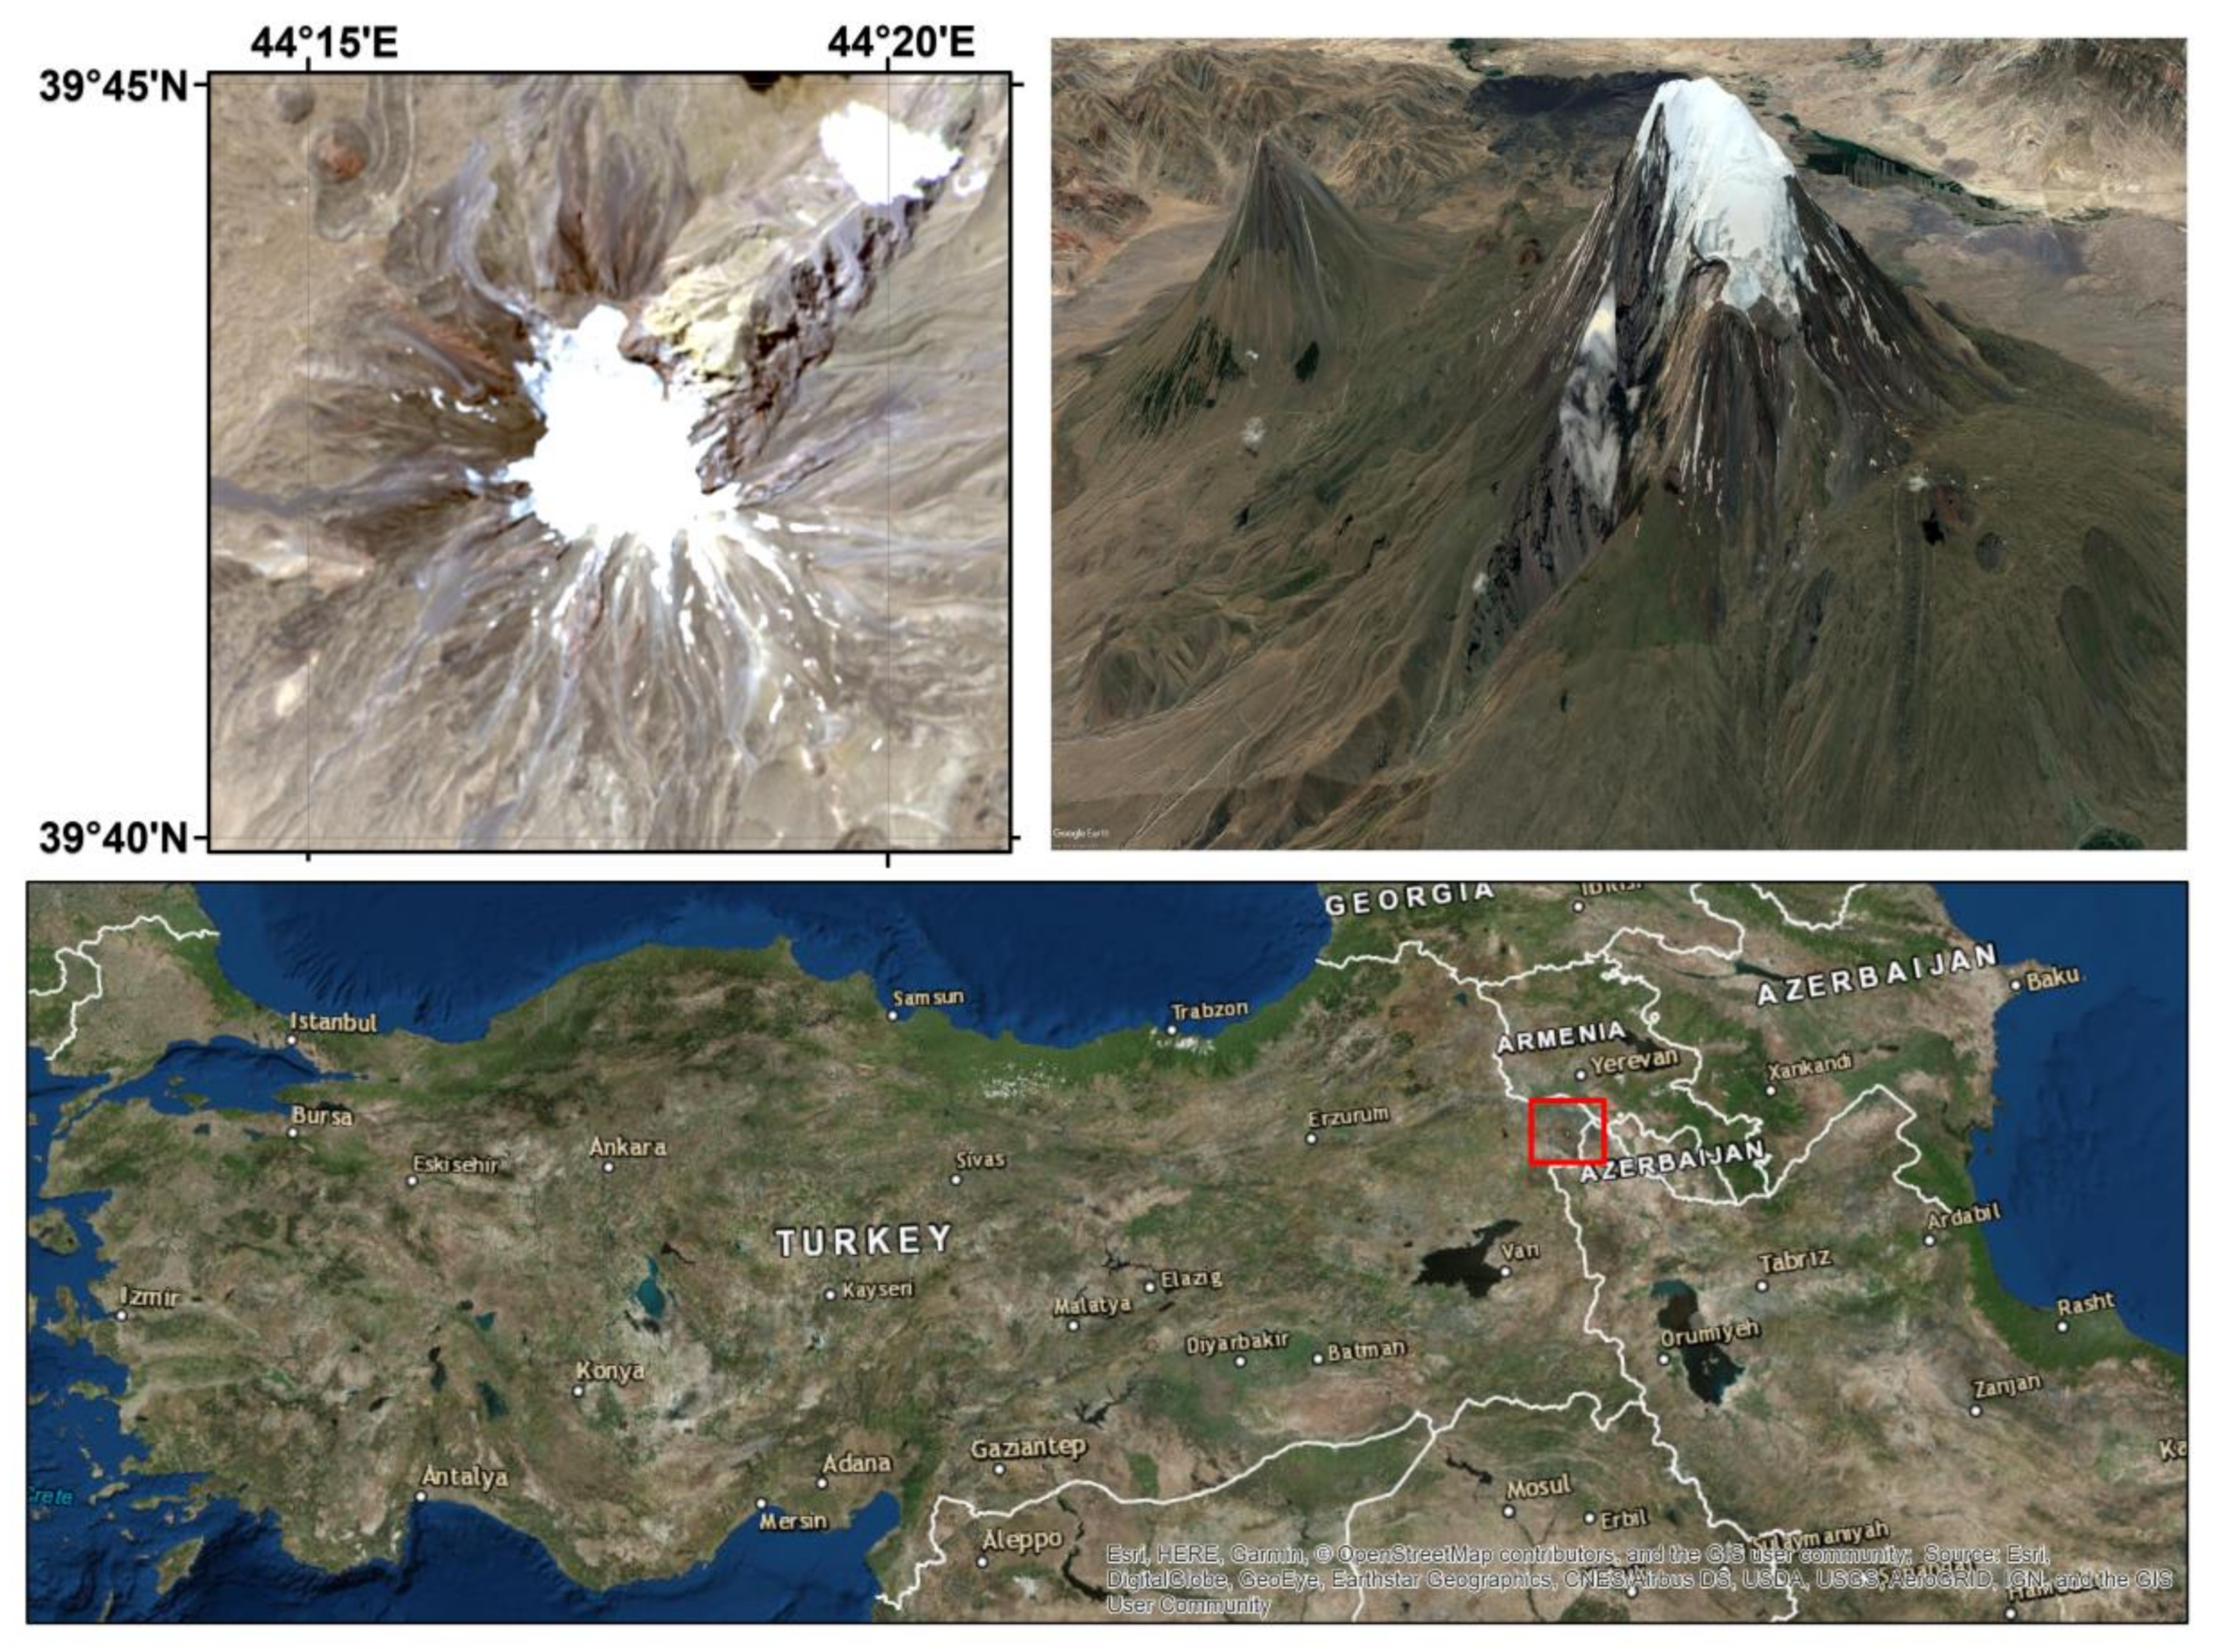
Figure 2.
Flow diagram of the study.
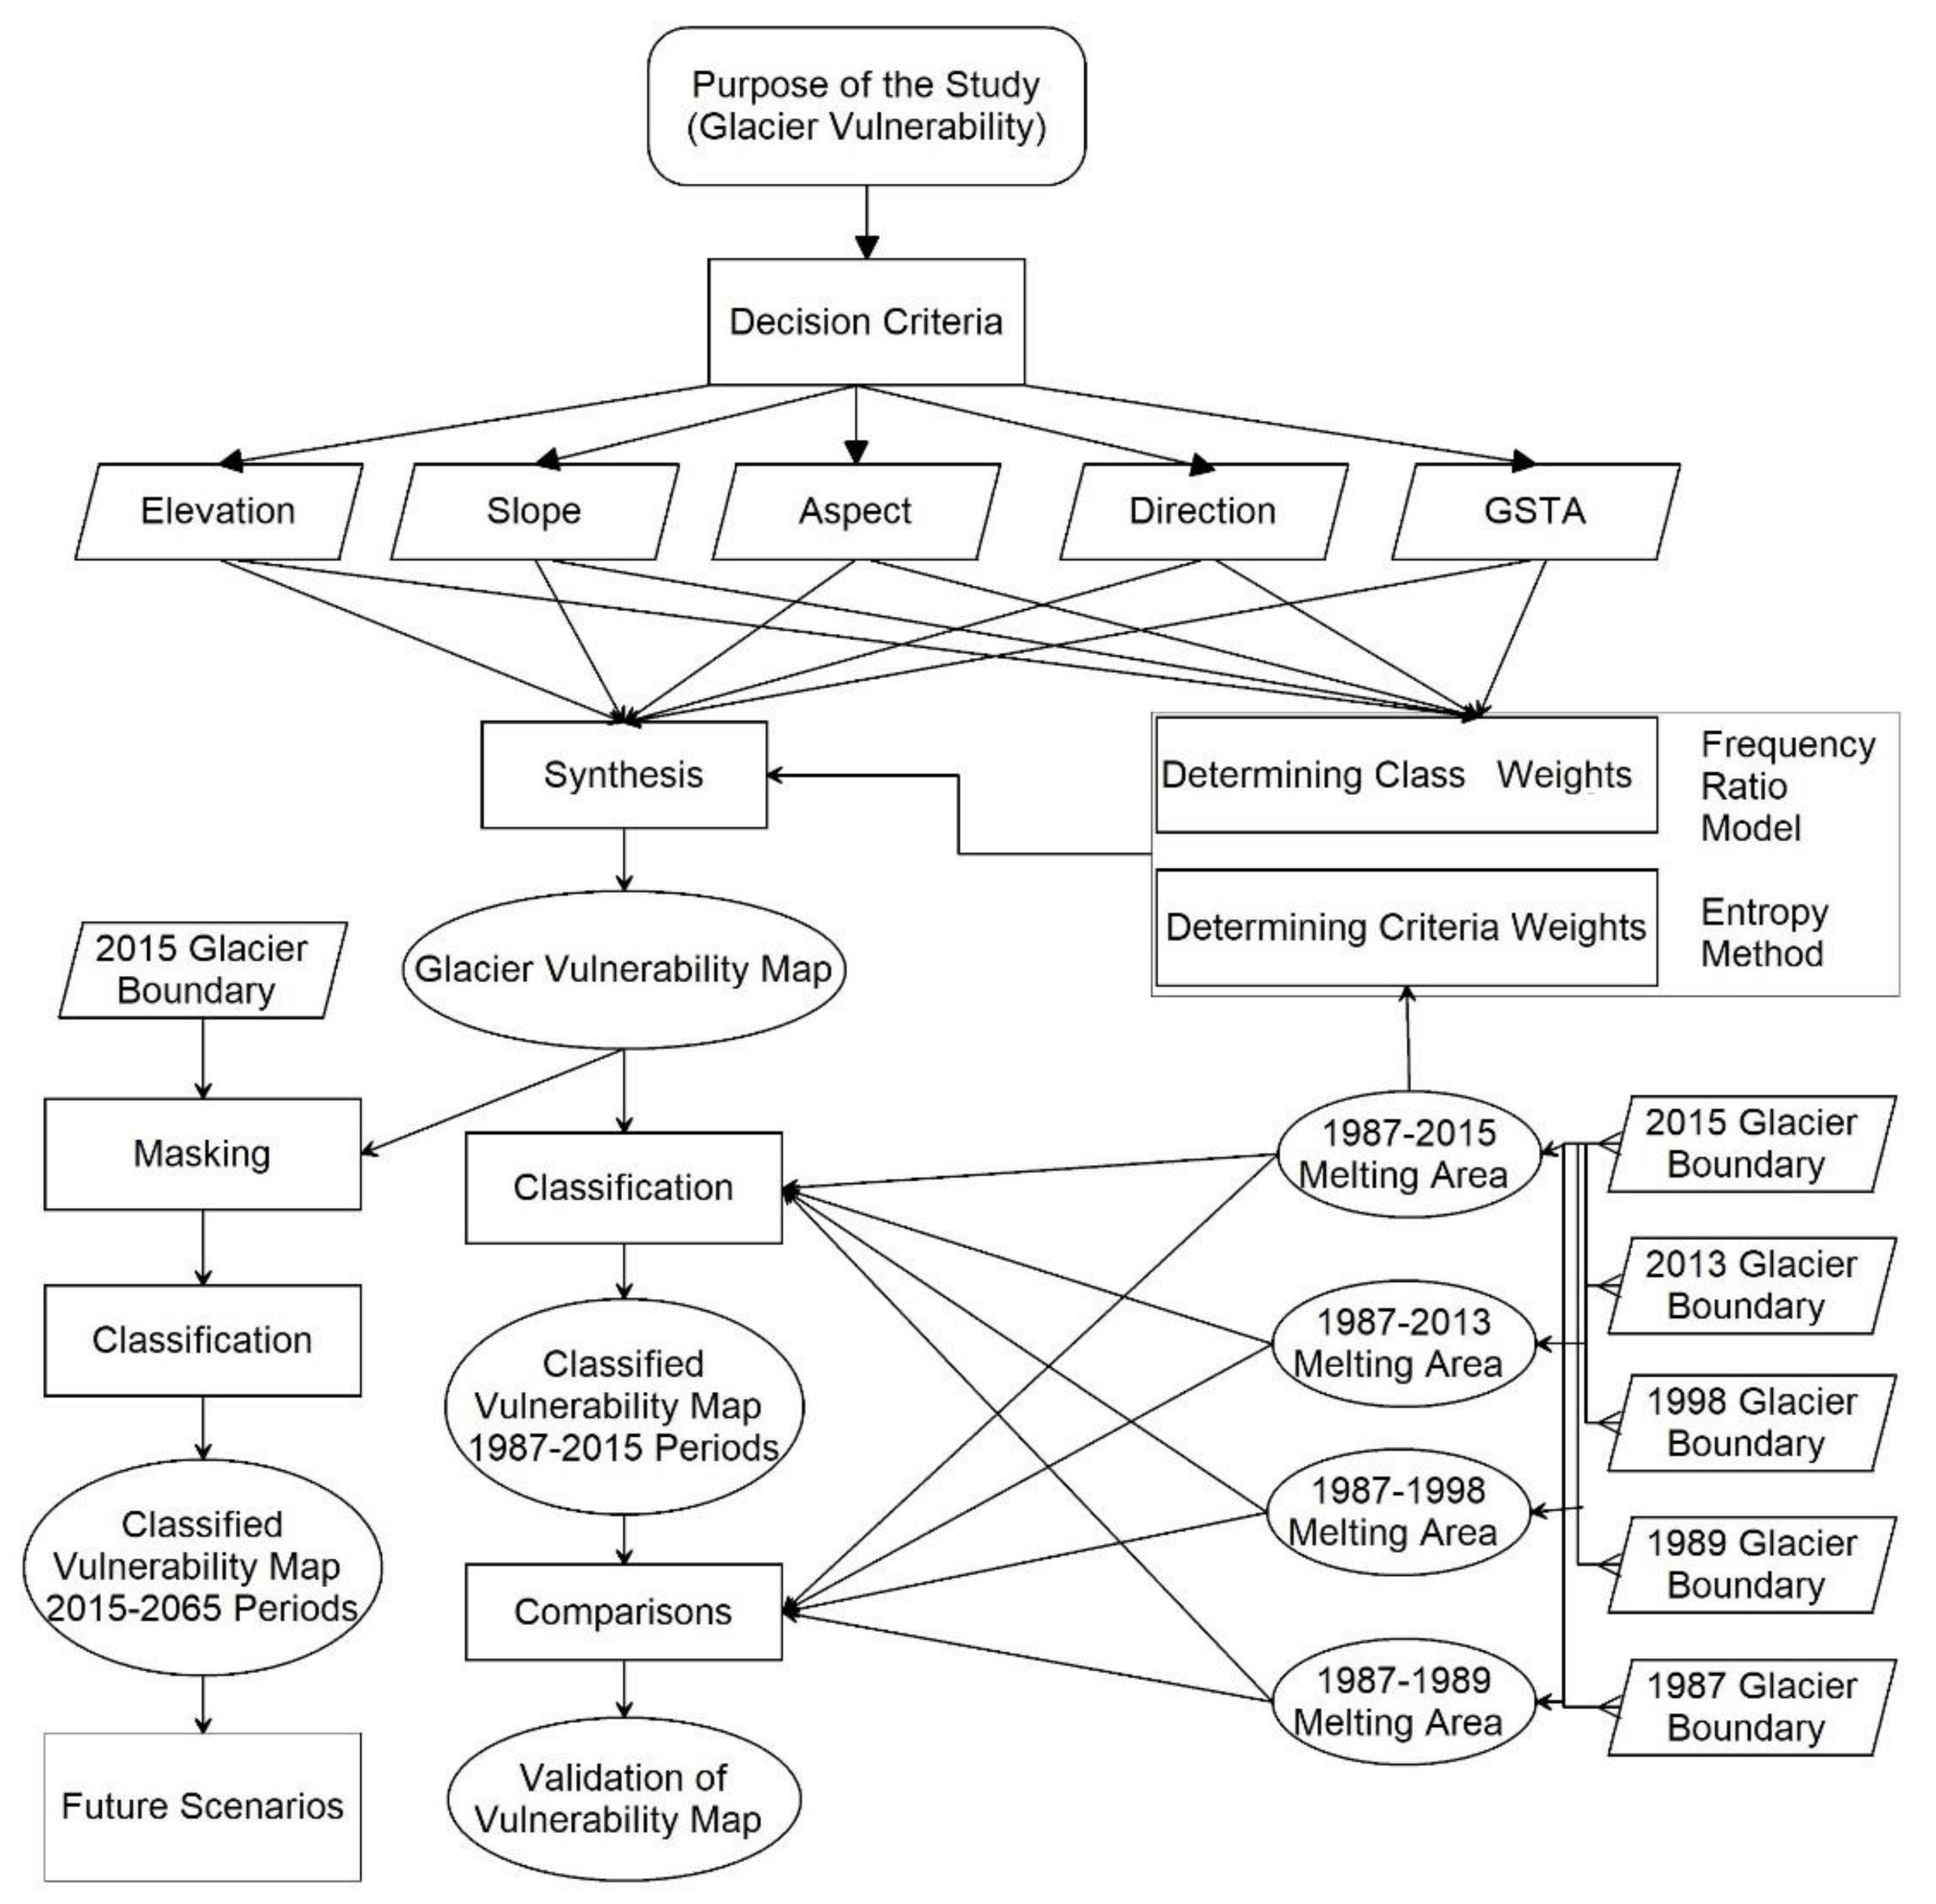
Figure 3.
Criteria layers.

Figure 4.
Glacier vulnerability map.
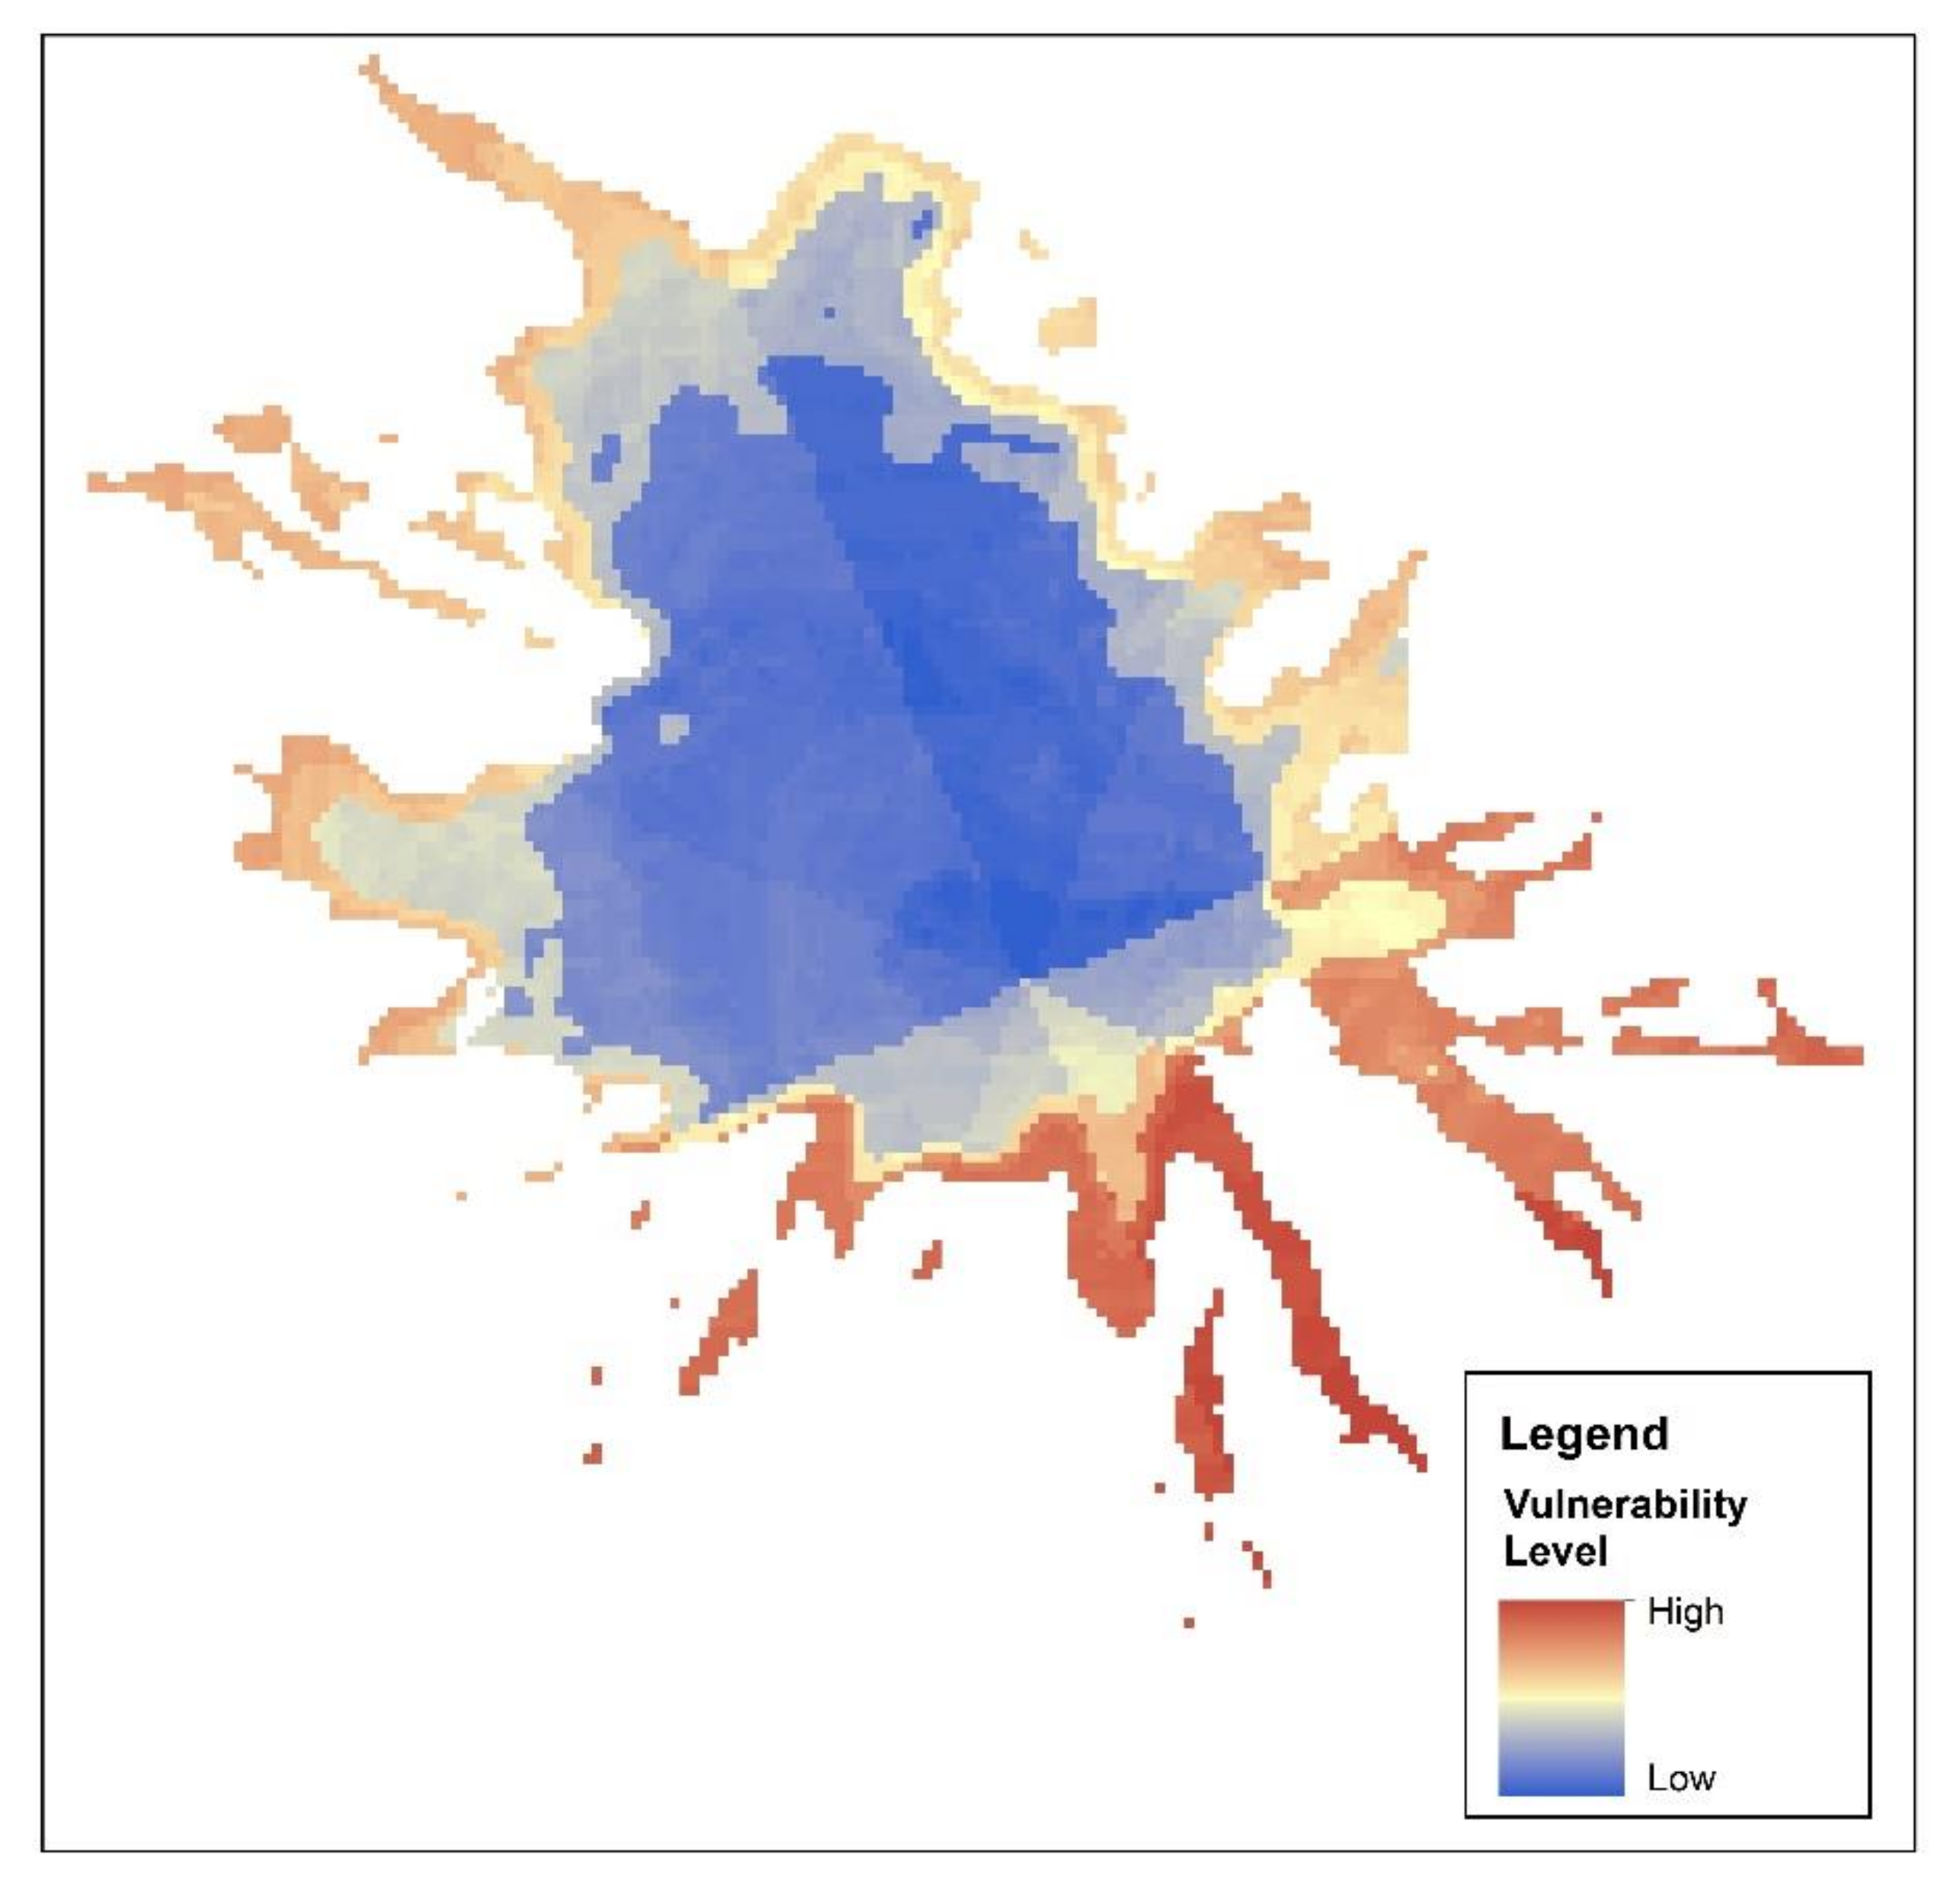
Figure 5.
(a) Glacier boundaries in different years. (b) Map of glacier vulnerability classified by the melting area for different periods.
Figure 5.
(a) Glacier boundaries in different years. (b) Map of glacier vulnerability classified by the melting area for different periods.

Figure 6.
(a) Actual melting regions (1987–2015). (b) Estimated melting regions according to the vulnerability map (1987–2015).
Figure 6.
(a) Actual melting regions (1987–2015). (b) Estimated melting regions according to the vulnerability map (1987–2015).

Figure 7.
Future retreat scenarios for Ağrı glacier.


Table 1.
The process of weight calculation.
| Criteria | Classes | Glacial Area (m2) | Glacial Area Ratio (a) | Melting Area (m2) | Melting Area Ratio (b) | FR (b/a) | (Pij) | Pij (Mean) | Hj | Hij max | Ij | Wj |
|---|---|---|---|---|---|---|---|---|---|---|---|---|
| Elevation (m) | 3600–3700 | 1983 | 0.0002 | 1983 | 0.0006 | 2.5916 | 0.1256 | 0.0625 | 3.6308 | 4.0 | 0.0923 | 0.0058 |
| 3700-3800 | 567,77 | 0.0061 | 567,77 | 0.0158 | 2.5916 | 0.1256 | ||||||
| 3800–3900 | 147,274 | 0.0158 | 132,894 | 0.0370 | 2.3385 | 0.1133 | ||||||
| 3900–4000 | 164,877 | 0.0177 | 117,274 | 0.0327 | 1.8433 | 0.0893 | ||||||
| 4000–4100 | 284,135 | 0.0306 | 232,564 | 0.0648 | 2.1212 | 0.1028 | ||||||
| 4100–4200 | 539,261 | 0.0580 | 392,978 | 0.1096 | 1.8886 | 0.0915 | ||||||
| 4200–4300 | 942,652 | 0.1014 | 540,500 | 0.1507 | 1.4860 | 0.0720 | ||||||
| 4300–4400 | 1,037,116 | 0.1116 | 478,268 | 0.1333 | 1.1951 | 0.0579 | ||||||
| 4400–4500 | 1,008,851 | 0.1085 | 385,540 | 0.1075 | 0.9904 | 0.0480 | ||||||
| 4500–4600 | 974,388 | 0.1048 | 334,714 | 0.0933 | 0.8902 | 0.0431 | ||||||
| 4600–4700 | 872,239 | 0.0938 | 279,672 | 0.0780 | 0.8309 | 0.0403 | ||||||
| 4700–4800 | 1,391,417 | 0.1497 | 259,837 | 0.0724 | 0.4840 | 0.0235 | ||||||
| 4800–4900 | 809,759 | 0.0871 | 241,985 | 0.0675 | 0.7745 | 0.0375 | ||||||
| 4900–5000 | 562,815 | 0.0605 | 131,902 | 0.0368 | 0.6074 | 0.0294 | ||||||
| 5000–5100 | 492,401 | 0.0530 | 0.0000 | 0.0000 | 0.0000 | 0.0000 | ||||||
| 5100–5200 | 9670 | 0.0010 | 0.0000 | 0.0000 | 0.0000 | 0.0000 | ||||||
| Direction | North | 1,848,237 | 0.1987 | 183,727 | 0.0508 | 0.2555 | 0.0226 | 0.1250 | 2.6905 | 3.000 | 0.1032 | 0.0129 |
| Northwest | 2,442,723 | 0.2626 | 598,004 | 0.1652 | 0.6292 | 0.0557 | ||||||
| West | 1,578,162 | 0.1696 | 510,726 | 0.1411 | 0.8317 | 0.0736 | ||||||
| Southwest | 486,716 | 0.0523 | 379,380 | 0.1048 | 2.0033 | 0.1773 | ||||||
| South | 381,942 | 0.0411 | 339,650 | 0.0938 | 2.2855 | 0.2023 | ||||||
| Southeast | 524,154 | 0.0563 | 573,507 | 0.1584 | 2.8121 | 0.2489 | ||||||
| East | 1,114,486 | 0.1198 | 832,588 | 0.2300 | 1.9200 | 0.1699 | ||||||
| Northeast | 926,533 | 0.0996 | 202,099 | 0.0558 | 0.5606 | 0.0496 | ||||||
| Aspect | North | 1,948,777 | 0.2096 | 356,284 | 0.0989 | 0.4720 | 0.0515 | 0.1250 | 2.9057 | 3.000 | 0.0314 | 0.0039 |
| Northwest | 1,496,045 | 0.1609 | 486,202 | 0.1350 | 0.8390 | 0.0916 | ||||||
| West | 1,494,806 | 0.1608 | 585,377 | 0.1626 | 1.0110 | 0.1104 | ||||||
| Southwest | 868,520 | 0.0934 | 490,913 | 0.1363 | 1.4592 | 0.1593 | ||||||
| South | 859,346 | 0.0924 | 544,467 | 0.1512 | 1.6356 | 0.1785 | ||||||
| Southeast | 658,270 | 0.0708 | 392,483 | 0.1090 | 1.5392 | 0.1680 | ||||||
| East | 600,005 | 0.0645 | 331,242 | 0.0920 | 1.4252 | 0.1556 | ||||||
| Northeast | 1,369,846 | 0.1474 | 413,805 | 0.1149 | 0.7798 | 0.0851 | ||||||
| Slope (°) | 0–5 | 184,216 | 0.0198 | 13,636 | 0.0038 | 0.1911 | 0.0147 | 0.0714 | 3.6574 | 3.807 | 0.0394 | 0.0028 |
| 5–10 | 470,087 | 0.0506 | 58,265 | 0.0162 | 0.3200 | 0.0245 | ||||||
| 10–15 | 654,799 | 0.0704 | 122,976 | 0.0342 | 0.4848 | 0.0372 | ||||||
| 15–20 | 959,512 | 0.1032 | 257,110 | 0.0714 | 0.6918 | 0.0530 | ||||||
| 20–25 | 1,340,590 | 0.1442 | 425,210 | 0.1181 | 0.8188 | 0.0628 | ||||||
| 25–30 | 1,483,401 | 0.1596 | 578,930 | 0.1608 | 1.0075 | 0.0773 | ||||||
| 30–35 | 1,380,507 | 0.1485 | 654,551 | 0.1818 | 1.2240 | 0.0939 | ||||||
| 35–40 | 1,184,390 | 0.1274 | 640,419 | 0.1779 | 1.3959 | 0.1070 | ||||||
| 40–45 | 783,973 | 0.0843 | 424,962 | 0.1180 | 1.3994 | 0.1073 | ||||||
| 45–50 | 428,929 | 0.0461 | 222,894 | 0.0619 | 1.3415 | 0.1029 | ||||||
| 50–55 | 233,308 | 0.0251 | 123,224 | 0.0342 | 1.3635 | 0.1046 | ||||||
| 55–60 | 109,836 | 0.0118 | 49,587 | 0.0138 | 1.1655 | 0.0894 | ||||||
| 60–65 | 69,918 | 0.0075 | 25,785 | 0.0072 | 0.9521 | 0.0730 | ||||||
| 65–75 | 12,149 | 0.0013 | 3223 | 0.0009 | 0.6849 | 0.0525 | ||||||
| GSTA (°) | < –4 | 1,530,600 | 0.1646 | 100,500 | 0.0301 | 0.1831 | 0.0250 | 0.1667 | 2.2061 | 2.585 | 0.1466 | 0.0244 |
| –4 - –2 | 2,846,700 | 0.3061 | 225,300 | 0.0676 | 0.2207 | 0.0301 | ||||||
| –2 - 0 | 1,400,700 | 0.1506 | 503,700 | 0.1510 | 1.0027 | 0.1369 | ||||||
| 0 - 2 | 887,100 | 0.0954 | 590,700 | 0.1771 | 1.8567 | 0.2535 | ||||||
| 2 - 4 | 734,100 | 0.0789 | 537,300 | 0.1611 | 2.0409 | 0.2786 | ||||||
| 4< | 1,899,600 | 0.2043 | 1,377,300 | 0.4130 | 2.0217 | 0.2760 |
Table 2.
The relative importance of the criteria.
| Criteria | Relative Importance |
|---|---|
| GSTA | 0.49 |
| Direction | 0.26 |
| Elevation | 0.12 |
| Aspect | 0.08 |
| Slope | 0.06 |
Table 3.
The percentages of overlap between the vulnerability map and the actual melting areas for different periods.
Table 3.
The percentages of overlap between the vulnerability map and the actual melting areas for different periods.
| Periods | Melting Area (m2) | Overlap Area (m2) | Overlap % |
|---|---|---|---|
| 1987–1989 | 1571 | 1223 | 77.8 |
| 1987–1998 | 1117 | 780 | 69.8 |
| 1987–2013 | 2744 | 2401 | 87.5 |
| 1987–2015 | 3223 | 2969 | 92.1 |
© 2020 by the author. Licensee MDPI, Basel, Switzerland. This article is an open access article distributed under the terms and conditions of the Creative Commons Attribution (CC BY) license (http://creativecommons.org/licenses/by/4.0/).
Share and Cite
MDPI and ACS Style
Yalcin, M. A GIS-Based Multi-Criteria Decision Analysis Model for Determining Glacier Vulnerability. ISPRS Int. J. Geo-Inf. 2020, 9, 180. https://0-doi-org.brum.beds.ac.uk/10.3390/ijgi9030180
AMA Style
Yalcin M. A GIS-Based Multi-Criteria Decision Analysis Model for Determining Glacier Vulnerability. ISPRS International Journal of Geo-Information. 2020; 9(3):180. https://0-doi-org.brum.beds.ac.uk/10.3390/ijgi9030180
Chicago/Turabian StyleYalcin, Mustafa. 2020. "A GIS-Based Multi-Criteria Decision Analysis Model for Determining Glacier Vulnerability" ISPRS International Journal of Geo-Information 9, no. 3: 180. https://0-doi-org.brum.beds.ac.uk/10.3390/ijgi9030180
Note that from the first issue of 2016, this journal uses article numbers instead of page numbers. See further details here.