1. Introduction
In the last decade, there has been a growing awareness that the involvement of citizens in decision making has an immediate and positive impact on actions to be taken, as they are the only owners of deep knowledge about the place where they live. Indeed, citizens can play the role of observers geographically distributed on the ground and can provide for timeliness of data through direct participation, thus increasing the reliability of the derived information and allowing operating on the territory in an efficient and effective way. Moreover, as stated in [
1], humans themselves represent a sensor network (of more than 6 billion of components), thanks to their capability of interpreting what they capture by their senses. By collecting, visualizing and geolocating information through smartphones and the Internet, they support decision makers creating sharable spatio-temporal databases about territorial objects and phenomena and help domain experts interpret territorial dynamics by improving processes of both descriptive and diagnostic analysis. This is a founding approach for experts and represents the basis from which every action on a territory should start.
Despite this awareness, however, existing methods and tools conceived to support general-purposes monitoring tasks are not satisfactory, yet. They face, indeed, each issue from a unique perspective and, although they are innovative, they may be limited by the lack of a real involvement of ultimate users by experts and decision makers during the design phase.
The research direction that we are currently following at the Laboratory of Geographic Information Systems (LabGIS) of the Department of Computer Science (University of Salerno) is to identify hybrid solutions that let citizens and experts work together to collect and redistribute the information, once properly processed [
2,
3]. In pursuing this goal, we are investigating every single aspect, phase and component that has to do with it, ranging from design and development to methods and tools, from environments to applications, in order to define a multi-faceted system capable to guarantee the expected results for all types of users.
1.1. Research Contribution
The goal of this paper is to describe the citizen-centric approach conceived to build territorial knowledge useful to provide decision makers with a timely and reliable picture of the status of a given territory. Underlying this approach, a visual representation of geospatial knowledge is defined, which summaries context-sensitive information about a territory and its citizens. This representation, named geometaphor, visually expresses an object or a phenomenon as a set of descriptive, graphical and spatial properties that can be used to support monitoring and decision-making activities in a spatially enabled territory. Moreover, geometaphors are designed to present results from data aggregation methods before invoking information visualization techniques on maps. This solution is extremely useful when large volumes of citizen supplied data are available that require big data manipulation algorithms to efficiently and quickly produce territorial knowledge [
4,
5,
6,
7].
In order to prove the feasibility of this approach, a spatial decision support system, SAFE (SAfety for Families in Emergency), has been developed. A fundamental feature of the whole system is the “dynamism of data”, meant as a continuous updating of knowledge chunks to build reliable dynamic scenarios. To this aim, SAFE embeds a visual environment aimed at professionals and experts, and a mobile application mainly addressed to support citizens in their daily activities. In particular, expert users and decision makers can be supported in their daily and extraordinary tasks through a collaborative Web environment where several functionalities are provided for land monitoring and event management tasks. End users, citizens and professionals can instead participate by using mobile applications that are intended to support their
prosumerism and facilitate the interaction aimed at providing data (the user as a producer) and acquire information (the user as a consumer) [
8]. Together, these innovative tools enable various geo-social processes, which in general allow increasing knowledge about a territory.
Besides a general-purpose monitoring activity, SAFE has been conceived to improve certified procedures, which may benefit from user-generated contents deriving from existing intelligent community networks. This feature makes SAFE especially suitable to handle emergency procedures that can be activated in case of an event, both planned and extraordinary. In these cases, most of the tasks in charge of public administrations can be facilitated and automated, such as the identification of risks on a territory and the planning of needs according to them. Then, the involvement of citizens through the mobile application becomes crucial since the timely communication of any relevant local information about an event allows decision makers to improve the distribution of the available resources.
1.2. Integrating Social Activism and Certified Procedures: The Civil Protection 2.0 scenario
The primary focus of SAFE is its establishment as a geo-social service where citizens play a primary role in evolving scenarios that concern them. Indeed, besides the role played by experts and professionals, citizens’ involvement is extremely important. The reason is twofold. Engaging citizens in a decision-making process implies to build more efficient solutions because they can contribute to the requirement analysis as active stakeholders, thus drawing attention on real needs. Moreover, if citizens can contribute to the development of a solution its adoption will be more convincing. These assumptions mean that citizens can acquire awareness about territory and its phenomena and produce collective intelligence.
The rationale behind such an approach is the concept of social activism entrusted by public responsibility. There exists a model known as ‘activist mapping’, which is the combination of social activism, citizen journalism and geospatial information. It was first used in Ushaidi, to collect and disseminate on a Google map the eye-witness accounts of violence which occurred in Kenya in 2007 [
2].
A domain where this approach is proving successful relates to the civil protection field, which represents a public sector where the integration of social activism and certified data can contribute to the enhancement of its efficacy.
In general, when an event occurs that requires civil protection actions, specific scenarios can be invoked. Some of them result from activities carried out in preparation steps, such as the identification of the risks of a territory, the census of available resources, the planning of the needs according to the risks, the dissemination of the emergency plan to citizens. Others are consequences of evolving scenarios and require a monitoring and decision support system, meant, for example, to activate alert or rescue procedures. The procedures that characterize the above scenarios can be activated and performed by different typologies of users, each operating through a given type of application.
Section 5 describes the model underlying SAFE and exemplifies how different categories of users can invoke its functionalities according to the role they play in an emergency scenario. Here, SAFE adopts a paradigm that aims to put civil protection activities [
8] into practice thanks to the use of new methods and tools, including ICT-based solutions. The basic idea is to converge the amount of data managed in the civil protection field on a cloud platform to allow a correct and perfect exchange of data and information. The research in this context has been stimulated by the initial awareness that although each municipality is required to draw up and manage an emergency plan for the possible risks associated with its territory, many of them are defaulting, for varying reasons. Lack of funds to be allocated, lack of expertise in this field, and the lack of a continuous monitoring of resources and information, are only some possible causes. The first goal addressed by the current research is to optimize the available resources management and guarantee the correct involvement and coordination of the actors present in the various procedures implementing the municipal plan. A high-quality standard also has to be guaranteed in order to avoid duplications, inconsistencies, incompleteness and unreliability.
Once such a result has been achieved, the goal is to offer a set of features that every day, 24 hours a day, makes citizens participate to the execution and management of the procedures. To this aim, SAFE provides users with a set of functions, which, by sharing both simple data and territorial knowledge support complex monitoring and risk management tasks.
The remainder of the paper is organized as follows.
Section 2 describes materials and methods applied during the design of SAFE. In
Section 3, the model underlying SAFE, the system for territorial service management, is described.
Section 4 depicts how SAFE works when applied to the domain of risk management. Some discussions and conclusions are drawn in
Section 5.
2. Materials and Methods
Several best practices for citizens’ involvement can be found in the literature, which spread in diverse domains, from Volunteered Geographic Information (VGI) examples in the field of the early warning [
2] to the more general-purpose Open Government (OG) paradigm, where the three basic principles, namely transparency, participation and collaboration affect both Public Administration (PA) and civil society [
9].
2.1. Geometaphors as Visual Summaries Metodologies
Due to the large volumes of available data, it is necessary to speed up visual analytics of a scenario to achieve efficiently its comprehension and cognition. To this aim, the literature proposes two different approaches, namely an approach with direct representation that uses data aggregation methods and an approach based on summaries built before visualizing data on a map. In this paper, we adopt the concept of
geometaphor as a hybrid visual representation that applies data aggregation methods to build summaries of datasets addressed to help analysts find what is important and answer queries quickly [
10].
The notion of geometaphor was initially introduced in [
11]. It consists of a visual representation of an object or a phenomenon described by a set of descriptive, graphical and spatio-temporal metadata. The need of such a representation arose from the requirement to convey information about a territory to different categories of users in a simple and compact manner.
2.2. GeoBig Data
Geospatial data has been always “big data” [
12]. Through the use of advanced sources, such as Global Positioning Systems (GPS), smartphones, Internet of Things (IoT) [
13], Web 2.0 [
14] and the Copernicus program [
15], massive volumes of this data are collected that contain implicit spatial and temporal components, and semantic interrelations among them, which should be uncovered and made explicit to benefit from them.
Once the ability of data collection is no longer hindered by the progress and innovation, the most important issue is how exploiting this amount of geospatial big data [
16] to obtain value from territorial knowledge. This huge data volume cannot be easily caught, stored, analyzed and managed by conventional hardware, software and database tools, and requires new technical architectures and analytics for producing business value [
13].
In general, systems for collecting and analyzing geospatial big data consist of three layers: geospatial big data integration and management, geospatial big data analytics, and geospatial big data service platforms. Among these, the second layer is often the most complex one, because it is responsible for performing data analytics. It is generally structured into a module for interactive analytics of real-time or dynamic data and a module for batch analytics of static or archived data. Most of well-established architectures embeds a Spatial On-Line Analytical Processing (SOLAP) engine aiming at combining Geographic Information Systems (GIS) and OLAP [
17]. It is a visual platform for analyzing spatio-temporal data through a multi-dimensional mode with aggregation levels. The result is visualized on various kinds of maps, such that a user can easily grasp the result of each operation. GeoMondrian is the first implementation of a true SOLAP server [
18]. Developed as a spatially-enabled version of Pentaho Analysis Services (Mondrian), it is an Open Source SOLAP Server allowing embedding spatial analysis capabilities into analytical queries, thus producing true geo-analytical queries.
Finally, recent solutions have been addressed to benefit from advances made by big data-oriented methods and technologies. Some new approaches are indeed conceived to extend Hadoop for geospatial big data and then to utilize one of its spatial versions as base platform [
19].
3. SAFE: A System for Territorial Services Management
SAFE has been conceived to be used in several domains, ranging from social to institutional, from education to voluntary. It is based on the awareness that the environment and the citizens, both in continuous evolution, are important “data sources”, which constantly provide relevant information for better urban planning. In fact, inferring information on city services usage and citizens’ habits can constitute great help to design smart urban planning actions and to improve city management [
20,
21,
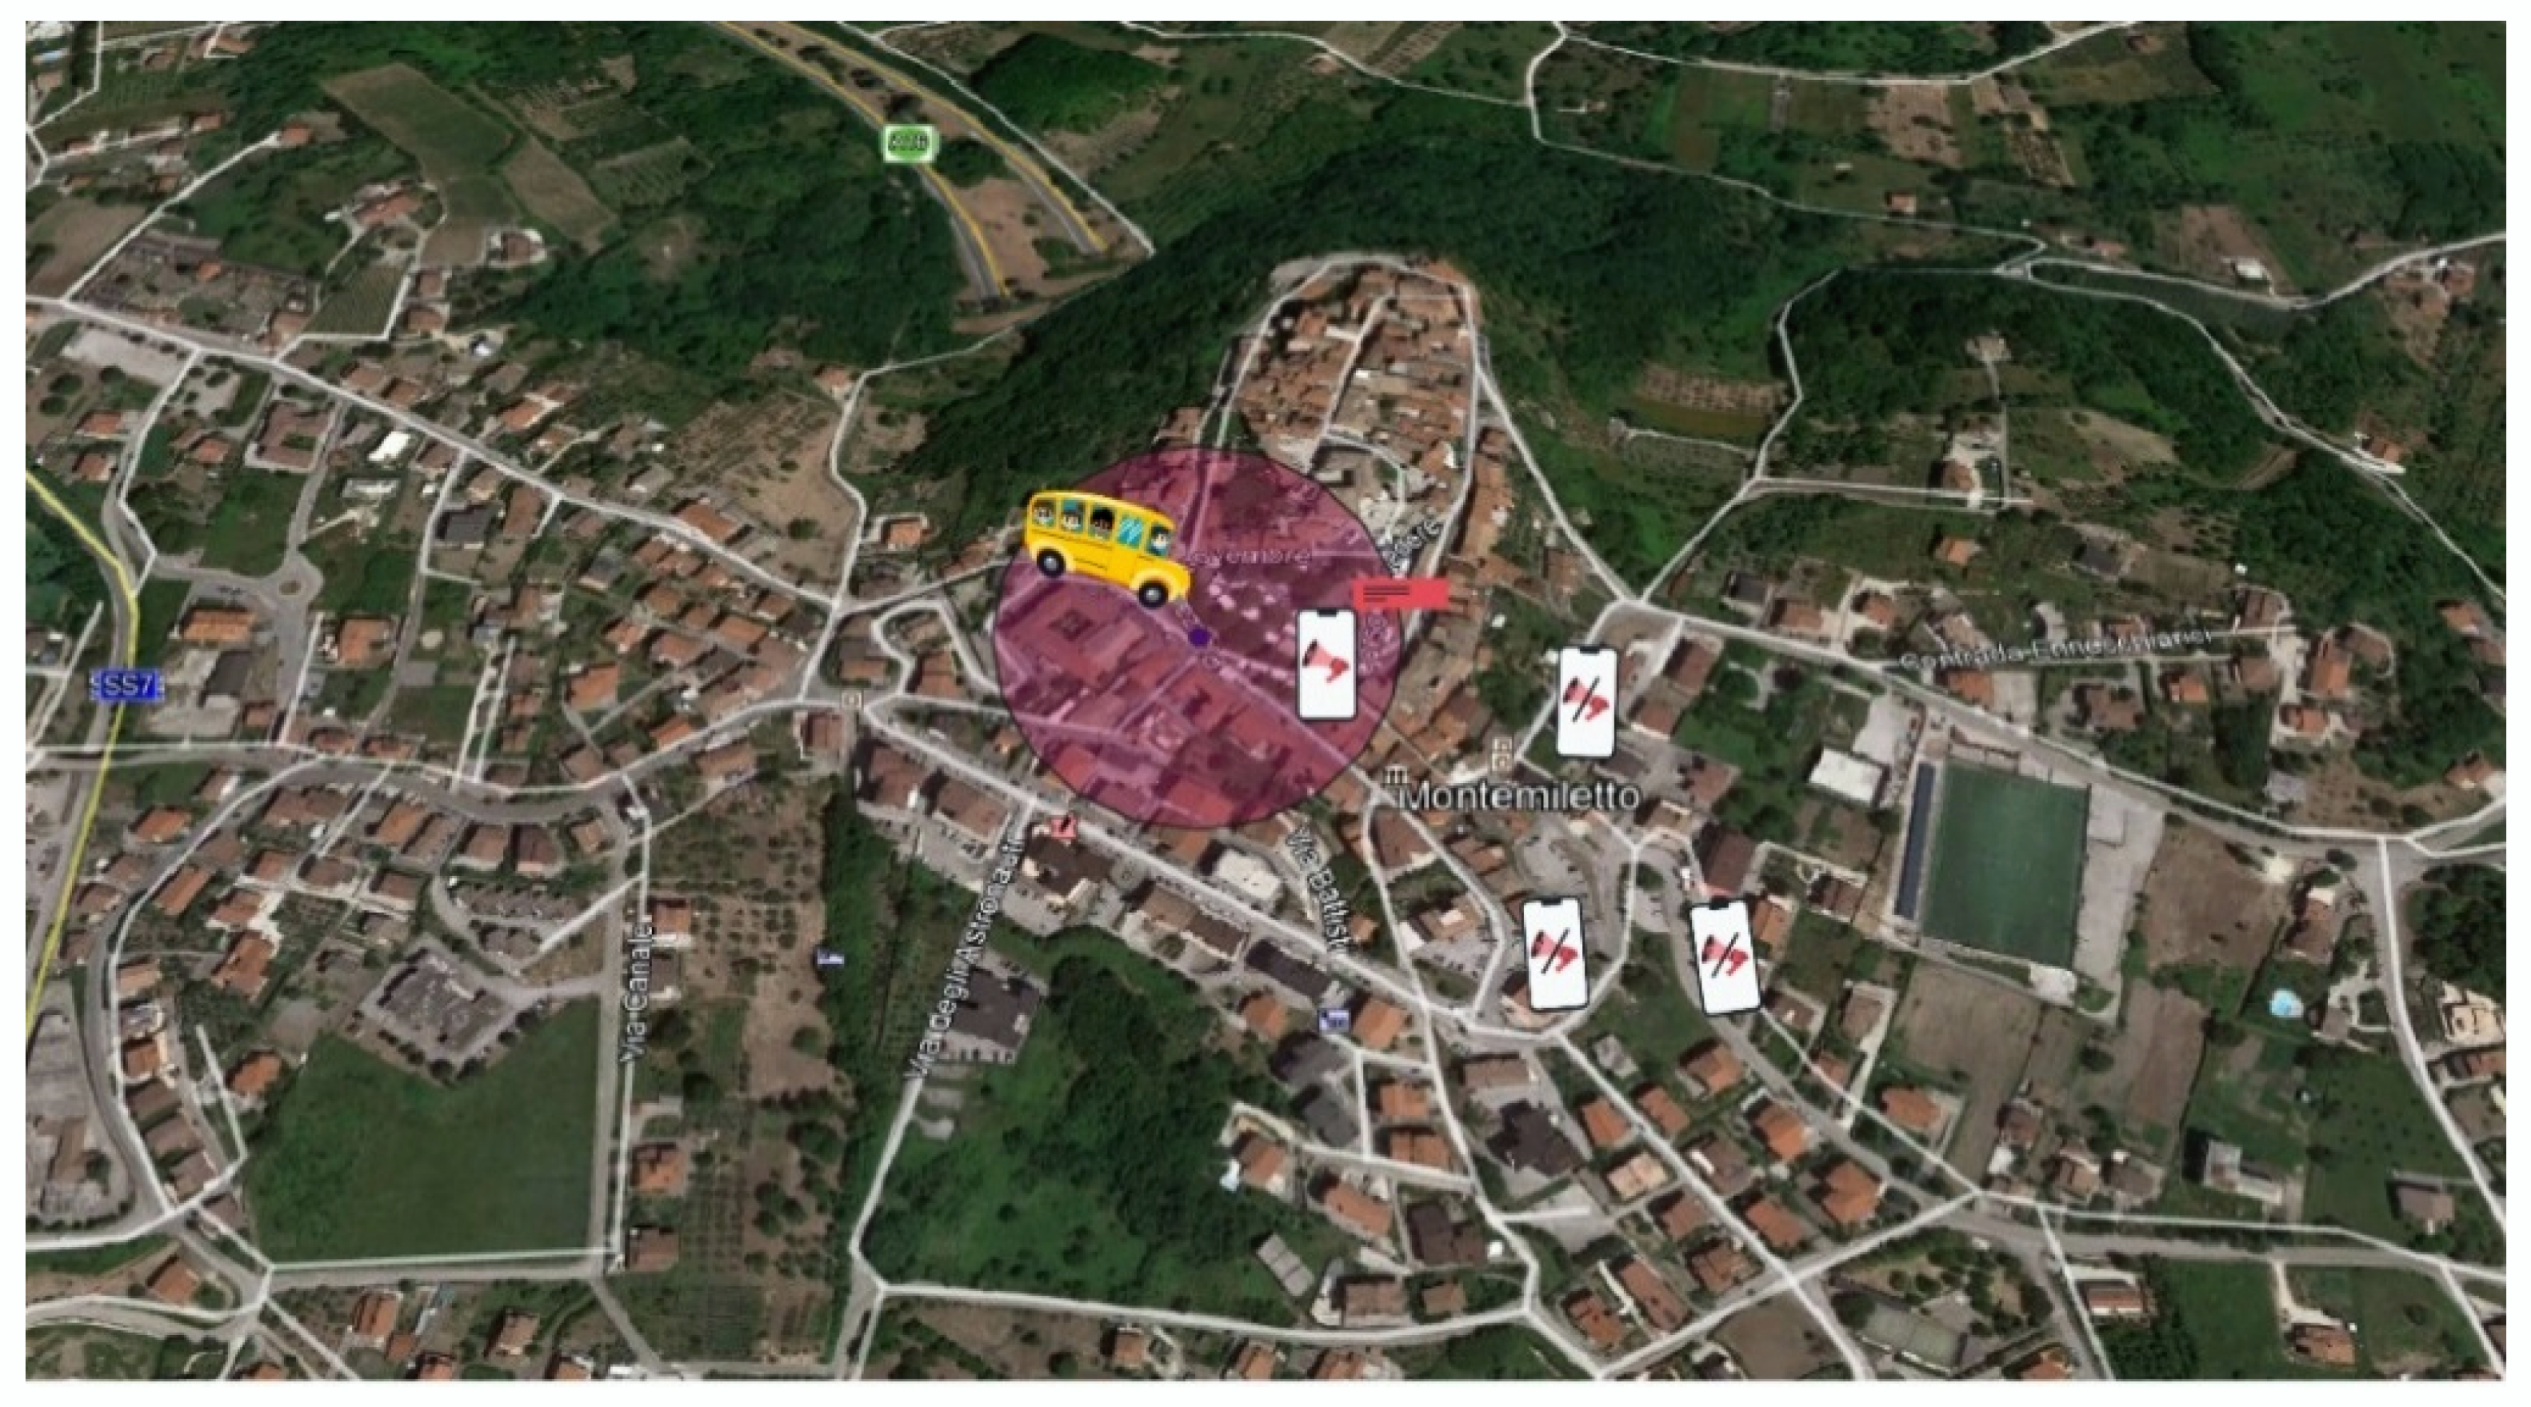
22]. An example is a notification automatically sent to a mother when the school bus is entering in an area at a given distance from her house (
Figure 1). Additionally, a citizen can send an alert to a target office in order to report an environmental problem.
A preliminary version of SAFE was described in [
23] where the primary goal of the project has been to follow the trend of the current research and identify hybrid solutions that let citizens and experts work together to collect and redistribute the information, once properly processed.
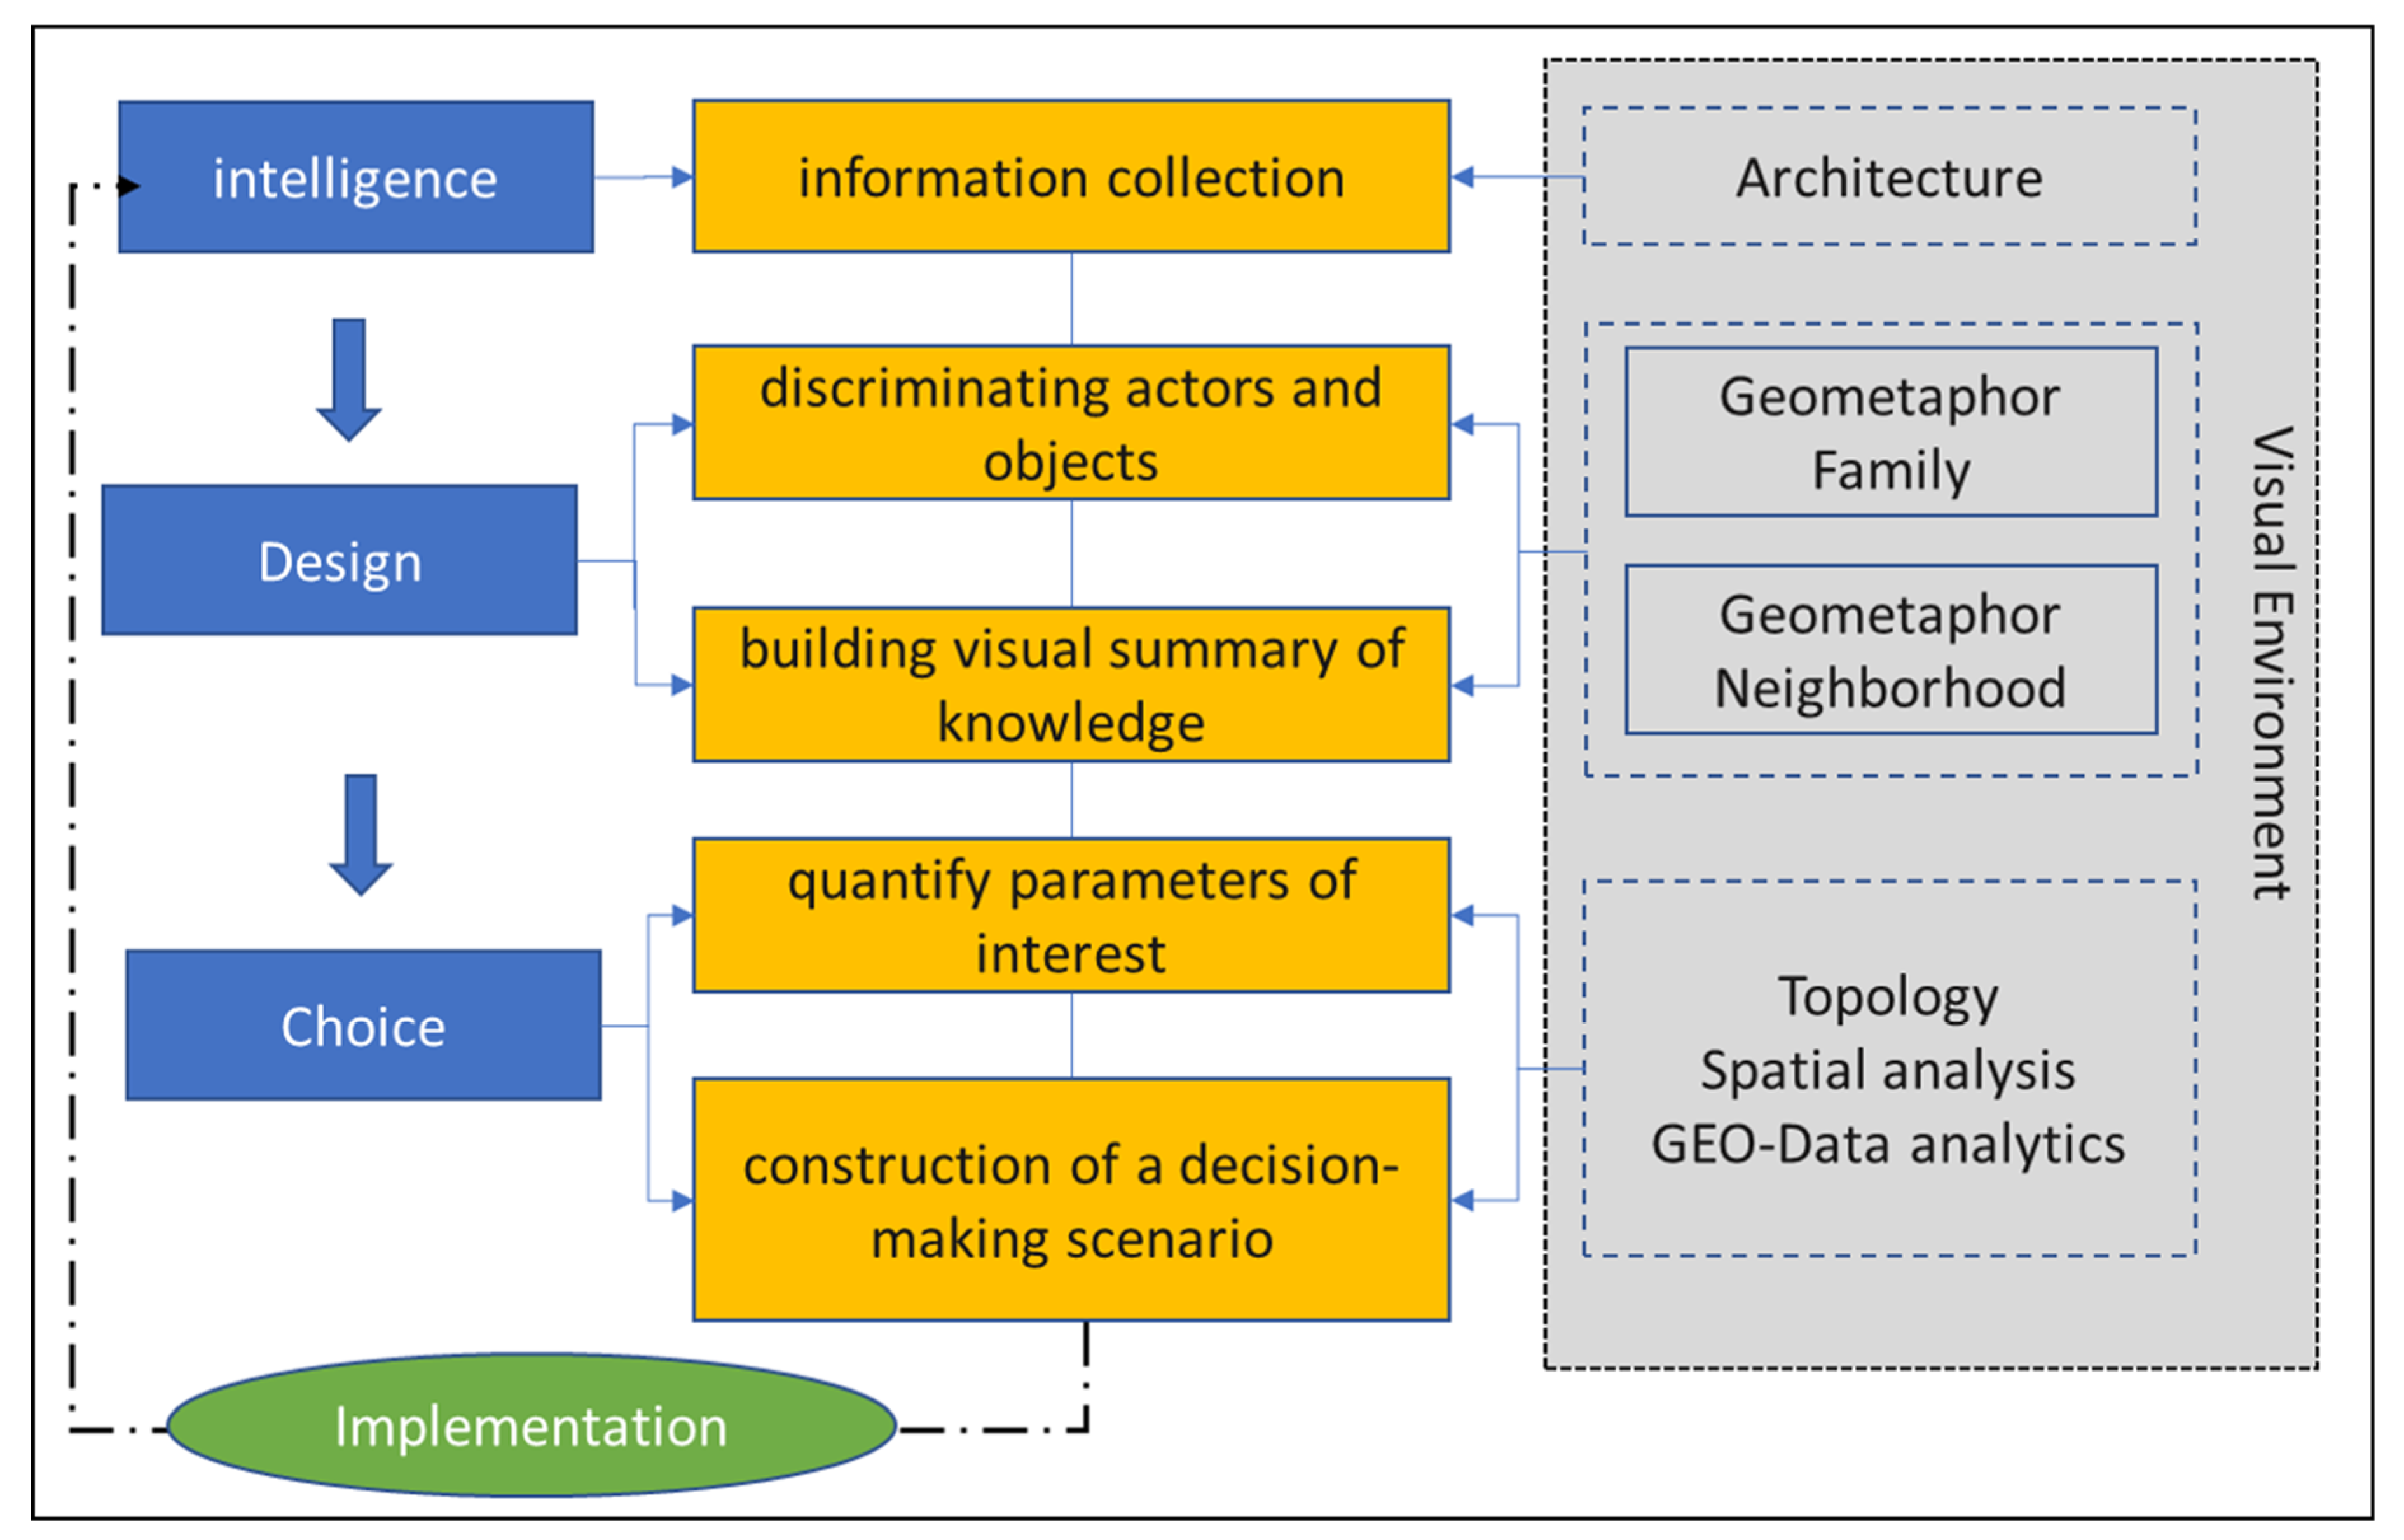
SAFE has been improved to be a support for decision makers to reduce uncertainty in making all decisions, namely daily and strategic. The system provides a process for acquiring, analyzing and visualizing large quantities of data. Specifically, the proposed methodology is based on the schematization of the decision-making process [
24,
25] and consists of three macro-phases (
Figure 2).
Macrophase 1 corresponds to the intelligence phase, that is, the information collection phase where the target problem is identified. The macrophase 2 corresponds to the design phase. It consists in structuring the decision problem through two sub-phases:
1. Discriminating actors and objects involved in a scenario;
2. Building visual summaries of knowledge.
Finally, macrophase 3 corresponds to the choice phase. This macro-phase allows quantifying parameters of interest for the construction of a decision-making scenario to be implemented.
Technological requirements necessary for functional interactions among the above macro-phases can be used as design requirements of the visual environment embedding the system functionality.
3.1. Macrophase 1: Intelligence
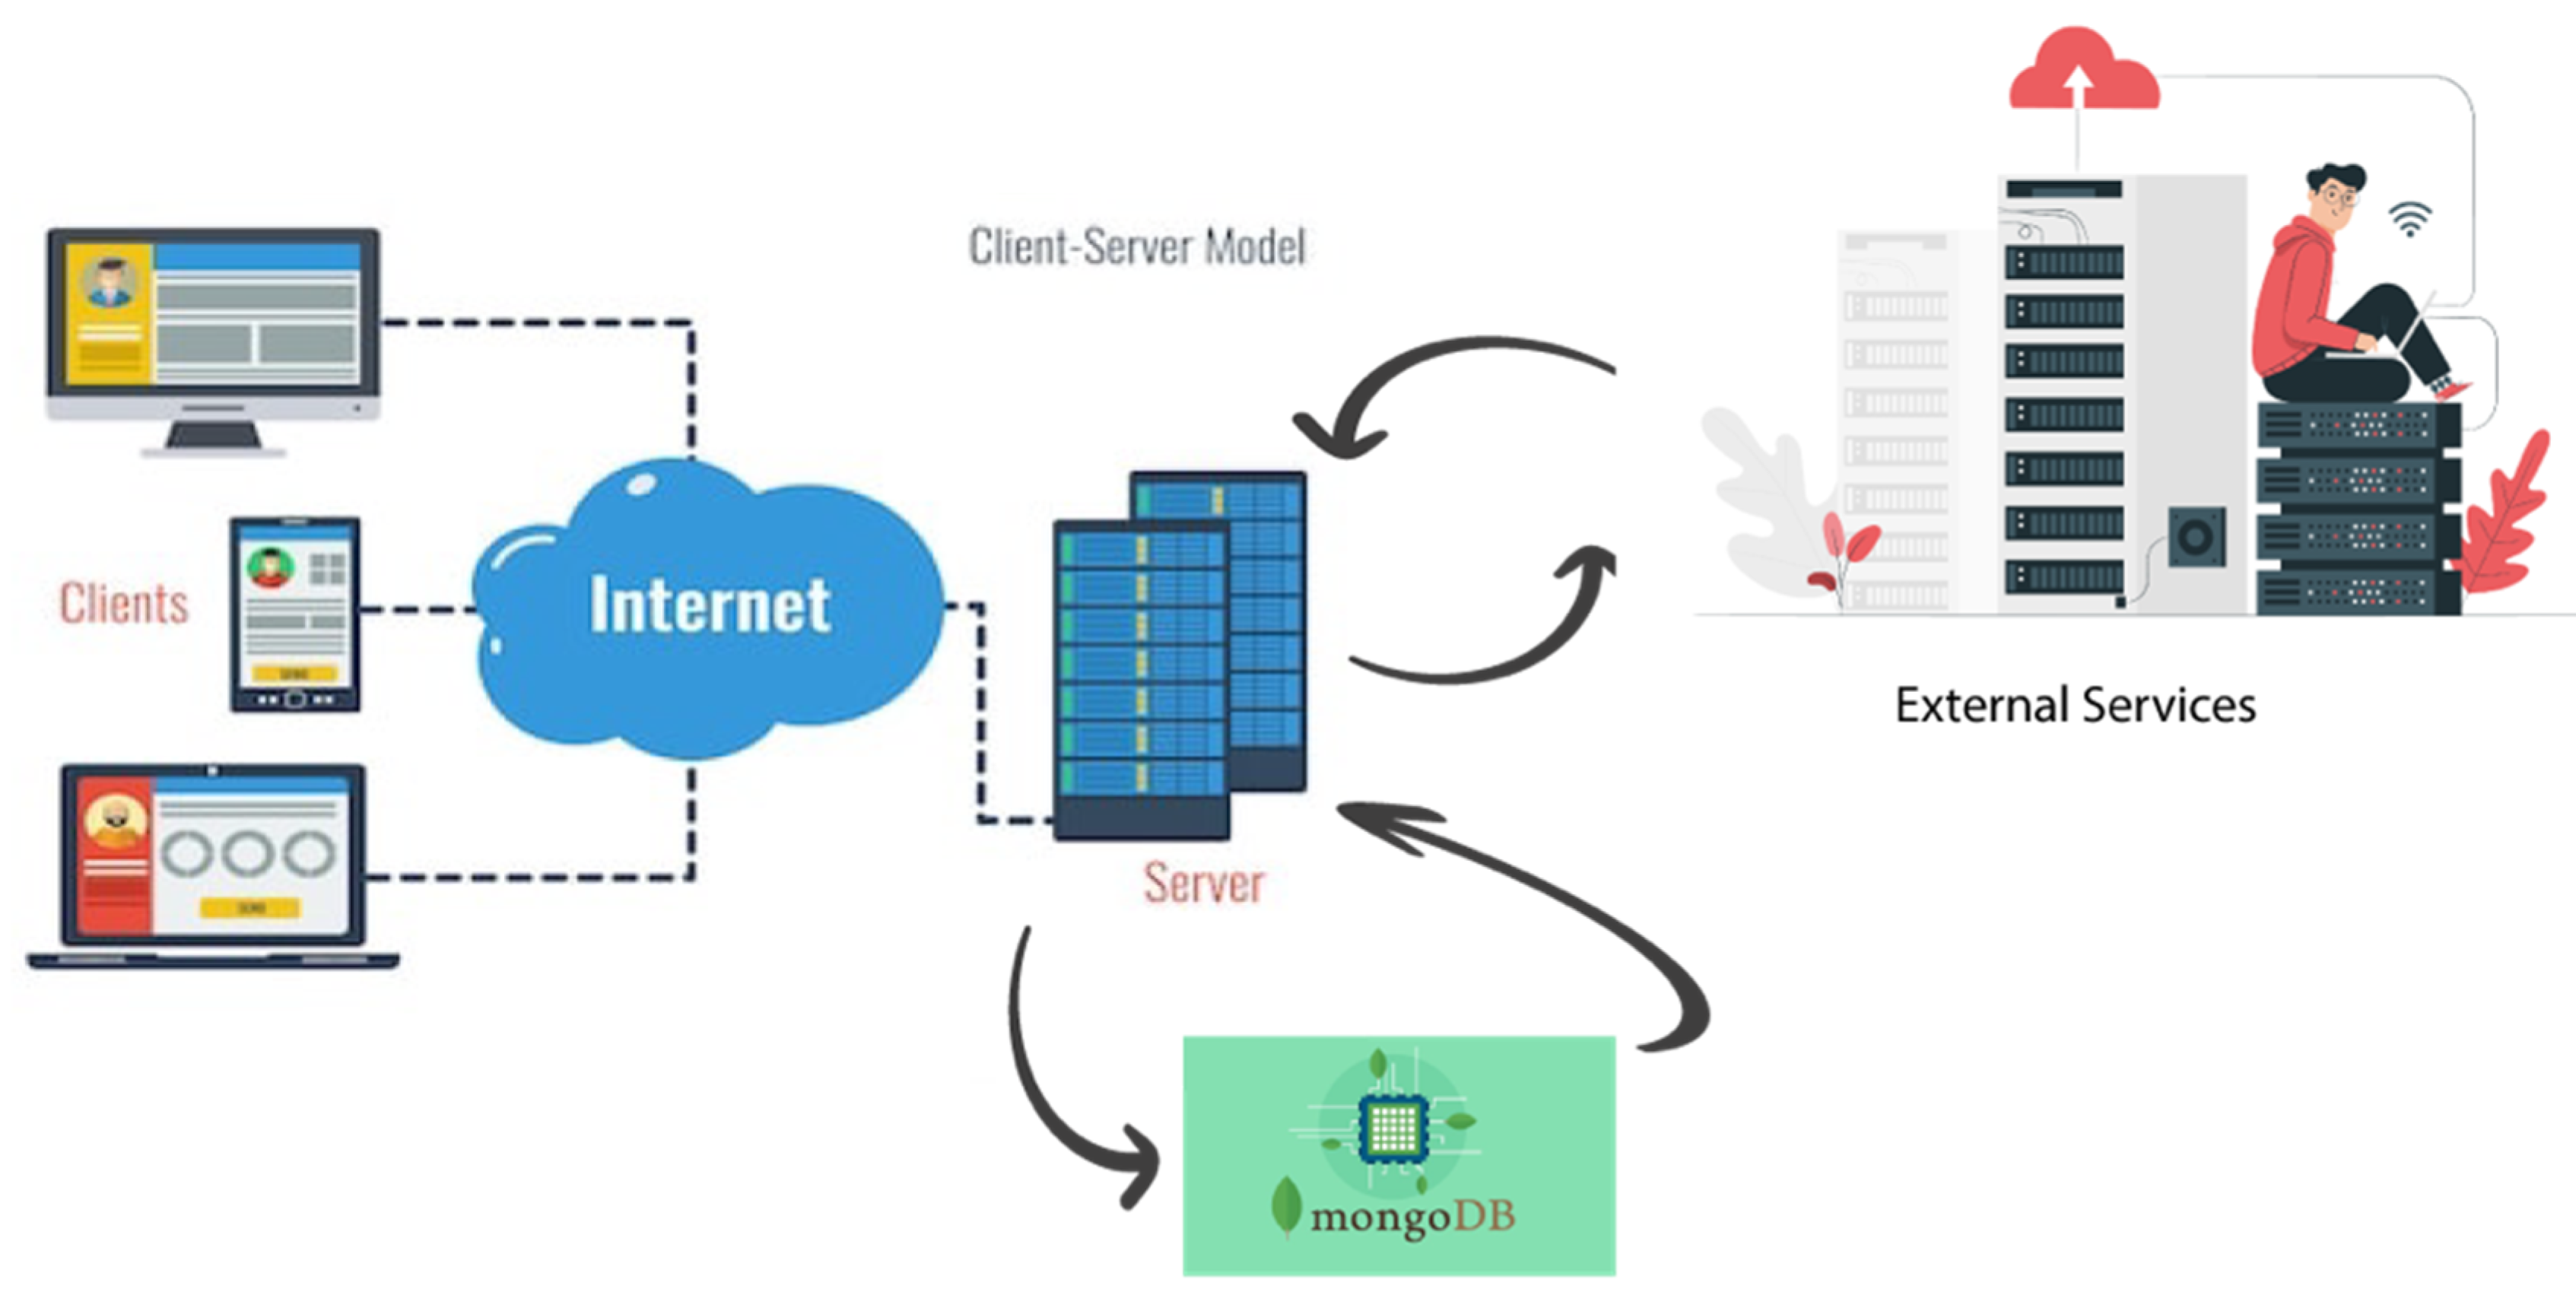
This macro-phase includes the design of the system architecture to satisfy the needs of dynamic information acquisition by the various actors (decision makers and citizens). This macro-phase involves the design of the system architecture to respond to the needs for dynamic acquisition of information by the various actors (decision makers and citizens). The architecture of the underlying system is shown in
Figure 3. It is a conventional client-server model, which consists of a Web application, a mobile application and a MongoDB database. The model has been realized by JSP and Servlet technologies. The server also interacts with external services that can be invoked by the two sets of services previously described. Moreover, some parallel processing of the huge volumes of data are carried out by using the MapReduce framework, the Hadoop component for data processing, conceived to extend it for geospatial big data. Once each part has been processed, the partial results are properly assembled into a unique final result. The opportunity of using web services and cloud platforms allows overcoming issues concerning scalability, big data storage, information privacy and security.
3.2. Macrophase 2: Design
3.2.1. Discriminating Actors and Objects Involved in a Scenario
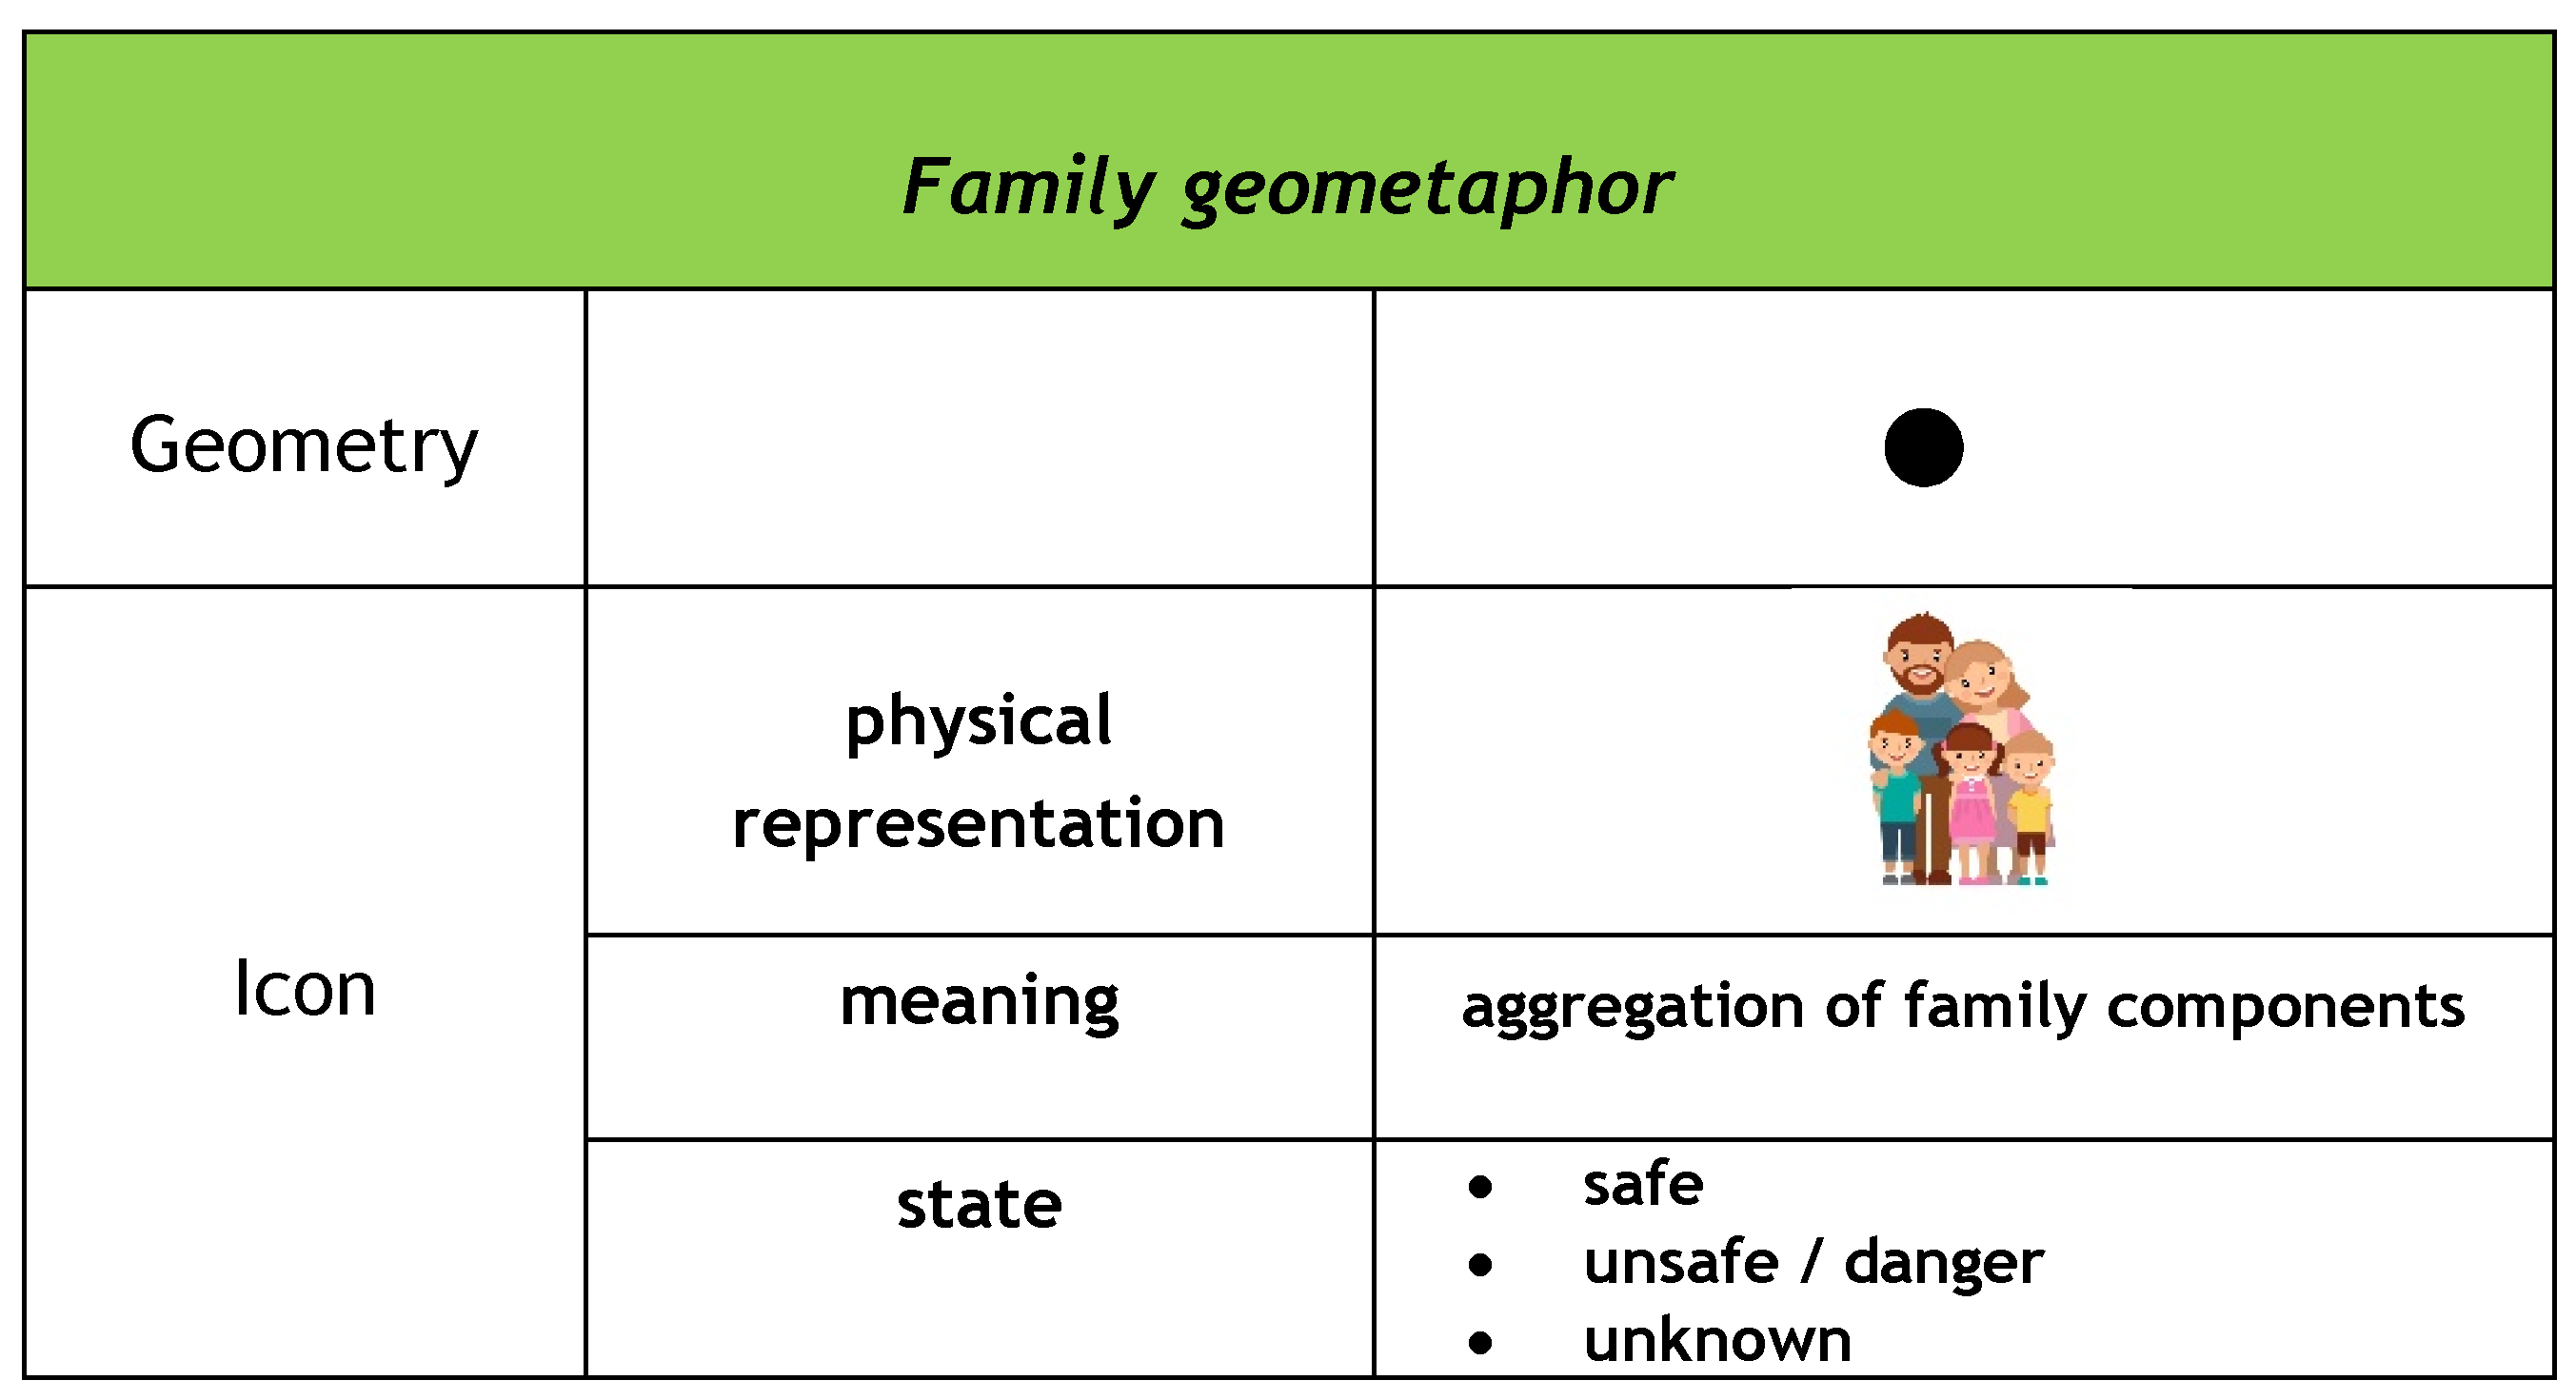
This step is based on a geometaphor associated with the concept of Family. In SAFE, the citizen-centric design and the previous requirements led to the definition of the Family (nucleo familiare) user. A Family is a sociological unit that represents an aggregation of people belonging to the same core from a fiscal, legal and economic point of view, and sharing the same accommodation. The metadata that characterize a Family unit are both quantitative, like the number of components, and qualitative, such as the components expressed as a hierarchy of family ties between them.
Figure 4 displays the geometaphor Family that visually groups components of a family. It consists of a physical component or Geometry, in this case a point, and of a logical component or Icon, expressed as a pair (physical representation and meaning) and a state.
3.2.2. Building Visual Summaries of Knowledge
As part of SAFE, a fundamental requirement concerns the visualization of data referring to a bound space like a map. In this case, the constraint of a precise geographic reference limits the capability of locating aggregated data in the best position in terms of visualization. The usual visualization techniques may in fact prove ineffective for georeferenced data since these are associated with precise coordinates (geographical or Cartesian) and cannot be arranged in different positions even if contained in areas of respect. On the other hand, leaving the atomic data always visible can lead to misinterpretations of a scenario by a decision maker.
It is then necessary to use a technique that allows both to allocate an exact reference for each SAFE user and at the same time to visually aggregate users who are georeferenced in a specified area.
The solution proposed in SAFE is a visual summary technique that allows having, under certain conditions, a visual synthesis of data present on a thematism. The idea combines Shneiderman’s mantra [
26] and Keim’s method [
27]. Shneiderman’s formulation “first overview, zoom and filter, then details on demand” represents a well-known visualization paradigm, which consists in the visualization, during the supervision phase, of all data contained in the dataset to obtain a complete view of the situation that characterizes a domain of interest. This type of visualization lets the user have a global vision of information, ensuring a more accurate management. Keim’s formulation “Analyze First—Show the important” states that it is not appropriate to use only visual and interactive methods for displaying large amounts of data. It is reasonable to first apply a series of computational analyzes and then provide an overview of the information that is relevant to the user. In this way, the user can interact with components that represent the synthesis of data without running the risk of losing data that make up the dataset. By taking into account both paradigms, in SAFE a new geometaphor is introduced that arises as a hybrid solution and adapts to the requirement of georeferencing [
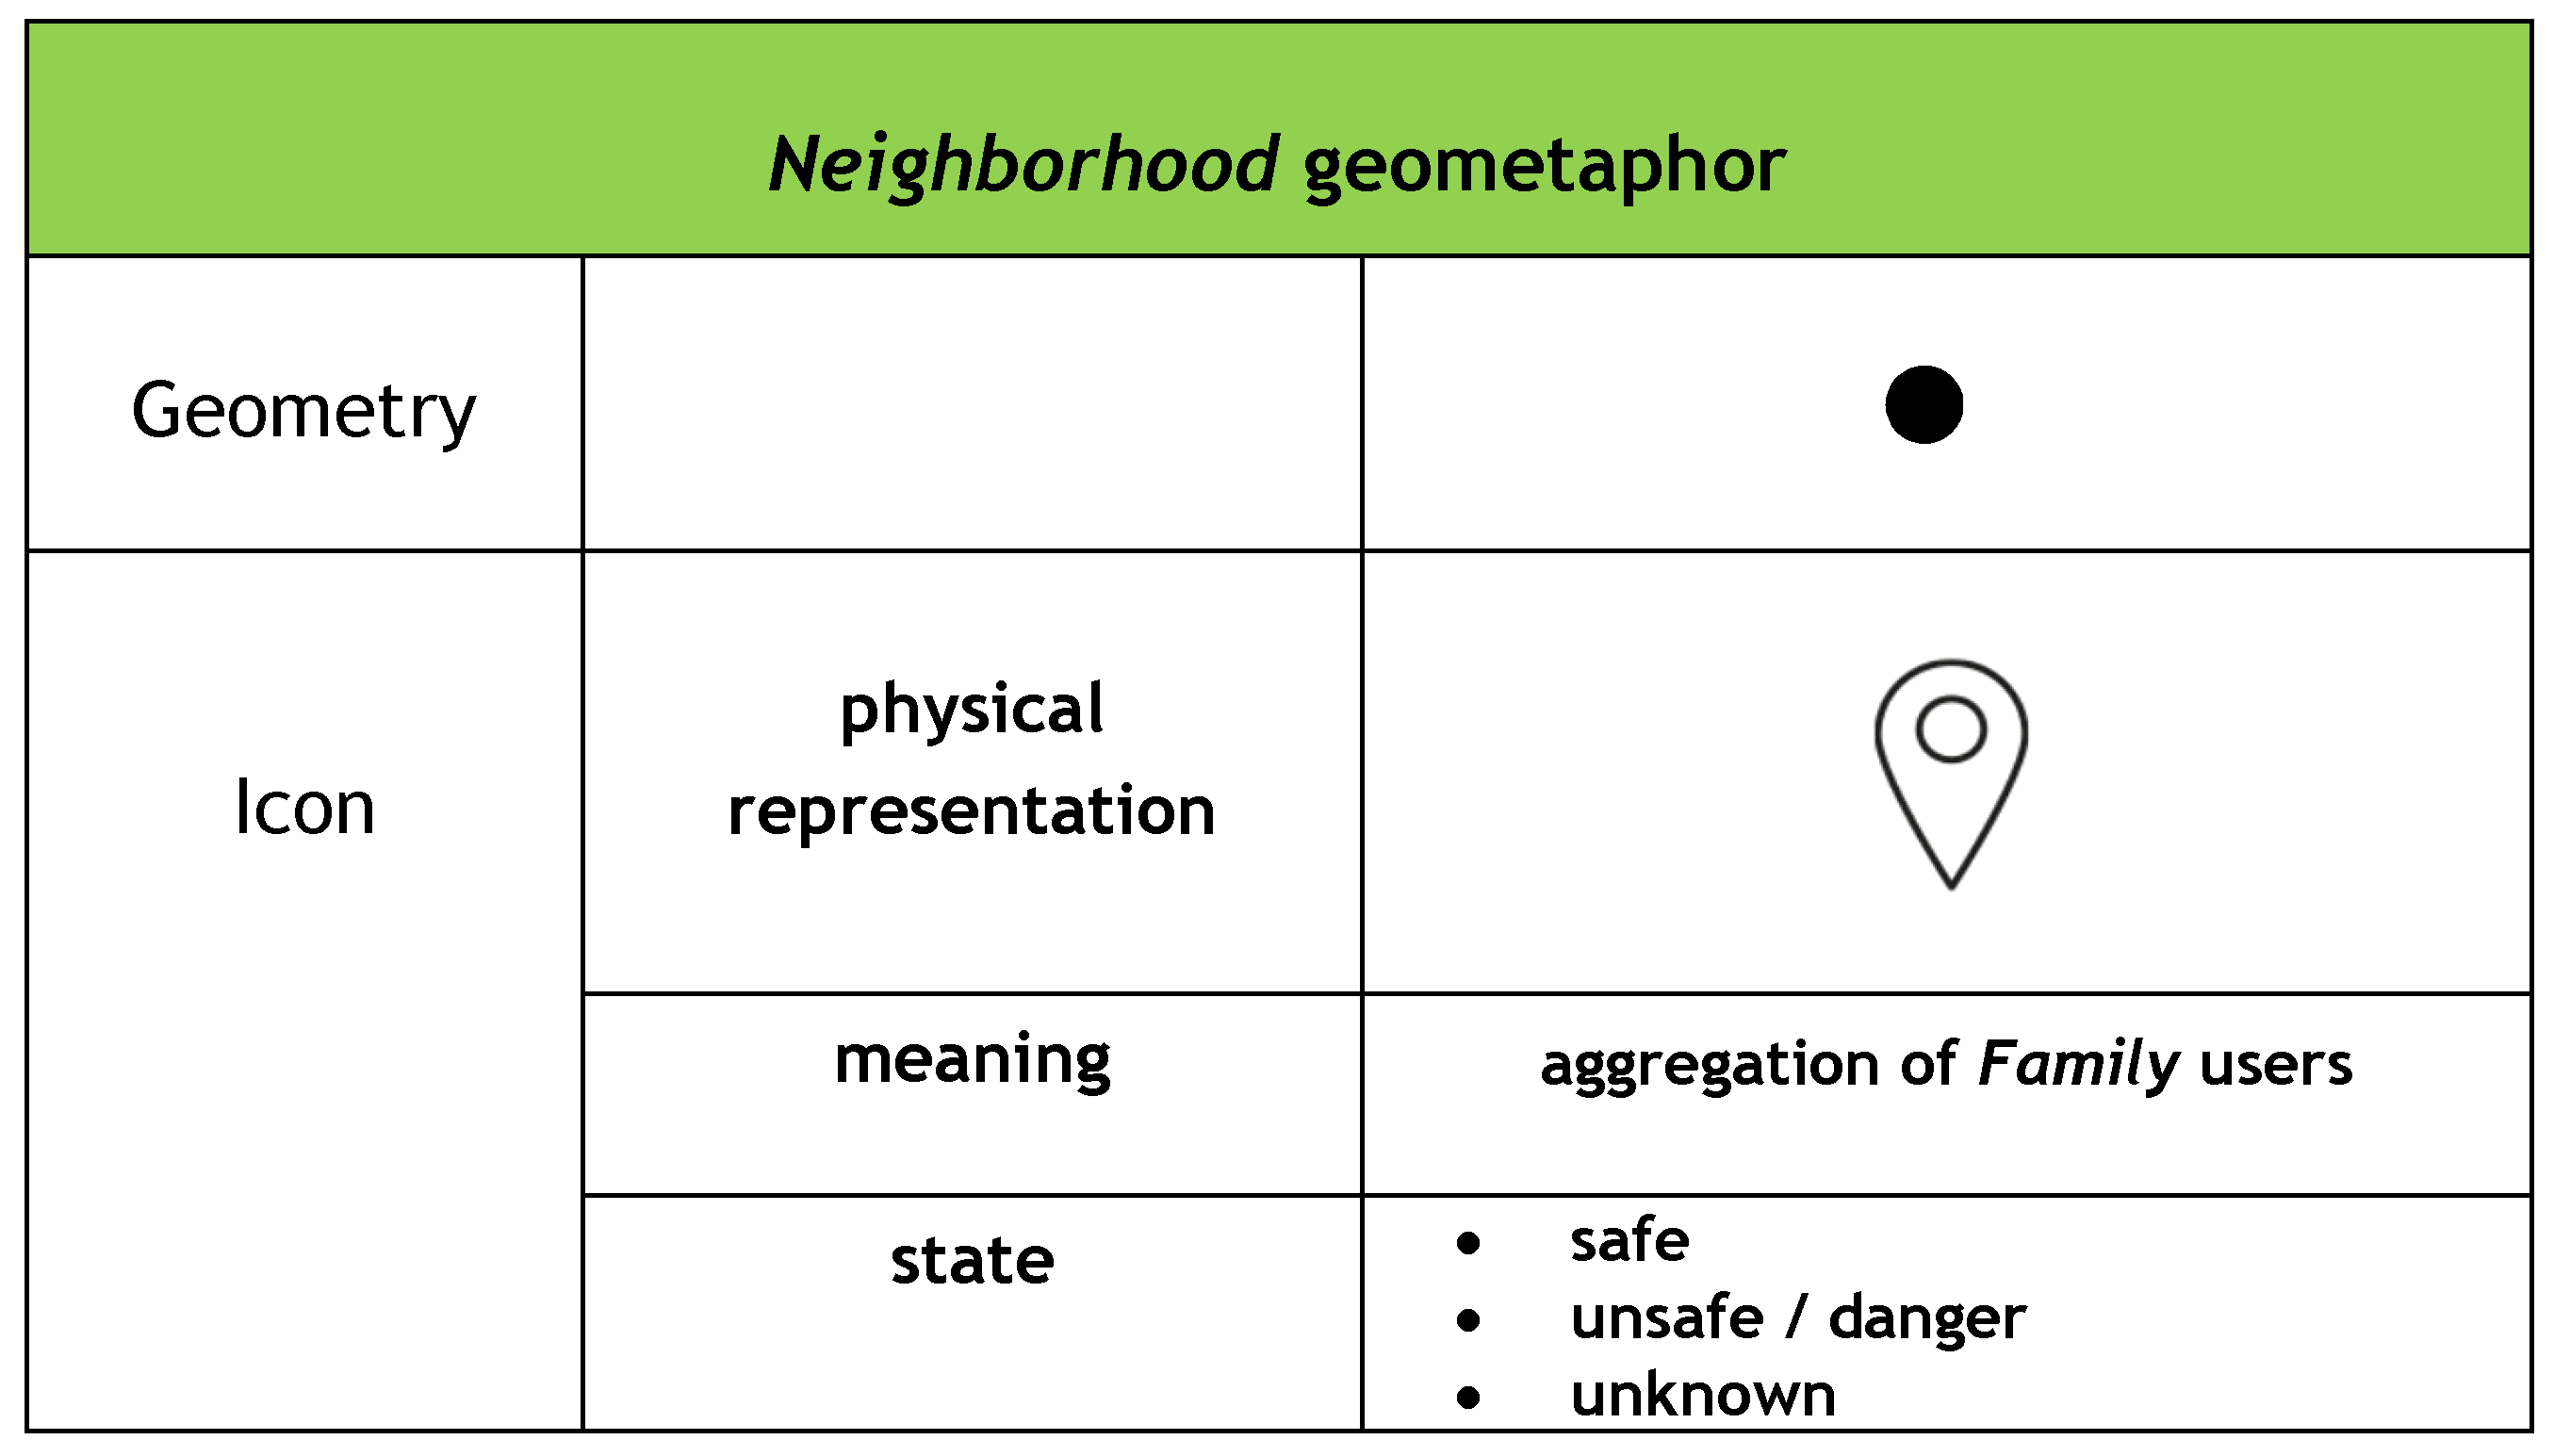
11]. The geometaphor defines the concept of Neighborhood (Vicinato) that visually groups families associated to a given area. This is the case, for example, of families in the same building, hence with the same planimetric coordinates, or families present in an area defined by a buffering threshold.
Figure 5 shows the components of the Neighborhood geometaphor. As in SAFE the Neighborhood geometaphor is associated with a map, the associated icon is represented by a balloon which a user navigating a map is familiar with. Its size implicitly includes the concept of one or more Family users who are located in a unique spatial reference or in an area defined by a specific boundary. To manage the state of this geometaphor, its physical representation can be associated with a different well-defined coloration, which adopts the semaphore metaphor (
Figure 6).
This geometaphor has also a zoom scale associated with it that has an impact on its visual behavior. This mechanism makes the project scalable and capable of handling large amounts of data in a clear and efficient manner.
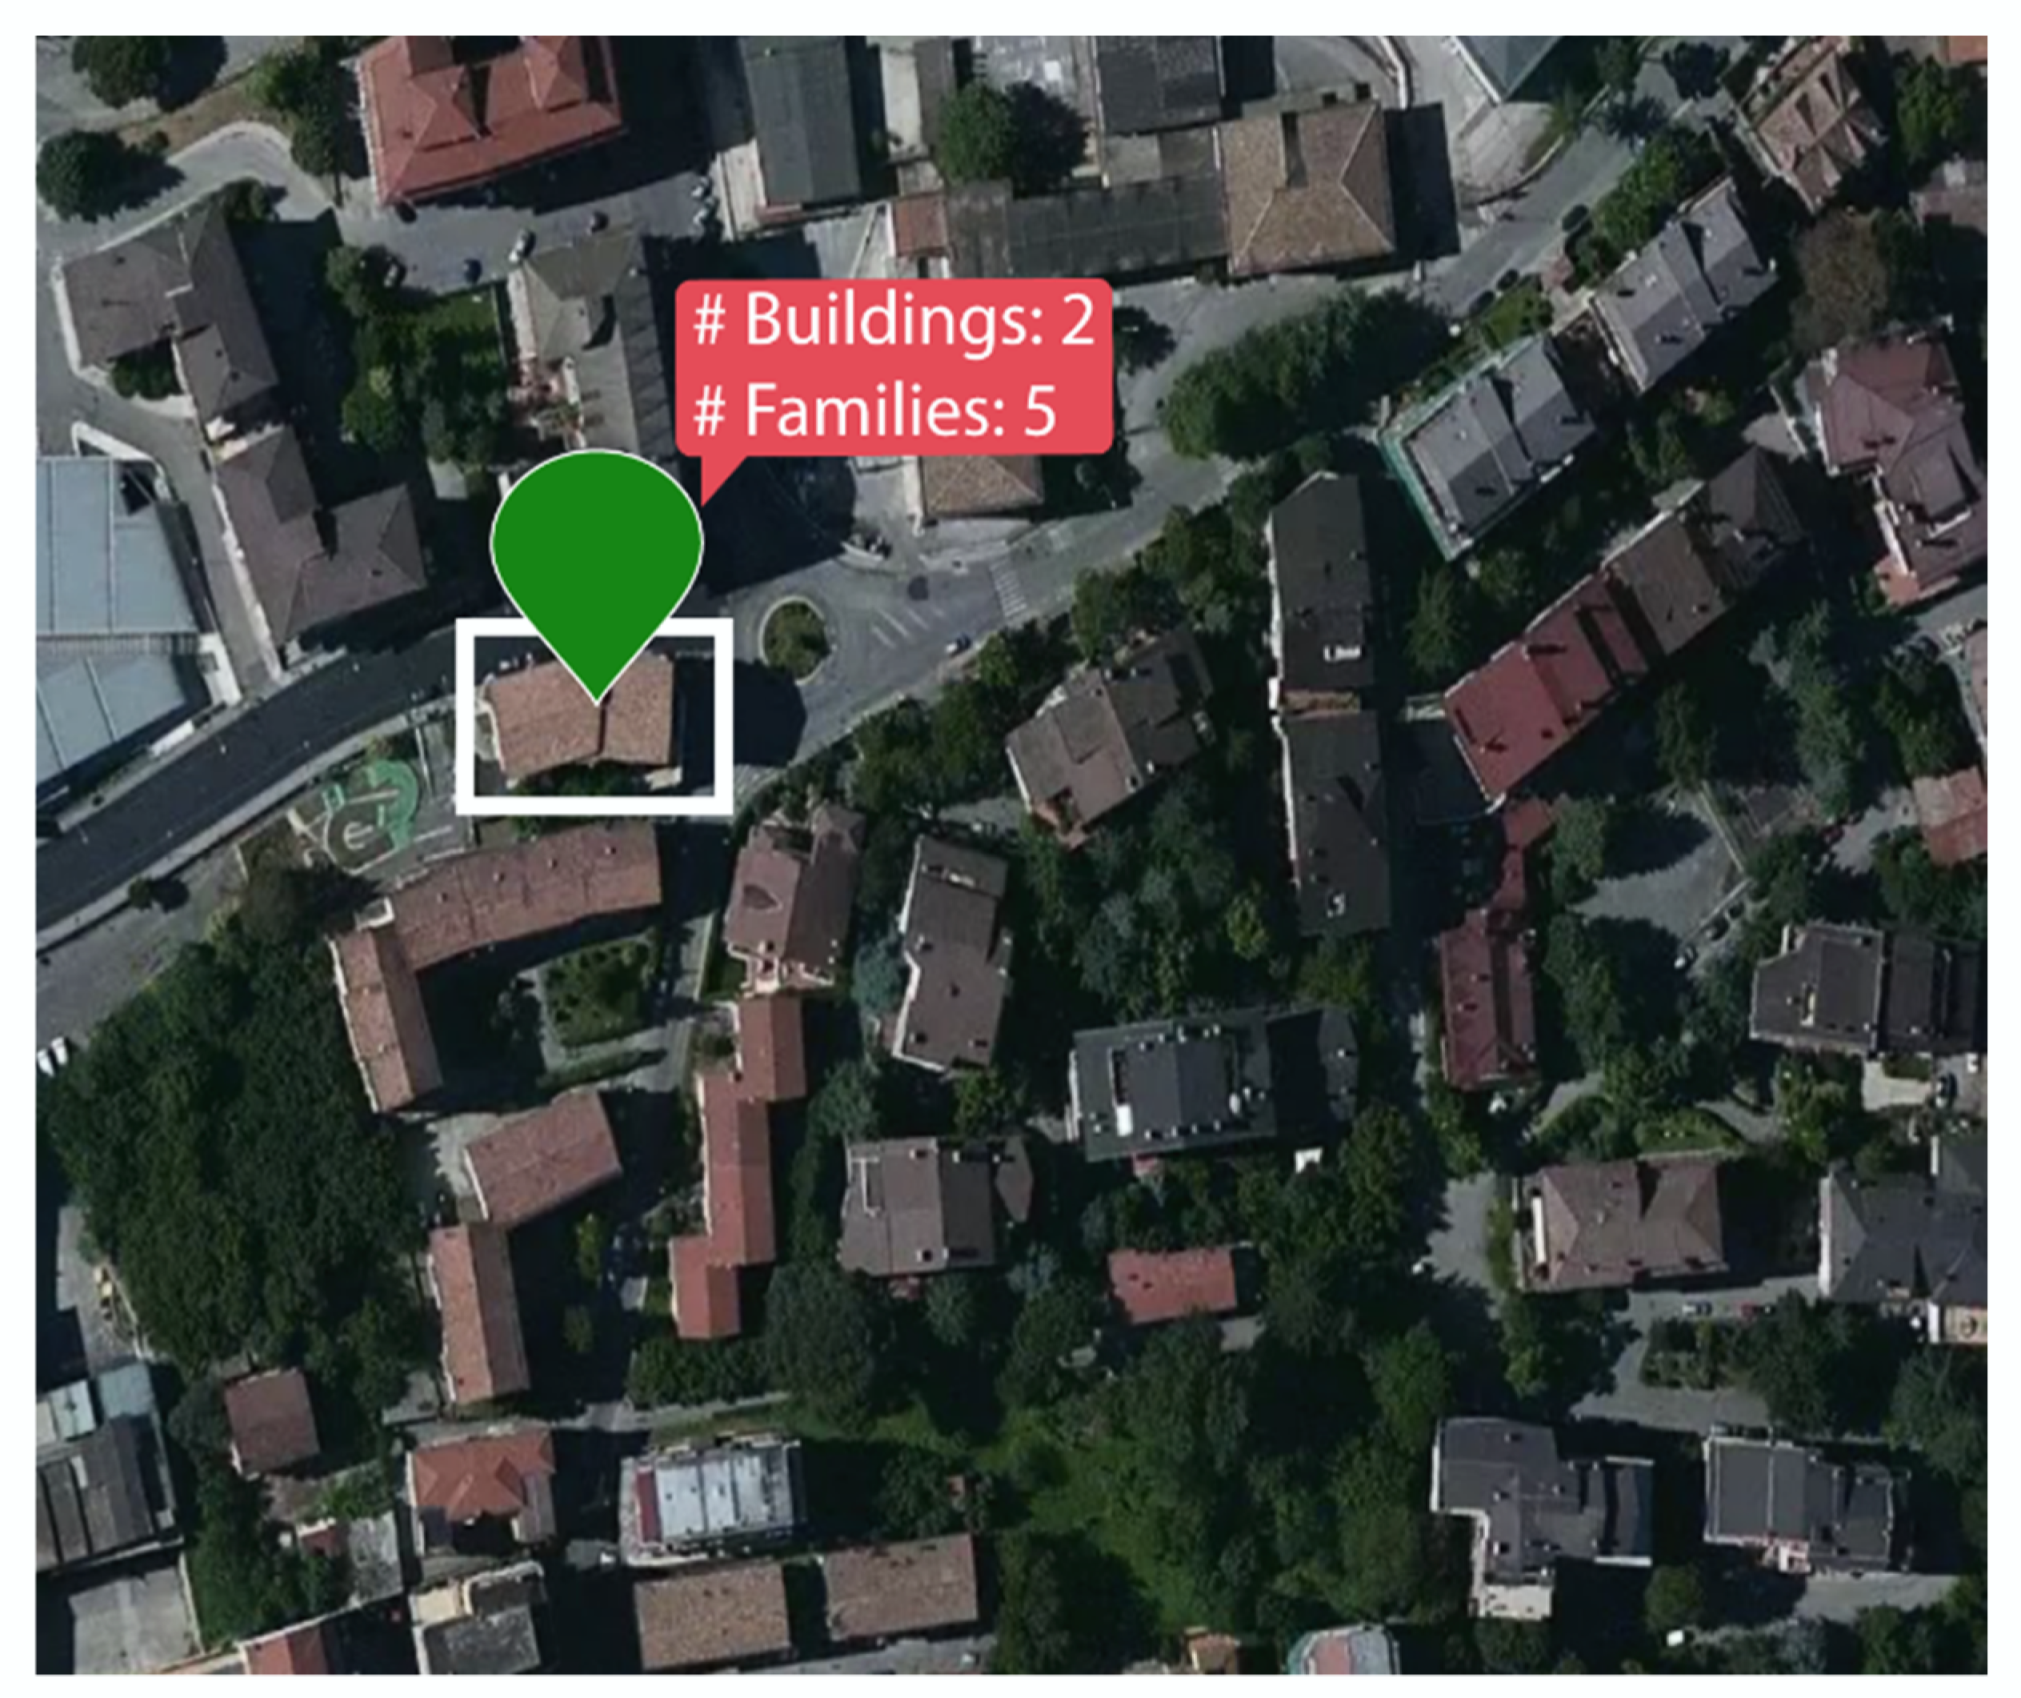
Figure 7,
Figure 8 and
Figure 9 show what happens when different zooming actions are applied to a Neighborhood geometaphor. Initially, an instance is depicted and its metadata values are displayed (
Figure 7), namely the number of buildings belonging to it and the total number of families located in those buildings.
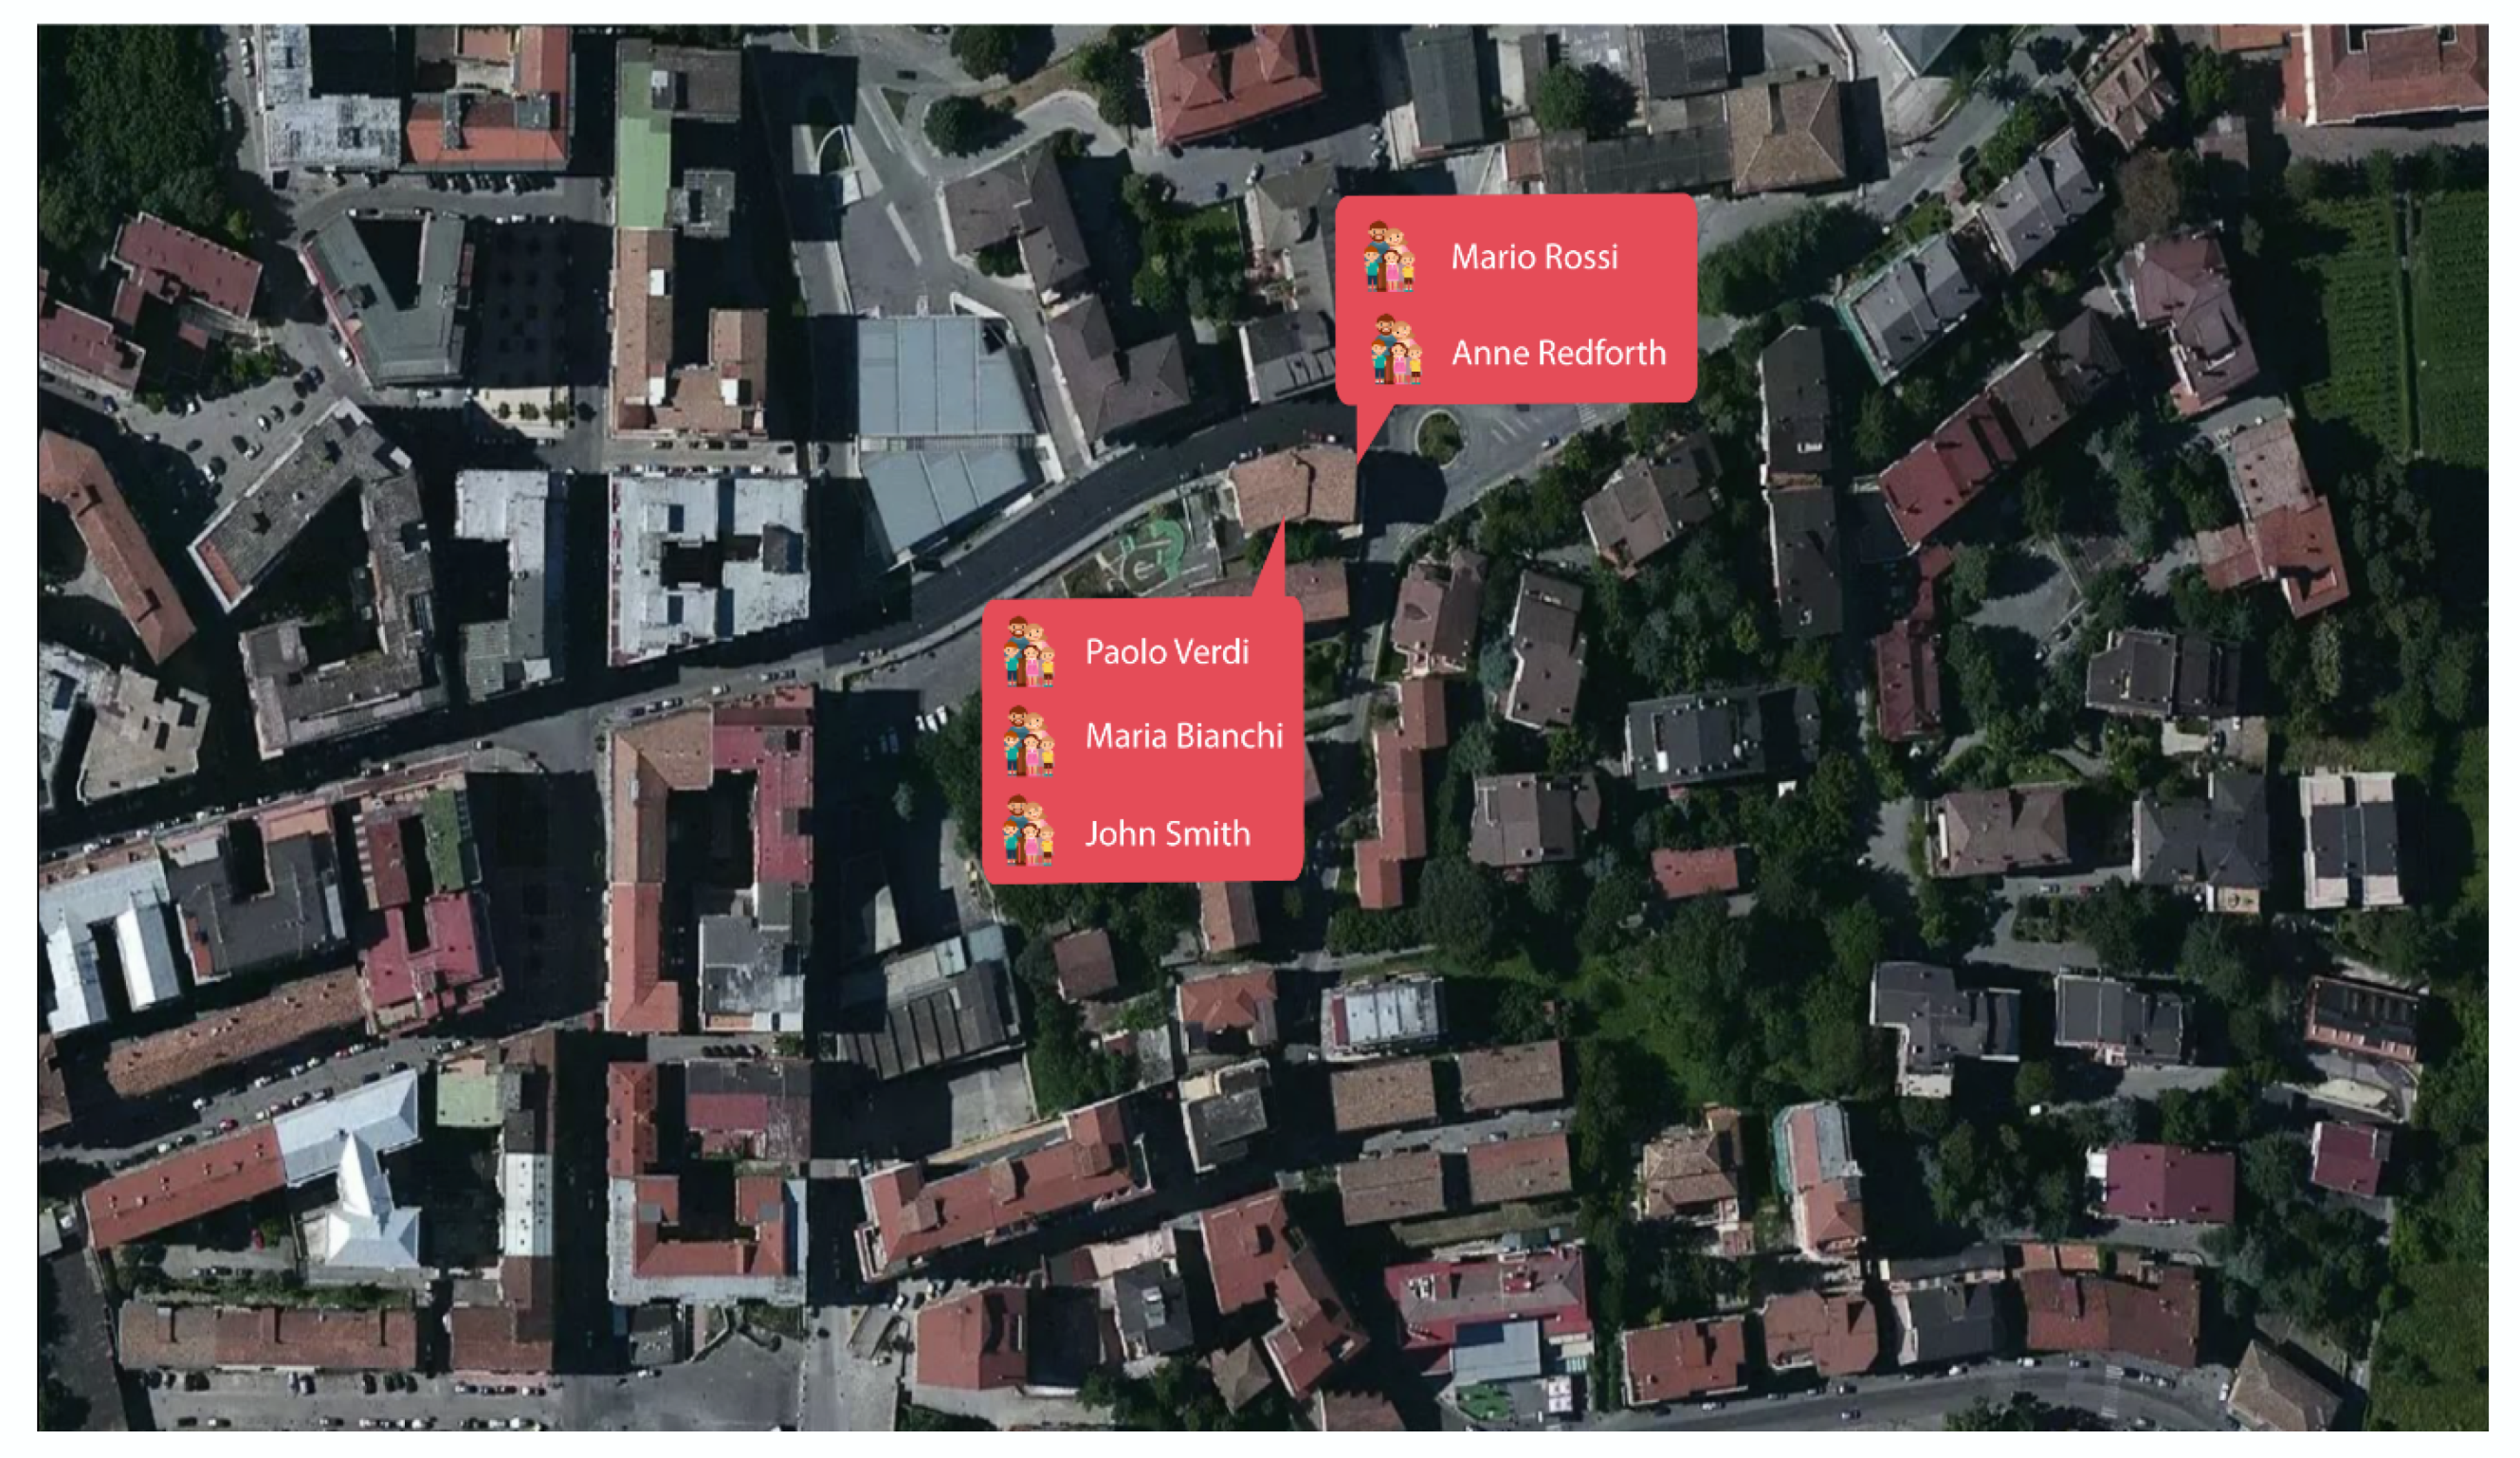
When a zooming is invoked, a cluster associated to the Family and Neighborhood geometaphors is calculated, and a label is visualized for each building, which contains a reference to the involved family (the householder’s name), as illustrated in
Figure 8.
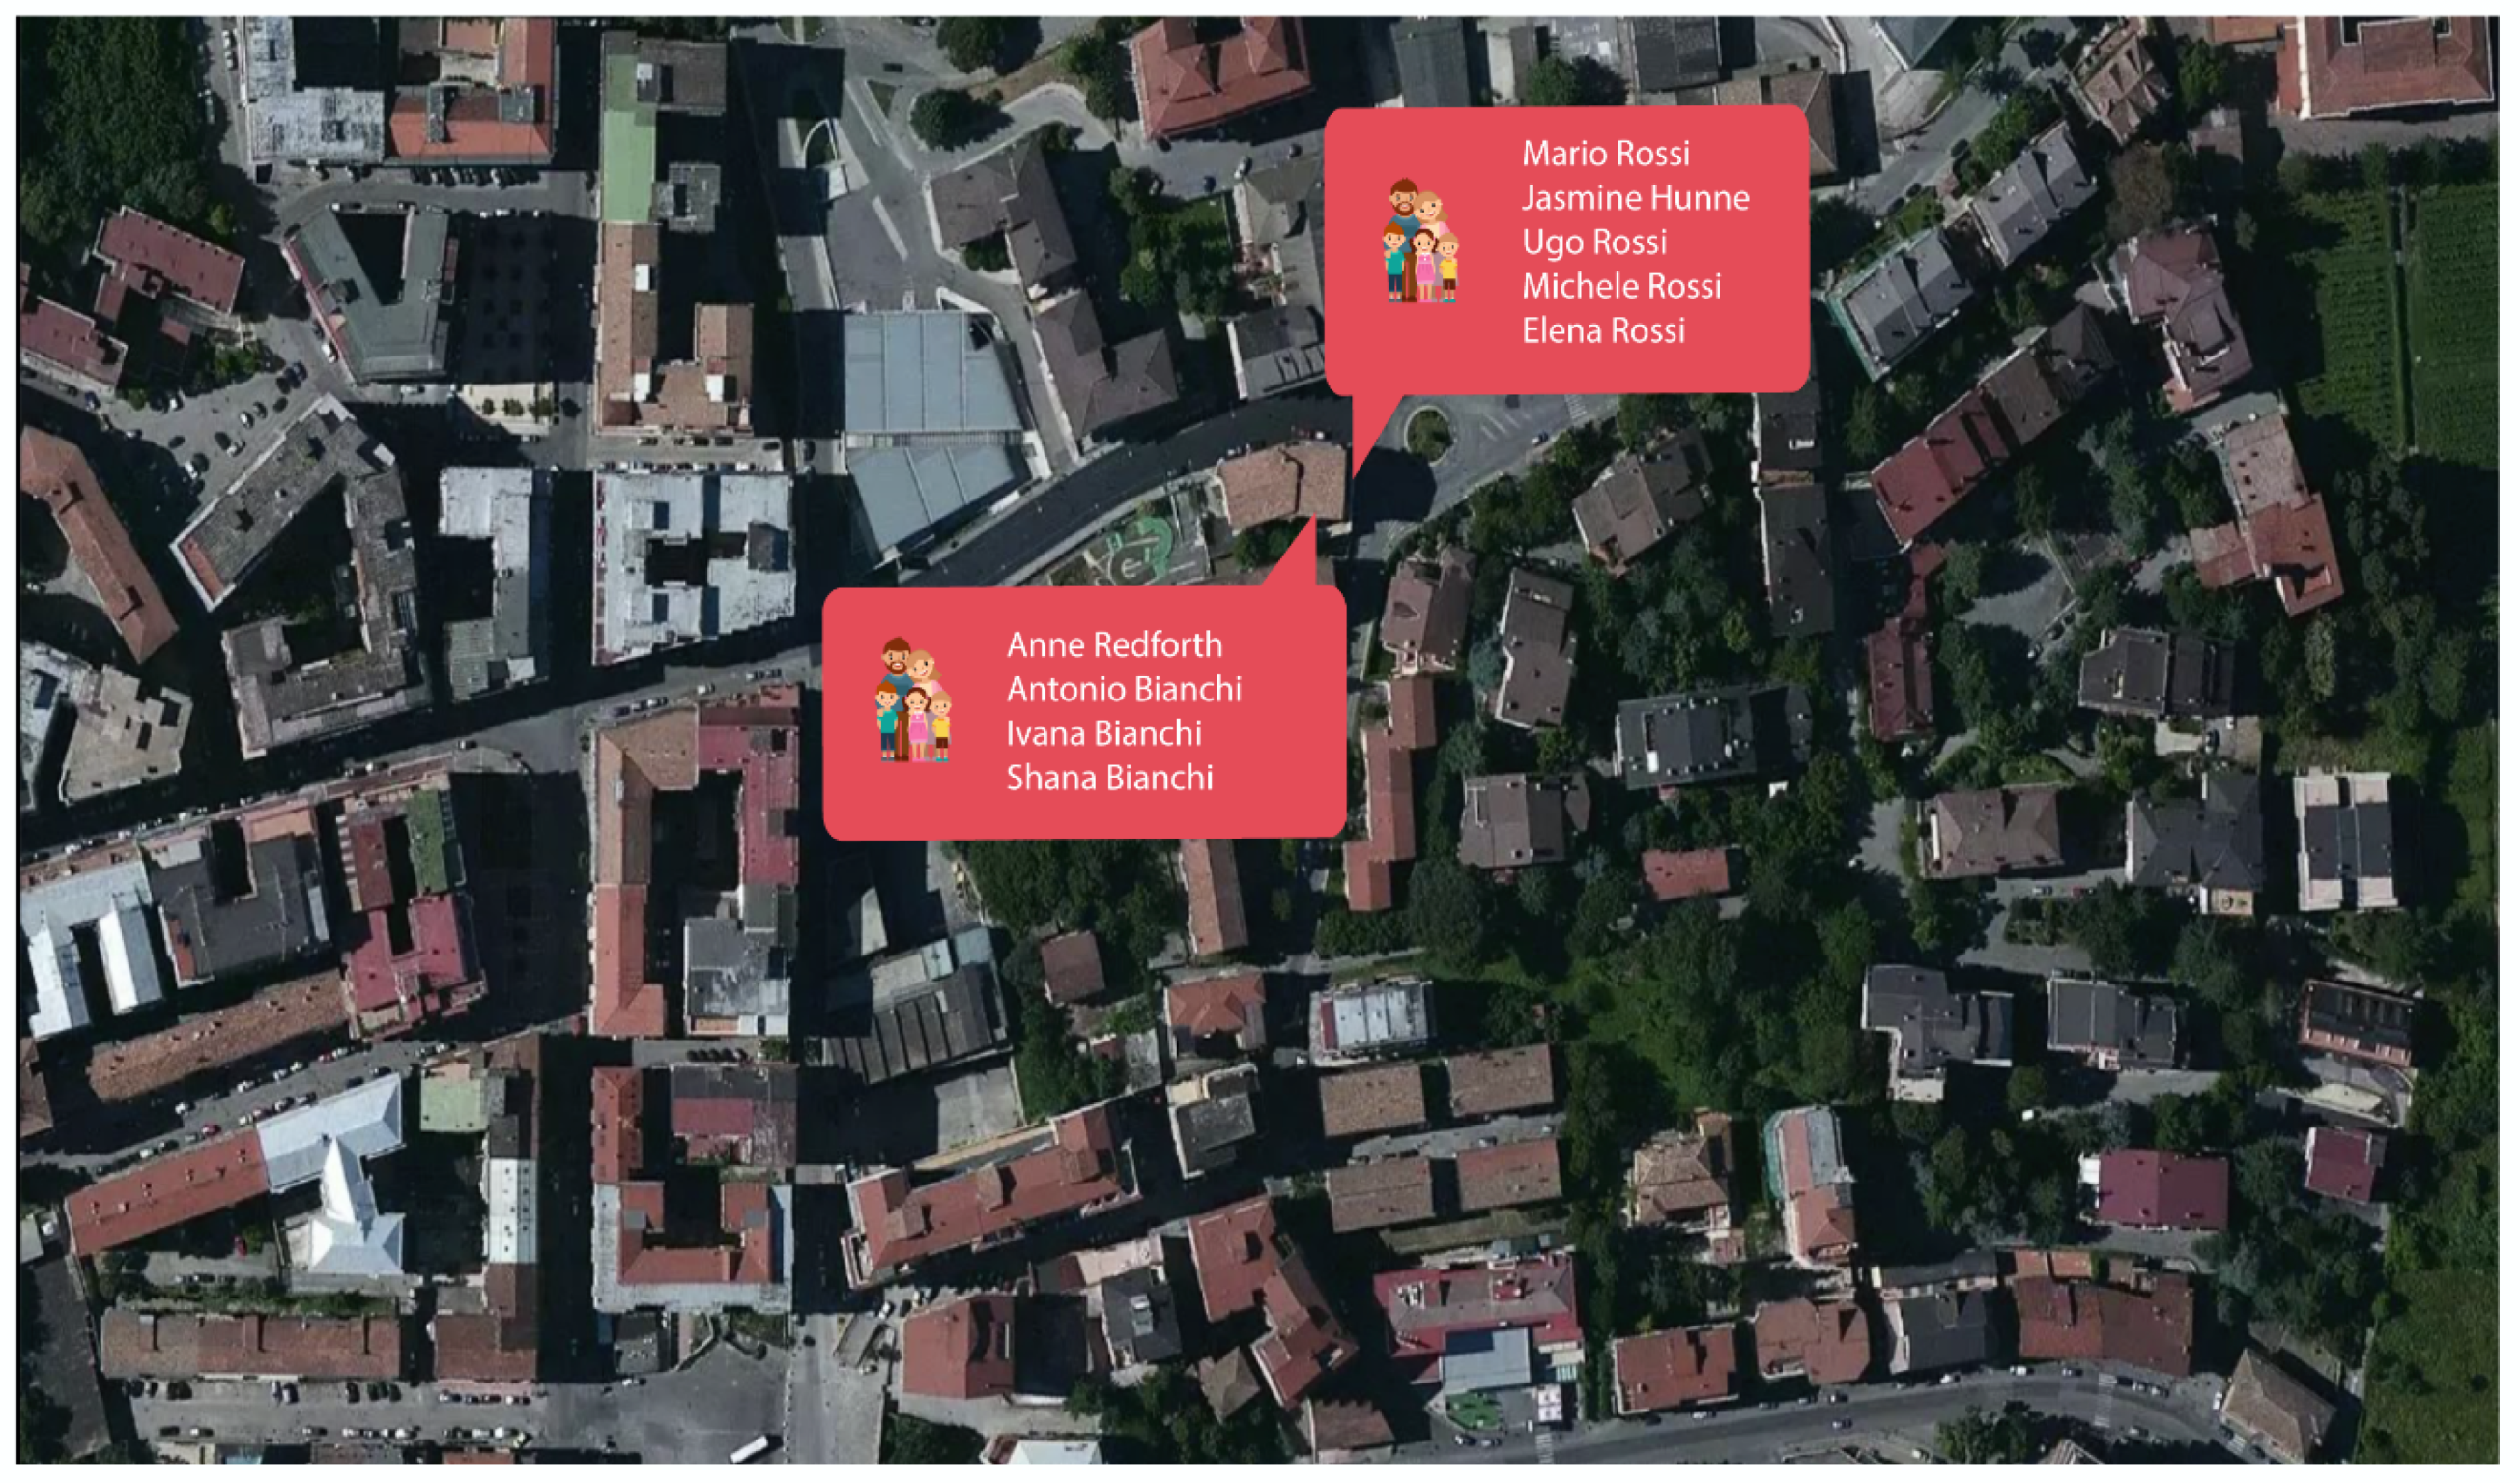
Finally,
Figure 9 shows how the cluster is disaggregated once an appropriate scale value is invoked again. In particular, a label for each Family is displayed containing data about the family members. In this case, members of the two Family geometaphors located into the right building are listed, once selected.
Finally, spatial operators can be applied to the Neighborhood geometaphor, in line with the operations allowed on a point geometry with respect to the geometries present in the other themes. In particular, topological operators (containment and adjacency), directional operators and metric operators (distance) can be invoked to obtain new information.
3.3. Macrophase 3: Choice
Macrophase 3 corresponds to the Choice phase. It consists of selecting the solution suitable to the subsequent implementation. It takes into account all parameters of interest so far quantified, as well as new parameters just processed through spatial analysis methods, to build a decision-making scenario. In particular, this scenario depends on the goal to be achieved. In SAFE, two categories can be considered. The former refers to the optimization of daily public territorial services. The latter category concerns the optimization of services for risk management. In particular, the test described in the following subsection refers to this latter issue.
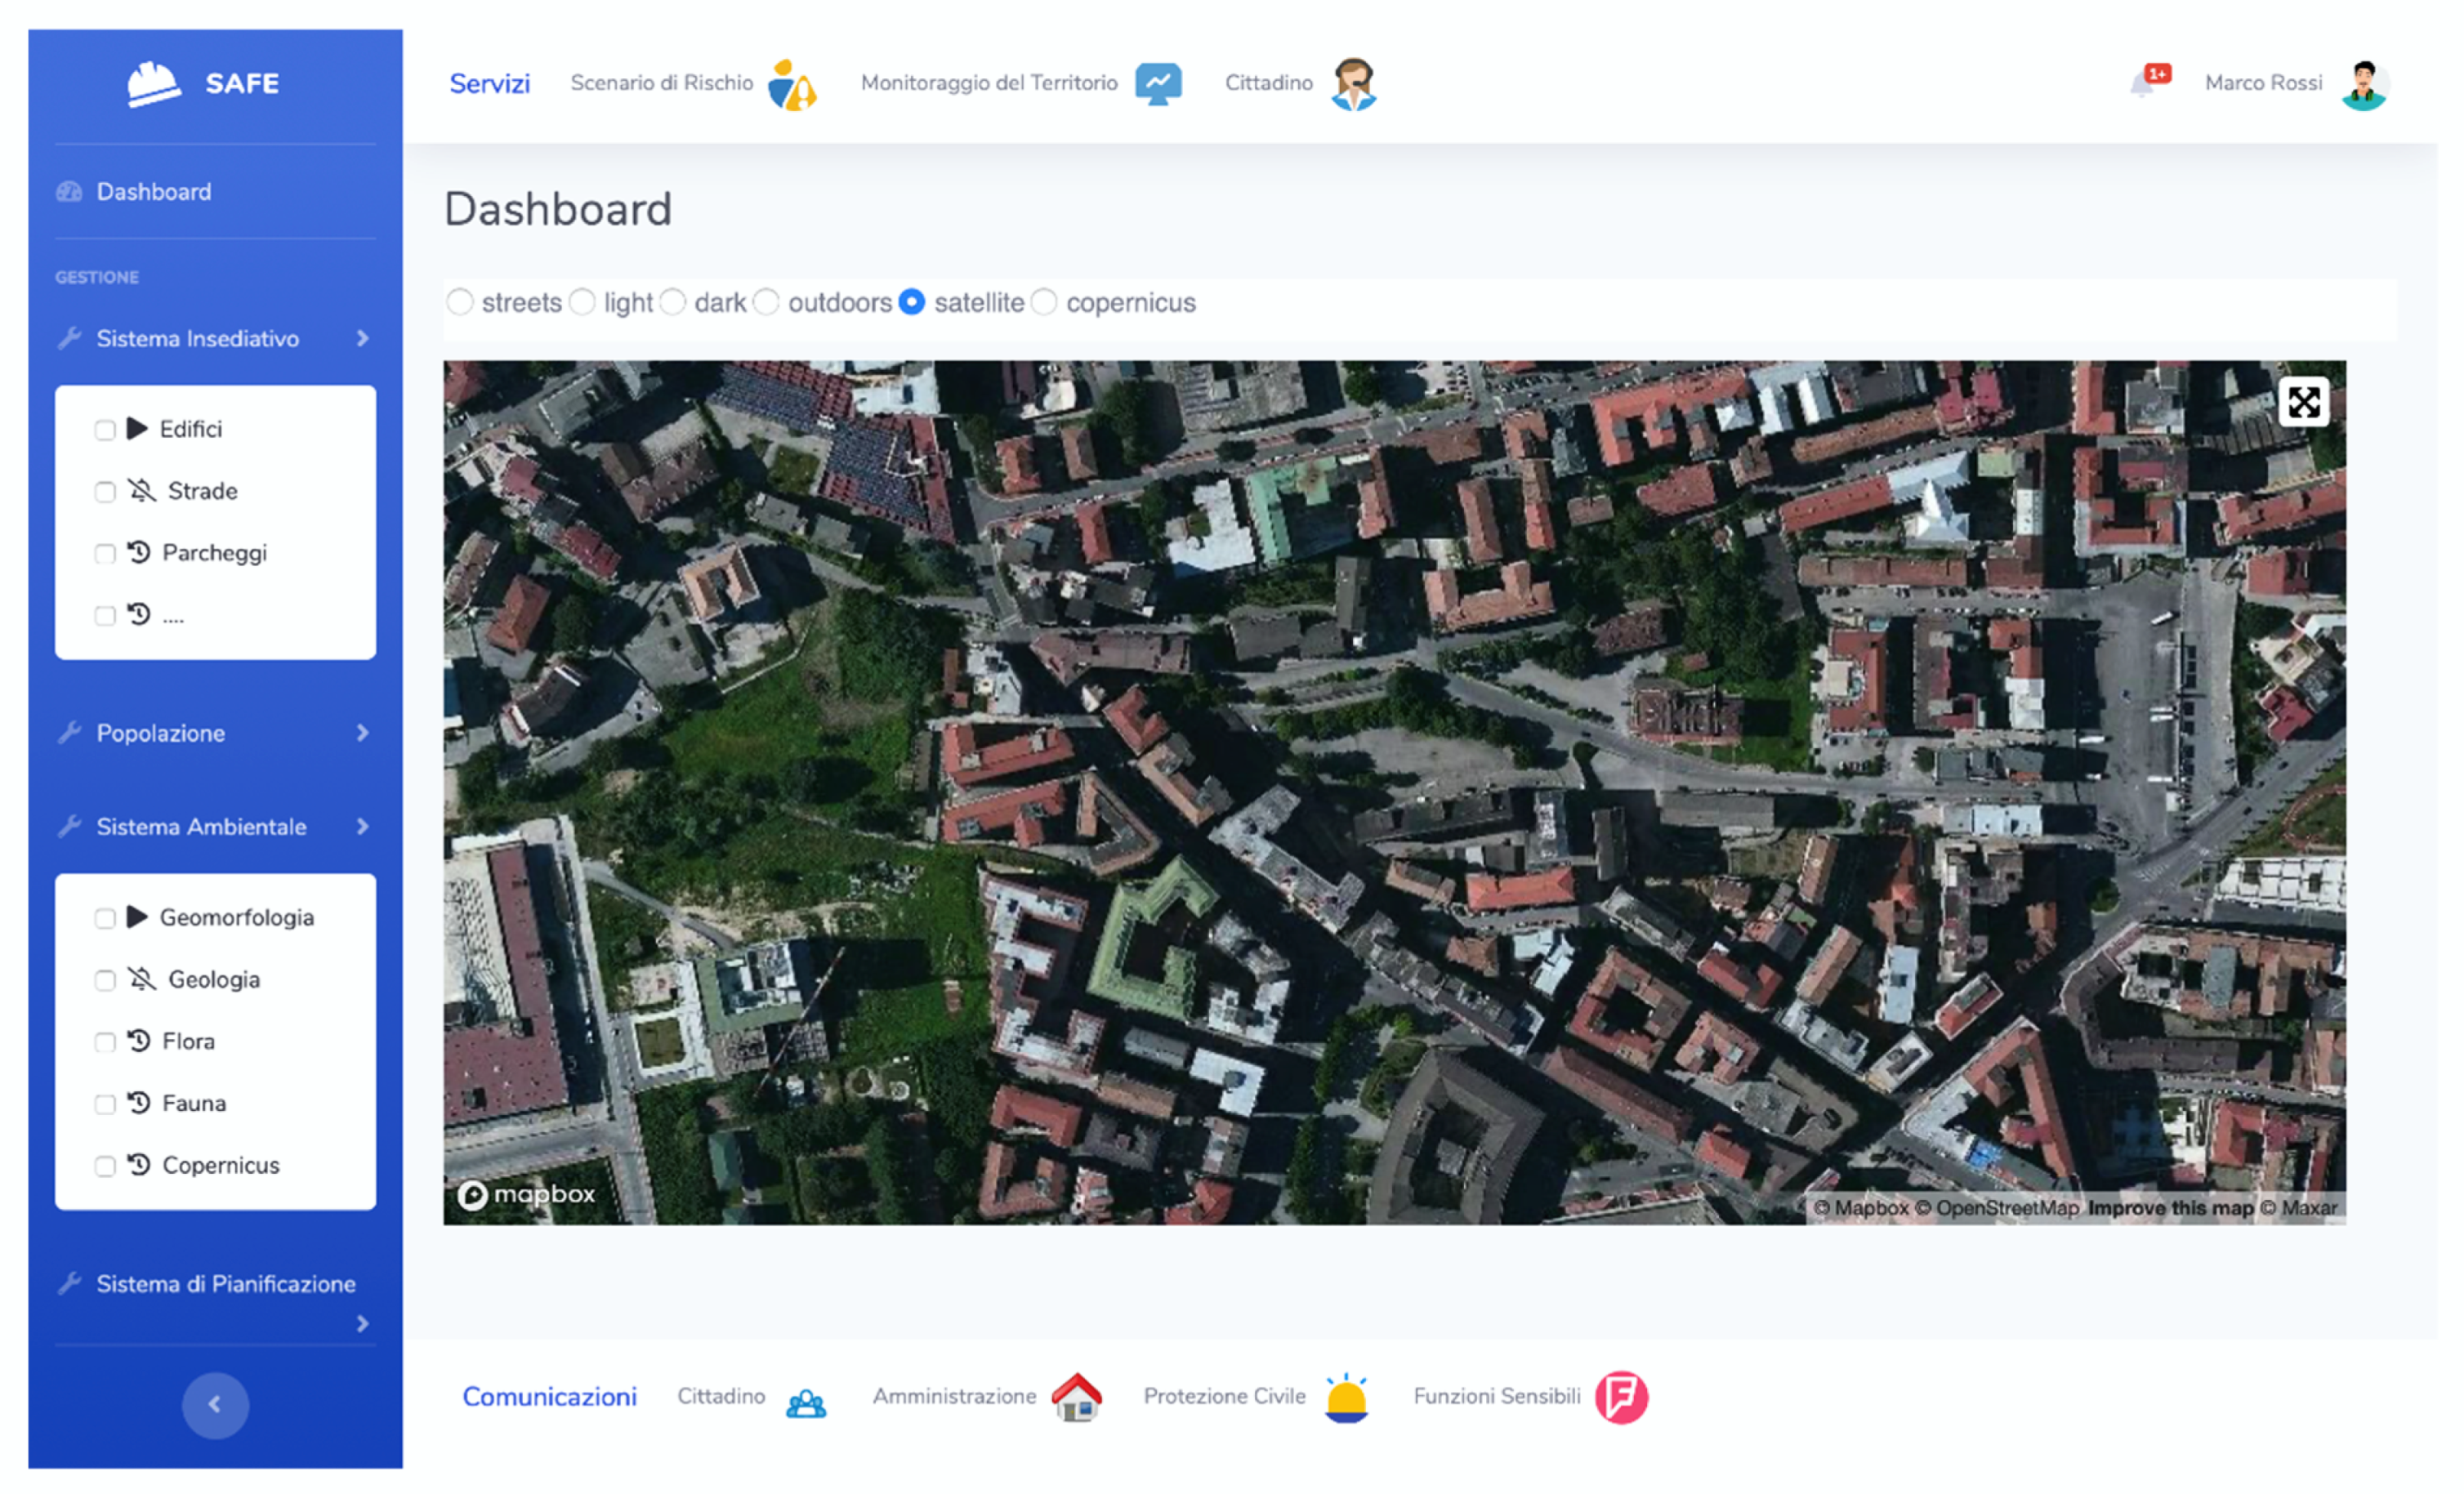
3.4. The Visual Environment
Figure 10 shows the interface of the visual environment for the Web component. It consists of three main portions, each associated with specific functionality. On the left, the main menu is visualized, which embeds four thematic sets of layers. Once a set is selected along with some layers, the central layout is managed accordingly. Finally, two sets of functionality are distributed around the central layout.
The former, named Services (Servizi), is located on the upper side and invokes services associated to Risk Scenarios (Scenario di Rischio) and Land Monitoring (Monitoraggio del Territorio) tasks for expert users and decision makers, and Citizens (Cittadino) activities for ultimate users, respectively. The latter, on the bottom side, contains communication services (Comunicazioni) to invoke information sharing and prosumerism activities.
Encouraging a daily practice of those applications is important because it guarantees that SAFE is used also in case of emergency where stress conditions can complicate the usage of an unfamiliar application.
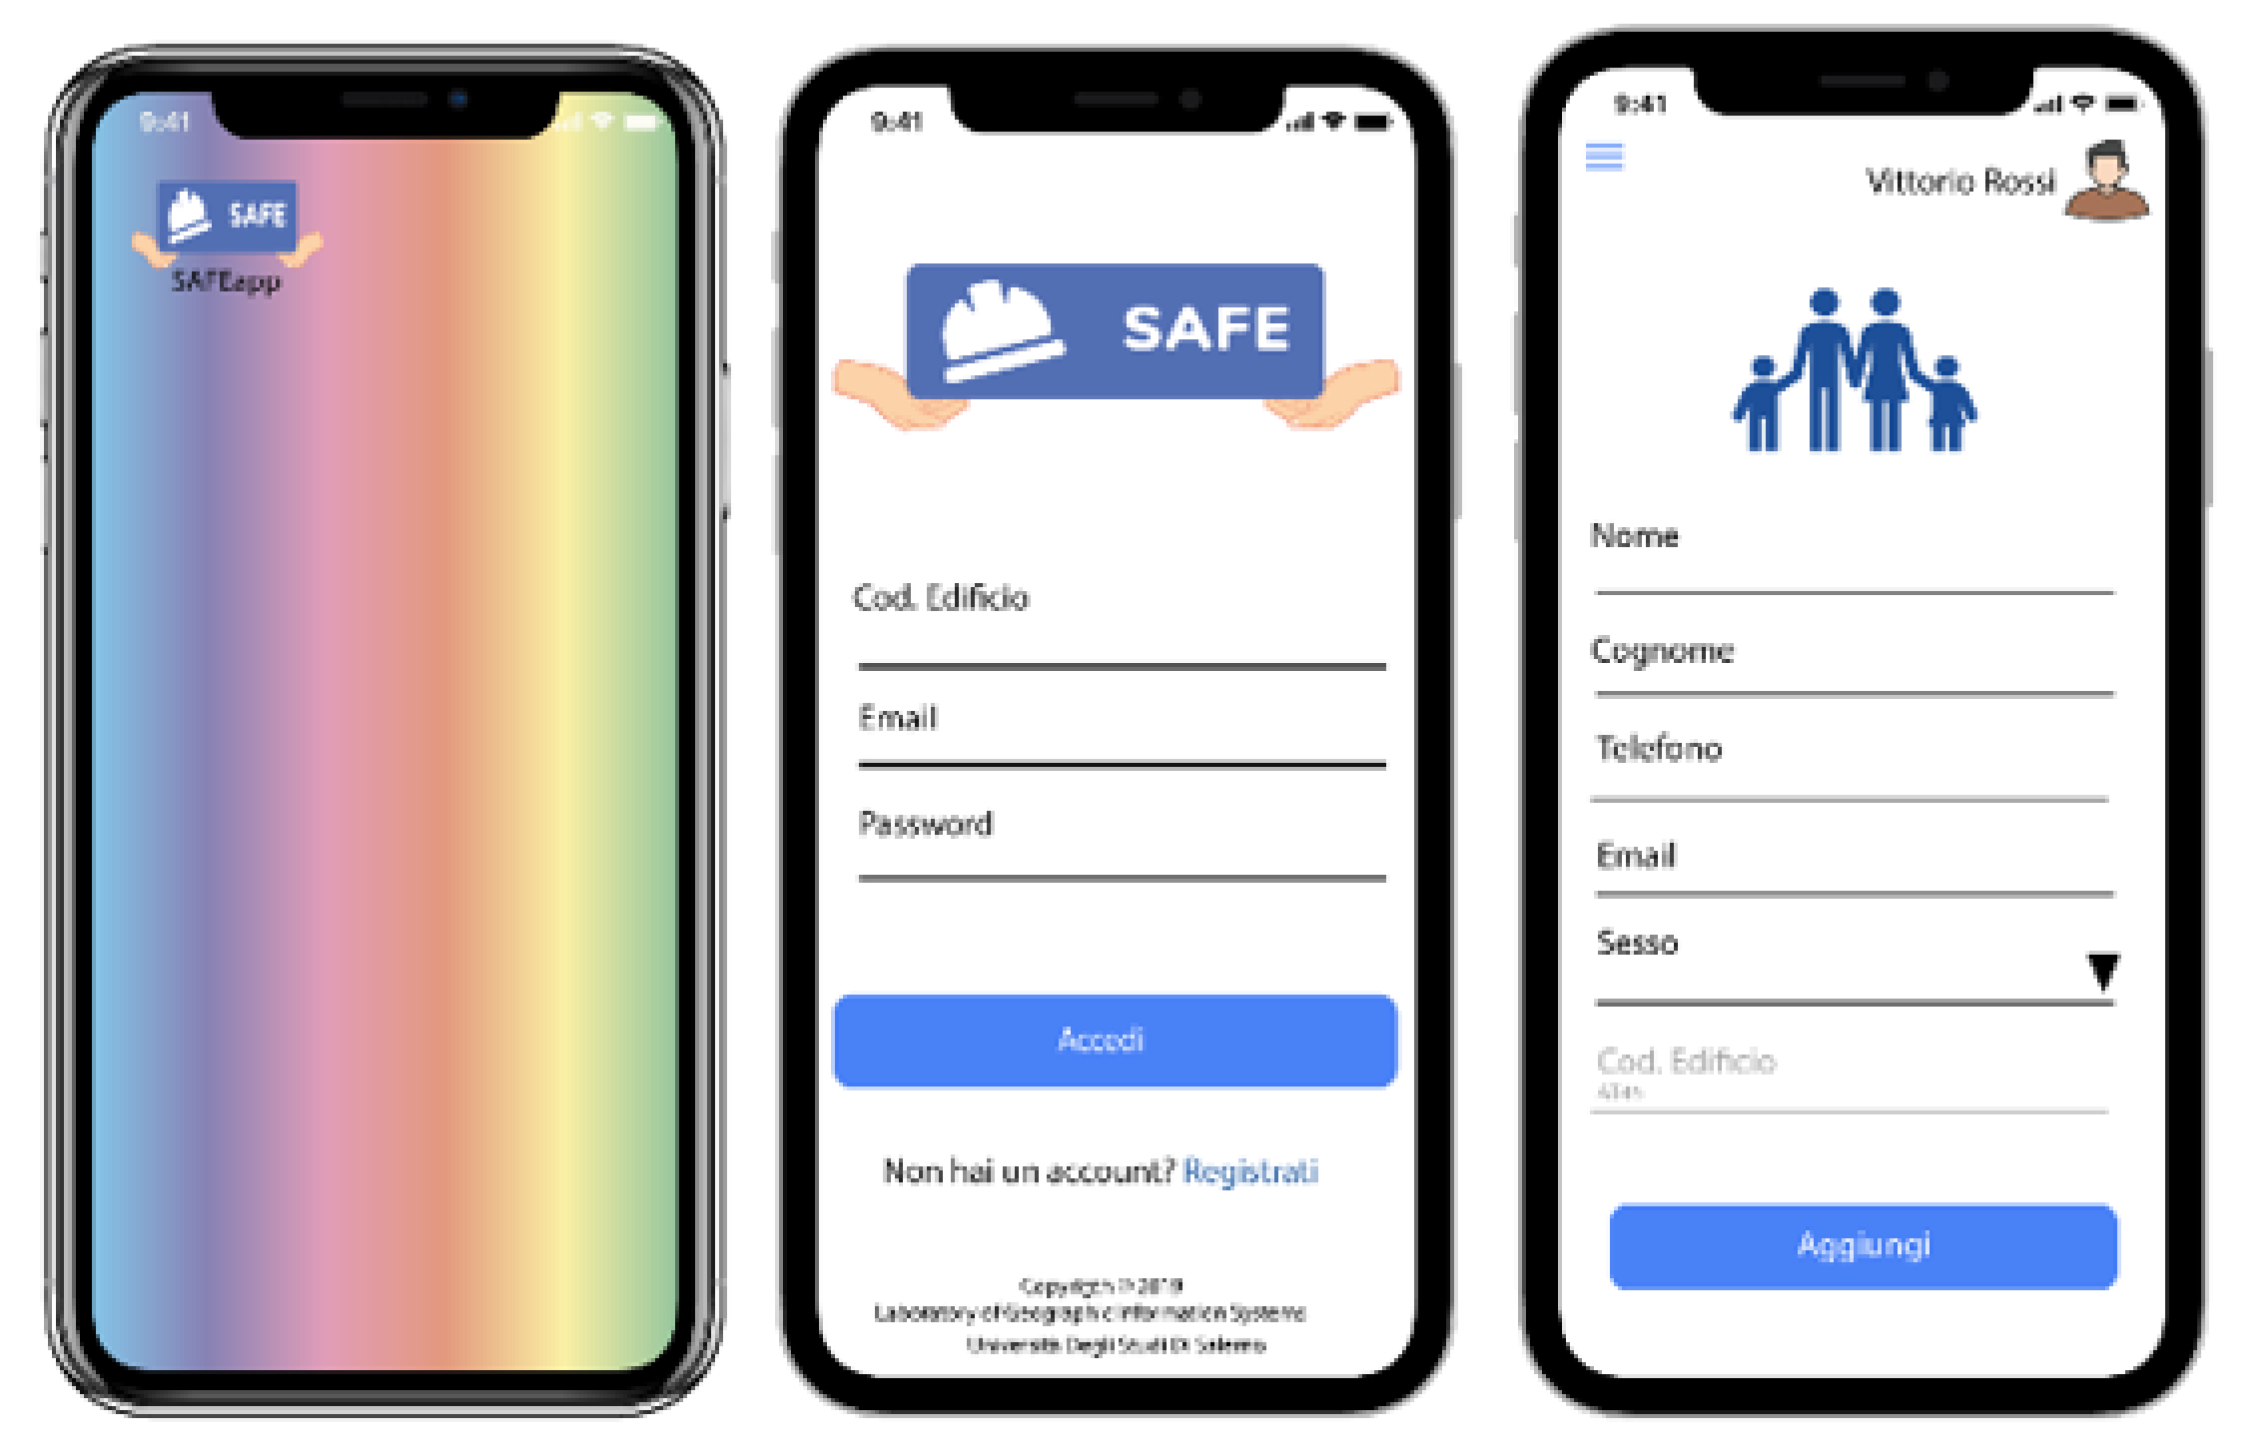
As for the mobile component,
Figure 11 shows the interface to register the family’s members along with some personal data, such as age, telephone number, possible pathologies and allergies. Each account associates a building, a householder and family members with an instance of a Family geometaphor, thus preserving relationships among members that can be used to optimize some tasks and their performance.
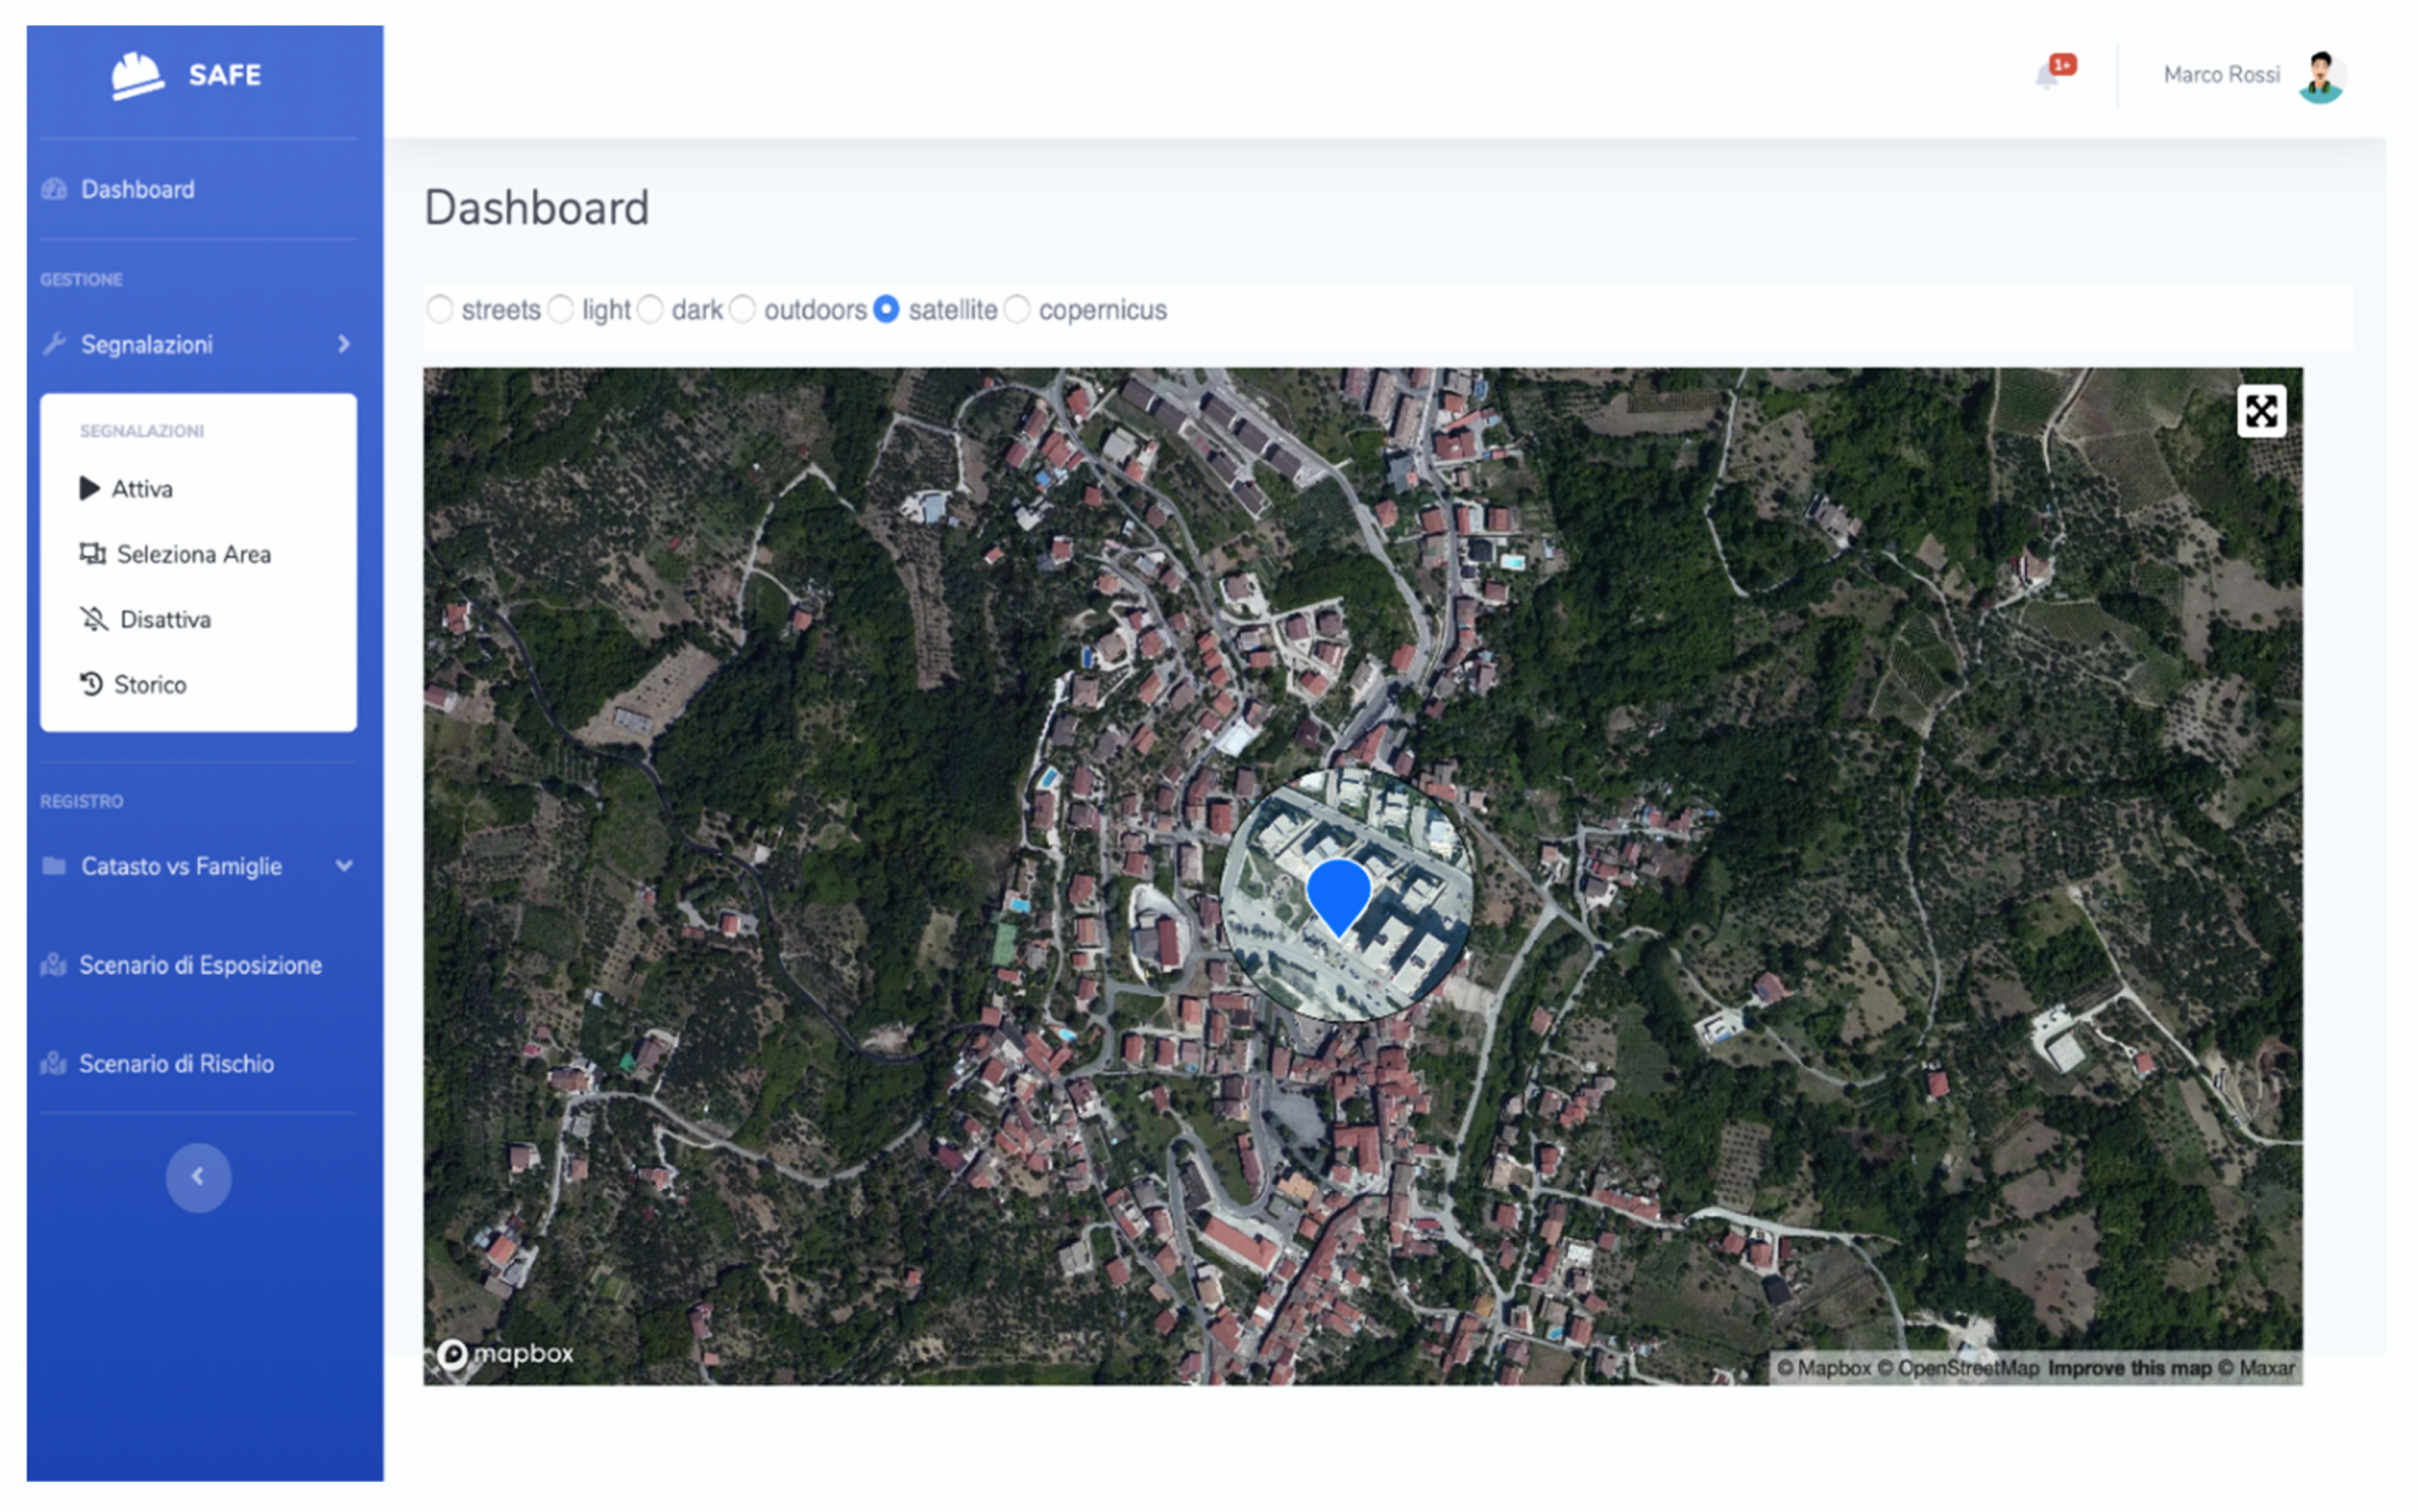
Figure 12 displays the interface once a new Family user is registered. After the update of the vector layer of the users’ geographic distribution, the new instance appears as a blue colored balloon on the map. It is worth noticing that this instance of the Family geometaphor is always associated to a building. This guarantees that the approach described through
Figure 4,
Figure 5 and
Figure 6 still holds, i.e., the details can be obtained by subsequent zooming operations. The fisheye tool is available, which allows zooming a map portion preserving the context.
4. Risk Management Activism in SAFE
The approach SAFE proves particularly beneficial in the risk assessment, because in different situations many factors and variables may not have reached an appropriate level of knowledge. The management model proposed by the civil protection manuals is in fact very often based on specific knowledge of the risk status of the territory derived from old databases. This situation is most emphasized in highly dynamic territorial contexts where both socio-natural and vulnerability factors could undergo rapid changes in the short and medium term [
28], thus requiring a continuous monitoring to acquire additional information from other sources.
SAFE can represent a solution.
The following Subsections describe how SAFE can be used to support different risk management activities by illustrating the interactions carried out by the users involved in them.
A preliminary version of SAFE has been tested in the Municipality of Monteforte Irpino in the South of Italy, where a municipal emergency plan (Piano di Emergenza Comunale) has been recently designed.
The whole process scheduled in SAFE starts by acquiring and storing data through an intelligent census based on a Web of data approach [
14]. An ontology of the Civil Protection domain is under construction based on software Protégé [
29]. It allows modelling and validating resources in terms of metadata, state and behavior. Moreover, the ontology can be used also to aggregate subsets of resources to build units to which a composite state and a behavior can be associated. Inference algorithms can be used to derive additional relationships among validated resources. The requirement is to have a system that dynamically generates new cards for the data entry tasks and populates the available dataset, through procedures that are based on an effective territorial knowledge, where instrumental and human resources, rules, behaviors and interactions converge.
The testing phase has been carried out on a sample area with the initial goal of assessing SAFE performances. The whole municipality is going to be involved in a subsequent phase when the coordination with the local civil protection is necessary to manage the increasing number of families. This phase will provide us with a further assessment regarding the system scalability.
4.1. Dynamically Quantifying Risk Parameters
It is known from the literature that the Risk is defined by the formula [
30]:
where variables correspond to:
P = Hazard: it is the probability that a phenomenon of a certain intensity occurs in a certain interval of time and in a given area.
V = Vulnerability: the vulnerability of an element (people, buildings, infrastructures, economic activities) is the propensity to suffer damage as a result of the stresses induced by an event of a certain intensity.
E = Exposure or Exposed Value: is the number of units (or “value”) of each of the risk elements present in a given area, such as human lives or settlements.
In this formula, the variable E represents the most sensitive data because it is linked to the human component. Usually, when it is processed, the Risk refers to the value obtained from data present in the official registry. However, it is known from the literature that this value is the most susceptible to changes, and a value acquired in real time with respect to an estimated or static value can make the difference in emergencies.
4.2. Experts’ and Decision Makers’ Role
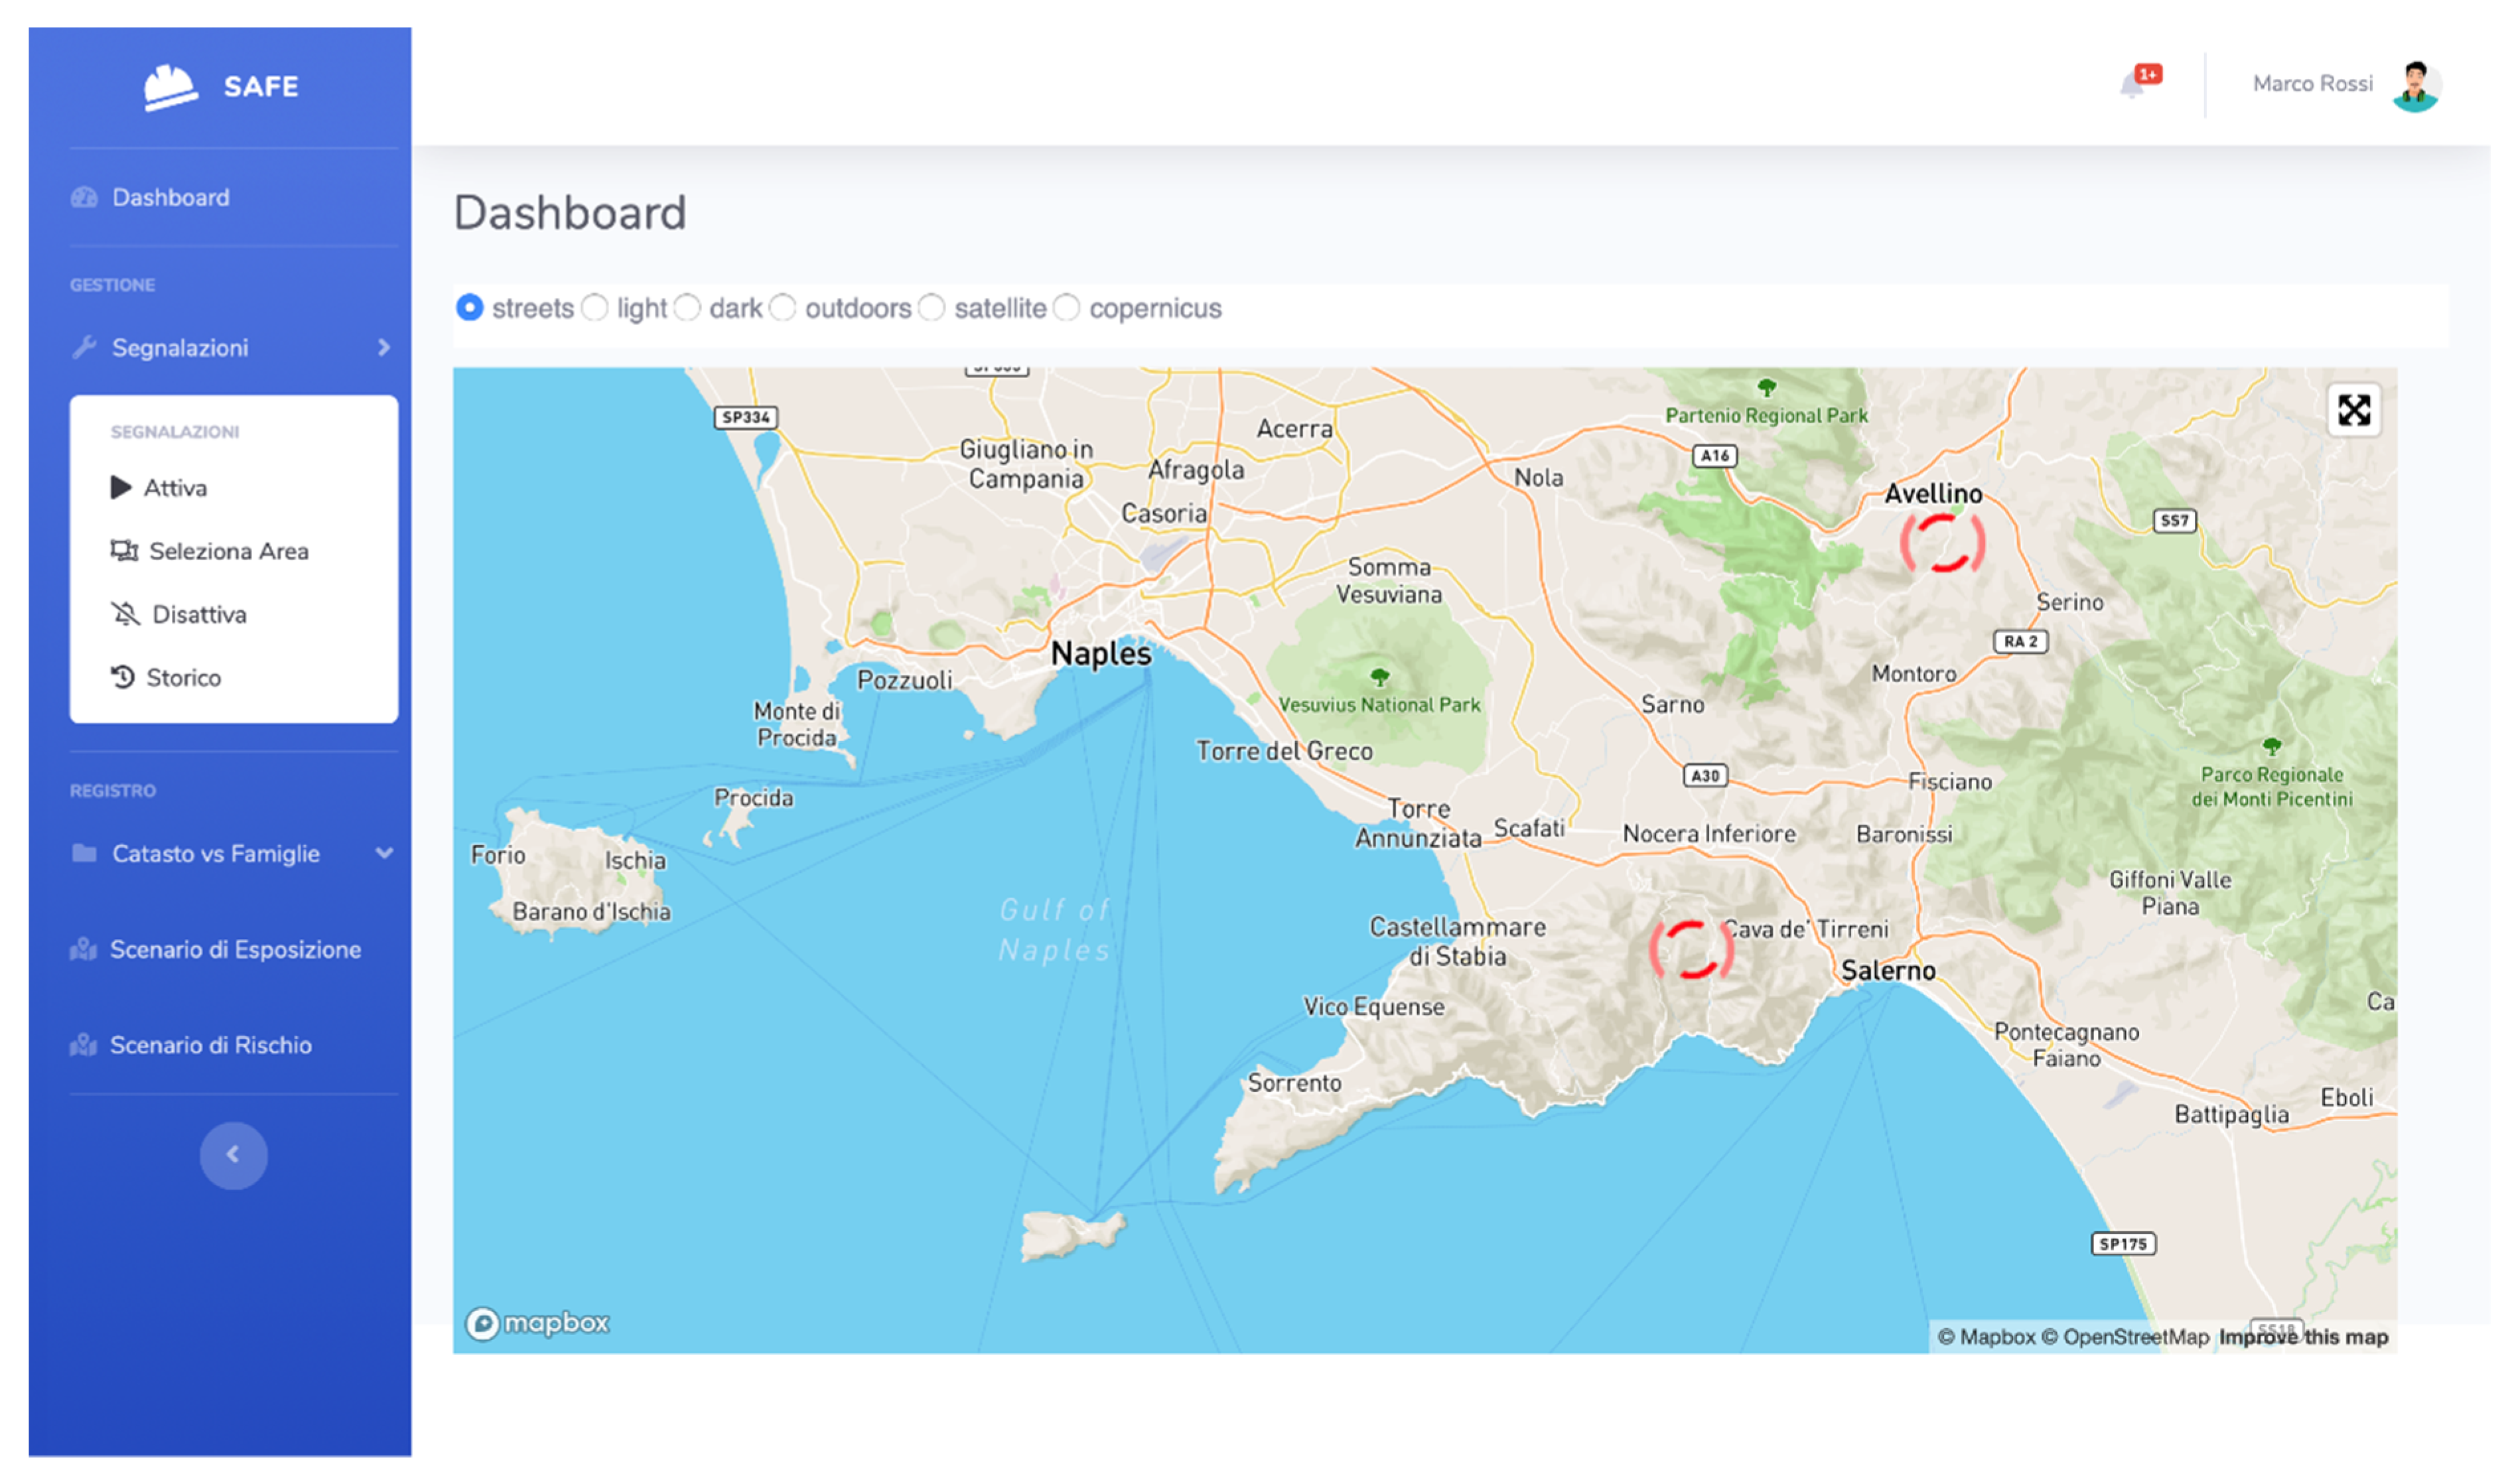
In case of an emergency, a decision maker or an emergency manager interacts with the SAFE Web application.
Figure 13 shows the initial interface where currently active alarms are displayed. From the left menu, it is possible to activate a new instance of a given alarm and select the involved area (if pre-defined) or edit it from scratch.
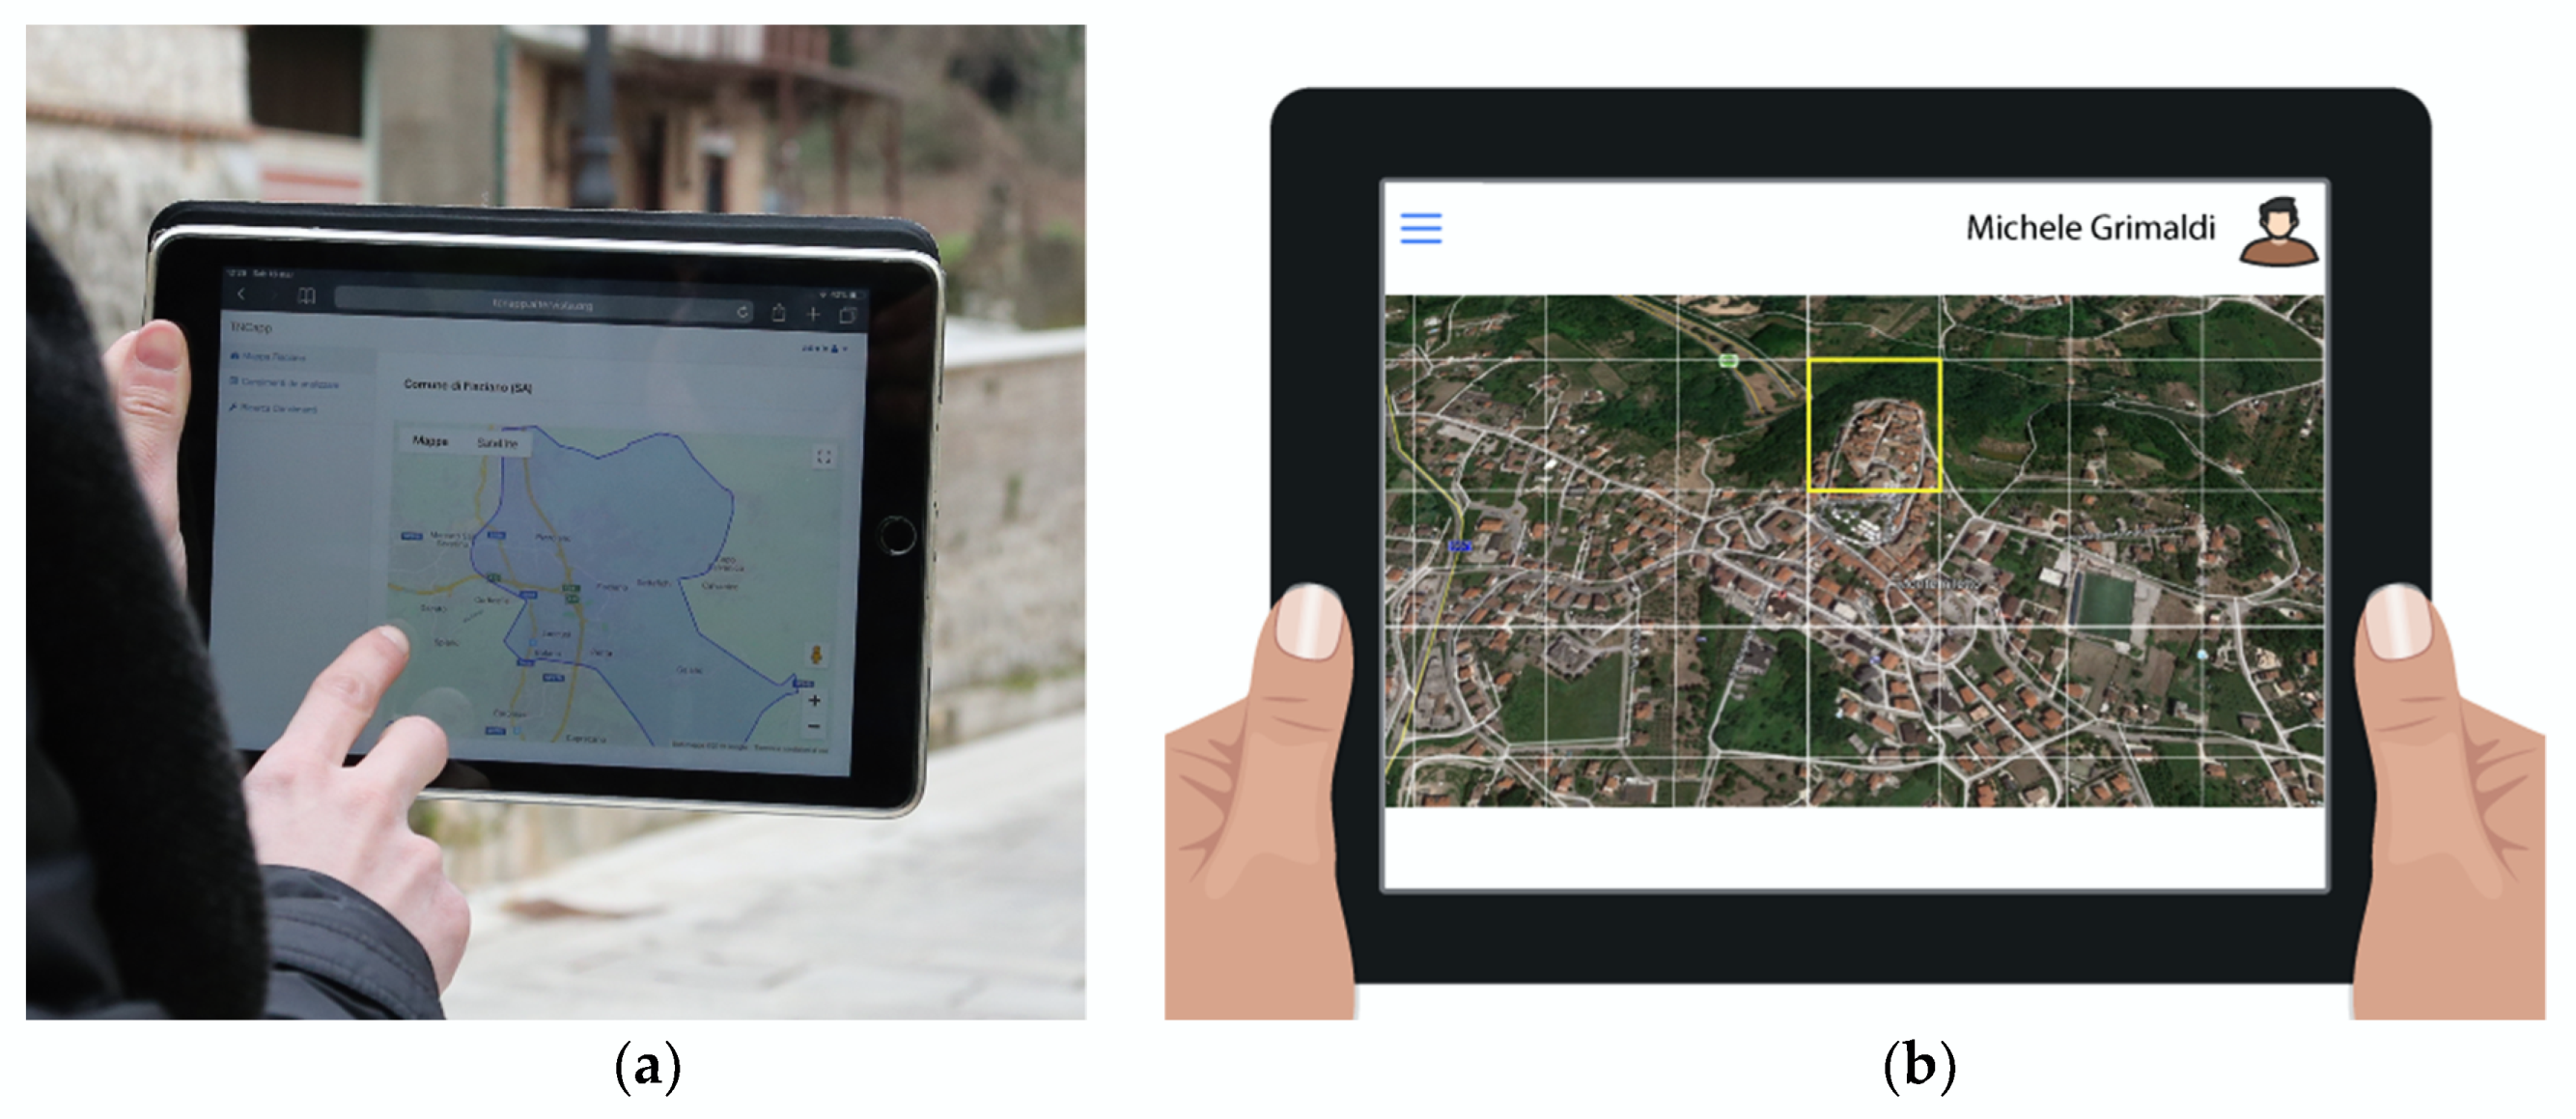
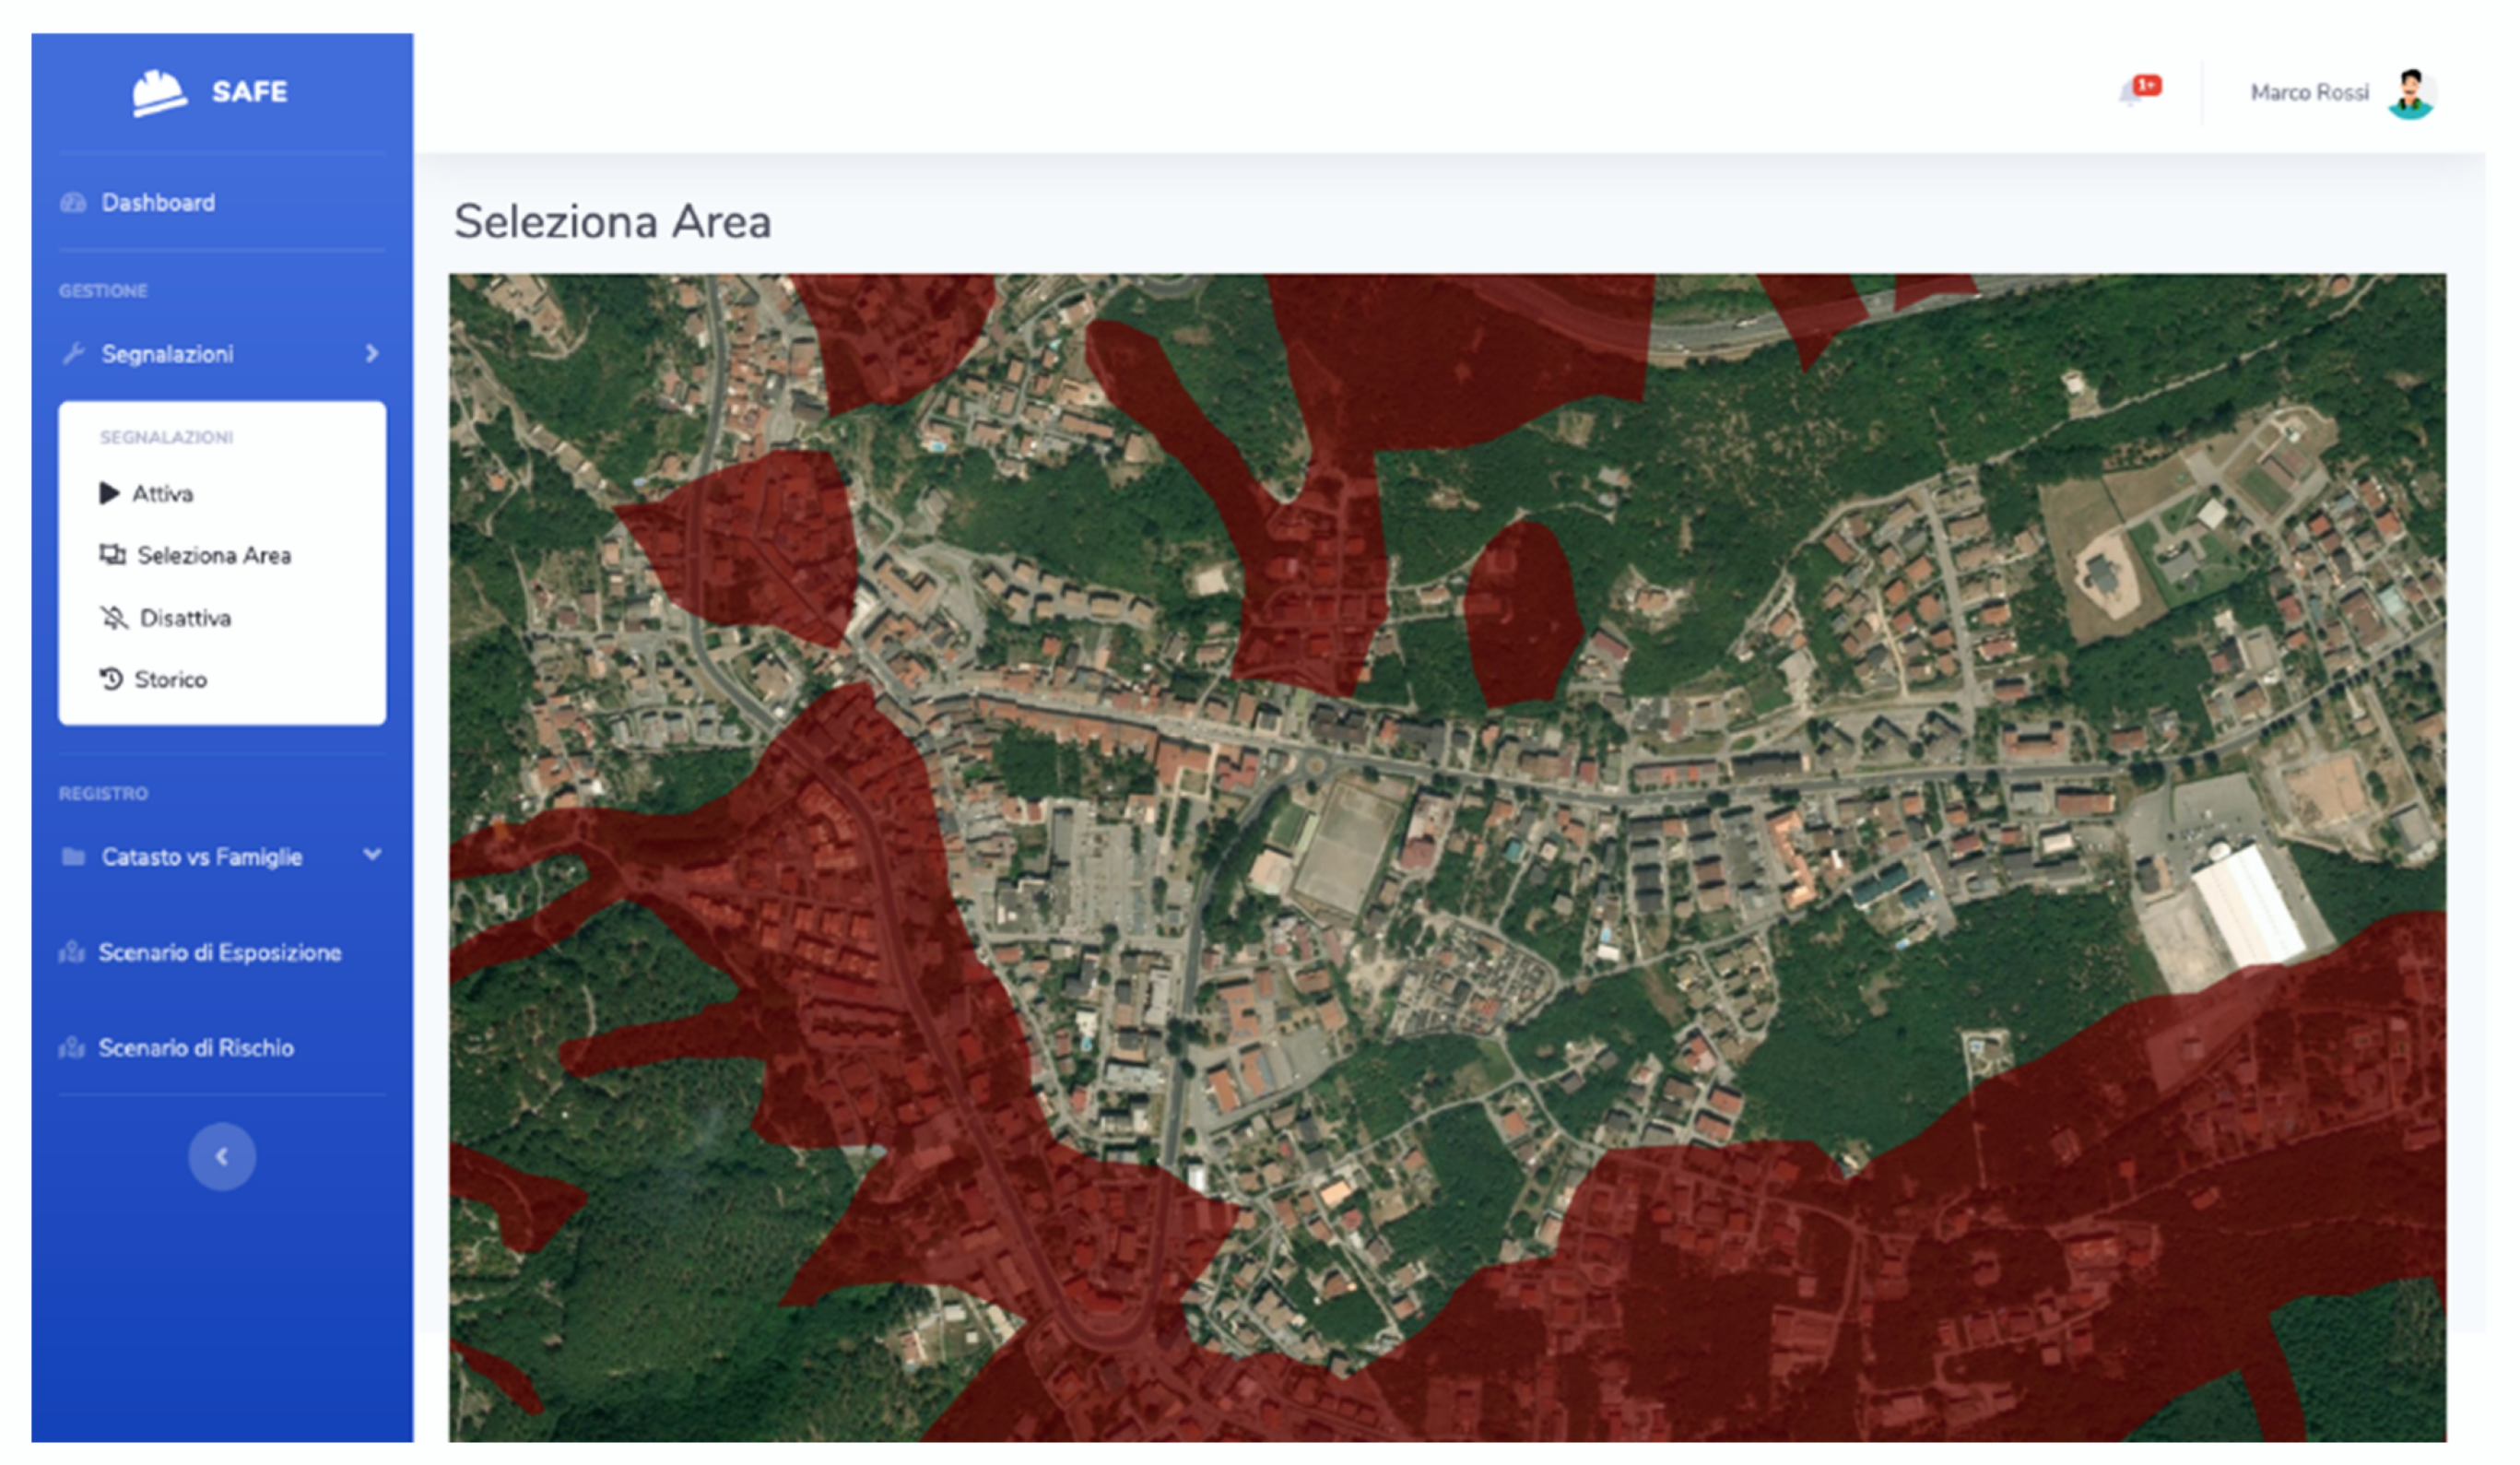
Figure 14 shows the interface when the Seleziona Area function is invoked, which allows selecting a risk area among the pre-defined ones.
In case the involved area is not present yet, it should be added.
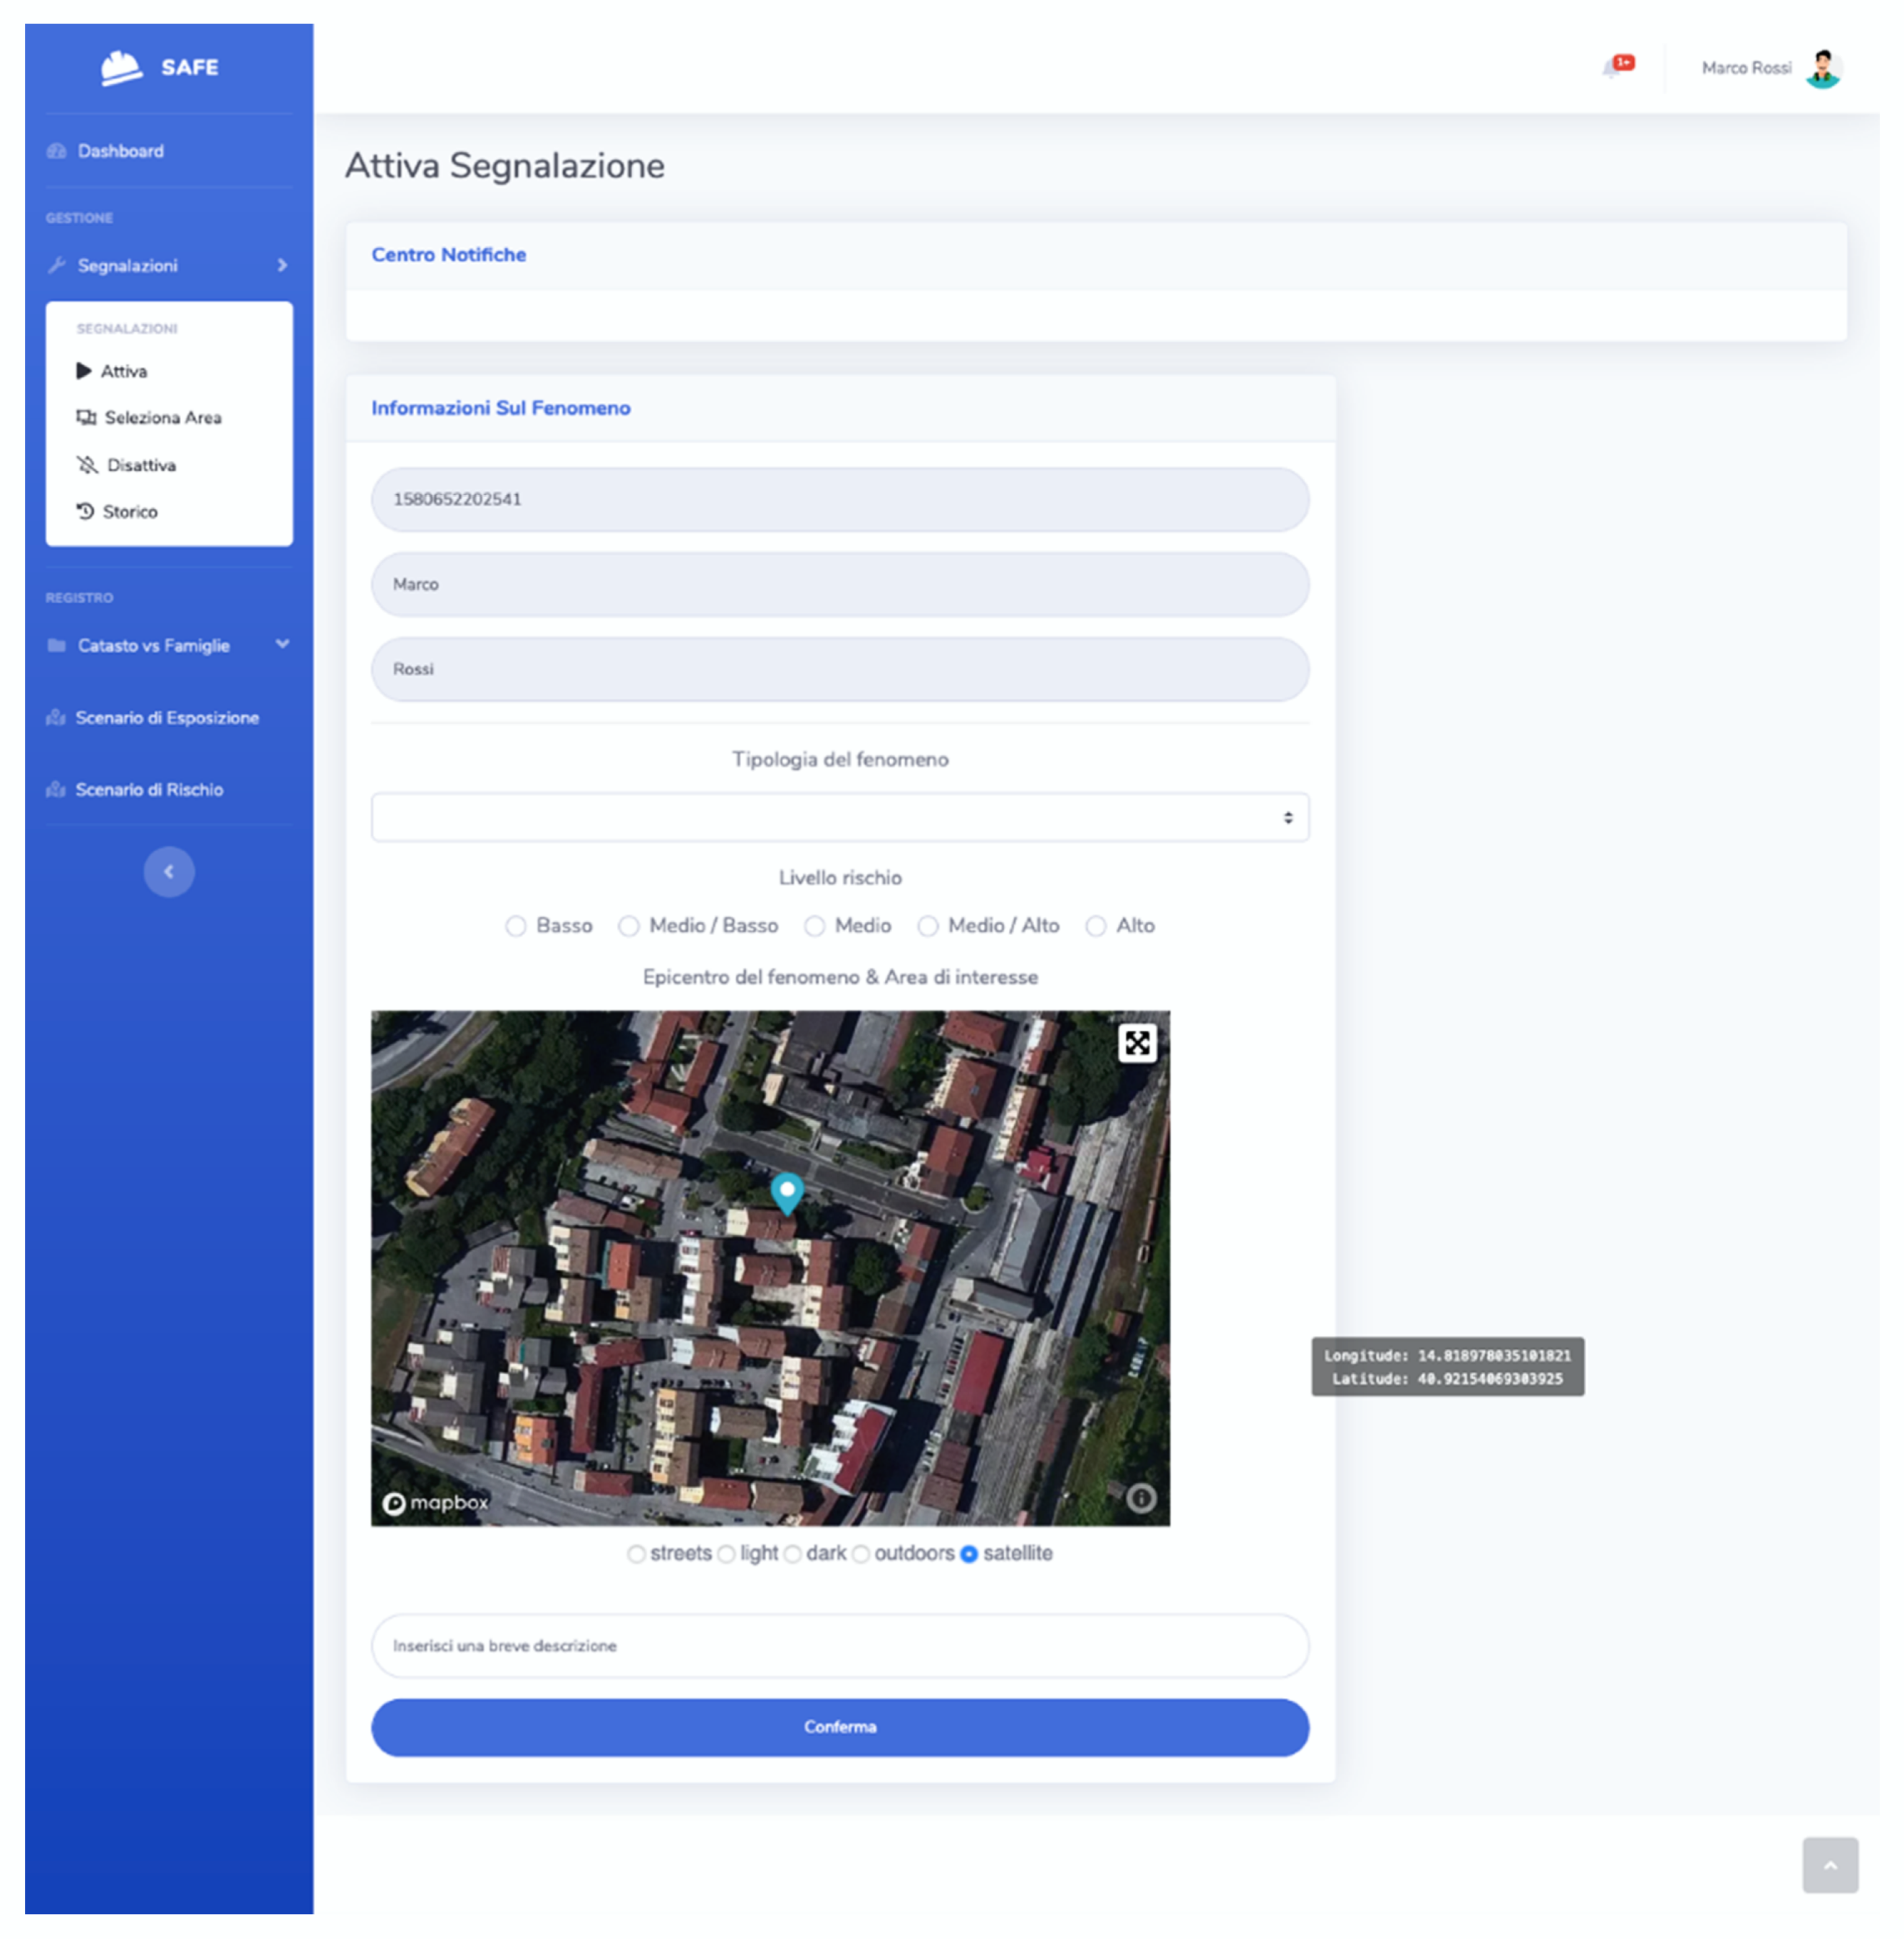
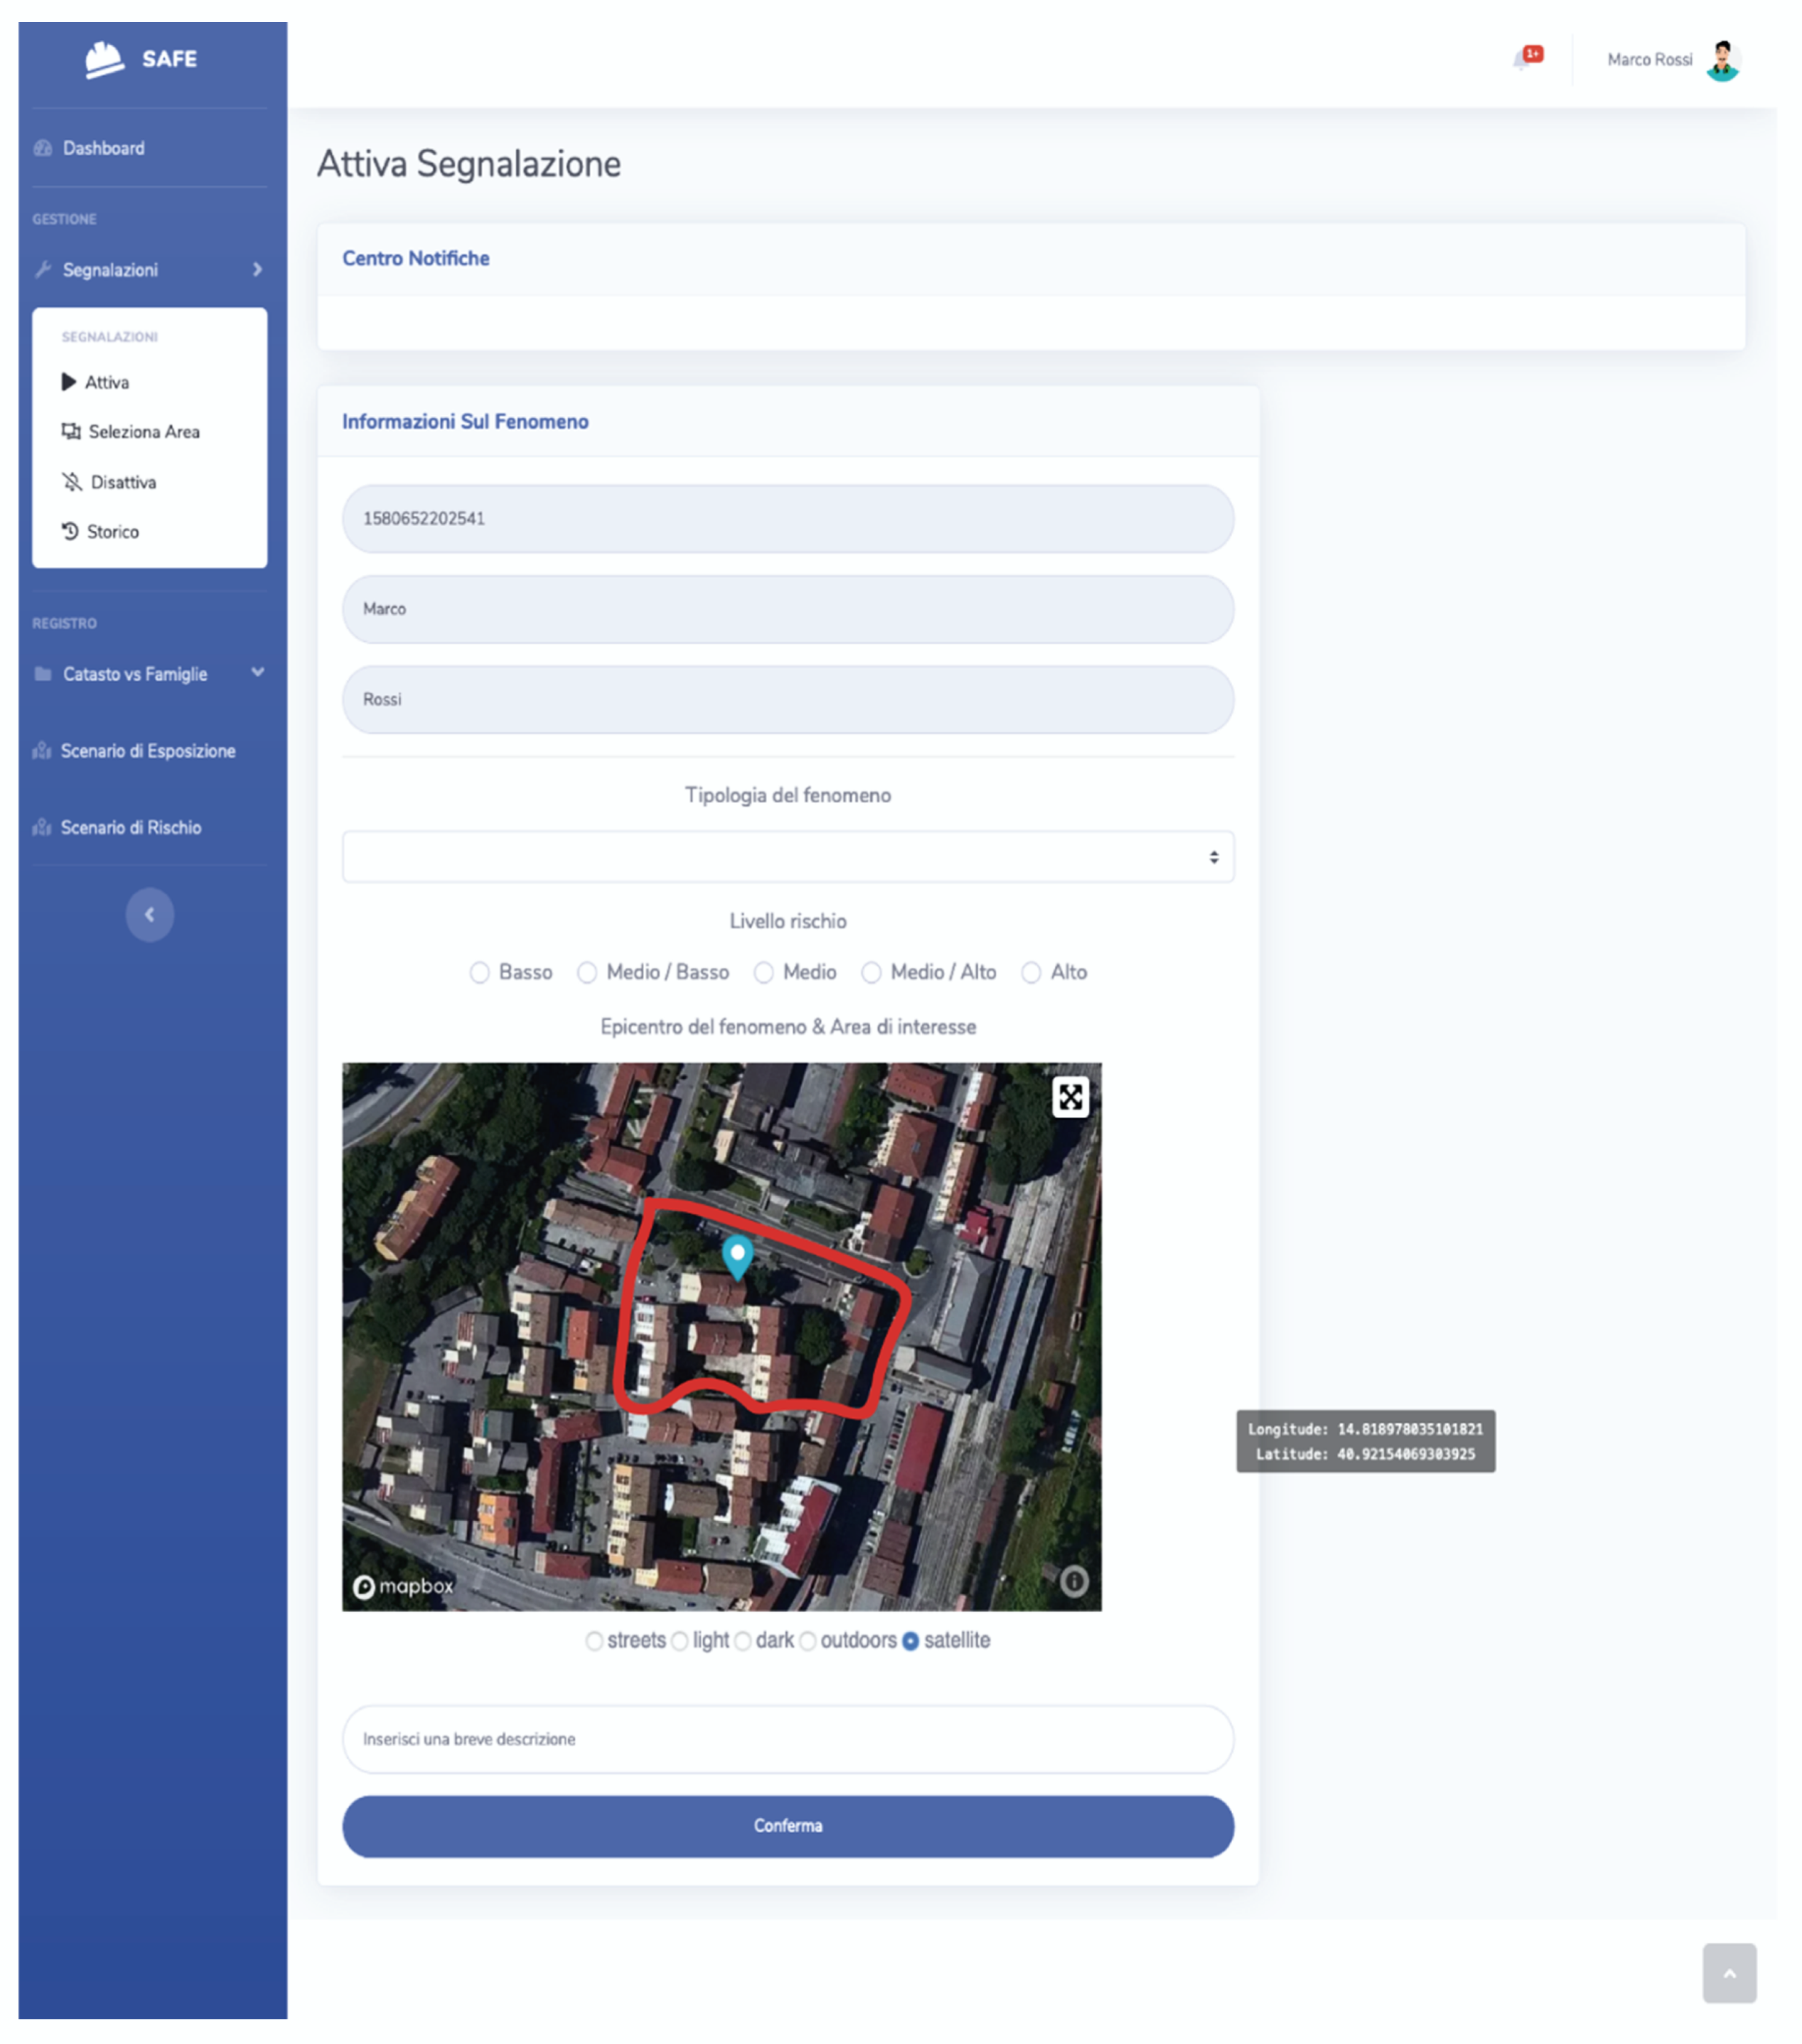
Figure 15 shows the form that should be filled in order to define the location of a new alarm referring to the occurred phenomenon. The area of interest can be either pointed or specified by free-hand drawing the appropriate geometry, as shown in
Figure 16, where a zoomed portion of the form is displayed.
Once the risk zone is specified, layers relevant to the phenomenon are displayed, such as Buildings, Points of Interest and Streets.
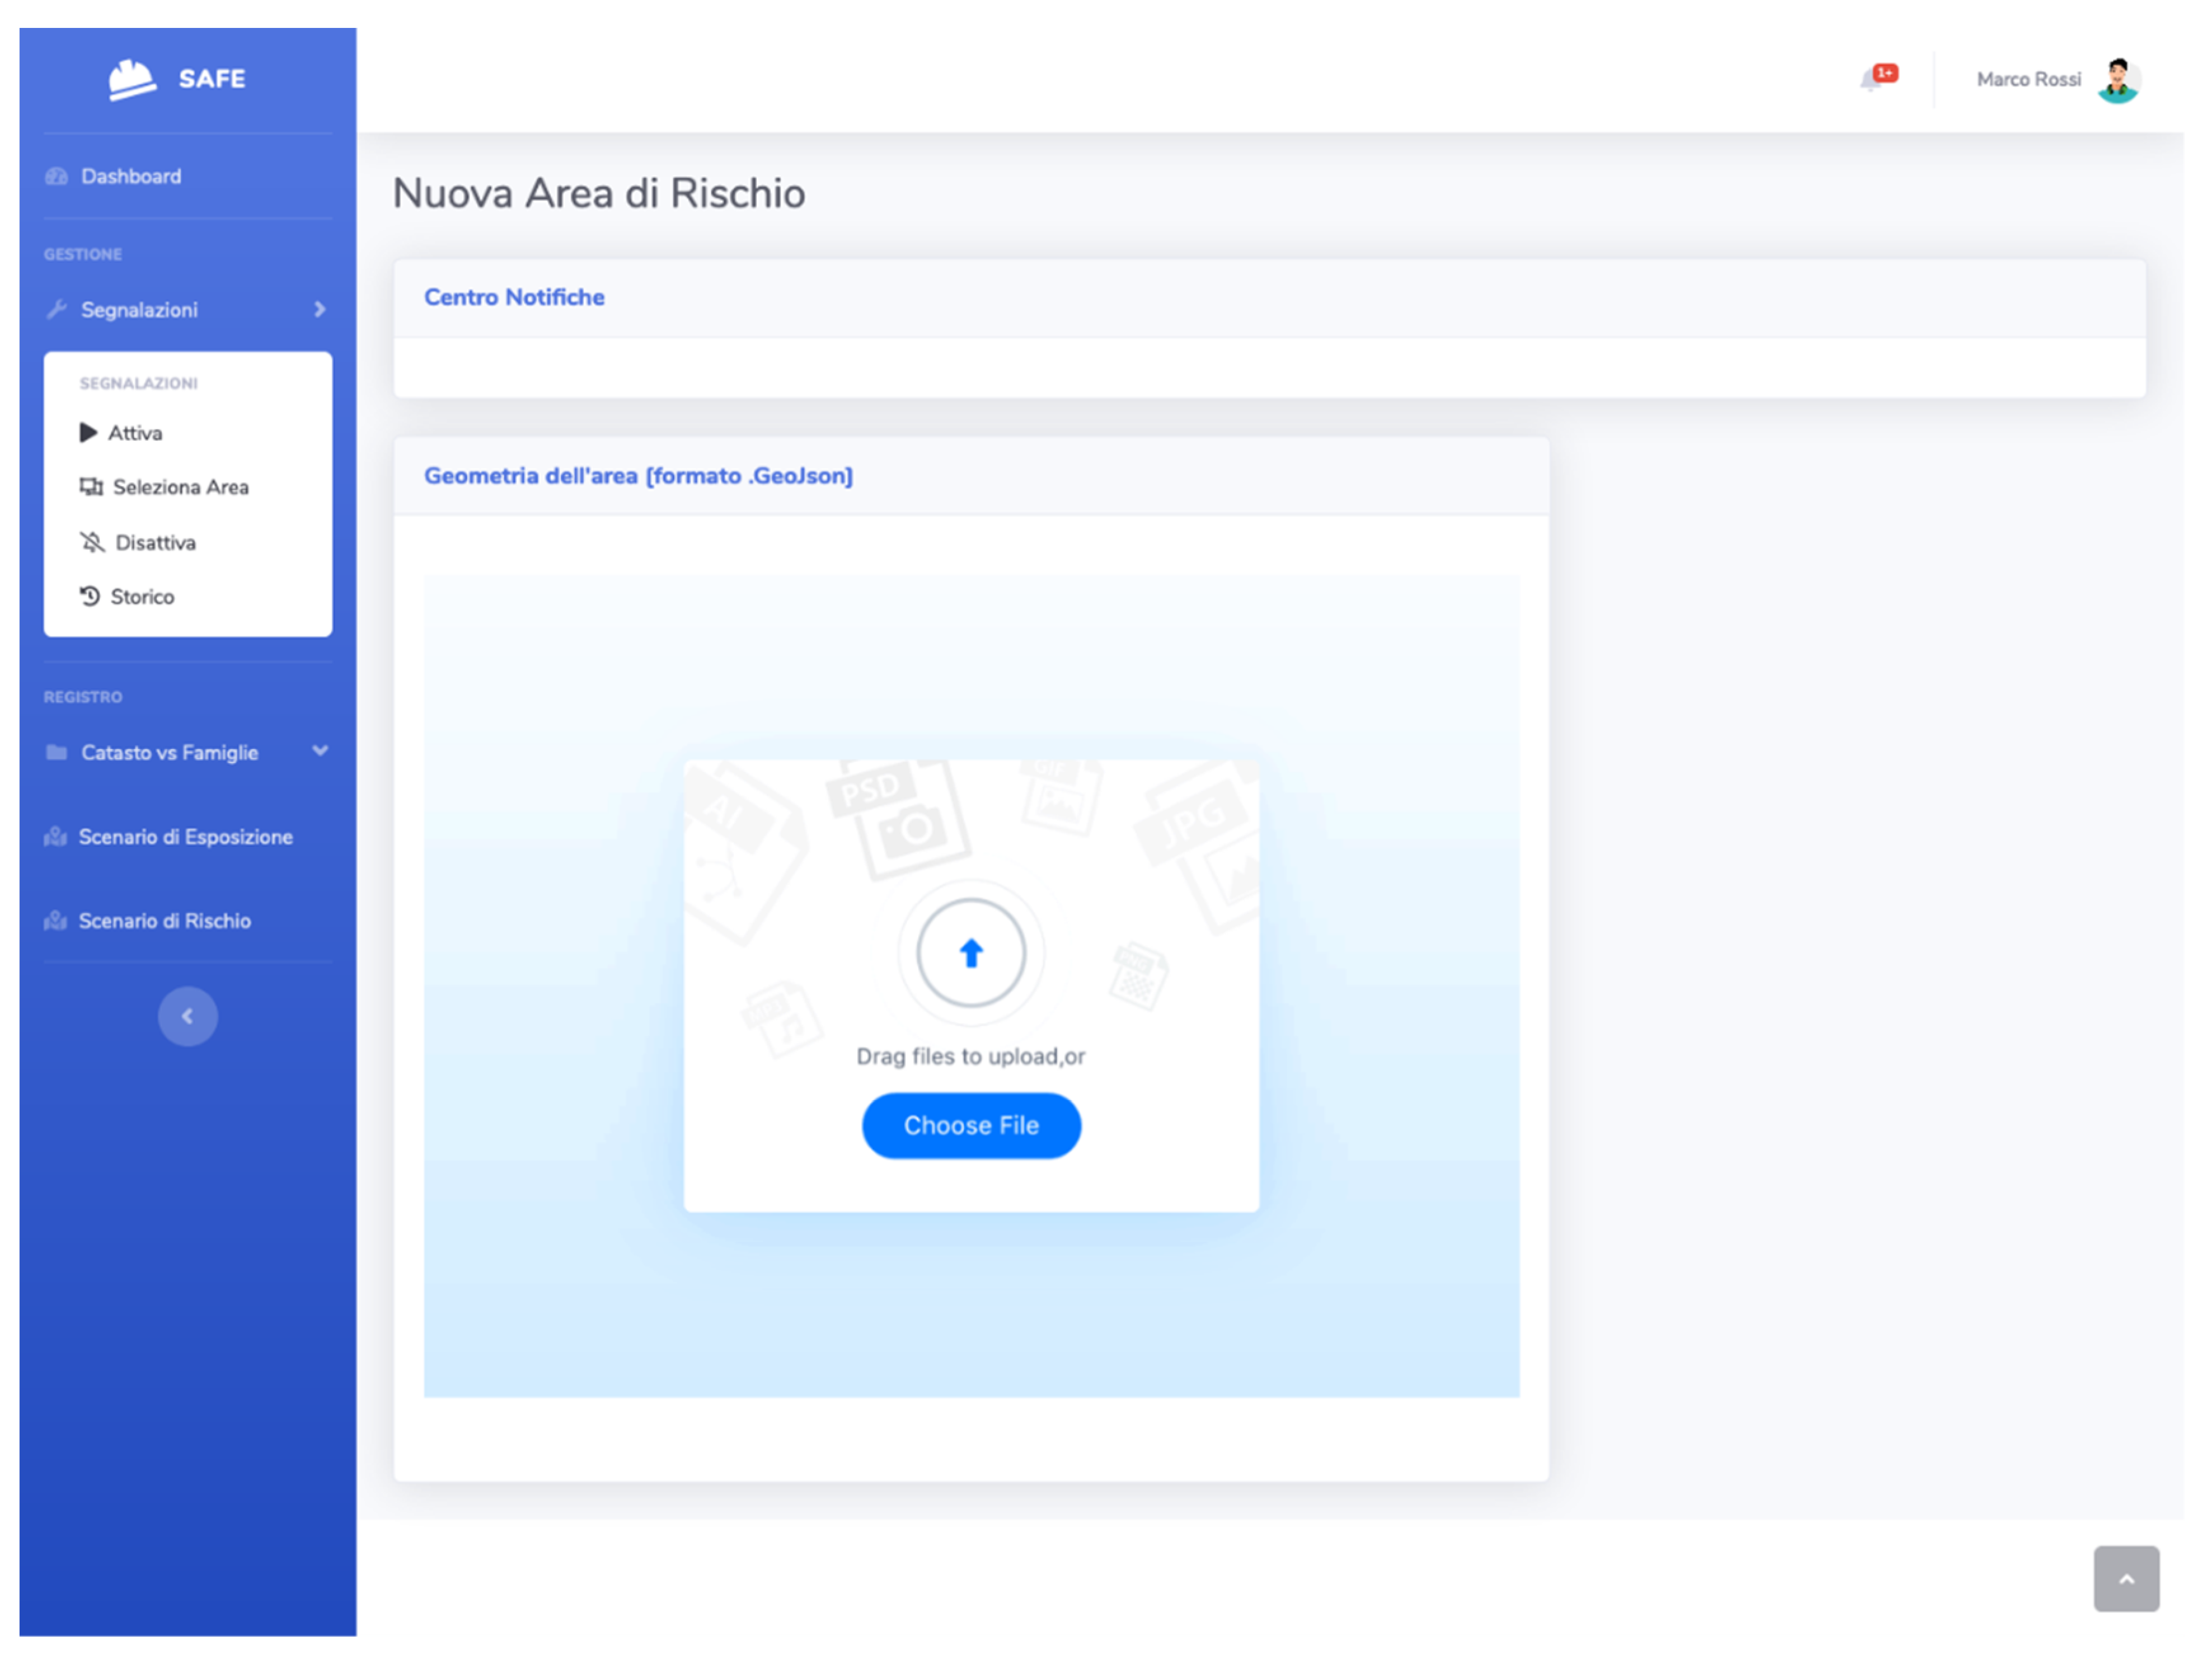
In case a new area should be added to the set of pre-defined ones, the Land Monitoring function allows users to upload the corresponding geojson file that describes the polygon in terms of a set of points.
Figure 17 shows how it can be invoked.
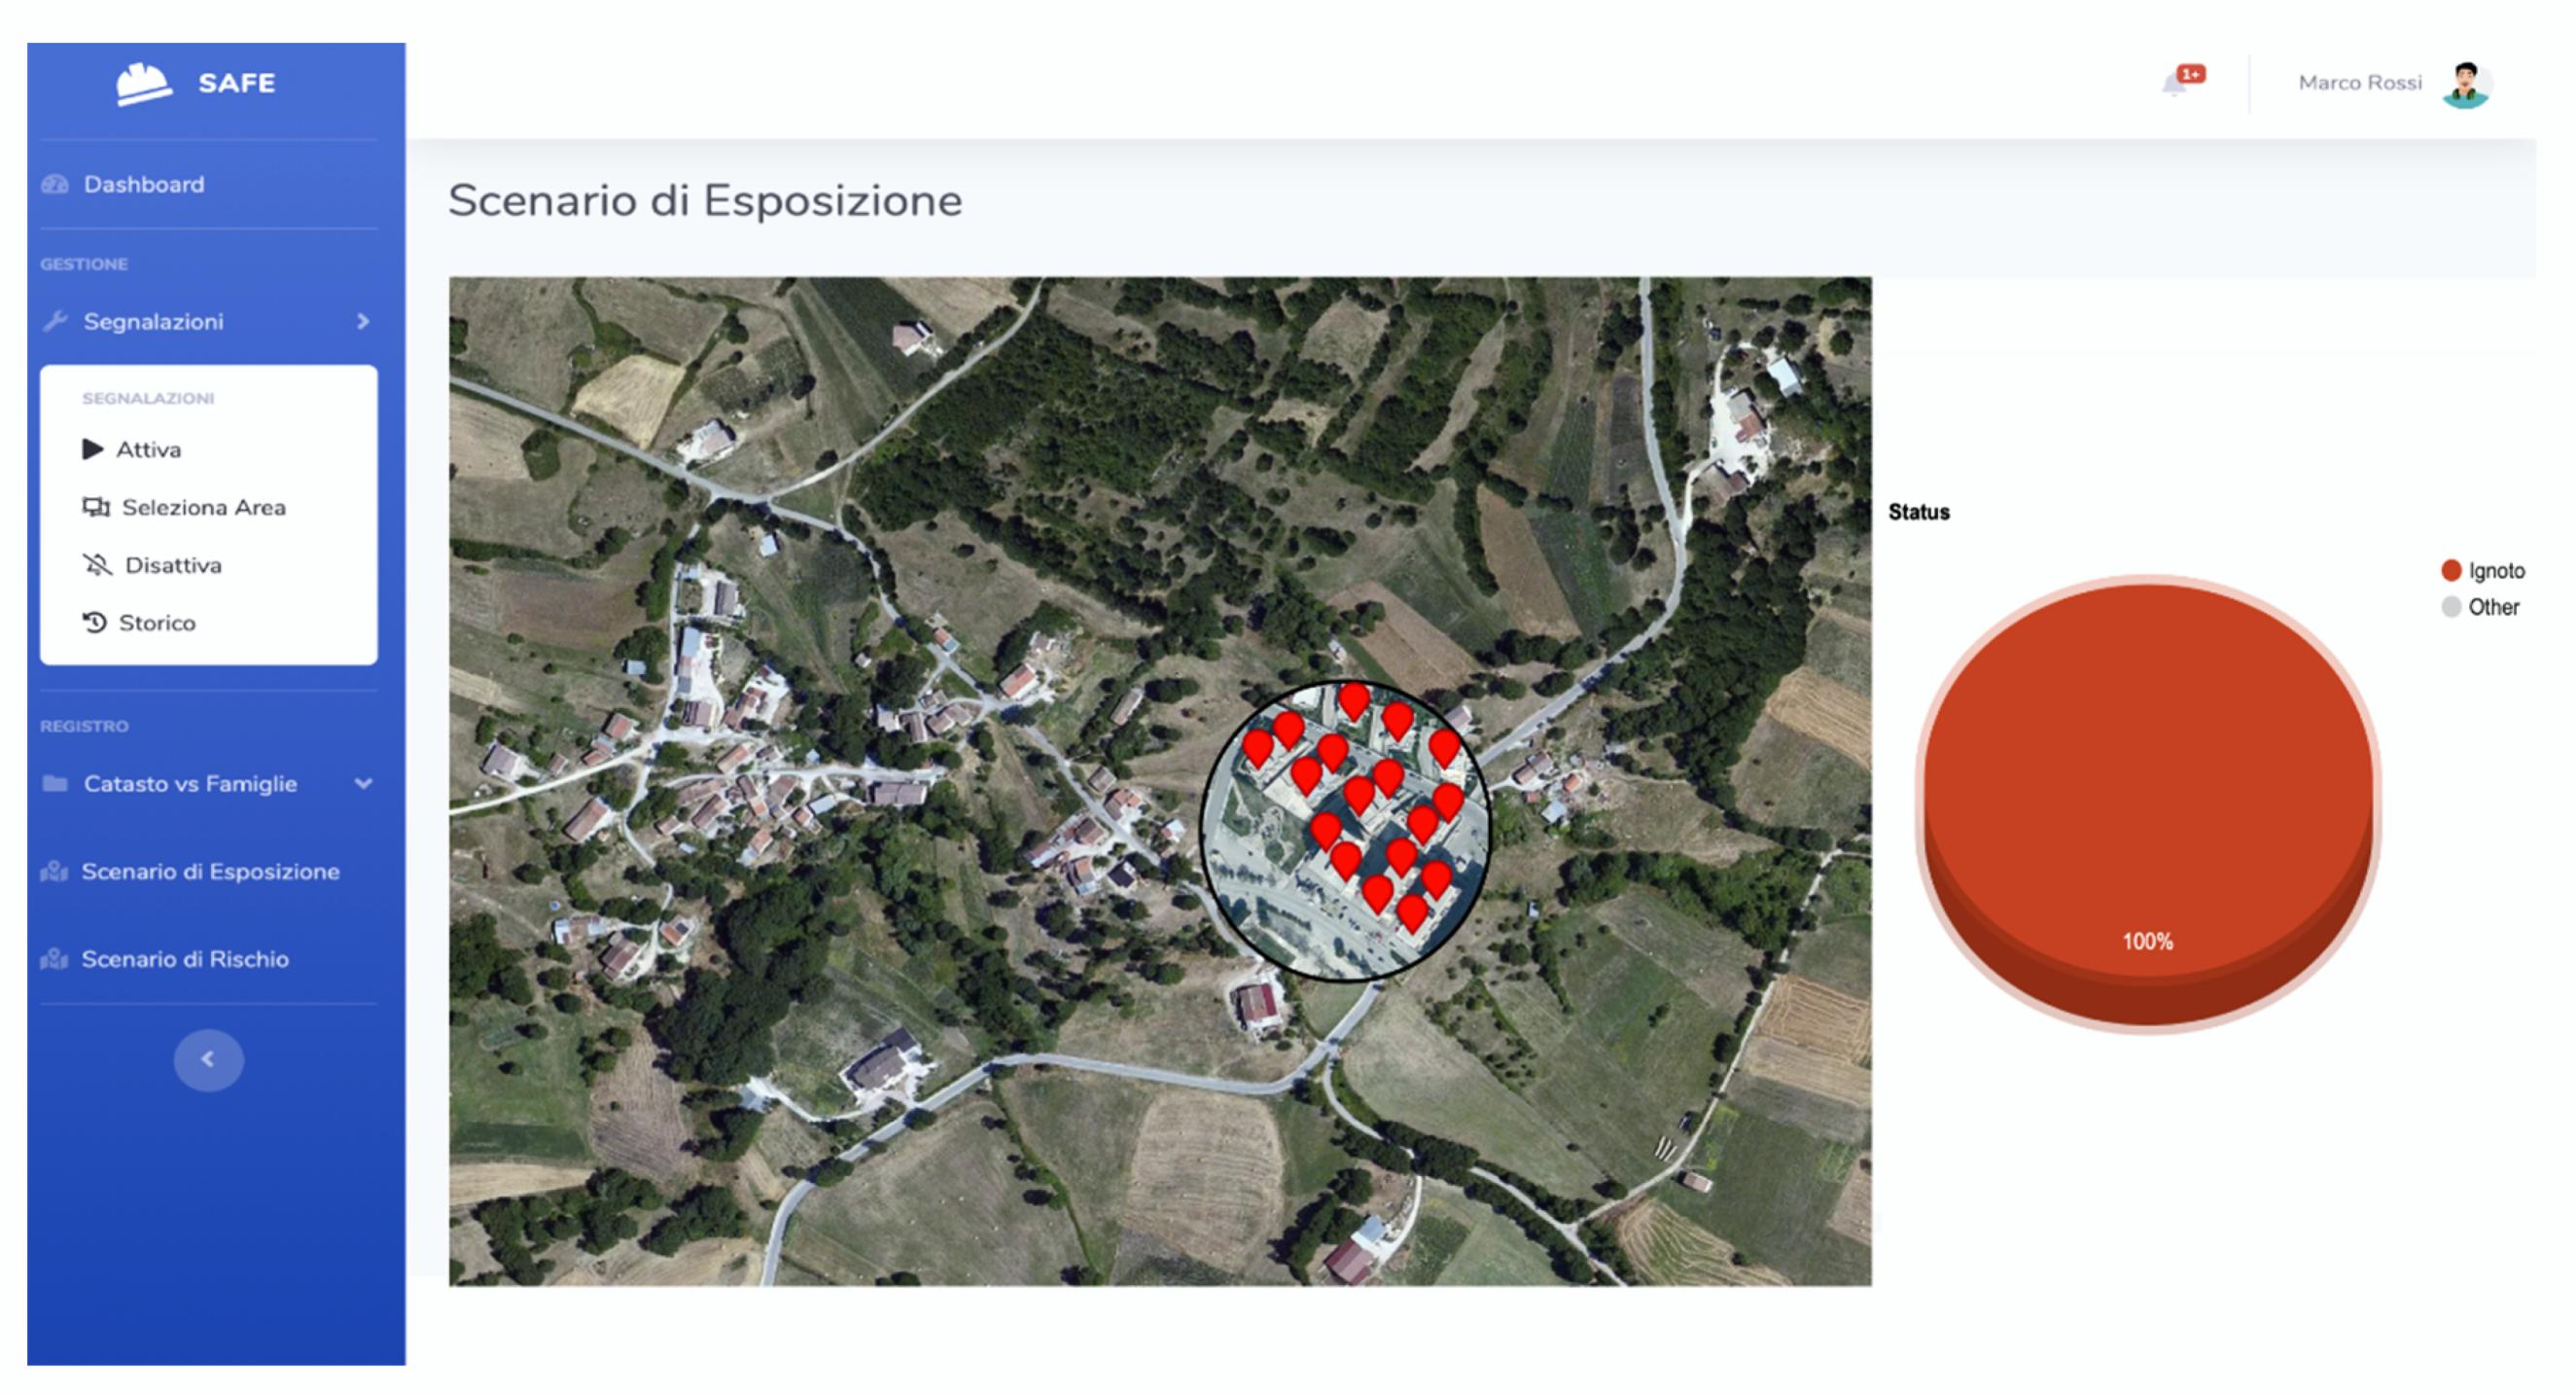
Once the decision maker has launched the alert, citizens located in the area of interest receive a notification on their mobile device.
Figure 18 shows a zoomed portion of the involved territory. Balloons representing both Family and Neighborhood users are red to indicate that, until SAFE receives feedbacks, citizens are in an unknown state. The diagram on the right side represents the Exposure scenario and visually summarizes the global distribution of the users’ state in terms of safe (sicuro), unsafe (pericolo) and unknown (ignoto) states. Values associated to it fill in the formula to calculate the risk parameters in real time.
4.3. Citizens’ Role
From a user point of view, the citizens’ involvement is prominent. Once they received an alert on their mobile device, the householders can communicate the necessary information about the state of each family’s member, while each member can notify only her/his own state. The timeliness of this action makes the difference both in terms of human lives and in terms of optimizing the distribution of rescue interviewees.
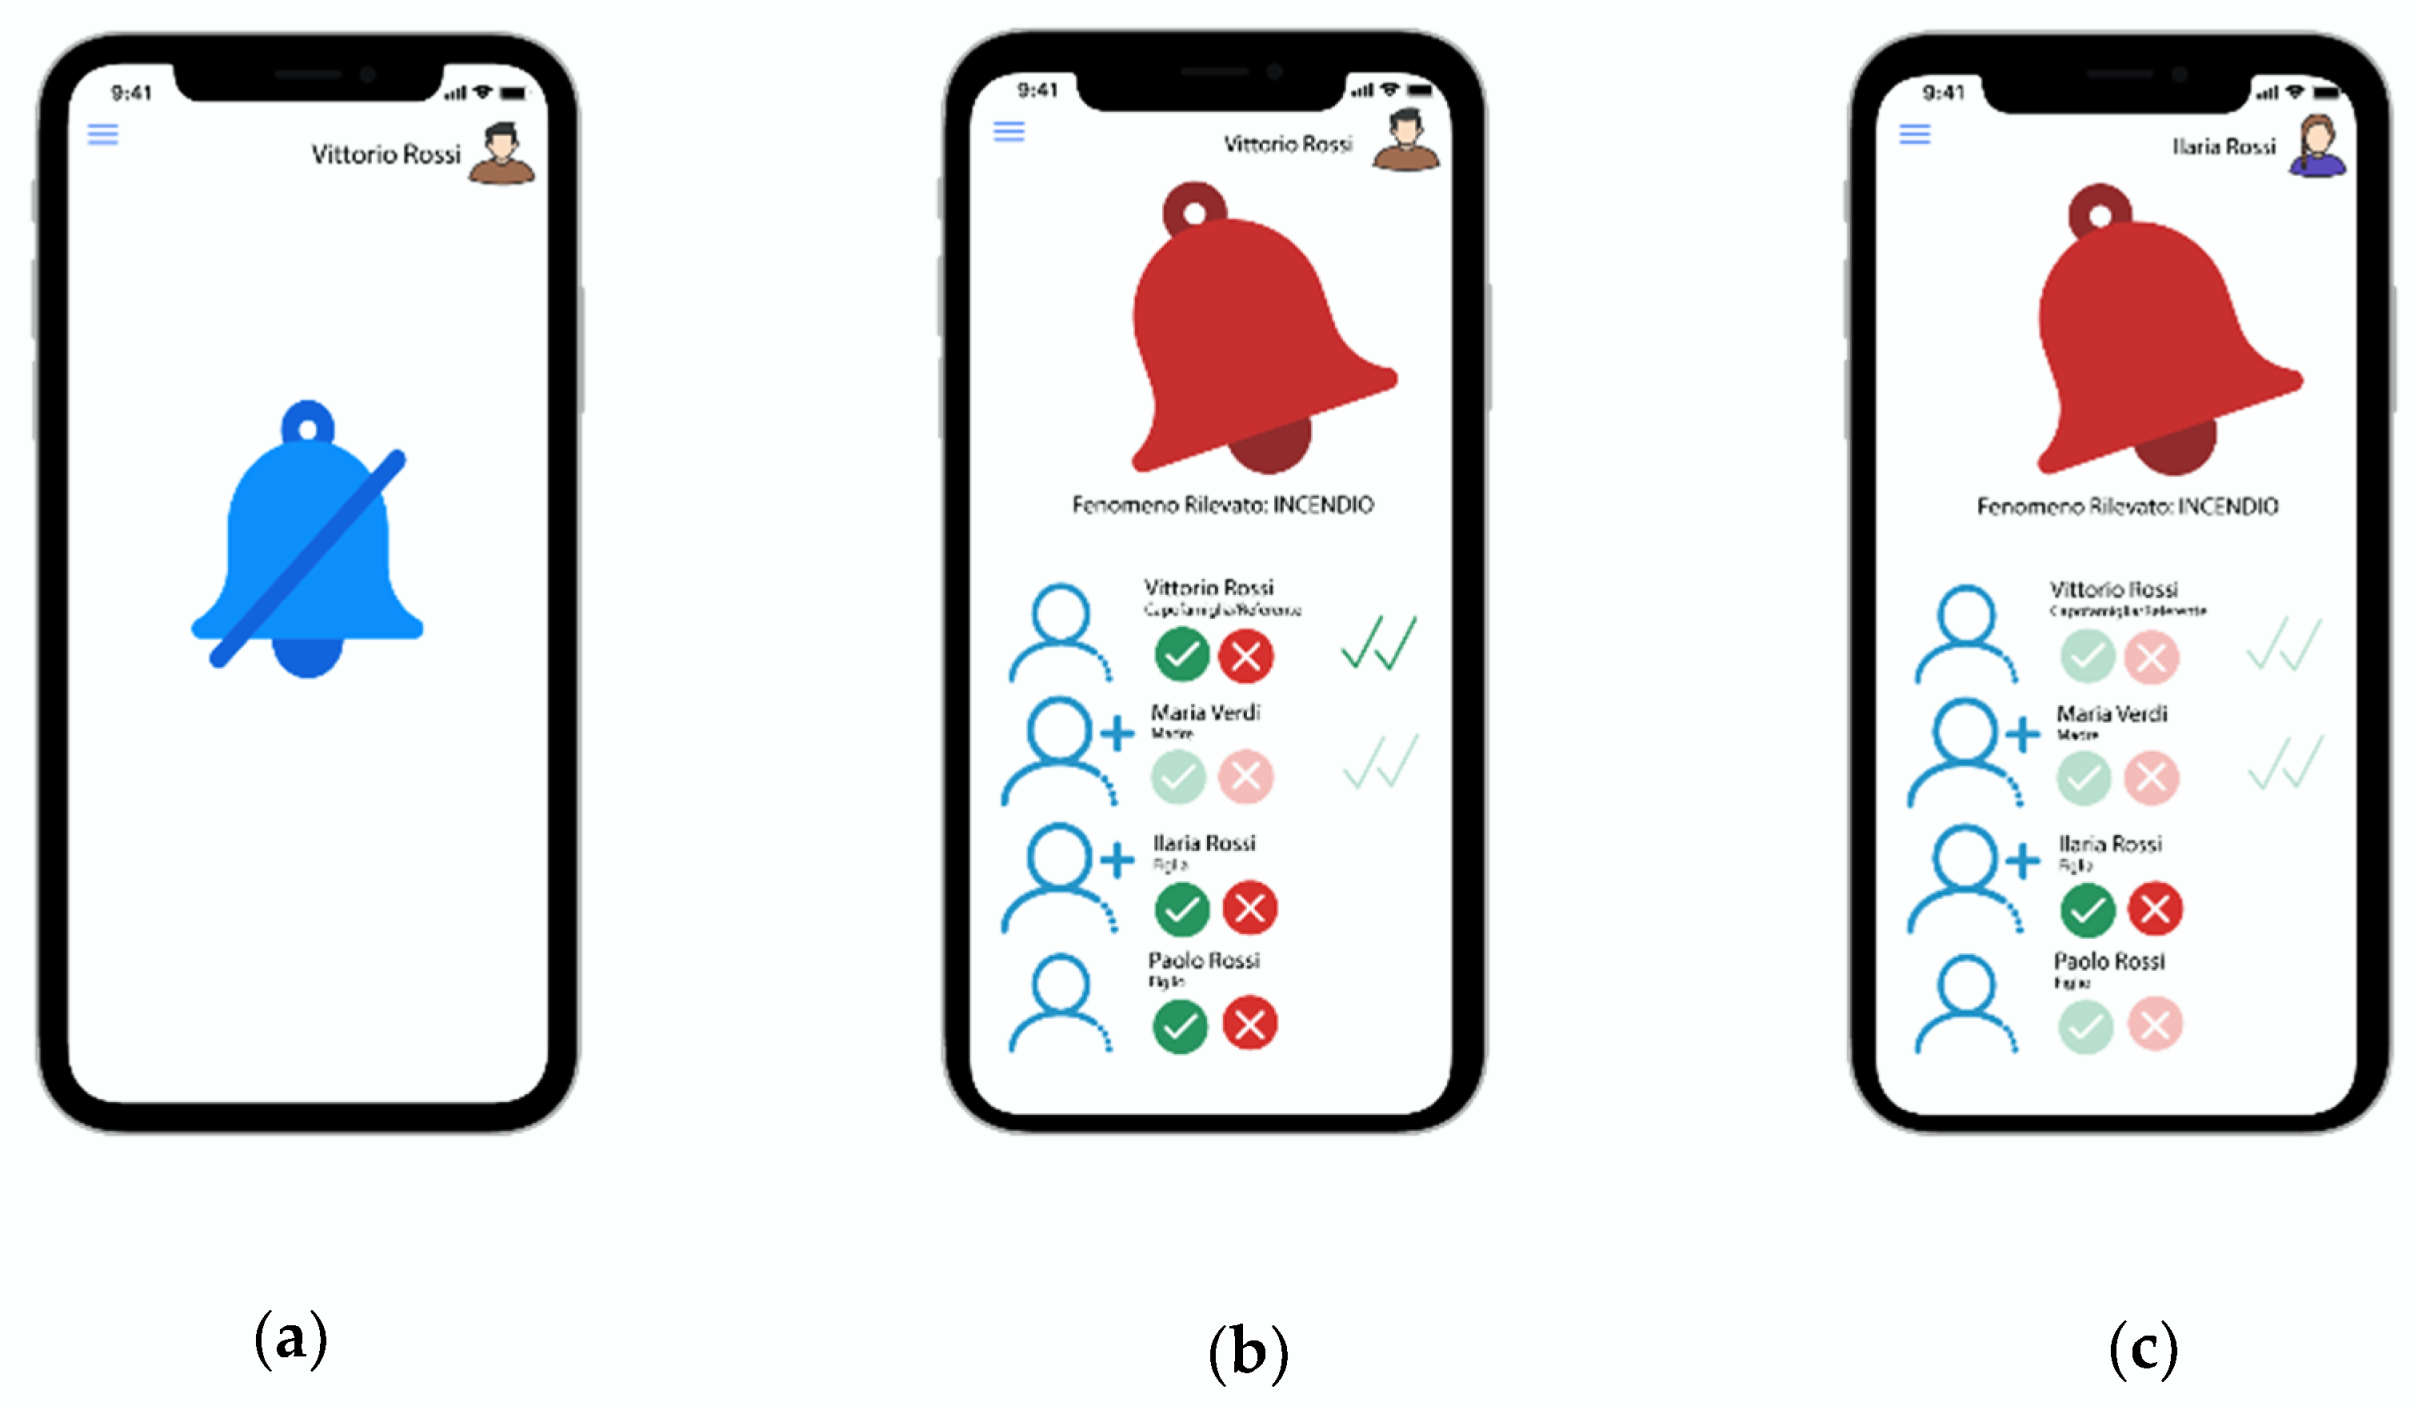
Figure 19a–c shows the mobile interface by which a citizen is involved in the SAFE activities. In particular,
Figure 19a shows that there are no notifications for Vittorio Rossi. In
Figure 19b, the citizen has been notified that a fire is occurring. He provides a “safe state” for himself, while his wife, Maria Verdi has already provided the same feedback by herself. The global state of his family is however still in a warning situation (yellow colored balloon) because no feedback has been given for the children, Ilaria and Paolo.
Figure 19c displays the interface available for Ilaria. She can be aware of what other members have set but can give information only about her state.
As the users’ notifications arrive, the color of the balloons can change accordingly. It becomes green when each person associated to it is in a safe state. Differently, it remains red if even one person is in an unknown state, while it becomes yellow if even one person needs aid.
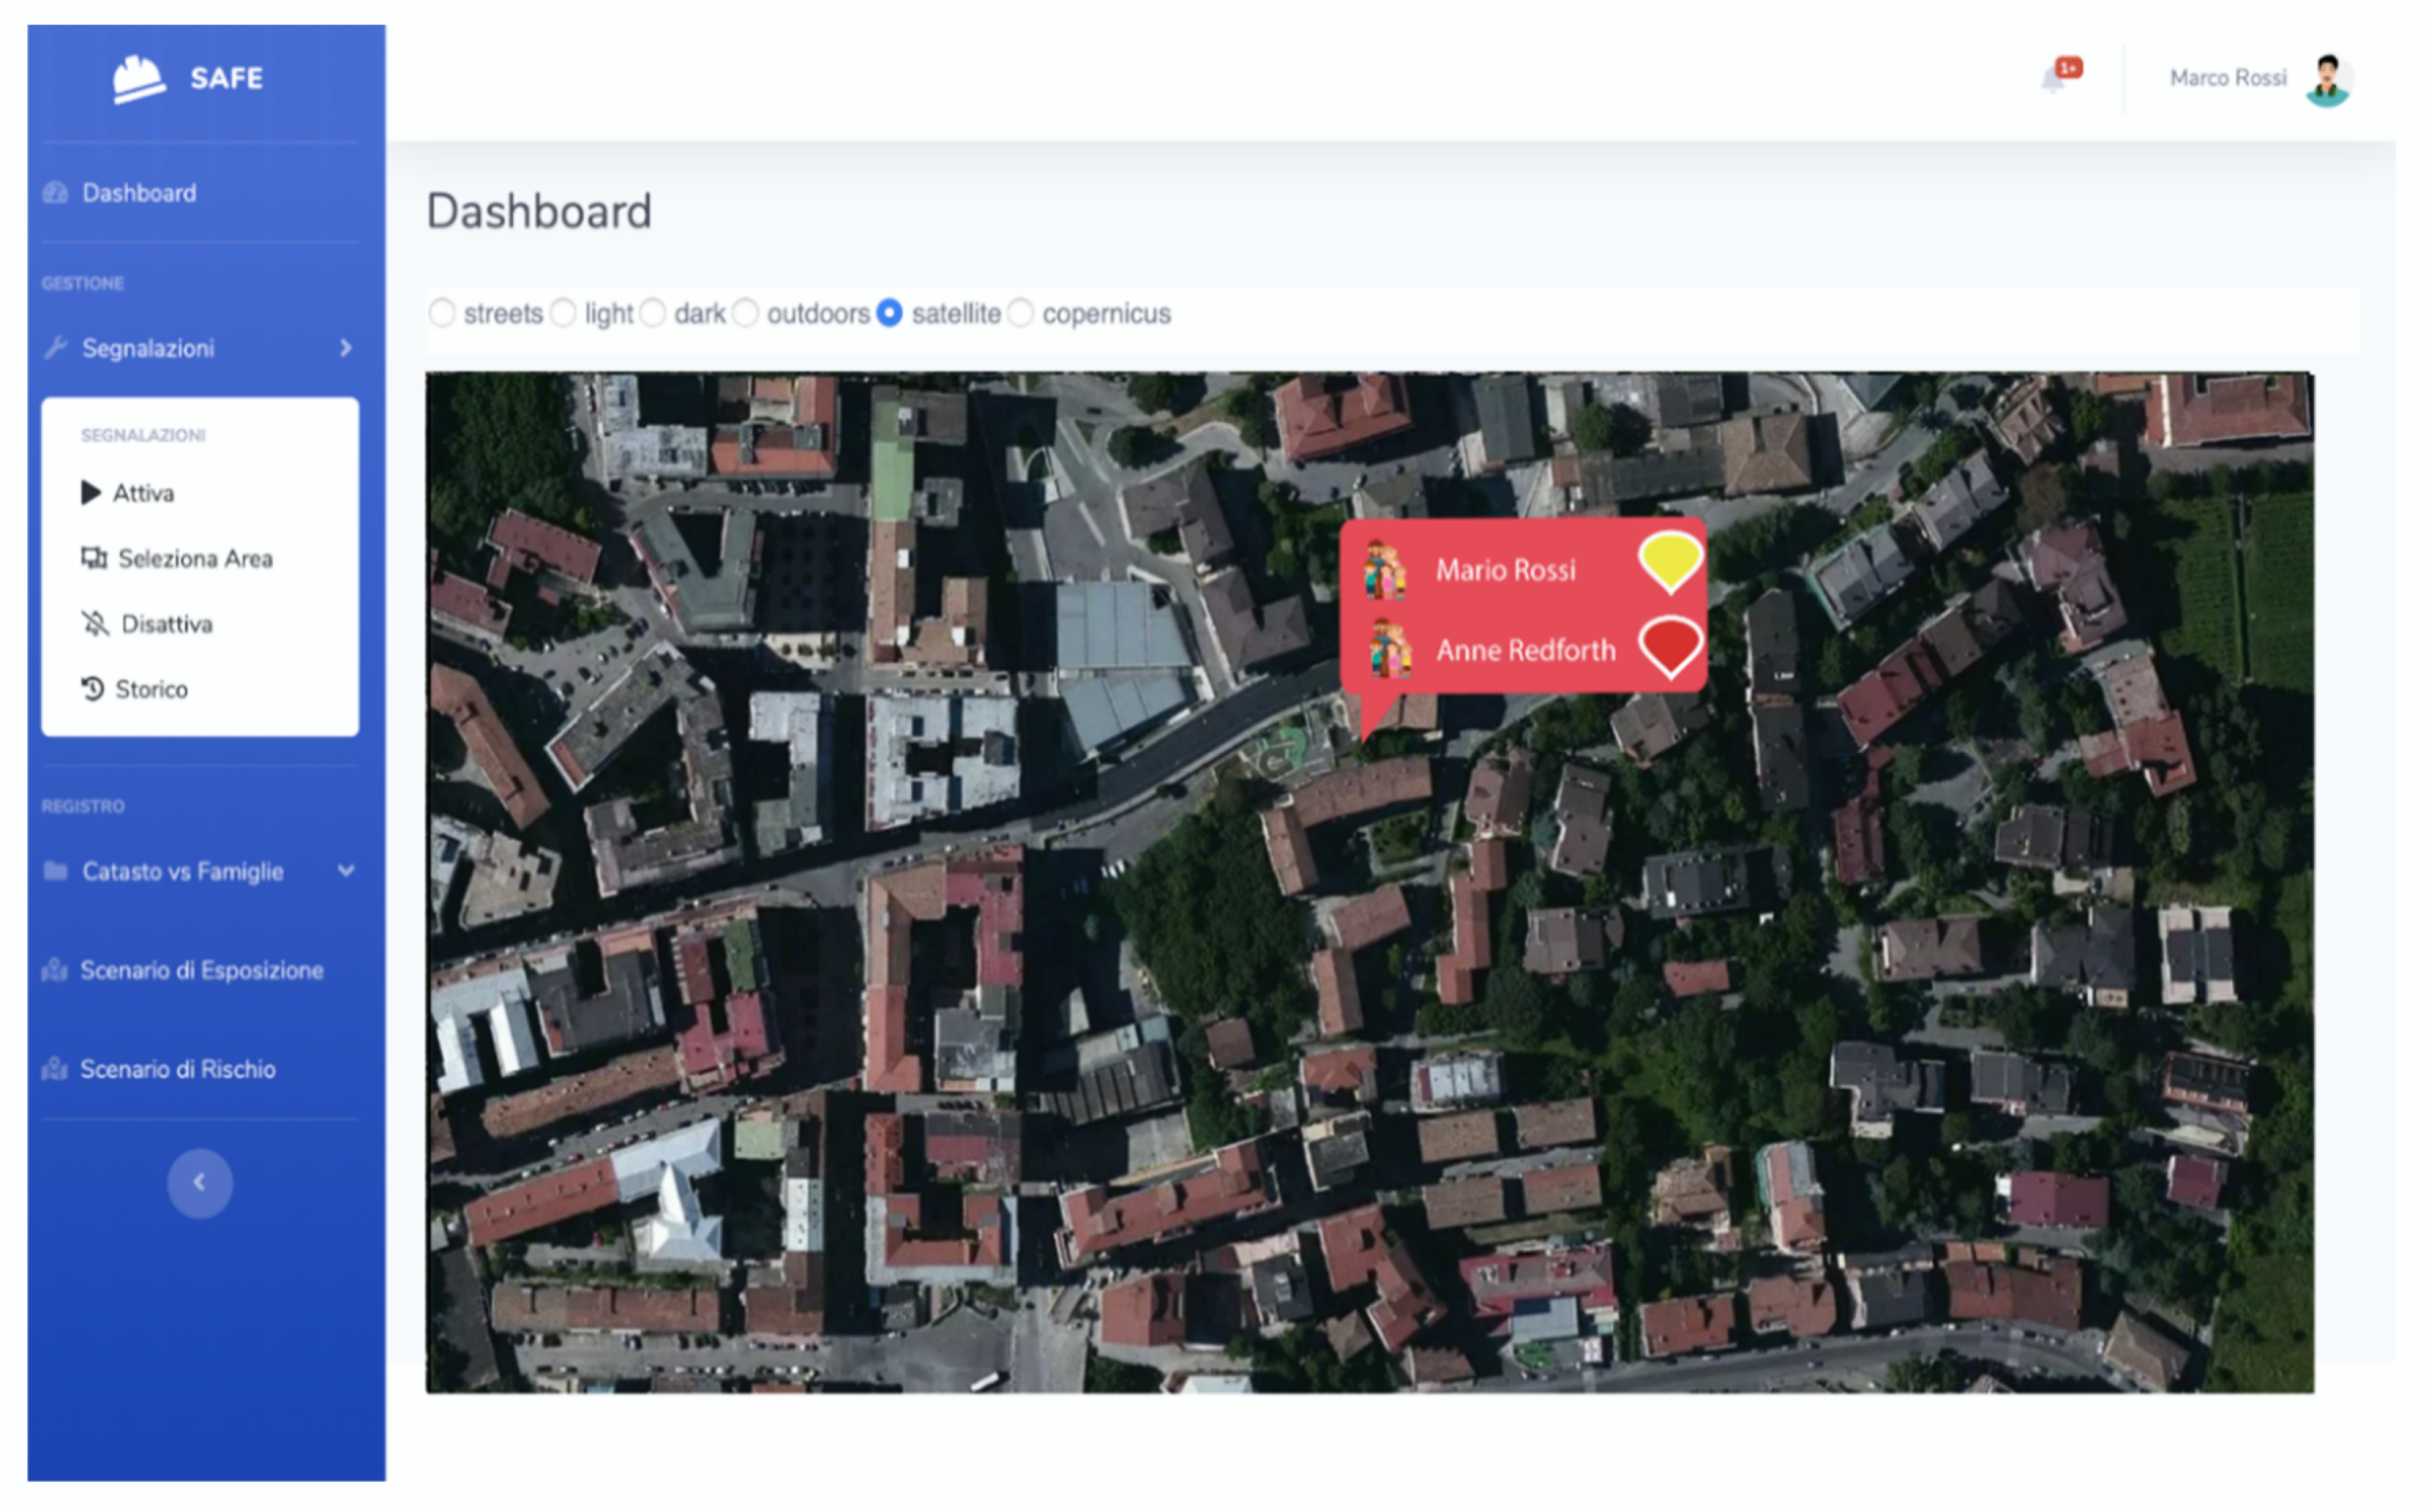
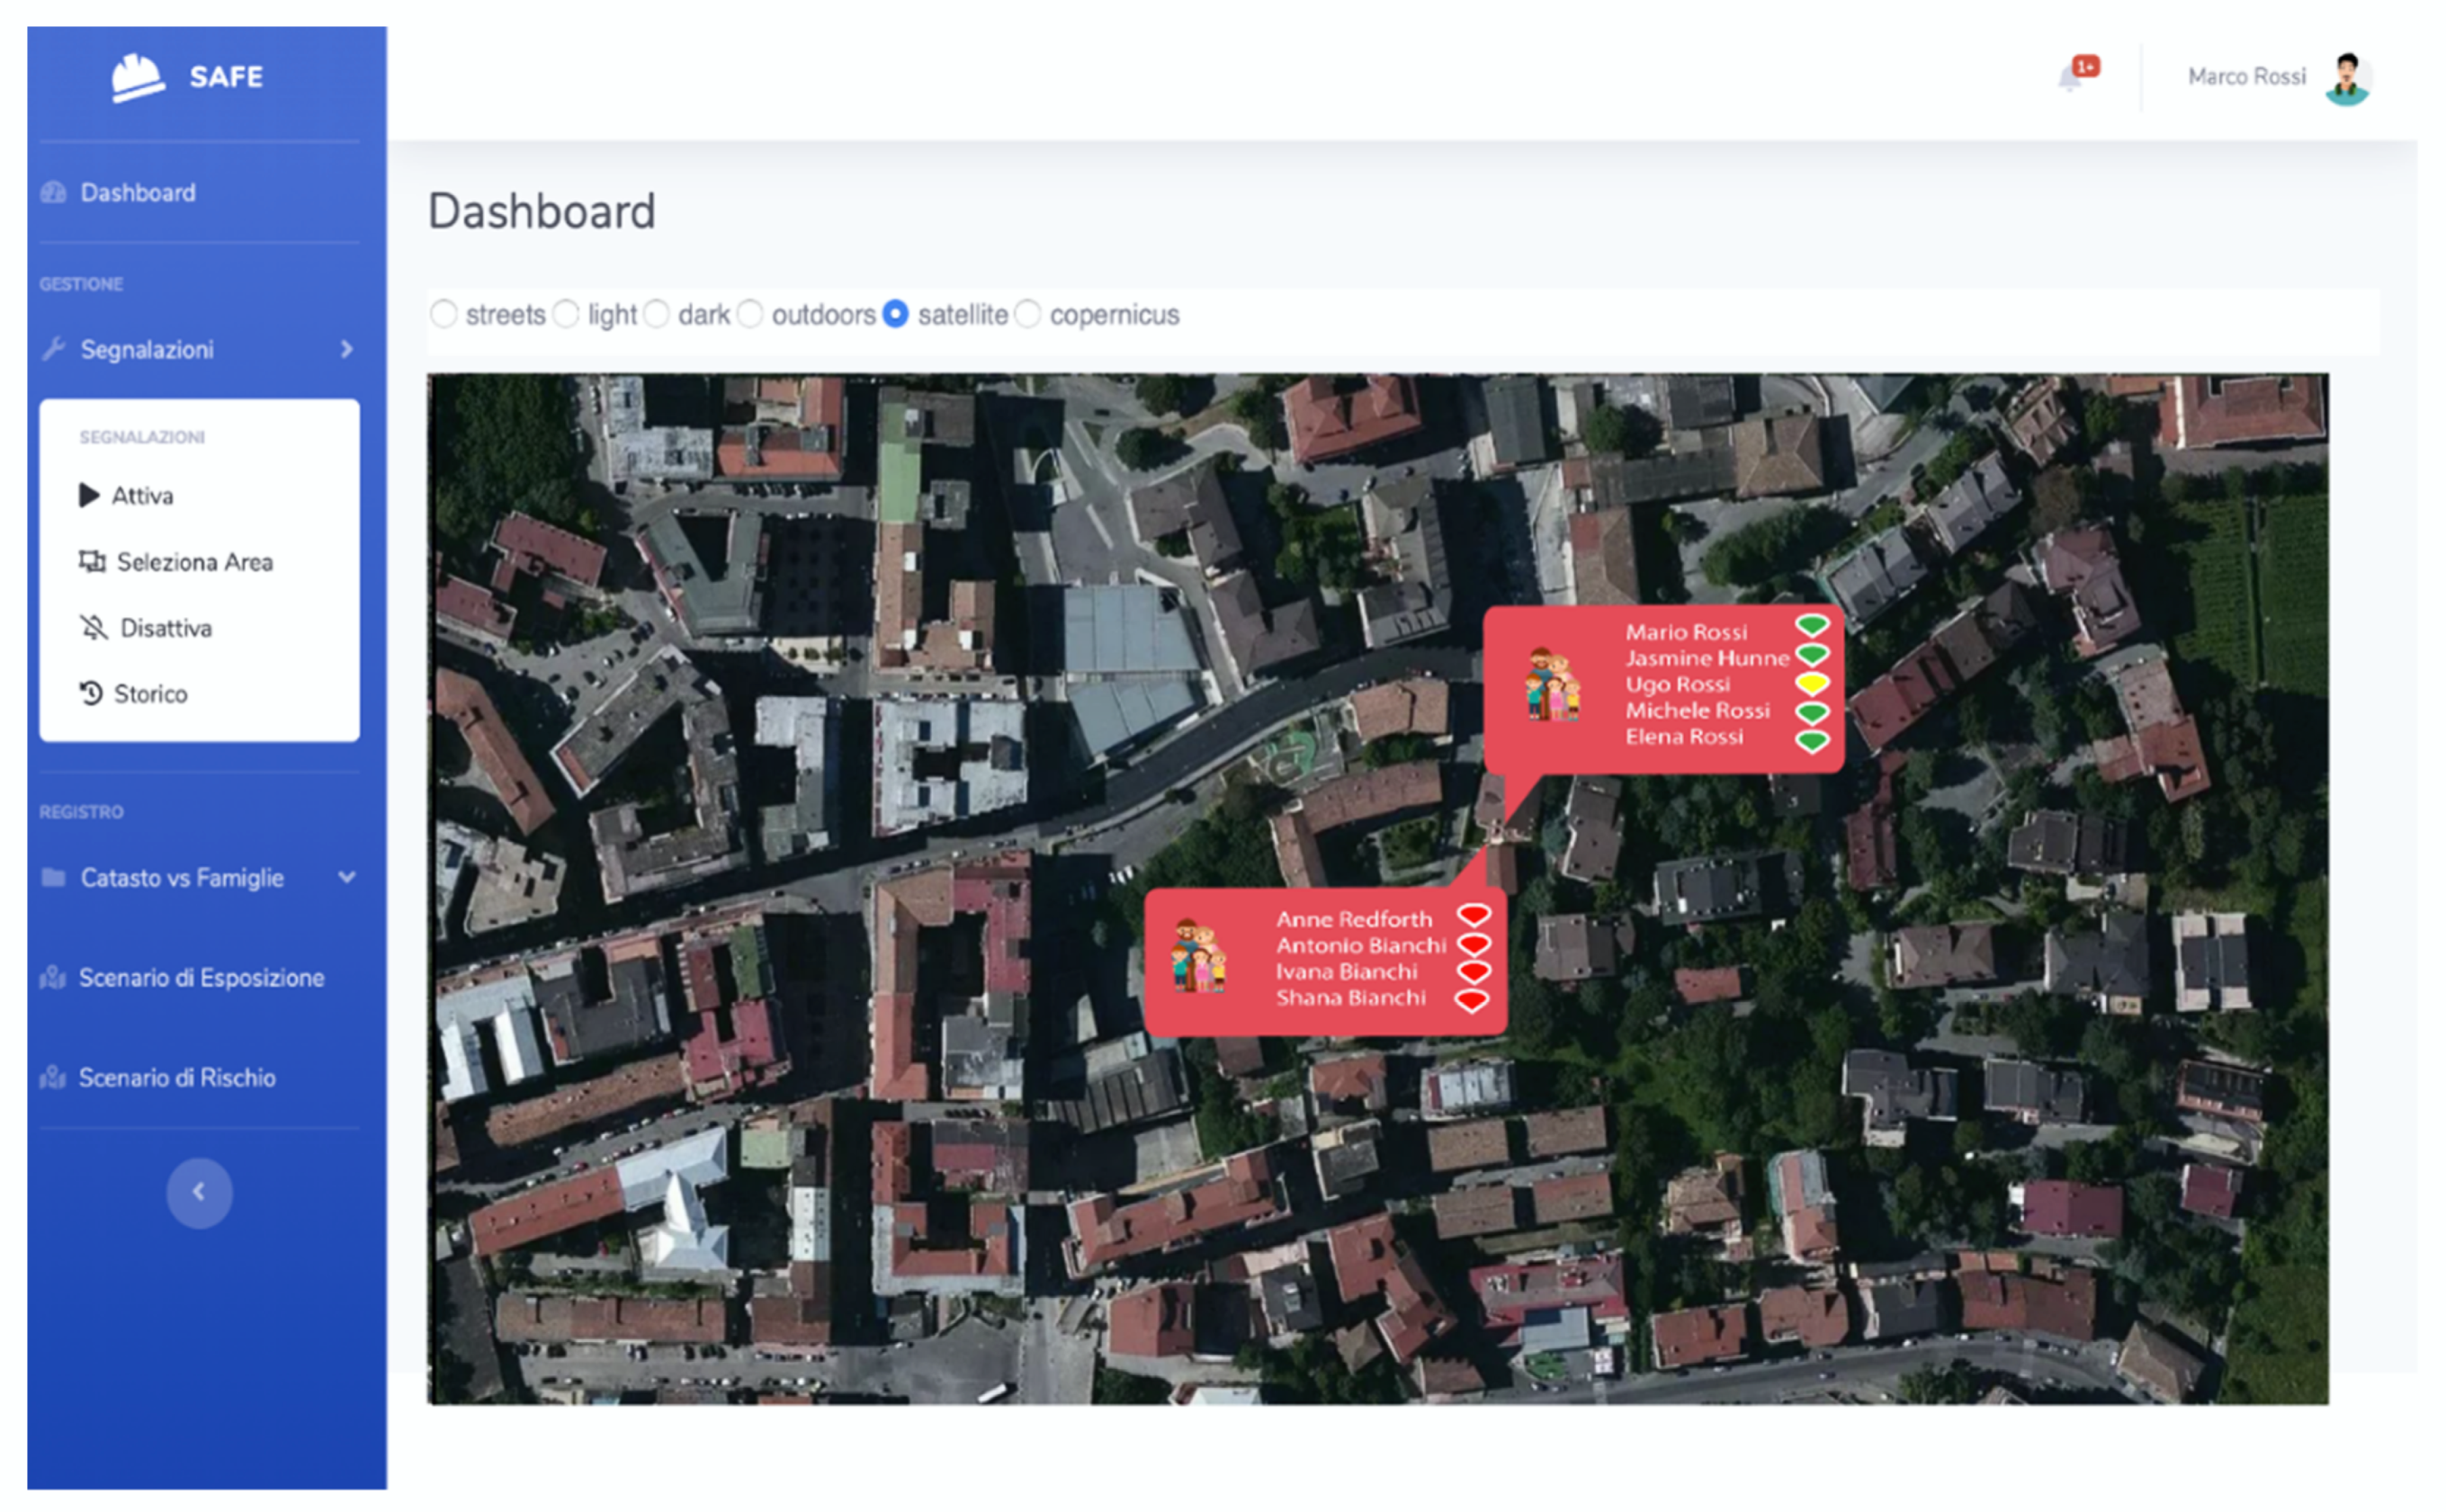
Figure 20 shows two balloons associated to two different Family geometaphors.
When selected, each balloon lists the members associated to it and their state.
Figure 21 shows such information for both the families.
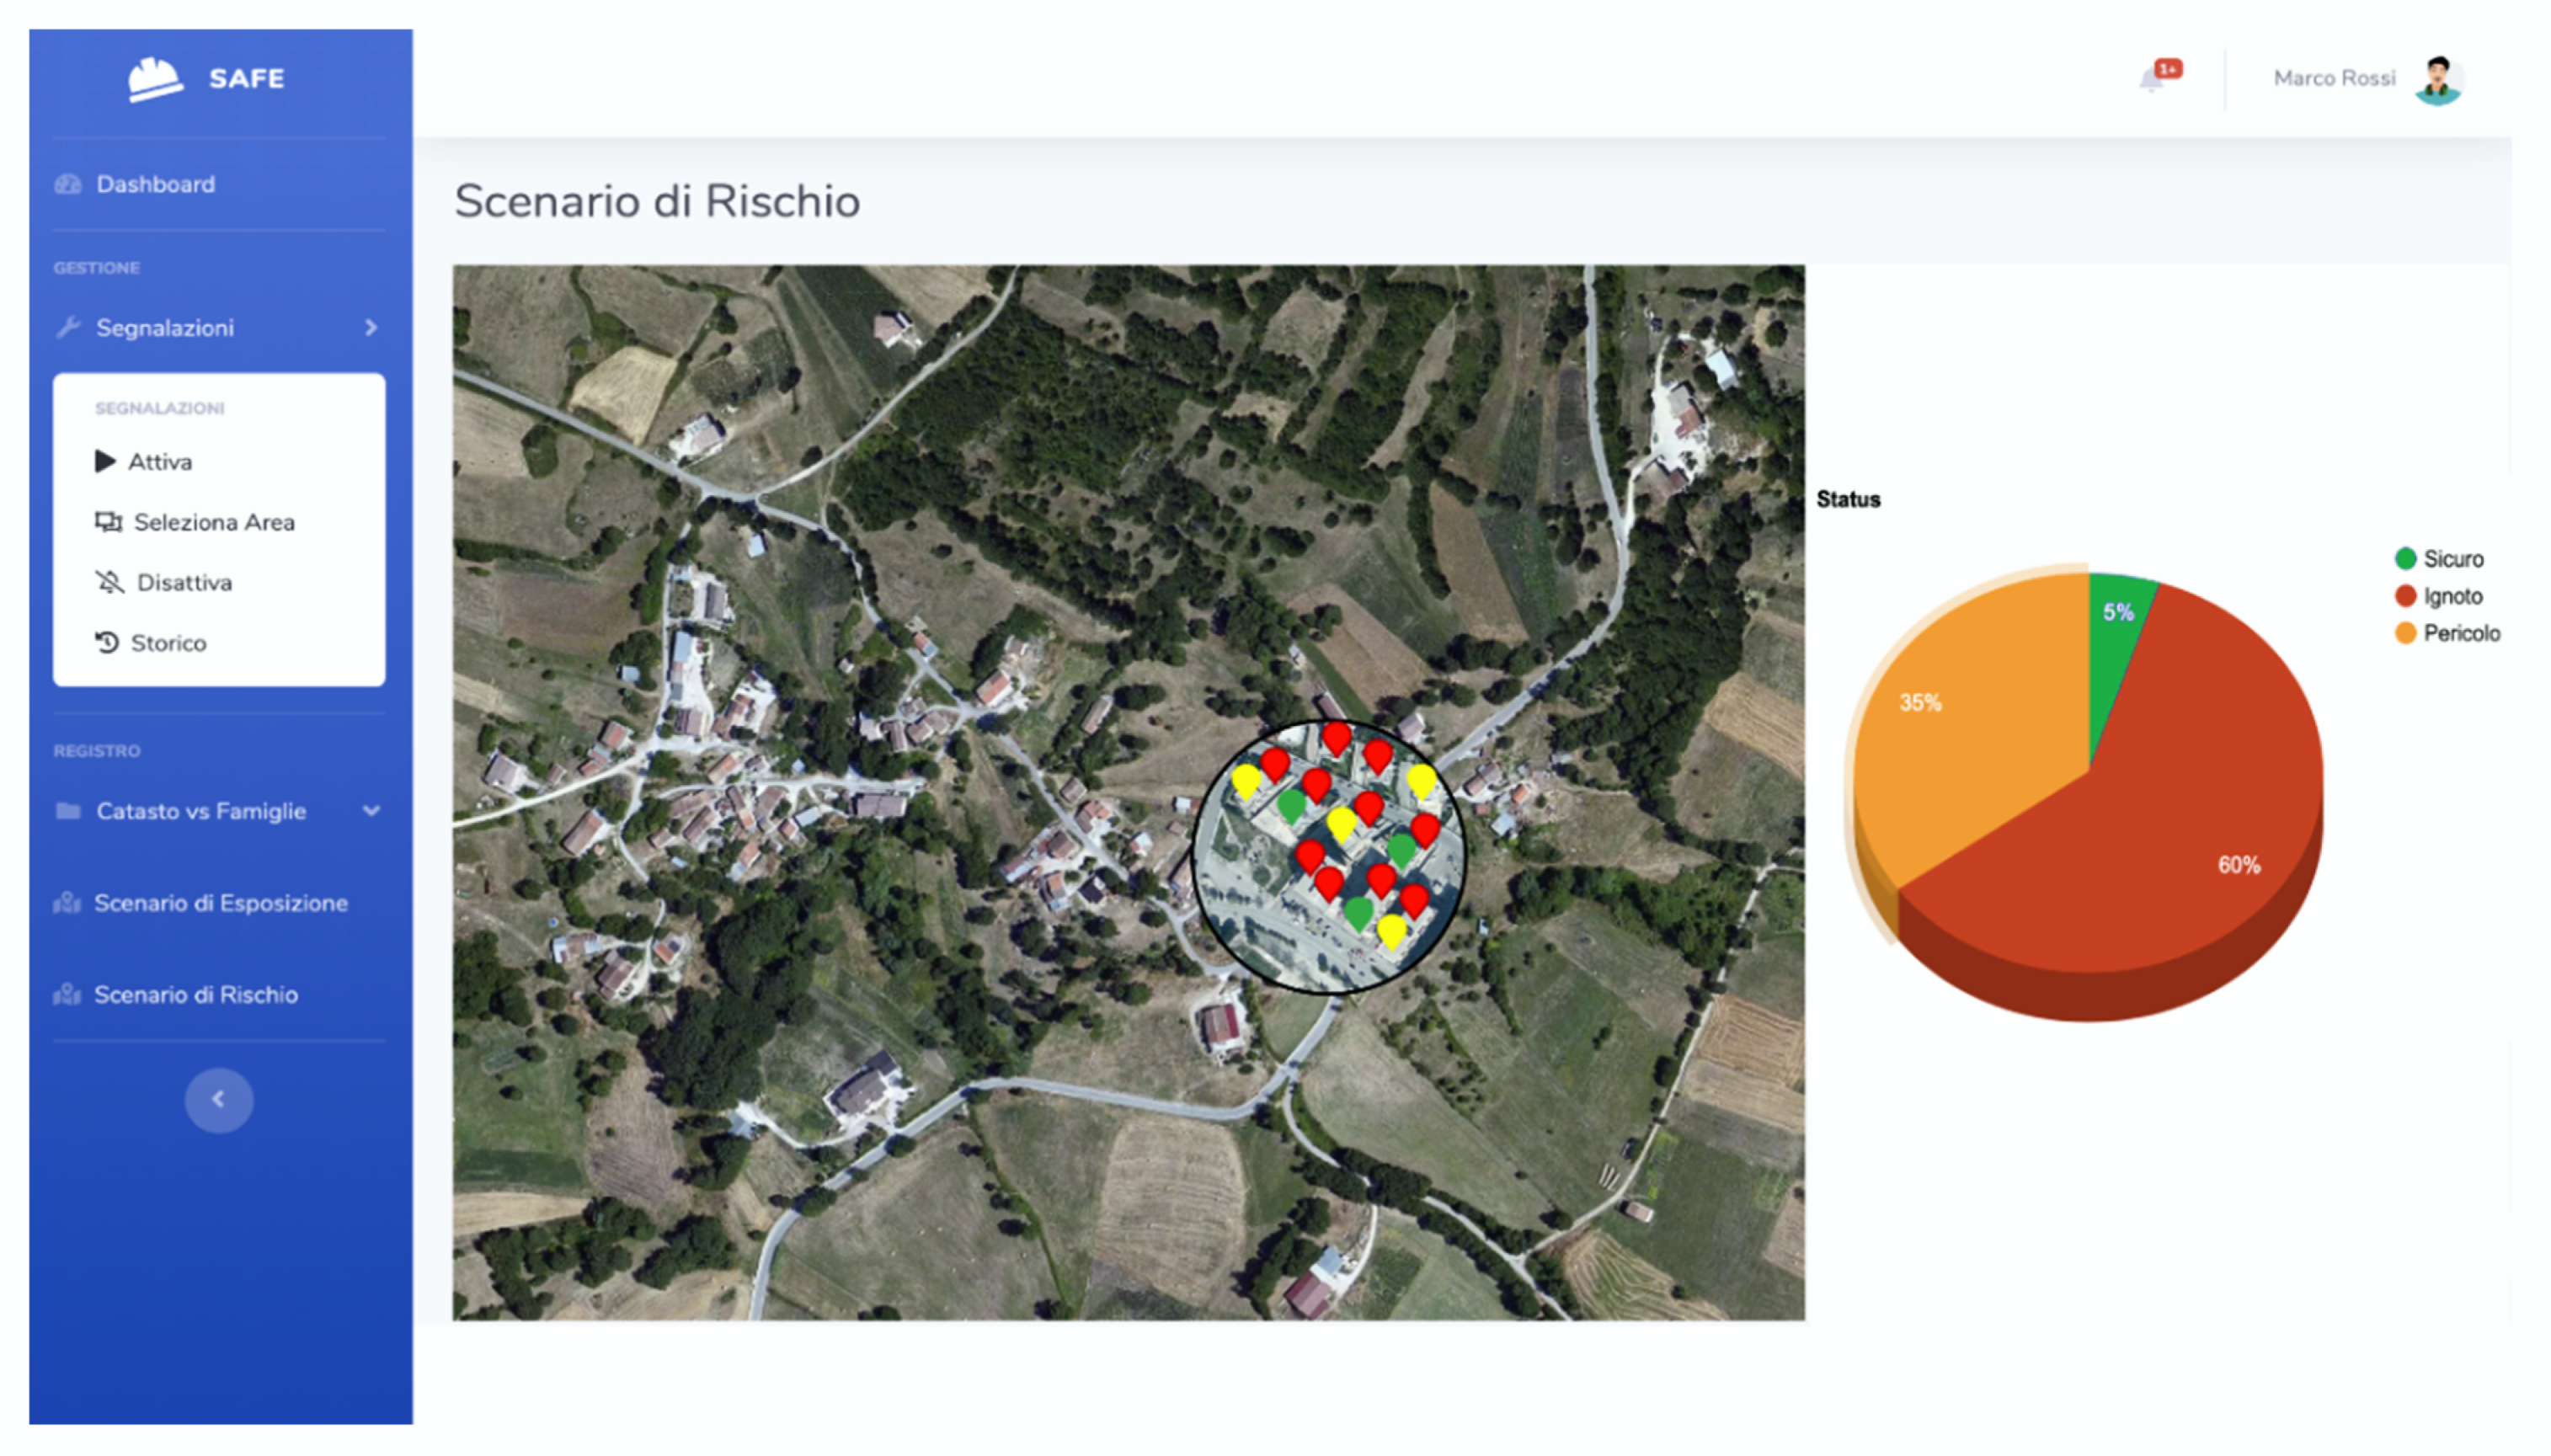
In SAFE, it is relevant to make the variables, coming into play during the Risk calculation, visible to the decision maker and at the same time that their values are as realistic as possible. The proposed solution is based on the use of the Neighborhood geometaphor and in particular on the value assumed by the component that expresses its state. Then, a value associated with the quiet state matches the global value estimated or acquired through the municipal plans. Otherwise, the feedback due to the change of state (unsafe, unknown) directly influences the calculation of the variable E allowing real-time monitoring of the population distribution. Thus, through SAFE graphical elements for displaying the values of variables updated in real time, the decision maker can have a complete view of all variables involved during rescue operations and make the best decision easier.
Figure 22 displays how the scenario depicted in
Figure 18 changes in terms of both color of balloons and graphic as the citizens’ feedbacks arrive.
4.4. The Role of Control Room and On Site Responders
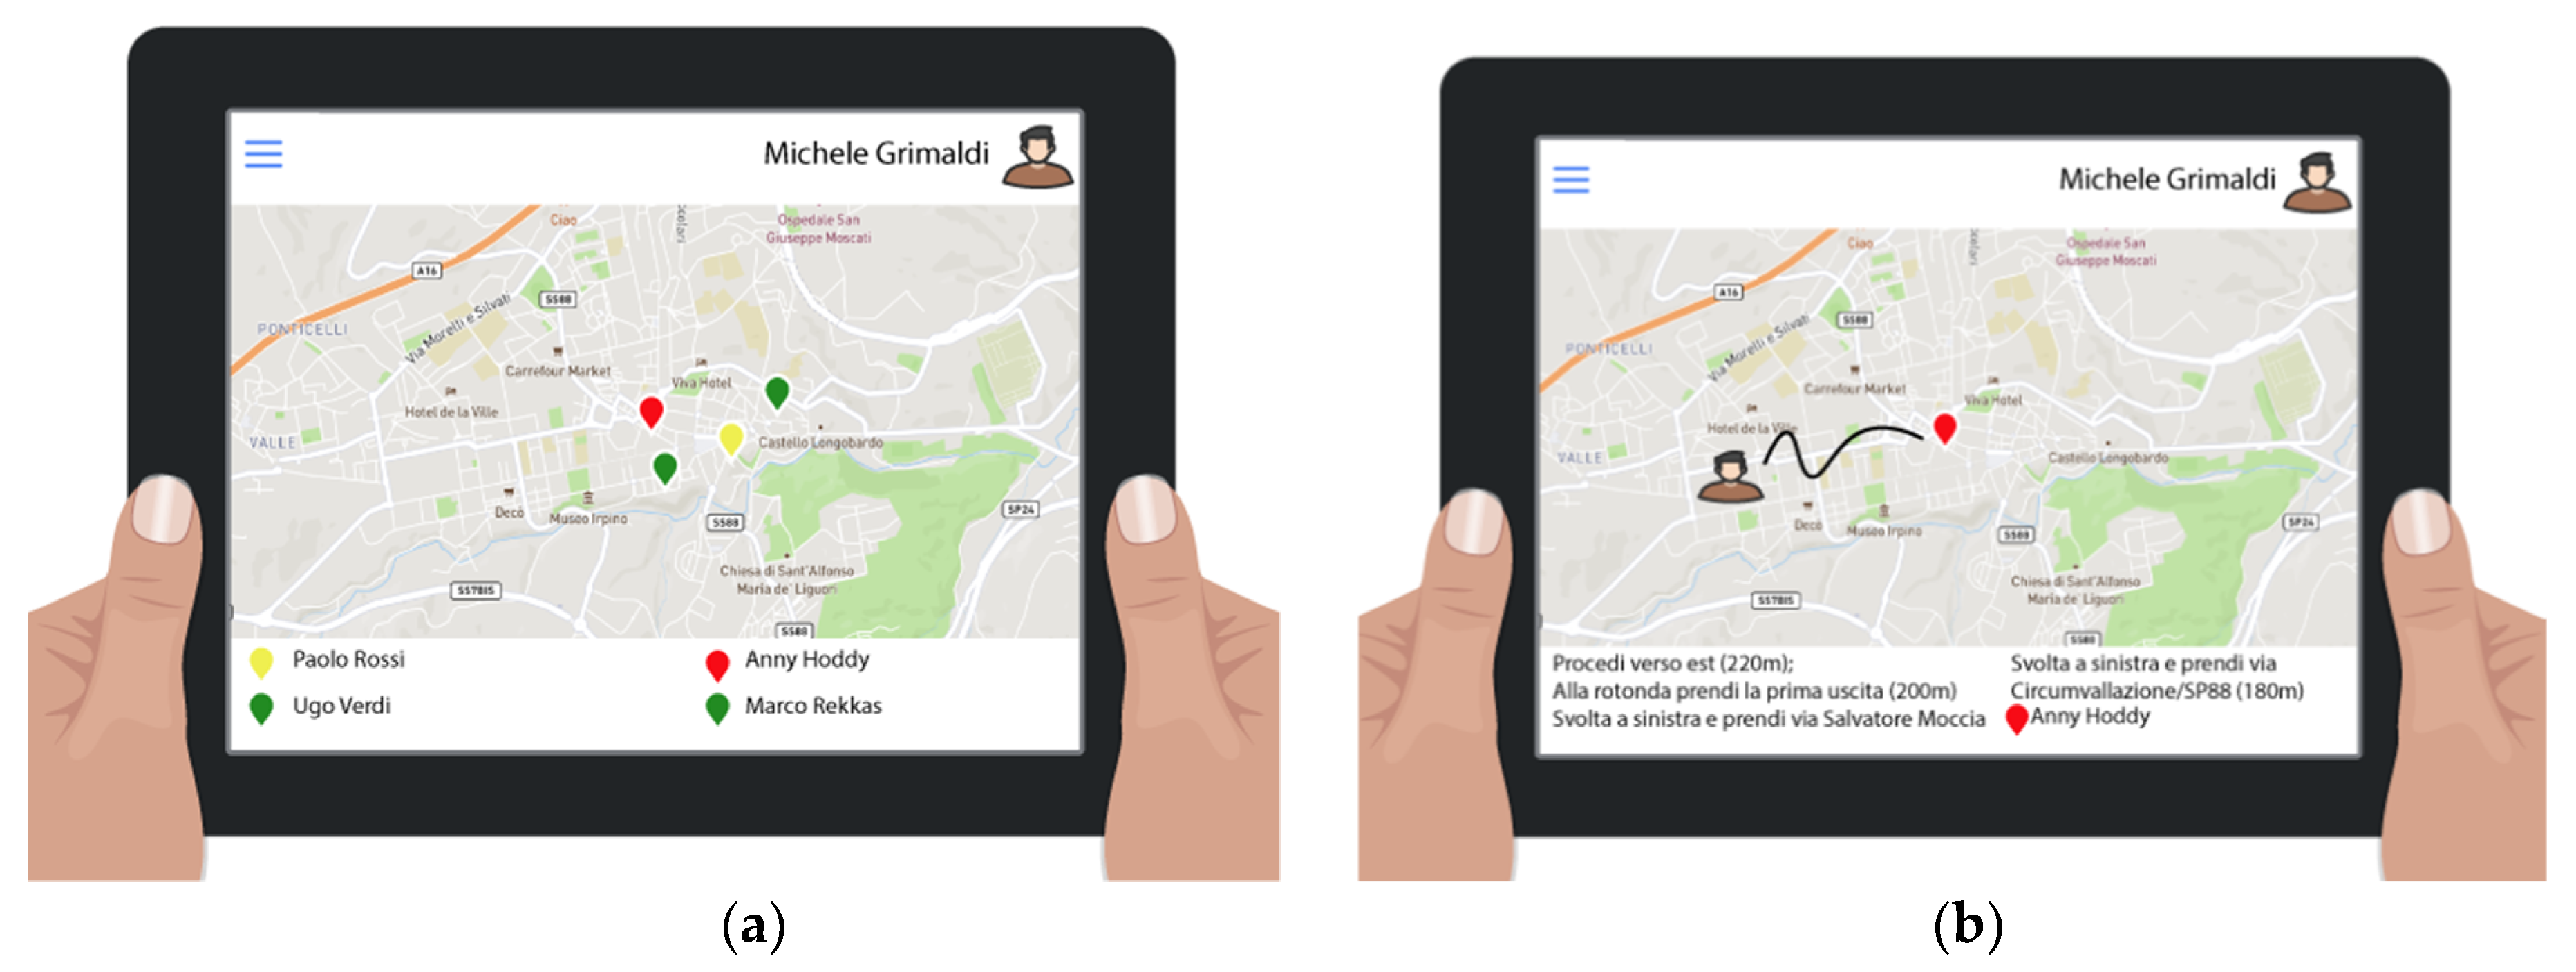
The information that can be derived from users’ notifications can also be used to optimize the aids distribution.
Figure 23 shows the interface available for the personnel, such as voluntary organizations, police forces, armed forces and the Red Cross [
31].
They can control both their zones of competence (aree di competenza) in general, and scenarios evolving inside them, thus reaching areas where their intervention is extremely important. In particular,
Figure 24 lists users who need aids (Soccorsi) and the path to reach them.
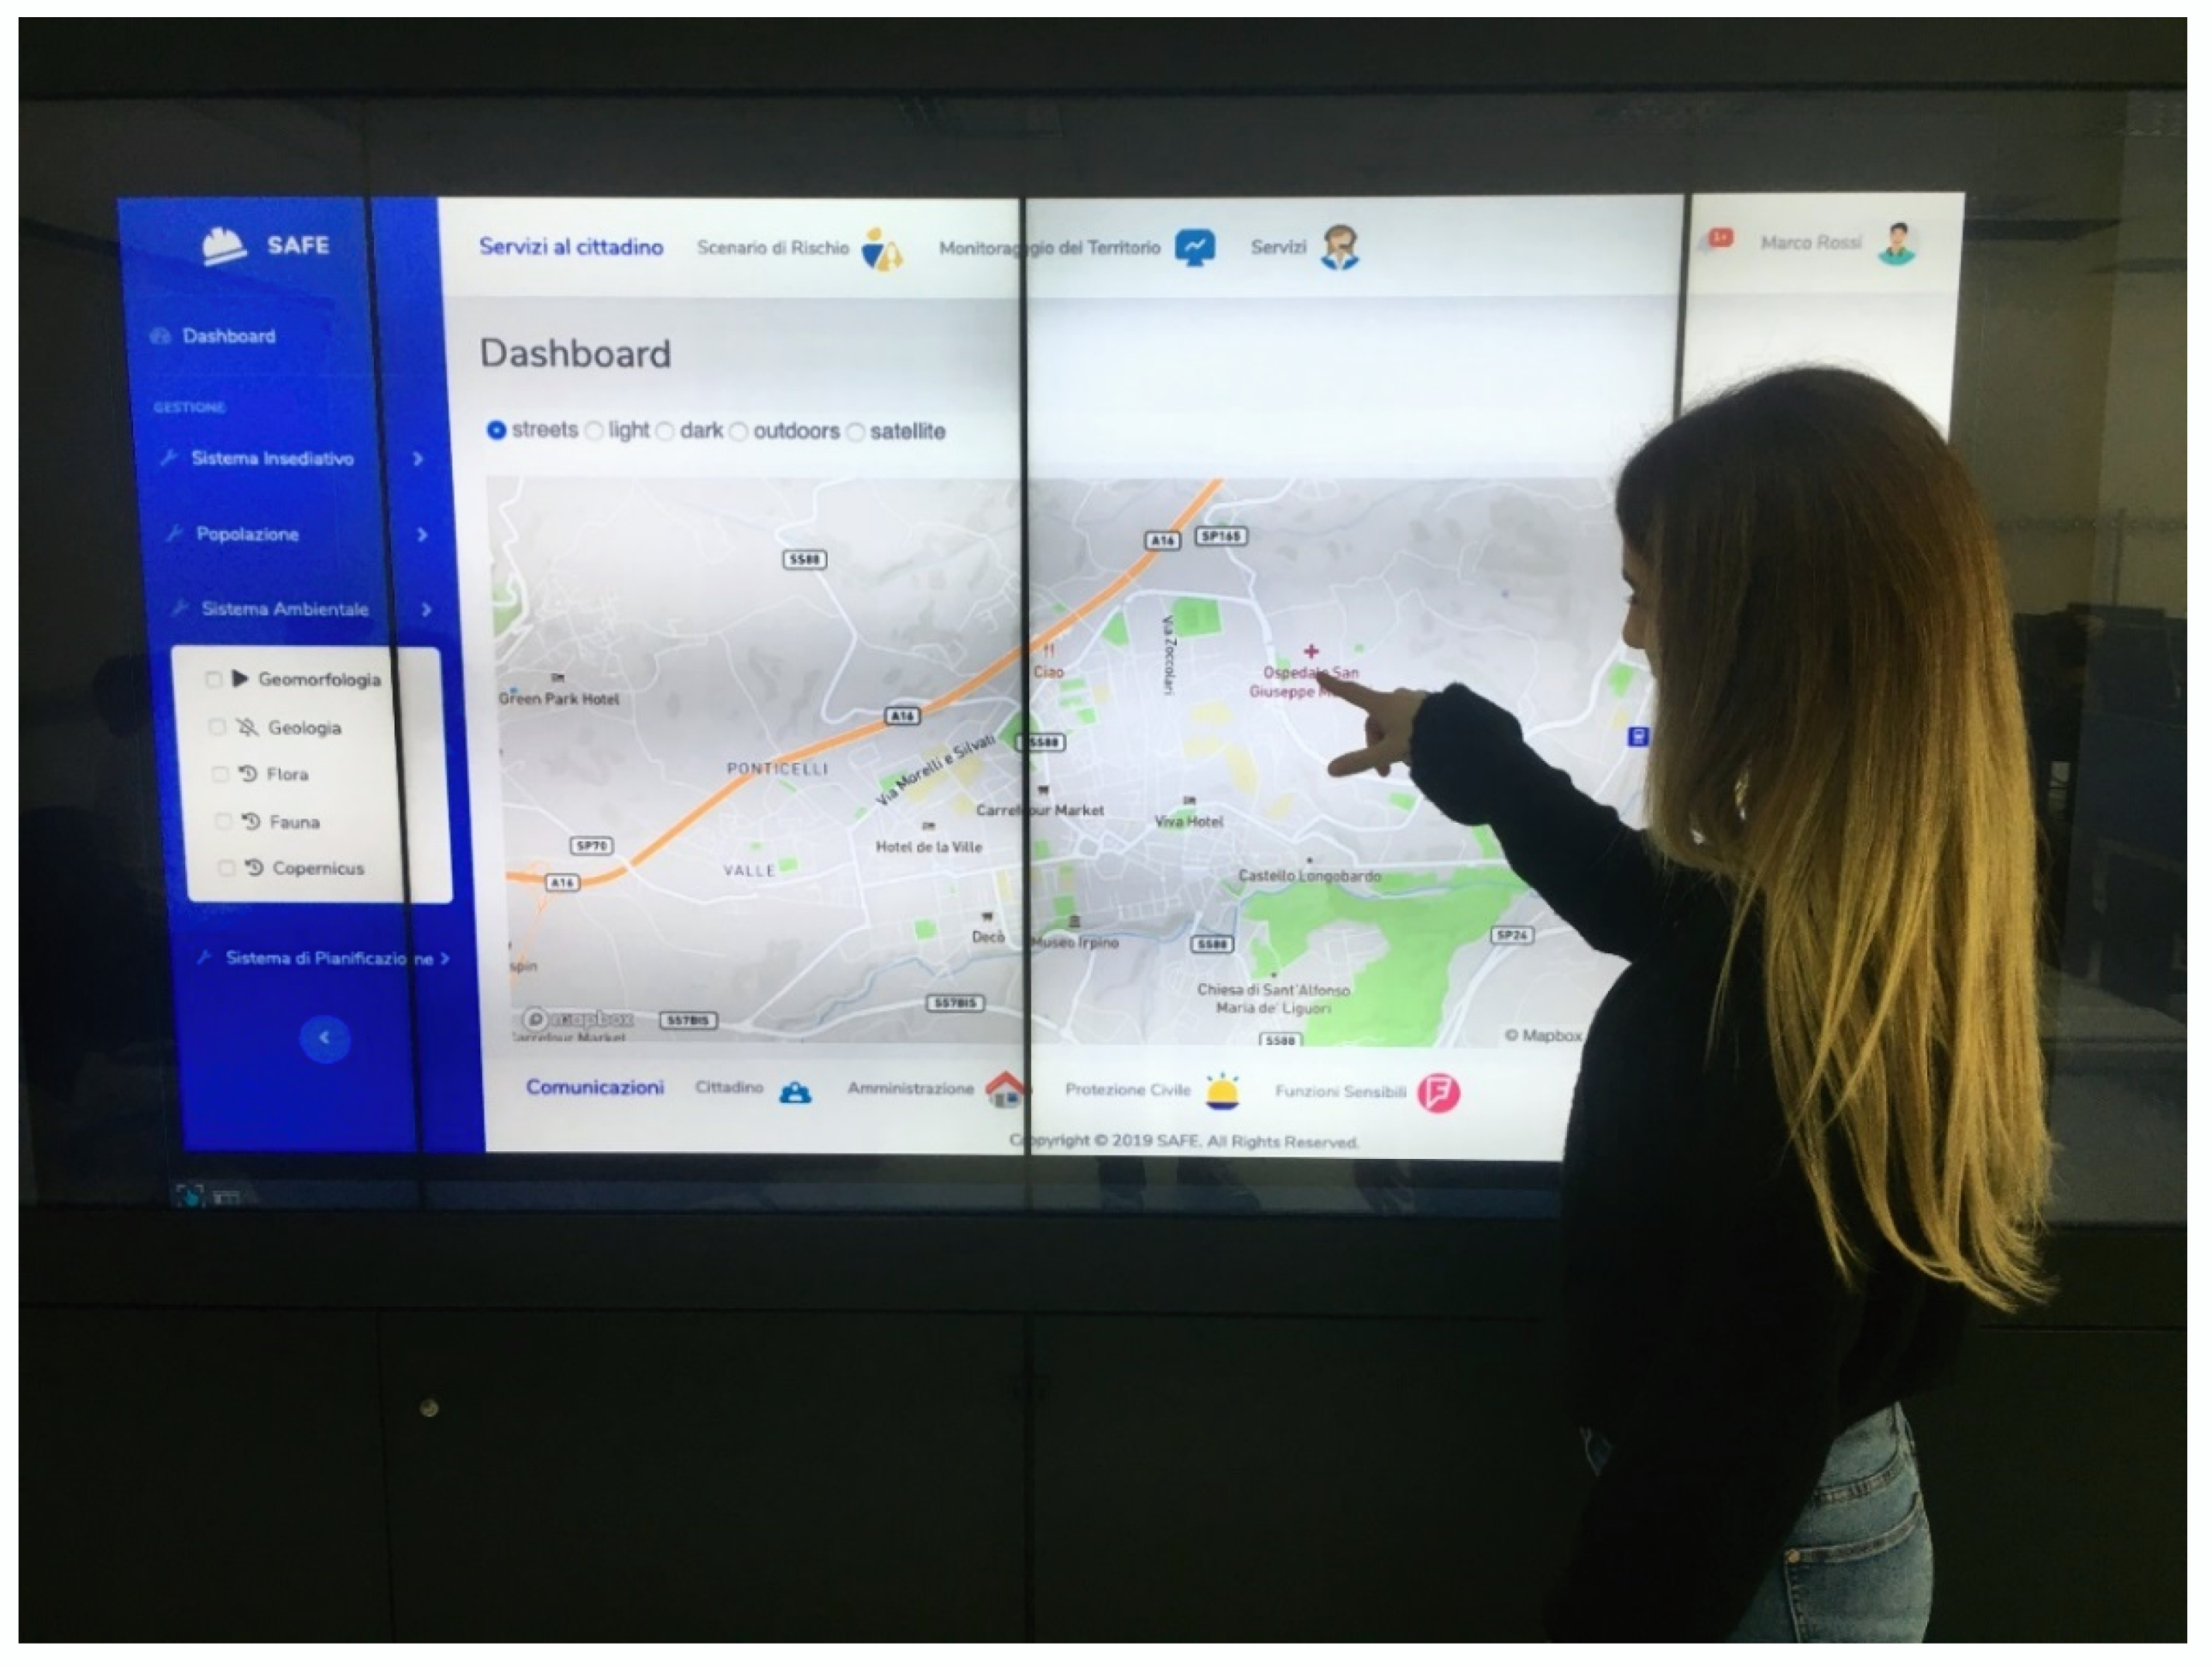
In
Figure 25, the visual environment of the Web component is displayed, as it appears when invoked by an expert user or by a decision maker. In this case, it is embedded in an interactive wall device.
5. Discussion and Conclusions
Geometaphors, visual operators and risk parameters, and geo-social activities are all included in SAFE, a visual environment conceived to assist decision makers, expert users and citizens in ordinary and extraordinary tasks concerning their territory. In particular, the SAFE Mobile component is a simple and agile tool for citizens who want both to contribute to carrying out operations on a territory and, at the same time, obtaining information from it. The SAFE Web component plays a two-fold role. It aims optimizing the available resources management and guaranteeing the correct involvement and coordination of the different actors present in the various procedures for implementing a municipal plan. Moreover, it carries out syntheses of data collected and builds dynamic maps of scenarios useful to decision makers for acting on a given area in case of both ordinary activities, such as separate waste collection management, and extraordinary events, such as an emergency.
As for the emergency management, in a few months, the Italian Civil Protection Department launches the testing of IT-Alert. It is a system that allows reaching via SMS each mobile device moving inside an area possibly affected by a natural risk. IT-Alert represents the Italian version of a European technological platform for civil protection alerting activities to population during an emergency. IT-Alert is also a mobile app that can be used to deliver citizens news about evolving risk scenarios.
When comparing SAFE and IT-Alert some differences can be emphasized. IT-Alert has been developed to mainly support alerting activities and offers the advantage of a simple data storage architecture. SAFE instead has been conceived also as a geo-social environment capable both to support users’ daily activities (citizens and families) and manage citizen supplied data useful to deliver decision makers a timely and reliable picture about the status of a given territory. The introduction of a set of geometaphors as visual representation of spatial objects and clusters allows acquiring an immediate overview of a scenario under investigation expressed in terms of visual synthesis. Moreover, by visually interacting with geometaphors, it is possible to obtain details that characterize them, as well as to explore different levels of aggregated information.
The capability to share information and knowledge among different functionalities represents a further innovative feature offered by SAFE. Indeed, information acquired from a territory becomes part of a supply chain, thus contributing to several subsequent processes, such as the quantification of the risk parameters during an emergency scenario.
As for the planned future work, the second phase of testing will provide useful information about the robustness of the underlying SAFE architecture, both in terms of data storage and query processing, which are inevitably affected by the increasing volume of data.
SAFE will be also integrated into an intelligent census based on a Web of data approach. An ontology describing an urban system is under construction by exploiting the Protégé ontology editor [
32]. It allows modelling and validating resources in terms of metadata, state and behavior, which can be in turn enriched through additional relationships among validated resources by applying inference algorithms.
The final goal will be to enhance the potential of SAFE and use it also as a means for the dissemination of information concerning both the behavior to be taken in case of a natural event, and in general the perception of risk itself by people, independently from the role they can play.


