Article

Effectiveness of Sentinel-2 in Multi-Temporal Post-Fire Monitoring When Compared with UAV Imagery

1
Engineering Department, School of Science and Technology, University of Trás-os-Montes e Alto Douro, 5000-801 Vila Real, Portugal
2
Centre for Robotics in Industry and Intelligent Systems (CRIIS), INESC Technology and Science (INESC-TEC), 4200-465 Porto, Portugal
*
Author to whom correspondence should be addressed.
ISPRS Int. J. Geo-Inf. 2020, 9(4), 225; https://0-doi-org.brum.beds.ac.uk/10.3390/ijgi9040225
Submission received: 30 January 2020 / Revised: 9 March 2020 / Accepted: 3 April 2020 / Published: 7 April 2020
(This article belongs to the Special Issue GI for Disaster Management)

Abstract

:
Unmanned aerial vehicles (UAVs) have become popular in recent years and are now used in a wide variety of applications. This is the logical result of certain technological developments that occurred over the last two decades, allowing UAVs to be equipped with different types of sensors that can provide high-resolution data at relatively low prices. However, despite the success and extraordinary results achieved by the use of UAVs, traditional remote sensing platforms such as satellites continue to develop as well. Nowadays, satellites use sophisticated sensors providing data with increasingly improving spatial, temporal and radiometric resolutions. This is the case for the Sentinel-2 observation mission from the Copernicus Programme, which systematically acquires optical imagery at high spatial resolutions, with a revisiting period of five days. It therefore makes sense to think that, in some applications, satellite data may be used instead of UAV data, with all the associated benefits (extended coverage without the need to visit the area). In this study, Sentinel-2 time series data performances were evaluated in comparison with high-resolution UAV-based data, in an area affected by a fire, in 2017. Given the 10-m resolution of Sentinel-2 images, different spatial resolutions of the UAV-based data (0.25, 5 and 10 m) were used and compared to determine their similarities. The achieved results demonstrate the effectiveness of satellite data for post-fire monitoring, even at a local scale, as more cost-effective than UAV data. The Sentinel-2 results present a similar behavior to the UAV-based data for assessing burned areas.

1. Introduction

In recent years, forest fires (i.e., large and destructive fires that spread over a forest or area of woodland) have received increasing attention due to their effects on climate change and ecosystems. Forest fires occur regularly, vary in scale and impacts and are inherent to terrestrial ecosystems [1]. Weather, topography and fuel are the three major components that define the fire environment and are directly related with the evolution of land use [2]. Portugal is one of the southern European countries most affected by forest fires, but it is also affected by rural fires [3]. In other words, not only do fires over forests affect the country, but the combination of environmental factors and human settlement may also cause harm to people or damage property or the environment [4]. Several factors contribute to the country being so severely affected: the Mediterranean climate, which benefits fuel accumulation and dryness along with the existence of flammable vegetation types; high ignition density; poor fire-suppression capabilities; and institutional instability [5]. Thus, forest fire impacts are attracting more and more attention not only from the scientific community, but also from public entities worldwide [5]. In the Portuguese case, this awareness is increasing, especially in the north and in the center of the country [6].
In this context, remote sensing platforms are being used as a capable tool for mapping burned areas, evaluating the characteristics of active fires and characterizing post-fire ecological effects and regeneration [7]. In the past decade, the use of unmanned aerial vehicles (UAVs) has increased for agroforestry applications [8] and are now being used for forest fire prevention [9], canopy fuel estimation [10], fire monitoring [11,12] and to support firefighting operations [13]. Likewise, studies using UAV-based imagery in post-fire monitoring have been concerned with surveying [14], calibrating satellite-based burn severity indices [15], assessing post-fire vegetation recovery [16], mapping fire severity [17,18], studying forest recovery dynamics [19] and sapling identification [20]. Despite being a cost-effective and a very versatile platform for remote sensed data acquisition that is capable of carrying a wide set of sensors, its usage in surveying big areas can be constrained due to legal [21] and technological limitations such as its autonomy and payload capacity [8]. On the other hand, traditional remote sensing platforms such as satellites continue to be widely used to obtain data with increasingly improved spatial, temporal and radiometric resolutions. Satellites still offer a quick way to evaluate forest regeneration in post-fire areas. However, lower spatial resolutions (compared with UAV data) often mean that satellites are used for studies only at regional or national scales [22,23,24,25,26]. The Copernicus Programme, from the European Union’s Earth Observation Programme, was created with the goal to achieve a global, continuous, autonomous, high-quality, wide-range Earth observation capacity. The different satellite missions belonging to this program make it possible to obtain accurate, timely and easily accessible information to improve the management of the environment, as well as to understand and mitigate the effects of climate change and ensure civil security. Therefore, access to medium- and high-resolution satellite data with a high temporal resolution are accessible for free [27], namely, the Sentinel-2 Multispectral Instrument (MSI) [28]. A wide range of spectral bands are available from visible to shortwave infrared (SWIR) which allows, in a post-fire monitoring context, severity determination of fire disturbances along with multi-temporal monitoring for burnt areas. This type of data is ideal for monitoring fire disturbances in Mediterranean regions that affect several crops and have extents ranging from some hectares to several square kilometers [29]. In this specific context, Sentinel-2 MSI data were used for exploring spectral indices of burn severity discrimination [30,31,32,33,34], as well as to assess burn severity in combination with Landsat data [35,36]. They were also used to take into account the available multi-temporal data in order to evaluate burned areas at a national level [37] and to assess post-fire vegetation recovery mapping of an island [38].
In this study, we evaluated an area that was severely affected by a fire disturbance in 2017 with an estimated extent greater than 300 ha. The area is located in north-eastern Portugal, and forested areas composed of maritime pine (Pinus pinaster) were significantly affected along with houses, wood storage buildings, agricultural structures and vehicles. This was therefore a fire that could be considered small, its analysis and monitoring could be possible to carry out using aerial high-resolution data acquired by a UAV. Every year, thousands of fires similar to this occur in Portugal, covering the north and center of the country in particular with small patches of burnt areas.
To assess the effectiveness of satellite data in studying this specific type of area, Sentinel-2 MSI data were used to characterize the area before the fire disturbance, allowing an assessment of the fire’s severity and multi-temporal analysis to be performed (2017–2019). Moreover, to compare the spatial information provided by the Sentinel-2 MSI (10-m spatial resolution), a UAV flight campaign was carried in part of the study area to acquire multispectral data with a very-high resolution. This is precisely the central question of this study: what is the potential use of new generation free-access satellite images (Sentinel-2) to monitor small-scale burnt areas. To the best of our knowledge, this is the first study that uses freely available satellite data to analyze a burnt area of relatively small dimensions and conclude that the results were in line with those obtained by high-resolution data acquired by a UAV. Although more studies are needed that cover different areas with different complexities and different vegetation covers, this study allowed us to conclude that satellite data have great potential, in certain cases, to replace high aerial-resolution data acquired by UAVs. This would allow analyzing post-fire areas (even small ones) at the national level, representing considerable savings in time and money.

2. Materials and Methods
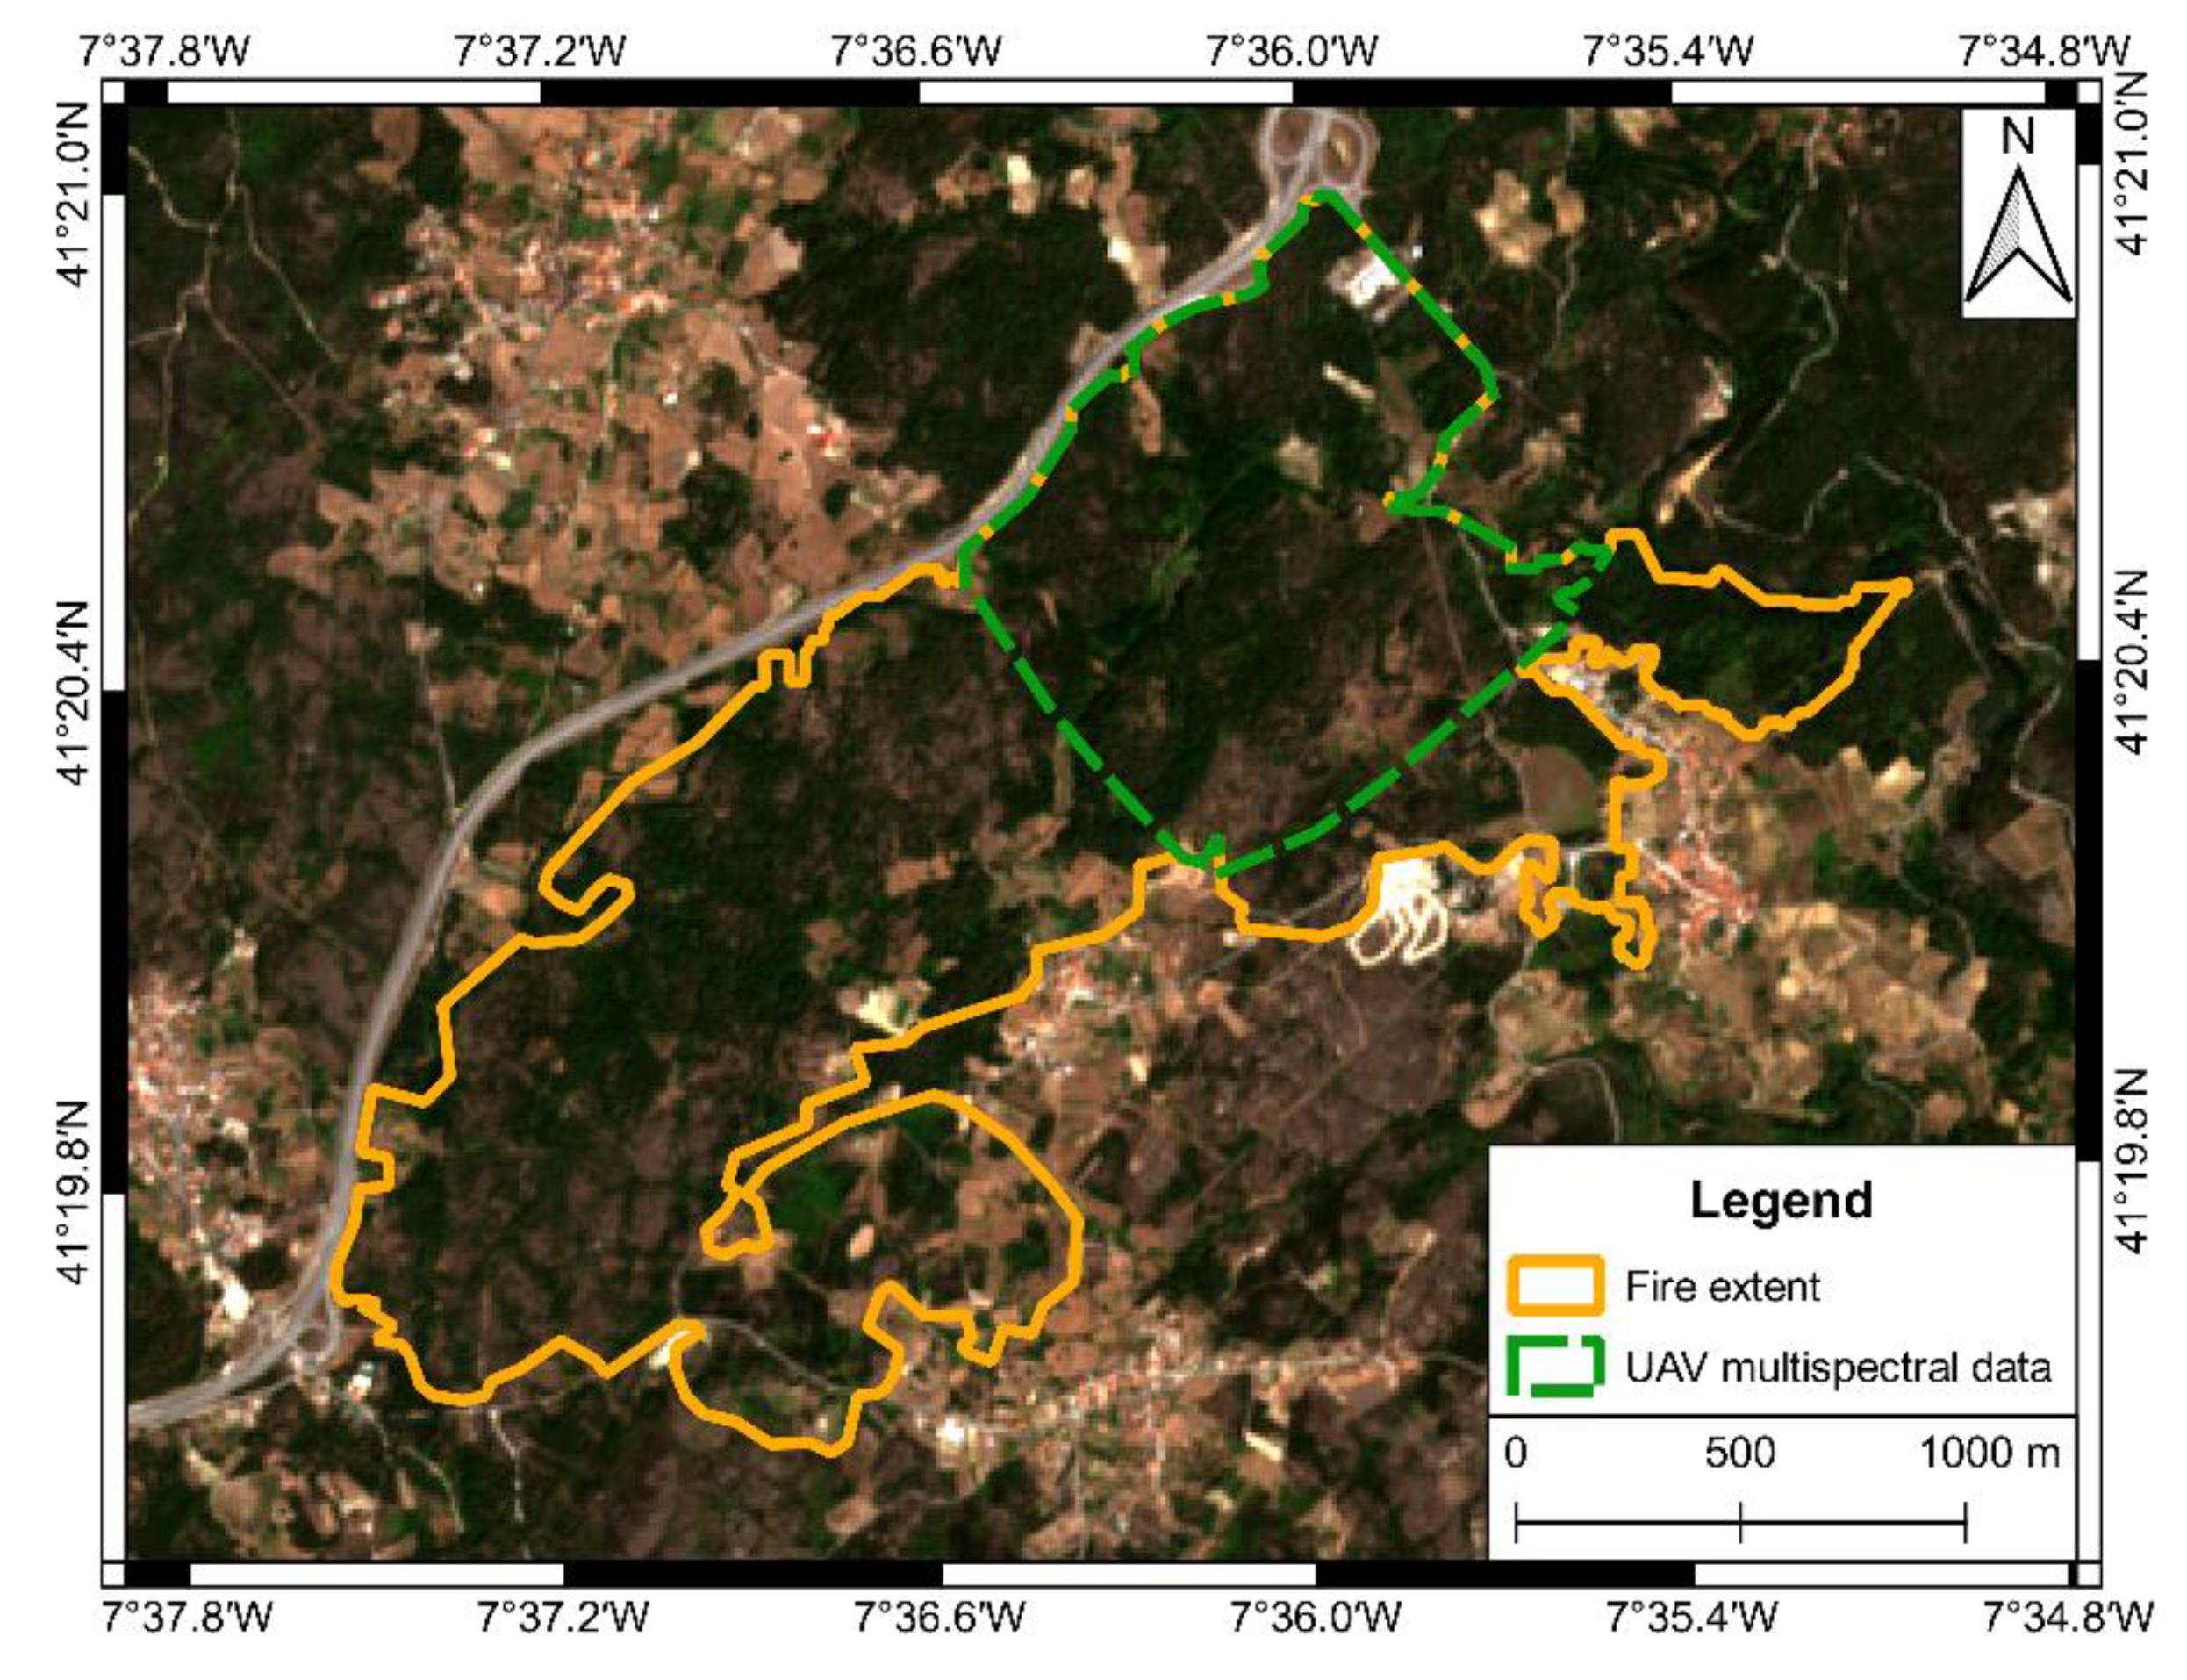
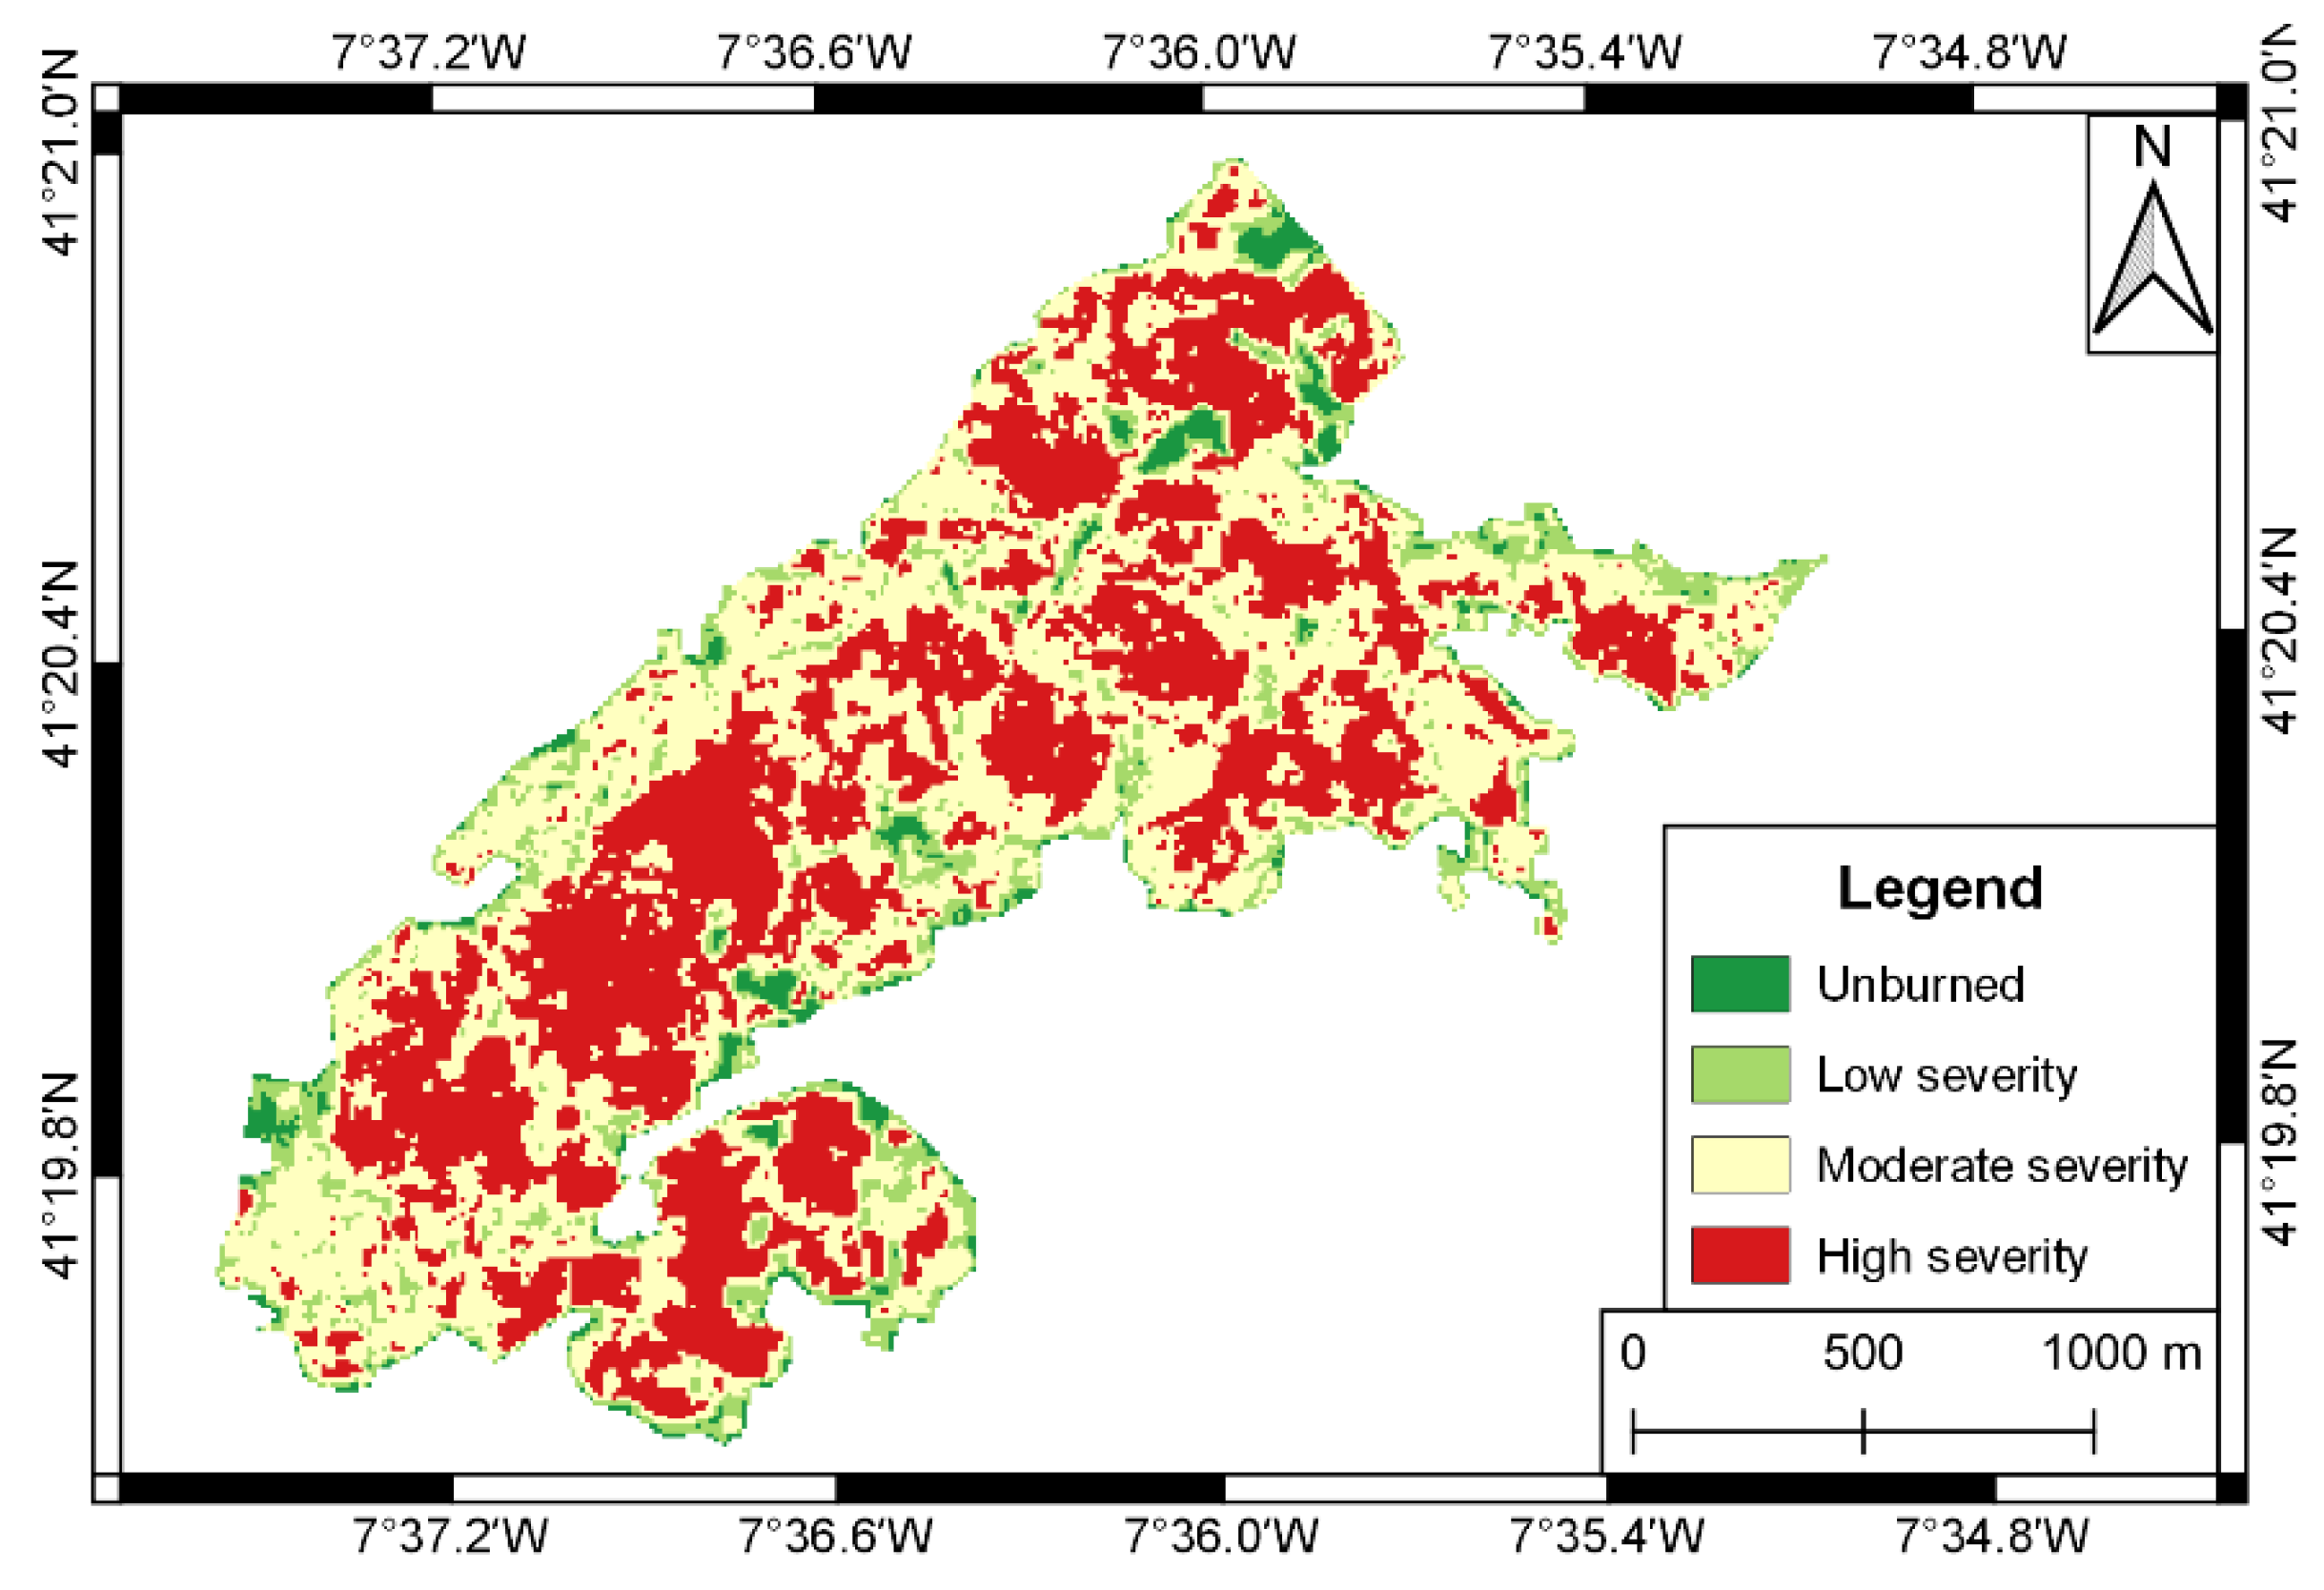
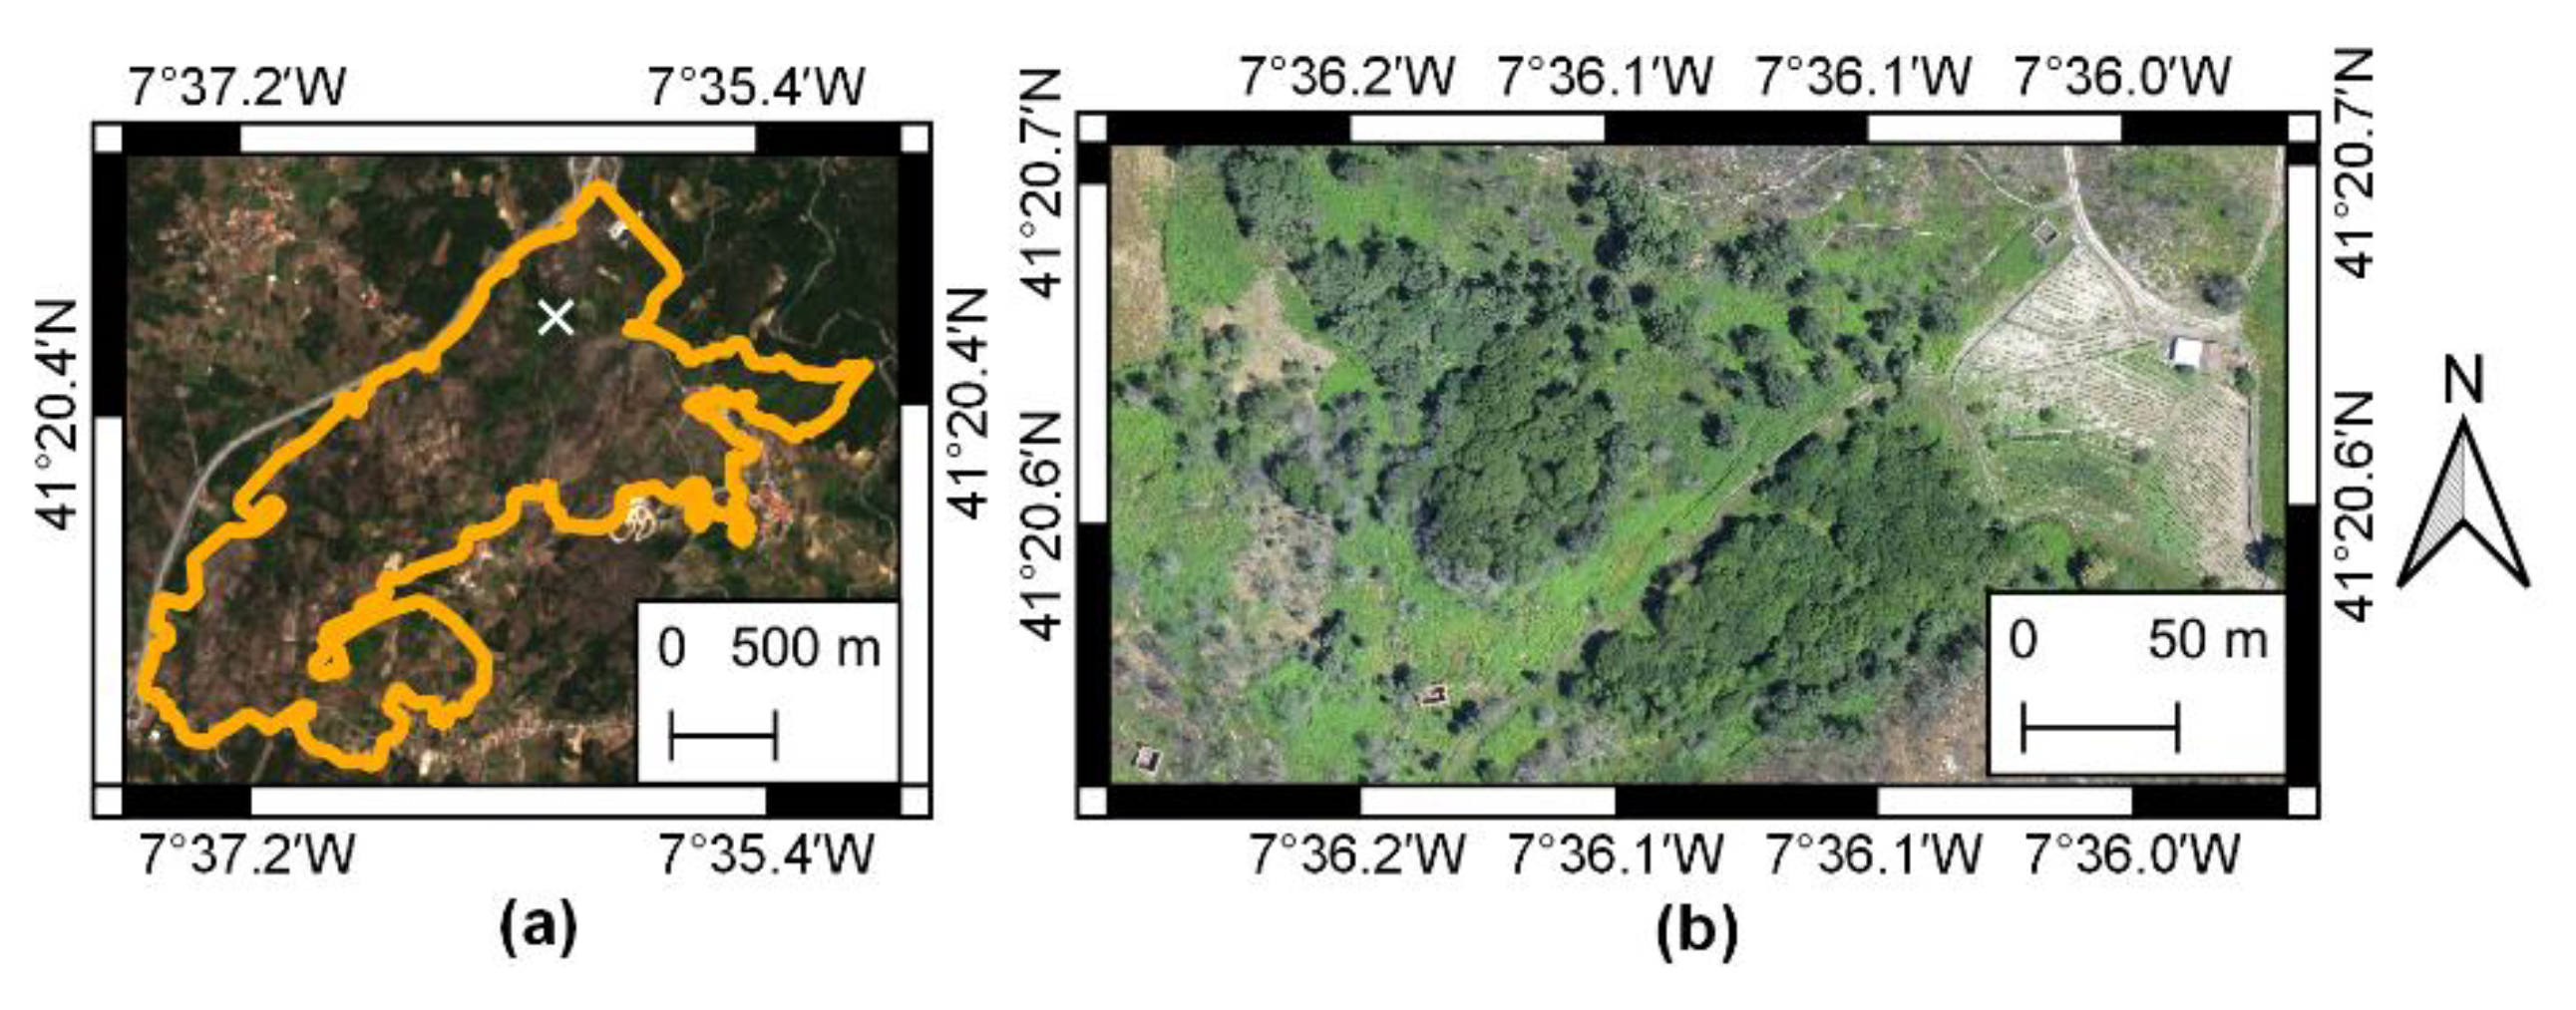
2.1. Study Area

The study area, highlighted in Figure 1, is located in the north-eastern region of Portugal within the municipality of Sabrosa (41°20’40.4″ N, 7°36’04.5″ W), near the villages of Parada do Pinhão and Vilarinho de Parada. This area was severely affected by a wildfire that began at 12:59 p.m. on 13 August 2017 and was reported as extinguished at 03:16 a.m. on 14 August 2017 [39]. The area is characterized by a warm and temperate climate, an average annual temperature of 13.1 °C and an annual precipitation averaging 1139 mm. July and August are the months with the highest mean temperatures (21 °C) and lower precipitation (28 mm). This area was selected due to its easy accessibility and representativeness, since the species in the area are common for the region. It is mostly populated by maritime pine, deciduous species such as Quercus pyrenaica and Castanea sativa Mill. and some riparian species, shrubland communities and parcels used for agriculture and silviculture purposes. Moreover, the burned area was greater than 100 ha, which fit the majority of the fire events (93%) that occurred in Portugal during 2017 [6].

2.2. Remote Sensing Dataset

The satellite imagery data used in this study were acquired by the Sentinel-2 MSI. Spectral data products provided by MSI ranged from the visible to the shortwave infrared (SWIR) parts of the electromagnetic spectrum. In total, there were 13 available spectral bands (B) at different spatial resolutions: (1) at 10 m—B2 (490 nm), B3 (560 nm), B4 (665 nm) and B8 (842 nm); (2) at 20 m—B5 (705 nm), B6 (740 nm), B7 (783 nm), B8a (865 nm), B11 (1610 nm) and B12 (2190 nm); and (3) at 60 m—B1 (443 nm), B9 (940 nm) and B10 (1375 nm) [28]. Data were obtained from the Copernicus Open Access Hub with an absence of clouds over the study area from June 2017 to October 2019. These epochs were selected due to being related to the last available period before the fire disturbance (June, July and August 2017), including the first cloud and smoke-free post-fire data (September 2017). The imagery was atmospherically corrected using the Sen2Cor [40].
Regarding UAV data, the senseFly eBee (senseFly SA, Lausanne, Switzerland) was used to acquire both RGB and multispectral imagery. A Canon IXUS 127 HS sensor with 16.1 MP resolution was used for RGB imagery acquisition, and the Parrot SEQUOIA sensor was used for multispectral imagery acquisition. The multispectral sensor comprised a four-camera array with 1.2 MP resolution acquiring green (530–570 nm), red (640–680 nm), red edge (730–740 nm) and near infrared (NIR) (770–810 nm) imagery. Its radiometric calibration was performed using a target prior to the flight. Two flights with the same mission plan (one per sensor) were performed on 11 July 2019. The RGB flight was performed at a 425-m height, covering an area of 230 ha, with a spatial resolution of 0.12 m. The imagery overlap was 80% front and 60% side, for a total acquisition of 91 georeferenced images (related to a ground system of geographic coordinates) distributed through eight strips (approximately 11 images per strip). As for the multispectral flight, it was carried out at a 215-m height, covering approximately 150 ha, with a spatial resolution of approximately 0.25 m; it had an 80% front overlap and 60% side overlap, for a total acquisition of 260 images per spectral band (12 strips with approximately 22 images per strip).
A pre-processing of UAV-based imagery is required before it is ready for use. Thus, Pix4Dmapper Pro version 4.4.12 (Pix4D SA, Lausanne, Switzerland) was used for the photogrammetric processing of the UAV imagery, and common tie points were identified in the provided imagery according to their geolocation and internal and external camera parameters. This enabled the computation of dense 3D point clouds that were further interpolated using inverse distance weighting (IDW) to obtain the following orthorectified outcomes: an orthophoto mosaic from the RGB imagery, digital elevation models (DEMs) and four radiometric bands from the multispectral imagery that could then be used for the computation of vegetation indices. DEMs were not used in the scope of this study, and the orthophoto mosaic was used for visual inspection only.

2.3. Data Processing and Analysis

Both satellite and UAV multispectral datasets were used to compute vegetation indices. Sentinel-2-based vegetation indices were used to assess the fire severity and to perform the post-fire multi-temporal analysis of the study area. Similar vegetation indices were computed using UAV data for a single epoch, allowing a comparison of both sets of results.

2.3.1. Computation of Spectral Indices

The satellite data were used to compute the normalized burn ration (NBR) [41] as in Equation (1). This index relates to vegetation moisture content by combining the NIR (B8) and SWIR (B12) parts of the electromagnetic spectrum [42], and is generally accepted as a standard spectral index to assess burn severity [41,43].
NBR = NIR SWIR NIR + SWIR
Moreover, the normalized difference vegetation index (NDVI) [44] was calculated using a NIR band (B8) and a RED band (B4) from Sentinel-2 MSI data. NIR and RED bands from the UAV-based multispectral data were also used to compute the equivalent index, as in Equation (2). NDVI is widely used to analyze the vegetation condition in different contexts [8].
NDVI = NIR RED NIR + RED

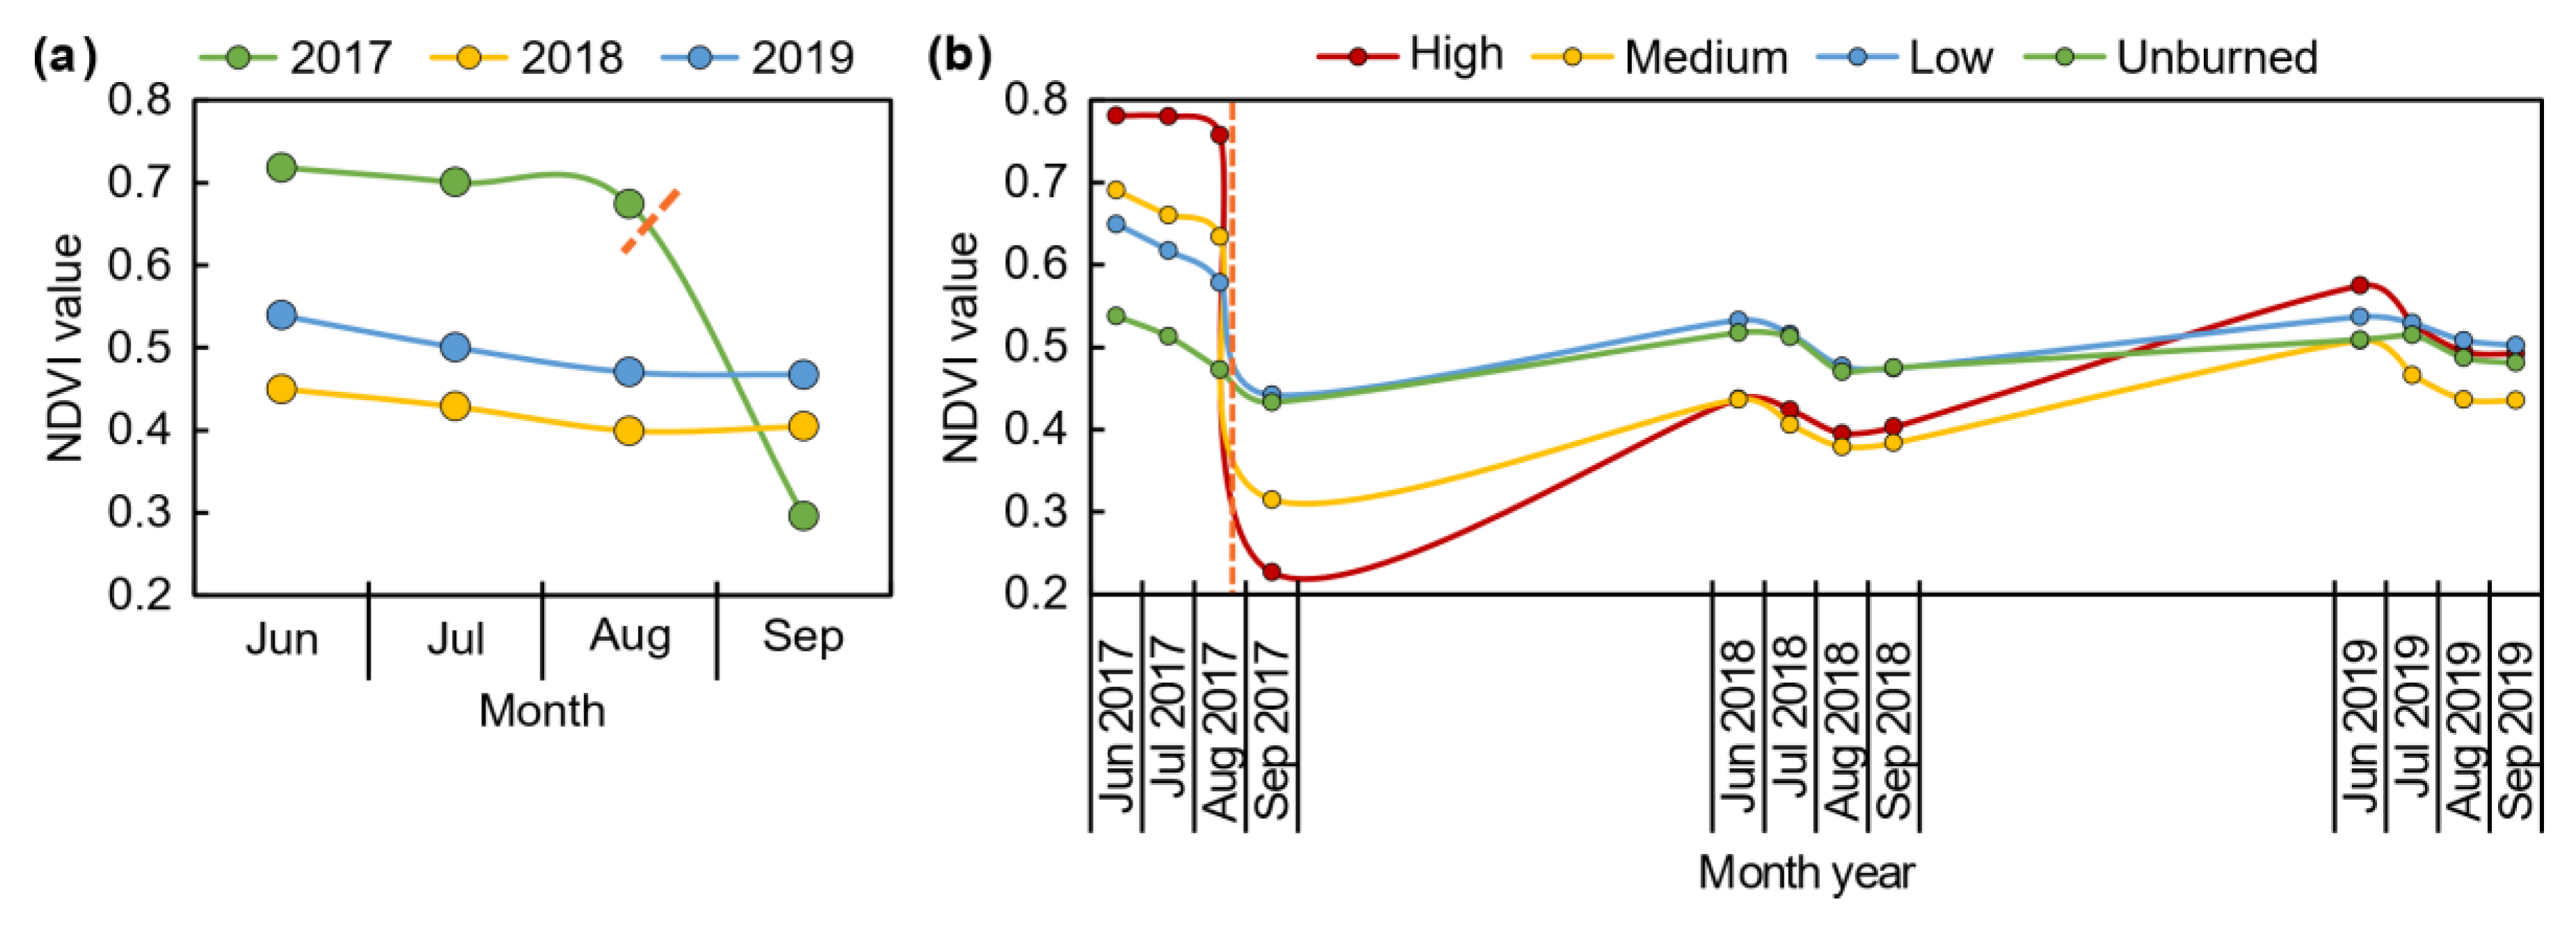
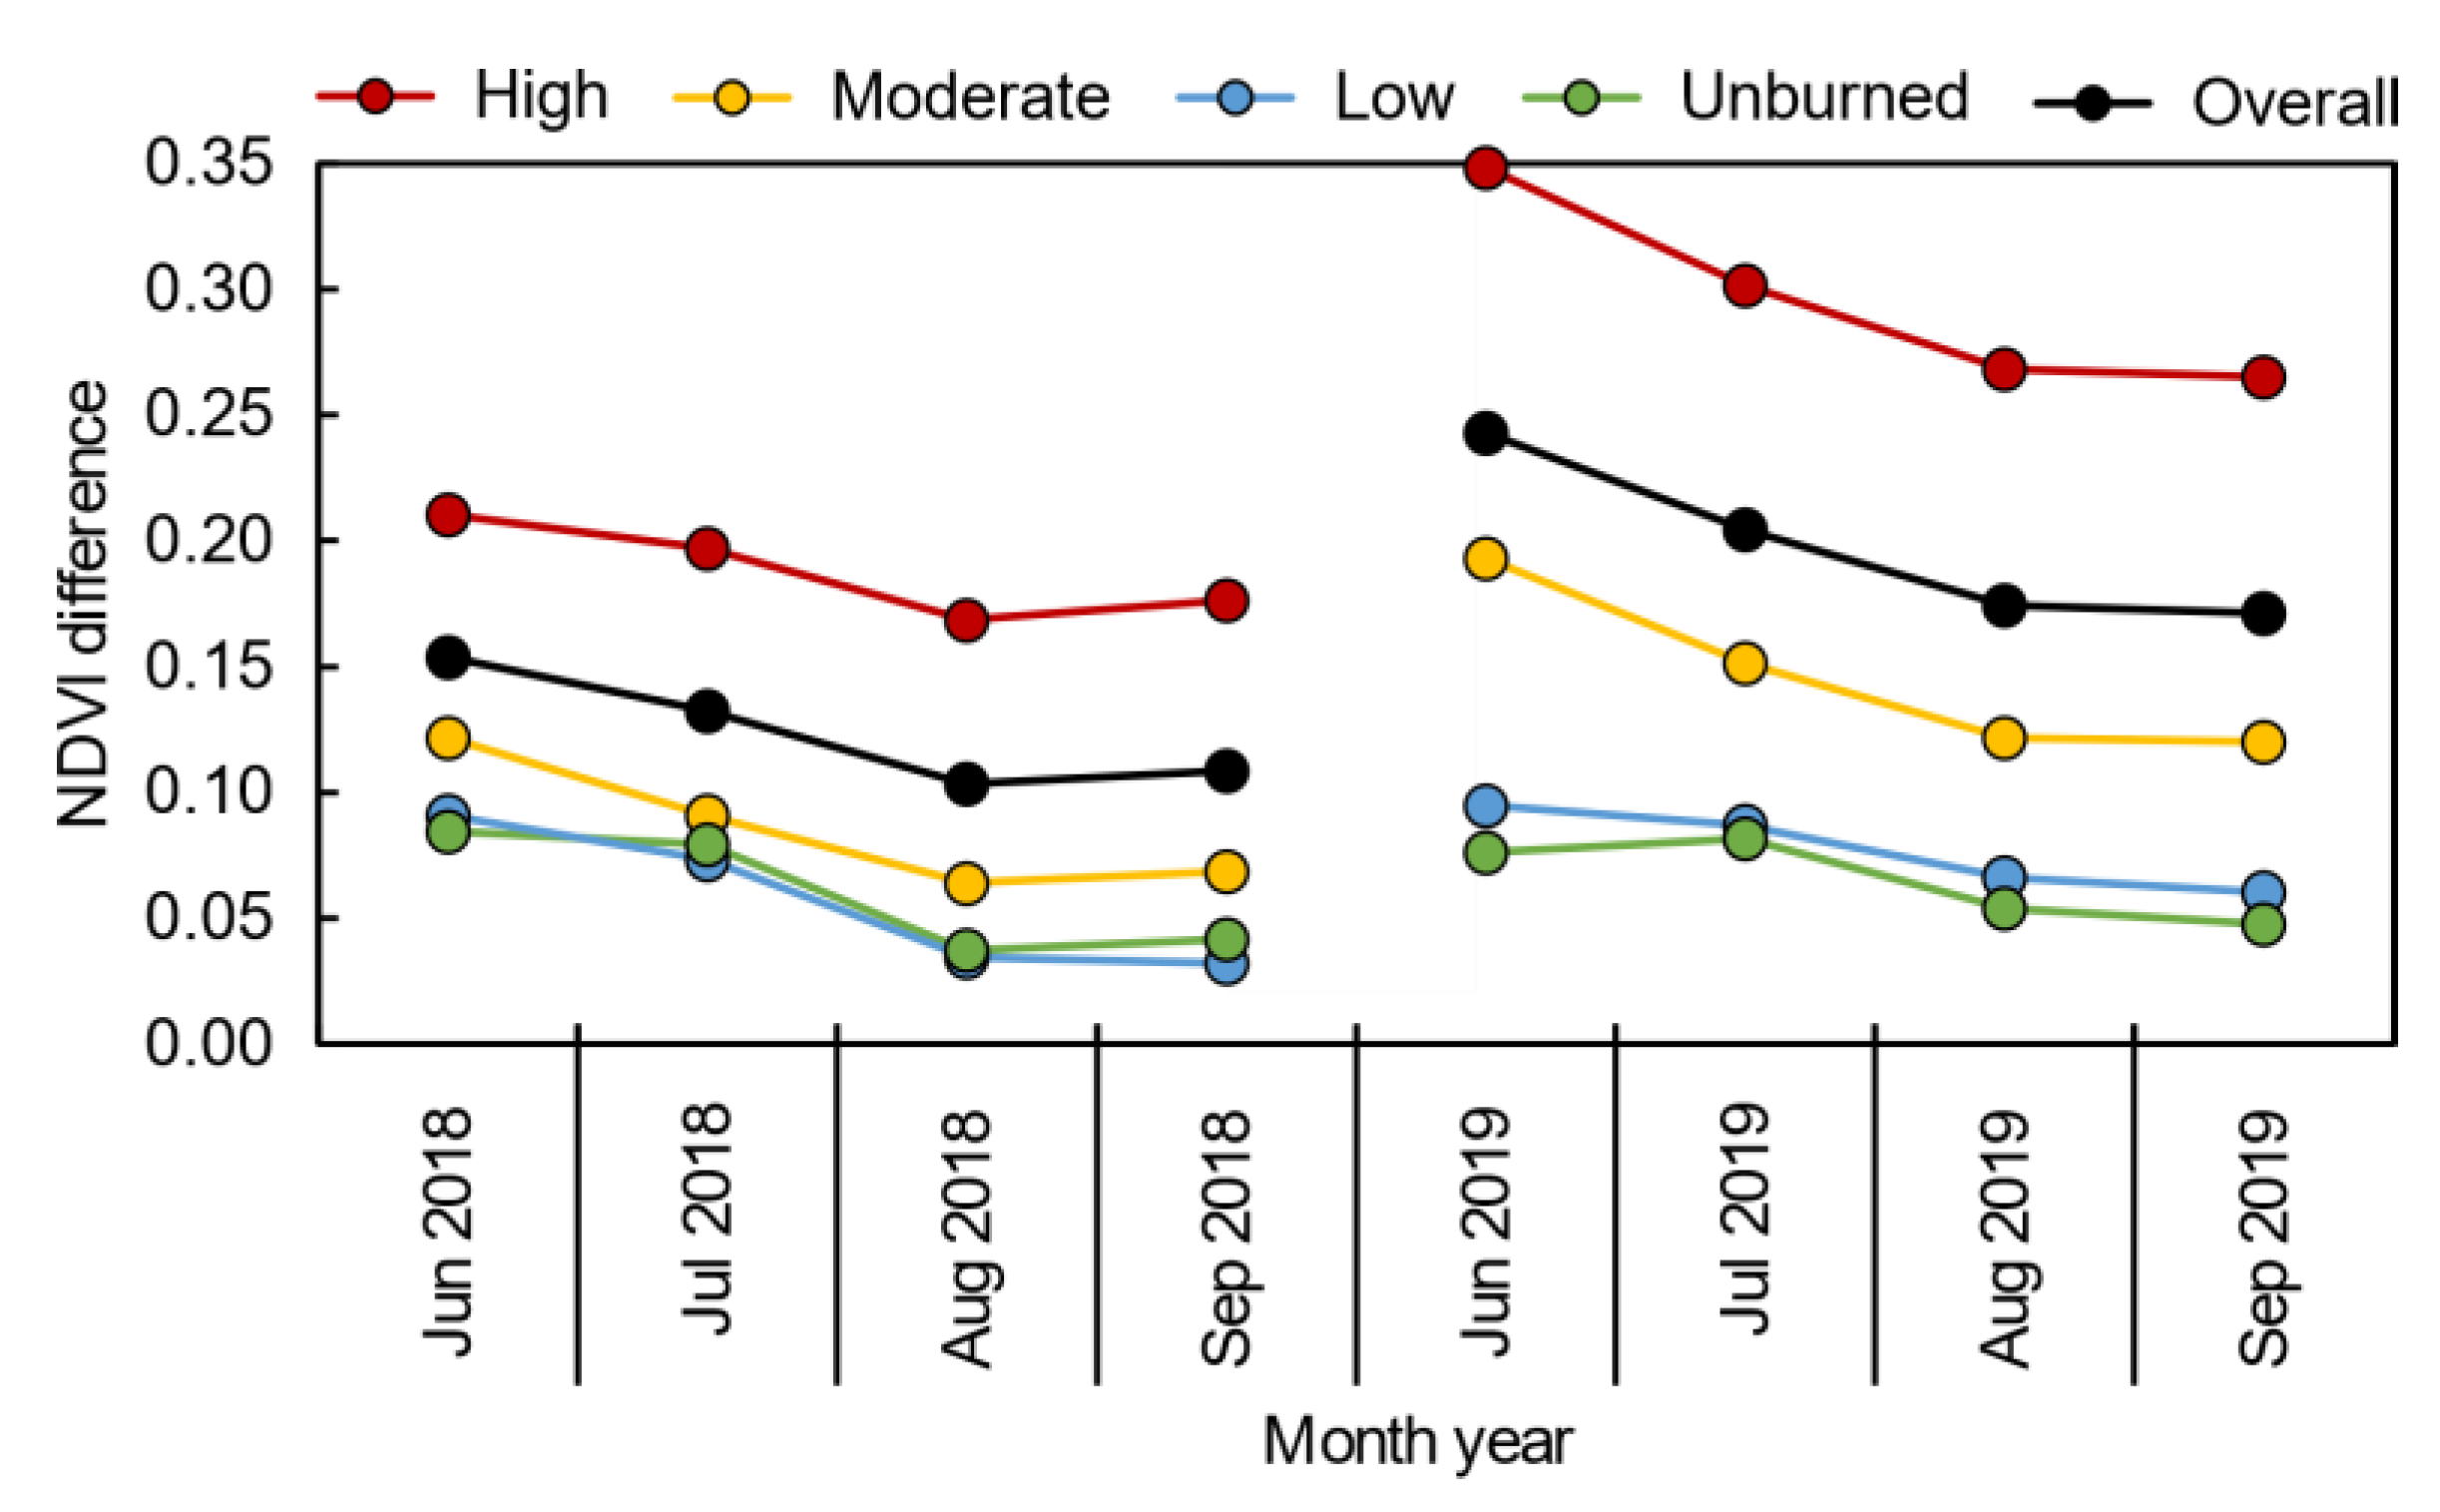
2.3.2. Post-Fire Multi-Temporal Analysis

The multi-temporal analysis performed in this study relied on the time series data provided by the Sentinel-2 MSI. From the available data, a set of four epochs was selected for each year (2017 to 2019), corresponding each one to the months of June, July, August and September, with the dates of the selected data presented in Table 1. This period was selected (June, July and August 2017) in order to include data prior to the fire disturbance, along with the same months in following available years (2018 and 2019). Some data outside these periods were affected by clouds and had to be discarded. Moreover, it was decided to not consider any data from October to May in order to avoid false assumptions from the natural seasonal behavior of the species in the study area (e.g., the absence of leaves in deciduous tree species in the winter time, and potential interference of undergrowth vegetation in winter and spring time). The selected months assured that the trees were fully developed and that undergrowth vegetation interference was minimal [45].
The difference normalized burn ration (dNBR), calculated by subtracting the post-fire raster data from the pre-fire raster as in Equation (3), was used to perform the burn severity level classification as proposed by the United States Geological Survey (USGS) [46,47], enabling an understanding not only the severity of the burned areas, but also of unburned areas within the study region. Pre- and post-fire NBRs were the NBR of a date before and after the fire disturbance, respectively. In burned areas, the NBR showed higher values before the fire and lower values after the fire. The dNBR was the difference between the NBRs of both epochs: positive values represented areas with a higher fire severity, while values close to or lower than zero represented unburned areas and/or vegetation regrowth. For each classified severity level, the mean NDVI value was calculated per analyzed month. The mean NDVI value was also estimated for the whole burned area.
dNBR = PrefireNBR PostfireNBR
To evaluate the post-fire recovery, a similar analysis was performed using the difference NDVI (dNDVI) by subtracting the NDVI of first post-fire (September 2017) from the NDVI values from each analyzed month from 2018 and 2019. This way, positive values represented an increase in the NDVI and, consequently, a potential recovery zone, while the inverse was true for values close to or less than zero.
The data analysis was carried in the opensource geographical information system (GIS) QGIS (version 3.4.12-Madeira) and functions from the Geographic Resources Analysis Support System (GRASS GIS) [48] and from the System for Automated Geoscientific Analyses (SAGA GIS) [49] were also used.

2.3.3. Sentinel-2 MSI and UAV Comparison

The Sentinel-2 MSI data acquired on 9 July 2019 were compared to the UAV-based multispectral imagery (two days difference). The NDVI maps produced from both datasets were compared. The UAV-based NDVI at its original spatial resolution (0.25 m), its resampling to half the resolution and its resampling to same resolution as the Sentinel-2 MSI (5 and 10 m, respectively) were used for this comparison. A total of 116 ha (~35%) of the burned area (Figure 1) was evaluated. This is precisely the most complex area, containing a greater variety of tree species, agricultural fields and infrastructure. The resampling of the UAV NDVI was performed using the “r.resamp.stats” function from GRASS GIS in QGIS, by specifying the grid cell sizes (5 × 5 m and 10 × 10 m) and assigning the aggregated mean values to each cell. The correlation among the different NDVIs (UAV-based and satellite-based) was performed using the “r.covar” function from GRASS GIS.
Moreover, the geospatial variability of the Sentinel-2 NDVI was compared with the UAV NDVI at the three different spatial resolutions. The mean values of each evaluated NDVI were quantified in a 50 × 50 m grid. The size of this grid, representing five times the Sentinel-2 resolution, was selected to smooth the transition zones of vegetation cover. Then, the local bivariate Moran’s index (MI) [50] and the bivariate local indicators of spatial association (BILISA) [51] were applied as in Anselin [52] to assess the spatial relationship between the NDVIs computed from both datasets. The local bivariate MI was used to assess the correlation between a defined variable (satellite NDVI) and a different variable in the nearby areas (UAV NDVI). BILISA was used to measure the local spatial correlation, forming maps of clusters with similar behaviors and enabling an assessment of their spatial variabilities and dispersion. These cluster maps were divided into four classes based on the correlation of a value with its neighborhood: high–high (HH); low–low (LL); high–low (HL); and low–high (LH). This analysis was made using GeoDa software (version 1.14.0) [53]. The required weights map was defined using an eight-connectivity approach (3 × 3 matrix) and 999 random permutations were used in the BILISA execution.

3. Results

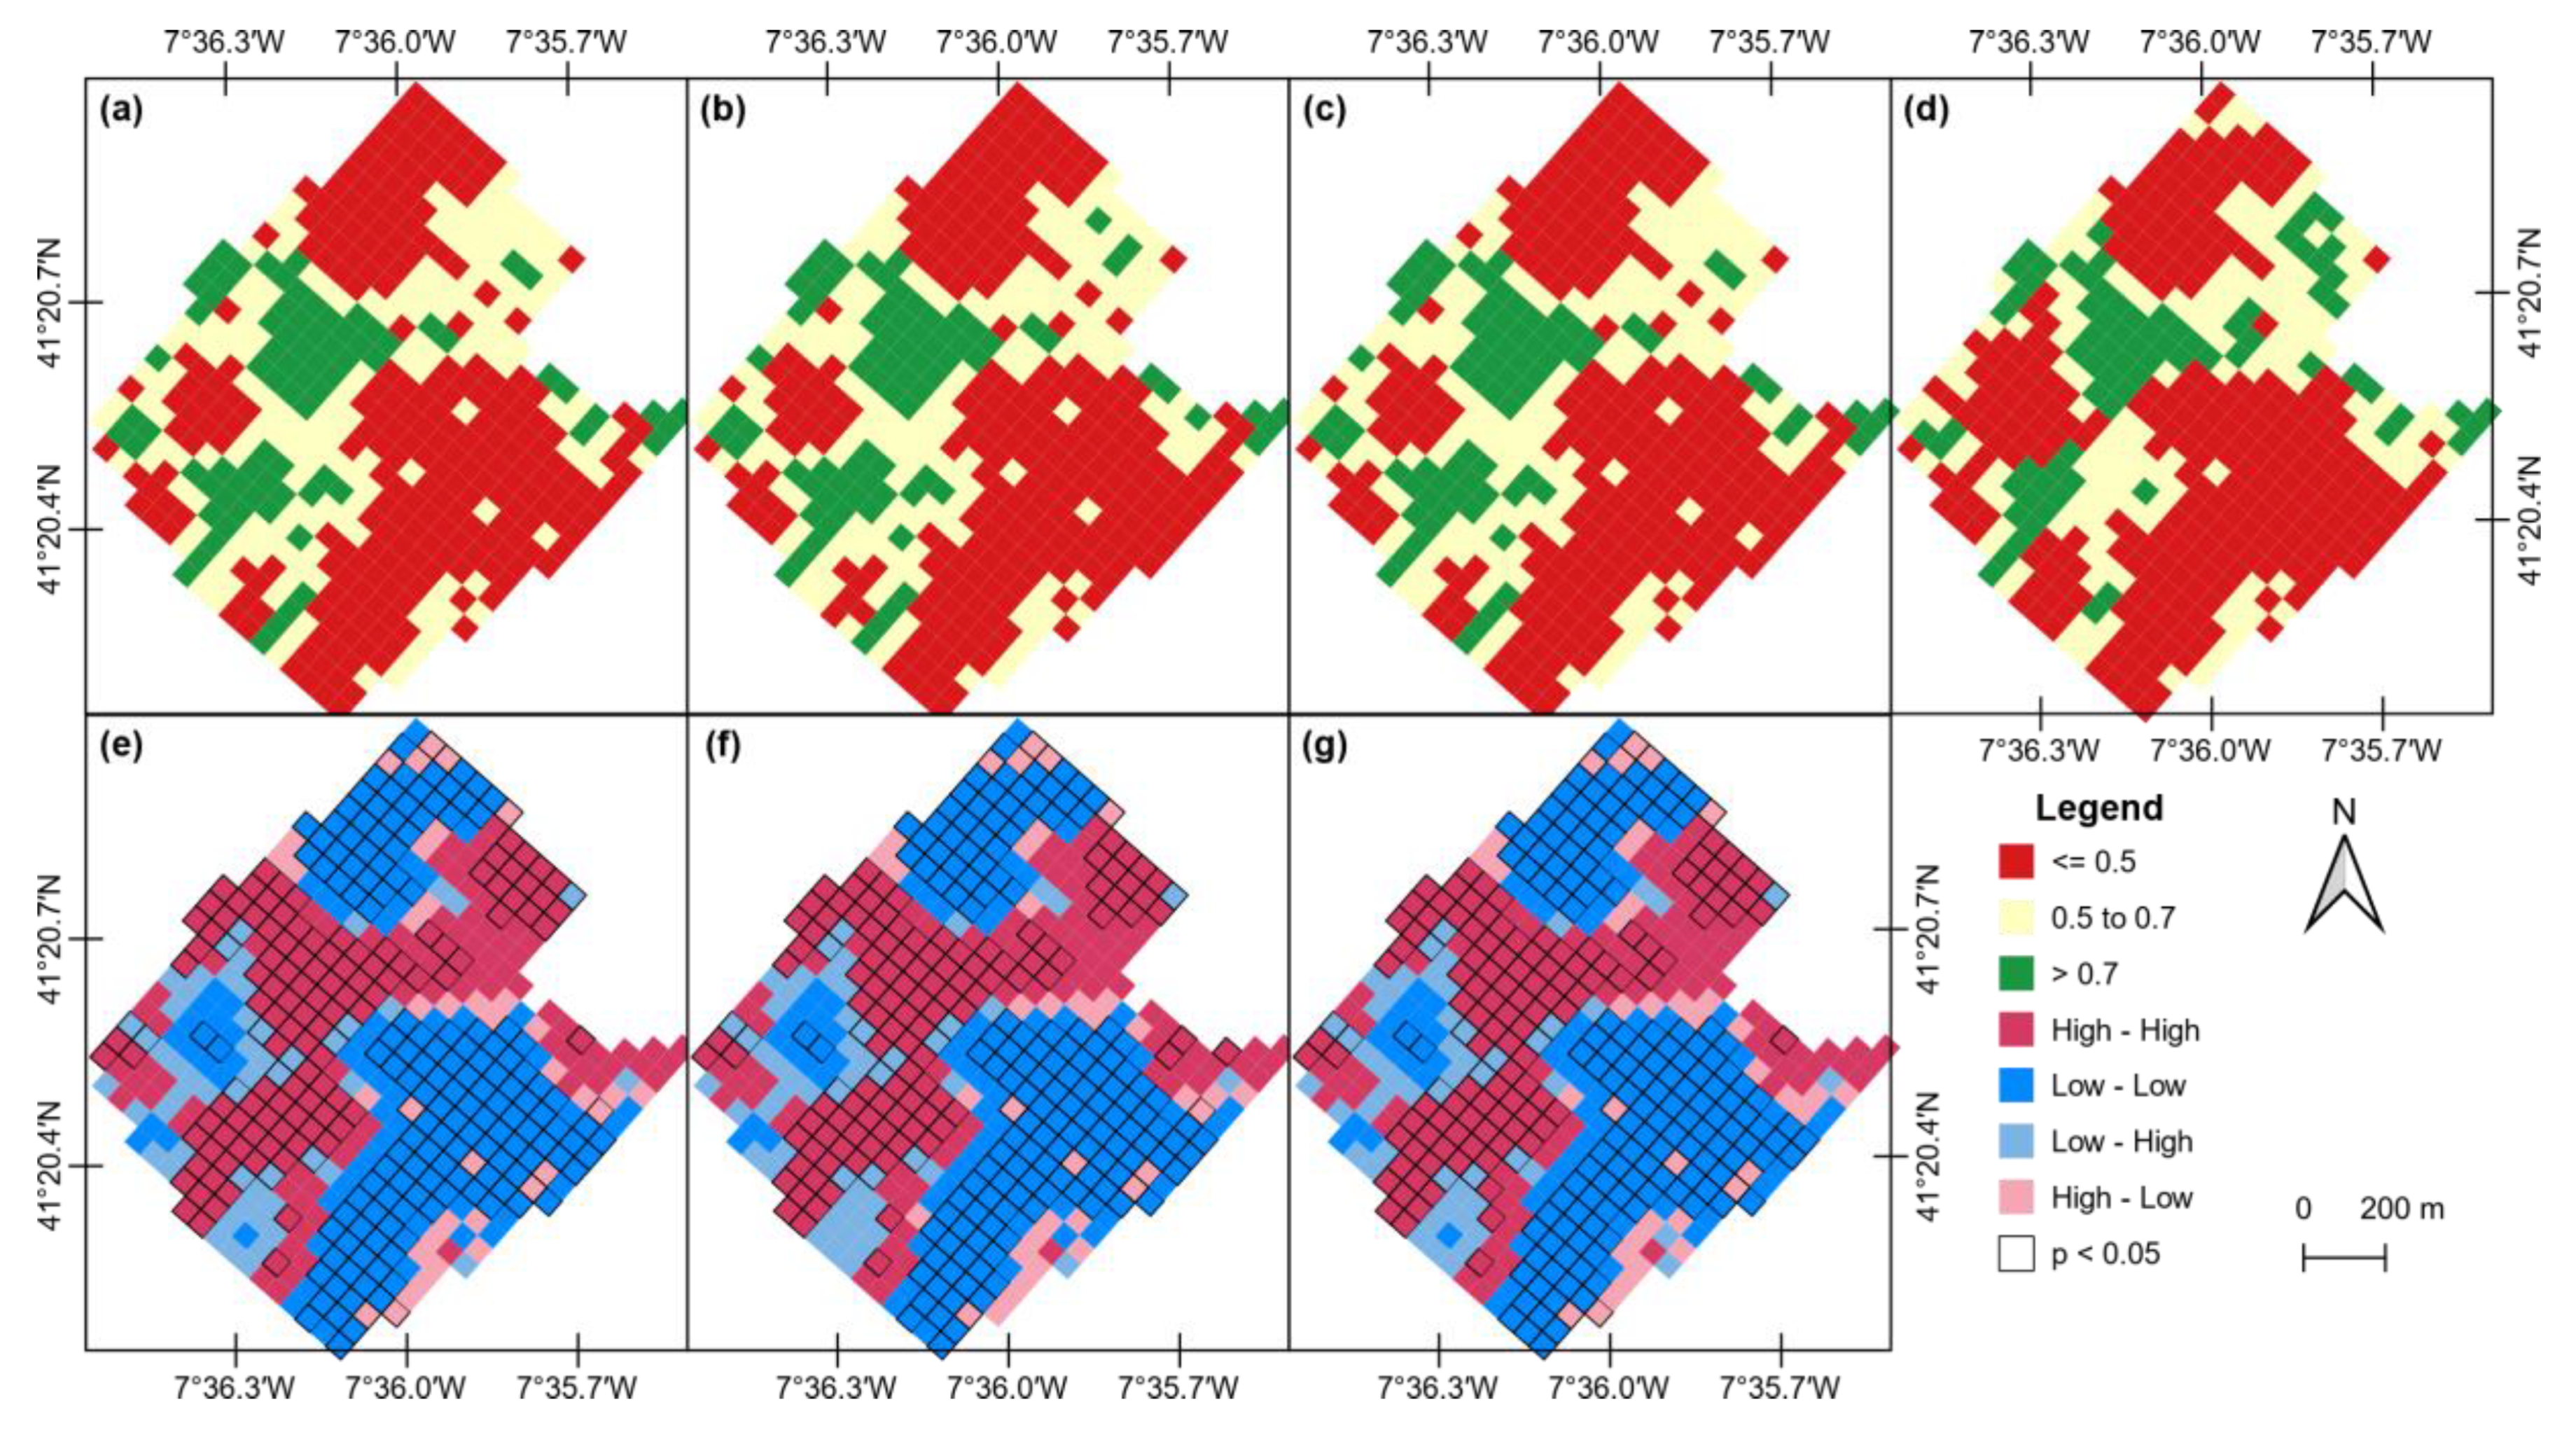
3.1. Sentinel-2 Post-Fire Monitoring

The fire severity map calculated using the dNBI from the pre-fire NBI (August 2017) and the first post-fire NBI (September 2017) are presented in Figure 2. From the 361 ha representing the study area, 42% (151 ha) presented a high severity, 44% (160 ha) showed a moderate severity and 38 ha (11%) presented a low severity. Only 3% of the area (12 ha) was estimated not to have been affected by the fire disturbance. A visual inspection of these areas allowed us to conclude that unburned and low-severity areas represented infrastructures, or corresponded to bare soil or fields used for agriculture along with some tree stands. Moderate severity areas included shrubland communities, agriculture terrains and trees, while high-severity areas mostly included highly density forest stands.
The Sentinel-2 multi-temporal data enabled us to characterize the study area throughout the analyzed period. Figure 3 presents the pre- and post-fire NDVI (August and September 2017, Figure 3a,b) and the NDVI from September of the two subsequent years (2018 and 2019, Figure 3c,d). The fire disturbance is clearly observable from the NDVI data and some forestry recovery is noticeable in the north, north-eastern and south-western parts of the study area. This is especially distinguishable in 2019 (Figure 3g).
The mean NDVI value was extracted for each severity level and unburned area for the months of June, July, August and September during 2017–2019, as well as for the whole area affected by the fire. Figure 4 presents these results. When analyzing the values obtained from the whole area (Figure 4a), the decline of NDVI values (−56%) after the fire disturbance (August to September 2017) is clearly noticeable. From September 2017 to June 2018, a growth of 52% in the mean NDVI value was verified, while in the homologous period in 2019 the growth was 33%. When separately analyzing each year, the values declined each month, with less noticeable results from August to September.
This tendency is reflected when observing the mean NDVI values per severity level (Figure 4b). The mean NDVI value of the unburned area was relatively constant, with a standard deviation of 0.03. Similarly, the area classified as low severity presented a standard deviation of 0.06. On the other hand, high-severity areas presented higher post-fire increases (with a standard deviation of 0.06 considering 2018 and 2019 values, and 0.17 overall), and the mean NDVI value presented growths of 93% from September 2017 to June 2018 and 42% from September 2018 to June 2019. For the moderate severity areas, these increases were 39% for September 2017 to June 2018, and 32% for September 2018 to June 2019, with a standard deviation of 0.04 (0.12 for the whole period). By comparing June 2018 to June 2019, the mean NDVI values for the high-, moderate- and low-severity areas and unburned areas presented variations of 32%, 16%, 1% and −2%, respectively.
When analyzing the post-fire dNDVIs (Figure 5) relating the differences in the first post-fire data (September 2017), a similar trend was observed. By analyzing the mean differences per year, an overall mean difference of 0.12 was verified in 2018, while in 2019 this difference was 0.20. In both years the same trend was verified, with the higher differences verified in areas with high severity, followed by moderate-severity areas. Both unburned and low-severity areas presented lower differences, with a mean difference of 0.06 for the two classes in 2018, an increase to 0.08 in 2019 for the low-severity areas and the same value maintained for the unburned area. The values declined from June to August and remained similar in September. When comparing July 2018 to July 2019, an overall increase of 0.09 was verified in the mean dNDVI values, representing increases of 0.14, 0.07, 0 and −0.01 for high, moderate, low-severity and unburned areas, respectively. A visual representation of the pre- and post-fire dNDVIs for the two subsequent years is presented in Figure 3e–g.

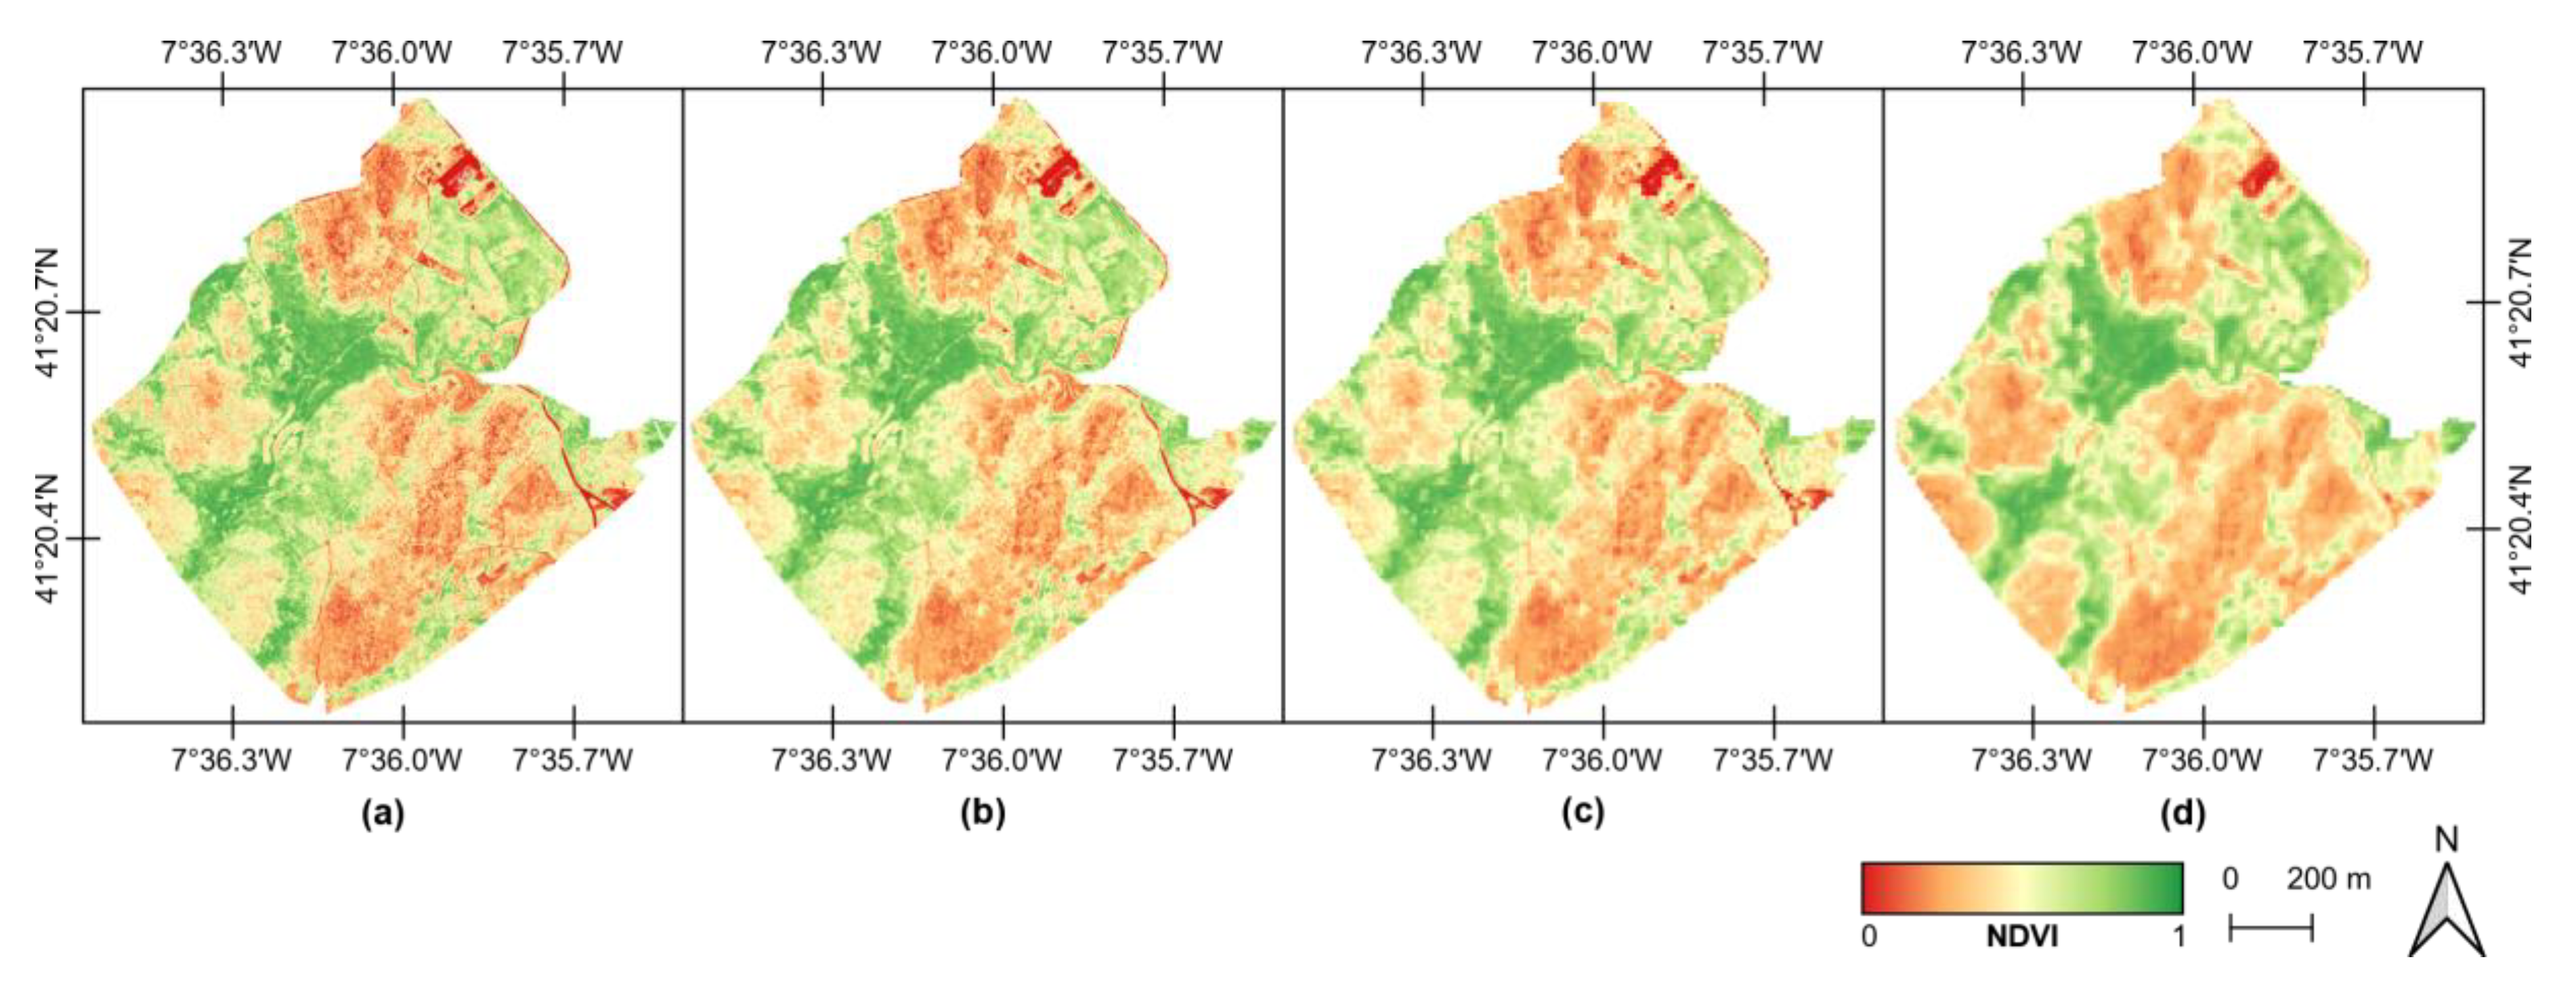
3.2. Comparison of UAV-Based and Sentinel-2 MSI Data

As mentioned in Section 2.3.3., the UAV-based multispectral data covered 116 ha of the study area. This was used to perform a comparison between the Sentinel-2 NDVI and the UAV-based NDVI at different spatial resolutions (Figure 6). The statistics of the different spatial resolutions of the UAV NDVI (Table 2) were similar in their mean values, while the minimum, maximum and standard deviation values tended to be greater for higher spatial resolutions. In regards to the NDVI computed from the Sentinel-2 dataset, a small difference was verified for the mean value, while the minimum, maximum and standard deviation values were similar to the UAV NDVI at a 10-m spatial resolution (Figure 6c).
The confusion matrix presented in Table 3 shows the correlation between all NDVIs. All resolutions of the UAV-based NDVIs showed a good correlation and increased as the spatial resolution became closer to the satellite resolution.
Geospatial correlation was conducted using a 50 × 50 m grid, resulting in a total of 479 cells. The mean value of the satellite NDVI was compared with each UAV resolution, and the results are presented in Figure 7. The MI value for all approaches was 0.634. Generally, all approaches presented a similar behavior in the BILISA relationships, where 59% of the cells presented a p-value lower than 0.05: 81% of cells presented an HH or LL correlation (39.3% and 41.4%, respectively), 11% presented an LH correlation and only 8% presented an HL correlation.

4. Discussion

This study evaluates the usage of free-access multi-temporal Sentinel-2 data to perform post-fire monitoring over an area of 361 ha in the north-eastern Portugal. The dNBI (Figure 2) was used to assess fire severity, which enabled estimation and delineation of the area affected per severity level. Both high and moderate severity classes represented the majority of the burned area (a total of 86%, corresponding to 311 ha), demonstrating a high incidence of fire disturbance in the forest stands present in the area. Moreover, both classes also presented the lowest post-fire NDVI values (Figure 4, September 2017). The same trend has been verified by other studies, noting that values decrease as fire severity rises [32]. On the other hand, unburned and low-severity areas were mostly located on the perimeter of the fire disturbance. These areas had easier access, due to the existence of roads and of priority protection by the authorities due to the proximity to settlements and infrastructures. These results are corroborated by the mean NDVI value of the multitemporal analysis (Figure 4), which shows similar values to the pre-fire data in the low-severity and unburned areas along with lower NDVI differences after the fire event (Figure 5). An example of a riparian stand that resisted fire disturbance is shown in Figure 8. On the other hand, areas classified with a high or moderate fire severity presented higher difference in the NDVI values during the analyzed period. This can be justified by the resprouting of some species and by the regeneration of others, as is the case with maritime pine, which has physical characteristics that allow its survival (thick bark and reproduction procedures) [54]. Moreover, the trend of NDVI values declining over the months can be justified by the presence of some undergrowth cover that dries out due to the absence of precipitation and increase of air temperature [55].
The UAV-based multispectral imagery acquired in the 116 ha of the study showed similar results when compared to the Sentinel-2 data. These findings have already been verified for WordView-2 1-m spatial resolution data [14], but never for Sentinel-2. In fact, for this type of application, the Sentinel-2 proved to be a more cost-effective approach that was able to cover wider areas, providing a short revisit time (five days) and delivering a wider spectral range. UAV-based multispectral data acquisition, on the other hand, can provide similar or higher temporal resolutions, but in a more time-consuming and expensive way, with costs increasing significantly for bigger areas [56]. This is an issue, since at least two human resources are needed who will make multiple trips and spend several days of work in order to meet a similar revisit time [57]. Furthermore, multiple batteries are needed to cover a considerable area. Fernández-Guisuraga et al. [14] used the Parrot SEQUOIA for UAV-based data acquisition during the post-fire monitoring of a 3000-ha area and faced several issues in the process. The overall procedure was time-consuming and computationally demanding, with data acquisition taking two months to conduct (resulting in a total of 100 h), and further data processing taking approximately 320 h. Some of these data then had to be discarded due to sensor malfunctions during the flights, in addition to radiometric anomalies found in the acquired images and further data storage problems. The experiment carried out by Fernández-Guisuraga et al. [14] allowed the suitability of UAV-based multispectral imagery to be determined when more information in terms of spatial variability in heterogeneous burned areas is needed. Other authors have explored fire severity measuring using UAV-based RGB imagery [17], but some limitations that directly impact its accuracy have been found such as the influence of canopy shadows, photogrammetric errors in canopy modelling and inconsistent illumination across the imagery. However, all remaining applications in terms of fire monitoring can be accomplished using satellite imagery, including those provided by Sentinel-2 MSI. Despite the great effectiveness of the satellite data for post-fire monitoring at a local/regional scale, some applications may require a significantly higher spatial resolution, making UAVs necessary, as is the case in individual tree monitoring [58], which cannot be conducted with satellite data with a decameter resolution or in real-time fire monitoring applications [12]. Thus, the complementarity of the two types of data are proven.

5. Conclusions

In this article, the potential of the use of satellite optical time series images from the ESA Copernicus Programme was addressed for monitoring relatively small areas affected by forest fires. In areas with sizes up to the one presented in this study (~400 ha), the use of small and very flexible UAVs for the analysis of post-fire vegetation recovery would be perfectly possible. However, the use of UAVs would result in a more laborious and expensive UAV tasks, requiring several visits to a field. Thus, in this study, Sentinel-2 MSI data were used to compute NBRs before and after fire disturbances in order to measure their extents and severity using difference NBR (dNBR). Subsequently, NDVI was also calculated to assess forestry recovery in the study region from 2017 to 2019. The NDVI from the Sentinel-2 MSI data was compared with UAV-based high-resolution data at different spatial resolutions (0.25, 5 and 10 m) to access their similarities. The results demonstrated the effectiveness of satellite data for post-fire monitoring, even at a local scale. The Sentinel-2 MSI data presented a similar behavior to the UAV-based data in assessing burned areas. The confusion matrix, calculated for Sentinel-2 and UAV, showed high correlations between all NDVIs (i.e., 0.83, 0.90 and 0.93 for 0.25, 5 and 10 m spatial resolutions, respectively). Furthermore, the median and extreme values were very similar, differing no more than 0.02 for the mean, 0.04 for the minimum and 0.01 for the maximum. Thus, the availability of multi-temporal Sentinel-2 MSI data with frequent revisit times enables the severity of fire disturbances to be identified and, in a post-fire context, for the recovery of forests to be monitored and their evolutions observed when compared to pre-fire vegetation status. In this way, Sentinel-2 data can be automatically used to monitor burned areas. However, this approach should be evaluated in other areas with different fire extensions and vegetative covers, as well as in broader post-fire periods.

Author Contributions

Conceptualization, Luís Pádua and Joaquim J. Sousa; data curation, Luís Pádua; formal analysis, Luís Pádua; funding acquisition, António Sousa, Emanuel Peres and Joaquim J. Sousa; investigation, Luís Pádua, Nathalie Guimarães and Telmo Adão; methodology, Luís Pádua and Joaquim J. Sousa; project administration, Luís Pádua, Emanuel Peres and Joaquim J. Sousa; resources, Luís Pádua, Nathalie Guimarães, Telmo Adão and Joaquim J. Sousa; software, Luís Pádua, Nathalie Guimarães and Telmo Adão; supervision, António Sousa, Emanuel Peres and Joaquim J. Sousa; validation, Luís Pádua and Joaquim J. Sousa; visualization, Luís Pádua; writing—original draft, Luís Pádua; writing—review and editing, Nathalie Guimarães, Telmo Adão, António Sousa, Emanuel Peres and Joaquim J. Sousa. All authors have read and agreed to the published version of the manuscript.

Funding

Financial support provided by the FCT-Portuguese Foundation for Science and Technology (SFRH/BD/139702/2018) to Luís Pádua.

Conflicts of Interest

The authors declare no conflict of interest.

References

  1. Fernandes, P.M.; Barros, A.M.G.; Pinto, A.; Santos, J.A. Characteristics and controls of extremely large wildfires in the western Mediterranean Basin. J. Geophys. Res. Biogeosci. 2016, 121, 2141–2157. [Google Scholar] [CrossRef]
  2. Rego, F.C. Land Use Changes and Wildfires. In Responses of Forest Ecosystems to Environmental Changes; Teller, A., Mathy, P., Jeffers, J.N.R., Eds.; Springer: Dordrecht, the Netherlands, 1992; pp. 367–373. ISBN 978-94-011-2866-7. [Google Scholar]
  3. Fernandes, P.M. On the socioeconomic drivers of municipal-level fire incidence in Portugal. For. Policy Econ. 2016, 62, 187–188. [Google Scholar] [CrossRef]
  4. Foster, D.R.; Knight, D.H.; Franklin, J.F. Landscape Patterns and Legacies Resulting from Large, Infrequent Forest Disturbances. Ecosystems 1998, 1, 497–510. [Google Scholar] [CrossRef]
  5. Mateus, P.; Fernandes, P.M. Forest Fires in Portugal: Dynamics, Causes and Policies. In Forest Context and Policies in Portugal: Present and Future Challenges; Reboredo, F., Ed.; World Forests; Springer International Publishing: Cham, Switzerland, 2014; pp. 97–115. ISBN 978-3-319-08455-8. [Google Scholar]
  6. Departamento de Gestão de Áreas Públicas e de Proteção Florestal 10. Relatório Provisório De Incêndios Florestais-2017, 2017.
  7. Lentile, L.B.; Holden, Z.A.; Smith, A.M.S.; Falkowski, M.J.; Hudak, A.T.; Morgan, P.; Lewis, S.A.; Gessler, P.E.; Benson, N.C. Remote sensing techniques to assess active fire characteristics and post-fire effects. Int. J. Wildland Fire 2006, 15, 319–345. [Google Scholar] [CrossRef]
  8. Pádua, L.; Vanko, J.; Hruška, J.; Adão, T.; Sousa, J.J.; Peres, E.; Morais, R. UAS, sensors, and data processing in agroforestry: a review towards practical applications. Int. J. Remote Sens. 2017, 38, 2349–2391. [Google Scholar] [CrossRef]
  9. Fernández-Álvarez, M.; Armesto, J.; Picos, J. LiDAR-Based Wildfire Prevention in WUI: The Automatic Detection, Measurement and Evaluation of Forest Fuels. Forests 2019, 10, 148. [Google Scholar] [CrossRef] [Green Version]
  10. Shin, P.; Sankey, T.; Moore, M.M.; Thode, A.E. Evaluating Unmanned Aerial Vehicle Images for Estimating Forest Canopy Fuels in a Ponderosa Pine Stand. Remote Sens. 2018, 10, 1266. [Google Scholar] [CrossRef] [Green Version]
  11. Martínez-de Dios, J.R.; Merino, L.; Caballero, F.; Ollero, A. Automatic forest-fire measuring using ground stations and Unmanned Aerial Systems. Sensors 2011, 11, 6328–6353. [Google Scholar] [CrossRef] [Green Version]
  12. Merino, L.; Caballero, F.; Martínez-de-Dios, J.R.; Maza, I.; Ollero, A. An Unmanned Aircraft System for Automatic Forest Fire Monitoring and Measurement. J. Intell. Robot Syst. 2012, 65, 533–548. [Google Scholar] [CrossRef]
  13. Yuan, C.; Zhang, Y.; Liu, Z. A survey on technologies for automatic forest fire monitoring, detection, and fighting using unmanned aerial vehicles and remote sensing techniques. Can. J. For. Res. 2015, 45, 783–792. [Google Scholar] [CrossRef]
  14. Fernández-Guisuraga, J.M.; Sanz-Ablanedo, E.; Suárez-Seoane, S.; Calvo, L. Using Unmanned Aerial Vehicles in Postfire Vegetation Survey Campaigns through Large and Heterogeneous Areas: Opportunities and Challenges. Sensors 2018, 18, 586. [Google Scholar] [CrossRef] [PubMed] [Green Version]
  15. Fraser, R.H.; Van der Sluijs, J.; Hall, R.J. Calibrating Satellite-Based Indices of Burn Severity from UAV-Derived Metrics of a Burned Boreal Forest in NWT, Canada. Remote Sens. 2017, 9, 279. [Google Scholar] [CrossRef] [Green Version]
  16. Larrinaga, A.R.; Brotons, L. Greenness Indices from a Low-Cost UAV Imagery as Tools for Monitoring Post-Fire Forest Recovery. Drones 2019, 3, 6. [Google Scholar] [CrossRef] [Green Version]
  17. McKenna, P.; Erskine, P.D.; Lechner, A.M.; Phinn, S. Measuring fire severity using UAV imagery in semi-arid central Queensland, Australia. Int. J. Remote Sens. 2017, 38, 4244–4264. [Google Scholar] [CrossRef]
  18. Carvajal-Ramírez, F.; Marques da Silva, J.R.; Agüera-Vega, F.; Martínez-Carricondo, P.; Serrano, J.; Moral, F.J. Evaluation of Fire Severity Indices Based on Pre- and Post-Fire Multispectral Imagery Sensed from UAV. Remote Sens. 2019, 11, 993. [Google Scholar] [CrossRef] [Green Version]
  19. Aicardi, I.; Garbarino, M.; Lingua, A.; Lingua, E.; Marzano, R.; Piras, M. Monitoring Post-Fire Forest Recovery Using Multitemporal Digital Surface Models Generated from Different Platforms. Earsel Eproceedings 2016, 15, 1–8. [Google Scholar]
  20. White, R.A.; Bomber, M.; Hupy, J.P.; Shortridge, A. UAS-GEOBIA Approach to Sapling Identification in Jack Pine Barrens after Fire. Drones 2018, 2, 40. [Google Scholar] [CrossRef] [Green Version]
  21. Hardin, P.J.; Jensen, R.R. Small-Scale Unmanned Aerial Vehicles in Environmental Remote Sensing: Challenges and Opportunities. GIScience Remote Sens. 2011, 48, 99–111. [Google Scholar] [CrossRef]
  22. Chu, T.; Guo, X. Remote Sensing Techniques in Monitoring Post-Fire Effects and Patterns of Forest Recovery in Boreal Forest Regions: A Review. Remote Sens. 2014, 6, 470–520. [Google Scholar] [CrossRef] [Green Version]
  23. Clemente, R.H.; Cerrillo, R.M.N.; Gitas, I.Z. Monitoring post-fire regeneration in Mediterranean ecosystems by employing multitemporal satellite imagery. Int. J. Wildland Fire 2009, 18, 648–658. [Google Scholar] [CrossRef]
  24. Eidenshink, J.; Schwind, B.; Brewer, K.; Zhu, Z.-L.; Quayle, B.; Howard, S. A Project for Monitoring Trends in Burn Severity. Fire Ecol. 2007, 3, 3–21. [Google Scholar] [CrossRef]
  25. Van Leeuwen, W.J.D. Monitoring the Effects of Forest Restoration Treatments on Post-Fire Vegetation Recovery with MODIS Multitemporal Data. Sensors 2008, 8, 2017–2042. [Google Scholar] [CrossRef] [PubMed] [Green Version]
  26. Liu, Y.; Gong, W.; Hu, X.; Gong, J. Forest Type Identification with Random Forest Using Sentinel-1A, Sentinel-2A, Multi-Temporal Landsat-8 and DEM Data. Remote Sens. 2018, 10, 946. [Google Scholar] [CrossRef] [Green Version]
  27. Gascon, F.; Cadau, E.; Colin, O.; Hoersch, B.; Isola, C.; Fernández, B.L.; Martimort, P. Copernicus Sentinel-2 Mission: Products, Algorithms and Cal/Val. In Proceedings of the Earth Observing Systems XIX International Society for Optics and Photonics, San Diego, CA, USA, 26 September 2014; Volume 9218, p. 92181E. [Google Scholar]
  28. Drusch, M.; Del Bello, U.; Carlier, S.; Colin, O.; Fernandez, V.; Gascon, F.; Hoersch, B.; Isola, C.; Laberinti, P.; Martimort, P.; et al. Sentinel-2: ESA’s Optical High-Resolution Mission for GMES Operational Services. Remote Sens. Environ. 2012, 120, 25–36. [Google Scholar] [CrossRef]
  29. Moreira, F.; Ascoli, D.; Safford, H.; Adams, M.A.; Moreno, J.M.; Pereira, J.M.C.; Catry, F.X.; Armesto, J.; Bond, W.; González, M.E.; et al. Wildfire management in Mediterranean-type regions: paradigm change needed. Environ. Res. Lett. 2020, 15, 011001. [Google Scholar] [CrossRef]
  30. Fernández-Manso, A.; Fernández-Manso, O.; Quintano, C. SENTINEL-2A red-edge spectral indices suitability for discriminating burn severity. Int. J. Appl. Earth Obs. Geoinf. 2016, 50, 170–175. [Google Scholar] [CrossRef]
  31. Roteta, E.; Bastarrika, A.; Padilla, M.; Storm, T.; Chuvieco, E. Development of a Sentinel-2 burned area algorithm: Generation of a small fire database for sub-Saharan Africa. Remote Sens. Environ. 2019, 222, 1–17. [Google Scholar] [CrossRef]
  32. Navarro, G.; Caballero, I.; Silva, G.; Parra, P.C.; Vázquez, Á.; Caldeira, R. Evaluation of forest fire on Madeira Island using Sentinel-2A MSI imagery. Int. J. Appl. Earth Obs. Geoinf. 2017, 58, 97–106. [Google Scholar] [CrossRef] [Green Version]
  33. Filipponi, F. BAIS2: Burned Area Index for Sentinel-2. Proceedings 2018, 2, 364. [Google Scholar] [CrossRef] [Green Version]
  34. Amos, C.; Petropoulos, G.P.; Ferentinos, K.P. Determining the use of Sentinel-2A MSI for wildfire burning & severity detection. Int. J. Remote Sens. 2019, 40, 905–930. [Google Scholar]
  35. Quintano, C.; Fernández-Manso, A.; Fernández-Manso, O. Combination of Landsat and Sentinel-2 MSI data for initial assessing of burn severity. Int. J. Appl. Earth Obs. Geoinf. 2018, 64, 221–225. [Google Scholar] [CrossRef]
  36. Mallinis, G.; Mitsopoulos, I.; Chrysafi, I. Evaluating and comparing Sentinel 2A and Landsat-8 Operational Land Imager (OLI) spectral indices for estimating fire severity in a Mediterranean pine ecosystem of Greece. GIScience Remote Sens. 2018, 55, 1–18. [Google Scholar] [CrossRef]
  37. Filipponi, F. Exploitation of Sentinel-2 Time Series to Map Burned Areas at the National Level: A Case Study on the 2017 Italy Wildfires. Remote Sens. 2019, 11, 622. [Google Scholar] [CrossRef] [Green Version]
  38. Chrysafis, I.; Christopoulou, A.; Kazanis, D.; Farangitakis, G.P.; Mallinis, G.; Mitsopoulos, I.; Arianoutsou, M.; Vassilakis, E.; Antoniou, V.; Theofanous, N.; et al. Post-fire vegetation recovery mapping using multi-temporal Sentinel-2A imagery in Chios island, Greece. In Proceedings of the EGU General Assembly Conference Abstracts, Vienna, Austria, 4–13 April 2018; Volume 20, p. 7066. [Google Scholar]
  39. ICNG—Instituto da Convervação da Natureza e das Florestas Mapas—ICNF. Available online: http://www2.icnf.pt/portal/florestas/dfci/inc/mapas (accessed on 9 January 2020).
  40. Louis, J.; Debaecker, V.; Pflug, B.; Main-Knorn, M.; Bieniarz, J.; Mueller-Wilm, U.; Cadau, E.; Gascon, F. SENTINEL-2 SEN2COR: L2A Processor for Users. In Proceedings of the Living Planet Symposium 2016, Prague, Czech Republic, 9–13 May 2016; Ouwehand, L., Ed.; Spacebooks Online: Prague, Czech Republic, 2016; Volume SP-740, pp. 1–8. [Google Scholar]
  41. Key, C.; Benson, N. Landscape Assessment: Ground measure of severity, the Composite Burn Index; and Remote sensing of severity, the Normalized Burn Ratio. In FIREMON: Fire Effects Monitoring and Inventory System; USDA Forest Service, Rocky Mountain Research Station: Ogden, UT, USA, 2006; p. LA 1-51. [Google Scholar]
  42. Veraverbeke, S.; Lhermitte, S.; Verstraeten, W.W.; Goossens, R. A time-integrated MODIS burn severity assessment using the multi-temporal differenced normalized burn ratio (dNBRMT). Int. J. Appl. Earth Obs. Geoinf. 2011, 13, 52–58. [Google Scholar] [CrossRef] [Green Version]
  43. French, N.H.F.; Kasischke, E.S.; Hall, R.J.; Murphy, K.A.; Verbyla, D.L.; Hoy, E.E.; Allen, J.L. Using Landsat data to assess fire and burn severity in the North American boreal forest region: an overview and summary of results. Int. J. Wildland Fire 2008, 17, 443–462. [Google Scholar] [CrossRef]
  44. Rouse, J.W., Jr.; Haas, R.H.; Schell, J.A.; Deering, D.W. Monitoring Vegetation Systems in the Great Plains with Erts. NASA Spec. Publ. 1974, 351, 309. [Google Scholar]
  45. Gouveia, C.; DaCamara, C.C.; Trigo, R.M. Post-fire vegetation recovery in Portugal based on spot/vegetation data. Nat. Hazards Earth Syst. Sci. 2010, 10, 673–684. [Google Scholar] [CrossRef] [Green Version]
  46. Teodoro, A.; Amaral, A. A Statistical and Spatial Analysis of Portuguese Forest Fires in Summer 2016 Considering Landsat 8 and Sentinel 2A Data. Environments 2019, 6, 36. [Google Scholar] [CrossRef] [Green Version]
  47. Keeley, J.E. Fire intensity, fire severity and burn severity: a brief review and suggested usage. Int. J. Wildland Fire 2009, 18, 116–126. [Google Scholar] [CrossRef]
  48. GRASS Development Team. Geographic Resources Analysis Support System (GRASS) Software; Version 7.2.; Open Source Geospatial Foundation: Beaverton, OR, USA, 2017. [Google Scholar]
  49. Conrad, O.; Bechtel, B.; Bock, M.; Dietrich, H.; Fischer, E.; Gerlitz, L.; Wehberg, J.; Wichmann, V.; Böhner, J. System for Automated Geoscientific Analyses (SAGA) v. 2.1.4. Geosci. Model Dev. 2015, 8, 1991–2007. [Google Scholar] [CrossRef] [Green Version]
  50. Moran, P.a.P. NOTES ON CONTINUOUS STOCHASTIC PHENOMENA. Biometrika 1950, 37, 17–23. [Google Scholar] [CrossRef] [PubMed]
  51. Anselin, L. Local indicators of spatial association—LISA. Geogr. Anal. 1995, 27, 93–115. [Google Scholar] [CrossRef]
  52. Anselin, L.; Rey, S.J. Modern Spatial Econometrics in Practice: A Guide to GeoDa, GeoDaSpace and PySAL; Geoda Press LLC: Chicago, IL, USA, 2014; ISBN 978-0-9863421-0-3. [Google Scholar]
  53. Anselin, L.; Syabri, I.; Kho, Y. GeoDa: An Introduction to Spatial Data Analysis. Geogr. Anal. 2006, 38, 5–22. [Google Scholar] [CrossRef]
  54. Fernandes, P.M.; Rigolot, E. The fire ecology and management of maritime pine (Pinus pinaster Ait.). For. Ecol. Manag. 2007, 241, 1–13. [Google Scholar] [CrossRef]
  55. Šraj, M.; Brilly, M.; Mikoš, M. Rainfall interception by two deciduous Mediterranean forests of contrasting stature in Slovenia. Agric. For. Meteorol. 2008, 148, 121–134. [Google Scholar] [CrossRef] [Green Version]
  56. Matese, A.; Toscano, P.; Di Gennaro, S.F.; Genesio, L.; Vaccari, F.P.; Primicerio, J.; Belli, C.; Zaldei, A.; Bianconi, R.; Gioli, B. Intercomparison of UAV, Aircraft and Satellite Remote Sensing Platforms for Precision Viticulture. Remote Sens. 2015, 7, 2971–2990. [Google Scholar] [CrossRef] [Green Version]
  57. Anderson, K.; Gaston, K.J. Lightweight unmanned aerial vehicles will revolutionize spatial ecology. Front. Ecol. Environ. 2013, 11, 138–146. [Google Scholar] [CrossRef] [Green Version]
  58. Pádua, L.; Adão, T.; Guimarães, N.; Sousa, A.; Peres, E.; Sousa, J.J. Post-fire forestry recovery monitoring using high-resolution multispectral imagery from unmanned aerial vehicles. In Proceedings of the ISPRS—International Archives of the Photogrammetry, Remote Sensing and Spatial Information Sciences, Prague, Czech Republic, 3–6 September 2019; Copernicus GmbH: Göttingen, Germany, 2019; Volume XLII-3-W8, pp. 301–305. [Google Scholar]
Figure 1. Overview of the study area along with the fire extent and area surveyed by the unmanned aerial vehicle (UAV).
Ijgi 09 00225 g001
Figure 2. Fire severity classification of the study area.
Ijgi 09 00225 g002
Figure 3. Normalized difference vegetation index (NDVI) of the study area in: (a) September 2017, (b) August 2017, (c) September 2018 and (d) September 2019. The difference NDVI (dNDVI) compared to September 2017 in (e) August 2017, (f) August 2018 and (g) August 2019.
Ijgi 09 00225 g003
Figure 4. Mean values of the normalized difference vegetation index (NDVI) of the study area (a) and for each severity level (b) in the months of June, July, August and September of 2017, 2018 and 2019. The orange dashed line marks the fire disturbance date.
Ijgi 09 00225 g004
Figure 5. Mean values of the difference normalized difference vegetation index (dNDVI) of the study area for each severity level in the months of June, July, August and September during 2018 and 2019.
Ijgi 09 00225 g005
Figure 6. Normalized difference vegetation index (NDVI) computed from the multispectral data obtained from the unmanned aerial vehicle at 0.25 m (a) and the resamples to 5 m (b) and 10 m (c), as well as the NDVI computed from the Sentinel-2 MSI data (d).
Ijgi 09 00225 g006
Figure 7. Mean value of the normalized difference vegetation index (NDVI) computed using the multispectral data obtained from an unmanned aerial vehicle (UAV) at 0.25 m (a) and the resamples to 5 m (b) and 10 m (c), as well as the NDVI computed from the Sentinel-2 Multispectral Instrument (MSI) data (d) in the 50 × 50 m grid. Bivariate local indicators of spatial association (BILISA) cluster maps between the NDVI map from Sentinel-2 and the UAV-based NDVIs at different spatial resolutions of 0.25 m (e), 5 m (f), and 10 m (g). Associations with a p-value < 0.05 are highlighted with a black border.
Ijgi 09 00225 g007
Figure 8. Overview of a stand that resisted the fire disturbance. Its location in the study area is (a) marked with a white cross and (b) visualized in the UAV-based orthophoto mosaic. Data from July 2019.
Ijgi 09 00225 g008
Table 1. Days corresponding to the Sentinel-2 data selected for multi-temporal analysis. June, July and August 2017 correspond to data before the fire disturbance.
YearMonth
JuneJulyAugustSeptember
20174141322
201824292312
201929191312
Table 2. Basic statistics of the normalized difference vegetation index of the different UAV-based spatial resolutions and the Sentinel-2.
Num. of PixelsMinimumMeanMaximumSTD
UAV 0.25 m1690 × 104-0.390.510.990.23
UAV 5 m4.57 × 104-0.100.510.930.21
UAV 10 m1.14 × 104-0.090.510.910.20
Sentinel-21.14 × 10⁴-0.060.490.920.20
Table 3. Correlation matrix between the normalized difference vegetation index of the different UAV-based spatial resolutions and the Sentinel-2.
UAV 0.25 mUAV 5 mUAV 10 mSentinel-2A
UAV 0.25 m1.00---
UAV 5 m0.851.00--
UAV 10 m0.910.931.00-
Sentinel-20.840.900.931.00

