A Multi-Scale Representation of Point-of-Interest (POI) Features in Indoor Map Visualization


School of Resource and Environmental Sciences, Wuhan University, 129 Luoyu Road, Wuhan 430079, China
*
Author to whom correspondence should be addressed.
ISPRS Int. J. Geo-Inf. 2020, 9(4), 239; https://0-doi-org.brum.beds.ac.uk/10.3390/ijgi9040239
Submission received: 9 March 2020
/
Revised: 8 April 2020
/
Accepted: 8 April 2020
/
Published: 11 April 2020
(This article belongs to the Special Issue Map Generalization)
Abstract
:As a result of the increasing popularity of indoor activities, many facilities and services are provided inside buildings; hence, there is a need to visualize points-of-interest (POIs) that can describe these indoor service facilities on indoor maps. Over the last few years, indoor mapping has been a rapidly developing area, with the emergence of many forms of indoor representation. In the design of indoor map applications, cartographical methodologies such as generalization and symbolization can make important contributions. In this study, a self-adaptive method is applied for the design of a multi-scale and personalized indoor map. Based on methods of map generalization and multi-scale representation, we adopt a scale-adaptive strategy to visualize the building structure and POI data on indoor maps. At smaller map scales, the general floor distribution and functional partitioning of each floor are represented, while the POI data are visualized by simple symbols. At larger map scales, the detailed room distribution is displayed, and the service information of the POIs is described by detailed symbols. Different strategies are used for the generalization of the background building structure and the foreground POI data to ensure that both can satisfy real-time performance requirements. In addition, for better personalization, different POI data, symbols or color schemes are shown to users in different age groups, with different genders or with different purposes for using the map. Because this indoor map is adaptive to both the scale and the user, each map scale can provide different map users with decision support from different perspectives.
1. Introduction
As the number of large buildings increases, indoor activities are becoming more frequent. Most people spend 80% to 90% of their time in an indoor environment [1], and many facilities and services that used to be provided in an outdoor environment have moved inside of buildings [2]. In this context, traditional map services that present facility locations by placing point-of-interest (POI) symbols on outdoor maps cannot meet the needs of map users in urban areas. As an important representation of location-based services (LBSs), indoor map services, which can provide users with facility locations inside a building, have become a new trend in map services [3]. Compared with that in outdoor spaces, the information density in indoor spaces is usually higher [4]; at the same time, indoor maps are mostly used on mobile devices [5]. Therefore, visualizing optimized informational content on a limited screen is an important issue for indoor map visualization, and it is of great significance to explore multi-scale and personalized visualization methods to allow indoor maps to adaptively meet users’ diverse and multilevel information needs [5,6].
Over the last few decades, indoor maps have attracted increasing attention from both commercial enterprises and scientific institutions [7]. Some popular indoor map services include Google Maps, Apple Maps, and Bing Maps, which offer indoor maps of popular public places in the form of map-based mash-ups that integrate rooms and hallways as the background and POI data as the foreground. Scientific research on indoor map services has mainly focused on indoor positioning systems [8], indoor navigation [9], and indoor spatial data modeling [10]. In contrast, little attention has been paid to the study of indoor map visualization [11]. However, indoor map visualization is the foundation of indoor location services and may strongly influence how effectively map information is conveyed; therefore, improving the design and visual clarity of maps from a cartographic perspective is important for indoor location services [12]. Most indoor maps are still 2D visualizations of the buildings of interest; such maps include architectural floor plans and abstract floor plans. However, although 2D visualization is suitable for representing outdoor surfaces, which tend to have very limited overlapping information, it is difficult to describe the vertical dimension of indoor environments in this way [13]. The outputs of some 3D data modeling approaches and tools that are relevant to indoor maps, including BIM (building information modeling), CityGML (city geography markup language), and IndoorGML (indoor geography markup language), are often considered forms of indoor maps [14]. However, these methods were mainly designed for building construction, urban modeling, and indoor navigation and are not optimized for visualization [15]. Among these methods, the use of BIM data, in formats such as IFC (industry foundation classes), to represent indoor space is very popular, and many advancements have been achieved in regard to the integration of these data with the geographic information system (GIS) [16]. BIM visualization has already served as the foundation for various indoor applications [17,18]. However, BIM data contain excessive information on building components, which results in a large data size; moreover, BIM visualization is limited by the available standards and lacks flexibility. These characteristics make BIM visualizations slightly different from cartographic maps, which focus on user-centered design and the enhancement of spatial understanding [14]. Some indoor maps rely on other innovative forms of visualization, using panoramic images and virtual, augmented, or mixed reality (VR, AR, or MR) to present literal representations of indoor environments that also include excessive detail. The lack of abstraction makes it difficult for users to obtain a rapid overview of a large area or to obtain useful information quickly from such a map [19]. There are also several approaches that take the form of true cartographic 3D maps with semantics and abstract symbolism, e.g., WRLD3D, Indoor3D, and ArcGIS Indoors [20,21,22]. Instead of presenting the exact form of the represented environment, these are nonliteral 3D representations with a high degree of abstraction. Cartographic principles such as symbolization are used to effectively communicate the intended messages.
From the perspective of the cartographic design of indoor maps, it is important to represent the building of interest at a number of levels of detail (LODs) through data generalization [5]. There are already some standard approaches to indoor LOD representation available in the BIM and GIS domains. BIM uses the concept of the level of development (LODt) to reflect the process of facility design and construction. The latest version of the LODt specification defines five LODts (100, 200, 300, 350, and 400), with LODt 100 using symbols or other generalized representations and LODt 400 modeling building components with sufficient detail and accuracy [23]. Although BIM is more of an architectural tool than a mapping platform, the LODt concept has a strong correlation with and significance to LODs for indoor mapping [24]. Within the GIS domain, CityGML comes closest to a LOD representation of indoor space. It defines five LODs for buildings, ranging from the most general LOD0 to the most detailed LOD4, but only LOD4 supports the representation of building interiors. In the new CityGML 3.0 format, LOD4 has been removed and integrated into LOD1-3 to support multiple representations of a building’s interior [25]. Because the LOD concepts in BIM and CityGML share some similarities, multi-LOD CityGML data can be extracted from BIM data to obtain generalized indoor representations [26]. Some related works have continued to improve the LODs of CityGML, through efforts such as the complete decoupling of the semantic LOD (by including or omitting some elements in each LOD) from the geometric generalization [27,28]. There are also some studies that have used a particular form of visualization for each LOD, for example, ranging from simple 2D floor plans to complex panoramic images [29]. In contrast to the above methods, our intent is to adapt classic map generalization techniques to indoor environments. Based on a cartographic 3D indoor map visualization, many indoor facilities are abstracted as POIs, and their multi-scale representation is studied. POIs are particularly important for maps because they represent locations that users may find useful or interesting and thus are the main source of information for users [30]. The existing work in the field of map generalization and multi-scale POI visualization in outdoor environments is extensive and well documented [31,32], but the corresponding strategies cannot be readily applied to indoor environments. For indoor maps, multi-scale representation and map generalization are new questions. Compared with traditional maps, indoor maps are larger scale maps with detailed and usually 3D representations. The LOD representations of indoor maps have richer contents and forms and capture more details at different levels.
In this paper, we apply a self-adaptive approach to the visualization of POIs on indoor maps to achieve multi-scale and personalized visualization. We develop a 3D indoor map with all floors superimposed vertically on an outdoor base map to allow users to perceive the entire building from one map. Acting as the background of the indoor map, multiple LODs of the building structure that can convey different levels of information are defined based on different levels of functional division. As the foreground of the indoor map, the POI data are visualized in a multi-scale way to describe different levels of semantic information. Furthermore, the POI data and symbols displayed can change with the user’s requirements to meet personalized needs.
2. Materials and Methods
2.1. Indoor Map Data
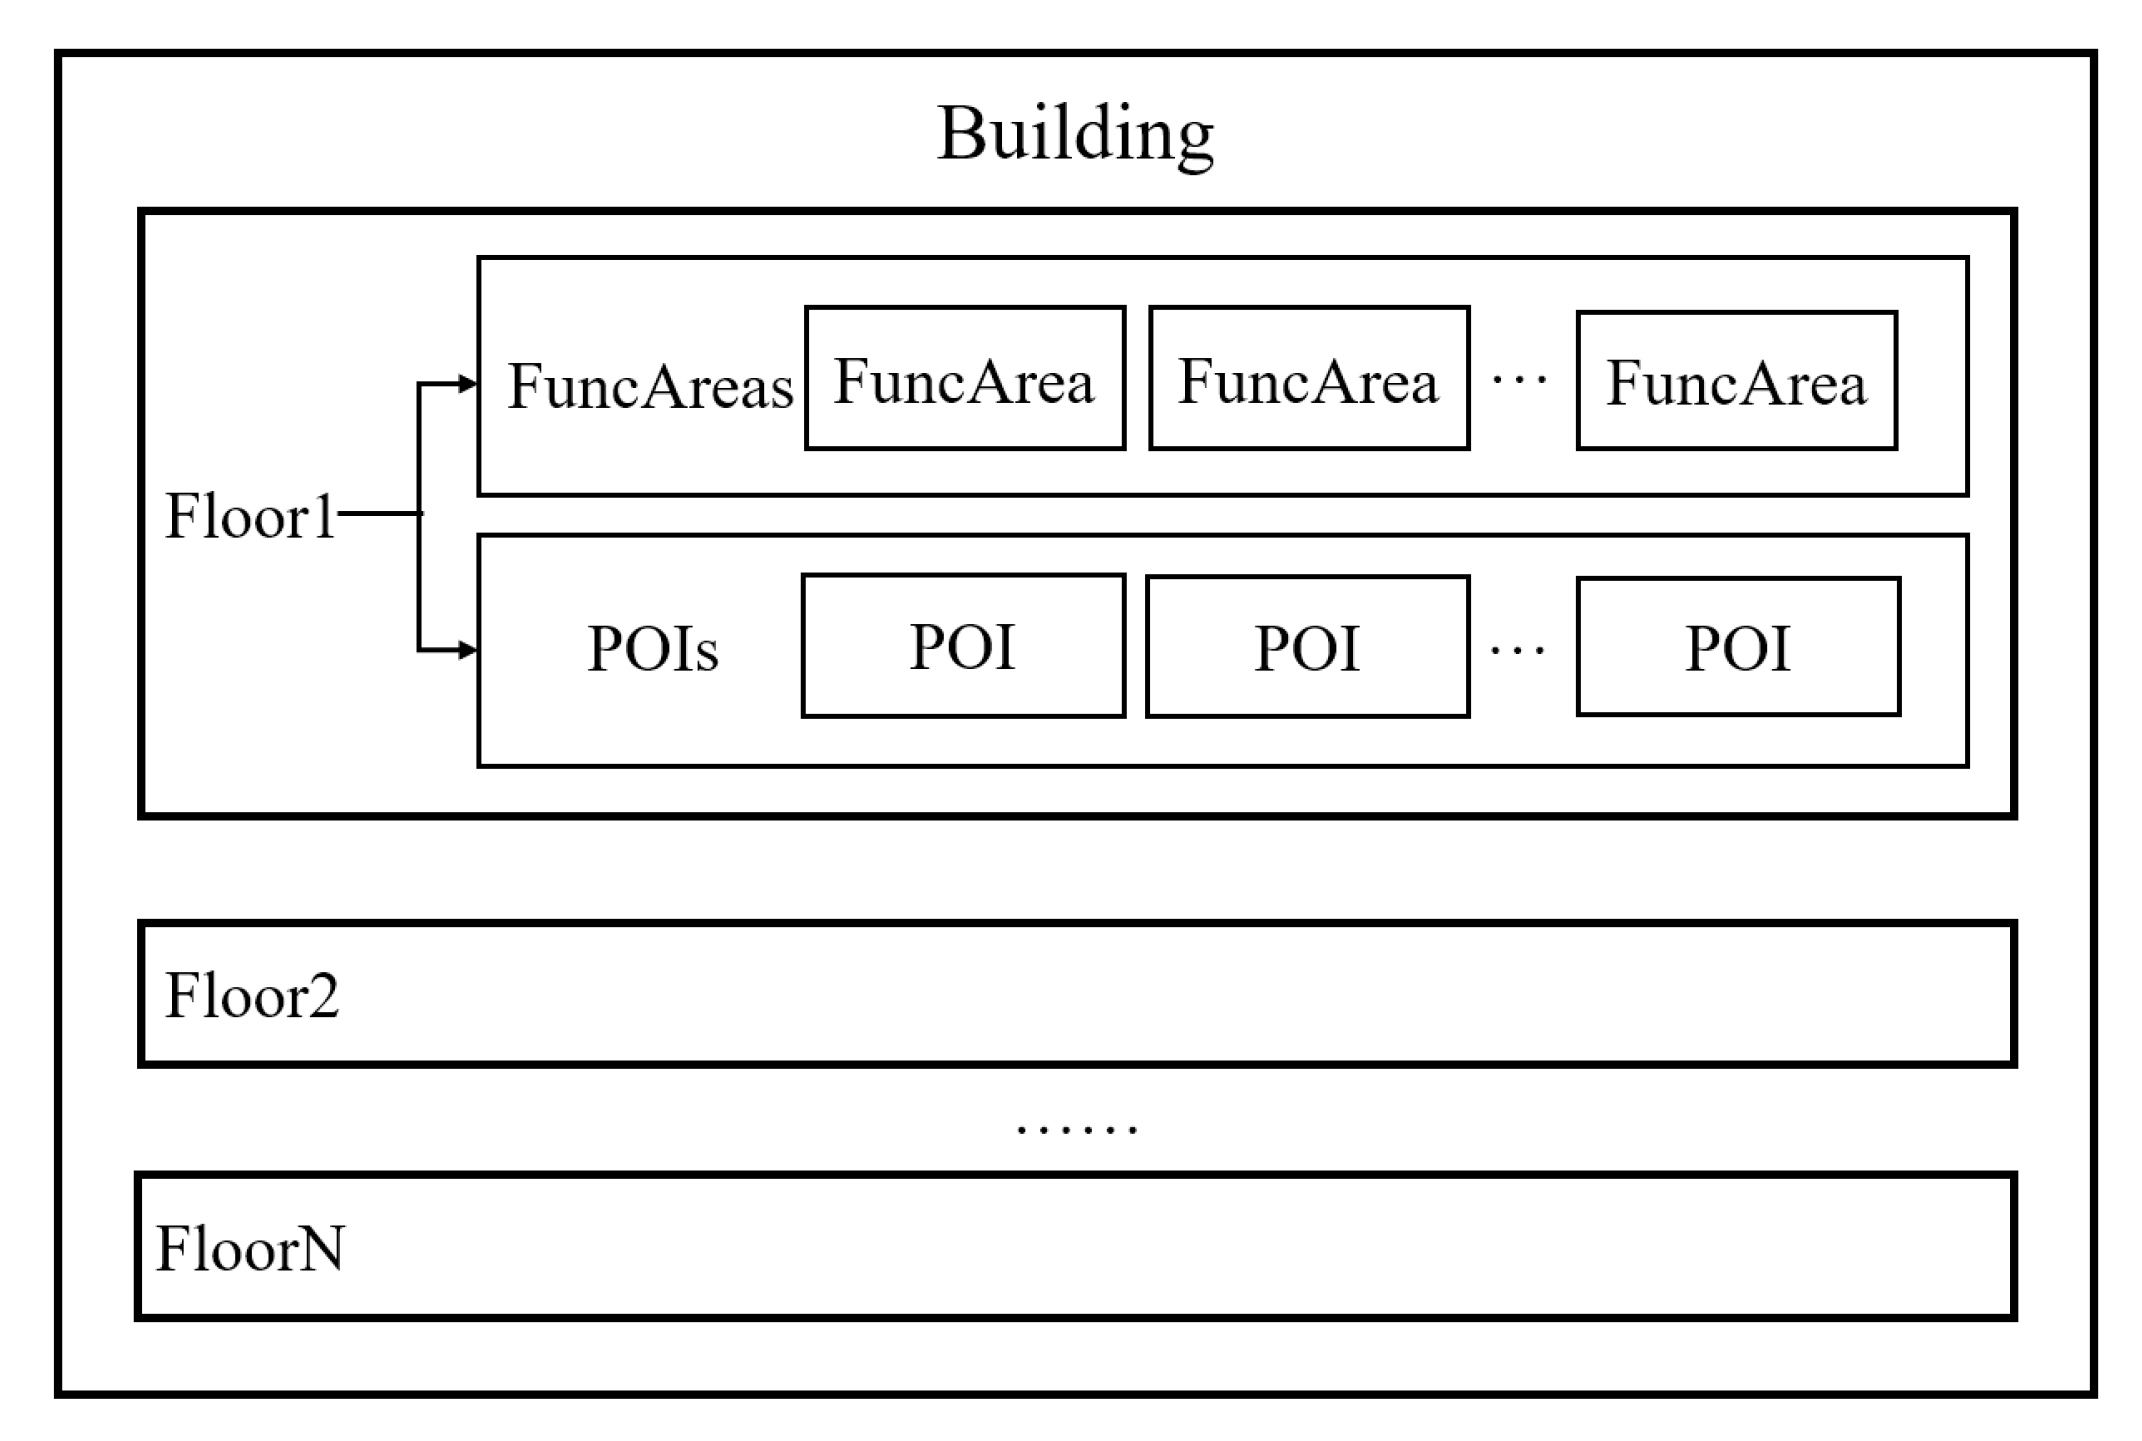
In this study, a shopping mall called Han Street Wanda Plaza in Wuhan, China, is used as an example to introduce the process of map-making. The indoor map data are digitized from the 2D floor plan and then organized hierarchically in accordance with the real structure of the building, as illustrated in Figure 1. A main JSON (JavaScript Object Notation) file is used to store the overall information of the whole building and to reference each of the building’s floors. Each floor is then further described in a GeoJSON file, which contains information about the floor itself as well as an array of functional areas and POIs. The functional areas we define in this study include areas such as original rooms, shops, counters, and generalized areas; they form the background of an indoor map and reflect the building structure. POIs are abstract point locations that provide information about the service facilities users are interested in, such as shops, toilets, and ATMs in a mall, and they form the foreground of an indoor map.
2.2. Indoor 3D Map Visualization
Indoor map visualization calls for markedly different visualization strategies than those for outdoor maps [33]. There are many differences between indoor spaces and outdoor spaces that may affect how we visualize them. First, indoor spaces have a finite size and a small spatial extent, in contrast to the unbounded and large spatial extent of the outdoors. Since the map scale is much larger, more fine-grained features and details should be represented with higher data accuracy on an indoor map. Second, indoor spaces have greater levels of complexity, and the density of spatial and semantic information is usually higher than in outdoor spaces; consequently, it may be necessary to omit or simplify some features to keep the map simple and readable. Third, the design and planning of indoor spaces are conducted entirely by humans; hence, the structure of an indoor space is more hierarchical and has a more regular geometry than the structure of natural outdoor features. Moreover, the human perception of an indoor space tends to progress from the whole to the parts, or from coarser to finer resolutions; therefore, indoor spaces should be visualized in a multi-scale way that aligns with such human cognition. Finally, an indoor space is usually multilayered, and a 3D visualization could provide not only an intuitive impression for users but also insight into the vertical structuring of the building.
2.2.1. Feature Selection and Classification
To reduce the cognitive load of processing an indoor map, we should ensure that the map contains as few redundant details as possible. The first step of visualizing an indoor map is feature selection. All features of a building can be divided into building structures and facilities; the former are the structural elements that form the building, and the latter add functionality to the building [28]. Using the shopping mall mentioned above as an example, for the building structure we selected the building outline, floor outlines, and room outlines as features. Many structural features that customers are not interested in when visiting a shopping mall were omitted, such as the doors and windows of each room and the railings, columns, and pipes. For facilities, we only selected those features that were most closely related to shopping behavior, which are then classified into three categories. Shops are of the greatest interest to users, so an indoor map of a mall should focus on them. Transportation features, including stairs, escalators, elevators, entrances and exits, were also selected; these features play a key role in users’ cognition of multistory indoor environments because they help users connect different floors in their mental map. Public service facilities, such as toilets, rest areas and ATMs, were also selected because they may be targets that users are looking for when they are shopping, although they are less important than features in the previous two categories. These facilities are the POIs that we consider in this study; they are visualized by POI symbols. In contrast, equipment and furniture, which are less important to shopping behavior, are not shown in the indoor map. The detailed feature selection and classification results are shown in Table 1.
2.2.2. Multi-Scale Data Modeling and Generalization
From the perspective of data organization, there are two main ways to achieve the multi-scale representation of spatial data in an online map. The first way is to prepare multiple versions of the data at different scales in advance through offline generalization and then call the desired version in real time based on the map scale. This approach can satisfy real-time performance requirements for larger volumes of data and is more suitable for data that are not updated frequently. This is the case for the building structure features presented on indoor maps. The second way is to generalize the original data online and return the generalized data needed for the current map view in real time. Data of smaller size, such as the POI features to be shown on an indoor map, can be generalized in this way to facilitate user interaction without sacrificing real-time performance. As shown in Figure 2, we use the 2D floor plan of the building of interest as the data source to create multi-scale indoor map data. After feature selection and classification, we digitize the building structure into polygon layers, which serve as the map backgrounds, and perform offline generalization. By contrast, the POIs (in the example presented here, transportation facilities, public service facilities, and shops) are simplified to single points to be presented as the map foreground information, and the online generalization process will be applied to these data. During digitization, multiple versions of the background polygon data that depict the indoor environment at different levels are prepared in advance. When users zoom in or zoom out, appropriate data are shown for the current zoom level. In contrast, only one version of the foreground point data is prepared, which is then generalized on the fly during visualization.
For the building structure, we propose four levels of detail that progress from the building outline to the detailed room distribution, as summarized in Table 2, in accordance with the functional partitioning of the indoor space. Simple 2D visualizations of the multi-scale original data for one of the floors are shown in Figure 3. These multi-scale representations can be regarded as interpolations of the CityGML LOD representations. CityGML predefines five LODs for buildings, but only the most detailed level includes indoor content, while at the other levels, the interiors of buildings remain empty. In our method, from LOD3 to LOD2 and further to LOD1, we gradually aggregate neighboring polygons and simplify the polygon shapes. Small polygons that cannot be seen clearly at smaller map scales are removed or merged with neighboring polygons. In this process, the functional differences between the polygons are considered; polygons that have the same function are more likely to be merged to illustrate the functional division of the indoor space. Spatial clustering can be used for this purpose [34,35,36]. Line simplification can also be applied to the polygon boundaries to obtain different representations [37,38]. Small intrusions and extrusions in the polygon shapes are simplified. Compared with natural outdoor features, artificial indoor features have more regular geometries, and traditional simplification methods that are successfully used in outdoor environments can still be applied. For facilities represented by POI symbols, the corresponding generalization process is described in Section 2.3.2.
2.2.3. 3D Visualization
We use non-photorealistic 3D visualization to obtain an abstract representation of the indoor environment. This is because the meanings and functions of the indoor features are more important than their realistic appearance. The original 2D features are extruded to 3D bounding boxes. These features include the building outline, the floor outlines, and the different types of functional areas on each floor, and their extrusion heights and colors are set differently, as shown in Figure 4. More specifically, we extrude the building outline based on the height of the building and use a light, transparent color to represent the boundary of the building to ensure that the interior of the building can still be seen clearly. Inside the building, the outlines of all floors are also extruded using a smaller height, and they are stacked vertically to allow multiple floors to be displayed on one map. To highlight a certain floor, its horizontal position can be modified in a manner akin to opening a drawer, as shown in Figure 5a. Similarly, the vertical positions of several floors can be modified to create space for a specific floor to be seen more clearly, as shown in Figure 5b. It is also possible to display only one floor, as in most indoor map applications, as shown in Figure 5c. On each floor, the functional areas generalized in the previous step are extruded in accordance with their corresponding levels of detail. For example, at a smaller scale, the map shows only general functional areas with relatively low heights, as shown in Figure 4b, which makes the map more abstract and two dimensional. At a larger scale, the rooms are represented by walls to obtain a more detailed representation than the 3D bounding boxes, as shown in Figure 4d. Each type of functional area has a unique color, which provides clear contrast and makes it easier to see hallways. The indoor maps are integrated into an outdoor 3D basemap; when the map is sufficiently zoomed in, some 3D buildings can be replaced by their indoor 3D maps.
2.3. Indoor POI Visualization
In the previous section, a 3D indoor map visualization that mainly depicts the structural features of a building was discussed. Based on such a map, POIs also need to be visualized to reflect the functions of the facilities and add more semantic information. The POIs on indoor maps are different from those on outdoor maps. First, unlike most outdoor POIs, an indoor POI is located on a particular floor of a building and tends to be more difficult to reach than a POI in an open outdoor space. Second, different types of indoor spaces have specific purposes that POI symbols on large-scale indoor maps should express. Compared with the large amount of POI data of various types that can be found outdoors, the indoor map of a particular building usually represents more focused functionalities and contains fewer POI categories than an outdoor map. The POIs on an indoor map are often associated with common detailed service information that users are interested in and that POI symbols can visualize, such as user ratings of stores in a shopping mall or the popularity of each exhibition hall in a museum. Third, the spatial extent of the indoor space is very small, but there tend to be many POIs in a single building; therefore, the density of indoor POIs is much higher than that of the POIs in a vast outdoor space. Due to the above differences, the visualization of indoor POIs should be different from that of outdoor POIs. A city map usually visualizes the location and basic attribute information of each POI, for instance, by using bubble icons to describe category information. On larger-scale indoor maps, however, for each POI, it is necessary to represent the 3D location (level, longitude, and latitude), the access path, and some detailed service information.
2.3.1. Hierarchical POI Classification
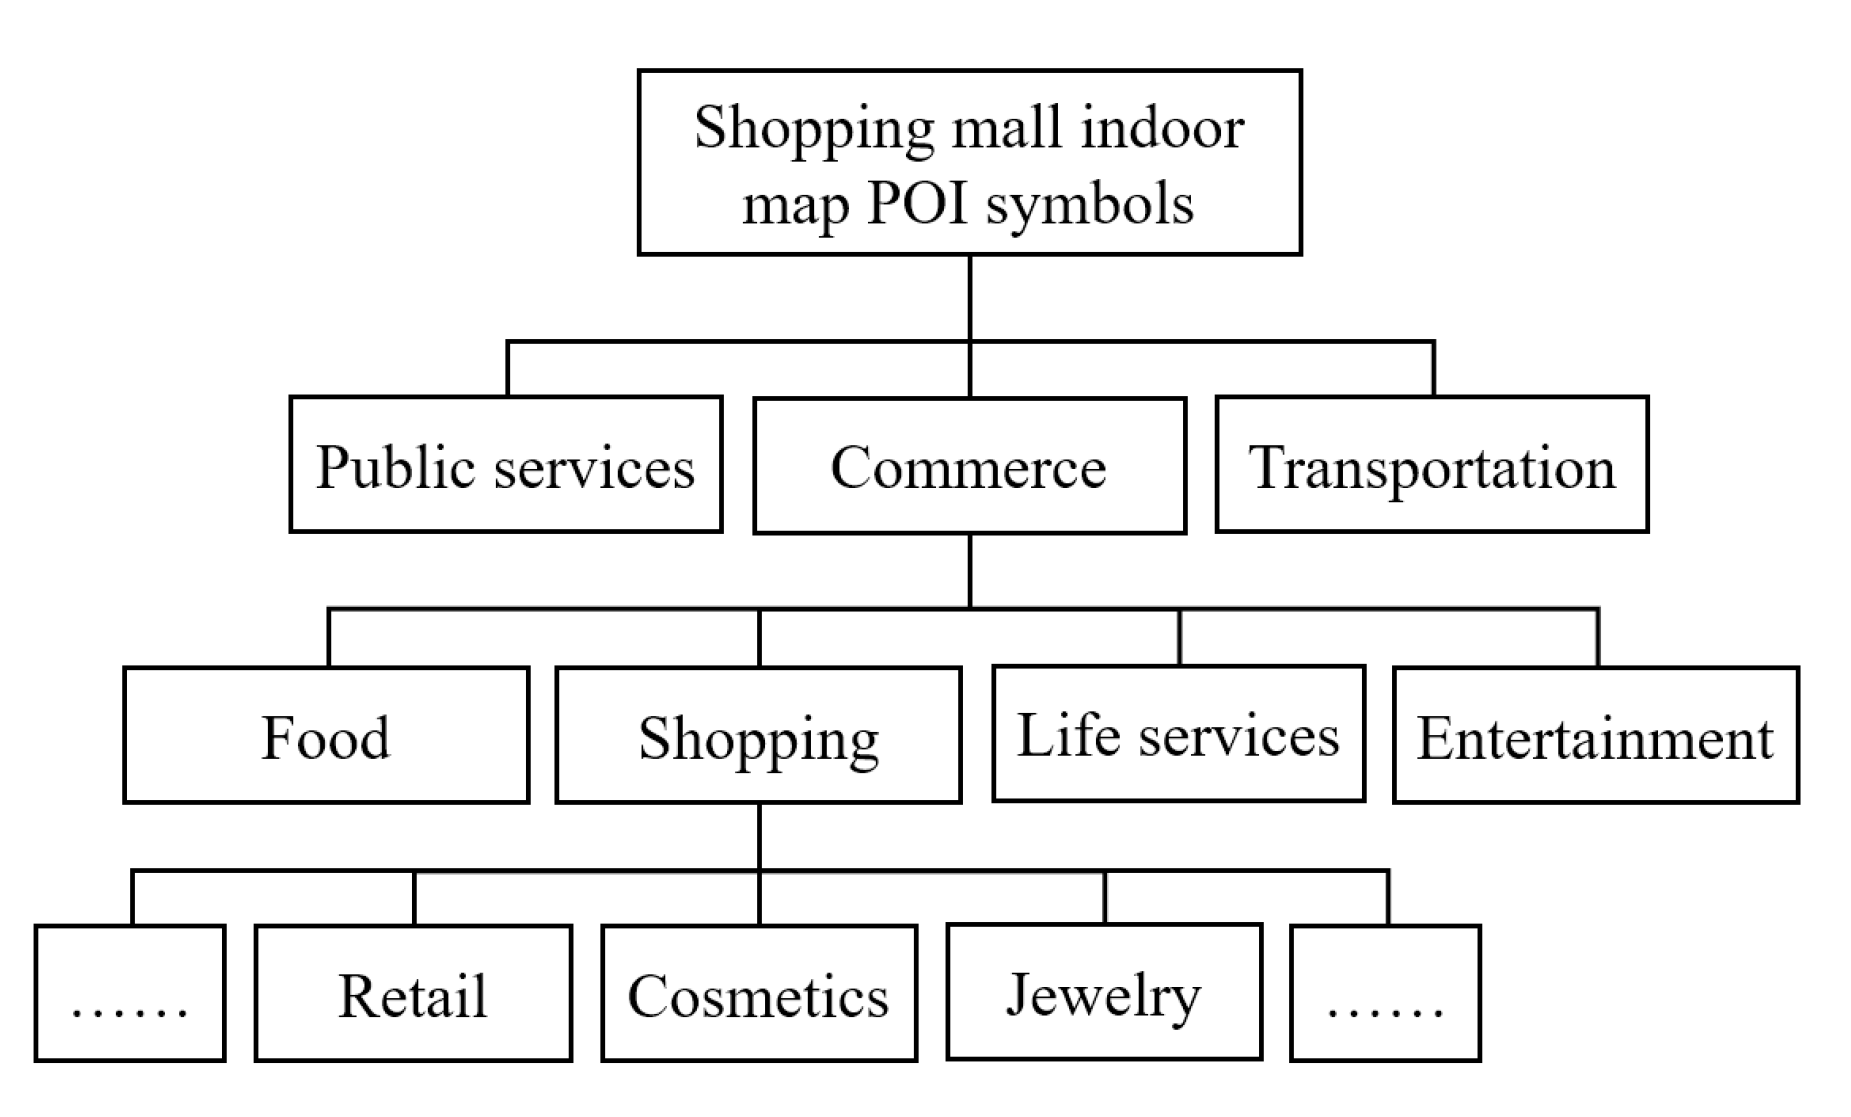
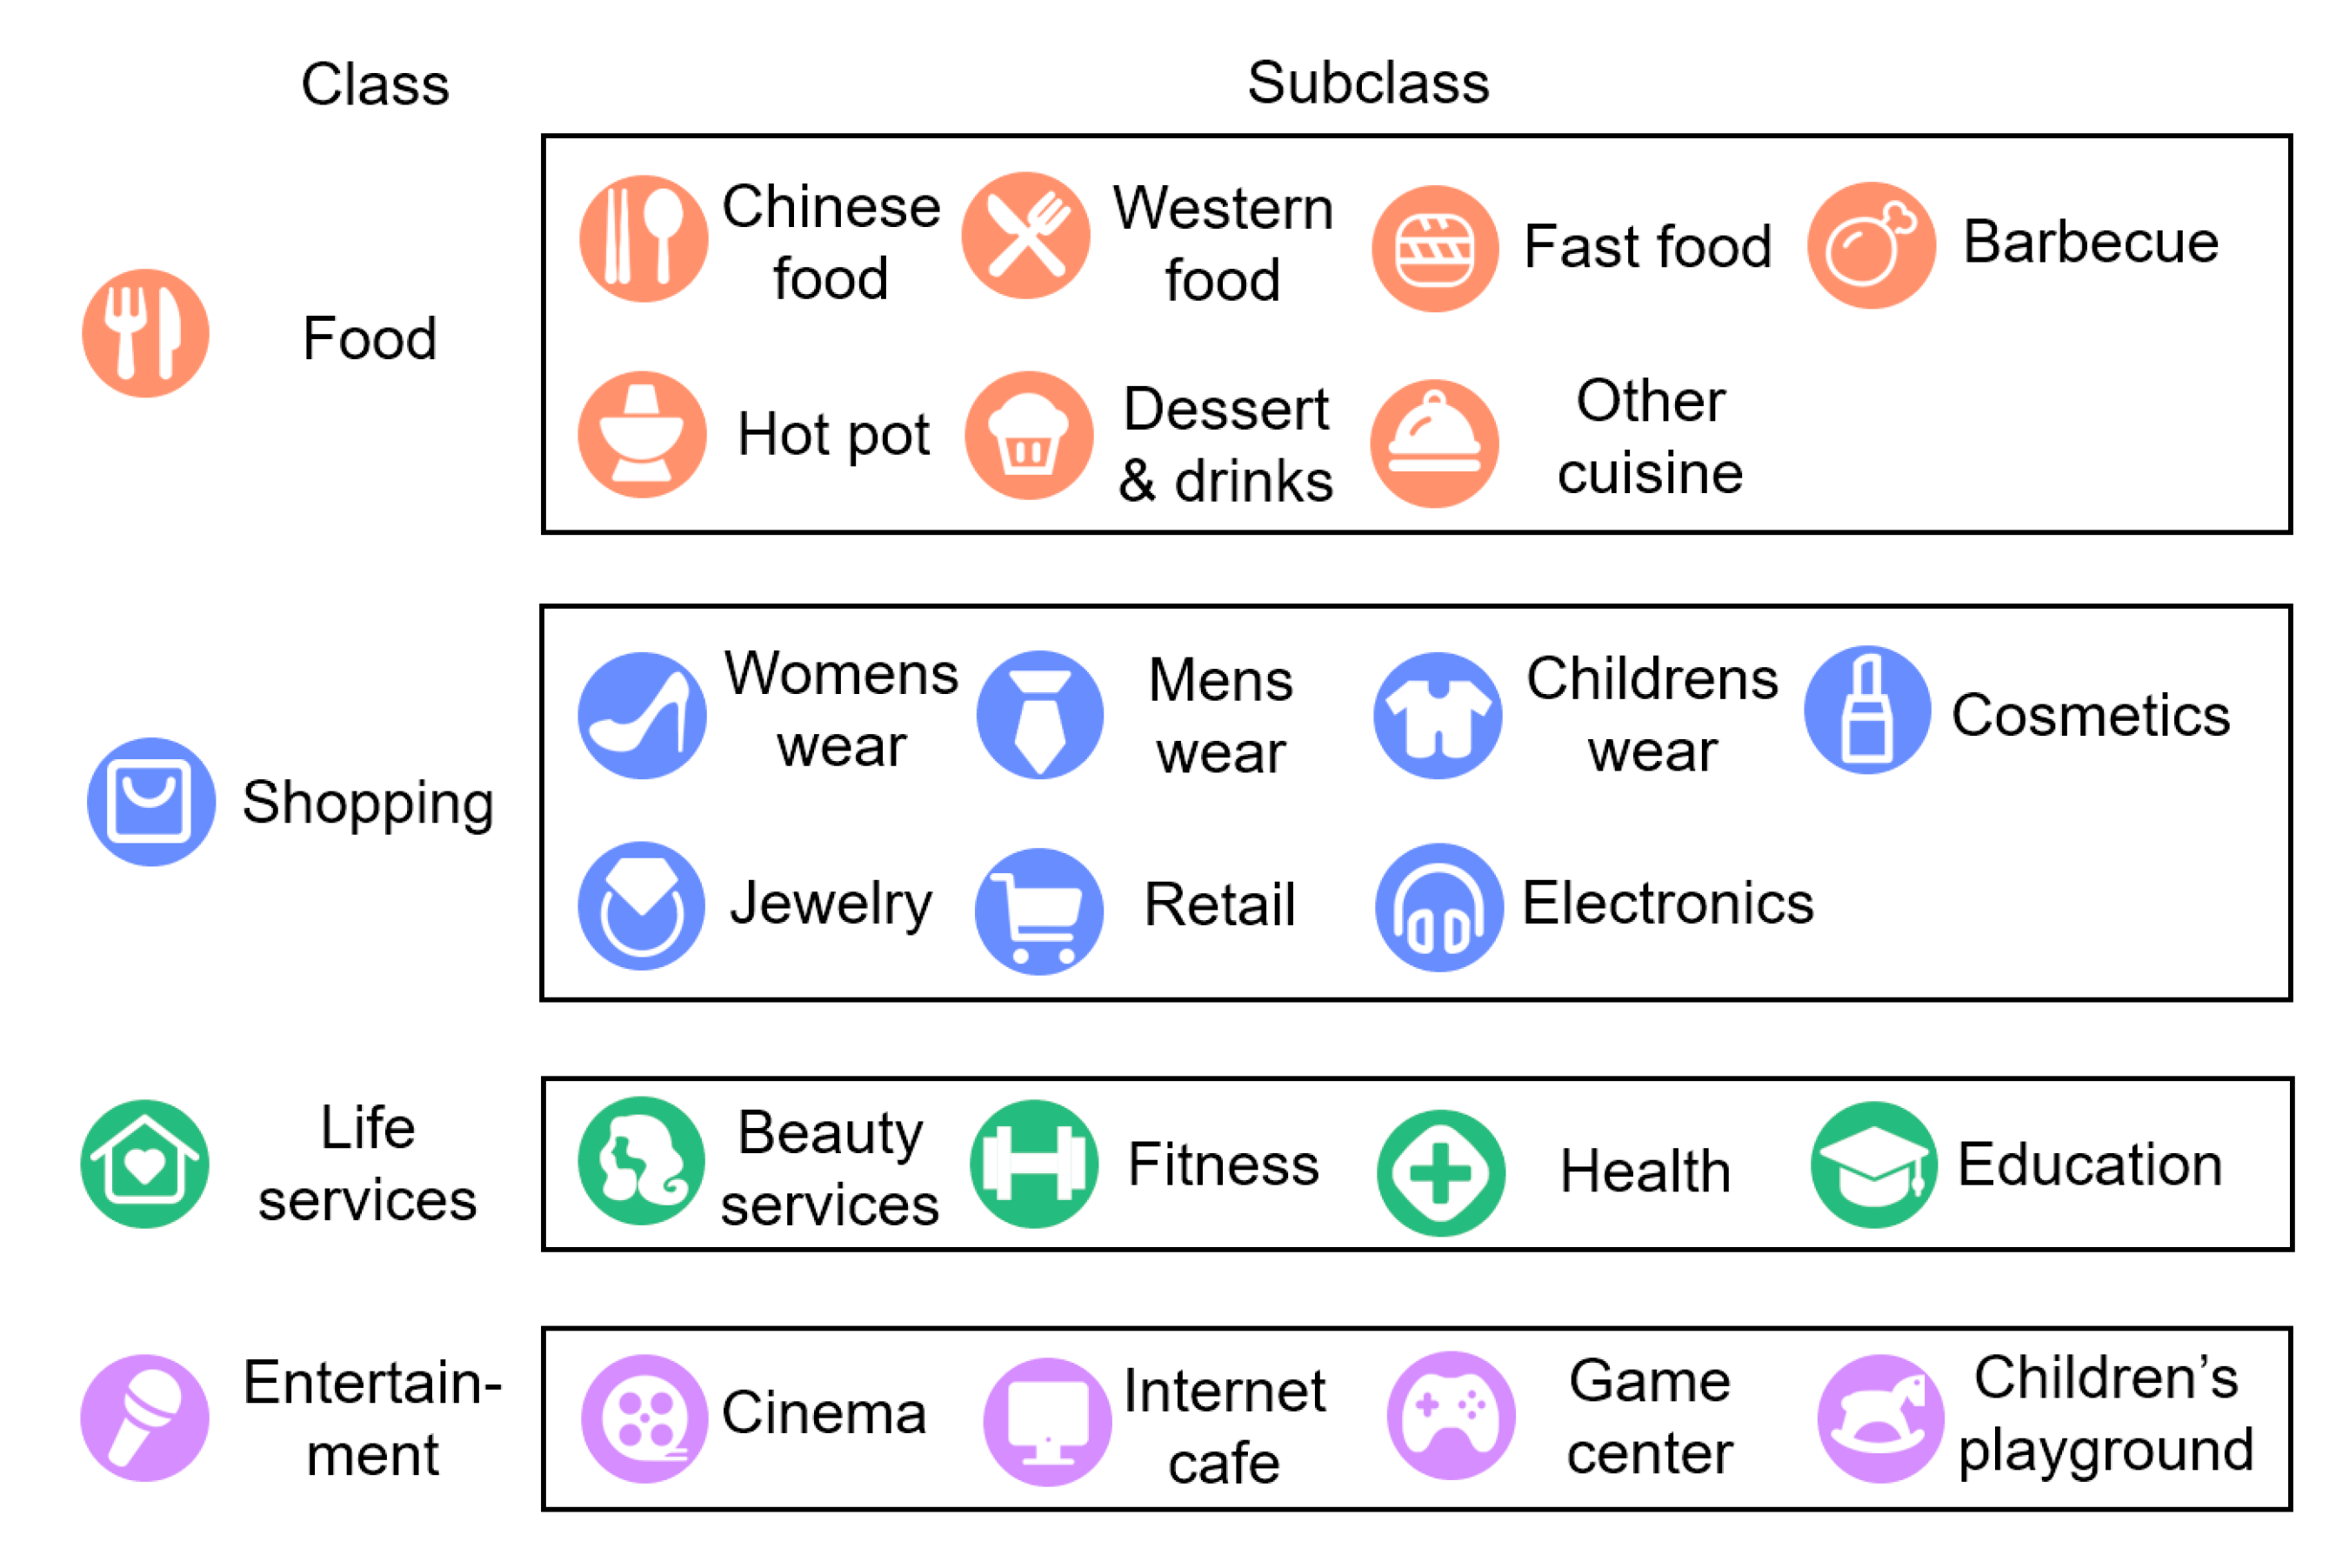
The first step of POI visualization is hierarchical classification, which lays the foundation for the multi-scale representation of POIs. Some classification systems have already been developed for outdoor POIs [39], but they cannot be directly applied for the classification of indoor POIs. POIs on an indoor map usually have distinct themes and belong to fewer categories. Different indoor maps express different themes, so a single classification system is difficult to apply to all of them. Table 3 shows the classification used in this paper for the considered example of Han Street Wanda Plaza. We first classified all the POIs into four main classes, and each class was then further classified into several subclasses.
2.3.2. Adaptive POI Selection
POIs are distributed densely within a building, but typical display devices have a limited screen size. To avoid POI symbols overlapping with each other, appropriate symbols should be selected to appear adaptively at different zoom scales. Many methods have been proposed for reducing the clutter of a large number of points while preserving their distribution patterns [31], but since POI distributions are usually more even in indoor spaces than in outdoor spaces, a simpler method can be used. Similar to a previous study [40], in our method, lightweight symbol selection is performed on the client side to achieve adaptive POI visualization on indoor maps for different users. The first step is to set the priority of each POI; symbols with higher priority are more likely to be kept when the map is zoomed out. The priority of a POI depends on two factors: the size of the corresponding room or functional area and the user’s interest in that POI. The priority is defined as follows:
where , , and are the priority, size, and interest level, respectively, of the th POI; and are the maximum size and interest level, respectively; and and are the weights used to balance these two factors. The first term in this equation indicates that POIs corresponding to larger areas are more likely to be kept when zooming out. The second term gives the method flexibility because it can be different for different users. For example, if a user’s main purpose is shopping, a higher interest level can be set for POIs that belong to the shopping category in the POI classification system mentioned above. The second step is the detection of conflicts between POI symbols; when one symbol is very close to or overlaps with another, the symbol with lower priority will be dropped.
2.3.3. POI Symbol Design
As the scale of the map changes, not only can the number of POI symbols change, but the LODs of the attribute information represented by the symbols themselves can also change. Based on the hierarchical POI classification, a distinct symbol is designed for each main class and subclass, as represented by the tree structure shown in Figure 6. From the parent nodes to the child nodes, the semantic level becomes more detailed. Symbols at a specific level in the tree structure are used in accordance with the map scale. At a smaller scale, the symbols for the main classes show the general distribution of POIs in each main class. At a medium scale, the symbols for the subclasses are used to show more detailed category information. In addition to the category information, the POIs contain rich semantic information that users might be interested in. For example, for food POIs, in addition to the types of food available in the mall, users may also be concerned with the price range, operating hours, number of seats remaining, user ratings, and other information. At a larger scale, this more detailed semantic information can be expressed, thus forming a semantic LOD model, as exemplified in Table 4.
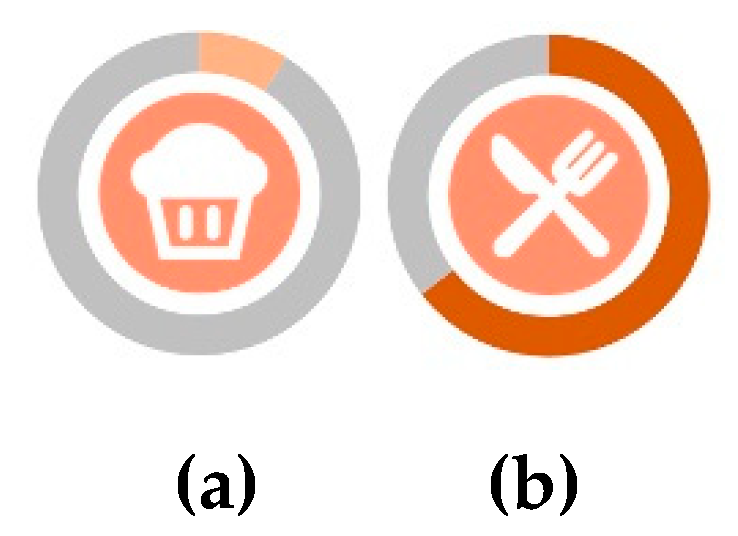
The design of the POI symbols should conform to the following principles. First, they should be able to intuitively express the functions of the POIs so that users can associate these symbols with the corresponding geographical features. Second, the design should be as simple as possible; excessive detail or complicated shapes will make the symbols difficult to recognize. Third, their colors should be brighter than the background to ensure that they are relatively prominent on the map. These principles of cartographic design are important for the presentation of indoor maps. When such a map is displayed on a mobile device, a legend cannot be provided due to the limited size of the display area. Consequently, the ability to convey semantic information by means of intuitive pictographic symbols becomes very important. Keeping the symbols simple can help readers interpret them without significant effort, especially while moving. For the foreground of the map and features that users are interested in, using a color that is distinct from the background can help establish a good visual hierarchy and attract the map user’s attention to the symbols. Guided by the above principles and referring to the symbols commonly used on internet maps, the POI symbols for the main classes and subclasses in the example considered here were designed as shown in Figure 7. On this basis, more detailed service information for a POI can be expressed by combining these basic symbols with other visual variables. For example, a bright color can be used to indicate that a POI is open, whereas a dark color can be used to indicate that the POI is closed. A circular progress bar can be added around a symbol to express the average price of a restaurant, as shown in Figure 8.
The representation of the POI symbols should be adaptive not only to the map scale but also to specific users. Symbols of different styles, sizes, and color schemes should be shown for users of different age groups or genders or with different purposes for using the map. To enable adaptive map symbol design, the symbol parameters should not be unique, but rather should vary within a certain range of values to allow them to adapt to different situations under the guidance of certain rules, as summarized in Table 5.
3. Results
3.1. System Design and Performance
In this study, an indoor map prototype system was developed following the ideas presented above. It is a web-based system that works on modern browsers on either desktop computers or mobile devices. The system takes advantage of the WebGL technique to render indoor 3D scenes, enabling a considerable performance increase compared with other web-based 3D graphics techniques without the use of plugins. The modeled indoor scenes were superimposed on a 3D city map based on Mapbox GL JS, which is a JavaScript library that also uses WebGL to render interactive maps. To evaluate the generalization and visualization performance of this system, we ran a test in the Chrome browser on a personal computer with the following specifications: an Intel Core i5-6200U CPU @2.30 GHz, 8 GB of RAM, and an NVIDIA GeForce 930M GPU. Every time the scale of the map changes, the real-time generalization and representation of the foreground POI data take an average of 23.3 ms. The time consumption is low because our method is light in weight and the dataset is small; specifically, there are 392 POIs in the experimental building. For the background building structure, data at different LODs were generalized in advance to guarantee real-time performance. For rendering and visualization, the system can maintain a frame rate of approximately 40 frames per second (FPS) when moving or zooming in and out of the map. The size of the indoor map data of this experimental building is 1.03 MB, which is acceptable for data transfer in web applications. These results show that the multi-scale representation method for indoor maps presented in this study can satisfy the requirements for online real-time operation.
3.2. Experimental Results and Analysis
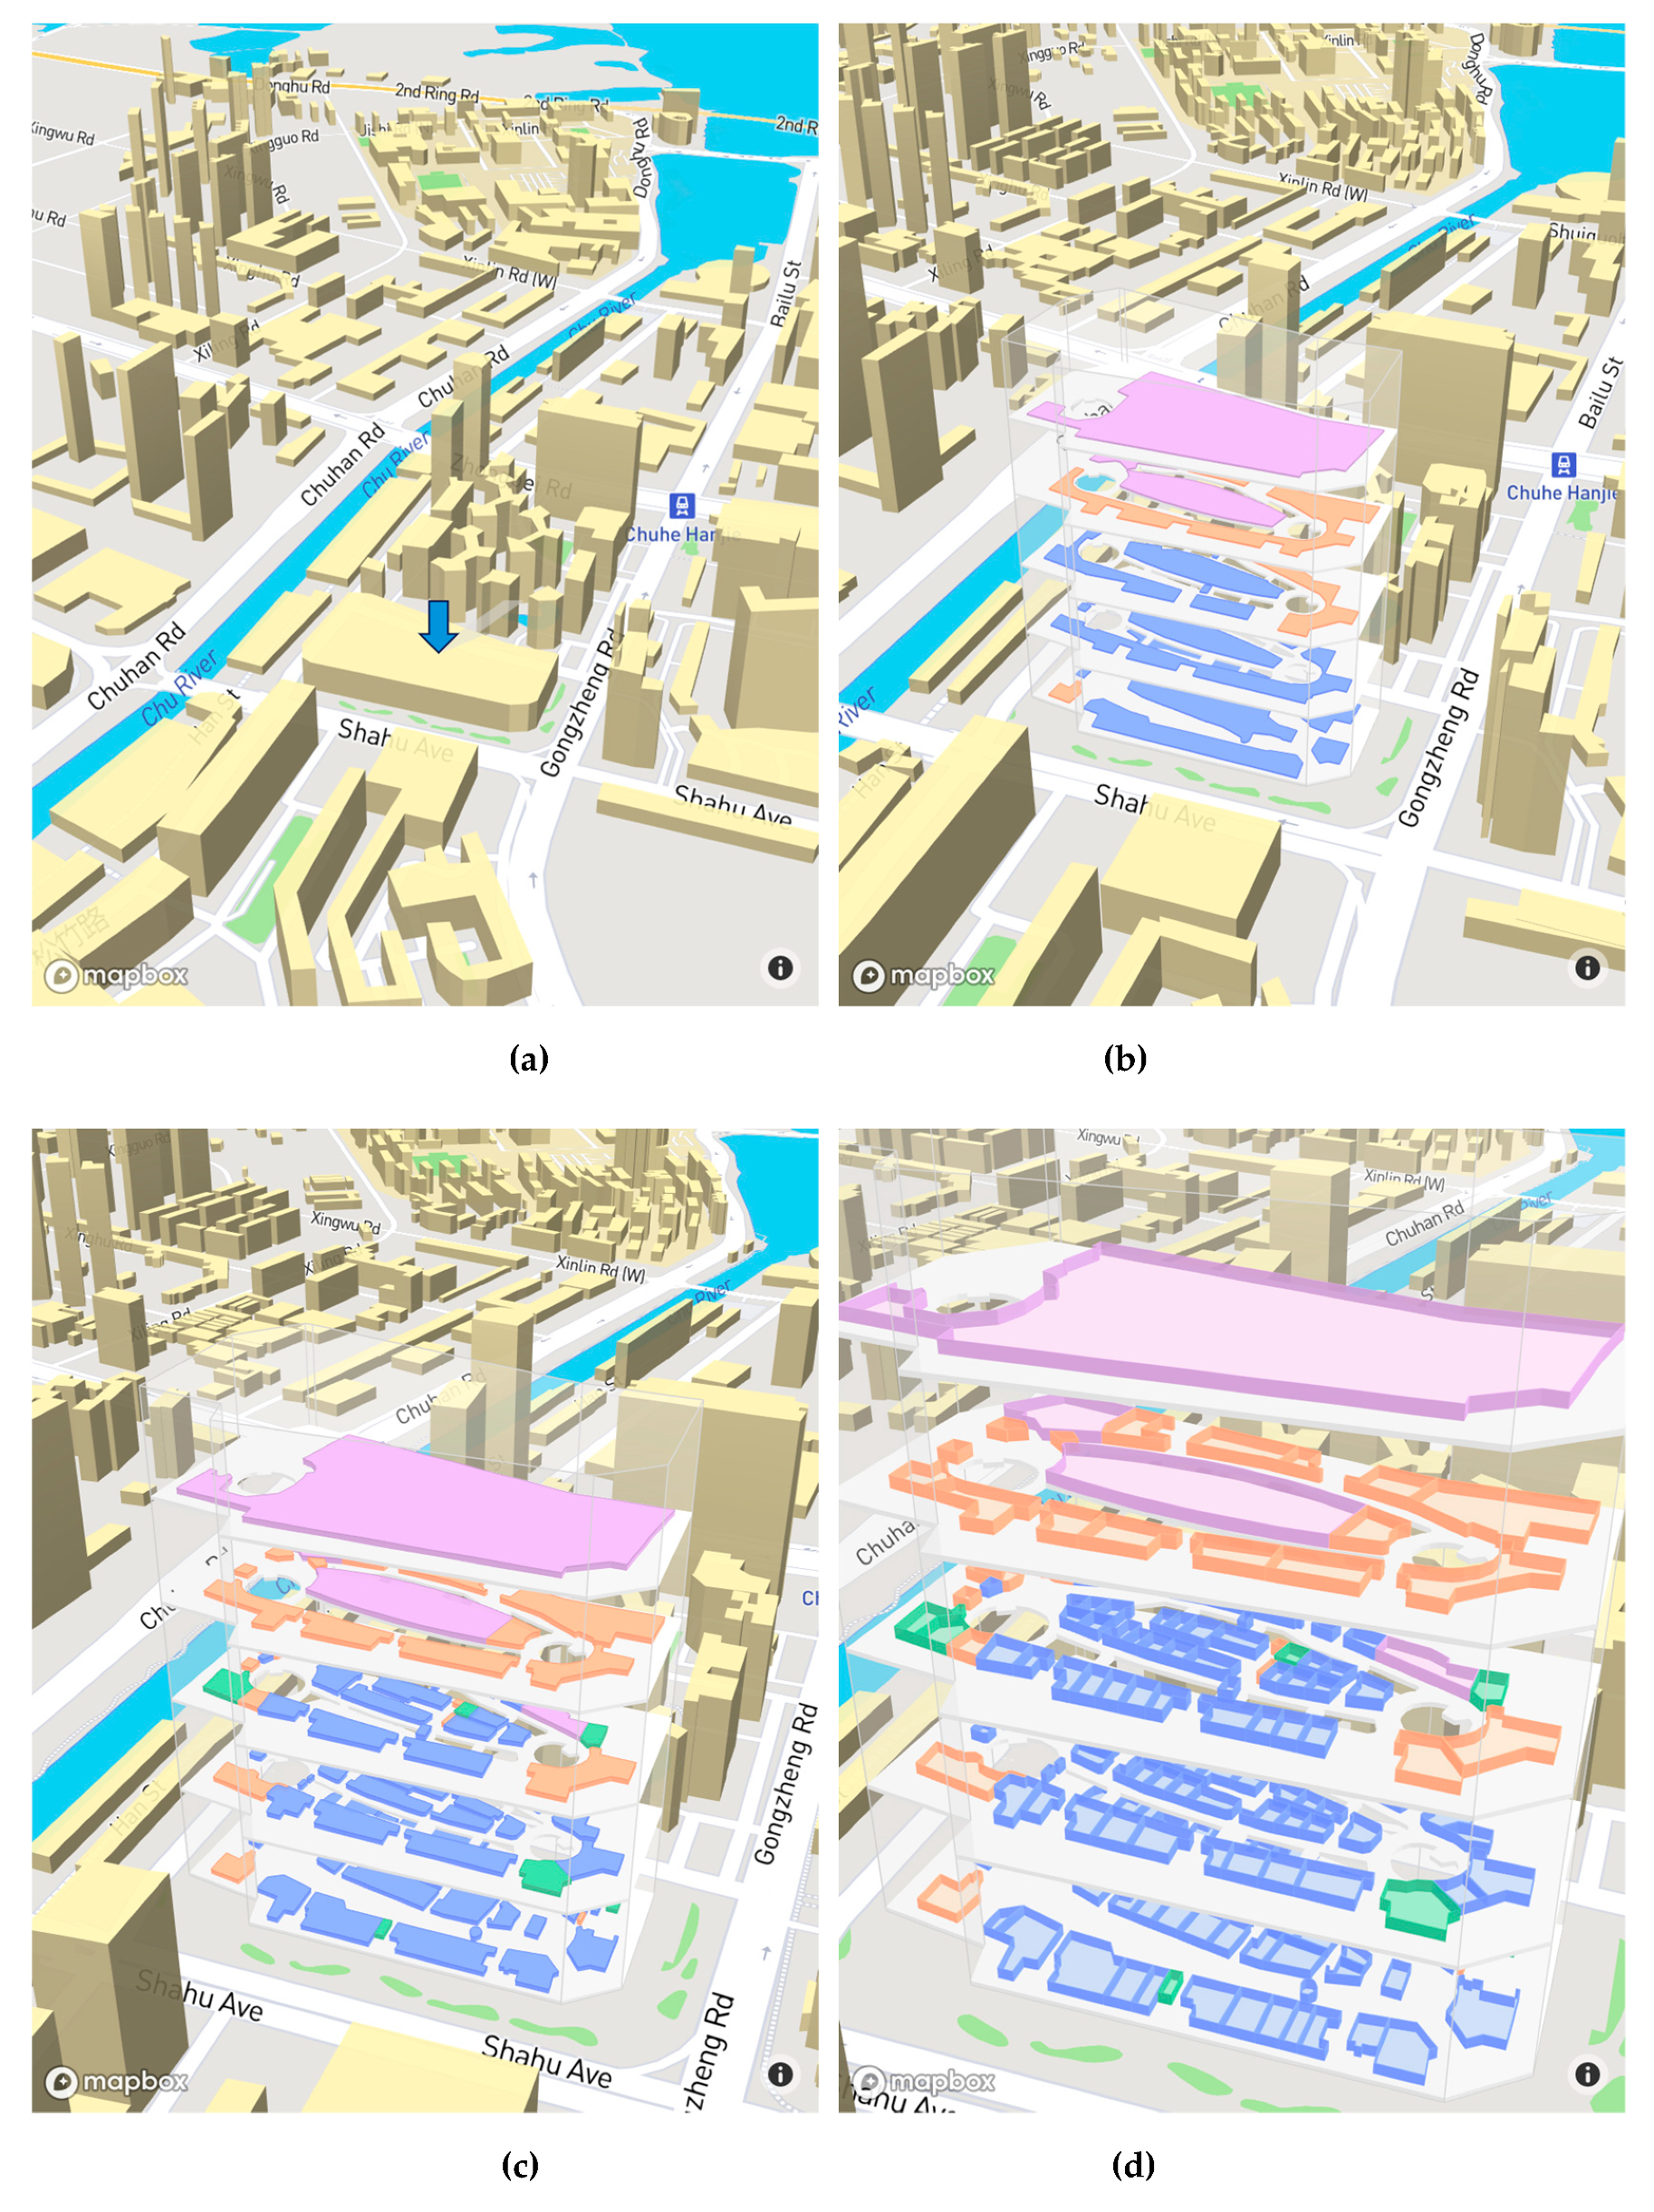
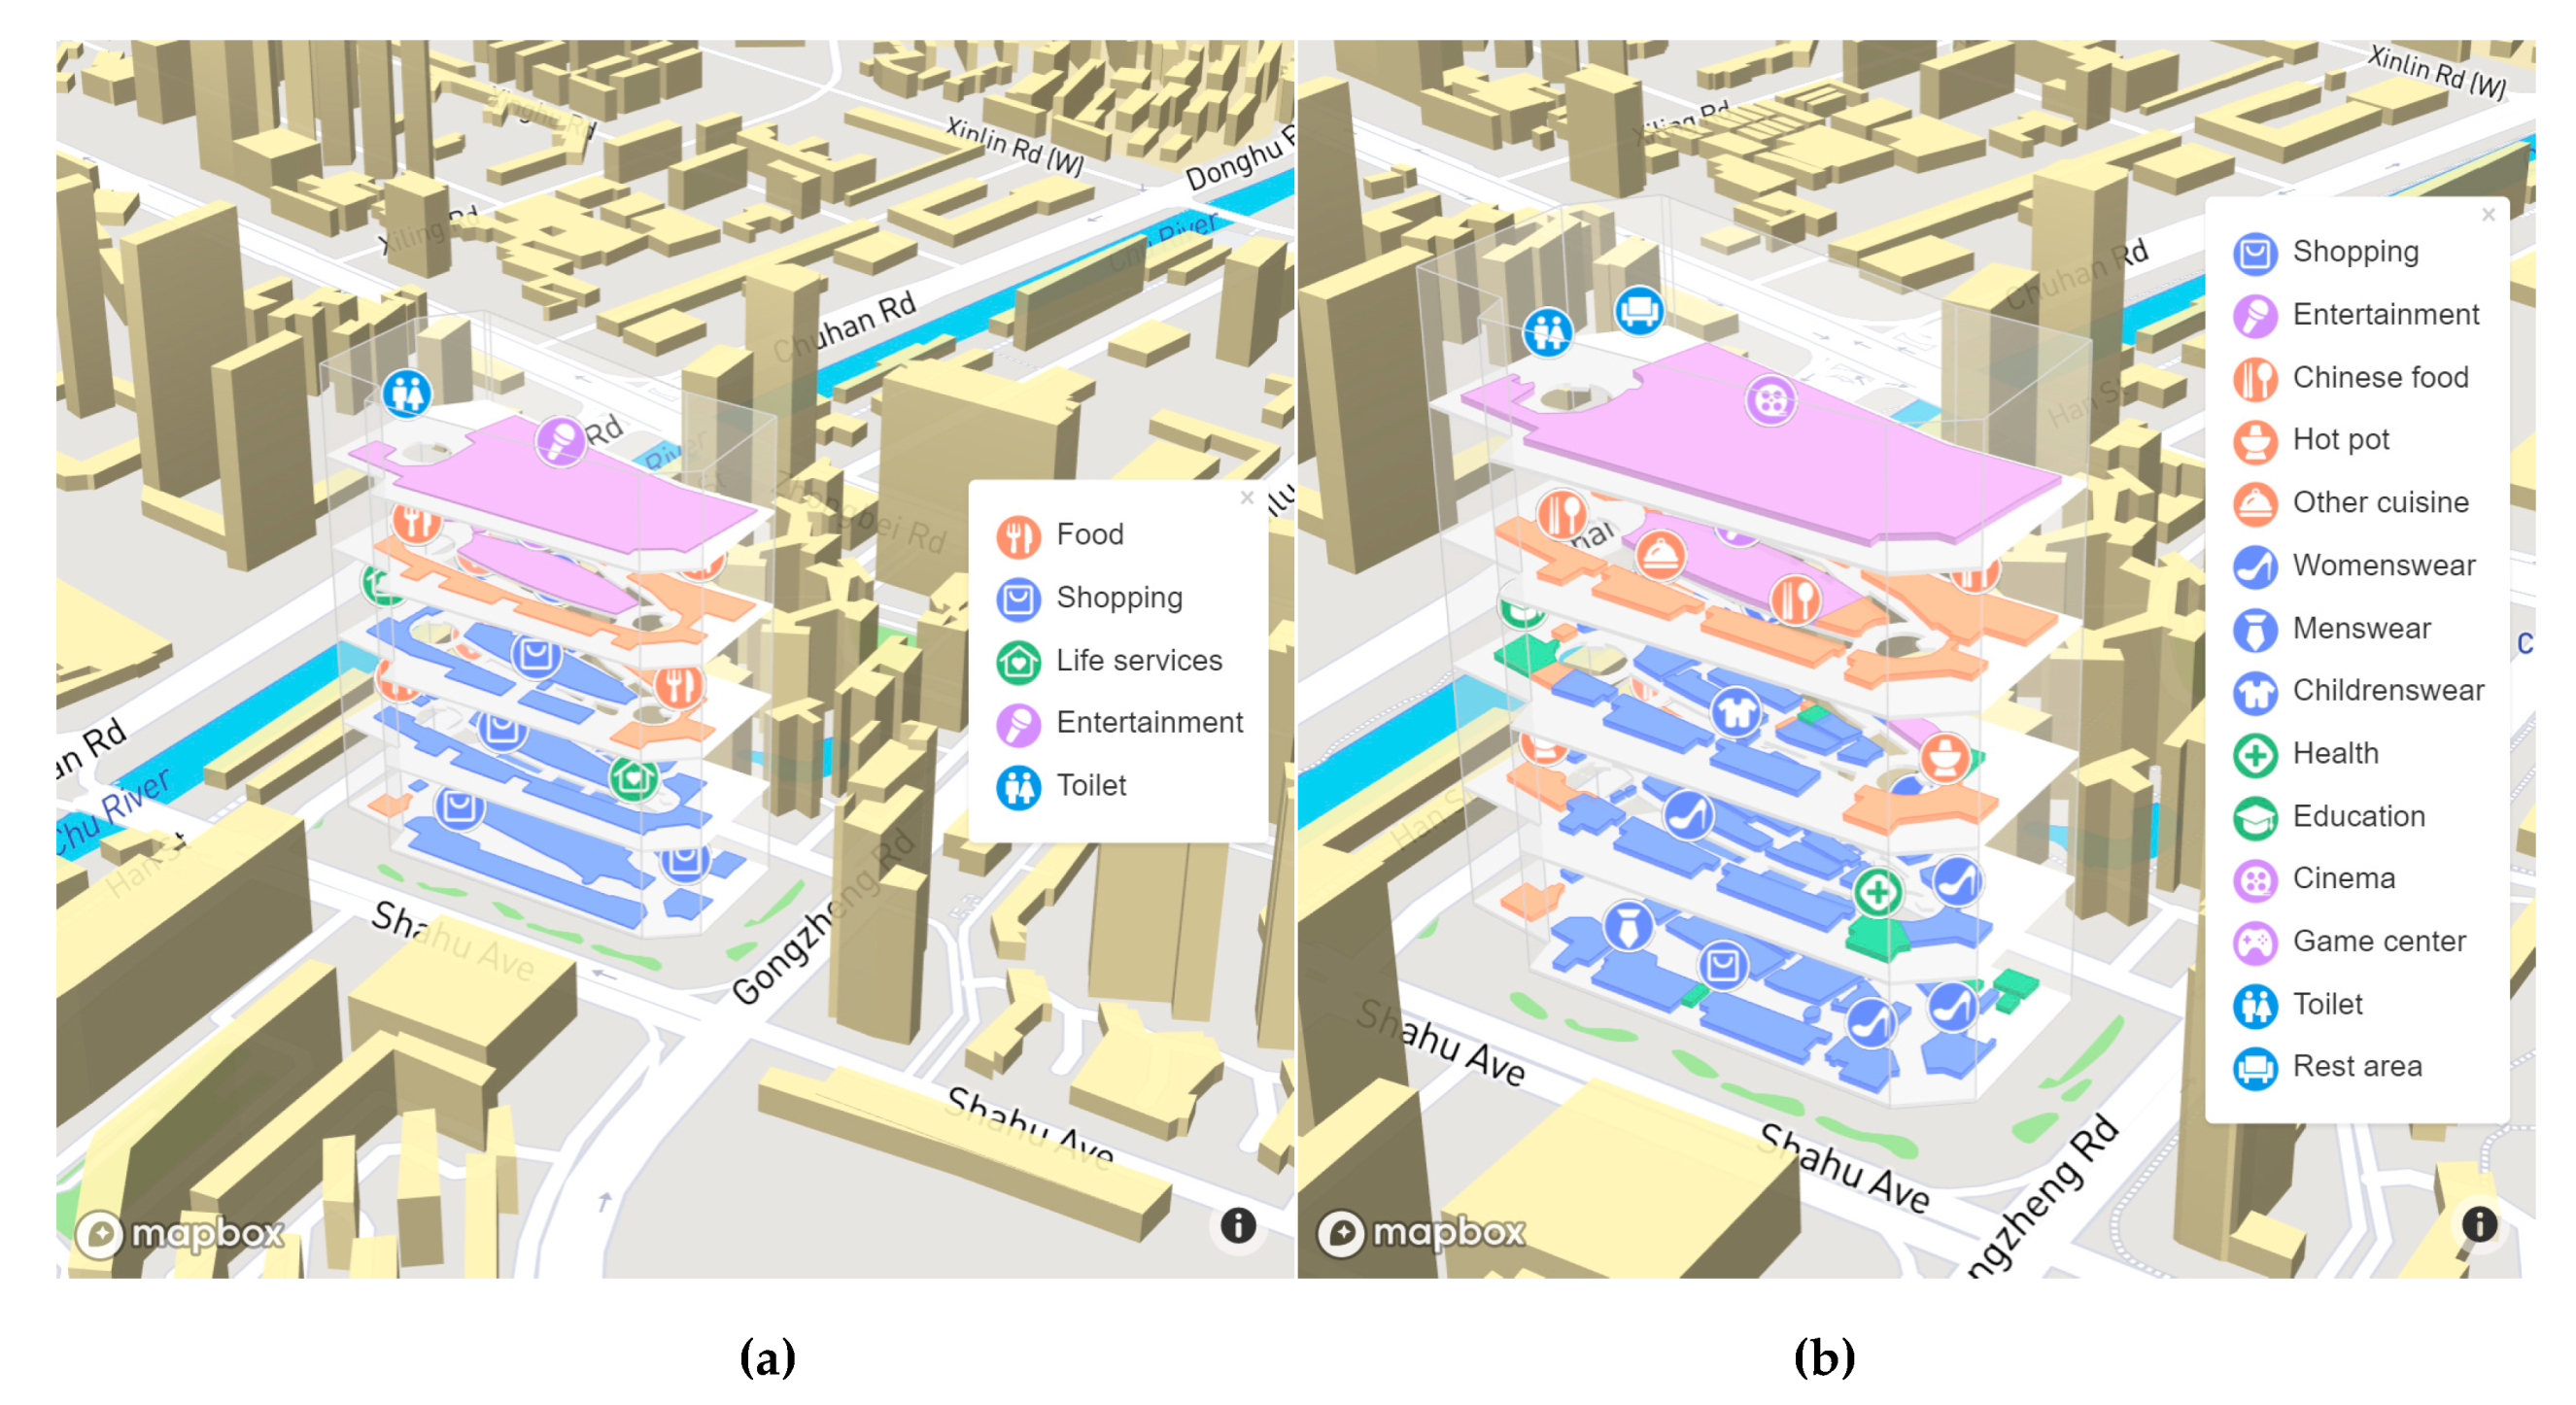
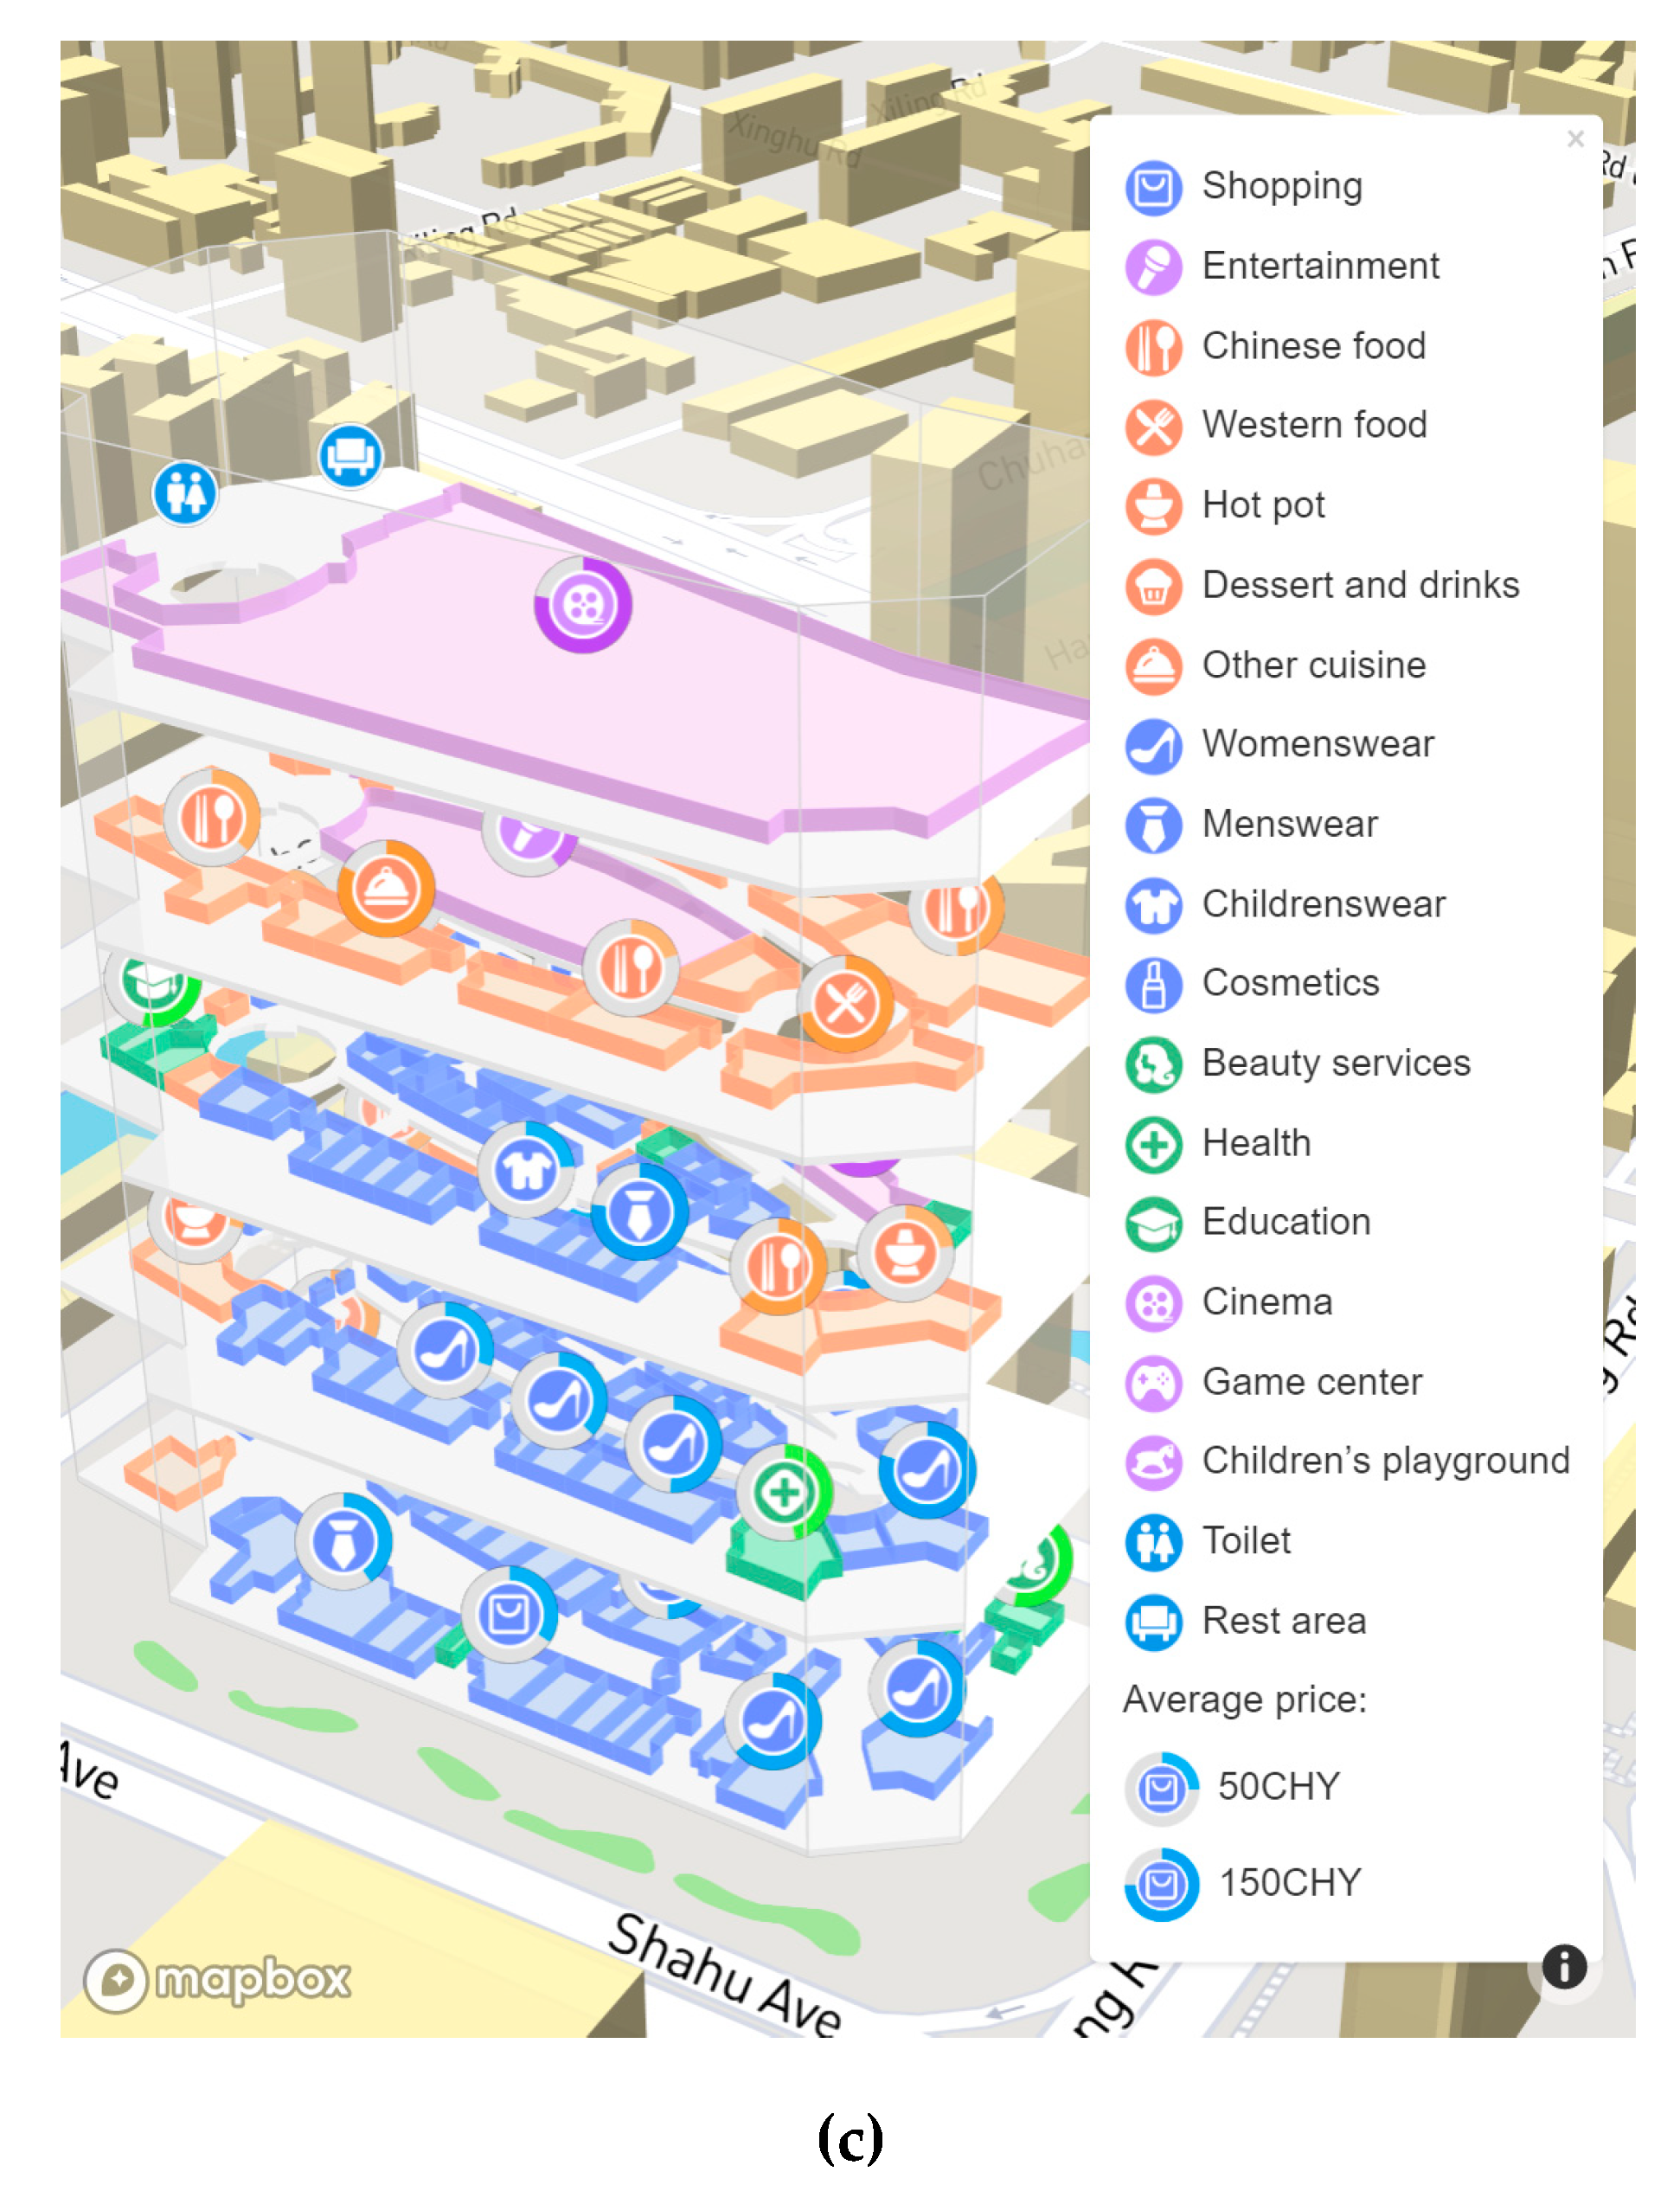
In the following, we will present the main visualization features of our indoor map application from two perspectives: scale adaptation and user adaptation. Figure 9 shows how the presented indoor map adapts to the map scale. Before zooming in on the building for which indoor map data are available, the exterior shapes and heights of the buildings on the background outdoor map are displayed in 3D. When the map is first zoomed in to the building of interest, an indoor map with few details appears. Figure 9a shows the general distribution of the floors and symbols with general category information. With the help of the POI symbols, we can see that the first to third floors of the mall are mainly devoted to shopping, whereas the fourth and fifth floors mainly consist of restaurants and entertainment facilities, respectively. As the user zooms in further, as shown in Figure 9b, the indoor map shows the functional spaces on each floor, such as clusters of restaurants or shops. It also shows POI symbols that describe detailed category information, such as fast food restaurants or clothing shops. As the user continues to zoom in, as shown in Figure 9c, the indoor map shows the detailed room distribution, and the POI symbols also provide more detailed service information, such as the average price of shops in this shopping mall. Through such multi-scale visualization of the building structure and POI data, the indoor map can provide users with multilevel information about the building interior. The level of information that the user needs is related to the current scale of the map. The overall distribution pattern of indoor service facilities inside the building, which is displayed at smaller map scales, can provide initial decision support for users at the macro level, while the detailed service information for the facilities that is visualized at larger scales can assist with detailed planning and final decisions at the micro level.
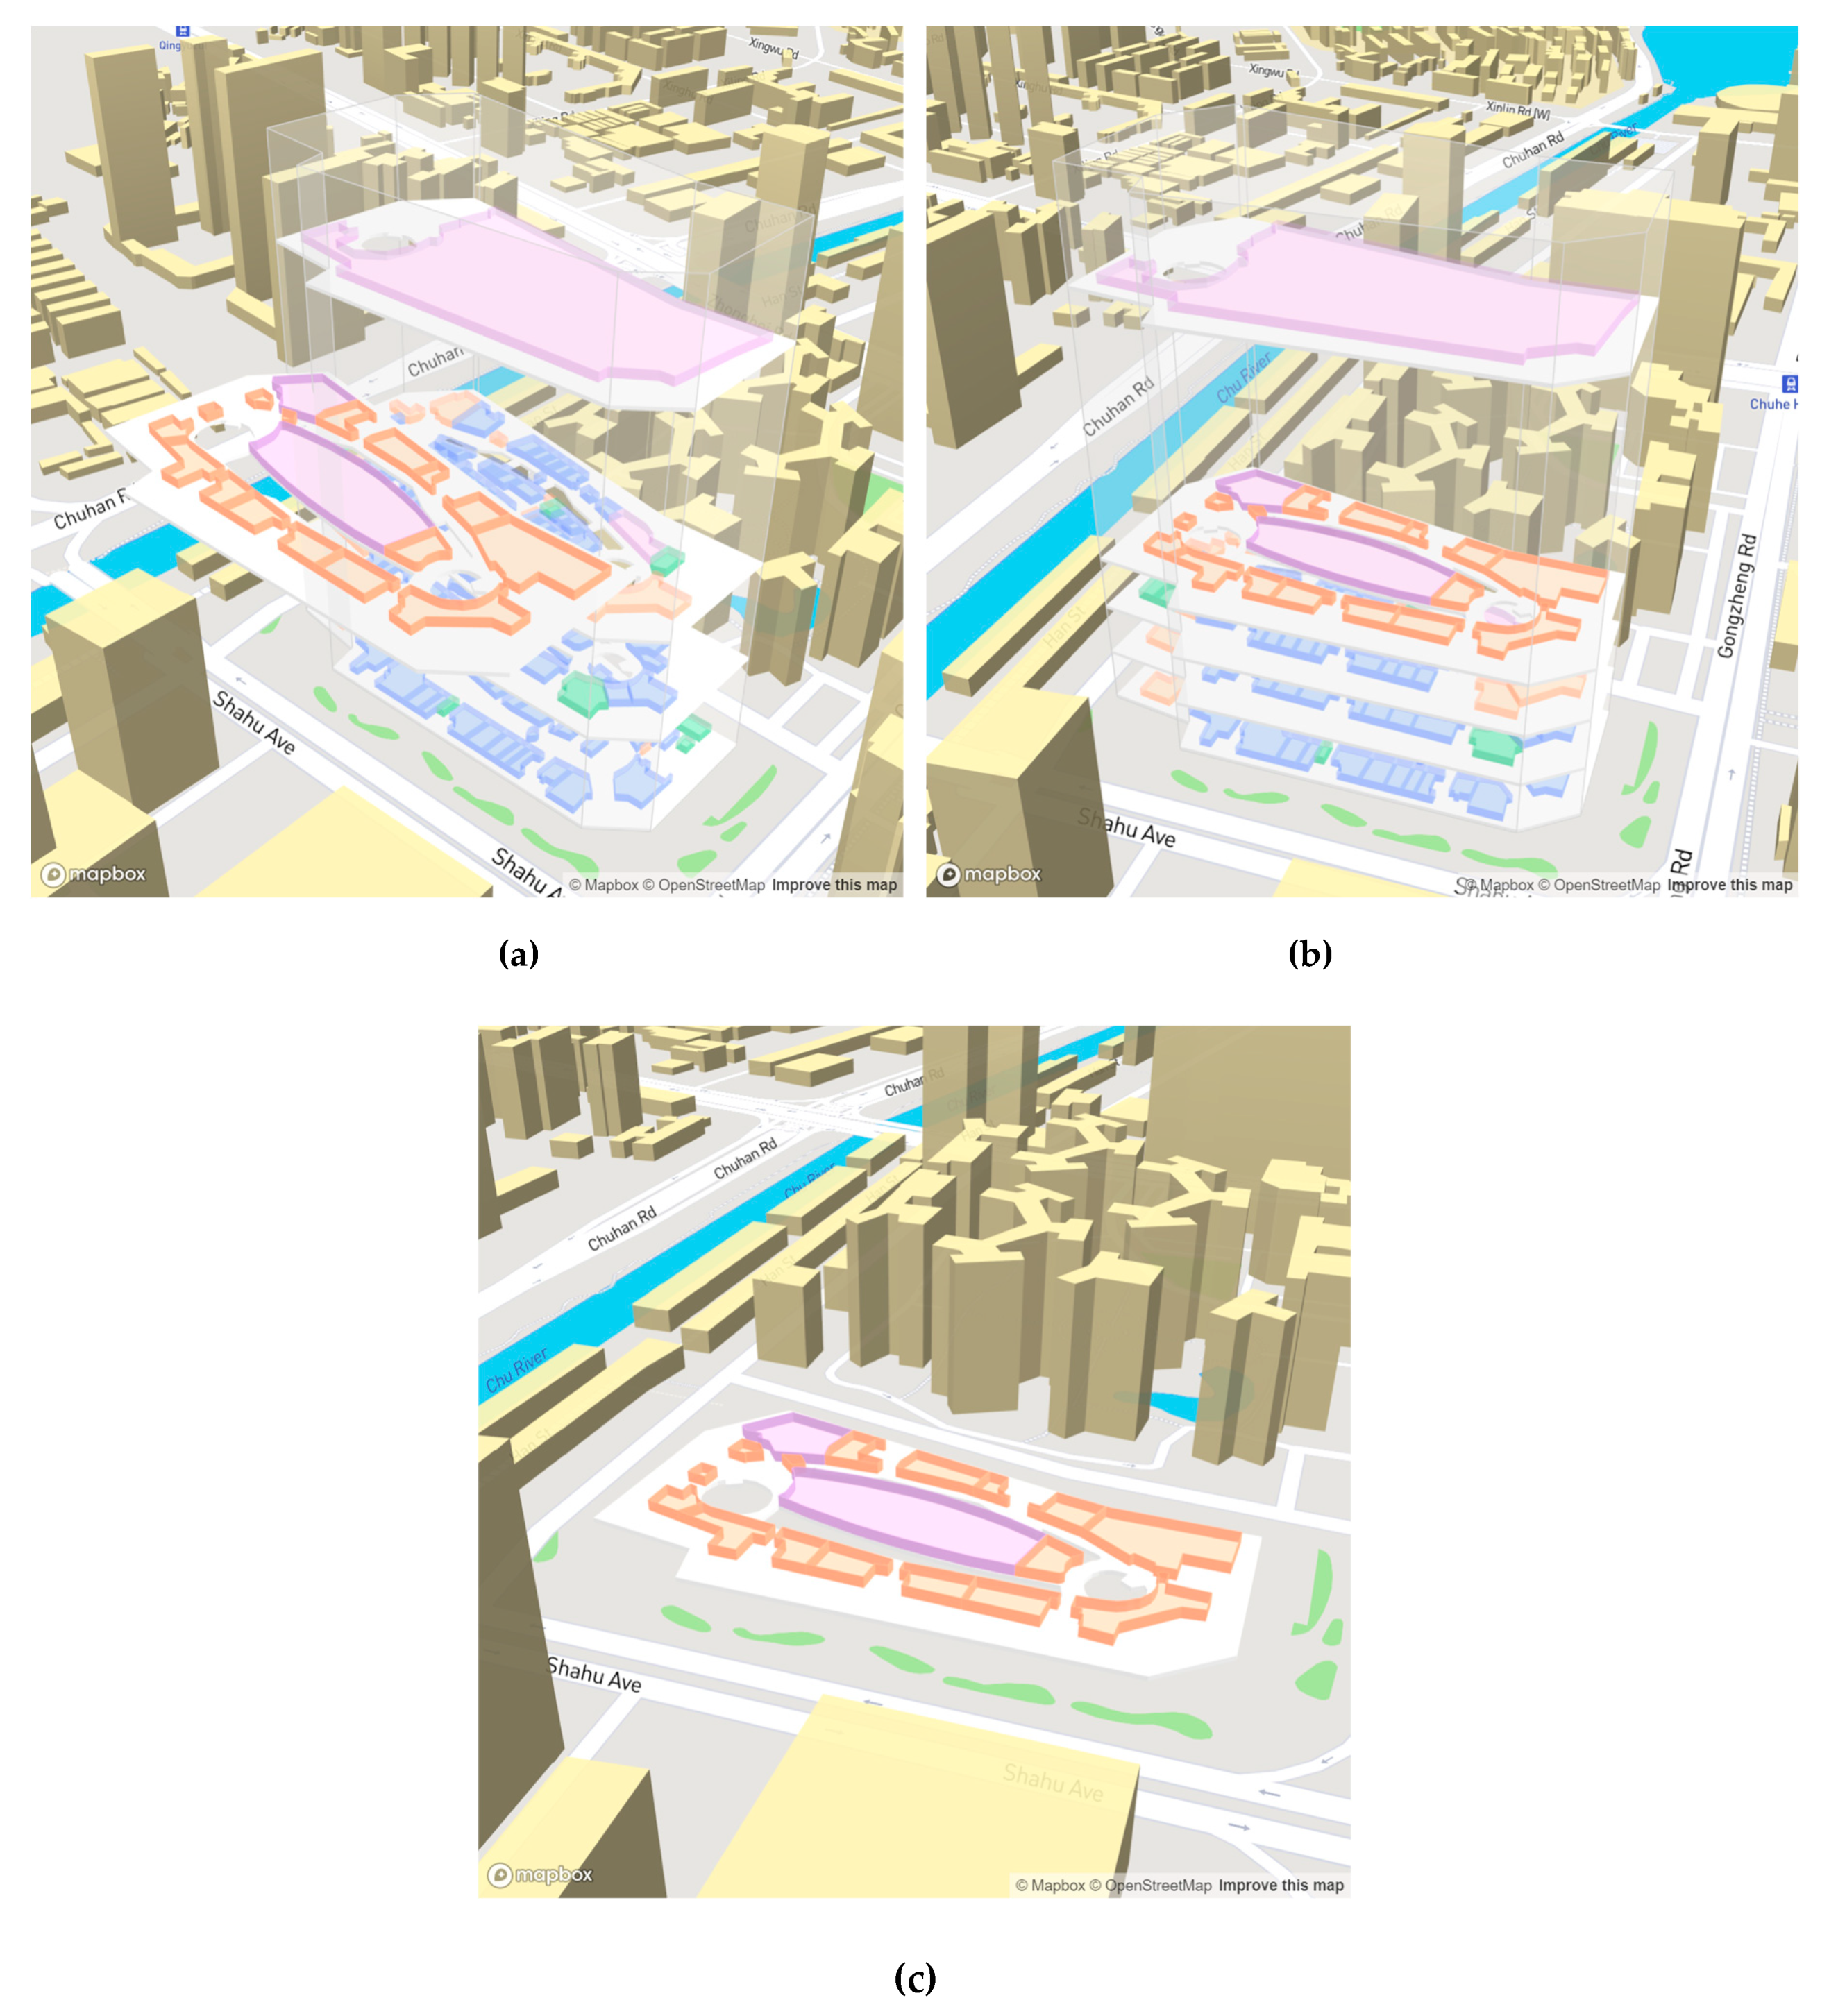
Figure 10 shows an example of how the indoor map can be adapted to different users. When a user registers and logs in to the indoor map system, he or she can input personal information, such as age and gender, and select what he or she is interested in. Based on this information, the LOD of the map content is adaptively changed for diverse users. For example, Figure 10a shows a version of the map that is presented to a young woman whose purpose is to shop for cosmetics and women’s clothes; POI symbols that are related to the specified interests are more likely to be displayed, and more detailed service information is provided in association with these symbols. Similarly, Figure 10b shows a version of the map that is presented to a young man who is interested in shopping for electronics and men’s clothes; accordingly, the POI symbols for electronics and menswear have higher display priorities, and their semantic LOD is higher. Other features that are not of great interest to these users are represented by simpler POI symbols. Age group is also a factor for adaptive POI visualization. If an older man rather than a young man is viewing the map, even if both men have the same interests, the displayed symbols may be slightly different. For example, as shown in Figure 10c, the rest area symbols have a higher display priority, and elevators are displayed with higher priority than escalators and stairs. In addition, considering that older people’s eyesight is often not very good, the size of the POI symbols is slightly enlarged by default. In this way, through adaptive visualization of the POI data, the presented indoor maps can provide users with personalized information about the building interior. A user’s interests and purpose in using the map determine the main features and levels of information that the indoor map represents. On an indoor map with a dense POI distribution, it is inevitable that some POIs will be omitted when the user zooms out. However, those POIs in which the user is most interested are retained and are represented at a higher LOD.
3.3. Comparative Analysis
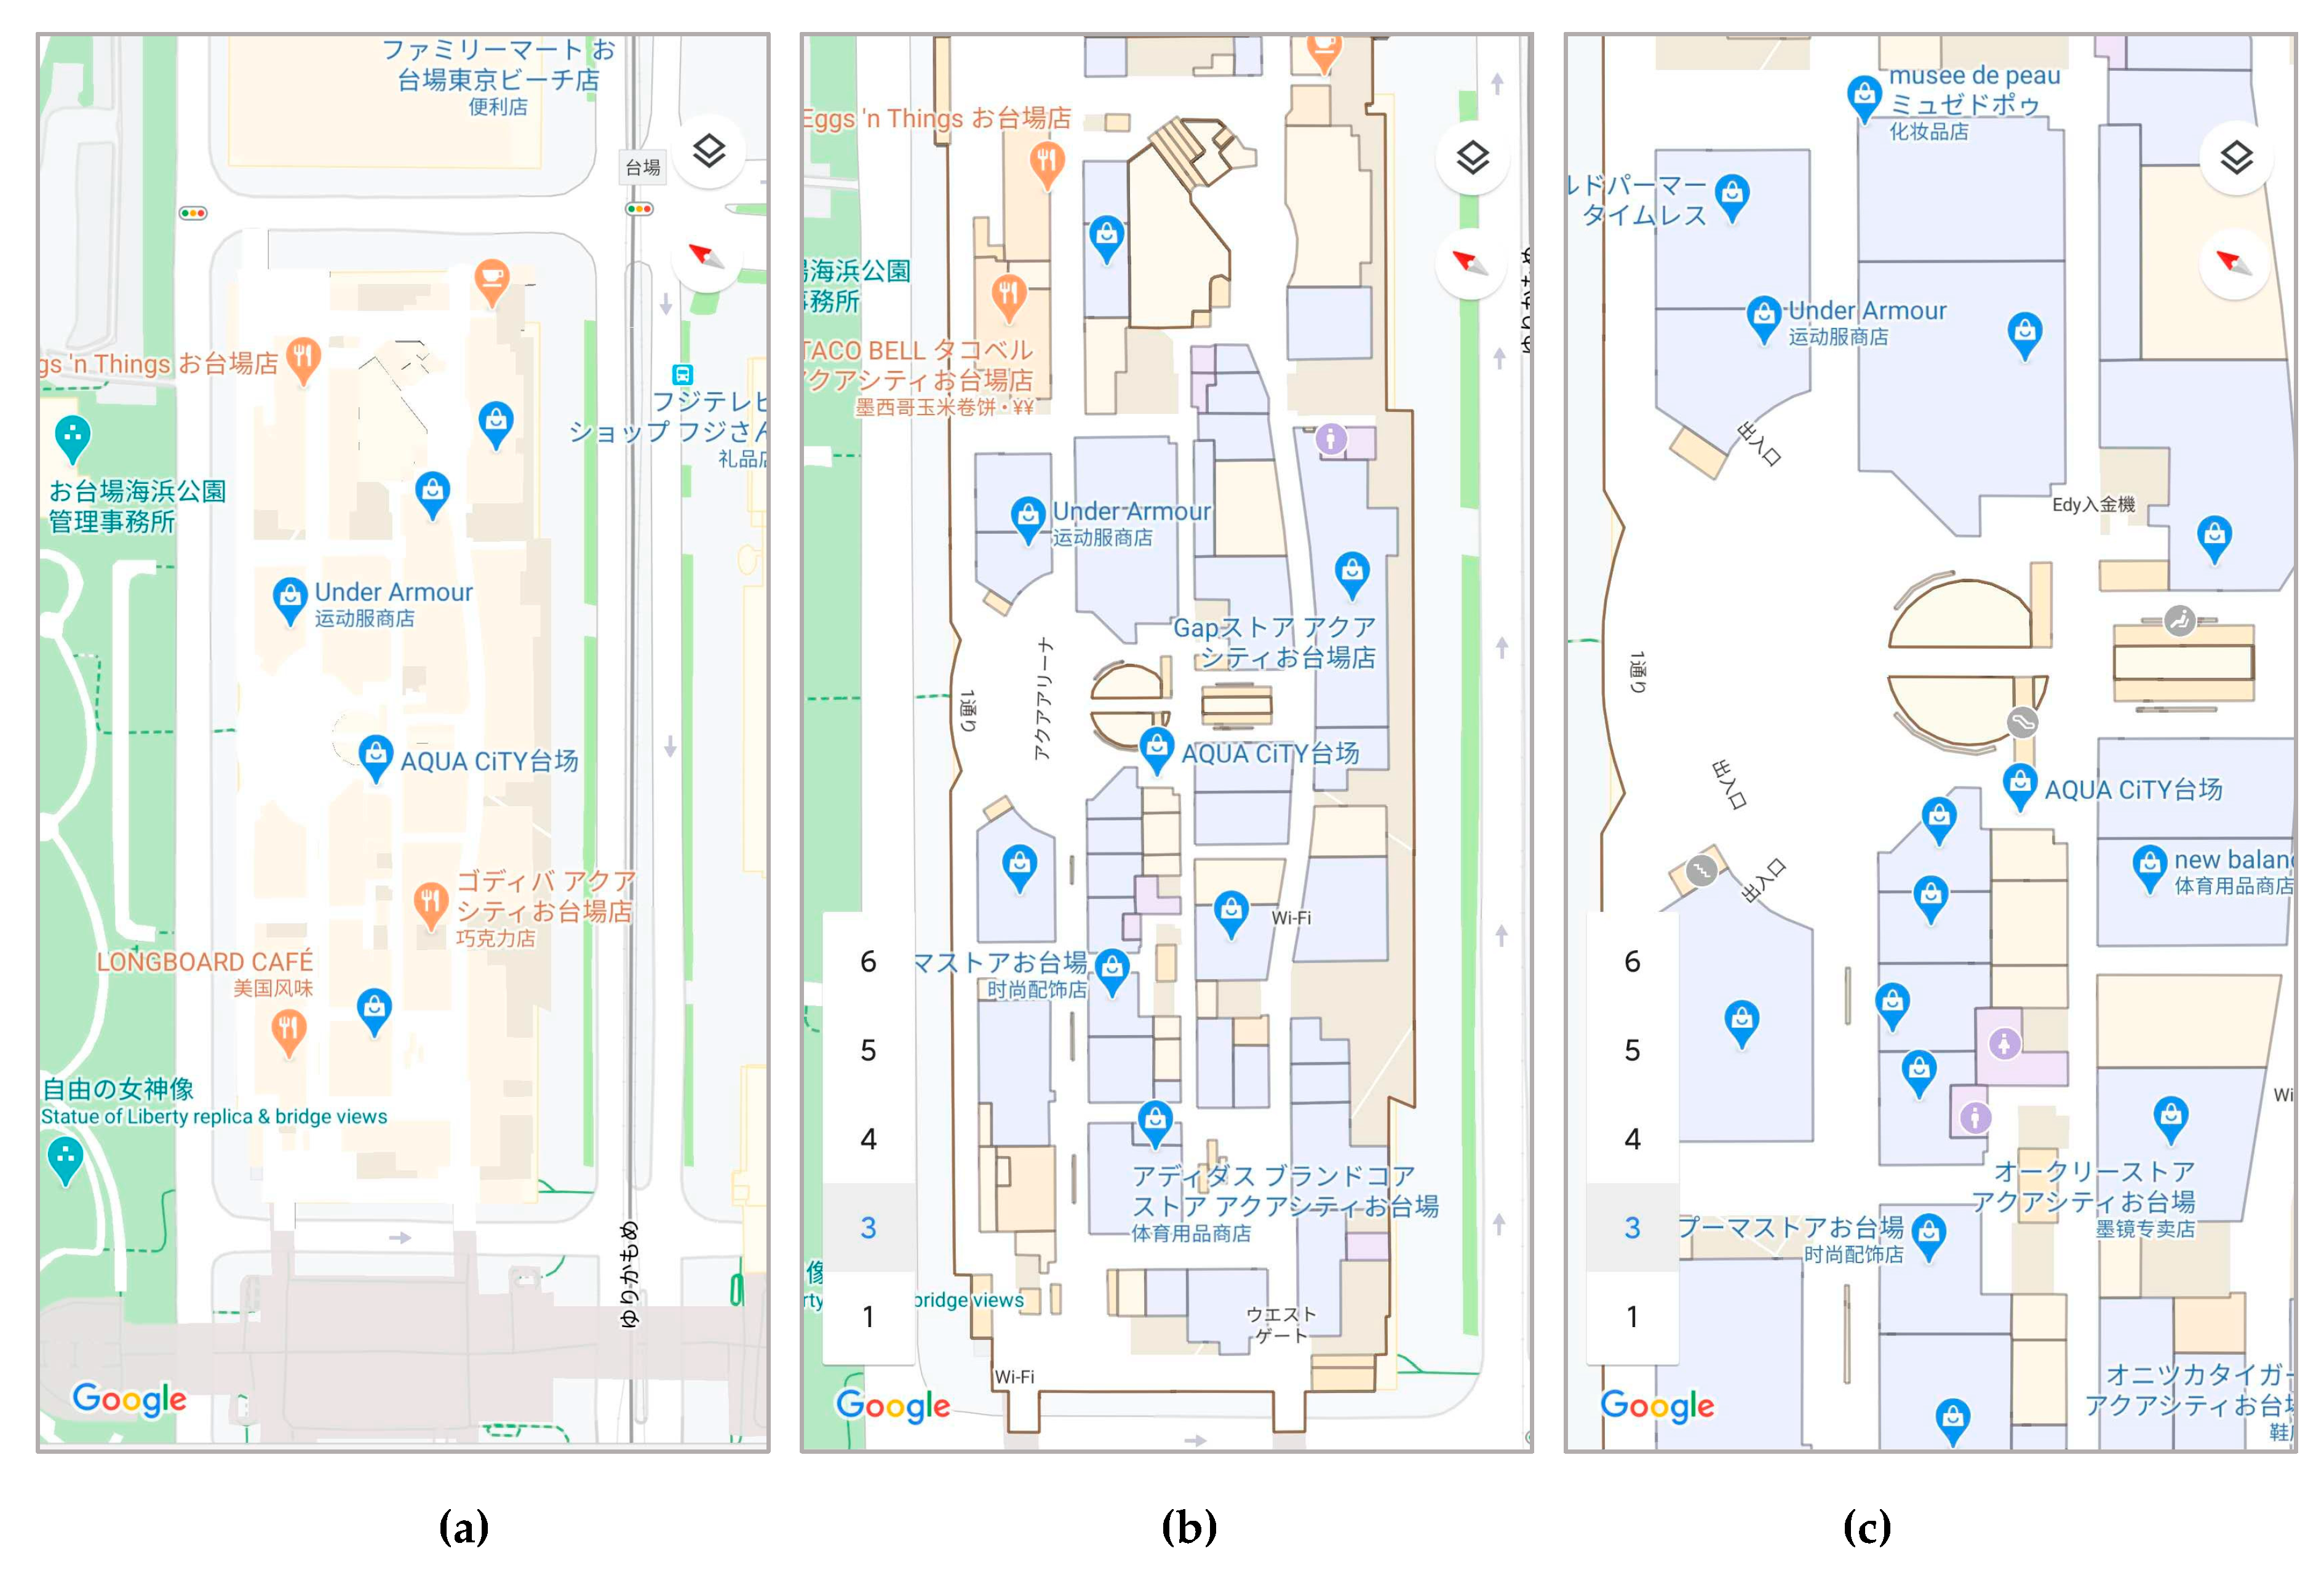
Compared with some of the prevailing indoor 3D modeling methods, such as BIM, the presented indoor map system is more abstract and captures richer semantic information. This allows the map user to comprehend the indoor environment more easily, and the lower level of detail also facilitates visualization performance. In comparison, BIM models are too complex for real-time utilization and contain elements that need to be removed for the models to be useful for visualization [41]. Some major map services such as Google Maps are more similar to the presented indoor map system. Such services also convey information mainly through foreground POI data, with the room distribution as the background to provide the spatial context. In terms of multi-scale representation, as shown in Figure 11a, the Google Indoor Maps service also displays a generalized background after the map is zoomed in to the building of interest, which is similar to our approach. However, in this representation, connected rooms are simply merged together without considering the functions of the rooms. By contrast, our indoor map system can reflect the functional divisions within a floor or even between floors with the help of the 3D visualization of all floors simultaneously. Moreover, this generalized background representation exists only in the mobile version of Google Maps. In the web version, all rooms and their details are shown at every level. This can result in the presentation of many tiny details that are difficult to recognize when the map is at a closer zoom level. Regarding POI representation, the level of semantic information represented by the symbols does not change with the map scale in Google Indoor Maps. The POI symbols can represent only rough category information at any zoom level, as shown in Figure 11. By contrast, when our indoor map is zoomed to a larger scale, the POIs can represent more detailed category information or service information. In addition, we incorporate user adaptivity into the multi-scale representation of our POI features. Overall, in terms of providing multilevel information, the indoor map system presented in this paper is superior.
4. Discussion
With the increasing number of facilities and services being provided inside buildings, it is becoming increasingly important to be able to visualize the POIs located inside a building on indoor maps. As the visualization results presented in this study indicate, the novel method proposed here allows more POI symbols to be displayed more clearly on indoor maps compared with common city map visualization methods, which tend to visualize POIs that belong to different layers in the same layer, resulting in symbol congestion problems. Although there are already many successful indoor map applications available today, our implementation has the following four advantages. The first advantage is 3D visualization. Traditional 2D visualization is not well suited to indoor maps because it allows only one floor of a building to be displayed, causing users to have difficulty integrating knowledge about different floors. Visualizing multiple floors at a time via 3D visualization can strongly enhance spatial understanding [42], although it can also cause some of the contents of one floor to be obscured by higher floors; one possible compromise might be to allow a single floor to be highlighted by changing its horizontal position, in a manner similar to opening a drawer, or changing the vertical distance between floors. The second advantage is multi-scale representation. There are many generalization techniques available for outdoor maps, but indoor maps also require generalization to help users perceive the interior of a building at different levels. Indoor maps at different scales can provide users with different levels of knowledge and decision support from different perspectives. Like map representation, decision-making when a user visits a building also proceeds from coarser to finer levels, including both preliminary decisions and detailed plans, which multi-scale indoor maps can help users make. The third advantage is the provision of detailed service information by means of POI symbols. Just as large-scale indoor maps should be more detailed than common city maps, the POI representations in indoor maps should also be more detailed. Traditional POI symbols represent only the location and basic category information of POIs. The usual way to obtain more detailed service information is to click on a symbol, which then shows a popup box containing more information [43]. By contrast, the POI symbols designed in this study can intuitively display some detailed service information without requiring additional user input or separate popup windows, which mobile phone screens may not be large enough to display. The fourth advantage is personalized map services. The information density is usually higher in an indoor environment than in an outdoor environment. In this context, high-fidelity models that visualize all details are not necessarily better; instead, it is more important to ensure that the optimal information content is presented in the visualization results [44]. To achieve this, the presented map content is adapted to different users in the system developed in this study, and user information is considered to display tailored POIs for different users.
There are two major limitations of this study that could be addressed in future research. First, this study used a shopping mall as an example to illustrate the proposed multi-scale representation method for indoor map visualization, but there are other types of indoor spaces that are also of interest for indoor map services, such as museums, airports, office buildings, and indoor parking areas. This method can also be applied to these indoor spaces but will require different implementations for this purpose. Multi-scale representation is suitable for most buildings, but because the functions of different types of buildings are different, different POI symbols must also be designed to provide different service information. Second, a more sophisticated self-adaptive model should be developed. In addition to map scale and basic user information, it would be better to also consider other factors, such as the display environment and the user’s cognitive ability, although this will come at the cost of greater complexity. Moreover, in our current implementation, the changes in map content and visual form are explicitly triggered through user interaction to ensure that it can provide accurate services to users; however, it would be preferable if these changes could be triggered automatically and implicitly.
5. Conclusions
Indoor maps serve as the foundation for and information carriers of indoor location services; therefore, it is important to be able to deliver the most useful information possible to users through indoor maps. POIs can describe a variety of service facilities and thus represent particularly important information conveyed by maps. To better visualize POIs on indoor maps, this paper has adapted and extended map generalization, a classic cartographic technique, to indoor environments. We have developed a 3D indoor map system that presents all floors of a building in a single map view. As the background of the indoor map, the building structure information is presented at an LOD that adaptively changes with the map scale. Similarly, as the foreground information, the number of POI symbols and the level of attribute information they represent are adaptively adjusted. Furthermore, the display of the POI symbols can be adapted to different users. In the future, to improve the usability of our developed prototype system, the presented self-adaptive model will require further improvement. Other types of indoor spaces need to be considered, such as museums, airports, office buildings, and indoor parking areas, many of which will require the development of unique cartographic symbols.
Author Contributions
Tinghua Ai and Yi Xiao conceived and designed the study; Yi Xiao performed the experiments and wrote the manuscript; Min Yang and Xiang Zhang reviewed and modified the manuscript. All authors have read and agreed to the published version of the manuscript.
Funding
This research was funded by the National Natural Science Foundation of China, grant number 41531180, and the National Natural Science Foundation of China, grant number 41871377, and the National Natural Science Foundation of China, grant number 41671384.
Acknowledgments
We highly acknowledge the editors and the anonymous reviewers who helped to improve the work considerably through their comments and suggestions.
Conflicts of Interest
The authors declare no conflicts of interest.
References
- Looking Forward: Five Thoughts on the Future of GIS. Available online: https://www.esri.com/news/arcwatch/0211/future-of-gis.html (accessed on 8 October 2019).
- Kim, K.; Lee, K. Handling Points of Interest (POIs) on a Mobile Web Map Service Linked to Indoor Geospatial Objects: A Case Study. ISPRS Int. J. Geo. Inf. 2018, 7, 216. [Google Scholar] [CrossRef] [Green Version]
- Basiri, A.; Lohan, E.S.; Moore, T.; Winstanley, A.; Peltola, P.; Hill, C.; Amirian, P.; Figueiredo, E.; Silva, P. Indoor location based services challenges, requirements and usability of current solutions. Comput. Sci. Rev. 2017, 24, 1–12. [Google Scholar] [CrossRef] [Green Version]
- Nossum, A.S. Exploring New Visualization Methods for Multi-Storey Indoor Environments and Dynamic Spatial Phenomena. Ph.D. Thesis, Norwegian University of Science and Technology, Trondheim, Norway, 2013. [Google Scholar]
- Gotlib, D.; Gnat, M.; Marciniak, J. The research on cartographical indoor presentation and indoor route modeling for navigation applications. In Proceedings of the 2012 International Conference on Indoor Positioning and Indoor Navigation, Sydney, Australia, 13–15 November 2012; pp. 1–7. [Google Scholar]
- Reichenbacher, T. Mobile Cartography–Adaptive Visualisation of Geographic Information on Mobile Devices. Ph.D. Thesis, Technical University of Munich, Munich, Germany, 2004. [Google Scholar]
- Gunduz, M.; Isikdag, U.; Basaraner, M. A Review of Recent Research in Indoor Modelling & Mapping. Int. Arch. Photogramm. Remote Sens. Spat. Inf. Sci. 2016, 41, 289–294. [Google Scholar] [CrossRef]
- Midtbø, T.; Nossum, A.; Haakonsen, T.; Nordan, R. Are indoor positioning systems mature for cartographic tasks? Evaluating the performance of a commercial indoor positioning system. In Proceedings of the AutoCarto 2012 Research Symposium, Columbus, OH, USA, 16–18 September 2012. [Google Scholar]
- Pang, Y.; Zhou, L.; Lin, B.; Lv, G.; Zhang, C. Generation of navigation networks for corridor spaces based on indoor visibility map. Int. J. Geogr. Inf. Sci. 2020, 34, 177–201. [Google Scholar] [CrossRef]
- Zlatanova, S.; Isikdag, U. 3D Indoor Models and Their Applications. In Encyclopedia of GIS, 2nd ed.; Shekhar, S., Xiong, H., Zhou, X., Eds.; Springer: Cham, Switzerland, 2015; pp. 1–12. [Google Scholar]
- Zlatanova, S.; Sithole, G.; Nakagawa, M.; Zhu, Q. Problems in Indoor Mapping and Modelling. Int. Arch. Photogramm. Remote Sens. Spat. Inf. Sci. 2013, 40, 63–68. [Google Scholar] [CrossRef] [Green Version]
- Gotlib, D.; Marciniak, J. Cartographical Aspects in the Design of Indoor Navigation Systems. Annu. Navig. 2012, 19, 35–48. [Google Scholar] [CrossRef]
- Zhou, Y.; Dao, T.H.D.; Thill, J.; Delmelle, E. Enhanced 3D visualization techniques in support of indoor location planning. Comput. Environ. Urban Syst. 2015, 50, 15–29. [Google Scholar] [CrossRef]
- Chen, J.; Clarke, K.C. Indoor cartography. Cartogr. Geogr. Inf. Sci. 2019, 46, 1–15. [Google Scholar] [CrossRef]
- Chen, J.; Clarke, K. Modeling Standards and File Formats for Indoor Mapping. In Proceedings of the 3rd International Conference on Geographical Information Systems Theory, Applications and Management, Porto, Portugal, 27–28 April 2017; pp. 268–275. [Google Scholar]
- Zhu, J.; Wright, G.; Wang, J.; Wang, X. A Critical Review of the Integration of Geographic Information System and Building Information Modelling at the Data Level. ISPRS Int. J. Geo. Inf. 2018, 7, 66. [Google Scholar] [CrossRef] [Green Version]
- Isikdag, U.; Zlatanova, S.; Underwood, J. A BIM-Oriented Model for supporting indoor navigation requirements. Comput. Environ. Urban Syst. 2013, 41, 112–123. [Google Scholar] [CrossRef]
- Deng, Y.; Cheng, J.C.P.; Anumba, C. A framework for 3D traffic noise mapping using data from BIM and GIS integration. Struct. Infrastruct. Eng. 2016, 12, 1267–1280. [Google Scholar] [CrossRef]
- Nossum, A.S. IndoorTubes A Novel Design for Indoor Maps. Cartogr. Geogr. Inf. Sci. 2011, 38, 192–200. [Google Scholar] [CrossRef] [Green Version]
- Wrld3d/Wrld-Indoor-Maps-Api. Available online: https://github.com/wrld3d/wrld-indoor-maps-api (accessed on 12 October 2019).
- Gai, M.; Wang, G. Indoor3D: A WebGL based open source framework for 3D indoor maps visualization. In Proceedings of the 20th International Conference on 3D Web Technology, Heraklion, Crete, Greece, 18–21 June 2015; pp. 181–187. [Google Scholar]
- Indoor Mapping, Location Tracking & Wayfinding|ArcGIS Indoors. Available online: https://www.esri.com/en-us/arcgis/products/arcgis-indoors (accessed on 23 February 2020).
- LOD Spec. 2019. Available online: https://bimforum.org/wp-content/uploads/2019/04/LOD-Spec-2019-Part-I-and-Guide-2019-04-29.pdf (accessed on 25 November 2019).
- Liu, X.; Wang, X.; Wright, G.; Cheng, J.; Li, X.; Liu, R. A State-of-the-Art Review on the Integration of Building Information Modeling (BIM) and Geographic Information System (GIS). ISPRS Int. J. Geo. Inf. 2017, 6, 53. [Google Scholar] [CrossRef] [Green Version]
- Löwner, M.O.; Gröger, G.; Benner, J.; Biljecki, F.; Nagel, C. Proposal for a New LOD and Multi-Representation Concept for CityGML. ISPRS Ann. Photogramm. Remote Sens. Spat. Inf. Sci. 2016, 4, 3–12. [Google Scholar] [CrossRef]
- Geiger, A.; Benner, J.; Haefele, K.H. Generalization of 3D IFC Building Models. In 3D Geoinformation Science: The Selected Papers of the 3D GeoInfo 2014, 1st ed.; Breunig, M., AlDoori, M., Butwilowski, E., Kuper, P.V., Benner, J., Haefele, K.H., Eds.; Springer: Berlin, Germany, 2015; pp. 19–35. [Google Scholar]
- Tang, L.; Li, L.; Ying, S.; Lei, Y. A Full Level-of-Detail Specification for 3D Building Models Combining Indoor and Outdoor Scenes. ISPRS Int. J. Geo. Inf. 2018, 7, 419. [Google Scholar] [CrossRef] [Green Version]
- Chen, J. Defining Semantic Levels of Detail for Indoor Maps. ISPRS Ann. Photogramm. Remote Sens. Spat. Inf. Sci. 2018, 4, 27–34. [Google Scholar] [CrossRef] [Green Version]
- Hagedorn, B.; Trapp, M.; Glander, T.; Dollner, J. Towards an Indoor Level-of-Detail Model for Route Visualization. In Proceedings of the 2009 Tenth International Conference on Mobile Data Management: Systems, Services and Middleware, Taipei, Taiwan, 18–20 May 2009; pp. 692–697. [Google Scholar]
- Yang, W.; Ai, T. POI Information Enhancement Using Crowdsourcing Vehicle Trace Data and Social Media Data: A Case Study of Gas Station. ISPRS Int. J. Geo. Inf. 2018, 7, 178. [Google Scholar] [CrossRef] [Green Version]
- Yang, M.; Ai, T.; Lu, W.; Cheng, X.; Zhou, Q. A Real-time Generalization and Multi-scale Visualization Method for POI Data in Volunteered Geographic Information. Acta Geod. Cartogr. Sin 2015, 44, 228–234. [Google Scholar]
- Yu, W.; Zhang, Y.; Chen, Z. Automated Generalization of Facility Points-of-Interest with Service Area Delimitation. IEEE Access 2019, 7, 63921–63935. [Google Scholar] [CrossRef]
- Nossum, A.S. Developing a Framework for Describing and Comparing Indoor Maps. Cartogr. J. 2013, 50, 218–224. [Google Scholar] [CrossRef]
- Ai, T.; Zhang, X.; Zhou, Q.; Yang, M. A vector field model to handle the displacement of multiple conflicts in building generalization. Int. J. Geogr. Inf. Sci. 2015, 29, 1310–1331. [Google Scholar] [CrossRef]
- Li, Z.; Yan, H.; Ai, T.; Chen, J. Automated building generalization based on urban morphology and Gestalt theory. Int. J. Geogr. Inf. Sci. 2004, 18, 513–534. [Google Scholar] [CrossRef]
- Sester, M. Optimization approaches for generalization and data abstraction. Int. J. Geogr. Inf. Sci. 2005, 19, 871–897. [Google Scholar] [CrossRef]
- Shen, Y.; Ai, T.; Wang, L.; Zhou, J. A new approach to simplifying polygonal and linear features using superpixel segmentation. Int. J. Geogr. Inf. Sci. 2018, 32, 2023–2054. [Google Scholar] [CrossRef]
- Ai, T.; Ke, S.; Yang, M.; Li, J. Envelope generation and simplification of polylines using Delaunay triangulation. Int. J. Geogr. Inf. Sci. 2017, 31, 297–319. [Google Scholar] [CrossRef]
- Gaode Open Platform, Web Services API and Related Downloads. Available online: http://lbs.amap.com/api/webservice/download/ (accessed on 20 April 2019).
- Lu, W.; Ai, T.; Zhang, X.; He, Y. An Interactive Web Mapping Visualization of Urban Air Quality Monitoring Data of China. Atmosphere 2017, 8, 148. [Google Scholar] [CrossRef] [Green Version]
- Pouke, M.; Virtanen, J.; Badri, M.; Ojala, T. Comparison of two workflows for Web-based 3D smart home visualizations. In Proceedings of the 2018 IEEE International Conference on Future IoT Technologies (Future IoT), Eger, Hungary, 18–19 January 2018; pp. 1–8. [Google Scholar]
- Lorenz, A.; Thierbach, C.; Baur, N.; Kolbe, T.H. Map design aspects, route complexity, or social background? Factors influencing user satisfaction with indoor navigation maps. Cartogr. Geogr. Inf. Sci. 2013, 40, 201–209. [Google Scholar] [CrossRef]
- Yu, C.; Ren, F.; Du, Q.; Zhao, Z.; Nie, K. Web map-based POI visualization for spatial decision support. Cartogr. Geogr. Inf. Sci. 2013, 40, 172–182. [Google Scholar] [CrossRef]
- Giudice, N.A.; Li, H. The Effects of Visual Granularity on Indoor Spatial Learning Assisted by Mobile 3D Information Displays. In Proceedings of the 2012 International Conference on Spatial Cognition, Kloster Seeon, Germany, 31 August–3 September 2012; pp. 163–172. [Google Scholar]
Figure 1.
Indoor map data structure. POI, point-of-interest.

Figure 2.
General workflow of indoor map data generalization. LODs, levels of detail.

Figure 3.
Multi-scale indoor map background data that indicate the functions of the indoor space at different levels: (a) LOD0; (b) LOD1; (c) LOD2; (d) LOD3.
Figure 3.
Multi-scale indoor map background data that indicate the functions of the indoor space at different levels: (a) LOD0; (b) LOD1; (c) LOD2; (d) LOD3.

Figure 4.
3D visualizations of the building structure: (a) LOD0; (b) LOD1; (c) LOD2; (d) LOD3.

Figure 5.
Multiple ways to highlight a floor: (a) changing the horizontal position of a floor; (b) changing the vertical position of a floor; (c) showing only one floor.
Figure 5.
Multiple ways to highlight a floor: (a) changing the horizontal position of a floor; (b) changing the vertical position of a floor; (c) showing only one floor.

Figure 6.
Tree structure of the indoor map POI symbols.

Figure 7.
Class- and subclass-level POI symbol design.

Figure 8.
Examples of rich semantic symbols: (a) dessert shop with an average price of 18 CHY; (b) Western food restaurant with an average price of 129 CHY.
Figure 8.
Examples of rich semantic symbols: (a) dessert shop with an average price of 18 CHY; (b) Western food restaurant with an average price of 129 CHY.

Figure 9.
Results of scale-adaptive indoor map: (a) at a smaller scale, the main function of each floor and class-level symbols are shown; (b) at a medium scale, the functional divisions of each floor and subclass-level symbols are shown; (c) at a larger scale, the detailed room distributions and POI symbols with rich semantic information are shown.


Figure 10.
POI visualization that adapts to the user’s purpose: (a) when the user is a young woman whose purpose is to shop for cosmetics and women’s clothes; (b) when the user is a young man whose interests lie in shopping for electronics and men’s clothes; (c) when the user is an older man with the same interests as the young man in (b).

Figure 11.
Examples of Google Indoor Maps at different scales, used with permission from Google: (a) smaller scale;(b) medium scale; (c) larger scale.
Figure 11.
Examples of Google Indoor Maps at different scales, used with permission from Google: (a) smaller scale;(b) medium scale; (c) larger scale.


Table 1.
Feature selection and classification results.
| Category | Selected Features |
|---|---|
| Building structure | Building outline, floor outlines, room outlines, room walls |
| Transportation | Escalators, elevators, entrances, exits, etc. |
| Commerce | Food, retail, entertainment, etc. |
| Public services | Toilets, rest areas, cashiers, service desks, ATMs, etc. |
Table 2.
LOD specifications for building structures.
| LOD | Represented Features |
|---|---|
| LOD0 | Building outline |
| LOD1 | Floor distribution and main function of each floor |
| LOD2 | Functional division of each floor |
| LOD3 | Detailed room distribution |
Table 3.
Hierarchical classification of indoor POIs.
| Class Code | Class | Subclass Code | Subclass |
|---|---|---|---|
| 01 | Food | 0101 | Chinese food |
| 0102 | Western food | ||
| 0103 | Fast food | ||
| 0104 | Hot pot | ||
| 0105 | Barbecue | ||
| 0106 | Dessert and drinks | ||
| 0107 | Other cuisine | ||
| 02 | Shopping | 0201 | Womenswear |
| 0202 | Menswear | ||
| 0203 | Childrenswear | ||
| 0204 | Cosmetics | ||
| 0205 | Jewelry | ||
| 0206 | Retail | ||
| 0207 | Electronics | ||
| 03 | Life services | 0301 | Beauty services |
| 0302 | Fitness | ||
| 0303 | Health | ||
| 0304 | Education | ||
| 04 | Entertainment | 0401 | Cinema |
| 0402 | Internet cafe | ||
| 0403 | Game center | ||
| 0404 | Children’s playground |
Table 4.
Example of the representation of semantic information at multiple levels.
| Semantic Level | LOD | Example |
|---|---|---|
| Class-level POI | LOD1 | Food |
| Subclass-level POI | LOD2 | Chinese food |
| POI attribute | LOD3 | Average price of this restaurant |
Table 5.
Rules for adaptive symbol parameter setting.
| Symbol Parameter | Range of Values | Self-Adaptive Conditions | Rules |
|---|---|---|---|
| Style |
|
|
|
| Size | Min size to max size |
|
|
| Color | Multiple sets of color schemes |
|
|
© 2020 by the authors. Licensee MDPI, Basel, Switzerland. This article is an open access article distributed under the terms and conditions of the Creative Commons Attribution (CC BY) license (http://creativecommons.org/licenses/by/4.0/).
Share and Cite
MDPI and ACS Style
Xiao, Y.; Ai, T.; Yang, M.; Zhang, X. A Multi-Scale Representation of Point-of-Interest (POI) Features in Indoor Map Visualization. ISPRS Int. J. Geo-Inf. 2020, 9, 239. https://0-doi-org.brum.beds.ac.uk/10.3390/ijgi9040239
AMA Style
Xiao Y, Ai T, Yang M, Zhang X. A Multi-Scale Representation of Point-of-Interest (POI) Features in Indoor Map Visualization. ISPRS International Journal of Geo-Information. 2020; 9(4):239. https://0-doi-org.brum.beds.ac.uk/10.3390/ijgi9040239
Chicago/Turabian StyleXiao, Yi, Tinghua Ai, Min Yang, and Xiang Zhang. 2020. "A Multi-Scale Representation of Point-of-Interest (POI) Features in Indoor Map Visualization" ISPRS International Journal of Geo-Information 9, no. 4: 239. https://0-doi-org.brum.beds.ac.uk/10.3390/ijgi9040239
Note that from the first issue of 2016, this journal uses article numbers instead of page numbers. See further details here.