1. Introduction
There has been growing interest in the use of advanced information processing techniques such as big data and deep learning in working-level tasks dealing with satellite data, and the civilian and scientific applications of high-resolution satellite images extend to precise analyses of data to give insights beyond visual interpretation based on pixels. For optical images acquired from Earth observation (EO) satellites, precise analyses require processing to convert sensor radiance into scientific data such as atmospheric reflectance, surface reflectance, or surface temperature. Among the pre-processing procedures used for EO images, atmospheric correction is a core step in generating surface reflectance data. Satellite images for the application of these approaches should be provided with scientific data, such as surface reflectivity, rather than pixel-based image data.
Atmospherically corrected images are employed for many land use applications, such as quantitative vegetation metric estimation. The development of atmospheric correction schemes and their application models is still ongoing. Horion et al. [
1] estimated normalized difference vegetation index (NDVI) values and analyzed the long-term trends in NDVI data derived from satellite sensors including SPOT-VEGETATION, Moderate Resolution Imaging Spectroradiometer (MODIS), and Advanced Very High Resolution Radiometer (AVHRR). Fan et al. [
2] proposed temporally variable correction equations for generating long-term and consistent NDVI datasets from moderate-resolution sensors, such as AVHRR, MODIS, and Visible Infrared Imaging Radiometer Suite (VIIRS). White computed NDVI values were derived from QuickBird and WorldView-2 satellite imagery that was captured to coincide with ground-based vegetation cover and spring discharge measurements [
3]. Significant linear relationships were established between the image NDVI values and ground-based vegetation cover. Gascon et al. [
4] introduced the Sen2Cor processor for the Level-2A product of Sentinel-2 imagery. It converts Top-Of-Atmosphere reflectance (hereinafter referred to as TOA reflectance) to its Bottom-Of-Atmosphere (BOA) counterpart by using the aerosol optical depth (AOD), water vapor content, cirrus cloud correction, terrain correction, and empirical Bidirectional Reflectance Distribution Function (BRDF) corrections. Solórzano et al. [
5] used a multispectral image from GeoEye-1 to extract image metrics for modeling a tropical, dry forest based on relative reflectance data that were atmospherically corrected using the Quick Atmospheric Correction (QuAC) algorithm in the Harris Geospatial ENVI software. Miura et al. [
6] investigated the cross-sensor compatibility of spectral vegetation indices between VIIRS and MODIS by calculating the vegetation indices, including NDVI, by TOA and TOC reflectance. In the case of Sentinel-2, a project is underway to publicly distribute atmospherically corrected products using the concept of a service platform [
7].
Kuhn et al. [
8] compared the standard United States Geological Survey (USGS) land surface reflectance products to Landsat-8 and Sentinel-2 aquatic remote sensing reflectance products over several river regions to highlight differences using a correction technique with in situ data. The surface reflectance data supported by the Google Earth Engine (GEE) provide TOA reflectance products from the Landsat Ecosystem Disturbance Adaptive Processing System (LEDAPS) for Landsat 4-5 TM/Landsat 7 ETM+ surface reflectance and the Land Surface Reflectance Code (LaSRC) for Landsat 8 (
https://developers.google.com/earthengine/datasets/catalog/LANDSAT_LC08_C01_T1_SR). The surface reflectance products of the Level-1 Precision/Terrain correction for the Landsat 7/8 imagery produced by the absolute atmospheric correction scheme, however, are incomplete due to the limited conditions for product generation. The Sentinel-2 Level-2A surface reflectance products have been available in the Earth Engine data catalog since 2019 (
https://philippgaertner.github.io/2019/04/gee-s2-level-2a-ingestion/).
To explore the atmospheric corrections of the WorldView-2 image obtained from commercial Earth observation satellites owned by DigitalGlobe, three methods—Simple Linear Regression, Fast Line-of-Sight Atmospheric Analysis of Spectral Hypercubes (FLAASH), and Atmospheric CORrection (ATCOR) models—were evaluated according to in situ reflectance data for particular targets [
9]. The mapping of vegetation functional types in urban areas was studied with WorldView-2 imagery [
10], and the Normalized Difference Water Index (NDWI) and NDVI values of the WorldView-2 imagery were used for coastline extraction [
11]. WorldView-3 satellite image sets are included in the National Land Cover Database (NLCD) for impervious surface area mapping for urban areas [
12]. For precision agriculture, the surface reflectance of WorldView-3 was studied by Solano [
13] in the process of geographic-object-based image classification for tree crown detection. To evaluate information on tree health in species-rich urban forestry, the potential of the cloud-free Atmospheric Compensation (ACOMP) products of WorldView-3 to mitigate the effects of atmospheric scattering and provide normalized surface reflectance values was investigated [
14].
Lee and Lee [
15] performed a comparison of products by applying several known atmospheric correction methods with multiple spectral image sets from KOMPSAT-2. KOPMSAT stands for Korea Multi-Purpose Satellite. The results revealed difficulties in generating consistent products, because atmospheric corrections are affected by several variables. Regarding very high resolution (VHR) KOMPSAT-3/3A images, Kim et al. [
16] analyzed the radiative characteristics of KOMPSAT-3 images and experimented to verify the image quality with Landsat-8 images in the same area. Sensor variables for the reflection of the TOA (hereinafter referred to as TOA reflectance) were also presented. Shin et al. [
17] conducted a comparative study with both results of the TOA reflectance calculation using KOMPSAT-3A and Landsat 8 OLI images in the test area and reported that the quality of the KOMPSAT-3A images was consistently maintained. In a pilot study on the calibration of KOMPSAT-3/3A images, Yeom et al. [
18] performed calculations of TOA reflectance using the second simulation of the satellite signal in the solar spectrum (6S) algorithm, an important radiated transport model, and analyzed the absolute radiometric characteristics of KOMPSAT-3/3A. Ahn et al. [
19] produced atmospherically corrected images of Landsat or Sentinel-2 images and used them to propose an adjustment factor for KOMPSAT-3 for TOA reflectance.
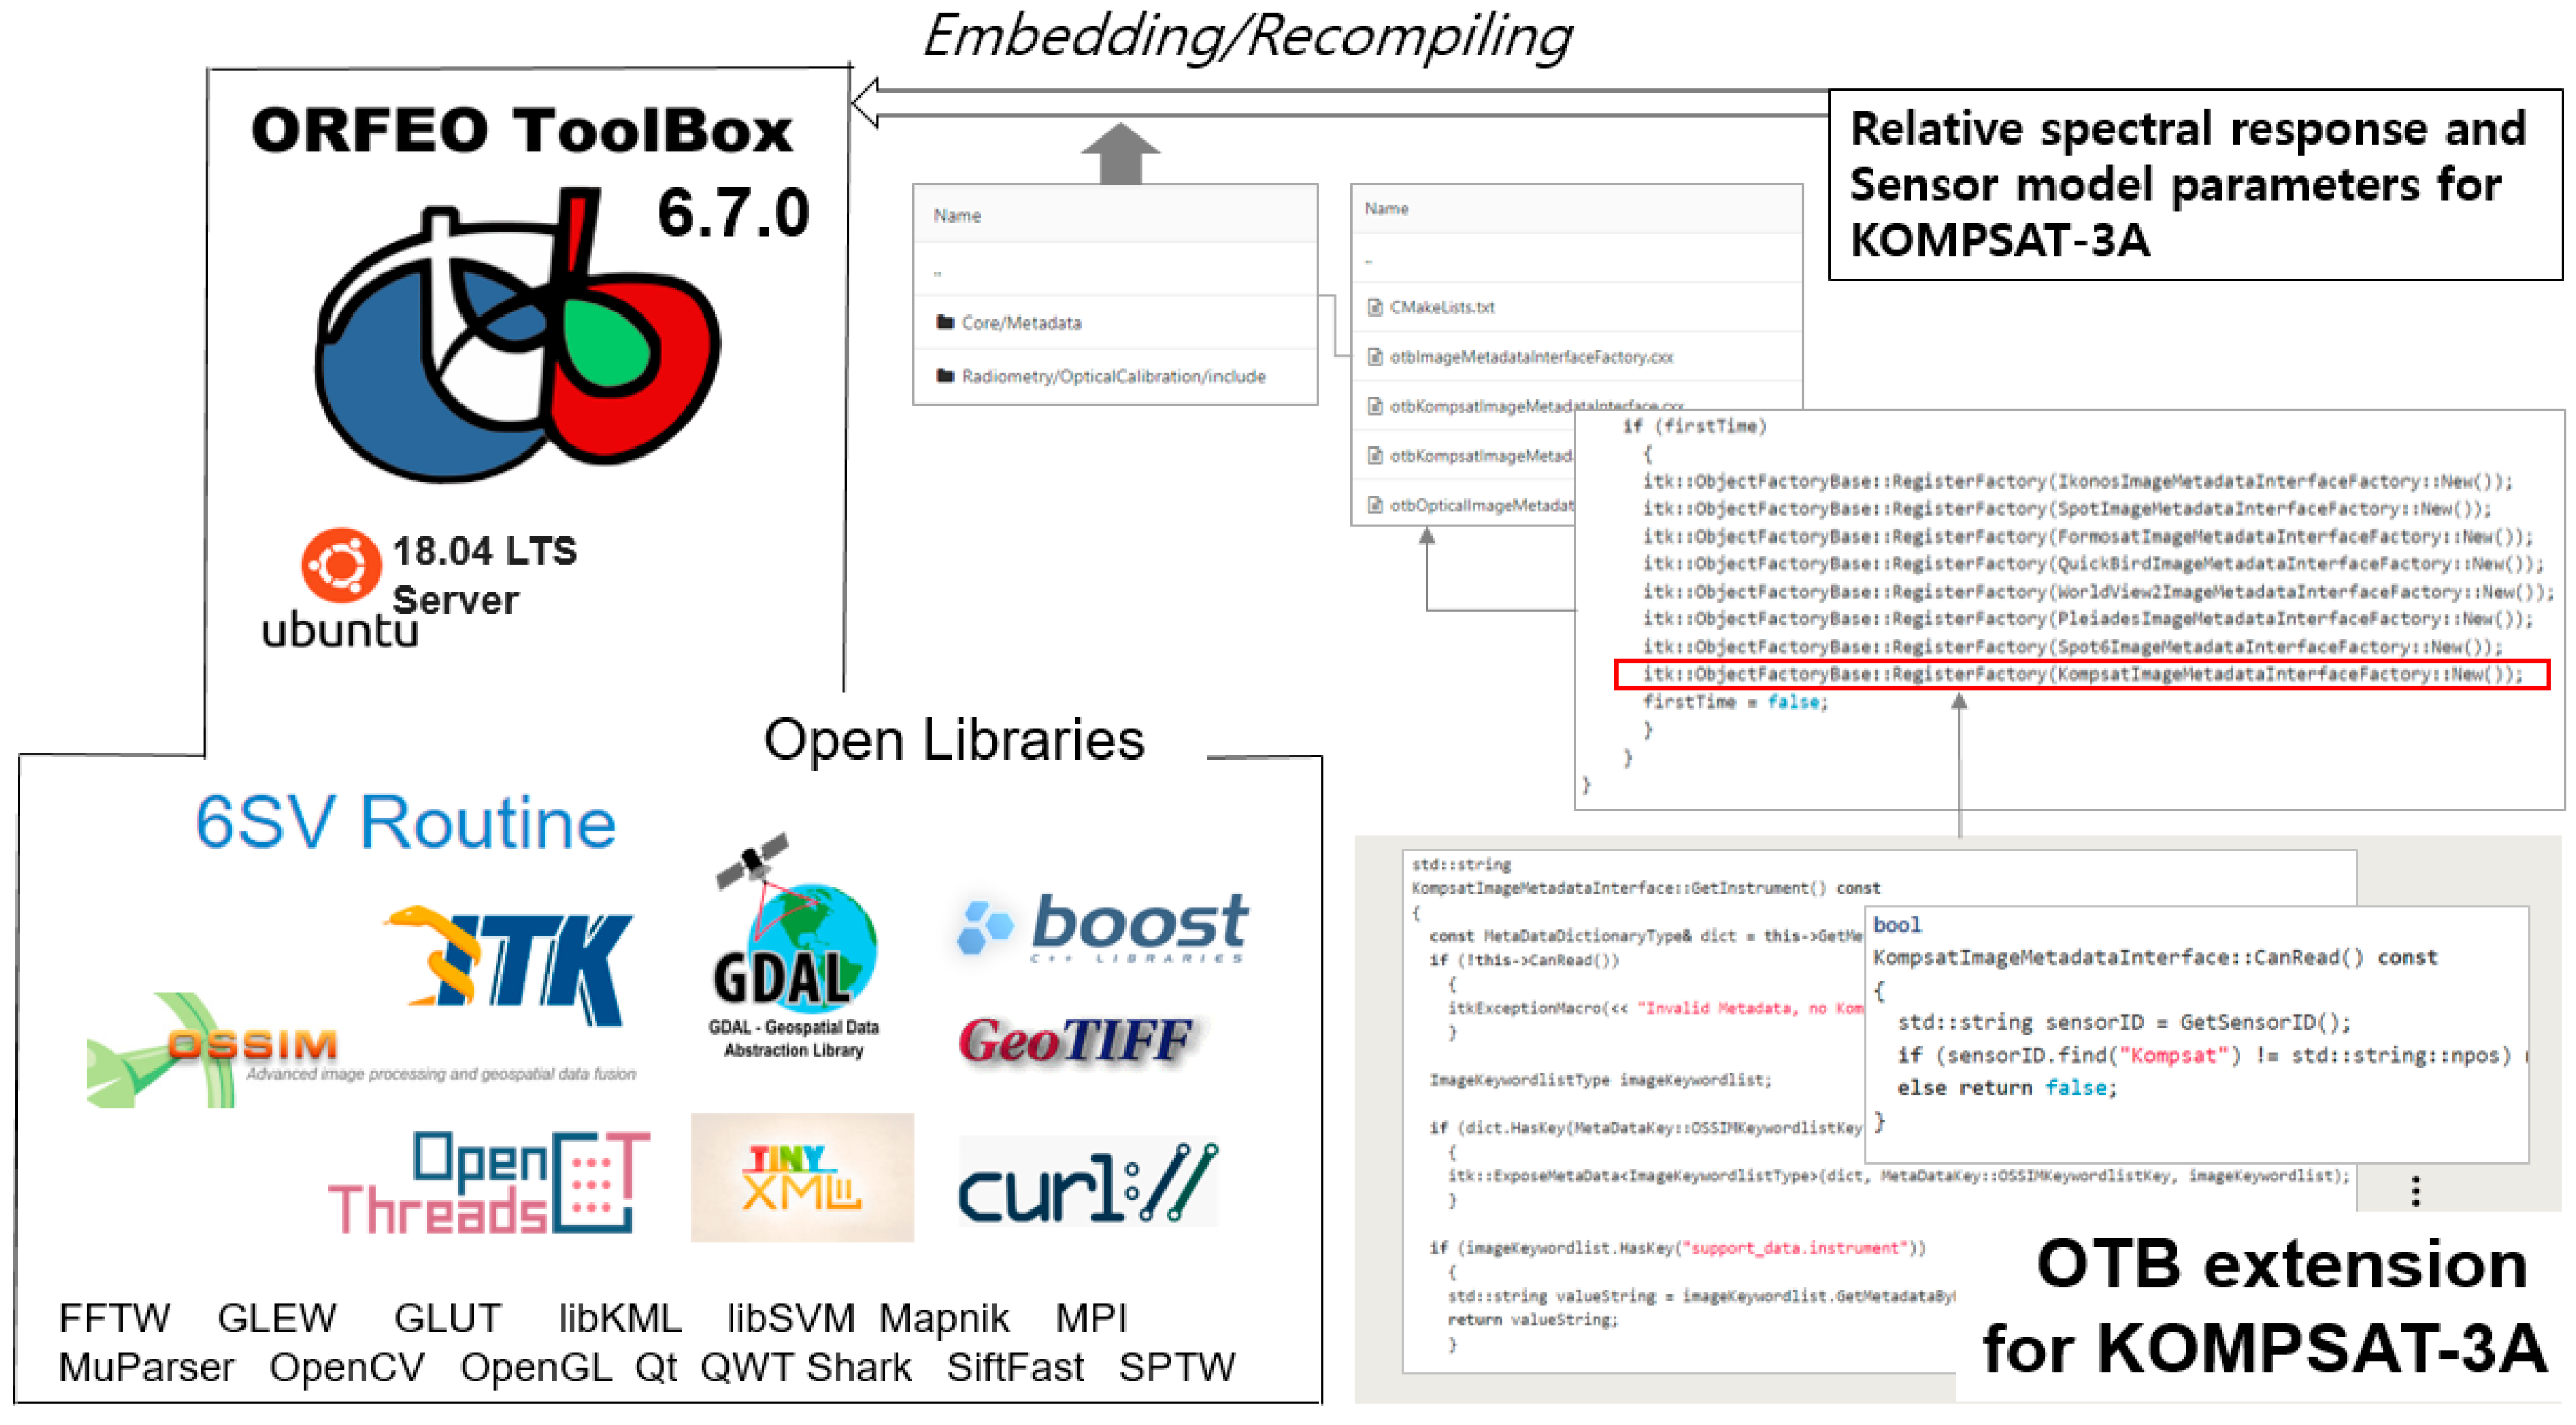
Most commercialized tools support extensions or plug-in programs for atmospheric correction; however, most algorithms and methods were developed primarily for MODIS, the Landsat series, and Sentinel-2 images. Thus, as of December 2019, few tools provide atmospheric correction methods that support the sensor model of KOMPSAT-3/3A. It is therefore critical to develop atmospheric correction processing tools for these satellite images to expand the scientific applications of KOMPSAT-3/3A images and other VHR images. Lee and Kim implemented a test version to produce surface reflectance for KOMPSAT-3A based on the open-source Orfeo ToolBox (OTB) environment and performed a case study with KOMPSAT-3A images in the Mekong river area [
20].
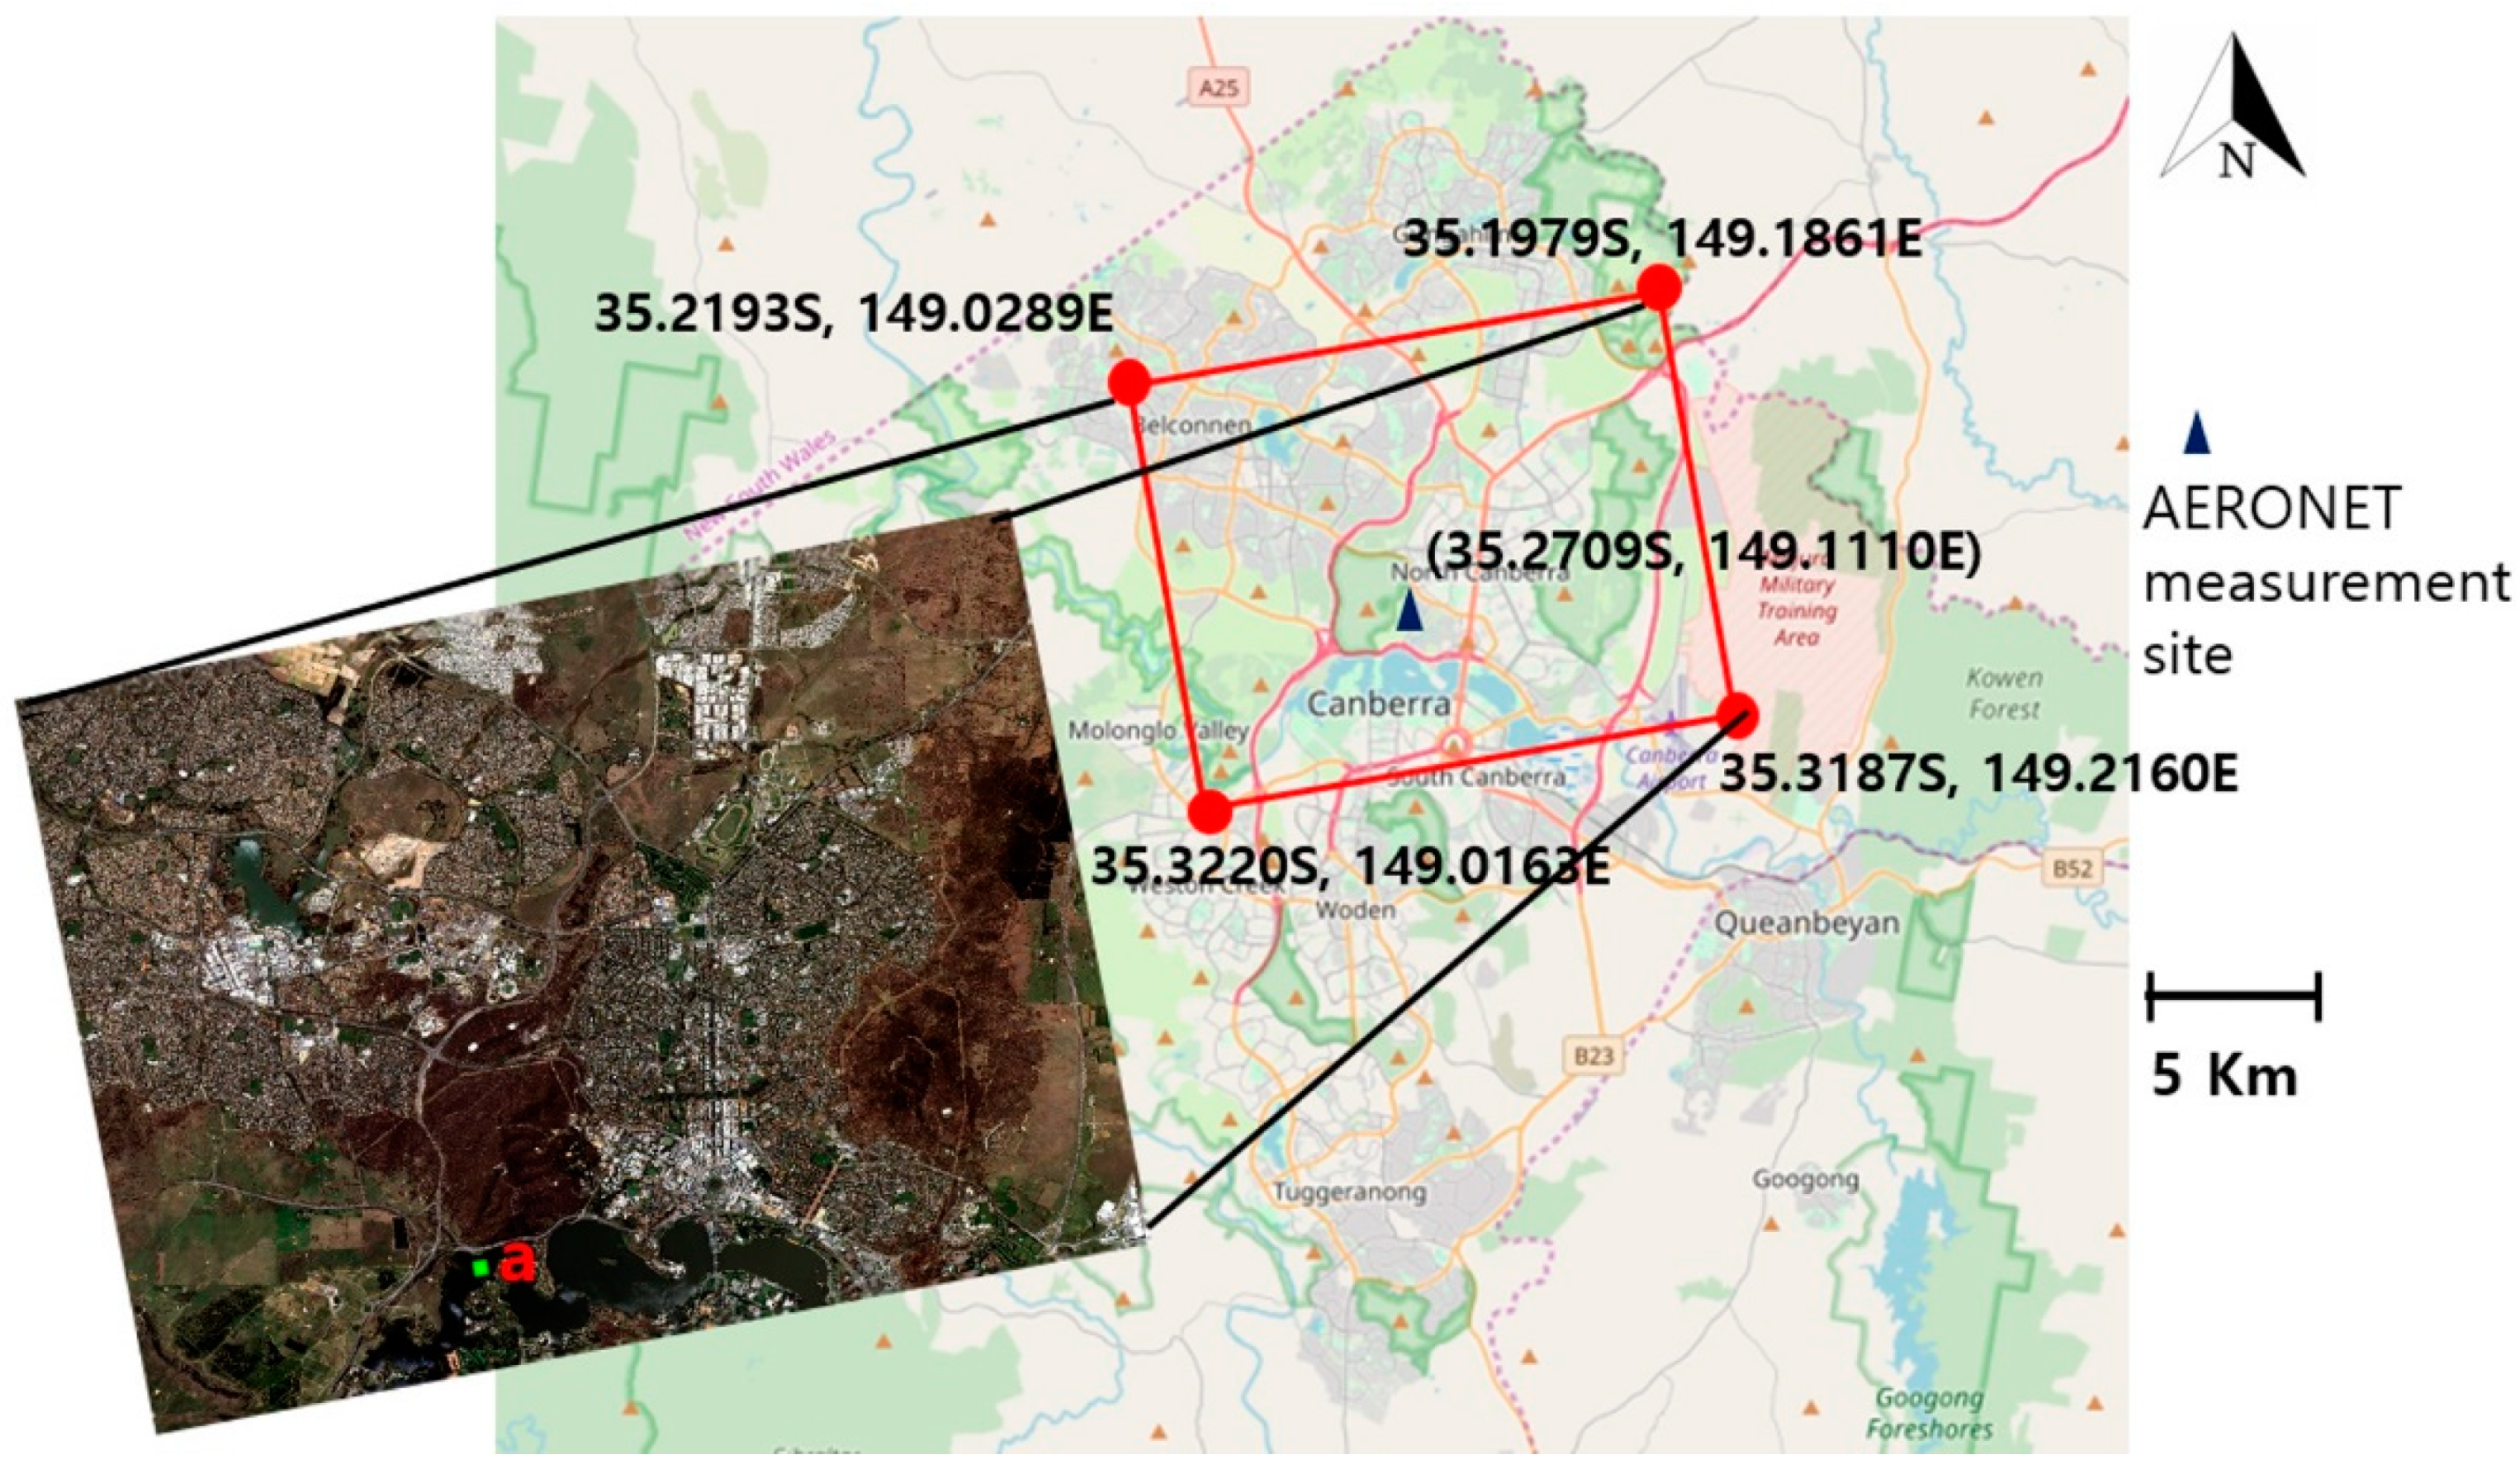
Based on this test version, this study implemented the OTB extension for KOMPSAT-3A images for an absolute atmospheric correction processing method based on open-source tools as the first step towards establishing an analysis ready data (ARD) database of KOMPSAT images and implementing the actual processing module in the OTB environment. Using this module, experiments were conducted to generate surface reflection with three KOMPSAT 3A images to compare the reflectance results of TOA and TOC with and without the AERONET file, which provides spectral AOD measurements. AERONET is a global aerosol network operated by the National Aeronautics and Space Administration (NASA) and other international satellite missions, which provides the public with different aerosol properties [
21]. Moreover, dark object subtraction (DOS)-based atmospheric correction images were prepared and compared with those from the absolute atmospheric correction scheme.
As for NDVI applications for agricultural monitoring purposes, the effects of the atmosphere should be considered because of meaningful results showing a mean difference of 18% between atmospheric and non-atmospheric corrected values [
22]. AERONET ground measurements, including aerosol and water vapor parameters, are used as a function of the accuracy of the inputs of the atmospheric correction algorithm to evaluate vegetation indices by TOA or TOC reflectance [
23]. Meanwhile, the GEE cloud platform consists of a multi-petabyte analysis-ready data catalog that is co-located with a high-performance, intrinsically parallel computation service. It is accessed and controlled through an internet-accessible application programming interface (API) and an associated web-based interactive development environment (IDE) that enables the rapid prototyping and visualization of results [
24]. The GEE provides substantial opportunities for Earth observation and geospatial applications, and it potentially eliminates some of the barriers, particularly in the developing world [
25]. Nouri [
26] explored the relationship between urban vegetation evapotranspiration (ET) and the vegetation indices derived from newly-developed high spatial resolution WorldView-2 imagery showing that NDVI values were derived for each category of landscape cover, namely, trees, shrubs, turf grasses, impervious pavements, and water bodies.
Based on the background and motivation mentioned above, the first purpose of this study is to address the OTB extension of KOMPSAT-3A images to produce TOA and TOC reflectance by absolute atmospheric correction. The second is to present the difference between the relative atmospheric correction of the DOS scheme and the absolute atmospheric correction for KOMPSAT-3A images through NDVI results. The third is to compare NDVI data from KOMPSAT-3A images with those obtained using Landsat-8 images in GEE, demonstrating the applicability of surface reflectance data produced from high-resolution multispectral images for future applications.
2. Absolute Atmospheric Correction for Optical Satellite Images and Work Scope
Solar radiation reflected from the surface is detected by satellite sensors through the atmosphere. The radiation energy detected by a satellite sensor is converted to pixel values according to the characteristics of the sensor and provided as an image. The quantity of radiant energy varies greatly from space to time, and it is important to extract accurate measurements from satellite images, regardless of space or time. The pixel values recorded in the image are not uniform across the spectral range, as they are dependent on the season, light and atmospheric conditions, position of the sun, and internal sensor variables. Therefore, calibration for converting pixel values into physical quantities of radiant energy by generalizing the relationship between the radiation energy values recorded in the sensors and the pixel values recorded in the images is an essential process for further analysis.
In addition, applications for crop monitoring or time series analysis related to natural disasters usually involve the comparison of images obtained from different types of sensor or at different times and in different seasons. For this task, physical variables indicating the atmospheric conditions at the acquisition time of the image are used together with a correction factor for the sensor to indicate the amount of physical energy recorded in each sensor. Solar radiation is reflected by various objects and structures on the surface and is detected by sensors in optical satellites, after which it is subjected to atmospheric attenuation that is absorbed and scattered by the Earth’s atmosphere; this process affects the pixel values of the image. Therefore, the radiative transfer model is used to quantitatively calculate the amount of radiant energy present. This model requires several physical values containing the position of the satellite at the time of image acquisition as well as the reflective characteristics of the target located on the surface and the condition of the atmosphere at that time. Then, using these variables, a radiation transport model, such as MODTRAN (MODerate resolution atmospheric TRANsmission) or the 6S model, is used for the atmospheric correction of the optical images [
27].
The performance of absolute atmospheric corrections for calculating TOC reflectance requires four types of data. The first is the data collected on the ground during the passage of the satellite. The second involves the relative spectral response function curves that indicate the pixel values of the images taken by the satellite, the response level of the sensors, and the sensor gain and offset. The third is the radiation energy values calculated based on the atmospheric conditions and geometrical positions of the sun and sensors required for the selected radiation transport model. The fourth is the measurement data describing atmospheric conditions, such as the AOD, atmospheric pressure, water vapor volume, ozone volume, and composition and quantity of aerosol gases.
Atmospheric correction is not necessary for all land applications of satellite images; however, it is an important process for the physical analysis of land properties or time series image analysis, such as the detection of change in the environment. There are several algorithms based on MODTRAN and the 6S model for this correction: ACORN (Atmospheric CORrection Now), FLAASH, ATREM (ATmospheric REMoval), and ATCOR. In addition to commercial tools, Bunting [
28] developed the Atmospheric and Radiometric Correction of Satellite Imagery (ARCSI) tool using the 6S model; this model supports Landsat, SPOT, Sentinel-2, Rapideye, WorldView, and Pleiades. Franz et al. [
29] developed a tool called the Framework for Operational Radiometric Correction for Environmental Monitoring (FORCE) that can produce Landsat ARD by applying a water vapor dataset using the MODIS image. Leutner [
30] developed RSToolbox, an open-source package for providing relative atmospheric correction processing according to the DOS algorithm for Landsat images in the R environment. In the SNAP Toolbox, a plug-in method of the iCOR atmospheric correction tool [
31] is mainly used for Sentinel 2 and Landsat 8 images. The TOA reflection tool in SAGA [
32] utilizes a module using the DOS scheme named i.landsat.toar in the GRASS library for Landsat images only.
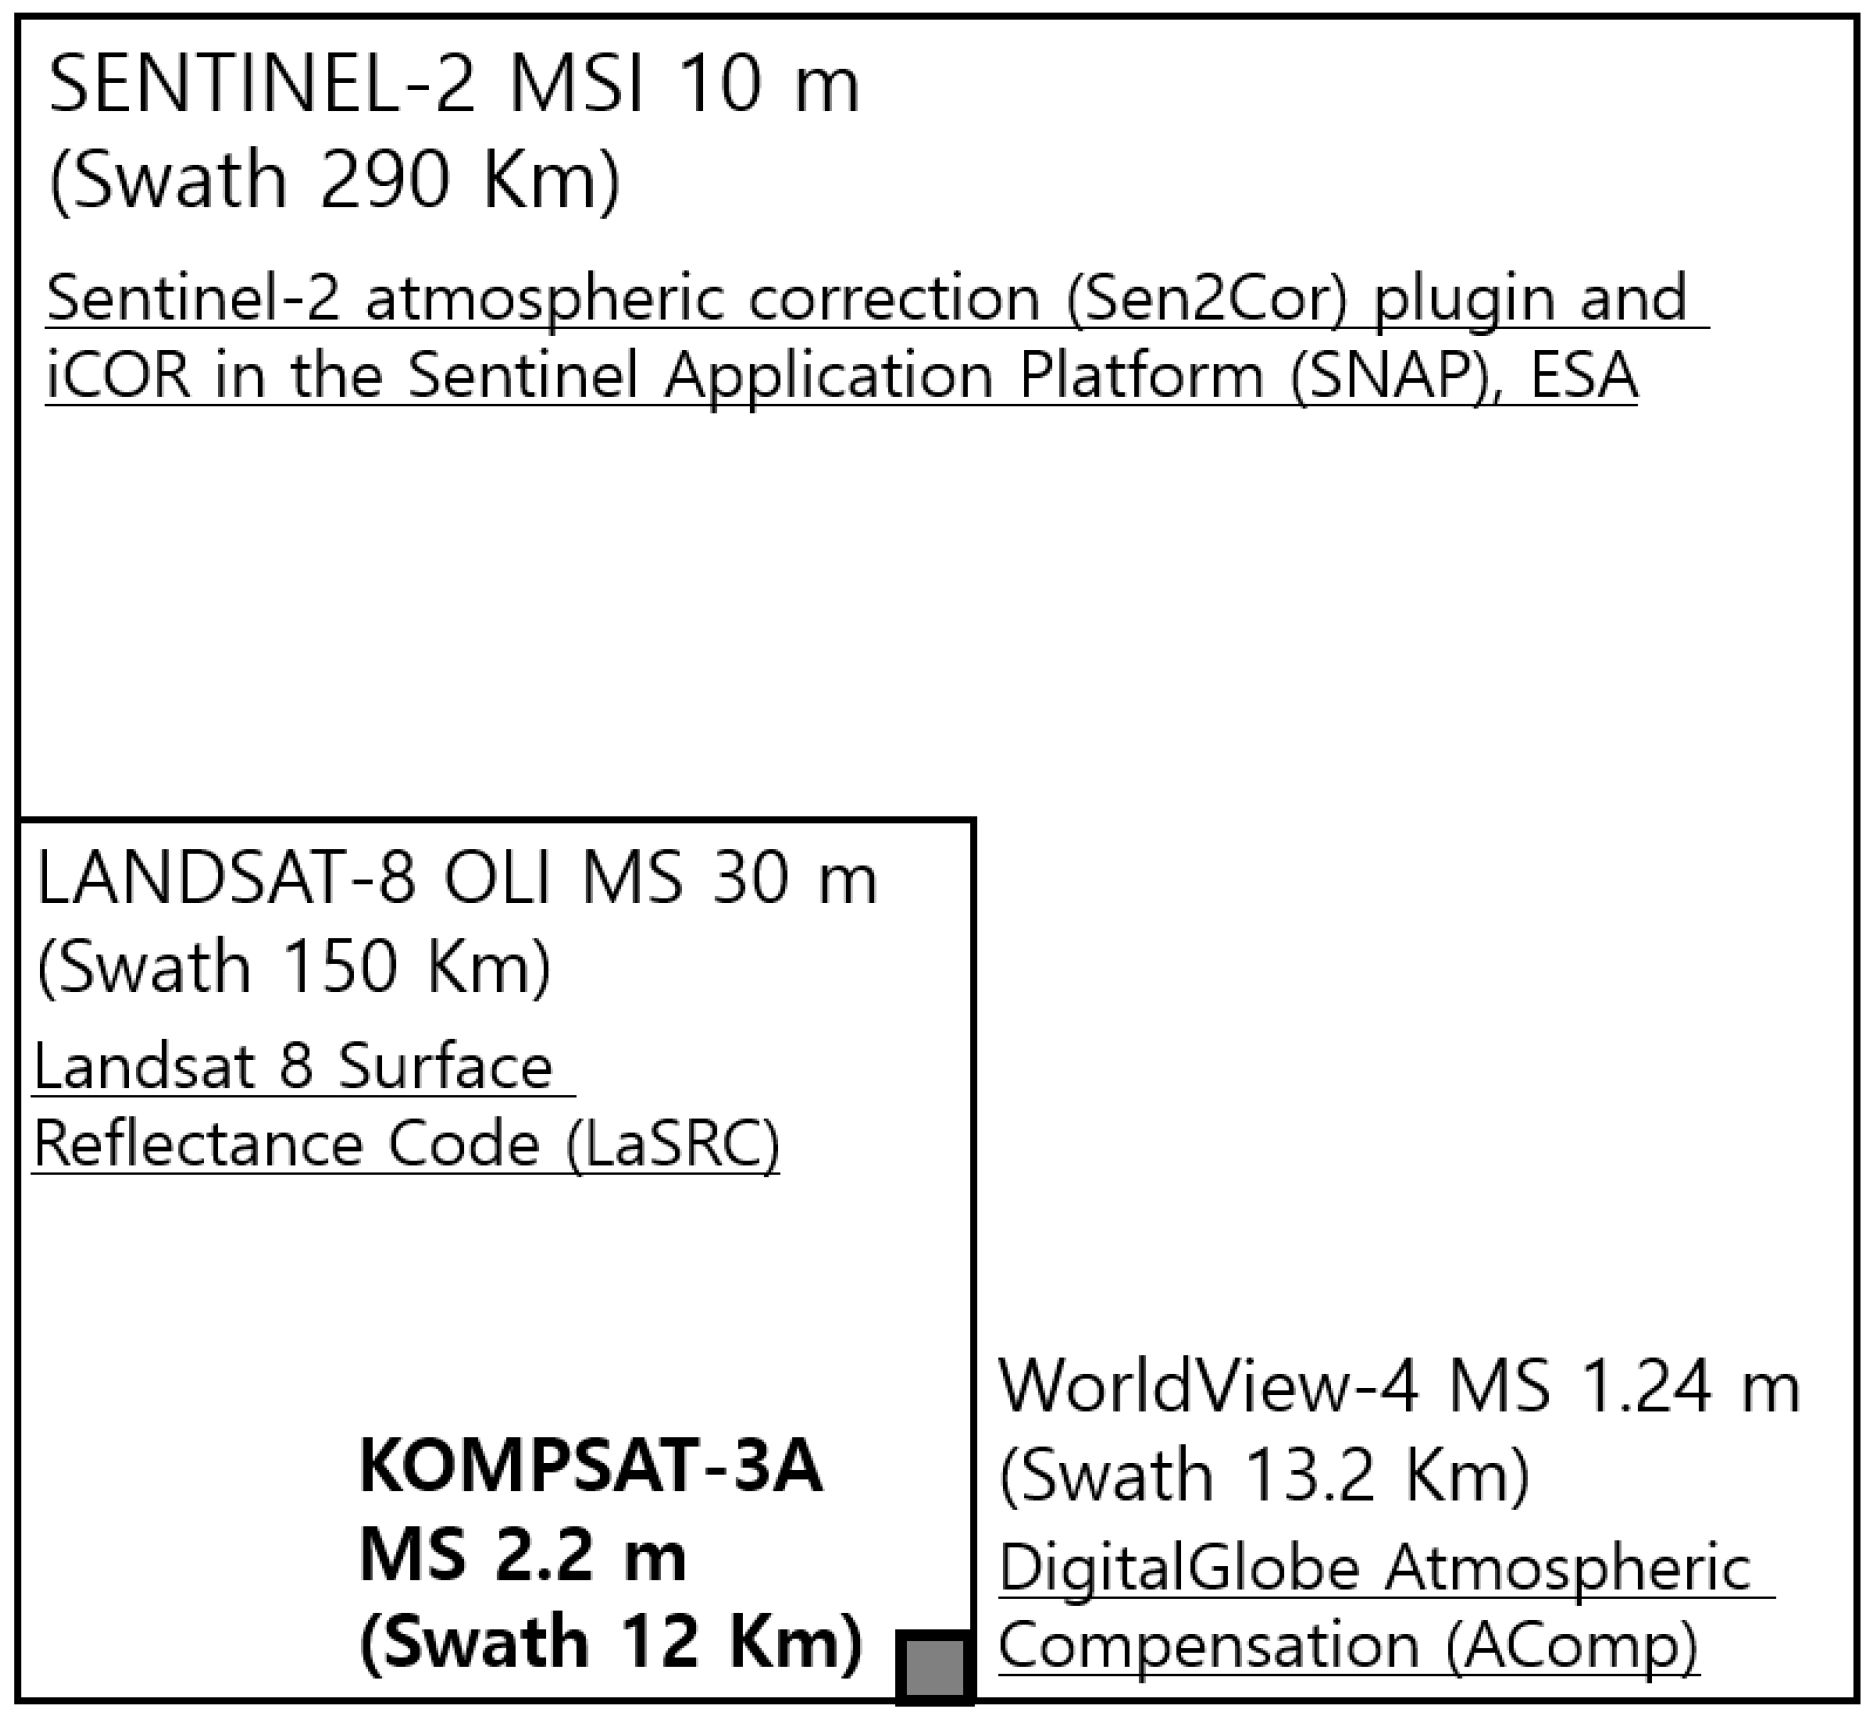
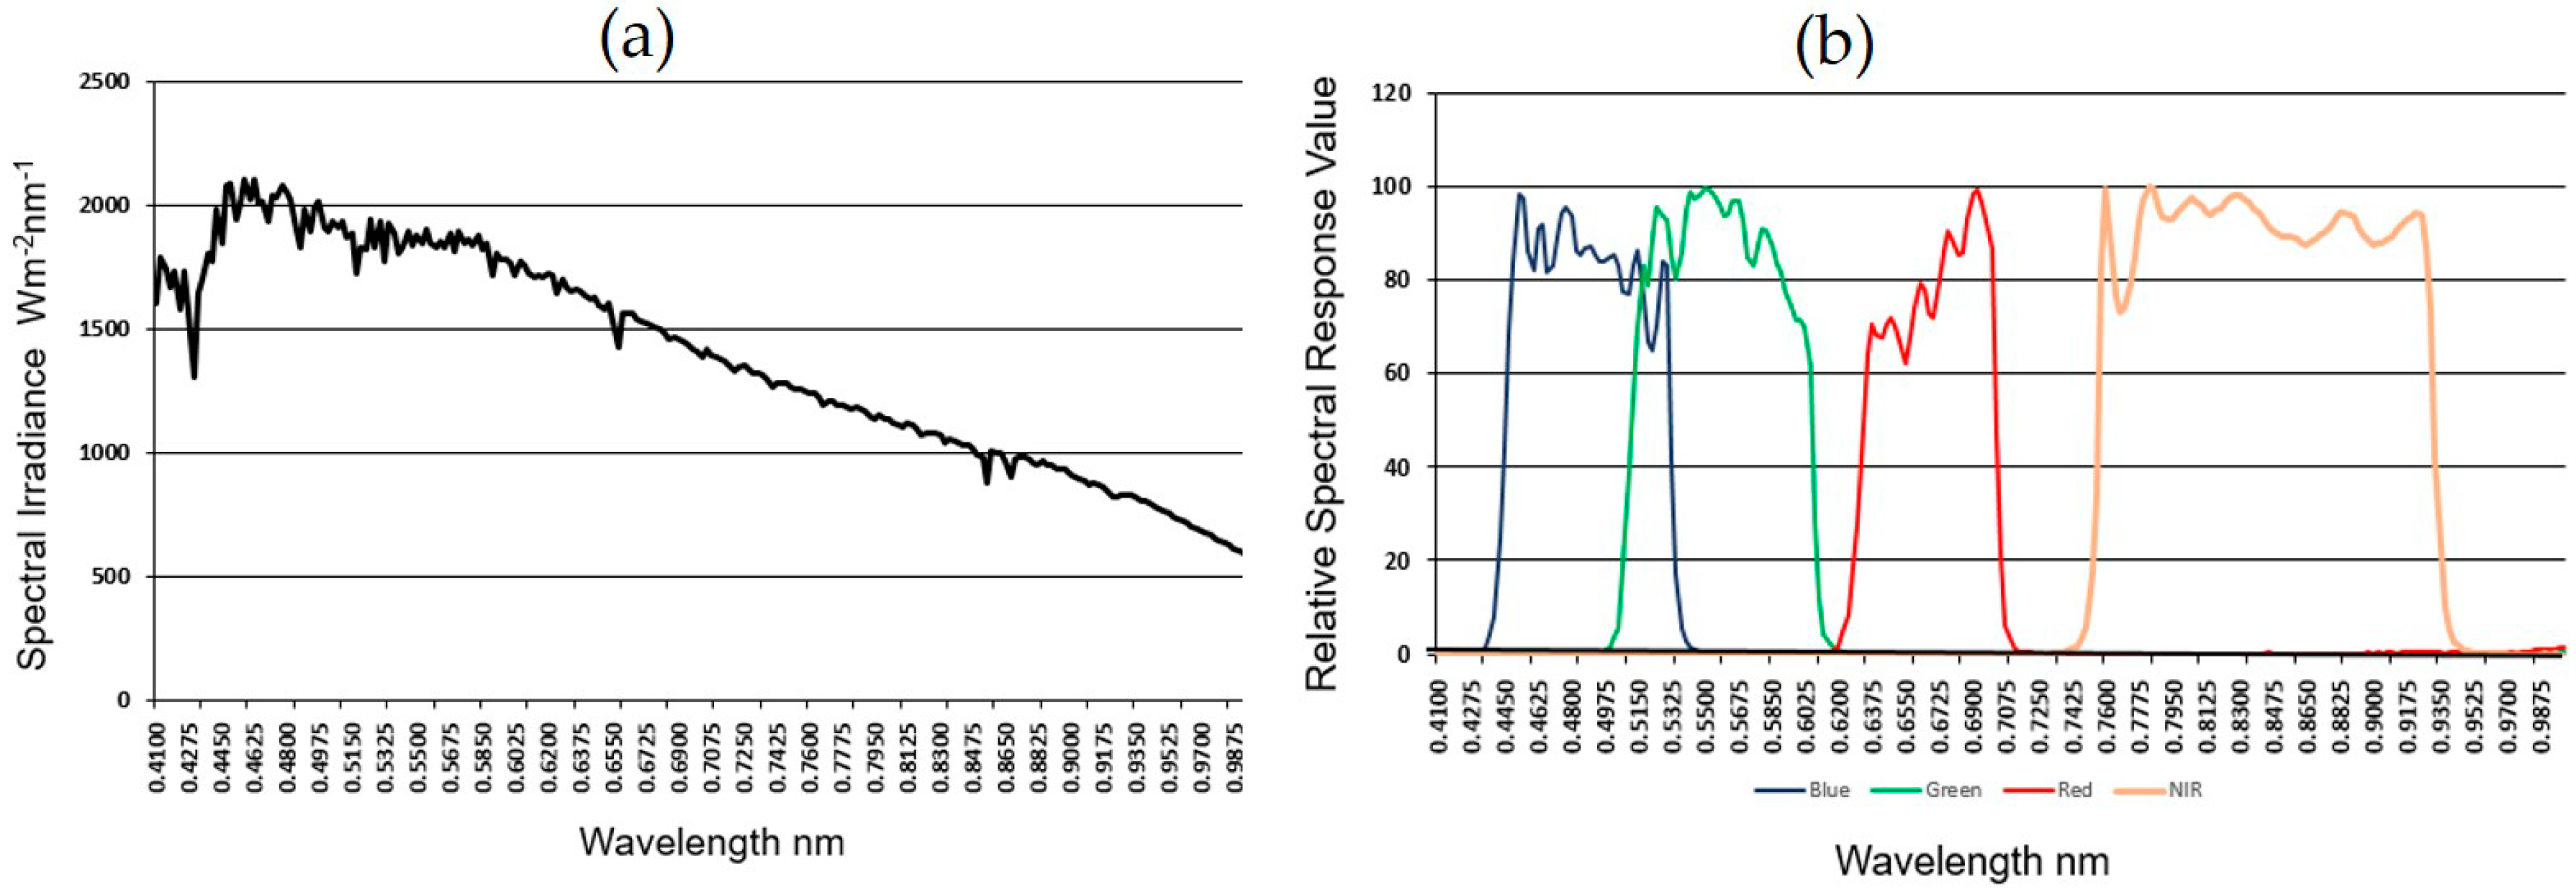
Figure 1 shows the types of optical satellite images and the spatial resolution of multispectral bands, swath width at the nadir, and atmospheric corrections for producing surface reflectance. The spectral band specification of KOMPSAT-3A is as follows: 450–900 µm for the panchromatic band, 450–520 µm for MS1 (blue), 520–600 µm for MS2 (green), 630–690 µm for MS3 (red), and 760–900 µm for MS4 (near infrared: NIR). The ground sample distance (GSD) at the nadir is 0.55 m for a panchromatic image, 2.2 m for multispectral bands, and 5.5 m for near infrared data. The radiometric resolution of data quantization is 14 bits. The swath width of KOMPSAT 3A is 12 km, and it is 15.4 times narrower than that of Landsat-8 OLI. Meanwhile, KOMPSAT-3 has the same spectral band specifications as KOMPSAT 3A, but the GSD for a panchromatic image and multispectral bands in the swath width of 15 km at the nadir is 0.7 m and 2.8 m, respectively. As for the four multi-spectral bands of DigitalGlobe WorldView-4 with a sensor resolution of 1.24 m and a swath width of 13.2 Km at the nadir, the wavelength widths for the blue band, green band, red band, and near infrared band are 450–510, 510–580, 655–690, and 780–920 µm, respectively. The panchromatic band with a spatial resolution of 0.31 m at the nadir has a wavelength width of 450–800 µm (
https://www.satimagingcorp.com/satellite-sensors/geoeye-2/). DigitalGlobe provides commercialized image products by AComp that support three radiometric correction methods: TOA reflectance, Rayleigh-only reflectance, and surface reflectance [
33]. Among them, surface reflectance compensates for atmospheric absorption and scattering phenomena and approximates what would be measured by a sensor held just above the surface without any alterations from the atmosphere. Of these three reflectance products, surface reflectance can be used for many kinds of application such as land use and cover analysis, time series evaluation, feature extraction, spectral matching, tonal balancing, and spectral accuracy evaluation.
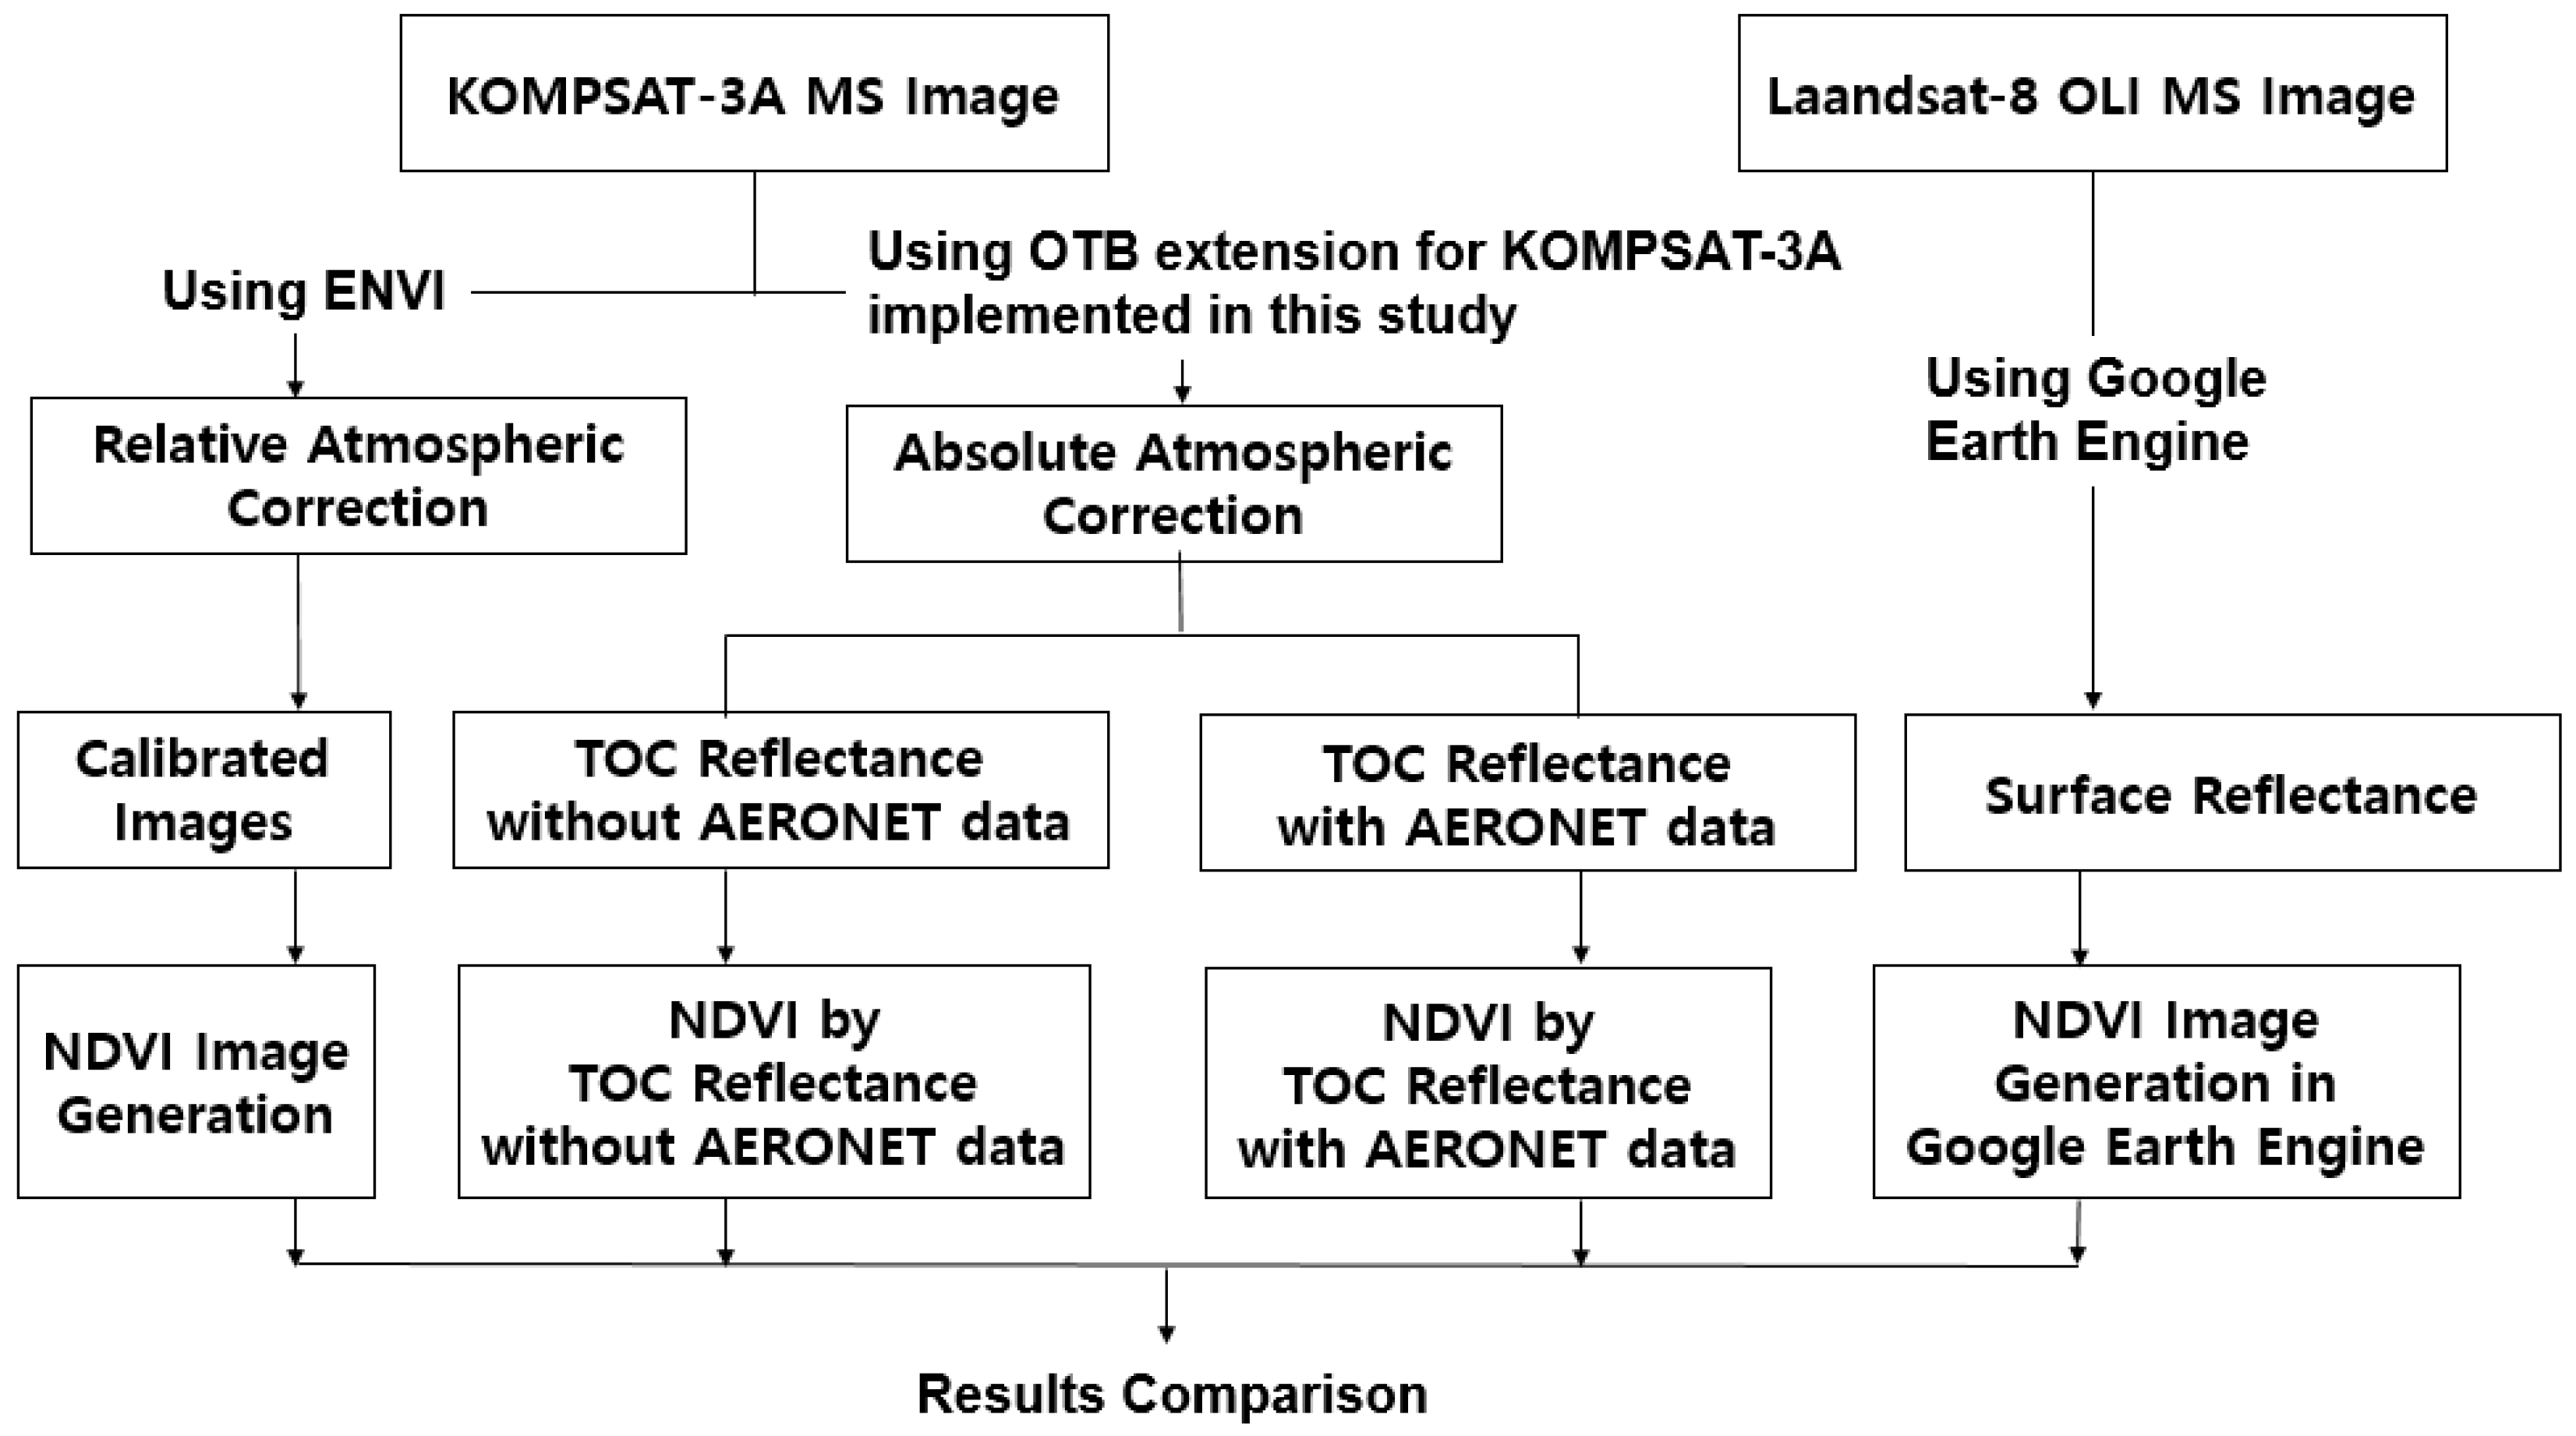
Figure 2 summarizes the workflow of this study. The OTB tool applied in this study was the OTB extension embedded in the sensor model, solar irradiation, and the relative spectral response function required for the atmospheric calibration of KOMPSAT-3A. An extension in a piece of software is a type of computer program that is meant to extend or add to what the base program is able to do. The tool implemented in this study is called OTB extension for KOMPSAT-3A, and it was rebuilt in the OTB environment, rather than being a plug-in inserted into it. This tool automatically reads input variables for atmospheric calibration from the images and applies them to produce TOA and TOC reflectance. Therefore, the entire source must be rebuilt, rather than simply being inserted.
4. Results and Discussion
Absolute atmospheric correction for high-resolution satellite images is a very important subject in terms of the value-added uses of images such as the commercial WorldView series, besides KOMPSAT-3A, and it is also important in terms of the quality control of the satellite images concerning calibration and validation. Its demand continues to grow due to the advent of new multi-spectral high-resolution images from the private and public sectors. The TOA and TOC reflection images are important products obtained from the absolute atmospheric correction of satellite images. However, most proprietary software does not provide an absolute atmospheric correction module for all kinds of high-resolution image, so relative atmospheric correction such as the DOS scheme is inevitable when users want to use a certain specific sensor image in their applications.
Although NDVI, which was applied in this study, is a simple computation method, the results vary widely depending on the data used. Absolute atmospheric correction produces a constant result, whereas relative atmospheric corrections could be inconsistent because the input values may vary. In addition, absolute atmospheric correction can standardize the processing procedures, but with relative atmospheric corrections, the results can be affected by the user’s experience and understanding level in terms of multi-spectral bands.
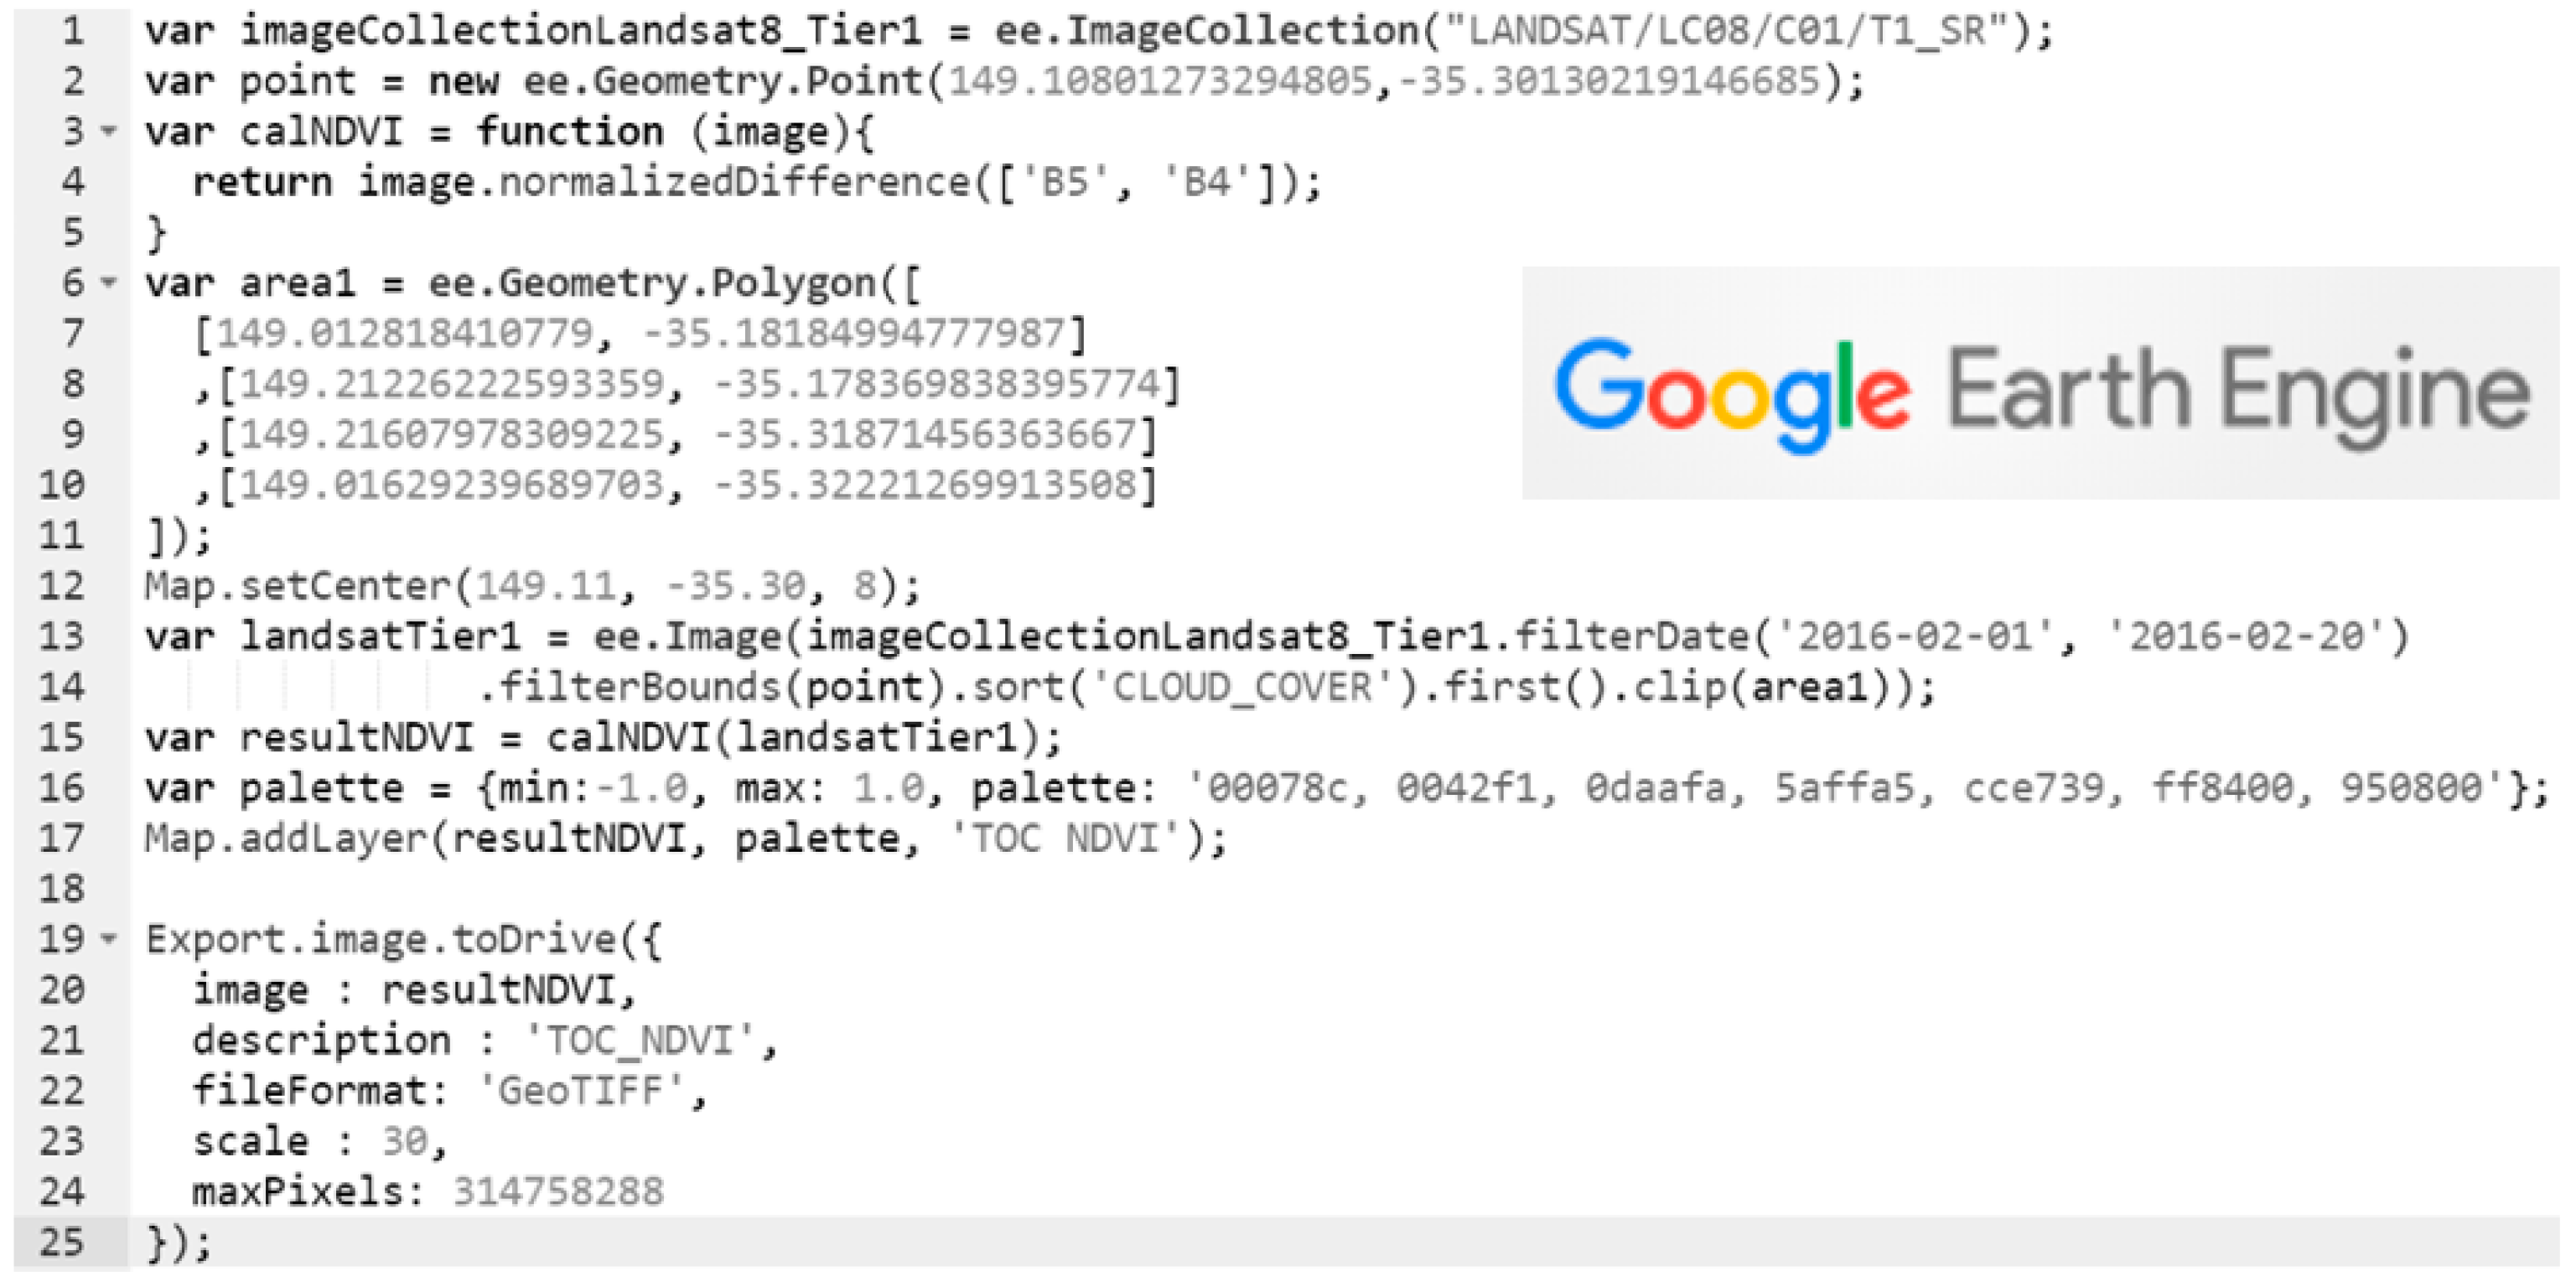
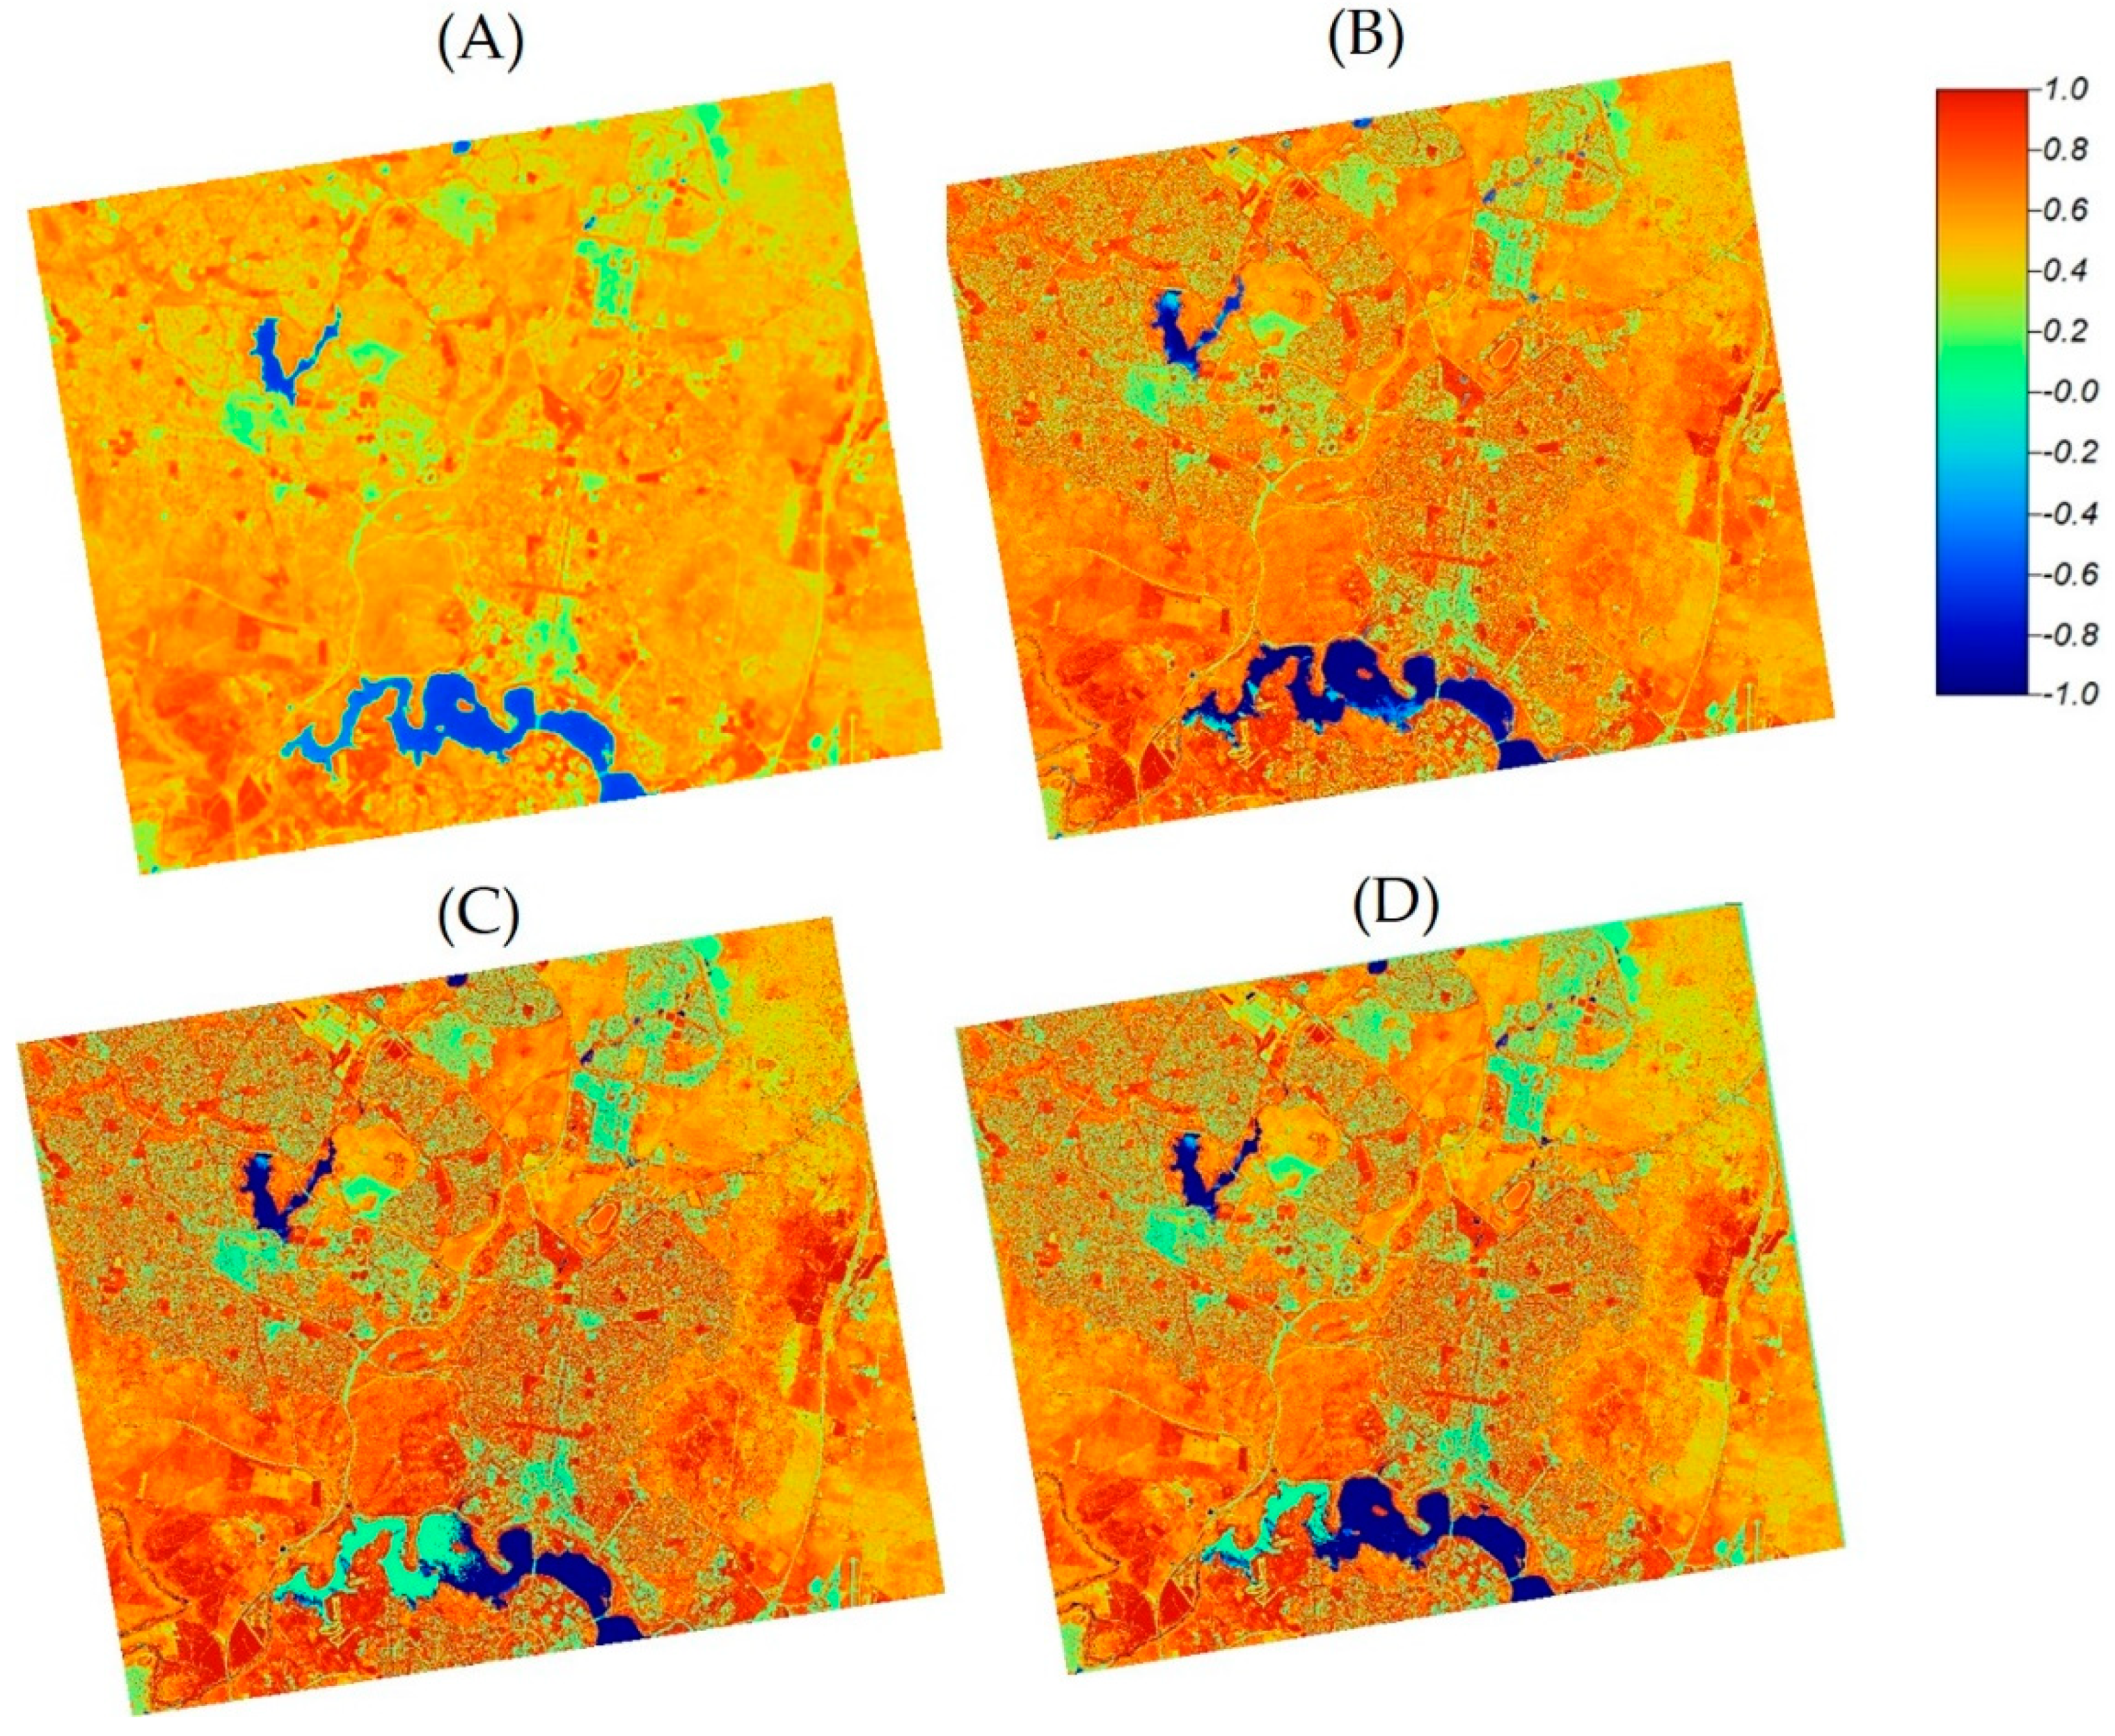
Figure 7 shows four cases of NDVI computation: the difference among Landsat-8 surface reflectance tier 1 in the GEE, the DOS-based reflectance produced with the ROI designated as “a” in the image in
Figure 5, and two TOC reflectance results obtained using the OTB extension for KOMPSAT-3A.
Figure 7A shows the resultant image from the GEE. This result of Landsat-8 OLI is quite different from other cases of KOMPSAT-3A. The Landsat-8 surface reflectance tier 1 of the GEE was generated from LaSRC by the USGS, whereas the TOC reflectance of KOMPSAT-3A was taken from the OTB extension. The DOS method often sets the ROI using subjective experience, so the results may vary depending on which region is selected, which is a relative atmospheric correction. The NDVI was conducted using DOS-based and TOC reflectance data, as displayed in
Figure 7B. Because the sensor resolution differs between Landsat and KOMPSAT-3A, the number of pixels is not identical. The number of pixels in
Figure 7A is 465 × 379, and that of other the results shown in
Figure 7B–D is 6351 × 5171.
For TOC reflectance, the two datasets shown in
Figure 7C,D were applied for NDVI calculation.
Figure 7C exhibits the results obtained using the red and near infrared bands of TOC reflectance without the AERONET data, while
Figure 7D shows the TOC reflectance with the AERONET data. This experiment was performed because AERONET observation stations are not always within the coverage range of imagery. In the module implemented for generating TOC reflectance, it is not a mandatory input dataset. The distinguishing features among the three products were revealed by visual interpretation in the range of [−1,1]. The negative values close to −1.0 in NDVI correspond to water bodies, while values from −0.1 to 0.1 (close to zero) are generally interpreted as barren areas.
Low positive values represent shrubs and grassland regions, whereas high positive values approaching +1.0 reflect temperate and tropical forests. To represent these features analytically, the results were partitioned into three ranges, namely, −1.0 to 0.1, 0.1 to 0.6, and 0.6 to 1.0, by a density slicing scheme, as shown in
Figure 7. Density slicing is a reclassification scheme where a raster image with continuous values is converted into a series of intervals, slices, or classes, and different colors are assigned to each slice or class as group variations with their legend.
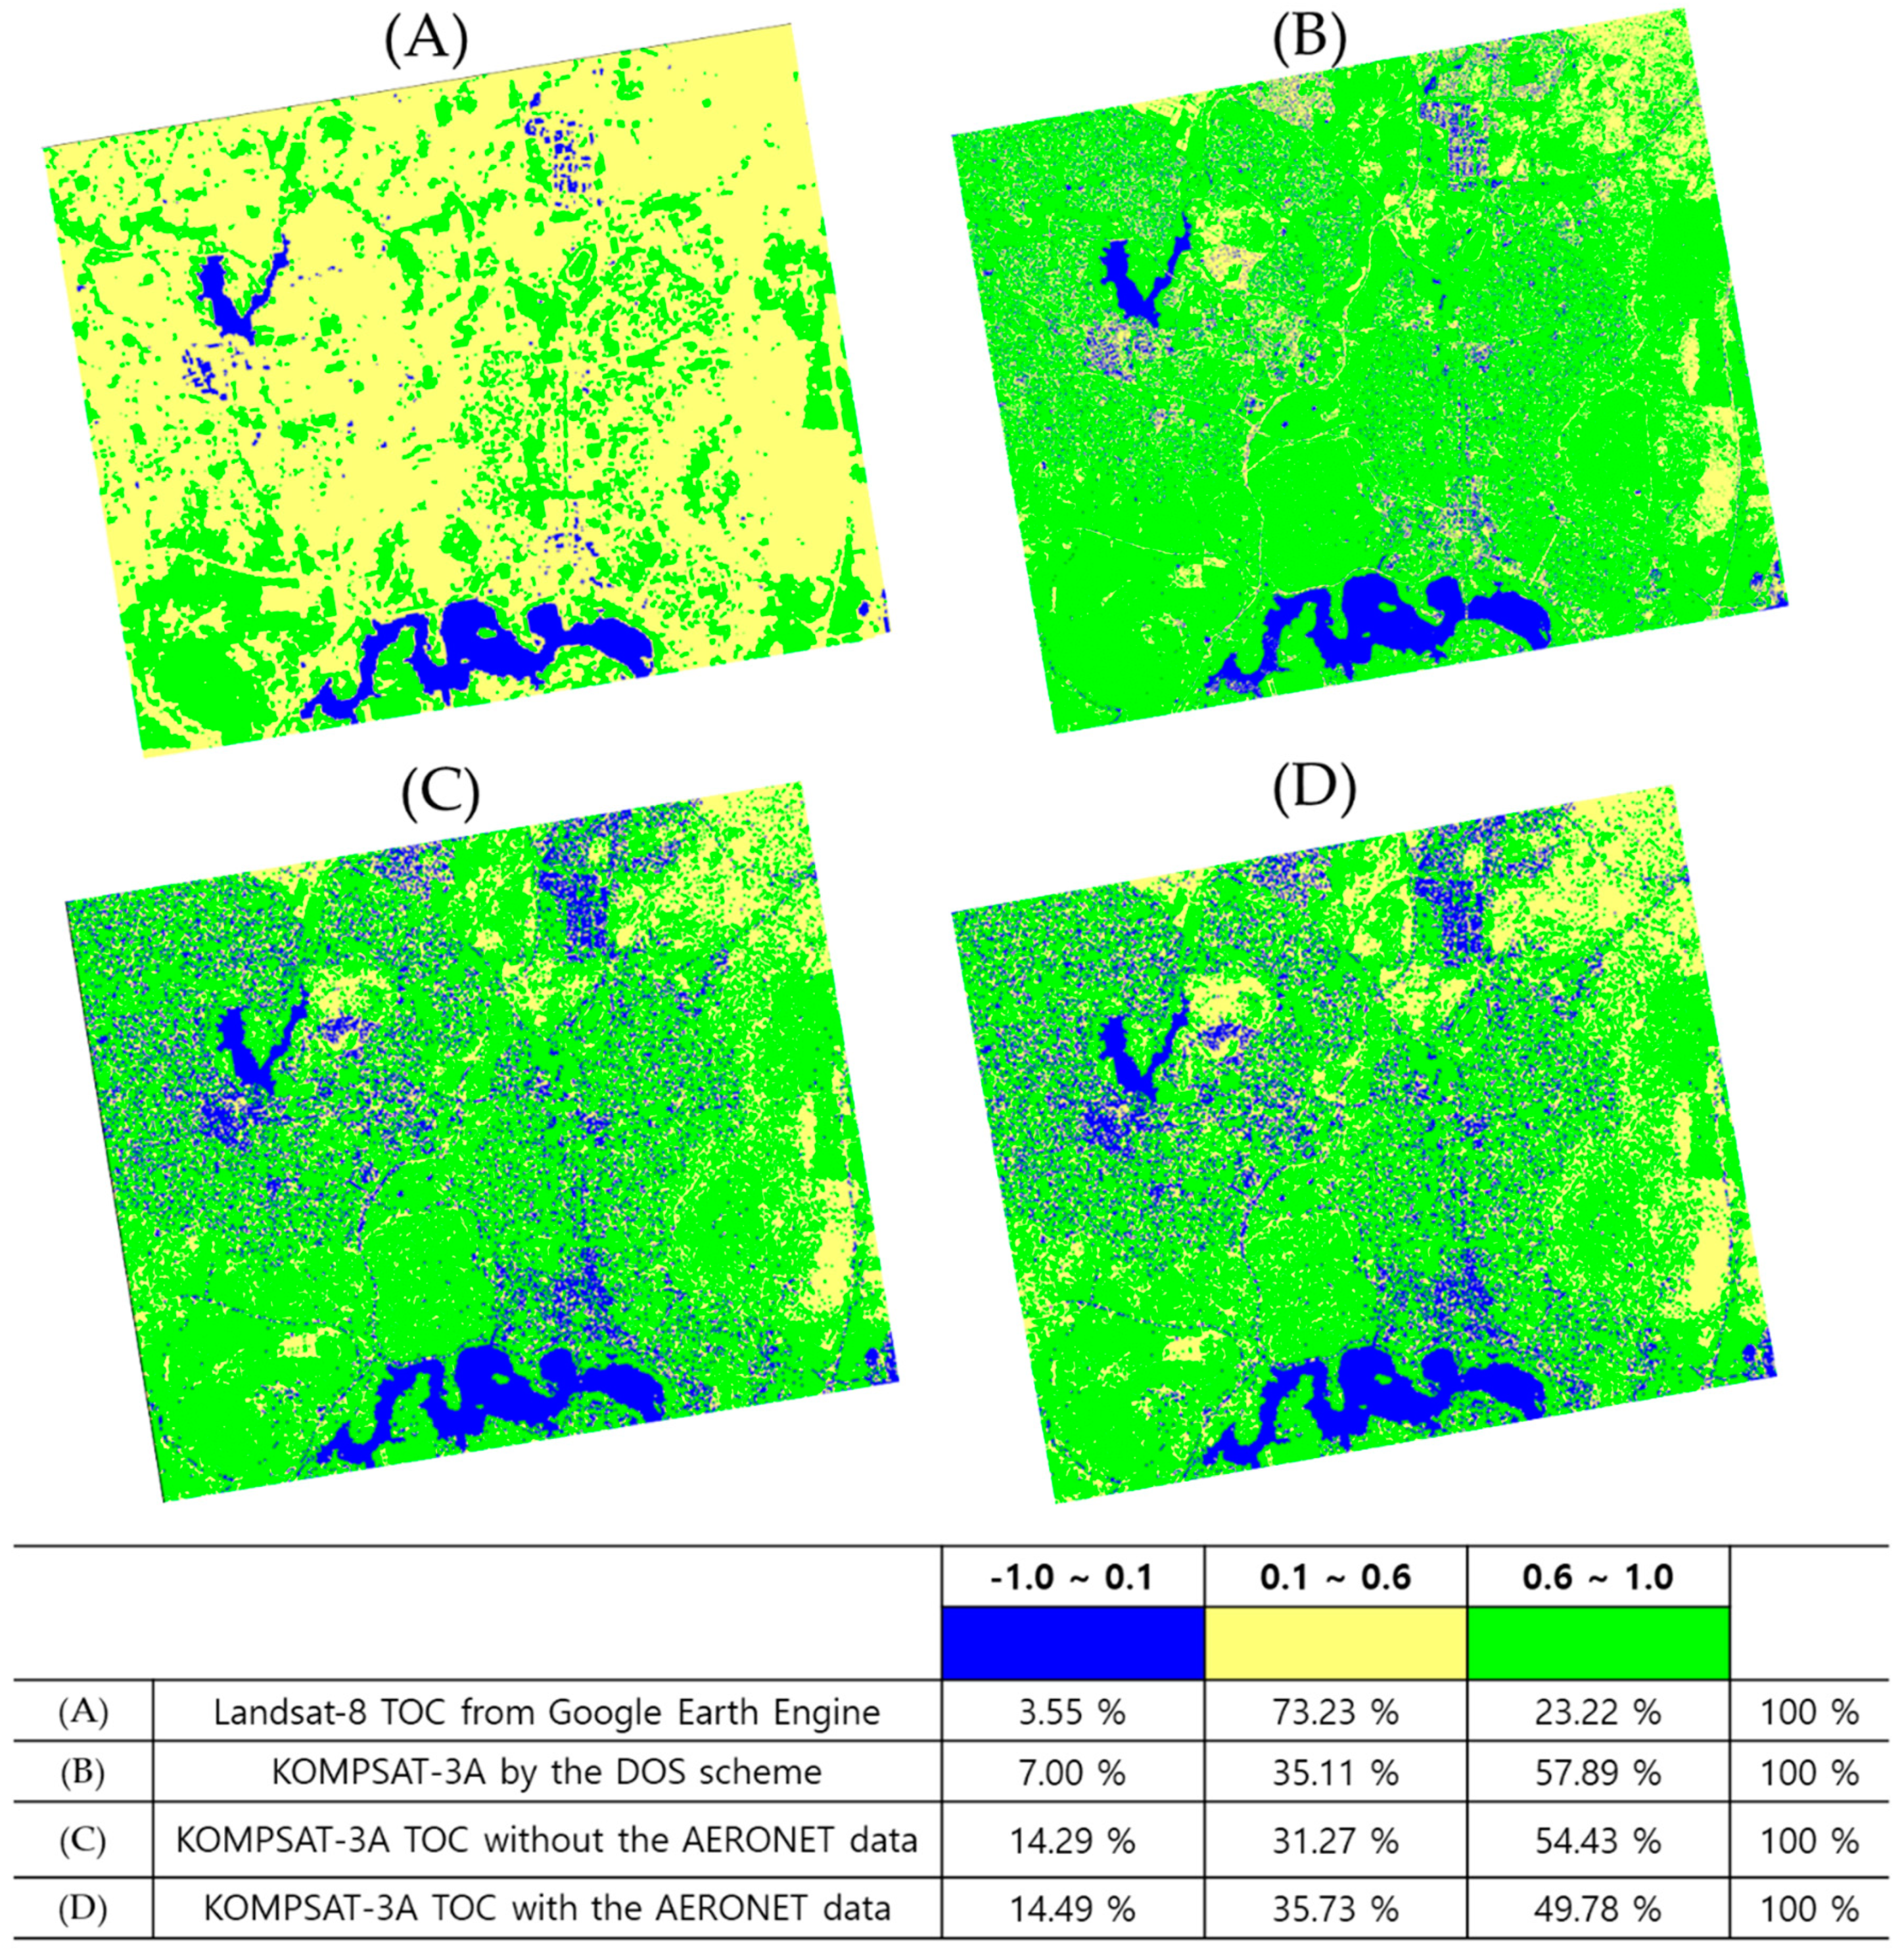
The comparison results of the NDVI of four classes are represented by density slicing with a percentage of the number of pixels in each class.
Figure 8A is the result of Landsat-8 surface reflectance tier 1 in the GEE.
Figure 8B–D show DOS-based reflectance, TOC reflectance without the AERONET data, and TOC reflectance with the AERONET data, respectively. These results are more clearly indicative of the differences, compared to the results shown in
Figure 7. In particular, visual interpretation shows that the distribution of
Figure 8A, which is concentrated in the middle class in range 0.1 to 0.6, is different from that of the other three cases, which represent the high vegetated trend over 0.6. In detail, the results of the DOS-based corrections are different from those of the TOC-based scheme. Furthermore, the processing results of TOC reflection with or without the AERONET data differ, showing the same proportion at the low class of −1.0 to 0.1, but reveal a difference of approximately ±4.5 percentage points in the upper two classes. This extension treats the use of the AERONET data as optional. In some cases, these data may not be applicable and may not be influenced when those of the AERONET measurement site which is far away are used. This case study showed that the application of these data affects the results. The suitability of the results for NDVI can be verified by experimenting with in situ data in the study area.
The GEE is an easy-to-handle tool for obtaining wide-area NDVI, but it is not suitable for precise analyses, such as analysis of urban forestry, because the data used are medium-resolution. To date, there has been no example of the ARD building of high-resolution images such as the WorldView series. The Committee on Earth Observation Satellites (CEOS) established the concept of CEOS Analysis Ready Data for Land (CARD4L) product types and their framework, to be content with the practical demand for such satellite data [
44]. However, it does not provide the ARD guidelines for producers and users of high-resolution EO images yet. The USGS established a Landsat ARD database containing data of different levels in the Earth Explorer [
45] to make it possible to use satellite images for monitoring or time series landscape analysis purposes without having to perform calibration or pre-processing. This Landsat ARD database partitions the territory of a country into a constant grid structure associated with a projection coordinate system and provides surface reflection images using atmospheric correction. The ARD products are time-series stacks of EO imagery prepared for a user to apply without pre-processing the image data. Therefore, for NDVI results at the regional scale, it is possible to perform pre-processing on an individual image and then aggregate the data into a mosaic image covering that region. It is necessary to calculate other vegetation indices as well as NDVI and estimate the results, since this is the first NDVI result using the TOC reflectance of a KOMPSAT-3A image.
The use of AERONET data as the input data for TOC reflectance computation was expected to be important for the results. This study shows this effect through NDVI calculations. The NDVI is a quantitative index with a high actual utilization value, although it is calculated by a simple formula using the red and near infrared bands. It needs to analyze the difference between the blue and green bands. To apply high-resolution satellite images to big data or deep learning, high performance processing for a huge dataset volume is the main topic, but it is also important to analyze the applicability and suitability of individually pre-processed data. The next step of this work is to compute the Atmospherically Resistant Vegetation Index (ARVI) [
46] using three bands—red, near infrared, and blue—to discover other aspects and effects of high-resolution multispectral bands for absolute atmospheric corrections.
5. Conclusions
Although atmospheric correction is a classic subject of research in satellite remote sensing, it is still being researched and developed, because of its practical importance in increasing the value of data. The surface reflection result is an important product obtained from the absolute atmospheric correction of satellite images. These data are important for establishing an ARD database. However, tools to extract TOC reflectance data from KOMPSAT-3A images are unavailable. For these functions, open-source tools are yet to be developed or published. In this study, an atmospheric correction extension module in OTB open-source software was implemented. Treating an important pre-processing function, absolute atmospheric correction, as open-source provides a huge economic advantage in terms of the large volume of high-resolution satellite image processing possible, because a base engine software can be customized in the way the developers and operators want it to be. For other high-resolution satellite sensor models, OTB extensions are also possible.
The NDVI results of this study are the first example computed using the surface reflectance obtained from the absolute atmospheric correction of a KOMPSAT-3A image. Therefore, quantitative comparative studies with different sensors or conditions are required. This study focused on the results of the use of AERONET data, among many cases. The NDVI results using TOC reflectance with or without AERONET data were considerably different from those obtained with the DOS scheme, a kind of relative atmospheric correction, and the Landsat-8 surface reflectance of the GEE. The GEE NDVI result was generated at different resolutions and with different applied algorithms, compared with KOMPSAT-3A. If AERONET data are available for the target area, then the aerosol data file is read directly in the newly implemented module. Although it was demonstrated that AERONET data are optional for NDVI evaluation, the results were affected by the inclusion of the data. The TOC reflectance results with the AERONET data containing atmospheric physical variables are considered to be more practical estimates compared with those obtained from relative methods or those lacking physical variables. Further experiments on various quantitative vegetation indices such as the ARVI using TOC reflectance will be conducted in future studies. It is expected that the need for computerized schemes to extract surface reflectance data will likely increase because of the practical demand for precise analyses using high-resolution multispectral images.


