Article

Quantifying the Characteristics of the Local Urban Environment through Geotagged Flickr Photographs and Image Recognition

Geographic Data Science Lab, Department of Geography and Planning, University of Liverpool, Liverpool L69 7ZT, UK
*
Author to whom correspondence should be addressed.
ISPRS Int. J. Geo-Inf. 2020, 9(4), 264; https://0-doi-org.brum.beds.ac.uk/10.3390/ijgi9040264
Submission received: 17 January 2020 / Revised: 8 March 2020 / Accepted: 17 April 2020 / Published: 19 April 2020
(This article belongs to the Special Issue Deep Learning and Computer Vision for GeoInformation Sciences)

Abstract

:
Urban environments play a crucial role in the design, planning, and management of cities. Recently, as the urban population expands, the ways in which humans interact with their surroundings has evolved, presenting a dynamic distribution in space and time locally and frequently. Therefore, how to better understand the local urban environment and differentiate varying preferences for urban areas has been a big challenge for policymakers. This study leverages geotagged Flickr photographs to quantify characteristics of varying urban areas and exploit the dynamics of areas where more people assemble. An advanced image recognition model is used to extract features from large numbers of images in Inner London within the period 2013–2015. After the integration of characteristics, a series of visualisation techniques are utilised to explore the characteristic differences and their dynamics. We find that urban areas with higher population densities cover more iconic landmarks and leisure zones, while others are more related to daily life scenes. The dynamic results demonstrate that season determines human preferences for travel modes and activity modes. Our study expands the previous literature on the integration of image recognition method and urban perception analytics and provides new insights for stakeholders, who can use these findings as vital evidence for decision making.

1. Introduction

Urban environments play a crucial role in decision making in terms of the design, planning, and management of cities, which are closely linked with urban functions and their ecosystems. From a social perspective, understanding how humans experience these environments is important for improving urban functions. For example, areas with a large population density and exposure require more attention and in-depth strategies. In recent years, as the urban population has expanded, the ways in which humans interact with their surroundings have evolved [1]. The distribution of the population has changed over space and time, locally and frequently.
Traditional approaches to understanding the urban environment have relied on survey data. These approaches can be used to characterise urban morphology, but they can generate gaps in data collection and data quality that are costly and problematic [2]. Although recently emerging street-level imagery data can overcome these gaps, these data are mostly from Google’s own street view fleets, which rarely capture human perceptions of the urban environment. Therefore, challenges remain for policymakers to plan and manage urban environments. In the past few decades, improvements in location technology, such as the global positioning system (GPS), have produced plenty of georeferenced urban data sources [3], such as social media data and mobile data. In addition to geographic information, many of these new forms of data also have other attributes, such as time, user profiles, user evaluation, or user photographs, providing great opportunities for research in social and urban domains [4]. Among these attributes, photographs offer a wealth of information about the environment that can be analysed to determine why and how humans interact with urban areas [5]. However, previous research on the content analysis of photographs is relatively rare [6,7,8,9].
Recently, thanks to advances in computer vision and deep learning techniques, especially improvements in convolutional neural network (CNN) performance, images have gradually been proven to be powerful for investigating the visual perception of our environment [10,11,12]. Since the early 2000s, CNNs have been applied to image recognition but were neglected until a big success during an ImageNet competition in 2012 [13]. CNNs have since become the dominant method for all image recognition tasks.
Drawing on the limited research of dynamic urban perceptions and the ongoing improvements in image recognition performance, this study focuses on urban areas of interest (UAOIs) and their outer urban environments. A UAOI is a perceptual space captured by the social morphology of the city, which reflects the real interests of large numbers of people and may emerge and disappear at different times [9,14]. A UAOI is not only a perceived region of a place but an outcome of human interactions with the environment. More importantly, many geotagged photographs that represent the physical appearances of UAOIs are available. As such, research on UAOIs offers a way to explore the connections between human cognition and digitally and visually represented geographies.
The objective of this study is to quantitatively formalise and understand urban areas through geotagged images. Not only do we analyse photographic metadata, but we also exploit information from the images themselves. Additionally, dynamic analysis is considered, which bridges a research gap. The following research questions are proposed: (1) “Why do people gather at certain areas all year or at certain times?”, (2) “Is there any difference between UAOIs and other areas?”, and (3) “What are the visual characteristics of UAOIs over time?”. We first extract the UAOIs in Inner London through a method framework proposed by [9]; then, an advanced and novel CNN model called Places365-CNN is utilised to extract features inside and outside the UAOIs. These features are then integrated to explore the regular characteristics of the urban environment. Finally, a finer temporal scale is applied to understand the dynamic characteristics of the UAOIs through a heatmap based on a z-score.
The structure of this paper is organised as follows. The next section discusses the past and recent work using geotagged images in urban analytics, as well as common techniques of image recognition in this domain. Section 3 introduces the methods used to characterise UAOIs, including data description, the CNN model, characteristic integration, z-score standardisation, and heatmap analysis. This is followed by an interpretation and discussion of the results of the overall and dynamic characteristics of UAOIs. Finally, Section 5 concludes the paper and suggests future extensions to this research.

2. Literature Review

2.1. Previous Studies on Geotagged Images from Social Media

In earlier research, geotagged images from photo sharing social media websites like Flickr, Instagram, and Picasa have been widely utilised to address a series of urban issues. Previous research includes proving the utility of Flickr data in mapping the urban environment [6,15], analysing user behaviour [16,17], facilitating event detection [7,18,19], travel route recommendations [20,21], places/areas of interest identification [9,22,23], and cultural ecosystem analysis [24]. However, certain information in geotagged photographs is currently underused, such as the content of photographs that were taken in urban areas. The density of photographs can only reflect the popularity of a place or an area but cannot demonstrate the reasons behind those patterns. It is thus necessary to understand if the photographs are relevant to the built environment and what aspects of the city are of greatest interest to people in a specific area [25]. Many studies have used the “tags” attribute of photographs to estimate public interest or capture large-scale events [6,7,18,19]. However, these studies have ignored the key attributes (i.e., photographs) of geotagged Flickr photographs. Furthermore, these tags may not be related to the photographs themselves due to their heterogeneity [26], while several users add no tags at all.

2.2. Image Recognition and Urban Analytics

Due to the great improvements to computer vision and deep learning techniques in recent years, a growing number of works have attempted to apply image recognition techniques to understand urban environments, mostly relying on Google Street View (GSV) images. Some harnessed GSV images to measure the perception of safety, class, and uniqueness, thus creating reproducible quantitative measures of urban perceptions and characterising the inequality of different cities [27]. Law and his colleagues combined GSV images with 3D-models generated from the GSV images and used a CNN to classify the street frontages of a front-facing street image in Greater London [28]. Similarly, ref. [29] exploited GSV images to predict the visual quality of the urban environment by comparing ratings based on a survey to train an image classification ConvNet model to predict a façade’s quality scale. Some studies have combined GSV images with other imagery datasets to extract parcel features for urban land use classification [11,30]. Naik and his colleagues used an image segmentation approach and support vector regression to monitor neighbourhood changes and correlate socioeconomic characteristics to uncover predictors for the improvement of physical appearance [10]. More recent research developed a deep CNN model, a hierarchical urban forest index, to quantify the amount of vegetation visible based on street-level imagery [2].
However, GSV is not the only image source that can be used to explore the urban environment. Alternatives have also appeared in recent urban studies. For example, images from Flickr, the most prevalent online photograph sharing website, were proven to be usable by [31,32] for land cover classification and validation. Flickr was also exploited in the work of [33], who developed a novel framework for ecosystem service assessment using Google Cloud Vision and hierarchical clustering to analyse the contents of Flickr photographs automatically. Apart from Flickr, “Place Pulse 1.0”, a crowdsourced image dataset created by [27], was used to predict the human judgement of a streetscape’s safety [34]. The results showed that geotagged imagery combined with neural networks can be used to quantify urban perceptions at a global scale. Other novel image datasets, such as “Scenic-or-not”, an online game that crowdsources the ratings of the beauty of geotagged outdoor images, was used to quantify the beauty of outdoor places in the UK through Places365-CNN models [35].
All of these studies demonstrate that geotagged images, in collaboration with image recognition techniques in computer vision, can enable a deeper understanding of our built environments. Meanwhile, a variety of challenges have emerged in these applications. Most studies are based on the global urban environment, while finer urban areas are rarely involved. More importantly, few efforts have associated image recognition with urban change [10,36]. Nevertheless, urban dynamics play an important role in understanding cities, especially for the perceived urban spaces that reflect human interactions with the built environment. Therefore, this study will bridge this research gap to quantify the characteristics of local urban built environments (i.e., UAOIs in this paper) and explore their dynamic patterns.

2.3. Recent Approaches to Image Recognition

For about a decade, there have been improvements in the techniques used for image recognition. Some of the most notable techniques include image classification, object detection, and image segmentation. Image classification refers to labelling a photograph based on its content from a fixed set of categories [37]. Image classification gained significant attention when the “AlexNet” model became the winner of the ImageNet Large Scale Visual Recognition Challenge 2012 (ILSVRC-2012), which was a breakthrough that significantly reduced the error rate of images to 15.3% [38]. ILSVRC is an annual contest that aims to automatically estimate the content of photographs from a subset of a large hand-labelled ImageNet dataset (1000 object categories for training and validation). Since then, an increasing number of pre-trained Convolutional Neural Network (CNN) architectures/models have been proposed for the contest, such as GoogleNet, ResNet-152, Inception-v4, etc., which have constantly improved the accuracy of image classification [39,40,41]. Several studies in recent years have used image classification to resolve empirical problems—for example, to retrain one’s own image dataset based on pre-trained architecture for prediction [28,29] or to extract features from images through a pre-trained model [32,33,35]. By manually labelling data or using ready-made training data, an image can be identified by a single attribute/label or by multiple features.
More sophisticated techniques include object detection and image segmentation. Compared to image classification, these two methods are able to recognise and locate multiple objects from an image. The former method identifies different sub-images, drawing a bounding box around a recognised object, while the latter partitions an image into objects or parts present with accurate boundaries [42,43]. Recent approaches that have gained wide popularity include Faster R-CNN (Region Convolutional Neural Network) [44] and YOLO (You Only Look Once) [45] for object detection and Mask R-CNN [41] for image segmentation. Unlike image classification tasks that primarily use the ImageNet dataset for training, most object detection and image segmentation tasks are trained on COCO (Common Objects in Context). COCO is a large-scale image dataset, with 80 categories used for object detection and segmentation [46]. These categories mainly include everyday objects, such as vehicles, people, and a few animals. These data have been widely applied in pose estimation [47], medical imaging [48], real-time video surveillance [49], etc. [10].
Considering the suitability and availability of these approaches, a recently introduced and scene-related image classification model, Places365 CNN [50], is used in our study. Compared to other pre-trained CNN models, Places365 CNN corresponds to our motivation to identify scene attributes from a built environment, while other object detection or segmentation models are related to office furniture, vehicles, and animals. More importantly, this model is freely available and well documented [50] but has been rarely used in previous urban analytics [35].

3. Methods

In the following section, we introduce the Flickr data, study area, and UAOI extraction and subsequently characterise the features of the UAOIs and the outer areas through an image classification model. In addition, a finer time dimension is included to further explore the dynamic characteristics of UAOIs.

3.1. Data and UAOI Extraction

Data were collected from Greater London, as Greater London is the capital of, and the largest city in, the United Kingdom, with a population of over 8 million, according to the latest 2011 census. Furthermore, the raw data show that Greater London has a larger volume of geotagged Flickr photographs than many other cities. In particular, Inner London [51], the interior part of Greater London, is used for characterisation, as a large volume of Flickr photographs are available from Inner London over a variety of years. Figure 1 demonstrates the spatial density of the photographs in Inner London and Greater London visualised by kernel density estimation (KDE) [52].
Flickr is an online photograph management and sharing website, where public photographs uploaded by users can be requested and downloaded from its public application programming interface (API, https://www.flickr.com/services/api/). The scale of Flickr is extensive, with 122 million users and over 10 billion photographs as of 2016, with a large degree of penetration [53]. Unlike commonly used geotagged GSV images that are not real-time [54], Flickr image data are accessible at any time and have been available since 2004, making it feasible to investigate the dynamic characteristics of UAOIs in a finer time dimension [9]. Furthermore, the locations of Flickr images result from human choices and are a representation of human interactions with the built environment. However, photographs are captured in a biased way, as the aspects of the urban environment rely on how populations interact with that environment. As such, the representation of Flickr images is skewed and not necessarily realistic. This warrants caution when drawing conclusions. Nevertheless, we argue that Flickr image data are still meaningful for our study due to their embodiment of human perceptions of the built environment and flexibility in the time dimension.
The first two stages of data pre-processing and UAOI extraction are based on the framework of [9]. All geotagged Flickr metadata uploaded within Inner London have been collected through a bounding box, with a time span from the first day of 2013 to the last day of 2015. The attributes of each data record include geographic coordinates, the capture times of the photographs, user IDs, and download URLs for each photograph. This three-year time span has more Flickr photographs than others, since the site was launched in 2004. It also allows us to explore the dynamic characteristics of images within UAOIs by subdividing the time by month. To decrease the influence of a few active users who will dominate the analysis outcomes, we retained only one photograph for each user based on the tags used and the time when the photograph was taken [9]. This is because some active users may take many similar photographs in a high-density area, which would influence the extraction of UAOIs. Specifically, if a user took several photographs in a minute but with the same tags, only one photograph was retained. The rationale for this approach was to remove photographs within a limited spatial extent based on the hypothesis that a person’s average walking speed is 5 km/h [55]. On this basis, the maximum walking distance within a minute is approximately 83 m. Within this short distance, only a single user’s photograph with the same text is retained.
For UAOI extraction, we rely on the methodology from [9], which combines HDBSCAN (hierarchical density-based spatial clustering for application with noise) [56] and alpha shapes [57]. We identified UAOIs every month by HDBSCAN and constructed the corresponding boundary for each UAOI via Alpha shapes. Figure 2 shows the spatial distribution of all extracted UAOIs from 2013 to 2015 in Inner London in a light coral colour. We subsequently downloaded all photographs within Inner London through the URL links embedded in the Flickr metadata. Since spatial information is available for the UAOIs, in other words, images that are grouped as UAOIs are available, we subsequently divided them into two image subsets: UAOI and NON-UAOI images, with total numbers of 187,064 and 816,058 photographs, respectively.

3.2. Extracting the Characteristics from UAOIs and Outer Areas

To uncover the potential driving factors that influence the formation of UAOIs, an image recognition technique is used to identify the objects in each Flickr image. CNN models are generally designed to process data in the form of multiple arrays, such as colourful image data consisting of three 2D arrays presented as pixel values in the three colour channels.
In this work, an image classification model, Places365 CNN, is used to extract the characteristics of UAOIs. The reason for using this classification model instead of object detection is primarily that we are interested in the characteristics of places. Places365 CNN can work as a classifier to identify scenes from the built environment. Alternatively, other image recognition models could be used as well, but we deemed Places365 CNN as the most productive model in this context of the study. Places365 is the latest subset of the Places2 Database, which is trained by 1.8 million images from 365 scene categories, where there are, at most, 5000 images per category [50]. We specifically use the Places365-ResNet model, fine-tuned on the ResNet152 (152-layer Residual Network) architecture. This CNN model has the best performance; its top five classification accuracy reaches 85.08%, whereas the top five classification accuracies for other popular CNNs, such as Places365-AlexNet, Places365-GoogleNet, and Places365-VGG, are 82.89%, 83.88%, and 84.91%, respectively [50].
All photographs within and outside the UAOIs are fed to the Places365-Resnet model, with the aim of exploring if there are any unique characteristics at UAOIs compared to other areas. For high-efficiency implementation, the recognition process of all photographs (approximately 100 GB) was undertaken using a single Nvidia Quadro M5000 GPU with 8 GB memory. As each photograph may contain more than one scene class, the model is set to return the maximum top five labels based on the probability for each photograph of our dataset. Furthermore, the top five labels’ classification accuracy (85.08%) is far beyond that of the top one label (54.74%), which was validated in the work of [50]. Then, we integrate the probability of all identical labels together and divide by the total number of photographs for UAOIs and other areas separately. This step helps us to acquire the mean regular probability of each label in different areas. Table 1 features a numeric illustration of how the results are interpreted and visualised in Section 4.1. It displays portions of the extraction from the 365 categories/labels, where the higher probability of a label represents more significant characteristics in that area, and vice versa.
Considering the temporal nature of UAOIs, certain UAOIs emerged and disappeared within just a few months (see examples in Figure 3). The UAOI in the north-west of Newham appears in July and August but disappears in September 2013, and a UAOI emerges in the middle of Southwark in August but vanishes in the next month. However, the regular characteristics recognised at the UAOIs over three years are unable to capture these minor seasonal changes. As a result, it remains challenging to explain why people would gather at certain UAOIs at specific times without identifying the dynamic patterns underlying these images.
To understand the factors that contributed to the dynamic changes of UAOIs, we subdivided photographs into a finer temporal resolution (i.e., we grouped photographs by month). Similarly, the maximum top five probabilities of labels were returned, and the mean probability of each label for UAOIs and Non-UAOIs in a month was calculated. Next, 36 tables similar to Table 1 were acquired in different months. Then, we concatenated them into a single table and determined the label probability of the UAOIs, where the row and column represent 365 features and 36 different months separately. We finally calculated the average values of the label probabilities for identical months but for different years, as shown in Table 2, which includes a small sample from the 365 labels and a numeric illustration for Section 4.2. By doing this, the significant characteristics for the UAOIs in different months are identified, thereby allowing us to capture several interesting dynamic patterns.
The probability values from Table 2 vary greatly among individual labels. For example, the values of the label “tower” are about 20 times higher than the values for the label “carousel”. The disparity of scales created a large challenge in simultaneously comparing the variety of all characteristics. To handle this, we calculated the z-score to standardise all label probability values by row; these values can be used to compare the results to the sample mean of the label probability for every row. This method returns a normalised value (z-score) based on its mean and standard deviation. The basic Z-Score can be calculated by the formula below:
Z = x x ¯ s
where x represents the value of the data point, and x ¯ and s represent the sample mean and sample standard deviation, respectively. This process ensures that the values in each row in Table 2 are on the same scale, thus laying the foundation for the subsequent heatmap analysis. A heatmap is a graphical presentation of data where the values contained in a matrix are represented as colours; the darker the colour is, the higher the value or the density. We performed heatmap analysis on the z-score of the probability of a label because it returns an instant visual pattern of the labels in a timeline, offering better insight into the dynamic characteristics of UAOIs.

4. Results and Discussion

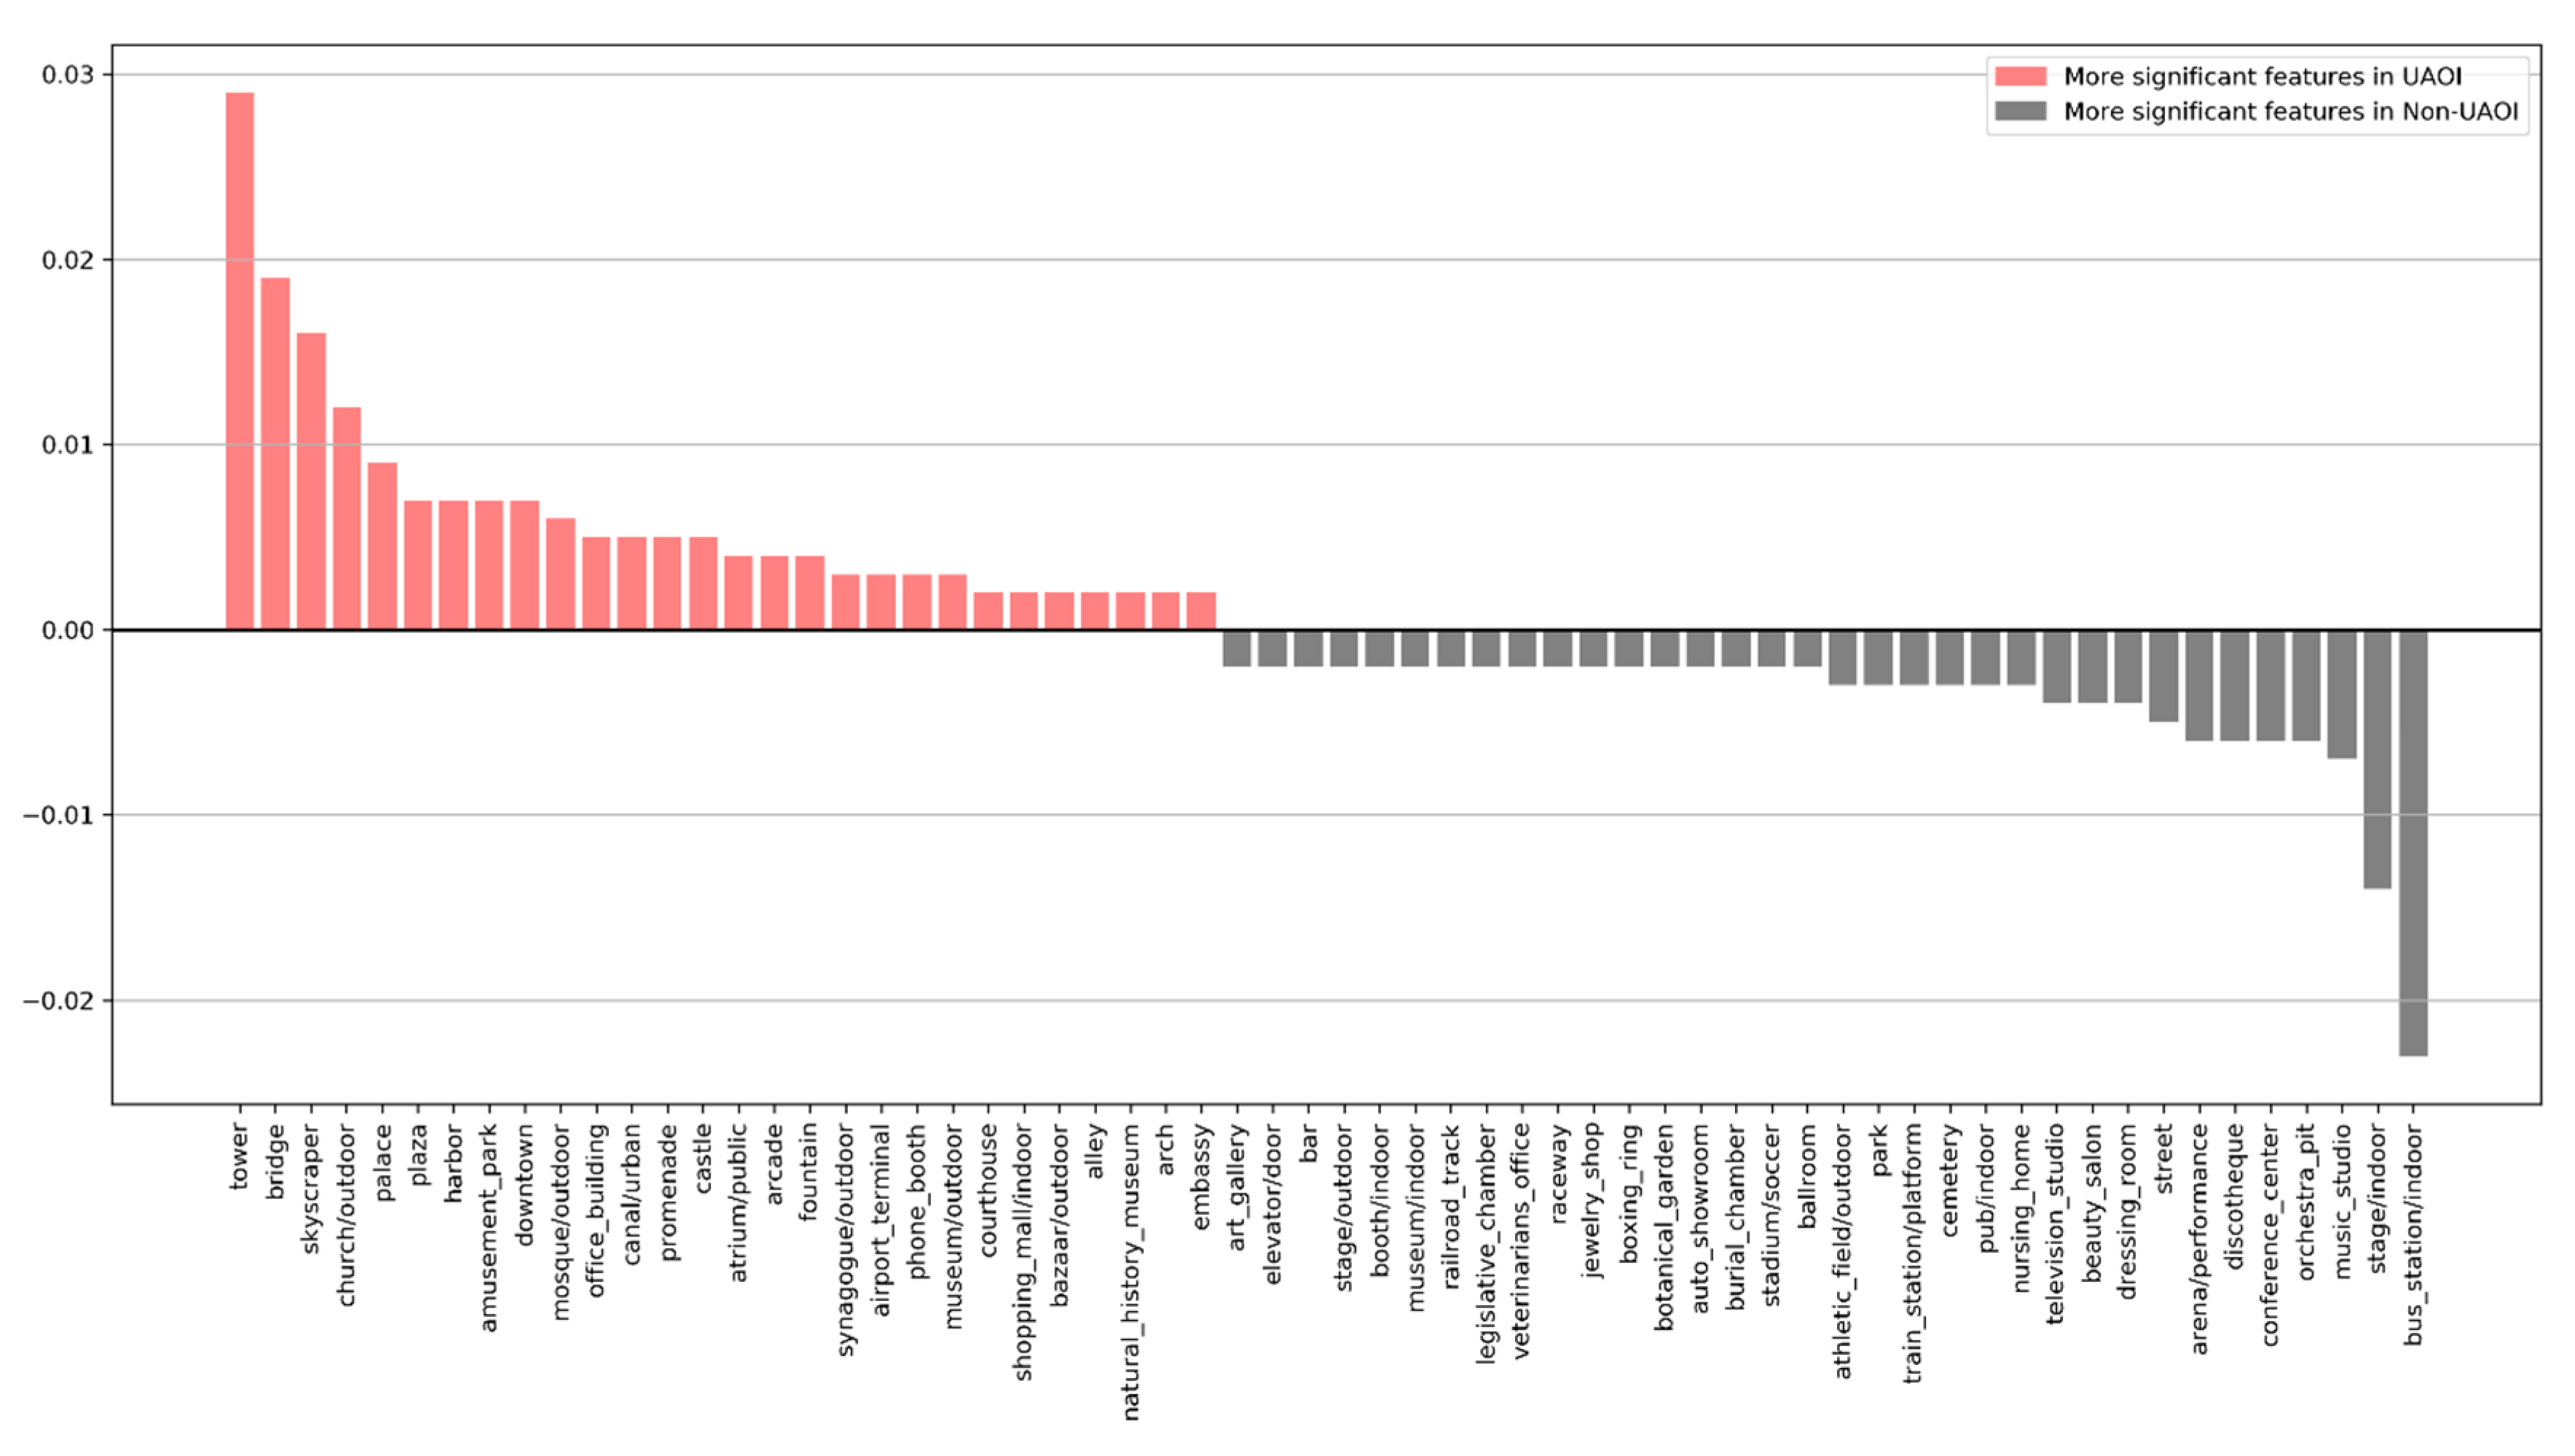
4.1. Regular Characteristics of UAOIs and Non-UAOIs

Based on the mean regular probabilities of the 365 categories for UAOIs and outside areas, we visualised the top 50 categories for both in an inverted pyramid graph (see Figure 4). The labels for the left and right y-axes were organised hierarchically, representing the significance of the characteristics from most to least within and outside the UAOIs. The top three characteristics for UAOIs are “tower”, “skyscraper”, and “bridge”, suggesting that the Tower of London, skyscrapers, and a variety of bridges, such as Millennium Bridge and Tower Bridge, are the most significant representations of UAOIs and the primary reasons for why people gathered in these places. The overall composition of the UAOIs includes iconic landmarks, historic and famous buildings, entertainment places, and museums and galleries, as the most high-frequency appearances of these characteristics include the tags “canal”, “harbour”, “church”, “amusement park”, “museum”, “gallery”, and so on. The components of areas outside the UAOIs are more strongly related to buses or train stations, as well as several indoor venues, such as “arena”, “music studio”, “conference centre”, and “shops”. These are ordinary scenes from daily life, which are less attractive to large numbers of people.
There are a few repetitive characteristics in the top 50 for both categories, making it difficult to determine the differences between UAOIs and Non-UAOIs. For example, the labels “tower”, “street”, “bus_station”, “skyscraper”, and “downtown” are identified in the top 10 for both. We then distinguished the most significant characteristics for both areas by calculating the different values of the mean regular probability of all labels in the UAOIs and Non-UAOIs. Figure 5 shows the differences of features between UAOIs and Non-UAOIs. By plotting this, features that are common in both would cancel out if their probabilities were the same and thus not feature in the figure. The bars in light coral and grey, respectively, represent more significant features for UAOIs and Non-UAOIs. A total number of 28 labels have a higher probability in UAOIs, while more labels are identifiable in Non-UAOIs. This can be attributed to the huge and manifold areas of Non-UAOIs, where larger numbers of photographs were taken. Although the significant levels of characteristics in UAOIs and Non-UAOIs are slightly different from those in Figure 4, the overall pattern conforms to the features shown above. UAOIs involve more scenic spots and places of entertainment, such as “tower”, “church”, “canal”, “fountain”, “amusement park”, and “shopping mall”, while the areas of less interest are more strongly related to daily life, including labels like “bus station”, “street”, “bar”, “conference centre”, and “railroad track”.
These regular characteristics quantitatively suggest why people would gather at UAOIs regularly over several years, as well as the characteristic differences between UAOIs and other areas. A large number of world-famous landmarks, modern skyscrapers, large-scale shopping malls, plazas, and places of entertainment are located at UAOIs. The uniqueness of these elements has attracted thousands of people (both travellers and residents in Inner London) to take photographs of them. Conversely, the characteristics of photographs taken outside UAOIs are relatively common and anonymous and are primarily associated with daily-life scenes. We would like to highlight that the features like music studio and pub display a small lean over Non-UAOI but do not feature as a clear signifier of the class (in other words, they can be found in the middle of the figure). Subjectively, this could correspond to people taking photos with no specific purpose at these areas compared to the more purposeful photographs taken within UAOIs, such as recording certain tourist attractions like the Tower Bridge.
More importantly, the results demonstrate that geotagged Flickr images can be used to quantify the characteristics of the urban environment instead of tags. This has been rarely explored in past research, where quite a few studies have instead used tags of Flickr to understand the urban environment and people’s perceptions of it [7,8,22]. Moreover, these results will help to familiarise us with the perception features of large communities at a local scale, whereas previous attempts were primarily focused on global urban appearance features.

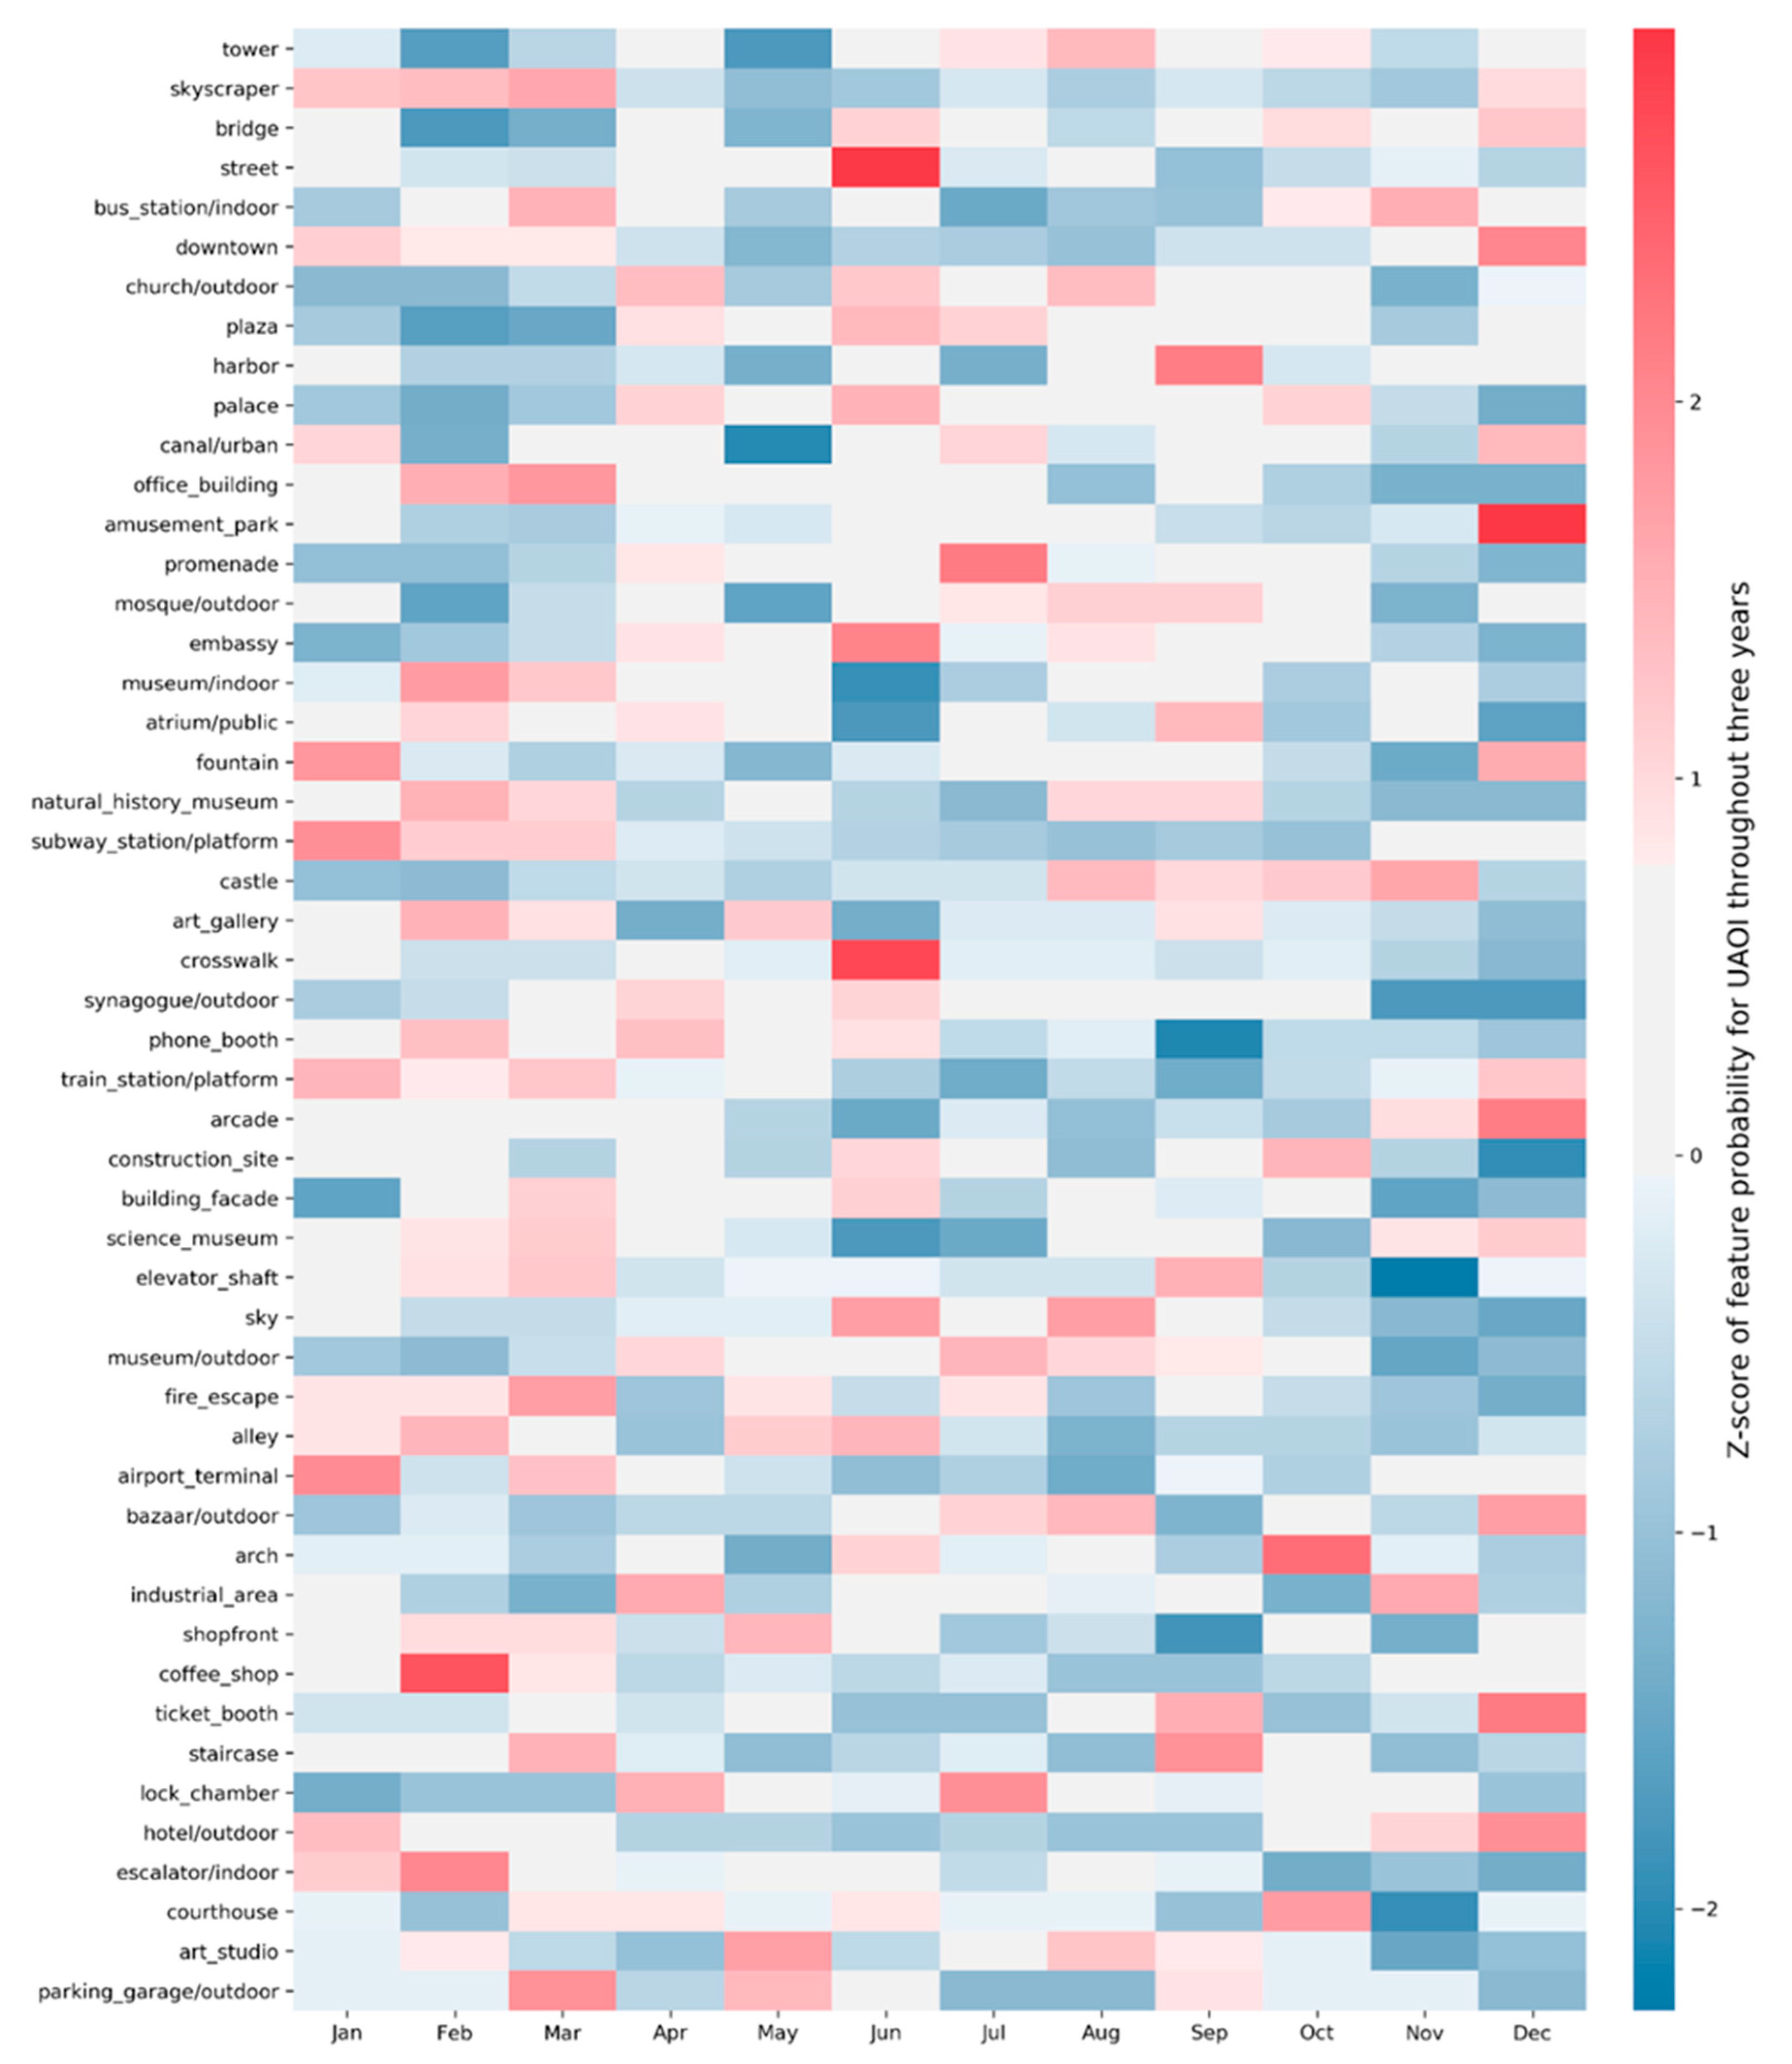
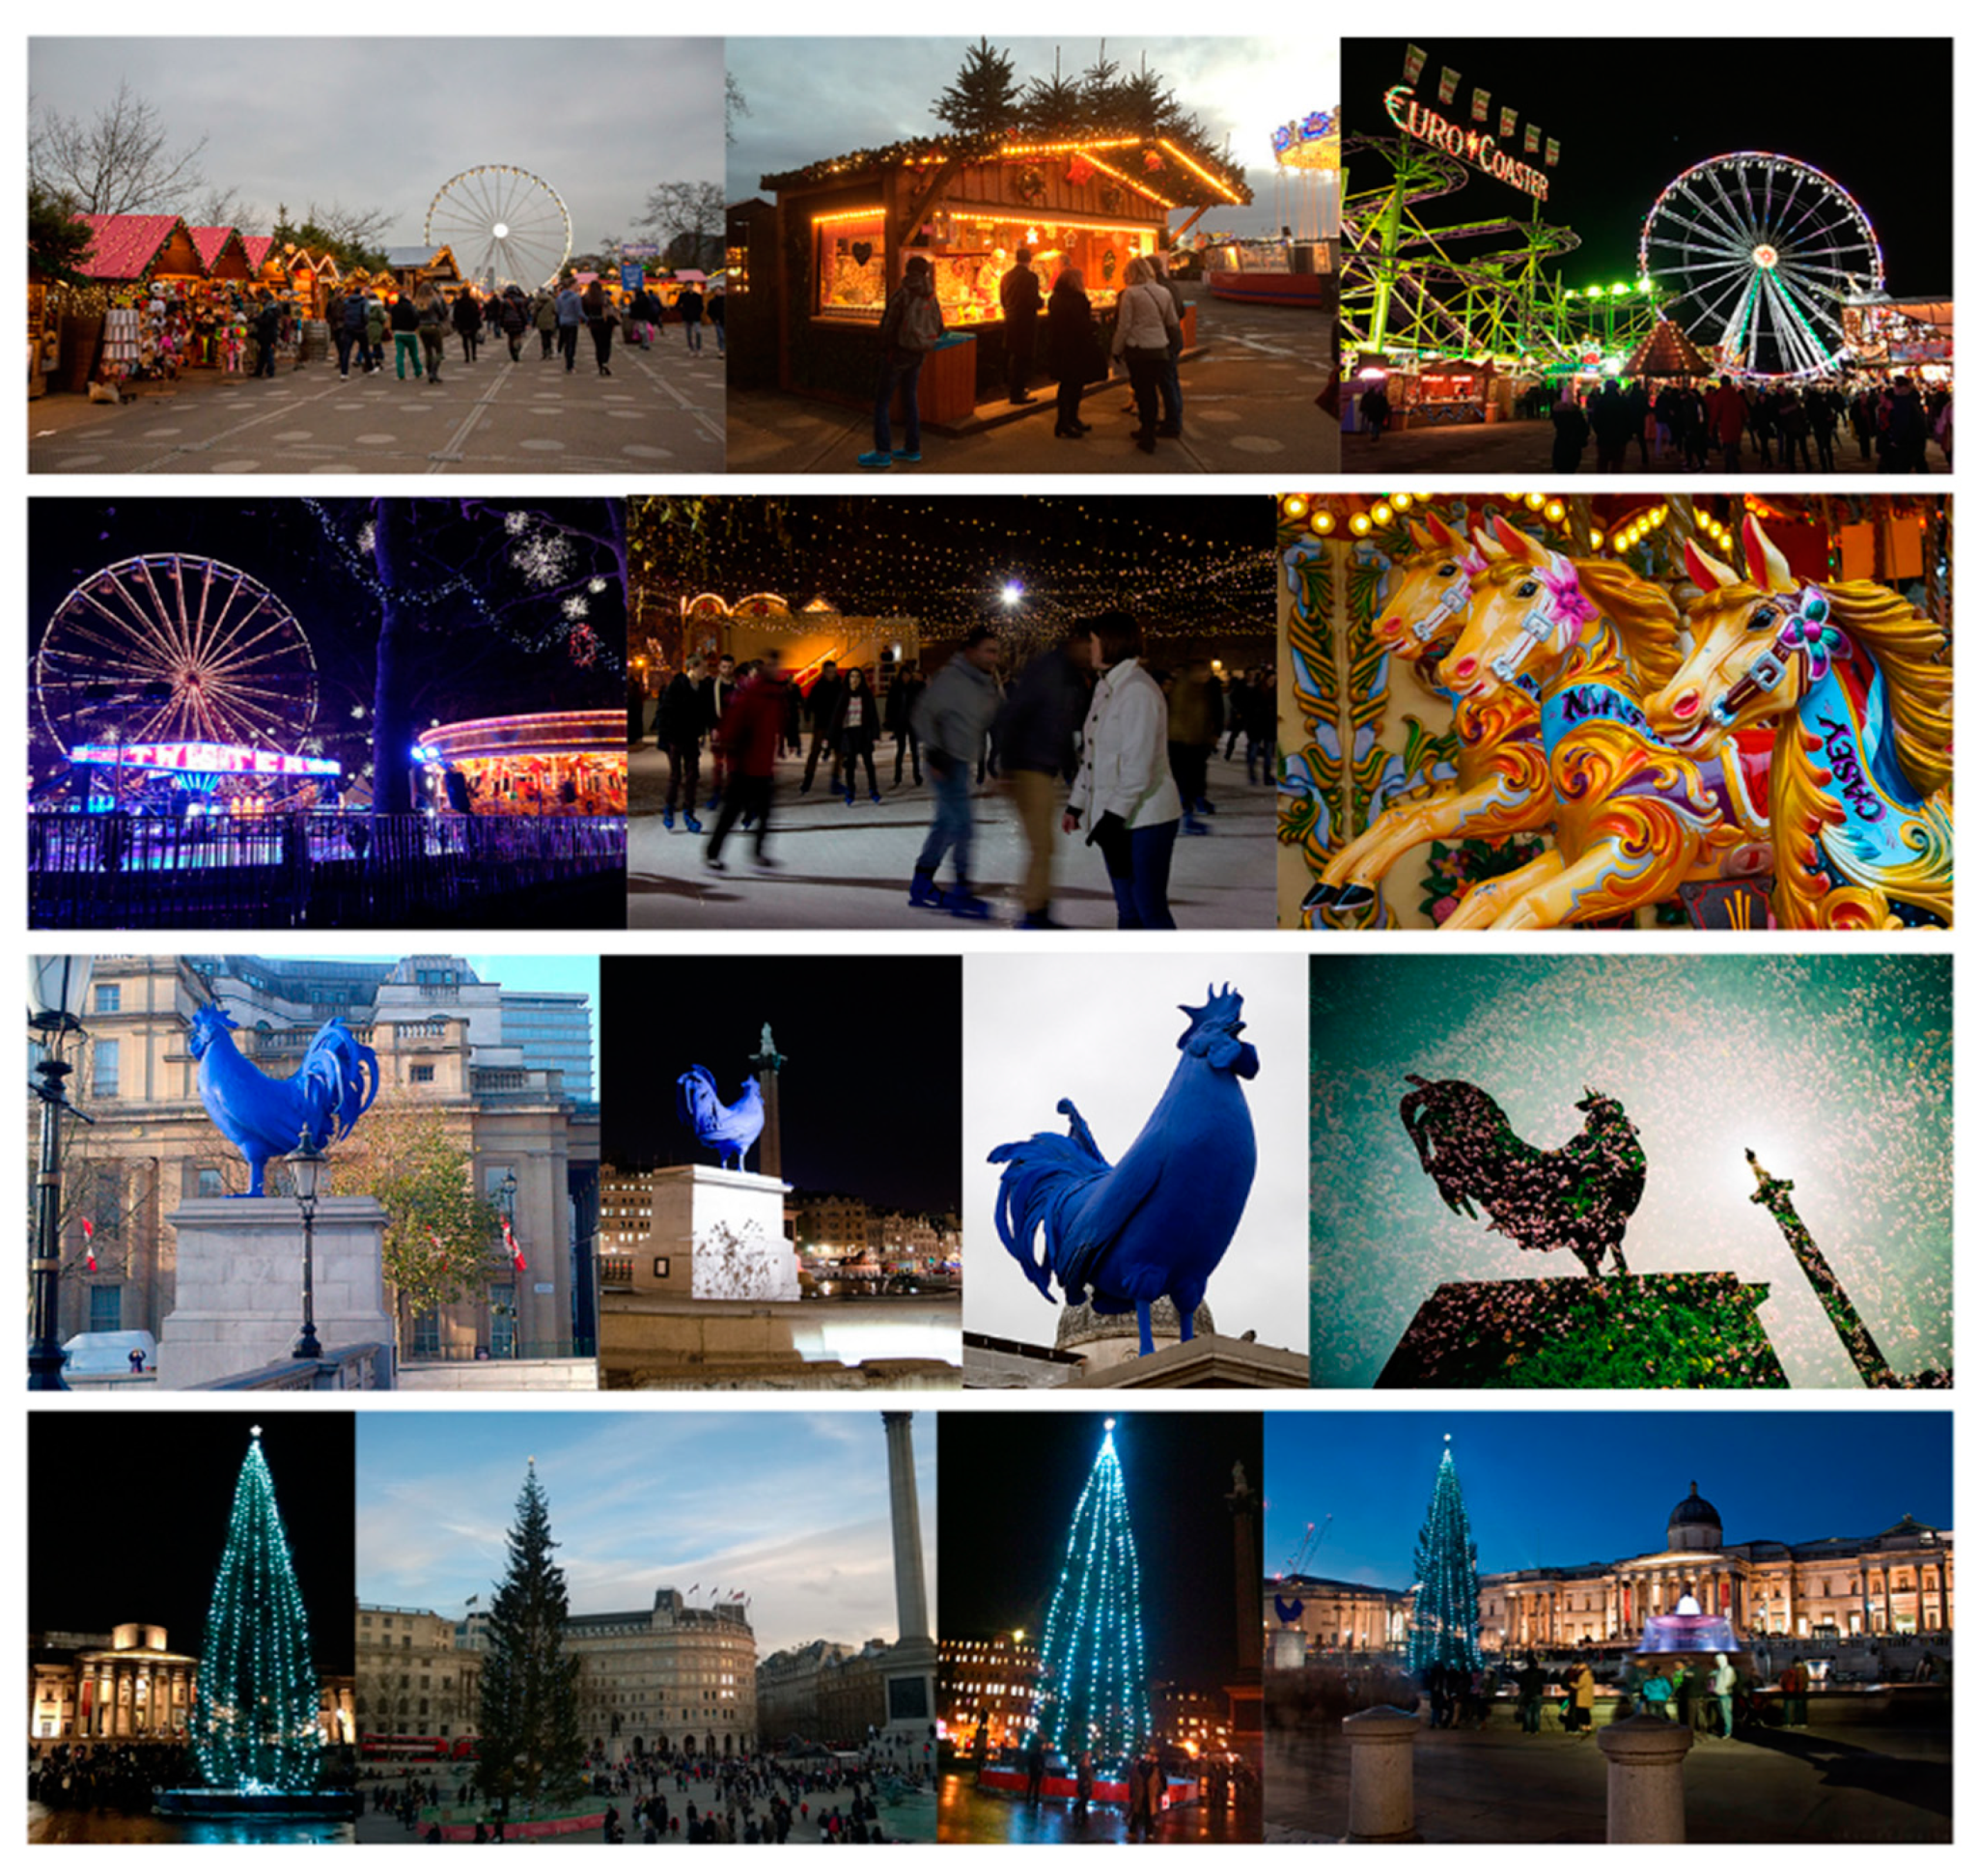
4.2. Dynamic Characteristics of UAOIs

Based on the z-score conversion, Figure 6 displays a heatmap with the top 50 labels in terms of probability of occurrence. This representation uncovers the underlying characteristics of UAOIs at certain time periods, where darker red or darker blue represent the standard deviation above or below the mean of a label over the period, respectively. The top three characteristics of the UAOIs “tower”, “skyscraper”, and “bridge” primarily present an intermediate colour between red and blue, with z scores ranging from −1 to 1, implying that these three characteristics remain attractive to people all year round. The colour for several transport-related labels, such as “subway_station”, “train_station”, and “airport_teminal” was slightly red from January to March but was blue for the rest of the year, suggesting that more photographs with these travel modes were taken during these months. Conversely, people’s travel mode priorities might differ when the weather becomes warmer, possibly including more walking and fewer vehicles. This manifests in the “street”, “promenade”, and “crosswalk” labels, whose z-scores of probability peak in June or July but remain at an average probability during the other months. We also uncovered various seasonal patterns of indoor and outdoor activities for UAOIs. For example, a series of indoor museums and galleries labelled as “museum/indoor”, “natural_history_museum”, “science museum”, and “art_gallery” were more prevalent during relatively cold months (February and March) compared with the others, while a number of magnificent buildings, as well as outdoor leisure places, with labels like “church”, “palace”, “mosque”, “castle”, “plaza”, “bazaar”, and “sky” were more likely to be identified in relatively warm seasons.
These dynamic patterns demonstrate that season has an important impact on human activity and considerably changes the travel modes and activity modes of people, leading to the different scene characteristics of UAOIs over the year. UAOI features tend to contain more vehicles and indoor buildings in winter, as people prefer to take photographs of vehicles and indoor activities during the cold season. Correspondingly, the UAOI features consist of more crosswalks, magnificent buildings, and recreational areas in warmer months, as more photographs related to these features were taken during this period.
These results also illustrate how urban perception changes over time, showing that dynamic analytics are important for the urban environment. These bridge the identified research gap in the dynamic features of cities [10,36]. Meanwhile, the practical implications of the dynamic characteristics of UAOIs can be reflected in the actions of retailers and local authorities. For example, a few retailers within UAOIs could expand their opening hours or deliver targeted advertising to potential customers in the summer, as people were more active during this period.

4.3. Capacity and Bias of Using Places365-CNN within This Context

In addition, the above heatmap also suggests that certain patterns deserve special attention. It is obvious that some characteristics are highly popular (i.e., reddest) over just a single month, such as coffee shops, streets, crosswalks, and amusement parks. To investigate what happened during these months with the corresponding characteristics, the “amusement_park” label was selected as an example for inspection. Specifically, we extracted the photographs that were classified as “amusement_park” in December for three years, setting a classification probability of 0.5 to filter photographs less than the threshold. A total of 175 photographs were kept after filtering, the majority of which (54.7%) were distributed at UAOIs, where Hyde Park, Trafalgar Square, London Bridge, and North Greenwich are located. Figure 7 (Due to the different shapes of the photographs, some images have been rescaled and cropped to aid visualisation in this figure. Photographers (Flickr user IDs) of images in Figure 7: ©17576427@N00, ©89333651@N00, ©91832335@N04, ©42230049@N03, ©16483105@N02, ©87076514@N02, ©64882892@N08, ©24605992@N06, ©75209620@N00, ©42112515@N06, ©42230049@N03, ©29558445@N00, ©36054481@N00, ©74264857@N00. Copyright of the images is retained by the photographers) displays a handful of samples from the 175 photographs we extracted, which were taken by various photographers in various years. Here we can see a Ferris wheel, street food markets, roller coaster rides, ice skating, and carousels; these types of scene attribute are located in the upper half of the images that were taken at Hyde Park. This seems to be related to Hyde Park’s Winter Wonderland, a Christmas extravaganza that is open to the public for 6 weeks every year from mid-November to the end of December [58]. This is one of the reasons that “amusement_park” peaked in December, in agreement with our common knowledge.
However, this does not relate exactly to the installation of an actual amusement park when examining the photographs shown in the rest of Figure 7. These photographs were taken at Trafalgar Square instead of Hyde Park, where a sculpture of a giant blue chicken, a Christmas tree, and a fountain with a red light were captured by multiple photographers. These scenes are not parts of an amusement park in the strictest sense, but their integration at a specific place and time can be considered a provisional amusement park, as the blue sculptures, green trees, and red fountains are similar to the colourful characteristics of an amusement park. The probable reason for this phenomenon is that groups of people gathered around Trafalgar Square in December because the Christmas tree appeared here in early December, and manifold events, such as a lighting ceremony and carol singing, happened during this period [59]. Therefore, “amusement_park” became extremely prevalent in December because many seasonal landmarks appeared, and spectacular events happened in a few UAOIs due to Christmas.
This pattern demonstrates that the pre-trained Places365-CNN model may not fit Flickr images very well, as several images can be identified based on biased characteristics. Nevertheless, the capacity of this CNN model to unpack the characteristics of the local built environment cannot be underestimated, which other models rarely have. This model successfully identified several pieces of useful information from urban areas, which can be used as a reference for policymakers and stakeholders.

5. Conclusions

In this study, a recent and rarely used image recognition method, Places365 CNN, was used to extract and quantify features of the local urban environment from Flickr photographs. We first compared the differences of the regular characteristics within and outside UAOIs over three years. Then, we explored the dynamic characteristics of UAOIs over that period. The results help explain why people become interested in certain urban areas more than others, what characteristics these areas possess, and if these characteristics can change over time. We found that the UAOIs were mainly identified in areas where iconic landmarks, tourist attractions, magnificent buildings, and leisure zones are located, such as towers, bridges, skyscrapers, churches, plazas, and shopping malls—which are different from the characteristics of Non-UAOIs, where more daily life-related areas are captured, such as stations, shops, and indoor venues. In terms of the dynamic characteristics of the UAOIs, UAOIs extracted in the winter contained more vehicles and indoor buildings, while UAOIs extracted in others season consisted of more crosswalks, magnificent buildings, and recreational areas. These patterns demonstrate that season has an important impact on human preferences for travel and activity modes. People tend to travel by various vehicles and conduct indoor activities on cold winter days but walk and engage in outdoor activities when the weather gets warmer.
This study contributes to both the theoretical and practical domains. We demonstrated that Flickr photographs themselves can be used to understand the perceived features of cities, instead of traditional methods, by using Flickr tags and other image sources like GSV images. More importantly, this work provides a potential way to bridge the research gap between image recognition techniques and urban perception analytics. Local scales and dynamic characteristics play important roles in recognising the features of the urban environment. In terms of practical significance, the regular and dynamic characteristics of the urban environment provide new insights for policymakers, who can use these findings as vital evidence for decision making. The regular characteristics of UAOIs would be informative for urban planners to give them a macroscopic understanding of urban areas and aid them in formulating relevant policies, such as investing more funds in certain UAOIs to stimulate consumption for economic growth. The dynamic characteristics of UAOIs can help transport planners regulate trip frequency in various seasons, with a greater trip frequency in the winter than in the summer. Furthermore, a few retailers may also be inspired by the dynamic characteristics of UAOIs, helping them to better design personalised advertisements at specific places and times or expand their opening hours in the summer.
However, the limitations of this study warrant further attention in future work. Flickr offers only one type of geotagged image data. Future work should incorporate multiple image sources together, which would make the results more persuasive and improve the coverage of the analysis. In addition, although the Places365 CNN model that we used to extract the urban features has a relatively high classification accuracy compared to others, the model is trained on the Places2 dataset, which may differ from the Flickr dataset in this study. This could lead to several features identified by Places365-CNN being incompatible with the real features of images. This issue can be addressed by manually labelling the features for a certain number of images and then retraining them by fine-tuning the parameters in the max-pooling layer of the Places365-CNN. Finally, the study area we selected was located at the local level of Inner London; more interesting patterns could be uncovered at a smaller scale by including more cities in future work.

Author Contributions

Conceptualization, Meixu Chen and Dani Arribas-Bel; methodology, software, investigation, and writing—original draft preparation, Meixu Chen; writing—review, editing and supervision, Dani Arribas-Bel and Alex Singleton. All authors have read and agreed to the published version of the manuscript.

Funding

This research received no external funding.

Acknowledgments

We would like to thank Yunzhe Liu for his technical support, and thank the help from Sam Comber and Ellen Talbot for their peer reviews in our lab.

Conflicts of Interest

The authors declare no conflicts of interest.

References

  1. Singleton, A.D.; Spielman, S.E.; Folch, D.C. Urban Analytics; Sage: London, UK, 2018. [Google Scholar]
  2. Stubbings, P.; Peskett, J.; Rowe, F.; Arribas-Bel, D. A hierarchical Urban forest index using street-level imagery and deep learning. Remote Sens. 2019, 11, 1395. [Google Scholar] [CrossRef] [Green Version]
  3. Arribas-Bel, D. Accidental, open and everywhere: Emerging data sources for the understanding of cities. Appl. Geogr. 2014, 49, 45–53. [Google Scholar] [CrossRef] [Green Version]
  4. Hollenstein, L.; Purves, R.S. Exploring place through user-generated content: Using Flickr tags to describe city cores. J. Spat. Inf. Sci. 2010, 2010, 21–48. [Google Scholar]
  5. Dorwart, C.E.; Moore, R.L.; Leung, Y.F. Visitors’ perceptions of a trail environment and effects on experiences: A model for nature-based recreation experiences. Leis. Sci. 2009, 32, 33–54. [Google Scholar] [CrossRef]
  6. Crandall, D.; Backstrom, L.; Huttenlocher, D.; Kleinberg, J. Mapping the world’s photos. In Proceedings of the WWW’09—18th International World Wide Web Conference, Madrid, Spain, 20–24 April 2009. [Google Scholar]
  7. Kisilevich, S.; Krstajic, M.; Keim, D.; Andrienko, N.; Andrienko, G. Event-based analysis of people’s activities and behavior using Flickr and Panoramio geotagged photo collections. In Proceedings of the International Conference on Information Visualisation, London, UK, 26–29 July 2010. [Google Scholar]
  8. Hu, Y.; Gao, S.; Janowicz, K.; Yu, B.; Li, W.; Prasad, S. Extracting and understanding urban areas of interest using geotagged photos. Comput. Environ. Urban Syst. 2015, 54, 240–254. [Google Scholar] [CrossRef]
  9. Chen, M.; Arribas-Bel, D.; Singleton, A. Understanding the dynamics of urban areas of interest through volunteered geographic information. J. Geogr. Syst. 2019, 21, 89–109. [Google Scholar] [CrossRef] [Green Version]
  10. Naik, N.; Kominers, S.D.; Raskar, R.; Glaeser, E.L.; Hidalgo, C.A. Computer vision uncovers predictors of physical urban change. Proc. Natl. Acad. Sci. USA 2017, 114, 7571–7576. [Google Scholar] [CrossRef] [Green Version]
  11. Zhang, F.; Zhang, D.; Liu, Y.; Lin, H. Representing place locales using scene elements. Comput. Environ. Urban Syst. 2018, 71, 153–164. [Google Scholar] [CrossRef]
  12. Seresinhe, C.I.; Moat, H.S.; Preis, T. Quantifying scenic areas using crowdsourced data. Environ. Plan. B Urban Anal. City Sci. 2018, 45, 567–582. [Google Scholar] [CrossRef] [Green Version]
  13. Lecun, Y.; Bengio, Y.; Hinton, G. Deep learning. Nature 2015, 521, 436–444. [Google Scholar] [CrossRef]
  14. Crooks, A.T.; Croitoru, A.; Jenkins, A.; Mahabir, R.; Agouris, P.; Stefanidis, A. User-generated big data and urban morphology. Built Environ. 2016, 42, 396–414. [Google Scholar] [CrossRef]
  15. Dunkel, A. Visualizing the perceived environment using crowdsourced photo geodata. Landsc. Urban Plan. 2015, 142, 173–186. [Google Scholar] [CrossRef]
  16. Antoniou, V.; Morley, J.; Haklay, M. Web 2.0 geotagged photos: Assessing the spatial dimension of the phenomenon. Geomatica 2010, 64, 99–110. [Google Scholar]
  17. Miah, S.J.; Vu, H.Q.; Gammack, J.; McGrath, M. A big data analytics method for tourist behaviour analysis. Inf. Manag. 2017, 54, 771–785. [Google Scholar] [CrossRef] [Green Version]
  18. Rattenbury, T.; Good, N.; Naaman, M. Towards automatic extraction of event and place semantics from flickr tags. In Proceedings of the 30th annual international ACM SIGIR conference on Research and development in information retrieval, Amsterdam, The Netherlands, 23–27 July 2007. [Google Scholar]
  19. Papadopoulos, S.; Zigkolis, C.; Kompatsiaris, Y.; Vakali, A. Cluster-based landmark and event detection for tagged photo collections. IEEE Multimed. 2011, 1, 52–63. [Google Scholar] [CrossRef]
  20. Zheng, Y.T.; Zha, Z.J.; Chua, T.S. Mining travel patterns from geotagged photos. ACM Trans. Intell. Syst. Technol. 2012, 3, 1–8. [Google Scholar] [CrossRef]
  21. Sun, Y.; Fan, H.; Bakillah, M.; Zipf, A. Road-based travel recommendation using geo-tagged images. Comput. Environ. Urban Syst. 2015, 53, 110–122. [Google Scholar] [CrossRef]
  22. Li, L.; Goodchild, M.F.; Xu, B. Spatial, temporal, and socioeconomic patterns in the use of twitter and flickr. Cartogr. Geogr. Inf. Sci. 2013, 40, 61–77. [Google Scholar] [CrossRef]
  23. Lee, I.; Cai, G.; Lee, K. Exploration of geo-tagged photos through data mining approaches. Expert Syst. Appl. 2014, 41, 397–405. [Google Scholar] [CrossRef]
  24. Hristova, D.; Aiello, L.M.; Quercia, D. The new urban success: How culture pays. Front. Phys. 2018, 6, 27. [Google Scholar] [CrossRef] [Green Version]
  25. Richards, D.R.; Friess, D.A. A rapid indicator of cultural ecosystem service usage at a fine spatial scale: Content analysis of social media photographs. Ecol. Indic. 2015, 53, 187–195. [Google Scholar] [CrossRef]
  26. Goodchild, M.F. Citizens as sensors: The world of volunteered geography. GeoJournal 2007, 69, 211–221. [Google Scholar] [CrossRef] [Green Version]
  27. Salesses, P.; Schechtner, K.; Hidalgo, C.A. The collaborative image of the city: Mapping the inequality of urban perception. PLoS ONE 2013, 8, e68400. [Google Scholar] [CrossRef] [PubMed] [Green Version]
  28. Law, S.; Shen, Y.; Seresinhe, C. An application of convolutional neural network in street image classification: The case study of London. In Proceedings of the 1st Workshop on Artificial Intelligence and Deep Learning for Geographic Knowledge Discovery, Los Angeles, CA, USA, 7–10 November 2017; pp. 5–9. [Google Scholar]
  29. Liu, L.; Wang, H.; Wu, C. A machine learning method for the large-scale evaluation of urban visual environment. arXiv 2016, arXiv:1608.03396. [Google Scholar]
  30. Kang, J.; Körner, M.; Wang, Y.; Taubenböck, H.; Zhu, X.X. Building instance classification using street view images. ISPRS J. Photogramm. Remote Sens. 2018, 145, 44–59. [Google Scholar] [CrossRef]
  31. Antoniou, V.; Fonte, C.C.; See, L.; Estima, J.; Arsanjani, J.J.; Lupia, F.; Minghini, M.; Foody, G.; Fritz, S. Investigating the feasibility of geo-Tagged photographs as sources of land cover input data. ISPRS Int. J. Geo Inf. 2016, 5, 64. [Google Scholar] [CrossRef]
  32. Xing, H.; Meng, Y.; Wang, Z.; Fan, K.; Hou, D. Exploring geo-tagged photos for land cover validation with deep learning. ISPRS J. Photogramm. Remote Sens. 2018, 141, 237–251. [Google Scholar] [CrossRef]
  33. Richards, D.R.; Tunçer, B.; Tunçer, B. Using image recognition to automate assessment of cultural ecosystem services from social media photographs. Ecosyst. Serv. 2018, 31, 318–325. [Google Scholar] [CrossRef]
  34. Naik, N.; Philipoom, J.; Raskar, R.; Hidalgo, C. Streetscore-predicting the perceived safety of one million streetscapes. In Proceedings of the IEEE Computer Society Conference on Computer Vision and Pattern Recognition Workshops, Columbus, OH, USA, 23–28 June 2014; pp. 779–785. [Google Scholar]
  35. Seresinhe, C.I.; Preis, T.; Moat, H.S. Using deep learning to quantify the beauty of outdoor places. R. Soc. Open Sci. 2017, 4, 170170. [Google Scholar] [CrossRef] [Green Version]
  36. Ilic, L.; Sawada, M.; Zarzelli, A. Deep mapping gentrification in a large Canadian city using deep learning and Google Street View. PLoS ONE 2019, 14, e0212814. [Google Scholar] [CrossRef]
  37. Karpathy, A. CS231n convolutional neural networks for visual recognition. Stanf. Univ. 2016, 1, 1. [Google Scholar]
  38. Krizhevsky, A.; Sutskever, I.; Hinton, G.E. Imagenet classification with deep convolutional neural networks. In Proceedings of the Advances in Neural Information Processing Systems, Lake Tahoe, NV, USA, 3–6 December 2012; pp. 1097–1105. [Google Scholar]
  39. Szegedy, C.; Liu, W.; Jia, Y.; Sermanet, P.; Reed, S.; Anguelov, D.; Erhan, D.; Vanhoucke, V.; Rabinovich, A. Going deeper with convolutions. In Proceedings of the Proceedings of the IEEE Computer Society Conference on Computer Vision and Pattern Recognition, Boston, MA, USA, 7–12 June 2015. [Google Scholar]
  40. Szegedy, C.; Ioffe, S.; Vanhoucke, V.; Alemi, A.A. Inception-v4, inception-ResNet and the impact of residual connections on learning. In Proceedings of the 31st AAAI Conference on Artificial Intelligence (AAAI 2017), San Francisco, CA, USA, 4–9 February 2017. [Google Scholar]
  41. He, K.; Zhang, X.; Ren, S.; Sun, J. Deep residual learning for image recognition. In Proceedings of the IEEE Computer Society Conference on Computer Vision and Pattern Recognition, Las Vegas, NV, USA, 26 June–1 July 2016. [Google Scholar]
  42. Murali, S. An Analysis on Computer Vision Problems. Available online: https://medium.com/deep-dimension/an-analysis-on-computer-vision-problems-6c68d56030c3 (accessed on 5 August 2019).
  43. Gandhi, R. R-CNN, Fast R-CNN, Faster R-CNN, YOLO—Object Detection Algorithms. Available online: https://towardsdatascience.com/r-cnn-fast-r-cnn-faster-r-cnn-yolo-object-detection-algorithms-36d53571365e (accessed on 28 November 2018).
  44. Ren, S.; He, K.; Girshick, R.; Sun, J. Faster R-CNN: Towards real-time object detection with region proposal networks. IEEE Trans. Pattern Anal. Mach. Intell. 2017, 39, 91–99. [Google Scholar] [CrossRef] [PubMed] [Green Version]
  45. Redmon, J.; Farhadi, A. YOLO9000: Better, faster, stronger. In Proceedings of the IEEE Conference on Computer Vision and Pattern Recognition, Honolulu, HI, USA, 21–26 July 2017; pp. 6517–6525. [Google Scholar]
  46. COCO COCO—Common Objects in Context. Available online: http://cocodataset.org/#home (accessed on 29 November 2018).
  47. Papandreou, G.; Zhu, T.; Kanazawa, N.; Toshev, A.; Tompson, J.; Bregler, C.; Murphy, K. Towards accurate multi-person pose estimation in the wild. In Proceedings of the 30th IEEE Conference on Computer Vision and Pattern Recognition (CVPR 2017), Honolulu, HI, USA, 21–26 July 2017. [Google Scholar]
  48. Johnson, J.W. Adapting mask-RCNN for automatic nucleus segmentation. In Proceedings of the 2019 Computer Vision Conference, Las Vegas, NV, USA, 2–3 May 2018; Volume 2. [Google Scholar]
  49. Shaifee, M.J.; Chywl, B.; Li, F.; Wong, A. Fast YOLO: A fast you only look once system for real-time embedded object detection in video. J. Comput. Vis. Imaging Syst. 2017, arXiv:1709.05943. [Google Scholar] [CrossRef]
  50. Zhou, B.; Lapedriza, A.; Khosla, A.; Oliva, A.; Torralba, A. Places: A 10 million image database for scene recognition. IEEE Trans. Pattern Anal. Mach. Intell. 2018, 40, 1452–1464. [Google Scholar] [CrossRef] [PubMed] [Green Version]
  51. London City Hall Policy 2.9 Inner London. Available online: https://www.london.gov.uk/what-we-do/planning/london-plan/current-london-plan/london-plan-chapter-two-londons-places/policy-29/ (accessed on 1 August 2019).
  52. O’Sullivan, D.; Unwin, D.J. Geographic Information Analysis: Second Edition; John Wiley & Sons: Hoboken, NJ, USA, 2010; ISBN 9780470288573. [Google Scholar]
  53. Smith, C. 20 Interesting Flickr Stats and Facts (2019)|By the Numebrs. Available online: https://expandedramblings.com/index.php/flickr-stats/ (accessed on 2 February 2019).
  54. Google Maps Street View Google-Contributed Street View Imagery Policy. Available online: https://www.google.com/streetview/policy/#blurring-policy (accessed on 9 July 2019).
  55. Onaverage Average walking speed. Available online: http://www.onaverage.co.uk/speed-averages/average-walking-speed/ (accessed on 26 August 2018).
  56. McInnes, L.; Healy, J.; Astels, S. Hdbscan: Hierarchical density based clustering. J. Open Source Softw. 2017, 2, 205. [Google Scholar] [CrossRef]
  57. Akkiraju, N.; Edelsbrunner, H.; Facello, M.; Fu, P.; Mücke, E.P.; Varela, C. Alpha shapes: Definition and software. In Proceedings of the 1st International Computational Geometry Software Workshop, Minneapolis, MN, USA, 20 January 1995; pp. 63–66. [Google Scholar]
  58. Wonderland, H.P.W. Visit London’s Christmas Extravaganza! Available online: https://hydeparkwinterwonderland.com (accessed on 23 February 2019).
  59. London City Hall Christmas at Trafalgar Square. Available online: https://www.london.gov.uk/about-us/our-building-and-squares/christmas-trafalgar-square# (accessed on 24 February 2019).
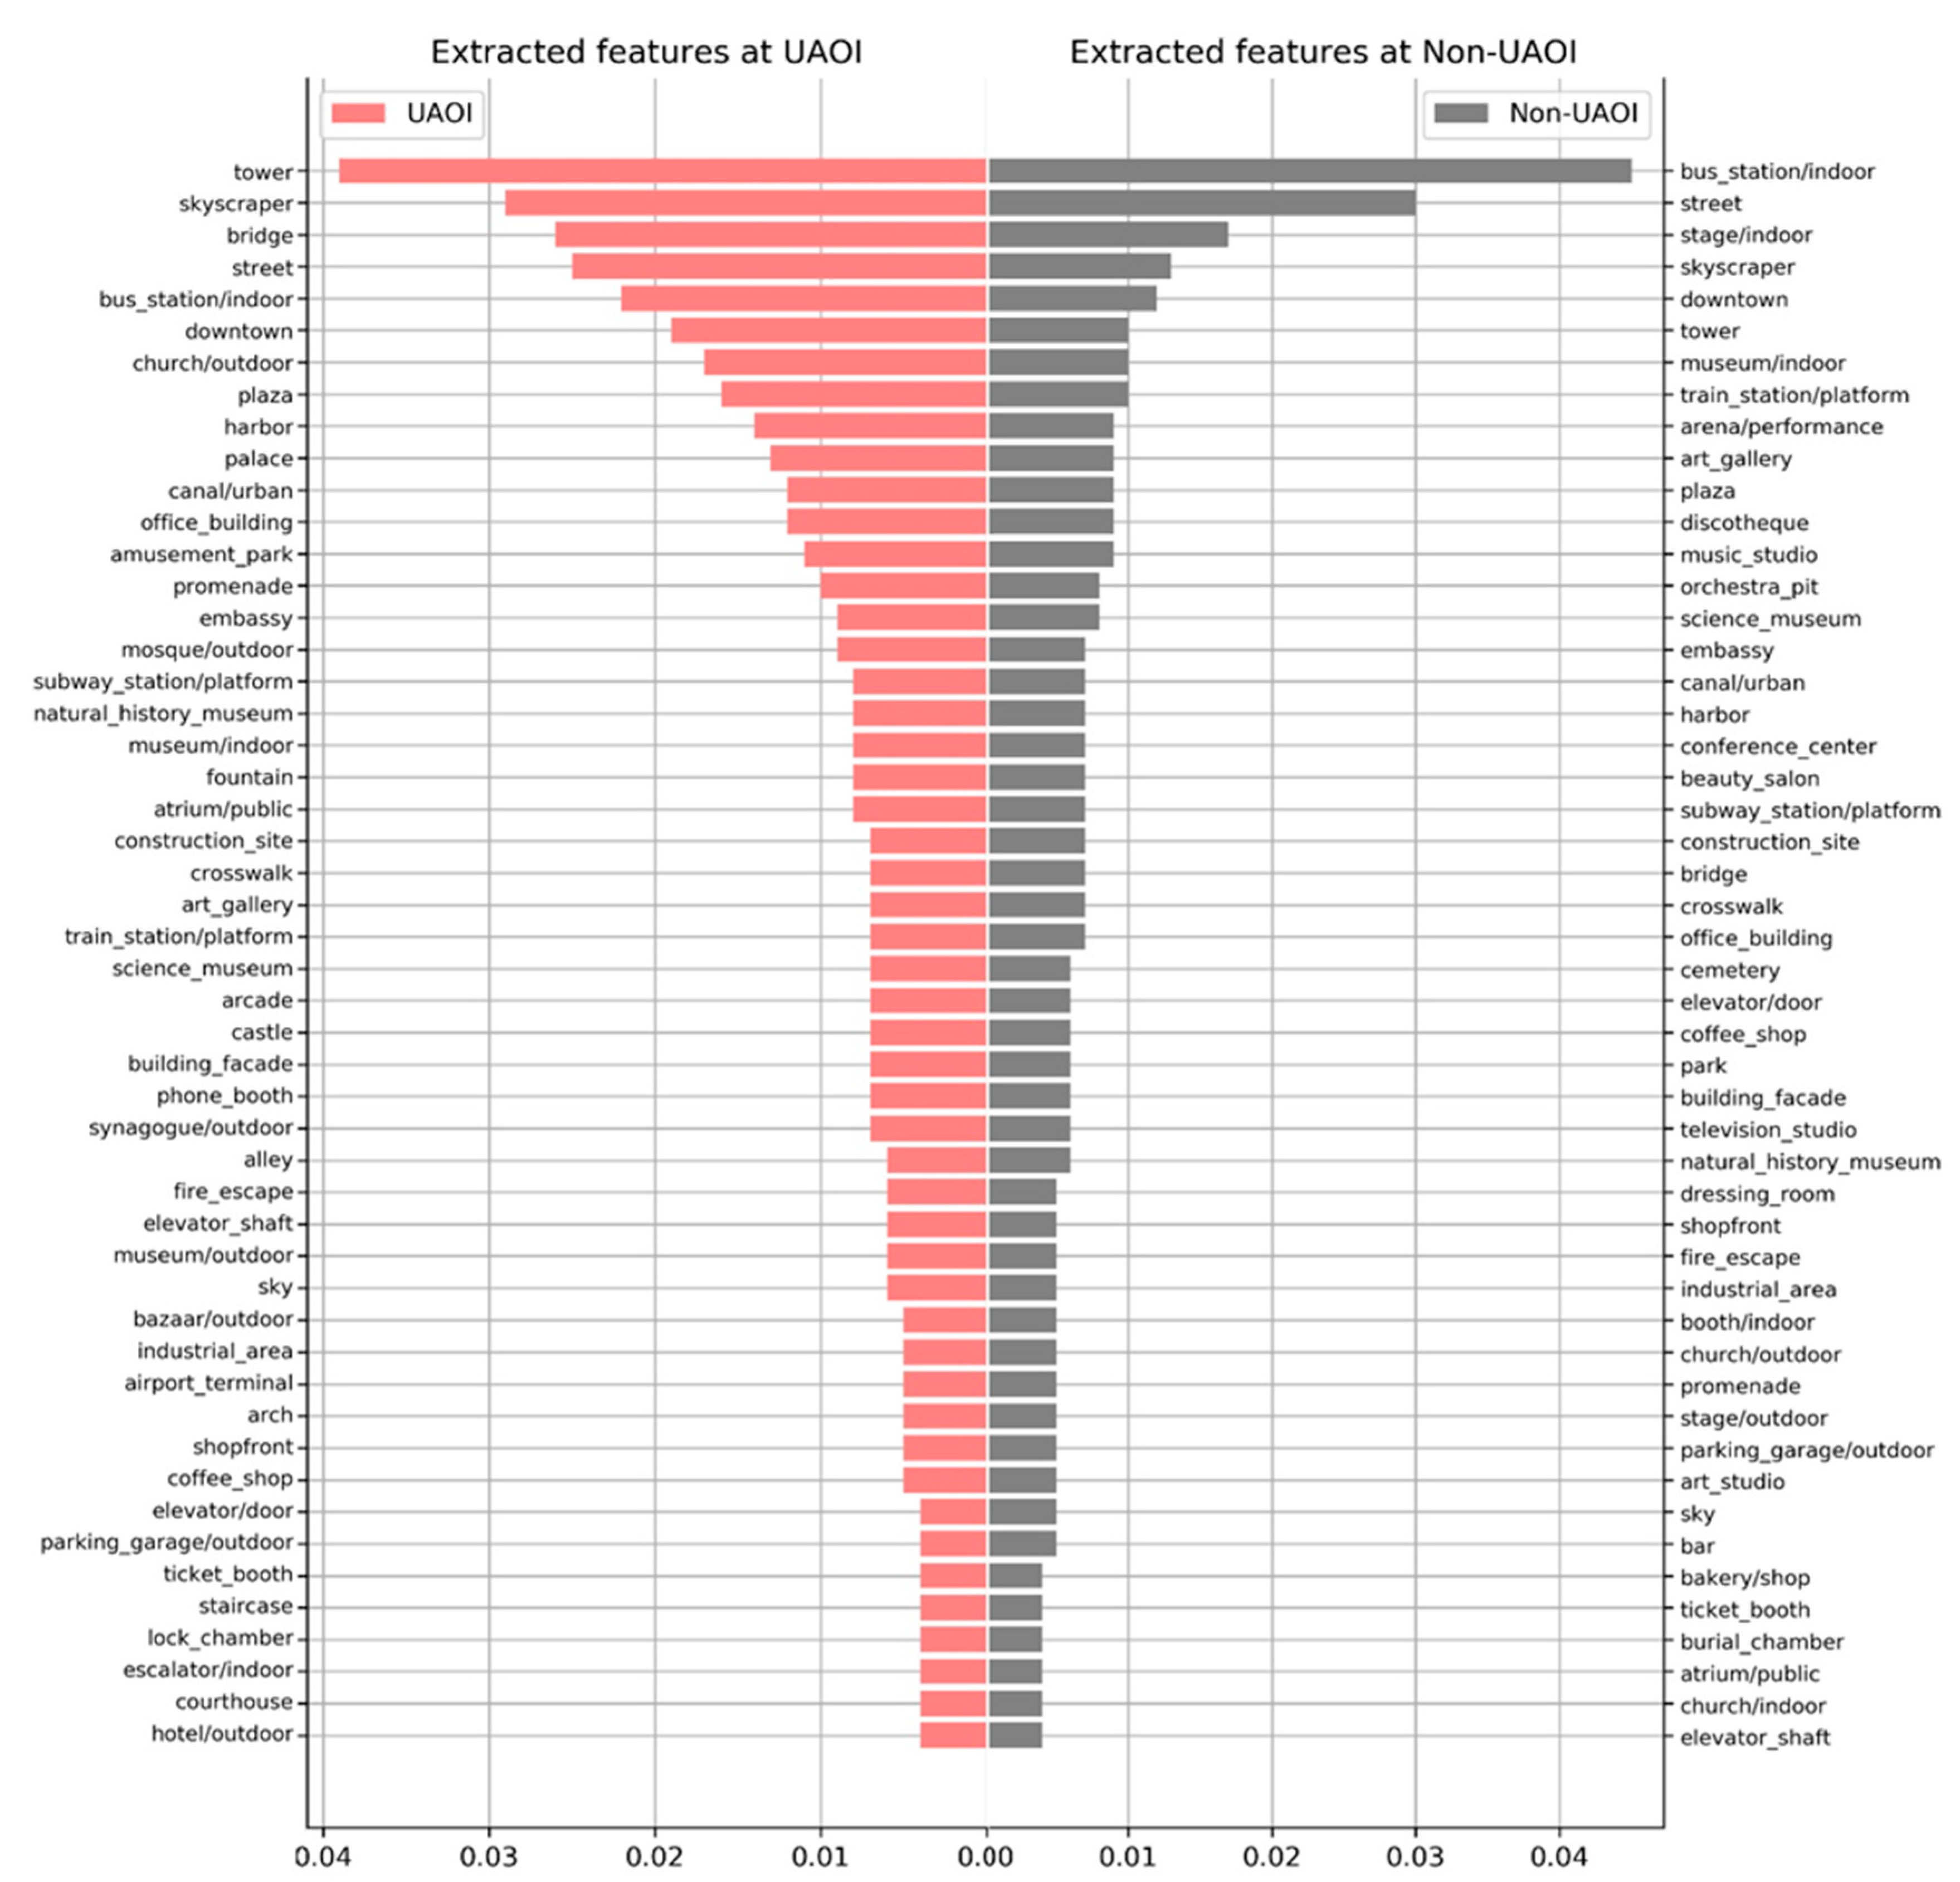
Figure 1. The spatial distribution of the geotagged Flickr photographs in Inner London and Greater London.
Ijgi 09 00264 g001
Figure 2. The spatial distribution of all urban areas of interest extracted per month for three years from [9].
Ijgi 09 00264 g002
Figure 3. A few urban areas of interest emerged and disappeared at certain months.
Ijgi 09 00264 g003
Figure 4. The top 50 feature probabilities extracted at urban area of interests and other areas.
Ijgi 09 00264 g004
Figure 5. Significant features in the urban areas of interest and outer areas separately.
Ijgi 09 00264 g005
Figure 6. Seasonal variations in the dynamic characteristics of urban areas of interest (UAOIs) based on the z-score.
Ijgi 09 00264 g006
Figure 7. Representative photographs taken in December, identified as an amusement park.
Ijgi 09 00264 g007
Table 1. The mean probability of partial labels quantified inside and outside urban areas of interest.
Bus StationStreetStage SkyscraperDowntownTowerMuseum Train StationMusic
Studio
UAOI0.02230.02530.00320.02910.01910.03850.00840.00710.0020
Non-UAOI0.04480.03010.01690.01330.01150.01040.00960.00960.0094
Table 2. The mean probability of the partial labels quantified in urban areas of interest per month.
JanFebMarAprMayJunJulAugSepOctNovDec
tower0.0380.0320.0360.0390.0320.0410.0420.0440.0410.0420.0360.041
skyscraper0.0340.0340.0350.0280.0250.0260.0280.0260.0280.0270.0260.033
bridge0.0260.0210.0220.0260.0230.0290.0270.0240.0270.0280.0270.029
street0.0260.0240.0230.0260.0250.0380.0240.0260.0210.0230.0250.022
hospital0.0020.0030.0030.0020.0020.0030.0020.0020.0020.0020.0030.002
outdoor library0.0020.0020.0020.0020.0030.0030.0040.0020.0030.0030.0010.001
jewellery shop0.0020.0030.0020.0020.0030.0010.0030.0020.0020.0020.0030.003
carousel0.0020.0020.0010.0010.0010.0010.0020.0020.0010.0010.0030.010

