A Systematic Review into Factors Influencing Sketch Map Quality


Department of Social Geography and Regional Development, Centre for Geographical and Environmental Education, Faculty of Science, Charles University, 128 00 Prague, Czech Republic
*
Author to whom correspondence should be addressed.
ISPRS Int. J. Geo-Inf. 2020, 9(4), 271; https://0-doi-org.brum.beds.ac.uk/10.3390/ijgi9040271
Submission received: 13 March 2020
/
Revised: 9 April 2020
/
Accepted: 16 April 2020
/
Published: 20 April 2020
Abstract
:Spatial perception is formed throughout our entire lives. Its quality depends on our individual differences and the characteristics of the environment. A sketch map is one way of visualising an individual’s spatial perception. It can be evaluated like a real map, in terms of its positional accuracy, content frequency and choice of cartographic methods. Moreover, the factors influencing the sketch map and/or its individual parameters can be identified. These factors should be of interest to geographers, cartographers and/or (geography) educators. The aim of this paper is to identify and describe the factors that clearly affect sketch map quality, by conducting a systematic review of 90 empirical studies published since 1960. Results show that most empirical studies focus on individual differences more than on environmental characteristics or information sources, even though the importance of these overlooked factors, especially source map characteristics and geographical education, has been proven in most analysed studies. Therefore, further research is needed in the field of sketch map quality parameters, especially in the use of cartographic methods. This paper could serve as a framework for such research.
1. Introduction
As they go about everyday activities, individuals create perceptions of the world (called mental or cognitive maps), including perceptions of places they have never visited [1]. This leads to the creation of a unique mental map [2] that contains spatial objects, their characteristics and the spatial relationships between them [3]. When perceiving space, information about it gets stored in the memory and forms the mental map. The concept of a mental map can be seen from four different perspectives: a) a mental map is a map (explicit statement); b) a mental map is like a map (analogy); c) a mental map works as if it were a map (metaphor); d) a mental map has no real connection with what we understand to be a map (hypothetical construct) [4]. Tversky [5] finds the term “cognitive collage” more appropriate than “mental map”, since information stored in the memory is systematically distorted and, therefore, difficult to transform into the structure of map [5]. Although it is still not known whether a mental map is a map in the strictest sense, this paper deals with spatial perception, and therefore uses the term mental map as an analogy with a real map. A mental map is suitable for encoding spatial information into the human memory [6] in the same way that a map in the cartographic sense encodes spatial information.
The aforementioned alternative perspectives, among others, allow different ways of collecting and evaluating data about mental maps. If we want to recall spatial information from memory, we can use various methods, such as sketching a map [7*,8*,9*,10], modelling the Earth’s surface [11*] or interviewing [12,13,14,15] (see more in [2]). The sketch map method allows an individual’s mental map to be understood more completely (in contrast to other methods), because it also allows for a metric evaluation of the quality of the spatial relations between objects [16].
The mental map quality—its construction, development and recall—is highly individual and influenced by a number of variables (factors), which may include individual differences; characteristics of the environment where the mental map is developed; or characteristics of the sources of spatial information (textbooks, maps, videos, photos, etc.) [17]. The knowledge of individuals’ mental maps and of the factors influencing their quality has application in a wide range of (spatial) scientific fields. For geography and cartography, application is closely related to the production and use of maps of different areas (the visualisations of geo-information). Maps in the geographical sense help us form the mental map of regions we have never been to, or (in the case of maps of well-known areas) enrich the mental map with new information that cannot be surmised from observing the landscape and develop the mental map in a qualitative way. Cartographers could benefit from the knowledge of factors when designing user-friendly maps that should be easier to read, and geography educators could use it to equip pupils with a sufficiently rich and exact mental map they could work with [18] and use when making spatial decisions [17].
Although the usefulness of systematization of knowledge in this area is evident, such synthesis is lacking. There are a few reviews analysing mental maps from the perspective of terminology [4], methodology [19] or applicability to various research fields [4,20]. However, only two studies [2,21] undertake a deeper systematic analysis of the factors that affect sketch map quality. The rest of the reviews focus purely on the influence of one or two factors, such as sex [4,22,23], age [22,24] or map characteristics [1,25], without the deeper ambition to systematise the field. Moreover, all the studies focus on a rather small sample of analysed papers and use a qualitative methodological approach. This paper, on the other hand, is a systematic review, aiming to complement these qualitative studies by employing a quantitative methodology (according to e.g., [26,27]) and considering a more extensive sample of papers.
The main goal of this study is to identify the factors that demonstrably do or do not influence sketch map quality, positional accuracy, content frequency and choice of cartographic methods, and, subsequently, to identify the knowledge gaps in this field. To meet this goal, we conducted a systematic review of the relevant studies published since 1960. The results will be useful for map production, geography education and future research in the area of sketch maps and spatial perception.
2. Perception of Space
Perception of space [28,29] has been the subject of research from a wide range of scientific fields, including the spatial sciences (geography, cartography, architecture and urban planning), the social sciences (sociology, psychology, pedagogy and anthropology), neuroscience and information technology (e.g., [30,31]). This means that a wider range of information is available, but limits the ability to achieve a clear conceptual and methodological basis [4], leads to unclear use of key terms (namely perception, mental map, cognitive map) and muddies the results of research.
Perception can be understood as a process whereby individuals perceive objects in their immediate environs [28], or as a process whereby the individual not only acquires information about the objects, but also encodes it, stores it and subsequently retrieves it from memory [32]. Each phase of this process is influenced by individual differences or external factors (see Figure 1).
At the beginning of the process of spatial perceptions [4], the individual perceives the external environment either directly or indirectly. The perception is therefore influenced by the external factors. The objects of perception then enter the memory, where the individual stores information, through a receptor, which is influenced by the individual differences. Internal representation of space (mental/cognitive map) is then created. The individual differences not only influence the amount of information, but also the form in which it is encoded. When recalling the information from mental/cognitive map, the information from mental/cognitive map is influenced by both the individual’s characteristics and the external factors (see Figure 1).
2.1. Terminology
Some of the psychological literature dealing with perception of the outside world uses the term “cognitive map” [33,34], but some authors use other terms, such as ”cognitive schema” [35], “cognitive image” [19,36] or “cognitive representation” [37]. These terms do not necessarily relate to perception of geographical space, but may involve, for example, perception of the spatial aspects of items [38]. Yet another term, “environmental images” [39], is used in environmental psychology. However, the term “mental map” [40,41*,42*] is becoming increasingly frequent in geographical literature, though “mental images” [43] and “mental representation” [44,45*,46] are also used.
As with “cognitive” and “mental”, the terms “map”, “image(s)” and “presentation” may be used interchangeably (see [38]). Based on their definitions in the literature [4,38], mental map and cognitive map can be considered synonyms, and the term mental map will be used in this paper. A mental map can generally be characterised as an individual’s internal perception of the outside world in the context of geographical space [47].
Terminological ambiguity prevails even in the use of the term “sketch map” for the result of visually recalling a mental map. Studies use, for example, “a free recall (sketch) map” [11*], “a free hand drawing” [48*], “a sketch map” [49*] or “a croquis” [50].
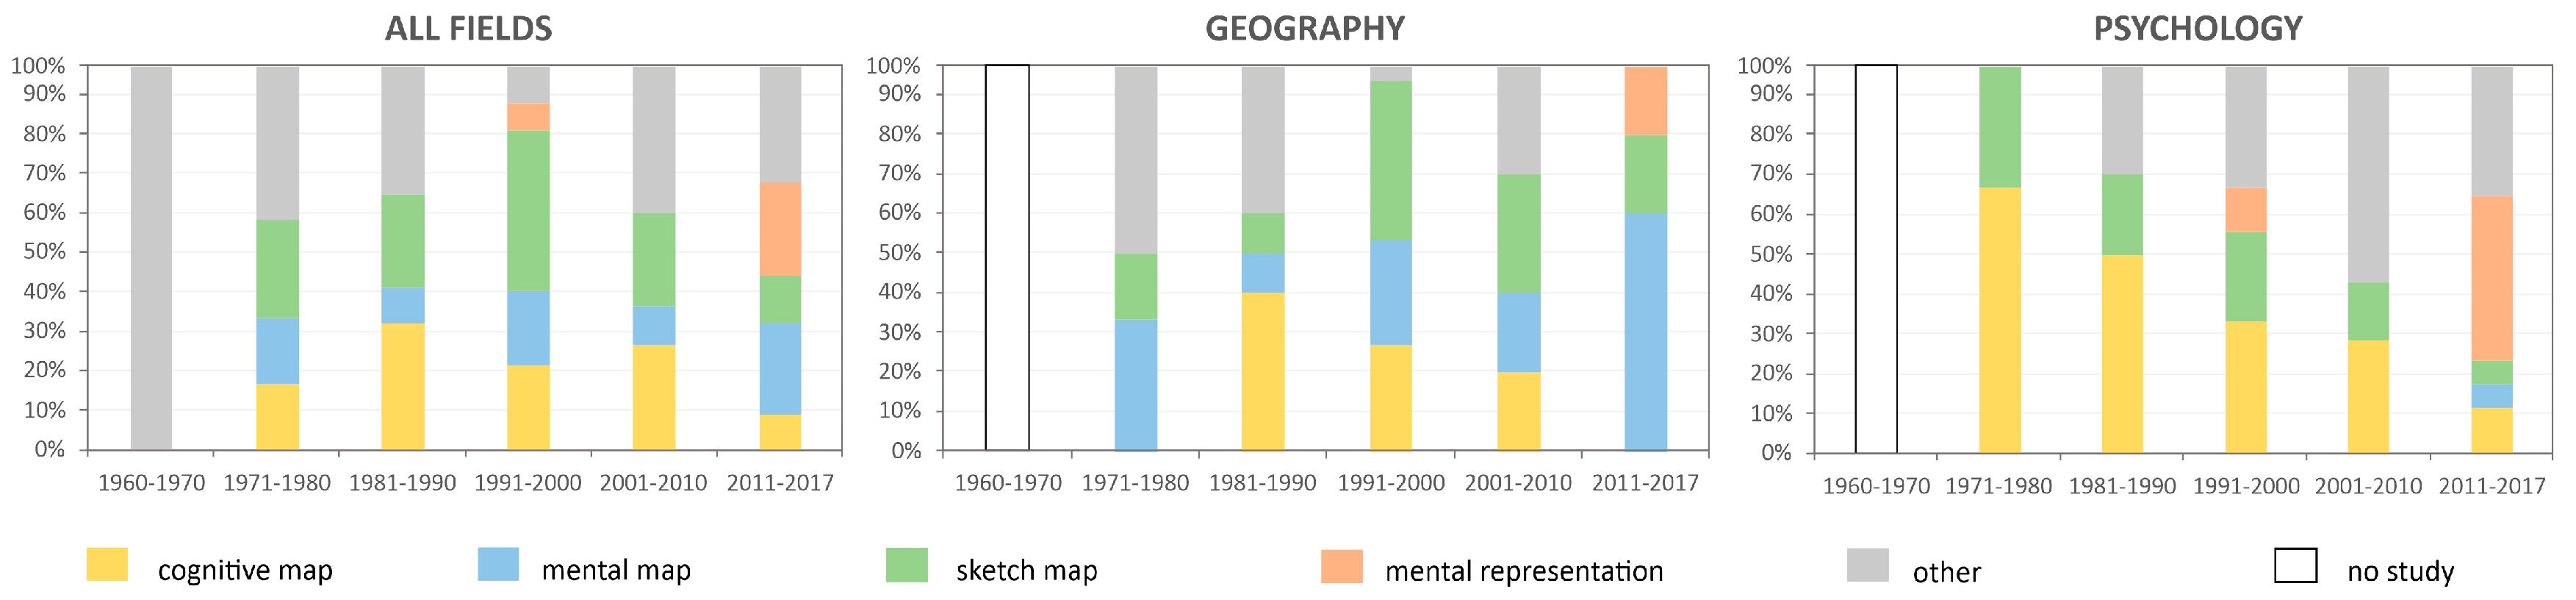
A temporal analysis of the terminology (Figure 2) shows that the most frequent terms used in the 90 studies analysed in this review are a mental map, a cognitive map, a sketch map and a mental representation. Their use differs from decade to decade and field to field. While geographical studies tend to use mental map, cognitive map is more frequent in older psychological papers. However, in more recent psychological literature, cognitive map is giving way to mental representation. On the other hand, the use of the term mental map is more common in recent geographical studies than in older ones. However, more research is needed on the changing terminology related to the spatial perceptions.
2.2. Factors
The mental map is affected by factors (independent variables) that influence an individual when creating, storing or recalling information from memory. Although studies have indicated that individuals’ mental maps can differ under the influence of various factors, and have therefore approached these factors as variables, almost none of the studies have attempted to sort the factors or investigate the systematic selection of the factors in empirical research. Only a small number of authors have classified the factors that influence sketch maps [2,51]. On the basis of their work, it is possible to distinguish between external factors and individual differences (see Figure 1). External factors can be categorised as primary or secondary factors, depending on the type of source of spatial information (see [2]). The individual differences, on the other hand, include biological, psychological and sociocultural factors [29]. This classification is in agreement with the process of spatial perception [28] (see Figure 1). These are the categories we use to classify all the factors discussed in this paper.
2.3. Methods of Collecting Information about Mental Maps
Various methods have been used for collecting information about mental maps, depending on the aim and scope of the research. The approaches can be broadly divided into uni-dimensional and two-dimensional tests [52].
Uni-dimensional tests are primarily focussed on spatial relations between two objects. They assess distance and direction tasks (more in [2]) or area estimations [53]. Two-dimensional tests are focussed on spatial relations between more than two objects, and can be further divided into three types: graphic and modelling tasks, completion tasks and recognition tasks [2].
Graphic and modelling tasks are processed by individuals using sketch maps or models. When doing completion tasks, individuals complete sentences about the relative position of objects. In recognition tasks, individuals recognize objects on a map [52]. Only studies using graphic and modelling tasks, which resulted in sketch maps, were considered for this paper. This method was chosen mainly because it allowed for more complex evaluation of spatial perception, using both qualitative and quantitative criteria. It is possible to evaluate not only the occurrence of objects on the sketch map, but also the relationships between several objects and the choice of cartographic methods used to design the sketch map.
The main limitation of this method is the individual’s drawing skills needed to convert information to a medium of good quality [2,54]. Some of the participants may have been unable to transfer the information from their mental map to the sketch map at a sufficient level of quality. An individual may not have been able to draw an object accurately, even if he or she had positioned them accurately in the mental map [21,55]. It is important to keep this limitation of the primary studies in mind when analysing their content.
2.4. Quality Evaluation of Sketch Maps
When evaluating the quality of a sketch map, it is possible to proceed from a cartographical evaluation of the map, based on positional accuracy, frequency of content and methods of depicting objects [56,57].
Content accuracy refers to the correct positioning [58*] and naming [49*,59*] of objects. Positional accuracy includes the absolute [60] and relative position [61] and the shape and size [62*] of objects. When evaluating absolute positional accuracy, studies have used methods of GIS buffer analysis [60]; the definition of identical points [63,64]; or transparencies [65]. Studies evaluating relative positional accuracy have assessed relative position with reference either to the mutual position of two objects, or to the points of the compass. Expert assessments [66*], GIS tools [61,67] or the overlay function [62*] have been used to evaluate both relative positional accuracy and shape and size [66*,68*,69*].
The evaluation of content frequency is more common. Studies count the frequency of objects within pre-set categories. The most frequent sorting method involves categorisation based on geometrical shapes [10,70*,71*,72*] or on the thematic classification of objects [9*,73*]. Some studies consider only the overall frequency of the drawn objects [74*,75*,76*].
3. Methodology
3.1. Literature Search
A broad literature search was carried out to locate peer-reviewed studies investigating sketch map quality that identified at least one factor influencing the sketch map quality.
The SCOPUS electronic database, which contains peer-reviewed articles from all of the aforementioned fields of study, was primarily used for the search. Using the terms discussed in the Terminology section, a search command was compiled (see Figure 3).
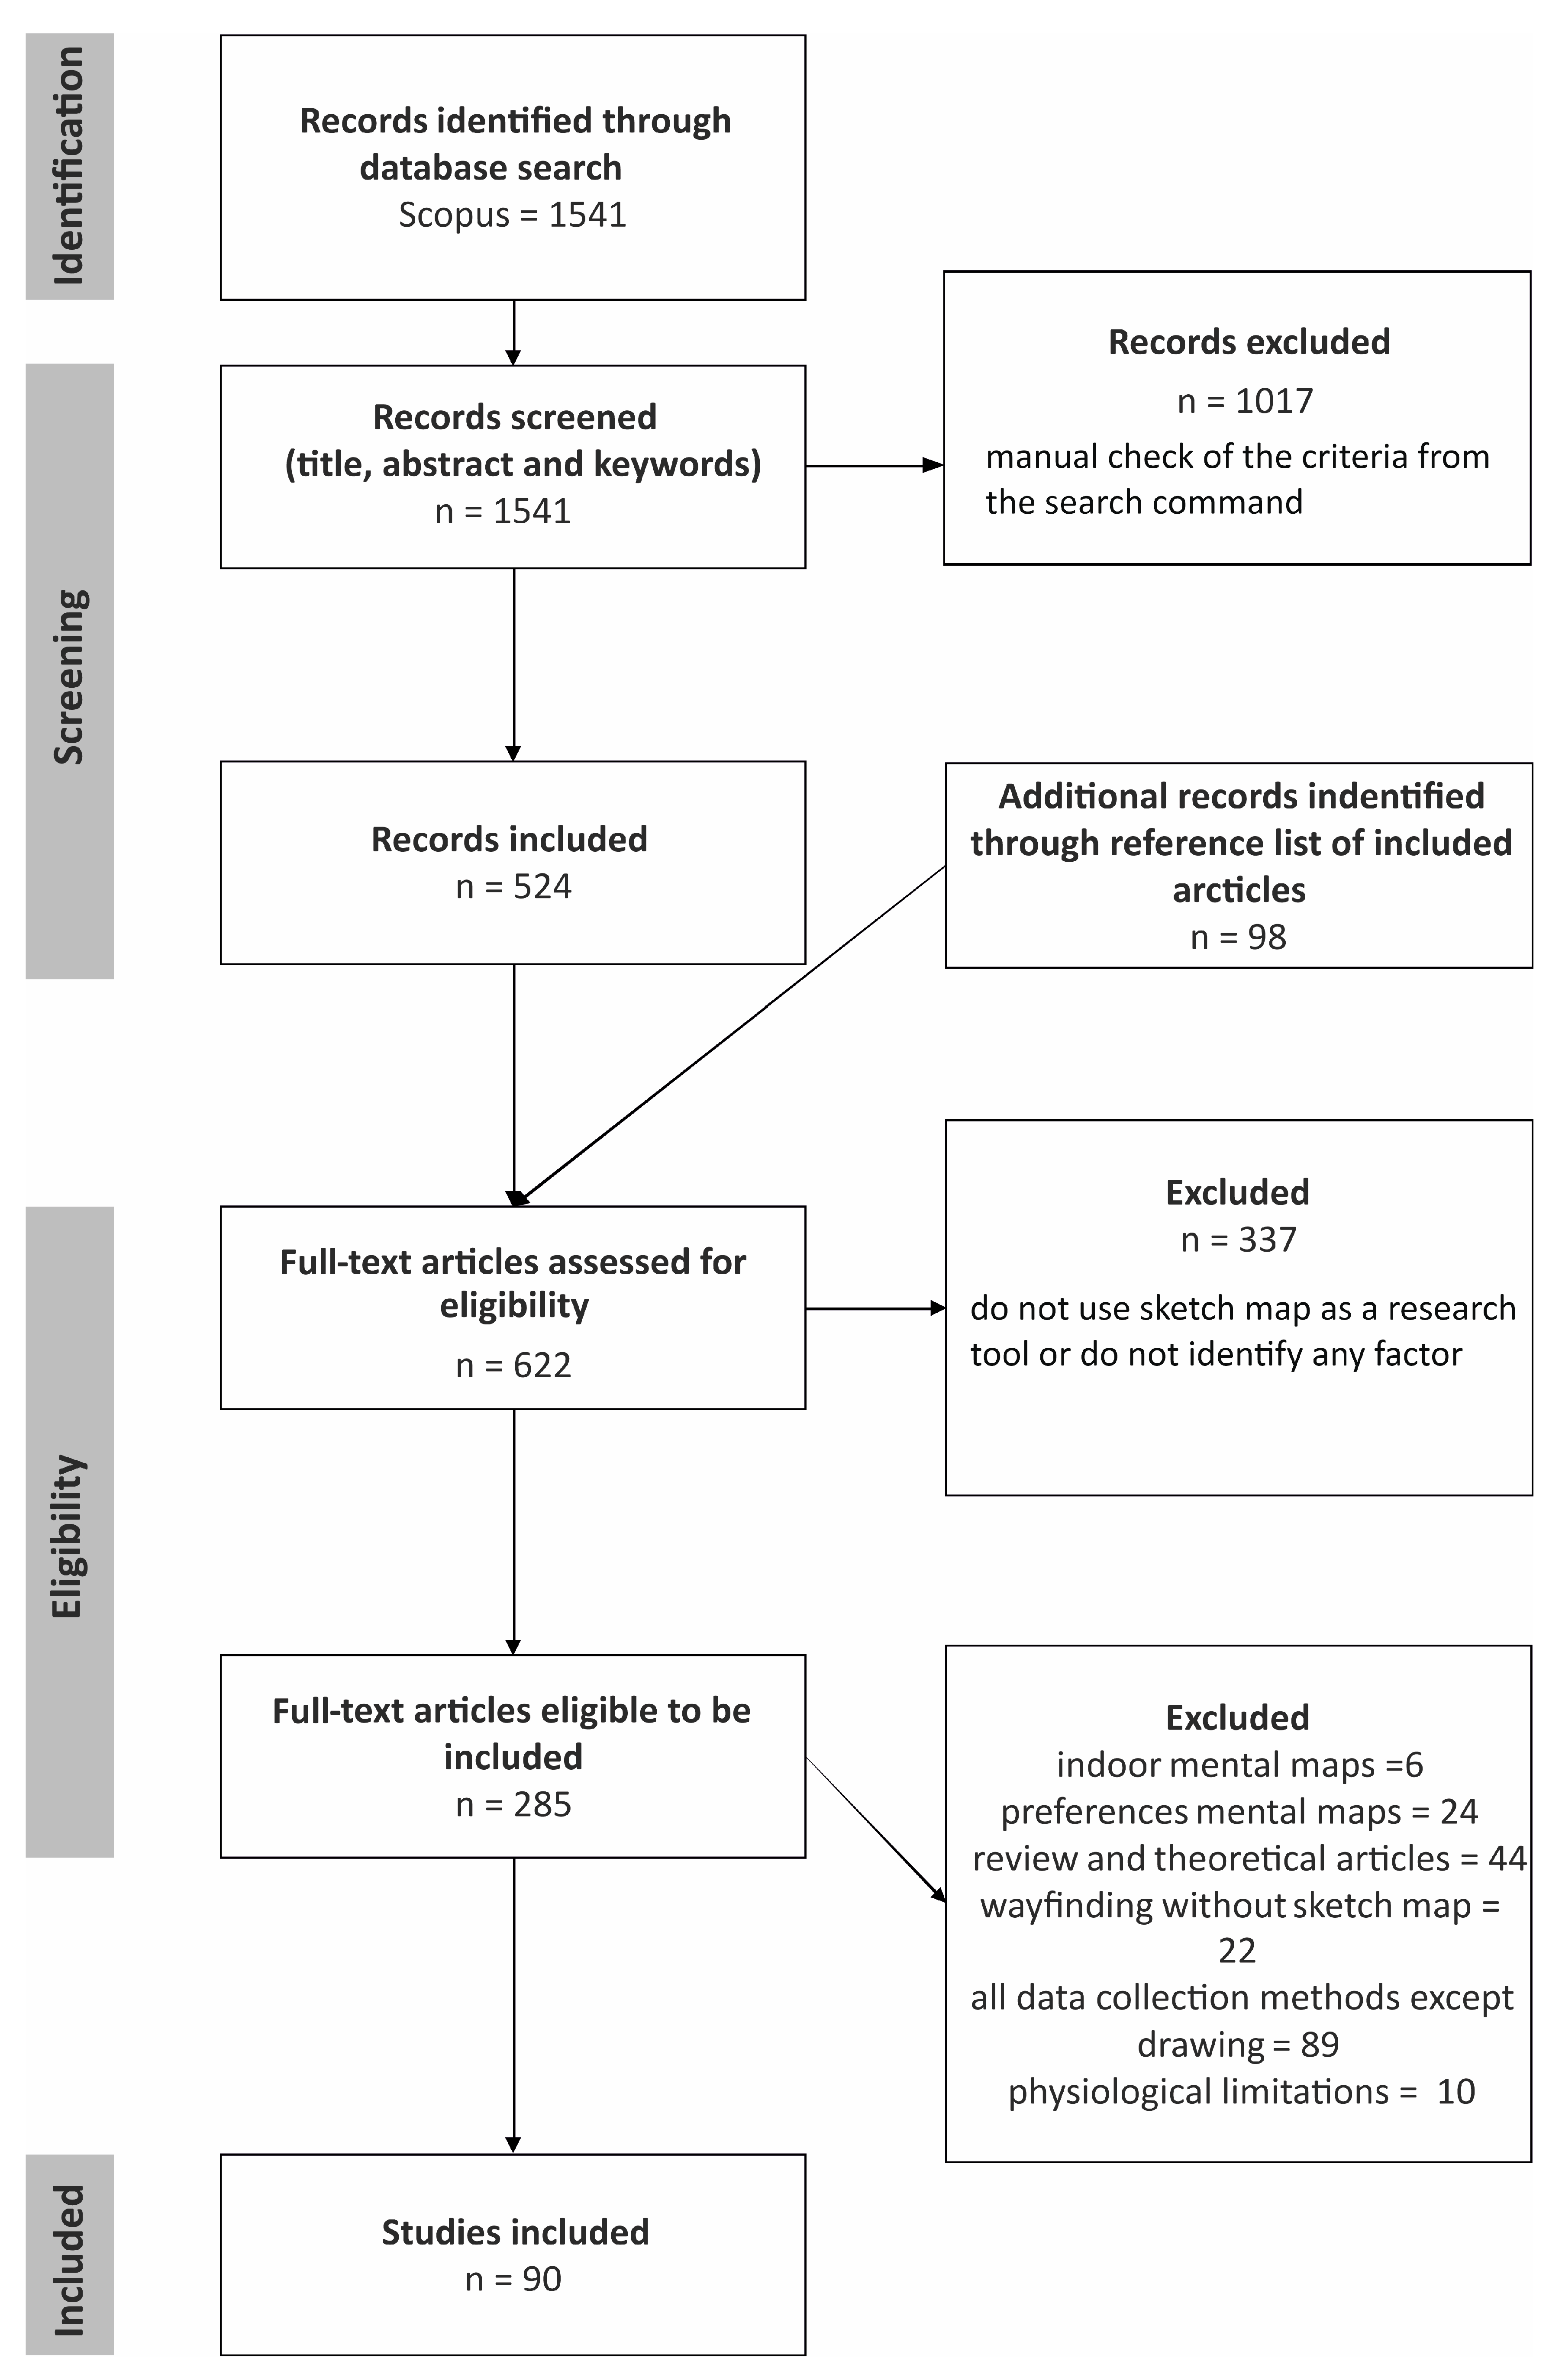
Given that the mental maps/sketch maps have been considered in a wide range of fields, it is not surprising that the search produced a total of 6710 articles. This total was further filtered to include only fields working with sketch maps in the geographical sense, namely earth and planetary science, the arts and humanities, the social sciences, environmental science and psychology. The results from the primary SCOPUS database search were then iteratively screened, and the list of “other keywords” for the search command was created to filter out undesirable studies (see Figure 3).
Furthermore, only articles published from 1960 to 2017 were selected, because mental maps have only been a significant geographical topic since the 1960s. The filter was also set to accept only articles in English. After the refinements, the search command found 1541 studies. Article information, including abstracts, was exported in CSV format. Since the intention was to acquire studies dedicated to the perception of geographical space, studies were excluded if they were unlikely to contain sketch maps; e.g., studies focussing on animals, child motor activity or teaching computers to imitate human behaviour via neural networks.
In the next phase, a primary assessment of abstracts and titles resulted in 524 articles. A further 98 studies were added after a detailed reference search in already-selected studies.
The last step was filtering articles based on content analysis of the full text, looking for the use of sketch maps as a data collection method and for identification of independent variables (factors) pertaining to sketch map quality. The search resulted in a final pool of 90 articles (see Figure 4).
3.2. Evaluation of the Provability of Factors
The evaluation of the influence of factors on sketch map quality is based on a combination of three quality parameters (see Section 2.4). For all three parameters, a given factor can be assessed as confirmed, unconfirmed, partially confirmed or nor investigated in the study under consideration (more in Table S1—online supplemental material). Partially confirmed factors are those factors for which only a part of the causality that has been investigated applies. For example, the influence of sex is partially confirmed: there was no difference in the number of elements drawn between women and men, but men drew more routes and women drew more significant elements [80*]. If a factor is confirmed in one study under one, two or all three quality parameters, and has not been investigated under the other parameters, then it is reported as confirmed in the overall quality. Factors that have not been confirmed or have been partially confirmed are treated equally. If in one study a factor is confirmed under one parameter and partially confirmed or unconfirmed under other parameters (with any value in the third quality parameter), then this factor is reported as partially confirmed in the overall quality.
Moreover, provability criteria were set to synthesize the general provability of the influence of each factor on sketch map quality. The provability of the factors has been designated using the rules set out in Table 1. Provability is the portion of studies which have confirmed the influence of the given factor on the sketch map; the number of studies represents the total number of studies that researched the influence of the given factor. The limit values for the criteria are data-driven, following the general recommendation (stated in [81]) of analysing at least five studies to identify the influence of the given factor (variable). When setting the limit value, possible values (5,7,10,15) were validated by statistical analysis (evaluation of data distribution) with the aim of high discrimination and reliability of the results. The limit value of five studies yielded the discrimination of about 30% (portion of factors meeting the requirement), while the other possible limit values considerably lowered the numbers of “proven” factors. Therefore, if a limit value above five was used, most factors would have been judged as “refuted”, and the results would have been less informative. However, the results of this study should be read keeping in mind the limitations of using the data-driven limit value for assessing the provability of factors.
The provability rules and the number of studies in which the given factor is investigated must be applied together. Factors that have been investigated in at least five studies and whose influence has been confirmed in at least 60% of them are considered proven. Factors that have been investigated in at least four studies and whose influence has been confirmed in less than 40% of them, are considered to be refuted. Factors that have been investigated in four studies and whose influence has been confirmed in 60% or more of them, or factors that have been investigated in more than four studies and whose influence has been confirmed in 40%–59% of them, are considered to be debatable. For some factors, it was not possible to designate a level of confirmation; these are factors that have been investigated in three studies or less.
Studies that focussed on multiple factors from one group or sub-group were counted multiple times (see numbers in brackets next to the individual groups of factors). For example, Appleyard’s study [74*] considers age and sex, which are biological factors, but also level of education, socioeconomic status and familiarity of place, which are sociocultural factors. This study has been counted twice under biological factors and three times under sociocultural factors, for a total of five time counts under individual differences.
4. Results
A total of 90 empirical studies were considered systematically (see their overview in Table S1—online supplemental material). The studies are evenly distributed over the decades (see Figure 5). The most frequently investigated were the sketch maps of college students (38;42%), followed by the sketch maps of adults (16;18%; see Figure 5). The largest number of papers comes from geography (26;29%), followed by psychology (23;25%) and education (15;17%; see Figure 5). The studies also vary in the scale of the area of interest; the studies mostly focussed on the global level (24;28%) and the level of local region (towns and cities; 23;26%), followed by the level of place (as the smallest level of geographical scale) and regional (continents) level (Figure 5).
The studies also differ in the methods used before the respondents were asked to draw a sketch map. The majority of the studies (60;67%) asked respondents to draw the sketch map from memory. In other studies, before doing their own drawing, respondents worked with either a map (9;10%), or some other source of information, such as the environment, or a text, an auditory description or a combination (17;19%). Other studies developed sketch maps as a part of a lesson (4;~4%).
4.1. Overall Quality Evaluation
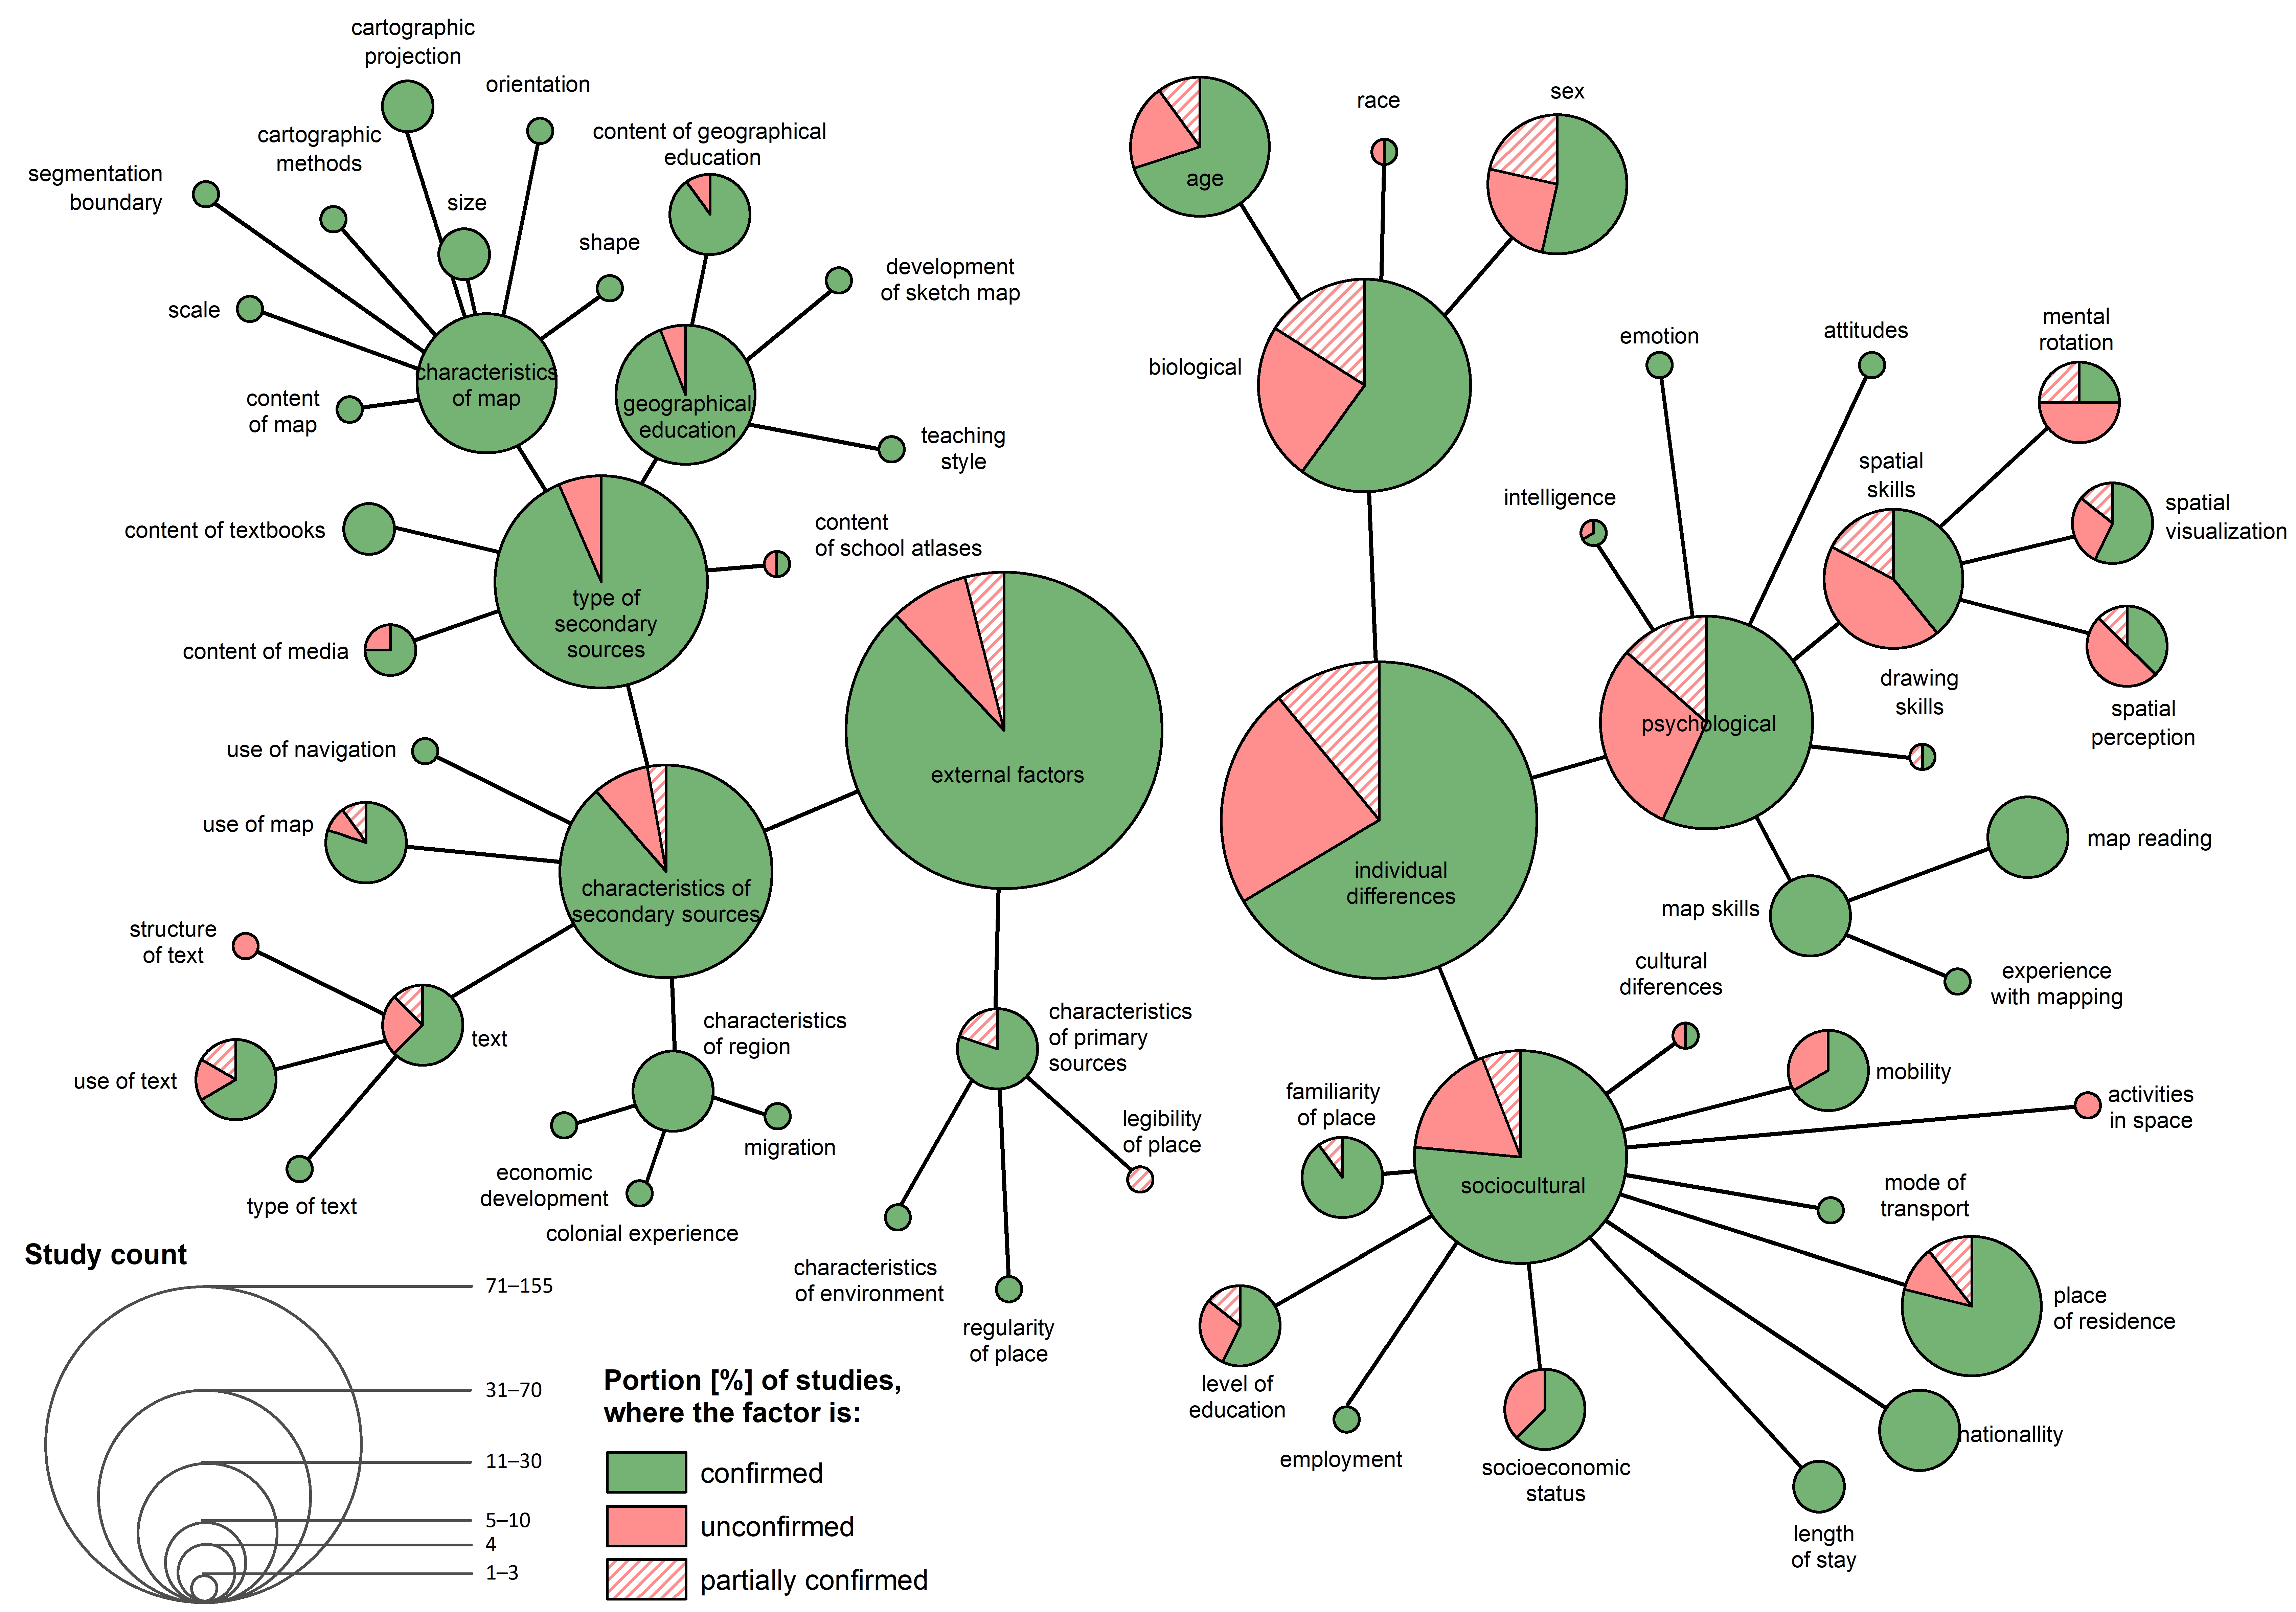
The review identified a total of 49 factors that influence sketch map quality. These factors were classified into groups and sub-groups (see Table 2). The studies tended to focus more on individual differences (155 cases) than on external factors (75). Within the category of individual differences, the predominant interest was in biological (50) and sociocultural (68) factors, rather than psychological ones (37). In the category of external factors, secondary sources (70) significantly outnumbered primary sources (5) (see Figure 6).
When assessing the overall quality of the sketch map, a total of ten factors were considered proven and two factors refuted, while eight factors were designated as debatable. More than half of the factors (29) cannot be assigned a provability value, because they have been researched in too few studies.
Within individual differences, the factors that were considered proven are age (14 confirmed, 2 partially confirmed, 4 unconfirmed; biological factor), map reading (6,0,0; psychological) and five sociocultural factors: mobility (6,0,3), place of residence (15,2,2), familiarity of place (9,1,0), nationality (5,0,0) and socioeconomic status (5,0,3). Within external factors, we consider proven the use of a map (8,1,1), the use of a text (4,1,1) and the content of the geography education (9,0,1), which belong to secondary sources.
Only four studies entirely failed to confirm the influence of age, and its influence was partially confirmed in two studies. The sketch map quality changes most distinctly in the age group of six to twelve [8*,9*], where older children depict the territory more precisely [8*,9*]; the content of the sketch map increases [11*,71*,82*]; the elements depicted change from natural to functional [8*]; and the choice of cartographic methods changes, with younger children selecting more pictorial elements and older children tending to select elements of Euclidean geometry [8*]. Notably, most of the studies [7*,74*,83*,84*,85*] that did not confirm or partially confirmed the influence of age on the sketch map did not use the age categories associated with individual cognitive development (see [24] for more), which may explain their failure to prove this dependency. Only the Drumheller [48*] study failed to confirm the influence of age on sketch map quality despite designating age categories according to cognitive development. This may be due to a different method of data collection (respondents were asked to draw not only a map of the world, but also the figure of the woman) where other specific factors can apply.
In the case of the map reading factor, authors [75*,76*,84*,86*,87*,88*] agree that the resulting sketch map is of better quality if the respondents read the geographical/topographical map shortly before drawing their sketch maps (for details see Table S1—online supplemental material).
The influence of mobility on the overall quality of the sketch map has been confirmed in studies focussing on respondents in developed countries. Research [75*,89*,90*,91*] has indicated that increased mobility has an influence on both positional accuracy and content. It was confirmed that less mobile people tend to draw lines, while more mobile people tend to draw more areas [92*]. The influence of mobility was unconfirmed in two studies focussing specifically on respondents from developing countries [93*,94*]. The developing economy is reported as a precondition, since travel is less frequent in these countries due to the poor economic situation of the inhabitants. Kask and Hannust [95*] later concluded that mobility is merely an ancillary factor.
The next factor which has been proven is place of residence. Only two studies failed to confirm this factor, and two studies partially confirmed it. Individuals draw more objects on maps of the neighbourhood of their place of residence [85*,96*], and they draw them with greater positional accuracy [62*,97*,98*,99*]. However, Lee and Schmidt [83*] state that proximity to the place of residence does not guarantee that the sketch map would be more diverse. Most of the unconfirmed and partially confirmed studies involved the creation of a sketch map of a larger territorial unit (or even of the whole world) [42*,100*,101*].
The factor of familiarity of place is closely linked to the factor of place of residence. The better the respondents know the given place, no matter whether from primary or secondary sources, the more elements they draw, and with greater accuracy [7*,74*,102*,103*,104*]. The Evans, Marrero and Butler [105*] study also discovered that the number of nodes and paths increases along with familiarity of place, but the number of significant elements does not change.
Place of residence and familiarity of place are also closely associated with nationality. Five studies focussed on differences in overall quality related to nationality, and all confirmed differences for sketch maps on both a global [73*,106*] and a local scale [107*,108*,109*].
Three studies failed to confirm the influence of socioeconomic status on the overall quality of sketch maps. However, each of these studies focussed on a different quality parameter [85*,110*,111*]. Other studies indicate that people with higher status have better quality sketch maps [41*,74*,89*,112*], i.e., they draw more elements, have greater positional accuracy and tend to draw spatial map types that correspond more to the real map. Only Çanakcioğlu [113*] states that the sketch maps of people with lower earnings include more objects than those of people with higher earnings. Çanakcioğlu argues that lower-income people spend more time outdoors and therefore have more opportunities to develop their mental maps.
The last three factors that have been proven to influence the overall quality of a sketch map are the use of maps and texts and the content of geographical education—all external factors. Studies usually investigate the first two simultaneously, and then compare them. The majority of studies (6) indicate that sketch maps based on a real map are better than those based on a text [114*,115*,116*,117*]. Only one study failed to confirm this conclusion, finding no difference between the use of a map and a text [118*]. One study confirmed that both a map and a text had a positive impact [119*]. Further studies that have investigated the influence of using a map and compared it with that of navigation [120*] or of observing the environment [86*] have confirmed that sketch maps created on the basis of map work are better. Two other studies [121*,122*] state the opposite: that respondents’ sketch maps are of better quality if they learn directly from the environment. However, results could be influenced by the fact that both of these studies focus on an area familiar to the participants.
Although the influence of the characteristics of the source map (cartographic projection, scale, orientation and the shape and size of the depicted region) was confirmed in all studies, the research is fragmented in terms of several further sub-factors. It is therefore not possible to unequivocally prove their influence, because they have been studied relatively rarely.
The influence of the content of geographical education is visible not only in the number of objects drawn [96*,101*], but also in the structure of the sketch map content, because respondents usually draw countries with advanced economies or large states [66*,123*,124*] which is often paid more attention in lessons.
Two of the three spatial skills—mental rotation and spatial perception—may be considered not to influence the overall sketch map quality. The influence of the third spatial skill, spatial visualisation, is debatable.
Certain factors may influence only some components of the sketch map quality, namely positional accuracy, content frequency or choice of cartographic methods.
4.2. Positional Accuracy
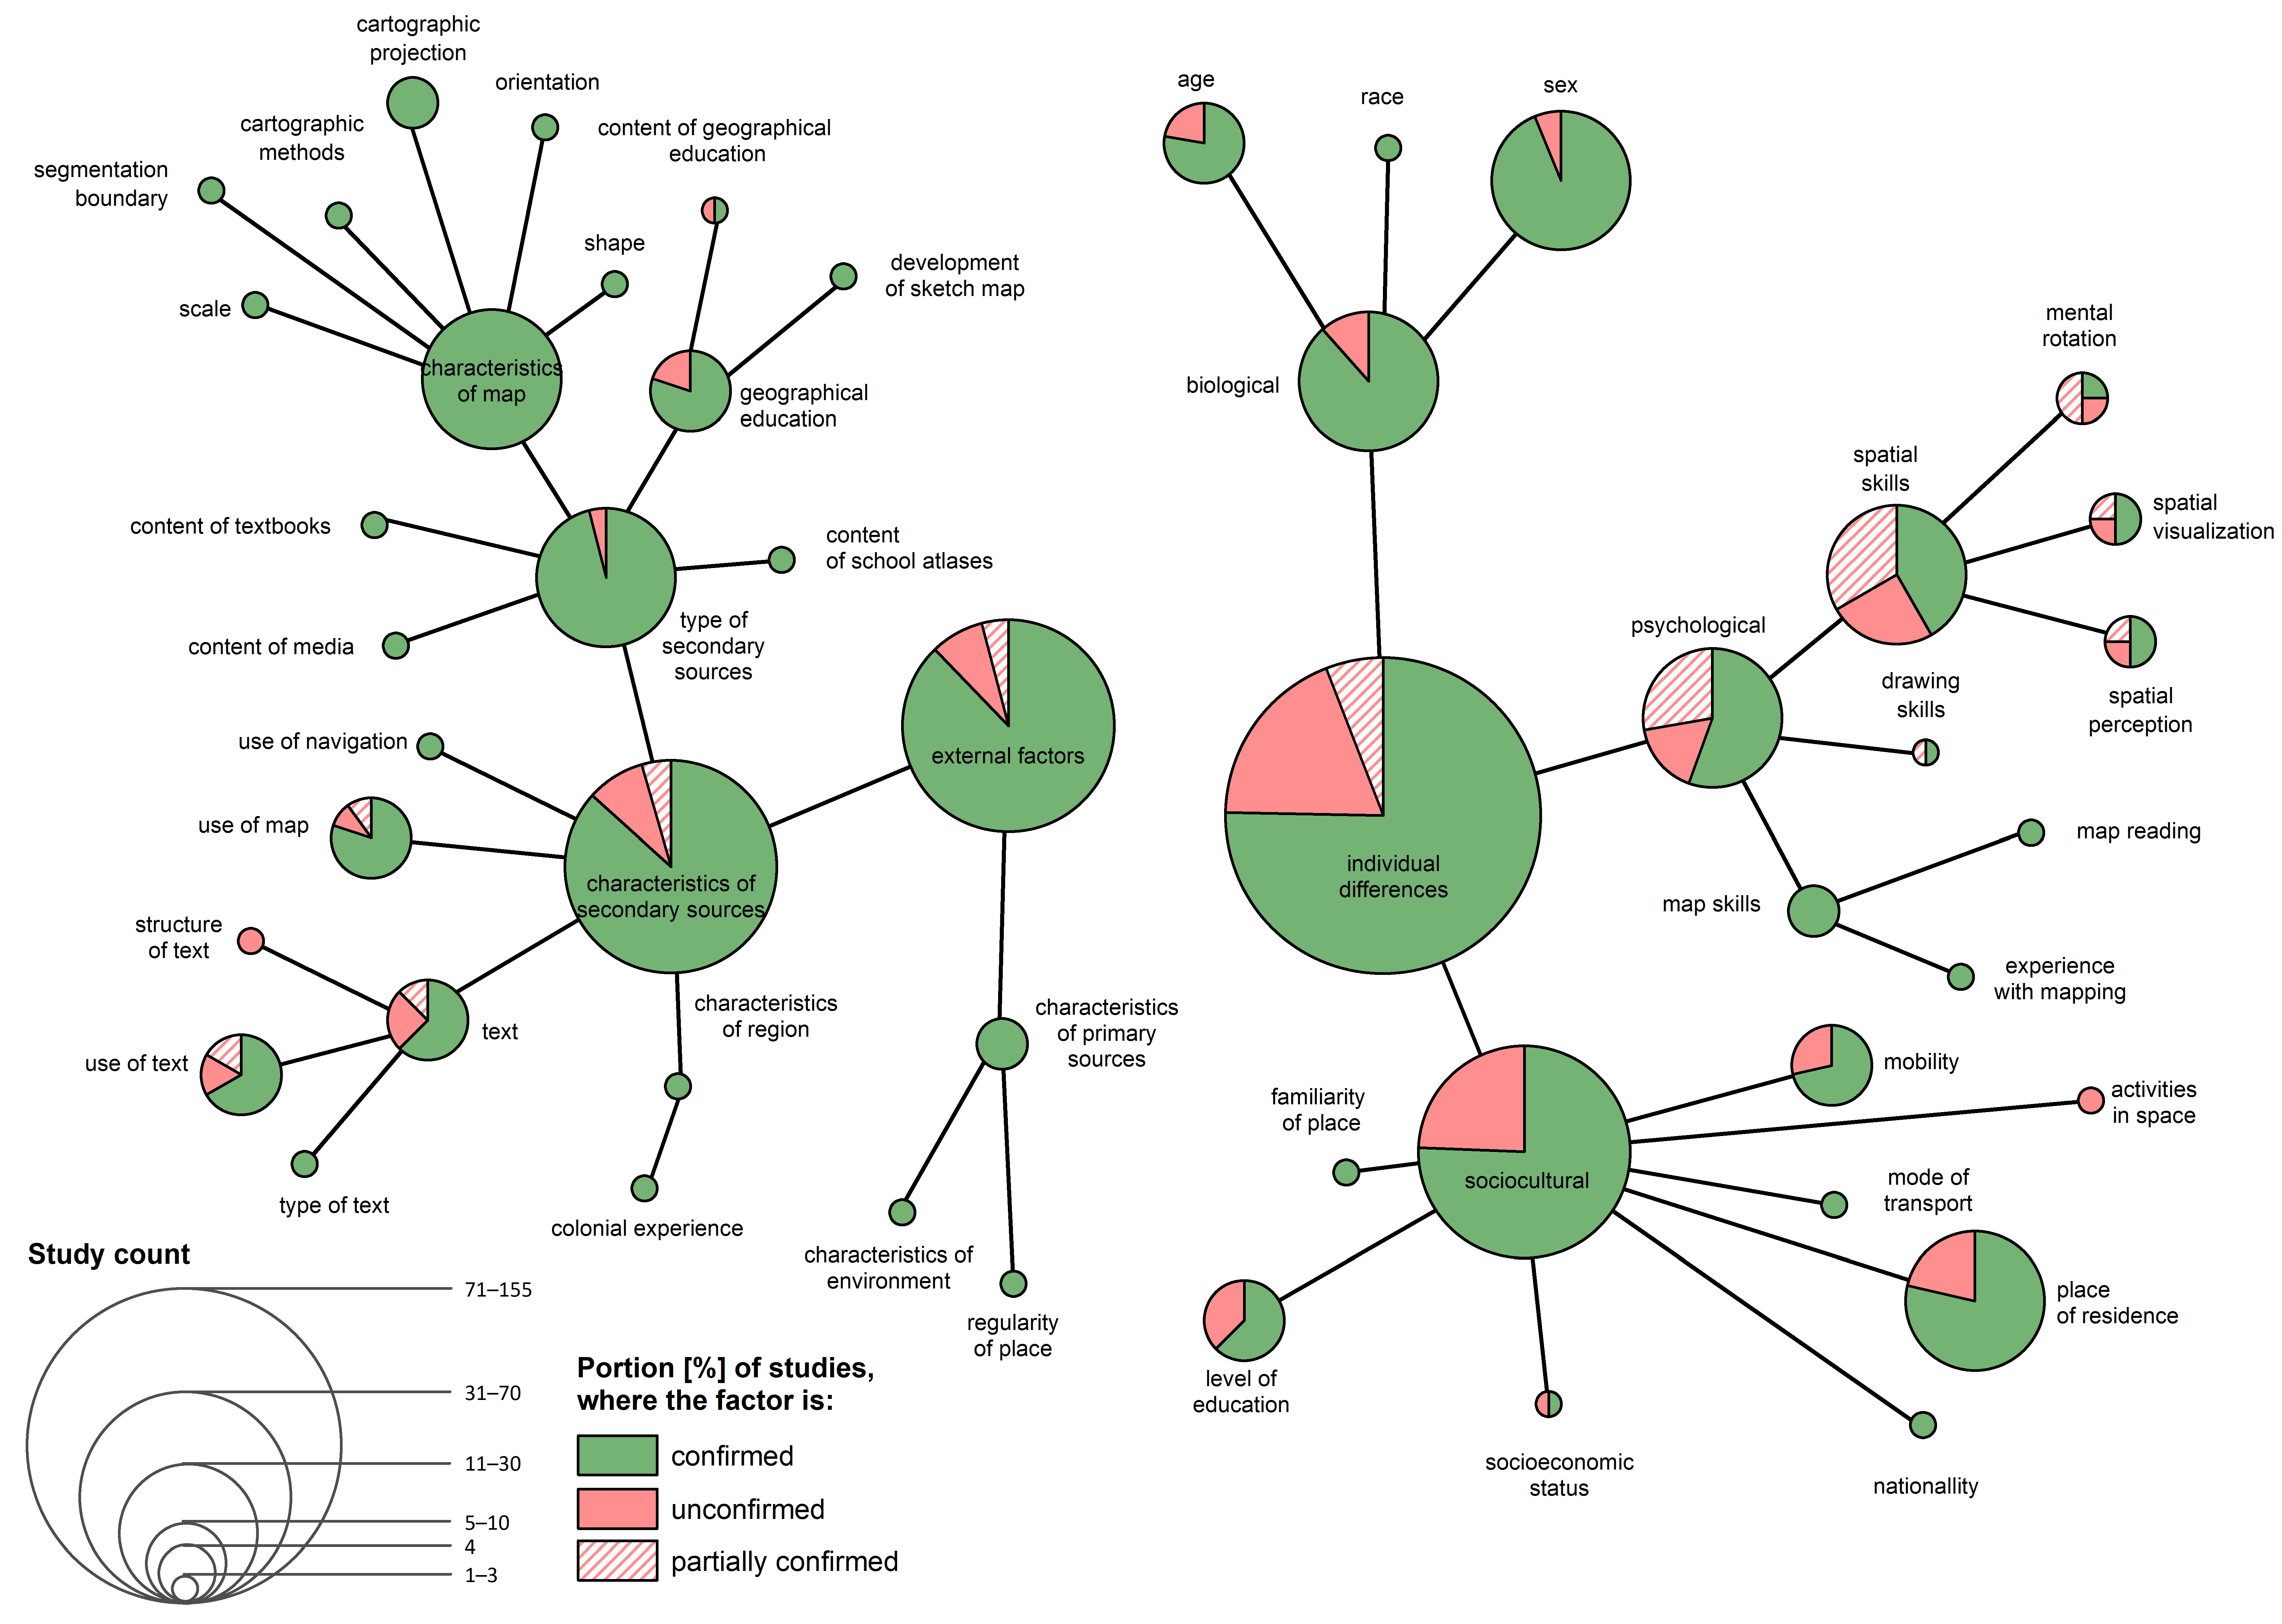
Studies focussing on positional accuracy focussed more often on individual differences (85 cases) than on external factors (49). The predominant individual characteristics studied were sociocultural factors (41), followed by biological (26) and psychological (18) factors. For external factors, the majority of studies focussed on secondary sources (45), with only four such studies focussing on primary sources. The studies did not include all the factors (see Figure 7) mentioned in the evaluation of the overall quality (see Figure 6), omitting, for example, attitudes, emotions and intelligence. Seven factors were classified as proven, one as refuted, three as debatable and 27 as “not-enough-evidence”.
As with general quality, proven factors include age (biological; 7 confirmed, 0 partially confirmed, 2 unconfirmed), mobility (sociocultural; 5,0,2), place of residence (sociocultural; 11,0,3), use of a map (secondary sources; 8, 1, 1) and use of a text (secondary sources; 4,1,1). Unlike with general quality, sex is an unequivocally proven factor (biological; 15,0,1). The other factor that is debatable for general sketch map quality but proven for positional accuracy is the level of education (sociocultural; 5,0,3). It is also worth mentioning that positional accuracy increases with age, travel, proximity of the drawn area to the place of residence and learning from a map rather than a text.
Sex is a significant factor, as men draw sketch maps with greater positional accuracy than women. Only one study [11*] out of 16 failed to confirm the differences between men and women when drawing a sketch map. This study differed from the others in that the sketch map was drawn on a sphere (3D) rather than on a flat sheet of paper (2D).
A further factor that can be considered proven is the level of education. Five studies confirmed the influence of this factor on positional accuracy, while three failed to do so. The level of education (which is closely associated with age) correlates positively with positional accuracy [74*,75*,94*]. Only two studies [85*,125*] stated that the level of education had little or no influence on positional accuracy. The influence of the field of study is more debatable. The available studies disagree as to whether pre-service primary teachers differ from pre-service secondary teachers [126*,127*]. Wiegand and Stiell [127*] state that geographers have the greatest positional accuracy in their sketch maps, followed by mathematicians, while humanities students have the lowest. It could be assumed that this difference is due to the more developed map skills and strategies of map work related to the field of geography and mathematics.
The influence of spatial skills (spatial perception and spatial visualisation) is debatable. Each of these has been investigated in four studies, but their influence has only been confirmed in two. The influence of mental rotation has been confirmed in one study [127*], unconfirmed in one [84*] and partially confirmed in two [128*,129*]. Thus, this factor can be considered refuted. The influence of spatial skills on positional accuracy requires further study, as do other not-enough-evidence factors, such as nationality, map orientation, cartographic projection and scale of the source map.
4.3. Content Frequency
Studies concerned with content frequency again focussed more on individual differences (100 cases) than on external factors (45). Within individual differences, the predominant interest was in sociocultural factors (43), followed by biological (36) and psychological factors (18). Within external factors, most studies (46) focussed on secondary sources, and only two on primary sources. The studies dealing with content frequency did not include all the factors (see Figure 8) related to overall quality (see Figure 6), omitting, for example, map scale, cartographic projection and cartographic methods. Other factors, such as emotion, attitudes, mode of transportation, structure of text, etc., were investigated in only one study. In total, more studies focussed on content frequency (72) than on positional accuracy (52). The small number of studies focussing on each factor makes the provability unclear.
As for overall quality, proven factors include age (biological; 11 confirmed, 0 partially confirmed, 2 unconfirmed), familiarity of place (sociocultural; 6,1,0), place of residence (sociocultural; 7,0,1), nationality (sociocultural; 5,0,0), socioeconomic status (sociocultural; 3,0,2), use of a map (secondary sources; 6,0,0) and content of geographical education (secondary sources; 8,0,1). Unlike with overall quality, the level of education (sociocultural; 3,0,2) is also considered proven.
The content frequency of sketch maps increases as participant age rises to adulthood. The content of geographical education also influences the content frequency of the sketch map, with the frequency of drawn elements higher for maps of the place of residence and other familiar places. If the respondents use a map, the frequency of drawn elements is higher than if the respondents use a text with the same number of objects mentioned. Different nationalities differ in the frequency of drawn elements [108*].
Two factors, namely the level of education and socioeconomic status, are at the cusp of provability. The level of education has been confirmed in three studies and unconfirmed in two. Secondary school grade does not influence the content frequency of sketch maps [85*,126*], but the general level of education does [74*,94*,130*]. Pupils at lower secondary schools drew fewer elements than pupils at upper secondary schools, just as labourers drew fewer than university students of the same age. Socioeconomic status, similarly, has been confirmed in three studies and unconfirmed in two. However, unlike with the level of education, no common trends have been found in the influence of socioeconomic status [111*,112*].
The debatable factor is sex. Out of 22 studies, sex was confirmed to influence content frequency in only 12, while nine studies did not confirm any influence and one confirmed partial influence. In studies that have confirmed the influence of sex on content frequency, the difference was observed in only one direction, i.e., women drew fewer elements in their sketch maps than men did [74*,83*,89*,131*]. Nine studies found no difference [7*,75*,80*,132*]. The research is even more inconsistent when classifying sketch map content in the manner of Lynch [39]. Some authors state that women draw more roads than men [72*,133*], while others state the opposite [76*,134*,135*]. Still others claim that the sketch maps of men and women do not differ in any way [70*]. It therefore seems that content frequency is influenced by factors other than sex.
As with positional accuracy, the refuted factors include spatial skills, but this time they are mental rotation and spatial perception [136*,137*,138*]. Spatial visualisation is considered a not-enough-evidence factor because it has been researched in only three studies [45*,136*,137*]. Content frequency, therefore, may be more dependent on the verbal component of perception, though it is also influenced by the non-verbal (imaginative) component (see [139]), while the opposite may be true of positional accuracy.
4.4. Cartographic Methods
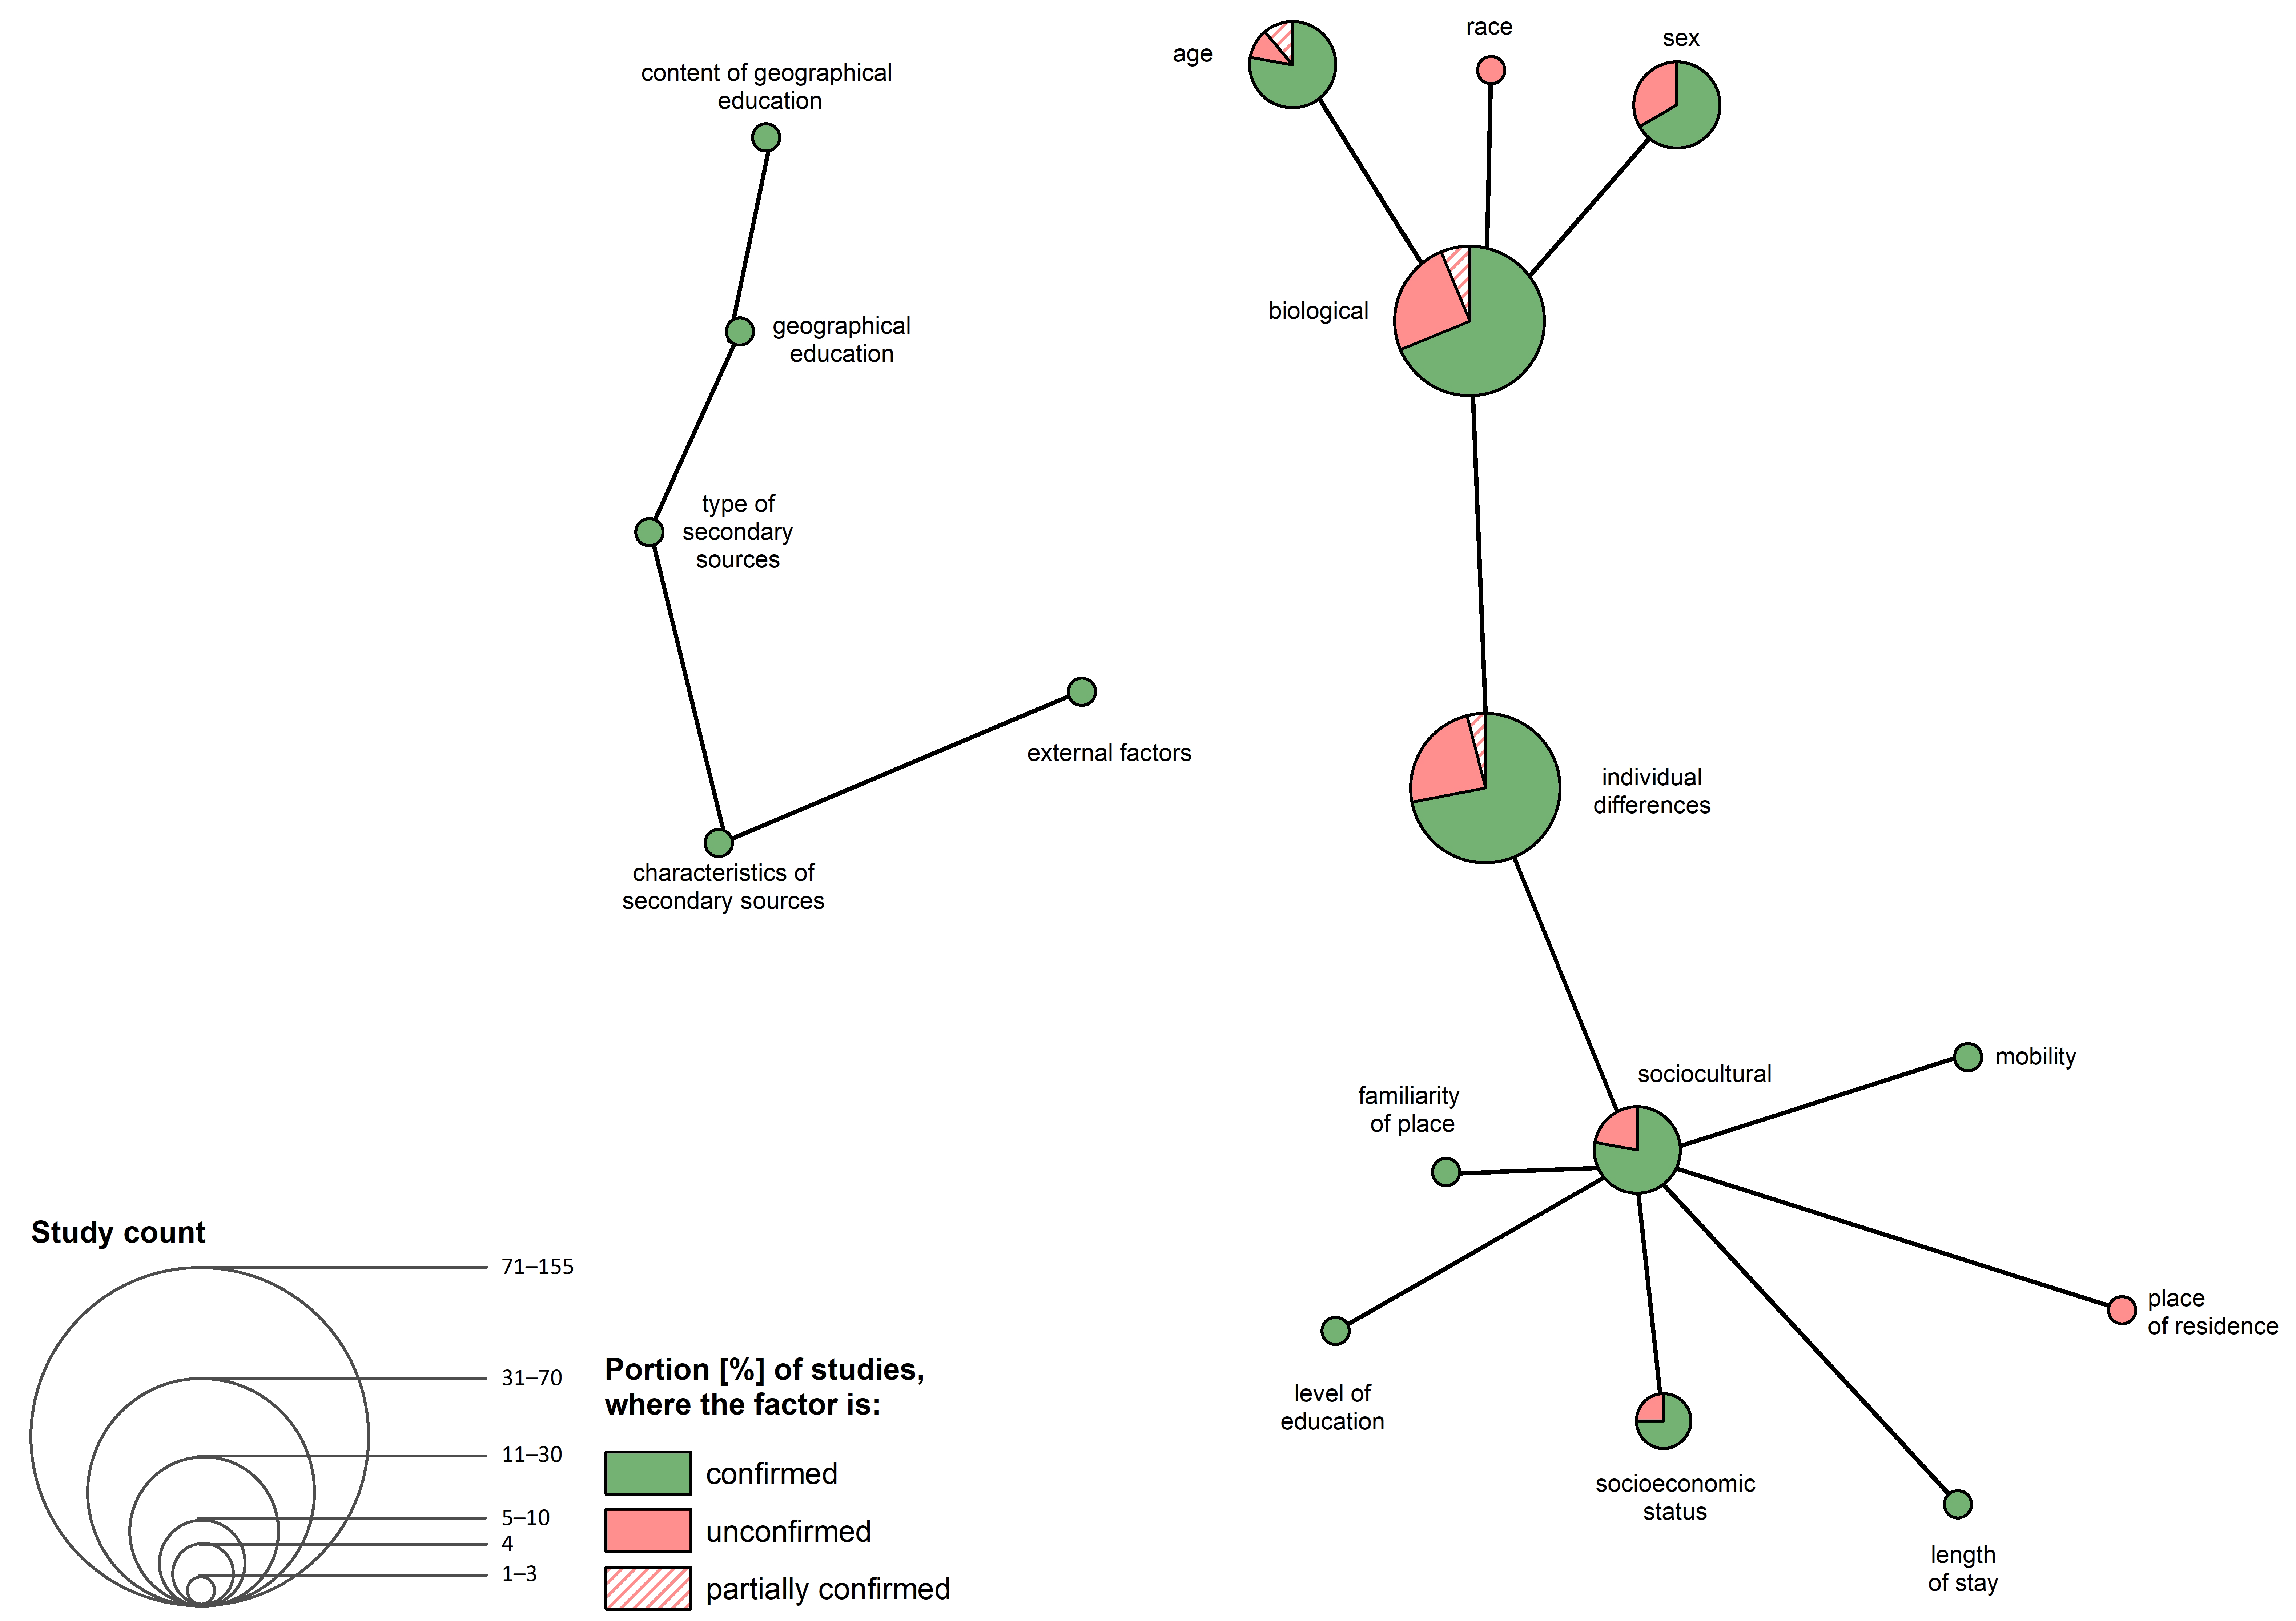
Only 26 studies focussed on factors influencing the choice of cartographic methods for the sketch map. These studies dealt more with individual differences (25 cases) than with external factors (1). For individual differences, the predominant interest was in biological factors (16), followed by sociocultural factors (9); no study focussed on psychological factors; and only one study dealt with external factors, specifically secondary sources (see Figure 9).
Age may be considered proven, as it was confirmed in seven studies out of nine. Studies of school-aged-children confirmed that younger pupils used more pictorial cartographic symbols, while older pupils drew objects using Euclidian geometry [8*,109*,111*]. Younger respondents also tended to choose the sequential type of sketch map, while older respondents tended to opt for the spatial type of sketch map [41*,71*]. Age was not confirmed in two studies [74*,83*]; however, both dealt only with adults.
In studies into the influence of sex, a trend appears of boys using Euclidean geometry at an earlier age than girls [77*], but there was no difference between adult men and women [140*]. Men and women also do not differ in terms of the graphic type of sketch map [83*].
The debatable factors include socioeconomic status. It seems to affect the selection of sequential or spatial sketch maps, with managers (executive positions) tending to opt for a spatial layout [74*], while people in non-managerial positions tended to opt for a sequential layout [41*]. The perception of people in non-managerial positions is more subjective than that of people in executive positions, who perceive space in a more complex manner, but usually from only one perspective (most often a bird’s eye perspective).
5. Usability and Limitations of Results
The results of this study have practical applications for cartography and geography education, and can serve as a framework for future research, especially in the area of designing user-friendly maps (visualizations of geographical data), or in geographical and environmental education.
Designing user-friendly maps is one of the core interests of cognitive cartographers, but research in this field does not benefit from the analyses of spatial perception and of maps sketched by the public. Studies in this field deal with the user-friendliness of either printed maps or geo-visualisations (related to the implementation of GIS) [141]. Information on the influence of external factors (specifically cartographic projection, content of maps and cartographic methods; Table 2) could be beneficial for the design of traditional printed maps. Moreover, knowledge of the influence of the individual differences between the users (e.g., age, sex, mobility; Table 2) should be taken into account when designing geo-visualisations using GIS. Such knowledge can be used to personalise the GIS applications, e.g., by using specific cartographic methods (symbols, colours, shapes, etc.).
Moreover, sketch maps can be used for the development of the mental maps of pupils [49*,97] or as a diagnostic tool for the evaluation of the pupils’ knowledge [69*,123*]. A systematic knowledge of the factors that influence sketch maps can help personalise geography teaching. Depending on the goals of the geographical education, the educator should work with those factors which have been unequivocally proven (age, familiarity of place, mobility, nationality, place of residence, socioeconomic status, use of a map and text) (see Table 2).
Similarly, the educator should keep in mind those factors which are debatable (sex, spatial visualisation, length of stay, level of education, cartographic projection and the media) and should be aware of the factors that are refuted (mental rotation and spatial perception) when using maps and developing pupils´ perception of space. Taking these factors into account when planning the lesson will make the lesson more efficient. When evaluating the pupils’ knowledge using a sketch map, the educator should also take into account the fact that the quality of the sketch map depends not only on the pupils’ knowledge, but also on a combination of other factors.
Findings can also be used when choosing the factors to be investigated in future research. As in the case of teaching, researchers should work with proven and debatable factors and keep in mind those which have not been proven. Future studies can focus on those factors which have yet to be sufficiently researched (see Figure 7 and Figure 8 and Table 2), but which are mentioned in the literature as affecting the quality of mental maps [2,21,142*]. From among differences between individuals, research should focus on the influence of creative and map skills, intelligence, attitudes and emotions [143,144]. It is recommended to pay attention to all the external factors when researching the influence of teaching on the mental maps of pupils. To date, there have been only sporadic empirical studies dealing with these factors [89*,92*,103*,142*]. None of the studies analysed focussed on the influence of the cartographic methods in the source maps on the choice of cartographic method in the sketch maps. This lack of research is unexpected, because the source maps serve as models for respondents while they are choosing their own symbol key. Further research can focus on the influence of the source map cartographic method on the choice of cartographic method in the sketch maps. Research can also focus on the dependence of the sketch map quality on the character of maps and other teaching materials (textbooks, workbooks) or on the educator’s teaching style.
Even though the analysis contains a relatively large number of empirical studies, it is also necessary to be aware of the limitations of its results. First, the sketch map yields limited information about the mental maps of individuals, which is related to their level of graphicacy (see Section 2.3).
It must also be noted that the analysis may have missed some of the factors that have been researched, and that some relevant studies may have been omitted if they did not meet one of the parameters in the search command (see Figure 1). For example, if they used different terminology or were not published in English. It may have also missed relevant studies if they were listed in a different database than SCOPUS. The search criteria must be kept in mind when assessing the results.
Another limitation to consider comes from the generalisation of the results, both at the level of the sketch map quality parameters and at the level of factor grouping. Each of the studies analysed has its specifics, not only in data collection and methodology, but also in sample size and characteristics. It was necessary to generalise the specifics so as to systematically synthesise the results from such an extensive sample.
It is also important to remember that the limit values of the provability were data-driven, and that further methodological research is needed to validate them.
Moreover, the studies analysed themselves have limitations that could influence the usefulness of the results of the review; for example, a study that collected data about factors did not necessarily report on the effects of all the factors considered. There are also limitations related to sample size: most of the studies investigated relatively small samples, mainly because of the demanding process of collecting data from a sketch map. The small sample size limits the generalisability of the results. However, this was eliminated in the review by setting the provability criteria to a higher portion of studies that confirmed the influence of the given factor.
Considering these limitations, it is recommended to consult the online supplemental material for the specifics of each study. Despite the limitations, the results of this review appropriately complement the results of the previous qualitative and small-sample reviews, and could be helpful in all related fields.
6. Conclusions
The findings clearly show that sketch map quality is influenced by a large number of factors. These include factors pertaining to the individual (such as biological, psychological and sociocultural factors) and factors arising from the external environment through information sources, either primary (i.e., directly from the environment) or secondary (i.e., mediating information about places of which the individual has no direct experience).
The content analysis has revealed a set of factors which predict that a sketch map will be of good quality, either as a whole or in terms of individual quality parameters. The best overall quality is produced by a well-travelled adult of higher socioeconomic status who is drawing a map of his or her neighbourhood based on information read from a map just before drawing. For the best positional accuracy, this individual should be a man, while for the best content frequency, the individual (male or female) should be educated in geography. Naturally, other factors that have not yet been sufficiently researched may also play a role.
The selection of factors in empirical studies depends on research design, especially on the component of sketch map quality considered and on the goal of the study. When comparing the results of empirical studies, it is always necessary to compare studies that have focussed on the same component of sketch map quality. In this regard, the review could serve not only as an overview of the results of existing studies, but also as a basis for a methodological framework for future research in the field. When preparing a research design, it should now be possible to choose approaches systematically according to research objectives and independent variables, so that the results could complement the knowledge from previous studies.
Supplementary Materials
Table S1: Main characteristics of reviewed studies [7*,8*,9*,11*,41*,42*,45*,48*,49*,58*,59*,62*,66*,68*,69*,70*,71*,72*,73*,74*,75*,76*,77*,80*,82*,83*,84*,85*,86*,87*,88*,89*,90*,91*,92*,93*,94*,95*,96*,97*,98*,99*,100*,101*,102*,103*,104*,105*,106*,107*,108*,109*,110*,111*,112*,113*,114*,115*,116*,117*,118*,119*,120*,121*,122*,123*,124*,125*,126*,127*,128*,129*,130*,131*,132*,133*,134*,135*,136*,137*,138*,140*,141,142*,143,144,145*,146*,147*,148*,149*,150*,151*]. The following are available online at https://0-www-mdpi-com.brum.beds.ac.uk/2220-9964/9/4/271/s1.
Author Contributions
Conceptualization, Martin Hanus and Kateřina Hátlová; methodology, Martin Hanus and Kateřina Hátlová; analysis, Kateřina Hátlová; investigation, Kateřina Hátlová and Martin Hanus; writing, Kateřina Hátlová and Martin Hanus; visualization, Kateřina Hátlová; supervision, Martin Hanus. All authors have read and agreed to the published version of the manuscript.
Funding
This research was funded by the Charles University under Charles University Research Centre, grant number UNCE/HUM/024.
Conflicts of Interest
The authors declare no conflict of interest. The funders had no role in the design of the study; in the collection, analyses or interpretation of data; in the writing of the manuscript, or in the decision to publish the results.
References
- Uttal, D.H.; Sheehan, K.J. The development of children’s understanding of maps and models: A prospective cognition perspective. J. Cogn. Educ. Psychol. 2014, 13, 188–200. [Google Scholar] [CrossRef]
- Kitchin, R.M.; Blades, M. The Cognition of Geographic Space; Tauris: London, UK, 2002. [Google Scholar]
- Waller, D.; Nadel, L. (Eds.) Handbook of Spatial Cognition; American Psychological Association: Washington, DC, USA, 2013. [Google Scholar]
- Kitchin, R.M. Cognitive maps: What are they and why study them? J. Environ. Psychol. 1994, 14, 1–19. [Google Scholar] [CrossRef]
- Tversky, B. Cognitive maps, cognitive collages, and spatial mental models. In Spatial Information Theory A Theoretical Basis for GIS.; Frank, A.U., Campari, I., Eds.; Springer: Berlin/Heidelberg, Germany, 1993; Volume 716, pp. 14–24. [Google Scholar]
- Kuipers, B. The “map in the head” metaphor. Environ. Behav. 1982, 14, 202–220. [Google Scholar] [CrossRef]
- Blades, M. The reliability of data collected from sketch maps. J. Environ. Psychol. 1990, 10, 327–339. [Google Scholar] [CrossRef]
- Matthews, M.H. Environmental cognition of young children: Images of journey to school and home area. Trans. Inst. Br. Geogr. 1984, 9, 89–105. [Google Scholar] [CrossRef]
- Wiegand, P. Young children’s freehand sketch maps of the world. Int. Res. Geogr. Environ. Educ. 1995, 4, 19–28. [Google Scholar] [CrossRef]
- Manrique-Sancho, M.-T.; Avelar, S.; Iturrioz-Aguirre, T.; Manso-Callejo, M.-Á. Using the spatial knowledge of map users to personalize city maps: A case study with tourists in Madrid, Spain. ISPRS Int. J. Geo-Inf. 2018, 7, 332. [Google Scholar] [CrossRef] [Green Version]
- Wiegand, P. Children’s free recall sketch maps of the world on a spherical surface. Int. Res. Geogr. Environ. Educ. 1998, 7, 67–83. [Google Scholar] [CrossRef]
- Battersby, S.E.; Montello, D.R. Area estimation of world regions and the projection of the global-scale cognitive map. Ann. Assoc. Am. Geogr. 2009, 99, 273–291. [Google Scholar] [CrossRef]
- Brown, M.A.; Broadway, M.J. The cognitive maps of adolescents: Confusion about inter-town distances. Prof. Geogr. 1981, 33, 315–325. [Google Scholar] [CrossRef]
- MacEachren, A.M. Application of environmental learning theory to spatial knowledge acquisition from maps. Ann. Assoc. Am. Geogr. 1992, 82, 245–274. [Google Scholar] [CrossRef]
- Bereitschaft, B. Mapping creative spaces in Omaha, NE: Resident perceptions versus creative firm locations. ISPRS Int. J. Geo-Inf. 2018, 7, 263. [Google Scholar] [CrossRef] [Green Version]
- Gärling, T.; Selart, M.; Böök, A. Investigating spatial choice and navigation in large-scale environments. In A Handbook of Spatial Research Paradigms and Methodologies; Foreman, N.M., Gillett, R., Eds.; Lawrence Erlbaum: Hillsdale, NJ, USA, 1997; pp. 153–176. [Google Scholar]
- Golledge, R.G.; Stimson, R.J. Spatial Behavior: A Geographic Perspective; Guilford Press: New York, NY, USA, 1997. [Google Scholar]
- Novotná, K.; Hanus, M.; Hátle, J. Mentální mapa jako nástroj i předmět výzkumu geografického vzdělávání. Geografie 2017, 122, 382–407. [Google Scholar] [CrossRef] [Green Version]
- Lloyd, R. A look at images. Ann. Assoc. Am. Geogr. 1982, 72, 532–548. [Google Scholar] [CrossRef]
- Curtis, J.W. Transcribing from the mind to the map: Tracing the evolution of a concept. Geogr. Rev. 2016, 106, 338–359. [Google Scholar] [CrossRef]
- Evans, G.W. Environmental cognition. Psychol. Bull. 1980, 88, 259–287. [Google Scholar] [CrossRef]
- Boardman, D. The development of graphicacy: Childern´s understanding of maps. Geogr. Assoc. 1989, 74, 321–331. [Google Scholar]
- Boardman, D. Graphicacy revisited: Mapping abilities and gender differences. Educ. Rev. 1990, 42, 57–64. [Google Scholar] [CrossRef]
- Catling, S.J. Maps and cognitive maps: The young child’s perception. Geography 1979, 64, 288–296. [Google Scholar]
- Peterson, M.P. The mental image in cartographic communication. Cartogr. J. 1987, 24, 35–41. [Google Scholar] [CrossRef]
- Havelková, L.; Hanus, M. Map skills in education: A systematic review of terminology, methodology, and influencing factors. Rev. Int. Geogr. Educ. Online 2019, 9, 361–401. [Google Scholar]
- Saltan, F.; Arslan, Ö. The use of augmented reality in formal education: A scoping review. Eurasia J. Math. Sci. Technol. Educ. 2016, 13, 503–520. [Google Scholar] [CrossRef]
- Sternberg, R.J. Cognitive Psychology; Harcourt Brace College Publishers: San Diego, CA, USA, 1996. [Google Scholar]
- Hartl, P.; Hartlová, H. Velký Psychologický Slovník; Portál: Prague, Czech Republic, 2010. [Google Scholar]
- Descloux, V.; Maurer, R. Cognitive map recall test: A new specific test to assess topographical disorientation. Appl. Neuropsychol. Adult 2018, 25, 91–109. [Google Scholar] [CrossRef]
- Thill, J.-C.; Sui, D.Z. Mental maps and fuzziness in space preferences. Prof. Geogr. 1993, 45, 264–276. [Google Scholar] [CrossRef]
- Couclelis, H.; Gale, N. Space and Spaces. Geogr. Ann. Ser. B Hum. Geogr. 1986, 68, 1–12. [Google Scholar] [CrossRef]
- Hirtle, S.C.; Jonides, J. Evidence of hierarchies in cognitive maps. Mem. Cogn. 1985, 13, 208–217. [Google Scholar] [CrossRef] [PubMed] [Green Version]
- Tversky, B. Levels and structure of spatial knowledge. In Cognitive Mapping: Past, Present, and Future; Kitchin, R.M., Freundschuh, S., Eds.; Routledge: London, UK; New York, NY, USA, 2000; pp. 24–43. [Google Scholar]
- Gray, R.A. Classification schemes as cognitive maps. Ref. Libr. 1983, 3, 145–153. [Google Scholar] [CrossRef]
- Lowry, J.D.; Zonn, L.E. Cognitive images of the south: The insider’s view. Southeast. Geogr. 1989, 29, 42–54. [Google Scholar] [CrossRef]
- Downs, R.M.; Stea, D. (Eds.) Image & Environment: Cognitive Mapping and Spatial Behavior; Transaction Publishers: New Brunswick, NJ, USA, 2005. [Google Scholar]
- Tuan, Y.F. Images and mental maps. Ann. Assoc. Am. Geogr. 1975, 65, 205–212. [Google Scholar] [CrossRef]
- Lynch, K. The Image of the City; Publication of the Joint Center for Urban Studies; MIT PRESS: Cambridge, MA, USA, 1960. [Google Scholar]
- Gould, P.; White, R. Mental Maps, 1st ed.; Routledge: London, UK; New York, NY, USA, 1974. [Google Scholar]
- Pocock, D.C.D. Some characteristics of mental maps: An empirical study. Trans. Inst. Br. Geogr. 1976, 1, 493–512. [Google Scholar] [CrossRef]
- Saarinen, T.F. Centering of mental maps of the world. Natl. Geogr. Res. 1988, 112–127. [Google Scholar]
- Pocock, D.C.D. City of the mind: A review of mental maps of urban areas. Scott. Geogr. Mag. 1972, 88, 115–124. [Google Scholar] [CrossRef]
- Lowe, R.K. Constructing a mental representation from an abstract technical diagram. Learn. Instr. 1993, 3, 157–179. [Google Scholar] [CrossRef]
- Meneghetti, C.; Zancada-Menéndez, C.; Sampedro-Piquero, P.; Lopez, L.; Martinelli, M.; Ronconi, L.; Rossi, B. Mental representations derived from navigation: The role of visuo-spatial abilities and working memory. Learn. Individ. Differ. 2016, 49, 314–322. [Google Scholar] [CrossRef]
- Wiegand, P. School students’ mental representations of thematic point symbol maps. Cartogr. J. 2002, 39, 125–136. [Google Scholar] [CrossRef]
- Golledge, R.G. Human wayfinding and cognitive maps. In Colonization of Unfamiliar Landscapes: The Archaeology of Adaptation; Rockman, M., Steele, J., Eds.; Routledge: London, UK; New York, NY, USA, 2003; pp. 25–43. [Google Scholar]
- Drumheller, S.J. Conjure up a map—A crucial but much neglected skill. J. Geogr. 1968, 67, 140–146. [Google Scholar] [CrossRef]
- Metz, H.M. Sketch maps: Helping students get the big picture. J. Geogr. 1990, 89, 114–118. [Google Scholar]
- Orlove, B. The ethnography of maps: The cultural and social contexts of cartographic representation in Peru. Cartogr. Int. J. Geogr. Inf. Geovisualization 1993, 30, 29–46. [Google Scholar] [CrossRef]
- Liben, L.S. Spatial representation and behaviour: Multiple perspectives. In Spatial Representation and Behavior Across the life Span: Theory and Application; Liben, L.S., Patterson, A.H., Newcombe, N., Eds.; Developmental psychology series; Academic Press: New York, NY, USA, 1981. [Google Scholar]
- Kitchin, R.M. Collecting and analysig cognitive mapping data. In Cognitive Mapping: Past, Present, and Future; Freundschuh, S., Kitchin, R.M., Eds.; Routledge frontiers of cognitive science; Routledge: London, UK; New York, NY, USA, 2000; pp. 9–23. [Google Scholar]
- Lapon, L.; De Maeyer, P.; Vanhaeren, N.; Battersby, S.; Ooms, K. Evaluating young people’s area Estimation of countries and continents. ISPRS Int. J. Geo-Inf. 2019, 8, 125. [Google Scholar] [CrossRef] [Green Version]
- Bell, S.; Iong, J. Sketch mapping and geographic knowledge: What role for drawing ability? In Proceedings of the Spatial Knowledge and Information, Fernie, BC, Canada, 19–22 February 2009; Volume 2, pp. 19–24. [Google Scholar]
- Wilmot, D. Investigating children’s graphic skills: A South African case study. Int. Res. Geogr. Environ. Educ. 2002, 11, 325–340. [Google Scholar] [CrossRef]
- Gilmartin, P. The cued spatial response approach to macro-scale cognitive maps. Can. Geogr. Le Géographe Canadien 1985, 29, 56–59. [Google Scholar] [CrossRef]
- Slocum, T.A. Thematic Cartography and Geovisualization, 3rd ed.; Pearson New Internat, Ed.; Pearson Education: Harlow, UK, 2014. [Google Scholar]
- Harwood, D.; Rawlings, K. Assessing young children’s freehand sketch maps of the world. Int. Res. Geogr. Environ. Educ. 2001, 10, 20–45. [Google Scholar] [CrossRef]
- Chiodo, J.J. Improving the cognitive development of students’ mental maps of the world. J. Geogr. 1997, 96, 153–163. [Google Scholar]
- Okamoto, K.; Okunuki, K.; Takai, T. Sketch map analysis using GIS buffer operation. In Spatial Cognition IV.; Reasoning, Action, Interaction; Freksa, C., Knauff, M., Krieg-Brückner, B., Nebel, B., Barkowsky, T., Eds.; Springer: Berlin/Heidelberg, Germany, 2005; Volume 3343, pp. 227–244. [Google Scholar]
- Schwering, A.; Wang, J.; Chipofya, M.; Jan, S.; Li, R.; Broelemann, K. SketchMapia: Qualitative representations for the alignment of sketch and metric maps. Spat. Cogn. Comput. 2014, 14, 220–254. [Google Scholar] [CrossRef] [Green Version]
- Sanders, R.A.; Porter, P.W. Shape in revealed mental maps. Ann. Assoc. Am. Geogr. 1974, 64, 258–267. [Google Scholar] [CrossRef]
- Peake, S.; Moore, T. Analysis of distortions in a mental map using GPS and GIS. In Proceedings of the 16th Annual Colloquium of the Spatial Information Research Centre, Dunedin, New Zealand, 29–30 November 2004; pp. 75–84. [Google Scholar]
- Waterman, S.; Gordon, D. A quantitative-comparative approach to analysis of distortion in mental maps. Prof. Geogr. 1984, 36, 326–337. [Google Scholar] [CrossRef]
- Abel, R.R.; Kulhavy, R.W. Maps, mode of text presentation, and children’s prose learning. Am. Educ. Res. J. 1986, 23, 263–274. [Google Scholar] [CrossRef]
- Walmsley, D.J.; Saarinen, T.F.; MacCabe, C.L. Down under or centre stage? The world images of Australian students. Aust. Geogr. 1990, 21, 164–173. [Google Scholar] [CrossRef]
- Wang, J.; Schwering, A. Invariant spatial information in sketch maps—A study of survey sketch maps of urban areas. J. Spat. Inf. Sci. 2015. [Google Scholar] [CrossRef]
- Whittaker, J.O.; Whittaker, S.J. A cross-cultural study of geocentrism. J. Cross-Cult. Psychol. 1972, 3, 417–421. [Google Scholar] [CrossRef]
- Wise, N.; Kon, J.H. Assessing geographic knowledge with sketch maps. J. Geogr. 1990, 89, 123–129. [Google Scholar]
- Huynh, N.T.; Doherty, S.; Sharpe, B. Gender differences in the sketch map creation process. J. Maps 2010, 6, 270–288. [Google Scholar]
- Matthews, M.H. Children represent their environment: Mental maps of Coventry city centre. Geoforum 1980, 11, 385–397. [Google Scholar] [CrossRef]
- Spencer, C.; Weetman, M. The microgenesis of cognitive maps: A longitudinal study of new residents of an urban area. R. Geogr. Soc. 1981, 6, 375–384. [Google Scholar] [CrossRef]
- Saarinen, T.F.; MacCabe, C.L. World patterns of geographic literacy based on sketch map quality. Prof. Geogr. 1995, 47, 196–204. [Google Scholar] [CrossRef]
- Appleyard, D. Styles and methods of structuring a city. Environ. Behav. 1970, 2, 100–117. [Google Scholar] [CrossRef]
- Beatty, W.W.; Tröster, A.I. Gender differences in geographical knowledge. Sex Roles 1987, 16, 565–590. [Google Scholar]
- Montello, D.R.; Lovelace, K.L.; Golledge, R.G.; Self, C.M. Sex-related differences and similarities in geographic and environmental spatial abilities. Ann. Assoc. Am. Geogr. 1999, 89, 515–534. [Google Scholar] [CrossRef] [Green Version]
- Matthews, M.H. Gender, graphicacy and geography. Educ. Rev. 1986, 38, 259–271. [Google Scholar] [CrossRef]
- Lee, J.; Bednarz, R.S. Video analysis of map-drawing strategies. J. Geogr. 2005, 104, 211–221. [Google Scholar] [CrossRef]
- Liberati, A.; Altman, D.G.; Tetzlaff, J.; Mulrow, C.; Gøtzsche, P.C.; Ioannidis, J.P.A.; Clarke, M.; Devereaux, P.J.; Kleijnen, J.; Moher, D. The PRISMA statement for reporting systematic reviews and meta-analyses of studies that evaluate health care interventions: Explanation and elaboration. PLoS Med. 2009, 6, e1000100. [Google Scholar] [CrossRef] [PubMed]
- Matthews, M.H. Cognitive Mapping Abilities of Young Boys and Girls. Geography 1984, 64, 327–336. [Google Scholar]
- Krowka, S.; Hadd, A.; Marx, R. Protocol for a systematic review: “No excuses” charter schools for increasing math and literacy achievement in primary and secondary education: A systematic review and meta-analysis. Campbell Syst. Rev. 2016, 12, 1–29. [Google Scholar] [CrossRef]
- Potter, R.B. The Development of spatial cognitive maps among Barbadian children. J. Soc. Psychol. 1985, 125, 675–677. [Google Scholar] [CrossRef]
- Lee, Y.; Schmidt, C.G. Urban spatial cognition: A case study of Guangzhou, China. Urban Geogr. 1986, 7, 397–412. [Google Scholar]
- Muffato, V.; Meneghetti, C.; Di Ruocco, V.; De Beni, R. When young and older adults learn a map: The influence of individual visuo-spatial factors. Learn. Individ. Differ. 2017, 53, 114–121. [Google Scholar] [CrossRef]
- Torrens, P.M. Where in the world? Exploring the factors driving place location knowledge among secondary level students in Dublin, Ireland. J. Geogr. 2001, 100, 49–60. [Google Scholar] [CrossRef]
- Lloyd, R. Cognitive maps: Encoding and decoding information. Ann. Assoc. Am. Geogr. 1989, 79, 101–124. [Google Scholar]
- MacEachren, A.M. The role of maps in spatial knowledge acquisition. Cartogr. J. 1991, 28, 152–162. [Google Scholar] [CrossRef]
- Okabayashi, H.; Glynn, S.M. Spatial cognition: Systematic distortions in cognitive maps. J. Gen. Psychol. 1984, 111, 271–279. [Google Scholar] [CrossRef]
- Herman, W.L.; Hawkins, M.L.; Barron, M.; Berryman, C. World place location skills of elementary school students. J. Educ. Res. 1988, 81, 374–376. [Google Scholar] [CrossRef]
- Jenkins, J.M.; Walmsley, D.J. Mental maps of tourists: A study of Coffs Harbour, New South Wales. GeoJournal 1993, 29, 233–241. [Google Scholar] [CrossRef]
- Schmeinck, D.; Thurston, A. The influence of travel experiences and exposure to cartographic media on the ability of ten-year-old children to draw cognitive maps of the world. Scott. Geogr. J. 2007, 123, 1–15. [Google Scholar]
- Murray, D.; Spencer, C. Individual differences in the drawing of cognitive maps: The effects of geographical mobility, strength of mental imagery and basic graphic ability. Trans. Inst. Br. Geogr. 1979, 4, 385–391. [Google Scholar]
- Chokor, B.A. Pattern of representation of countries in cognitive maps of the world with special reference to Africa. J. Environ. Psychol. 2003, 23, 427–437. [Google Scholar] [CrossRef]
- Karan, P.P.; Bladen, W.A. Perception of the urban environment in a third-world country. Geogr. Rev. 1982, 72, 228–232. [Google Scholar]
- Kask, K.; Hannust, T. Does a dozen years change a thing? Estonian children’s drawings of Europe in 2000 and 2012. Trames. J. Humanit. Soc. Sci. 2013, 17, 301–312. [Google Scholar]
- Bailly, A.S.; MacCabe, C.; Saarinen, T. Images of francophone countries and francophone images of the world. Geogr. Helv. 1995, 50, 3–11. [Google Scholar]
- Wiegand, P.; Stiell, B. The development of children’s sketch maps of the British isles. Cartogr. J. 1997, 34, 13–21. [Google Scholar] [CrossRef]
- Madaleno, I.M. How Do Remote Southern Hemisphere Residents Perceive the World? Mental Maps Drawn by East Timorese and Mozambican Islanders. Scott. Geogr. J. 2010, 126, 112–136. [Google Scholar] [CrossRef]
- Saarinen, T.F.; Parton, M.; Billberg, R. Relative size of continents on world sketch maps. Cartogr. Int. J. Geogr. Inf. Geovis. 1996, 33, 37–48. [Google Scholar] [CrossRef]
- Kong, L.; Savage, V.R.; Saarinen, T.; Maccabe, C. Mental maps of the world: The case of Singapore students. J. Geogr. 1994, 93, 258–263. [Google Scholar]
- Thomas, L.; Willinsky, J. Grounds for imagining a pacific community: Mapping across boundaries and great divides. J. Geogr. 1999, 98, 1–13. [Google Scholar] [CrossRef]
- Bomfim, Z.A.C.; Urrutia, E.P. Affective dimension in cognitive maps of Barcelona and São Paulo. Int. J. Psychol. 2005, 40, 37–48. [Google Scholar] [CrossRef]
- Hussein Snaf, R. College students’ cognition of the Arab World map. GeoJournal 1991, 23, 282–286. [Google Scholar] [CrossRef]
- Rittschof, K.A.; Stock, W.A.; Kulhavy, R.W.; Verdi, M.P.; Johnson, J.T. Learning from cartograms: The effects of region familiarity. J. Geogr. 1996, 95, 50–58. [Google Scholar] [CrossRef]
- Evans, G.W.; Marrero, D.G.; Butler, P.A. Environmental learning and cognitive mapping. Environ. Behav. 1981, 13, 83–104. [Google Scholar]
- Gourley, J.; Saarinen, T.F.; MacCabe, C. Comparison of sketch maps drawn by students from Armidale, Australia and Dunedin, New Zealand. N. Z. J. Geogr. 2008, 96, 8–15. [Google Scholar] [CrossRef]
- Ramadier, T.; Moser, G. Social legibility, the cognitive map and urban behaviour. J. Environ. Psychol. 1998, 18, 307–319. [Google Scholar] [CrossRef]
- Singh, R.P.B. Image of varanasi city: Reflections on geography of tourism. Frankf. Wirtsch. Soz. Schr. 1982, 41, 161–174. [Google Scholar]
- Thommen, E.; Avelar, S.; Sapin, V.Z.; Perrenoud, S.; Malatesta, D. Mapping the journey from home to school: A study on children’s representation of space. Int. Res. Geogr. Environ. Educ. 2010, 19, 191–205. [Google Scholar] [CrossRef]
- Golledge, R.G.; Spector, A.N. Comprehending the urban environment: Theory and practice. Geogr. Anal. 1978, 10, 403–426. [Google Scholar] [CrossRef]
- Grieve, K.W.; van Staden, F.J. A cross-cultural study of children’s cognitive maps. South Afr. J. Psychol. 1988, 18, 91–95. [Google Scholar] [CrossRef]
- Goodehild, B. Class differences in environmental perception: An exploratory study. Urban Stud. 1974, 11, 157–169. [Google Scholar] [CrossRef]
- Çanakcioğlu, N.G. Can cognitive maps of children be analysed by space syntax? ITU J Fac. Arch. 2015, 12, 127–140. [Google Scholar]
- Denis, M.; Zimmere, M. Analog properties of cognitive maps constructed from verbal descriptions. Psychol. Res. 1992, 54, 286–298. [Google Scholar]
- Ferguson, E.L.; Hegarty, M. Properties of cognitive maps constructed from texts. Mem. Cogn. 1994, 22, 455–473. [Google Scholar] [CrossRef] [Green Version]
- Meneghetti, C.; Borella, E.; Gyselinck, V.; De Beni, R. Age-differences in environment route learning: The role of input and recall-test modalities in young and older adults. Learn. Individ. Differ. 2012, 22, 884–890. [Google Scholar] [CrossRef]
- Stock, W.A.; Peterson, S.E.; Hancock, T.E.; Verdi, M.P. Mental representations of maps and verbal descriptions: Evidence they may affect text memory differently. Contemp. Educ. Psychol. 1995, 20, 237–256. [Google Scholar] [CrossRef]
- Louwerse, M.M.; Benesh, N. Representing spatial structure through maps and language: Lord of the rings encodes the spatial structure of middle earth. Cogn. Sci. 2012, 36, 1556–1569. [Google Scholar] [CrossRef]
- Rittschof, K.A.; Stock, W.A.; Kulhavy, R.W.; Verdi, M.P.; Doran, J.M. Thematic maps improve memory for facts and inferences: A test of the stimulus order hypothesis. Contemp. Educ. Psychol. 1994, 19, 129–142. [Google Scholar] [CrossRef]
- Dickmann, F. City maps versus map-based navigation systems—An empirical approach to building mental representations. Cartogr. J. 2012, 49, 62–69. [Google Scholar] [CrossRef]
- Casey, P.J. Remembering what we do, not what we view: The plasticity of everyday cognitive maps. Aust. J. Psychol. 2002, 54, 8–16. [Google Scholar]
- Tversky, B. Distortions in memory for maps. Cogn. Psychol. 1981, 13, 407–433. [Google Scholar] [CrossRef]
- Reynolds, R.; Vinterek, M. Geographical locational knowledge as an indicator of children’s views of the world: Research from Sweden and Australia. Int. Res. Geogr. Environ. Educ. 2016, 25, 68–83. [Google Scholar] [CrossRef]
- Shin, E.K. Using geographic information system (GIS) to improve fourth graders’ geographic content knowledge and map skills. J. Geogr. 2006, 105, 109–120. [Google Scholar]
- Mondschein, A.; Blumenberg, E.; Taylor, B. Accessibility and cognition: The effect of transport mode on spatial knowledge. Urban Stud. 2010, 47, 845–866. [Google Scholar] [CrossRef]
- Chiodo, J.J. Mental maps: Preservice teachers’ awareness of the world. J. Geogr. 1993, 92, 110–117. [Google Scholar]
- Wiegand, P.; Stiell, B. Mapping the place knowledge of teachers in training. J. Geogr. High. Educ. 1997, 21, 187–198. [Google Scholar] [CrossRef]
- Meneghetti, C.; Muffato, V.; Varotto, D.; De Beni, R. How directions of route descriptions influence orientation specificity: The contribution of spatial abilities. Psychol. Res. 2017, 81, 445–461. [Google Scholar] [CrossRef]
- Pearson, J.L.; Ialongo, N.S. The relationship between spatial ability and environmental knowledge. J. Environ. Psychol. 1986, 6, 299–304. [Google Scholar] [CrossRef]
- Ramadier, T.; Bronner, A.-C. Knowledge of the environment and spatial cognition: JRS as a technique for improving comparisons between social groups. Environ. Plan. B Plan. Des. 2006, 33, 285–299. [Google Scholar] [CrossRef]
- Coluccia, E.; Iosue, G.; Antonella Brandimonte, M. The relationship between map drawing and spatial orientation abilities: A study of gender differences. J. Environ. Psychol. 2007, 27, 135–144. [Google Scholar] [CrossRef]
- Bahrick, H.P. The cognitive map of a city: Fifty years of learning and memory. In Psychology of Learning and Motivation; Elsevier: Amsterdam, The Netherlands, 1983; Volume 17, pp. 125–163. [Google Scholar]
- Webley, P. Sex differences in home range and cognitive maps in eight-year old children. J. Environ. Psychol. 1981, 1, 293–302. [Google Scholar] [CrossRef]
- Kitchin, R.M. Are there sex differences in geographic knowledge and understanding? Geogr. J. 1996, 162, 273–286. [Google Scholar] [CrossRef]
- Pearce, P.L. Mental souvenirs: A Study of tourists and their city maps. Aust. J. Psychol. 1977, 29, 203–210. [Google Scholar] [CrossRef]
- Meneghetti, C.; Fiore, F.; Borella, E.; De Beni, R. Learning a map of environment: The role of visuo-spatial abilities in young and older adults. Appl. Cogn. Psychol. 2011, 25, 952–959. [Google Scholar] [CrossRef]
- Meneghetti, C.; Pazzaglia, F.; De Beni, R. Mental representations derived from spatial descriptions: The influence of orientation specificity and visuospatial abilities. Psychol. Res. 2015, 79, 289–307. [Google Scholar] [CrossRef]
- Quaiser-Pohl, C.; Lehmann, W.; Eid, M. The relationship between spatial abilities and representations of large-scale space in children—A structural equation modeling analysis. Personal. Individ. Differ. 2004, 36, 95–107. [Google Scholar] [CrossRef]
- Paivio, A. Mental imagery in associative learning and memory. Psychol. Rev. 1969, 76, 241–263. [Google Scholar] [CrossRef] [Green Version]
- Nieścioruk, K. The use of mental and sketch maps as a tool to evaluate cartography teaching effectiveness. Cartogr. J. 2016, 53, 186–196. [Google Scholar] [CrossRef]
- Freundschuh, S.; Montelloa, D. Cognition of geographic information. In A Research Agenda for Geographic Information Science; Lynn Usery, E., Mcmaster, R., Eds.; CRC Press: Boca Raton, FL, USA, 2004; pp. 61–91. [Google Scholar]
- Seibert, P.S.; Anooshian, L.J. Indirect expression of preference in sketch maps. Environ. Behav. 1993, 25, 607–624. [Google Scholar] [CrossRef]
- Spencer, C.; Blades, M. (Eds.) Children and Their Environments: Learning, Using, and Designing Spaces; Cambridge University Press: Cambridge, UK, 2006. [Google Scholar]
- Hemmer, I.; Hemmer, M.; Kruschel, K.; Neidhardt, E.; Obermaier, G.; Uphues, R. Which children can find a way through a strange town using a streetmap?—Results of an empirical study on children’s orientation competence. Int. Res. Geogr. Environ. Educ. 2013, 22, 23–40. [Google Scholar] [CrossRef]
- Anacta, V.J.A.; Schwering, A.; Li, R.; Muenzer, S. Orientation information in wayfinding instructions: Evidences from human verbal and visual instructions. GeoJournal 2017, 82, 567–583. [Google Scholar] [CrossRef] [Green Version]
- Gillespie, C.A. How culture constructs our sense of neighborhood: Mental maps and children’s perceptions of place. J. Geogr. 2010, 109, 18–29. [Google Scholar] [CrossRef]
- Gutsche, R.E. News place-making: Applying ‘mental mapping’ to explore the journalistic interpretive community. Vis. Commun. 2014, 13, 487–510. [Google Scholar] [CrossRef]
- Pinheiro, J.Q. Determinants of cognitive maps of the world as expressed in sketch maps. J. Environ. Psychol. 1998, 18, 321–339. [Google Scholar] [CrossRef] [Green Version]
- Greenberg Raanan, M.; Shoval, N. Mental maps compared to actual spatial behavior using GPS data: A new method for investigating segregation in cities. Cities 2014, 36, 28–40. [Google Scholar] [CrossRef]
- Cho, S. The role of IQ in the use of cognitive strategies to learn information from a map. Learn. Individ. Differ. 2010, 20, 694–698. [Google Scholar]
- Long, Y.; Baran, P.K. Does Intelligibility affect place legibility? Understanding the relationship between objective and subjective evaluations of the urban environment. Environ. Behav. 2012, 44, 616–640. [Google Scholar]
Figure 1.
The process of spatial perception with a group of factors (Source: modified from [2,28,29]).
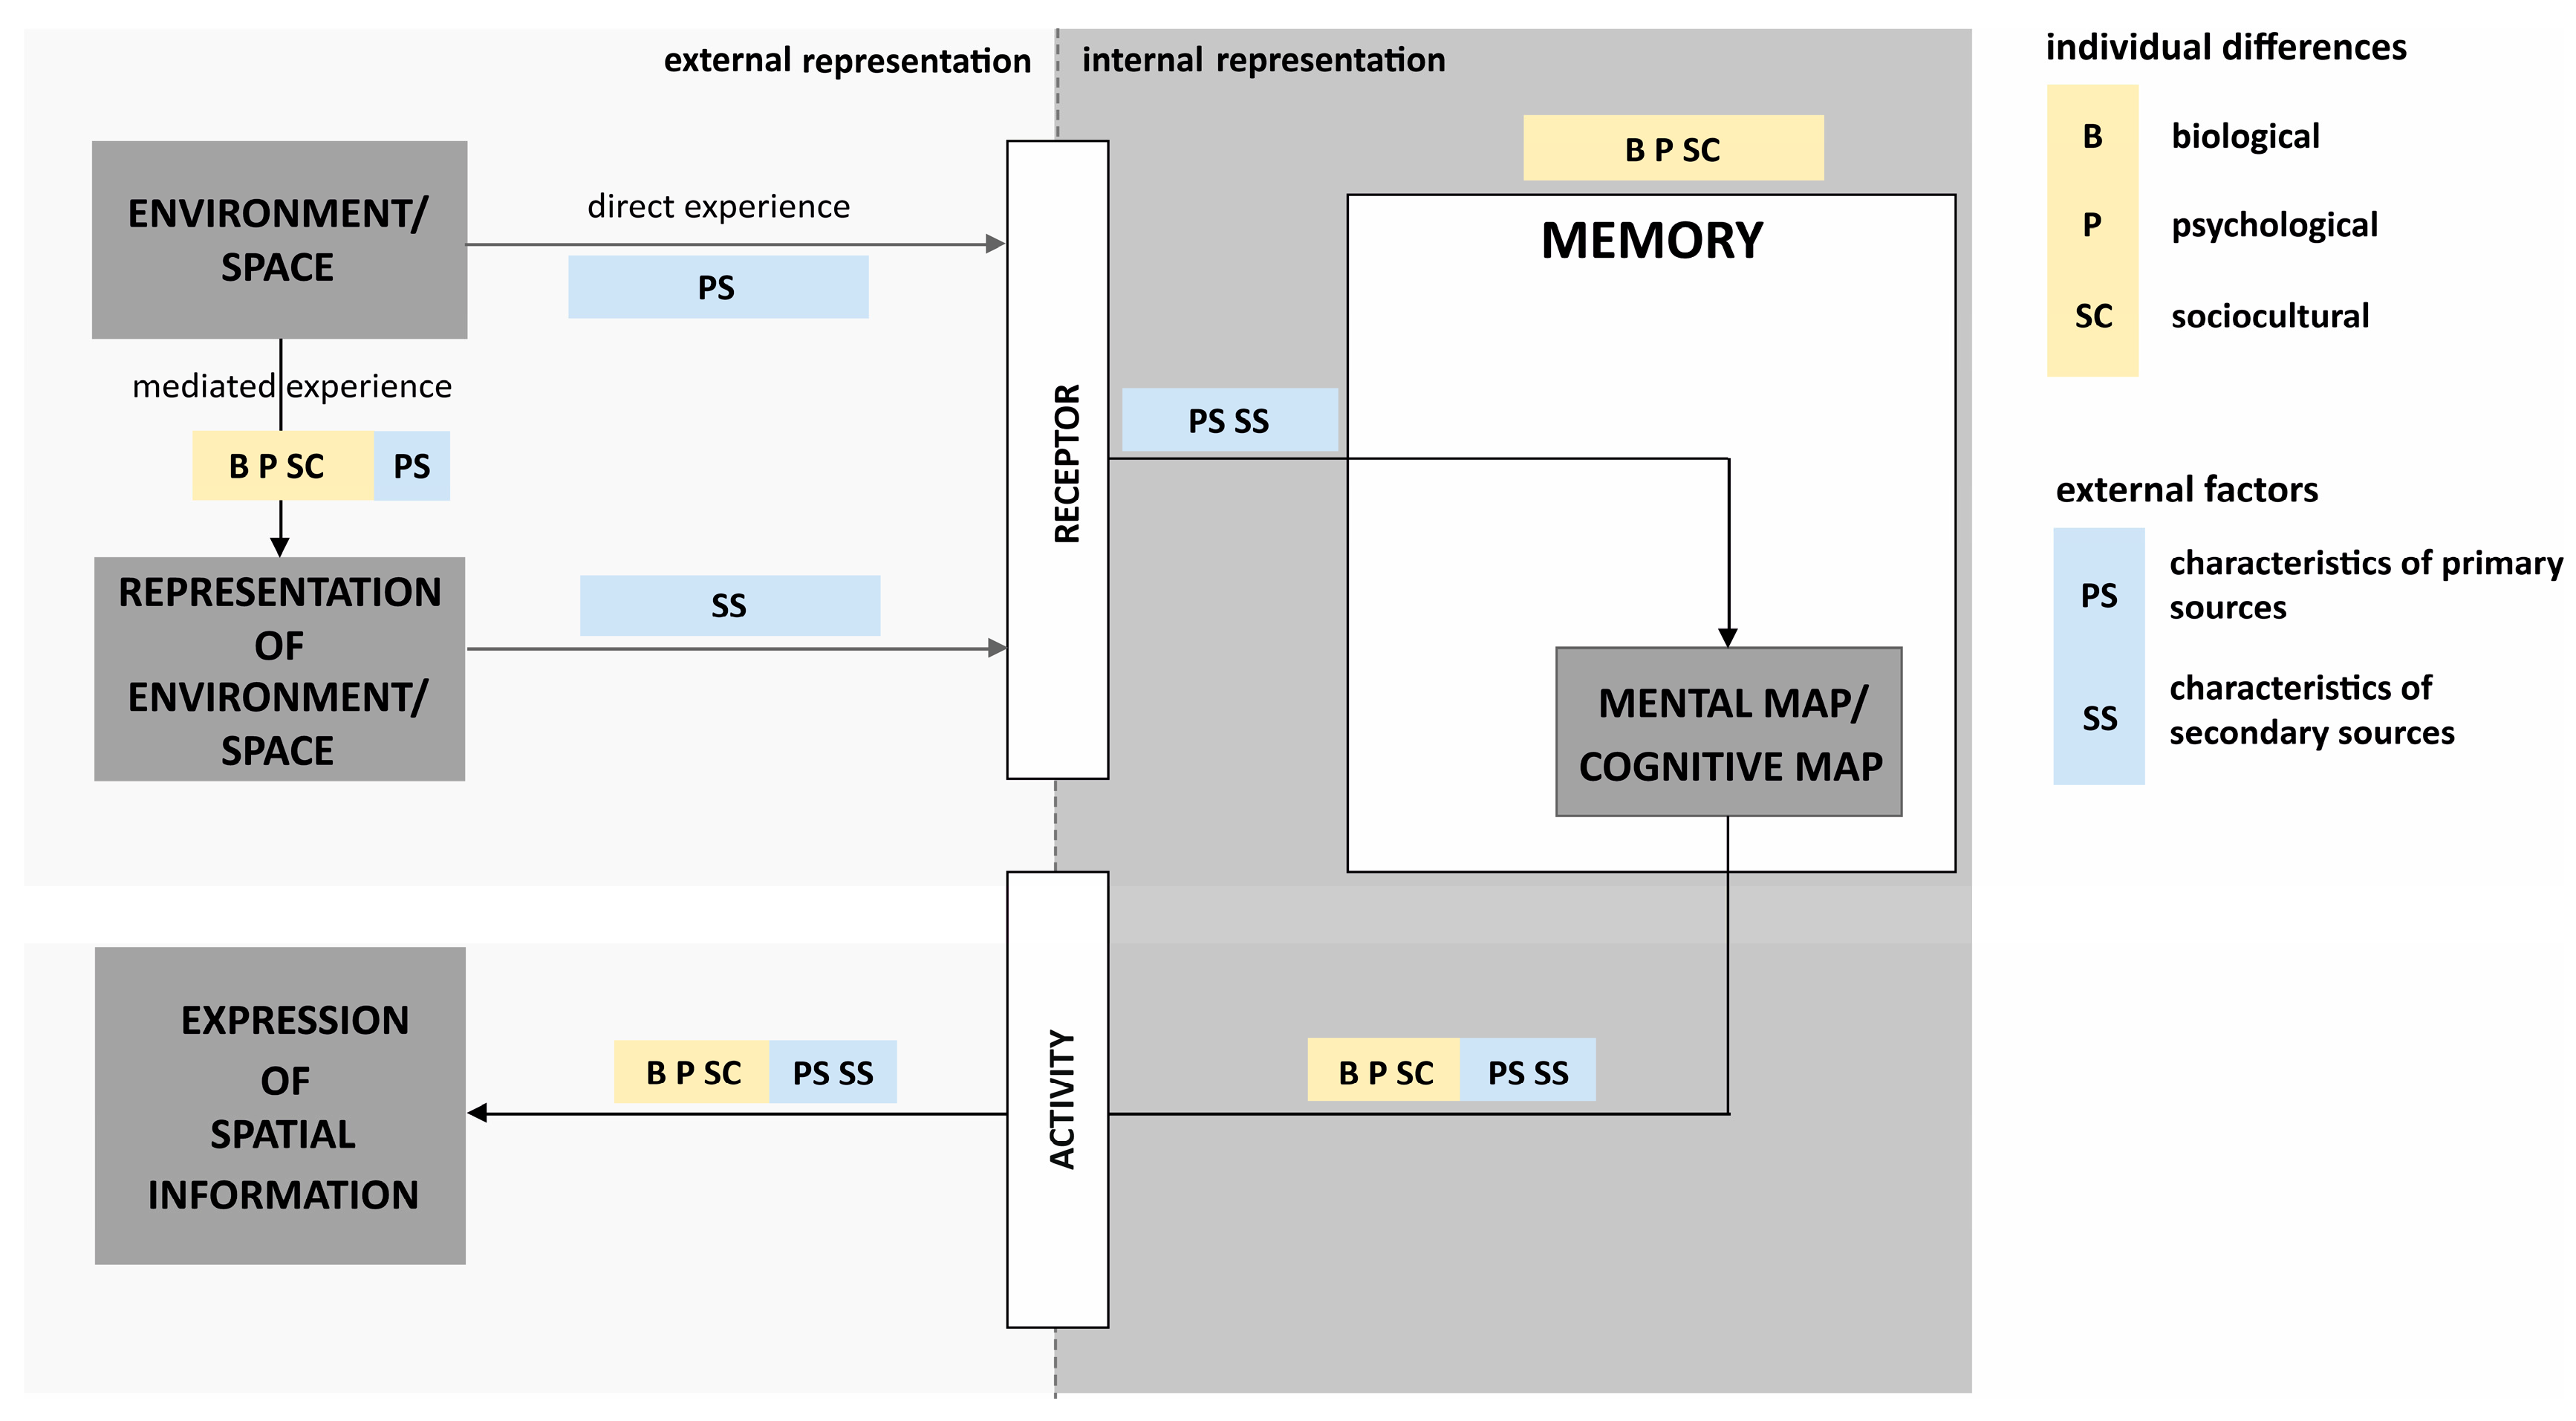
Figure 2.
Changing terminology.

Figure 3.
The command used to search for articles in the SCOPUS database.

Figure 4.
Systematic selection of articles for analysis (Source: modified from [79]).
Figure 4.
Systematic selection of articles for analysis (Source: modified from [79]).

Figure 5.
Characteristics of all 90 studies analysed (see details in Table S1—online supplemental material).
Figure 5.
Characteristics of all 90 studies analysed (see details in Table S1—online supplemental material).
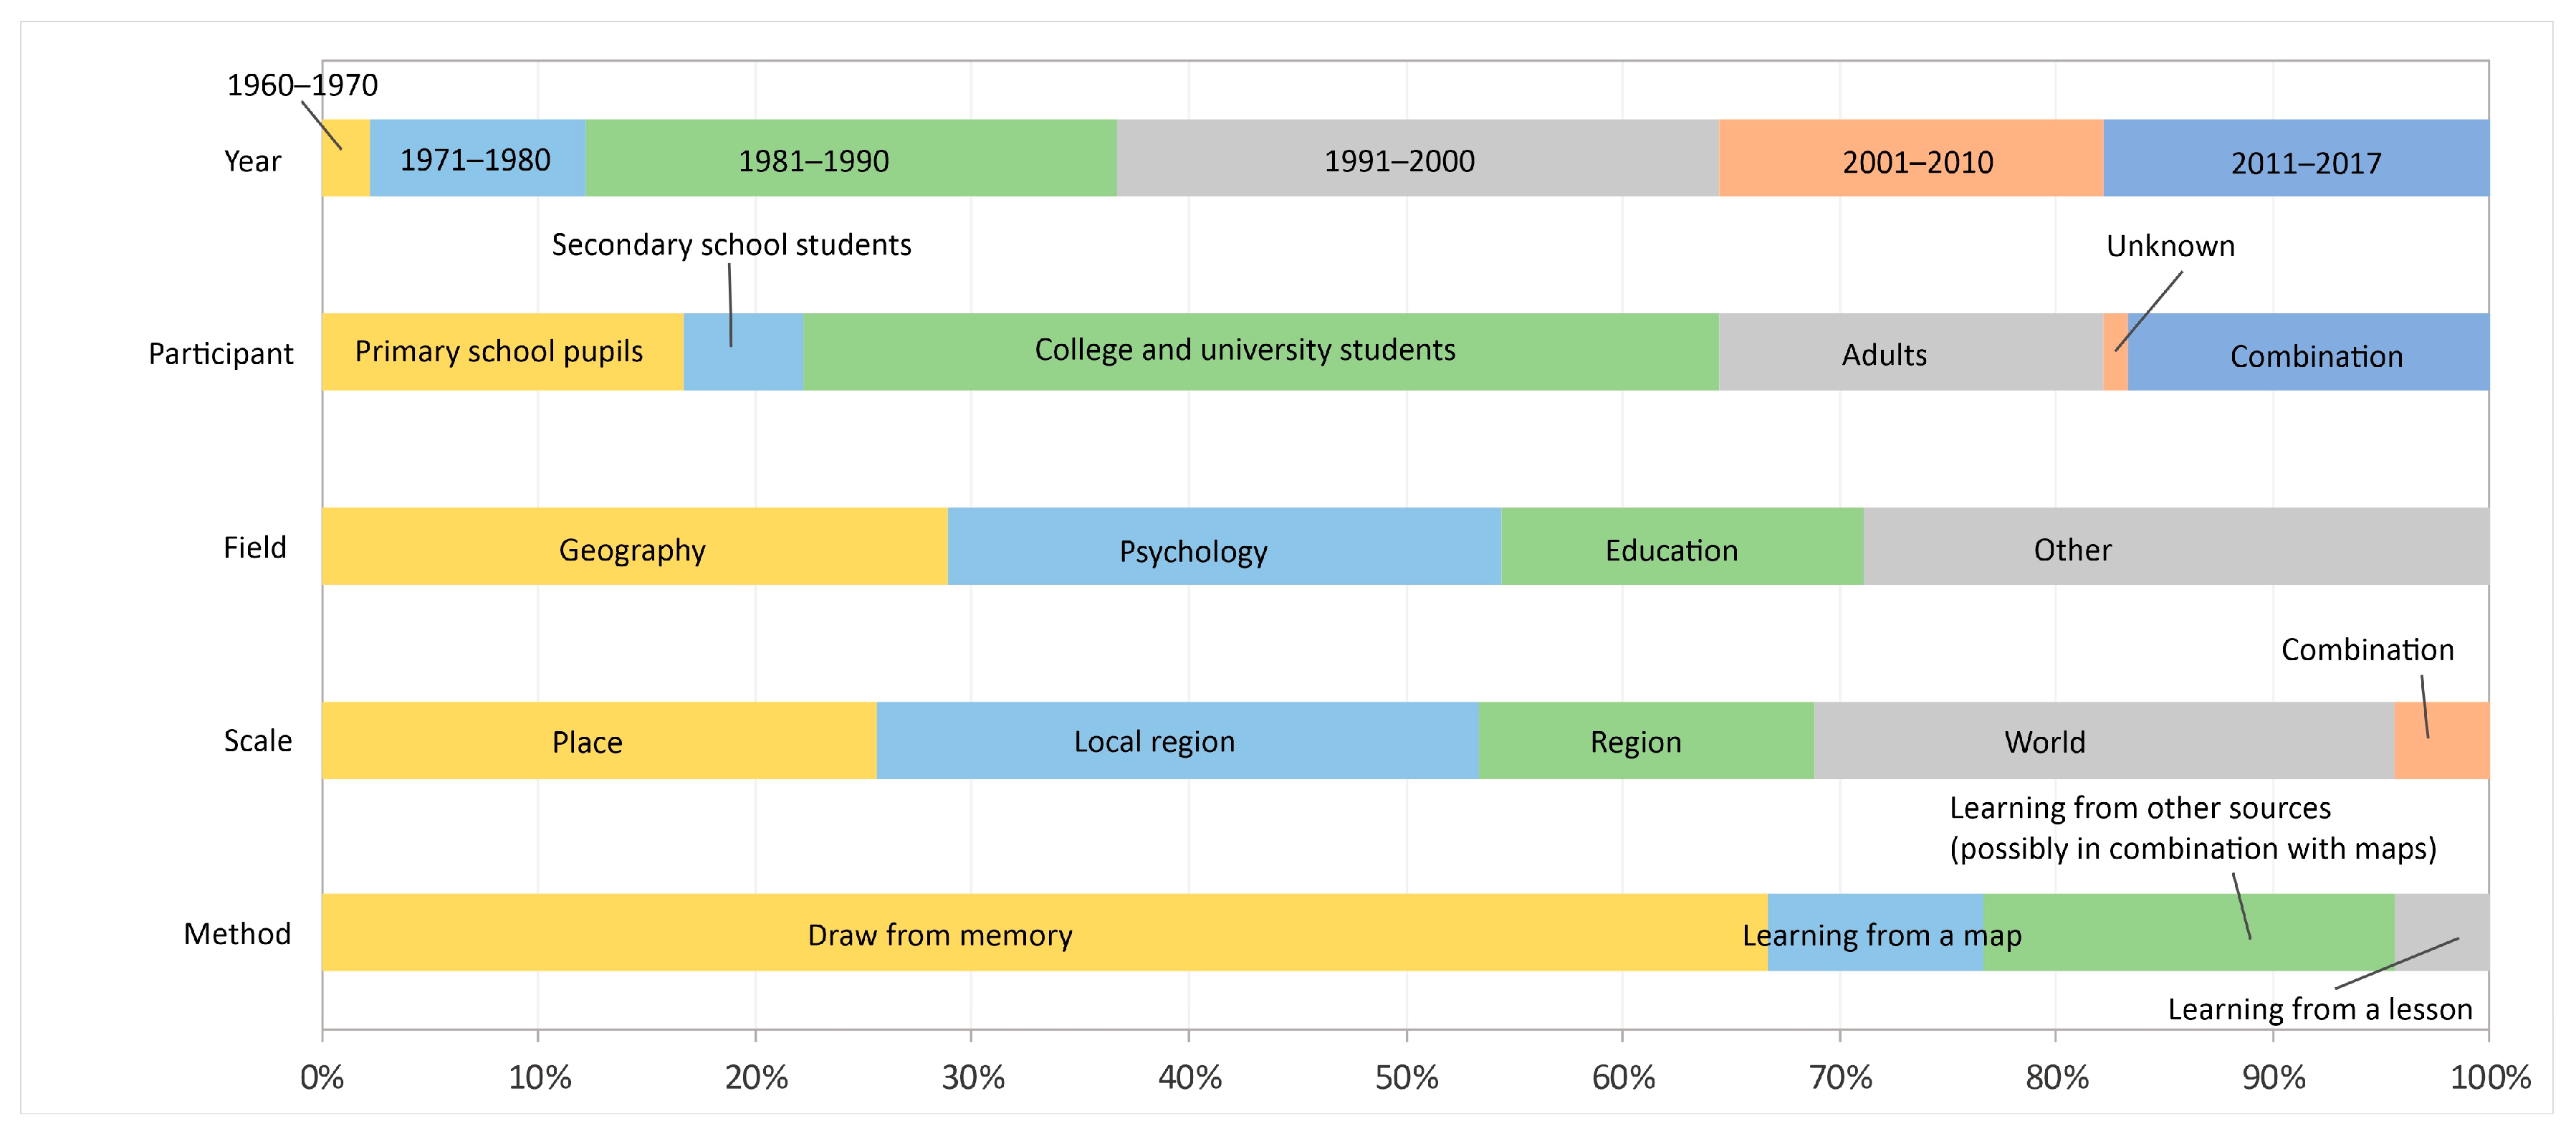
Figure 6.
Factors influencing the overall quality of a sketch map.

Figure 7.
Factors influencing positional accuracy in sketch maps.

Figure 8.
Factors influencing content frequency in sketch maps.
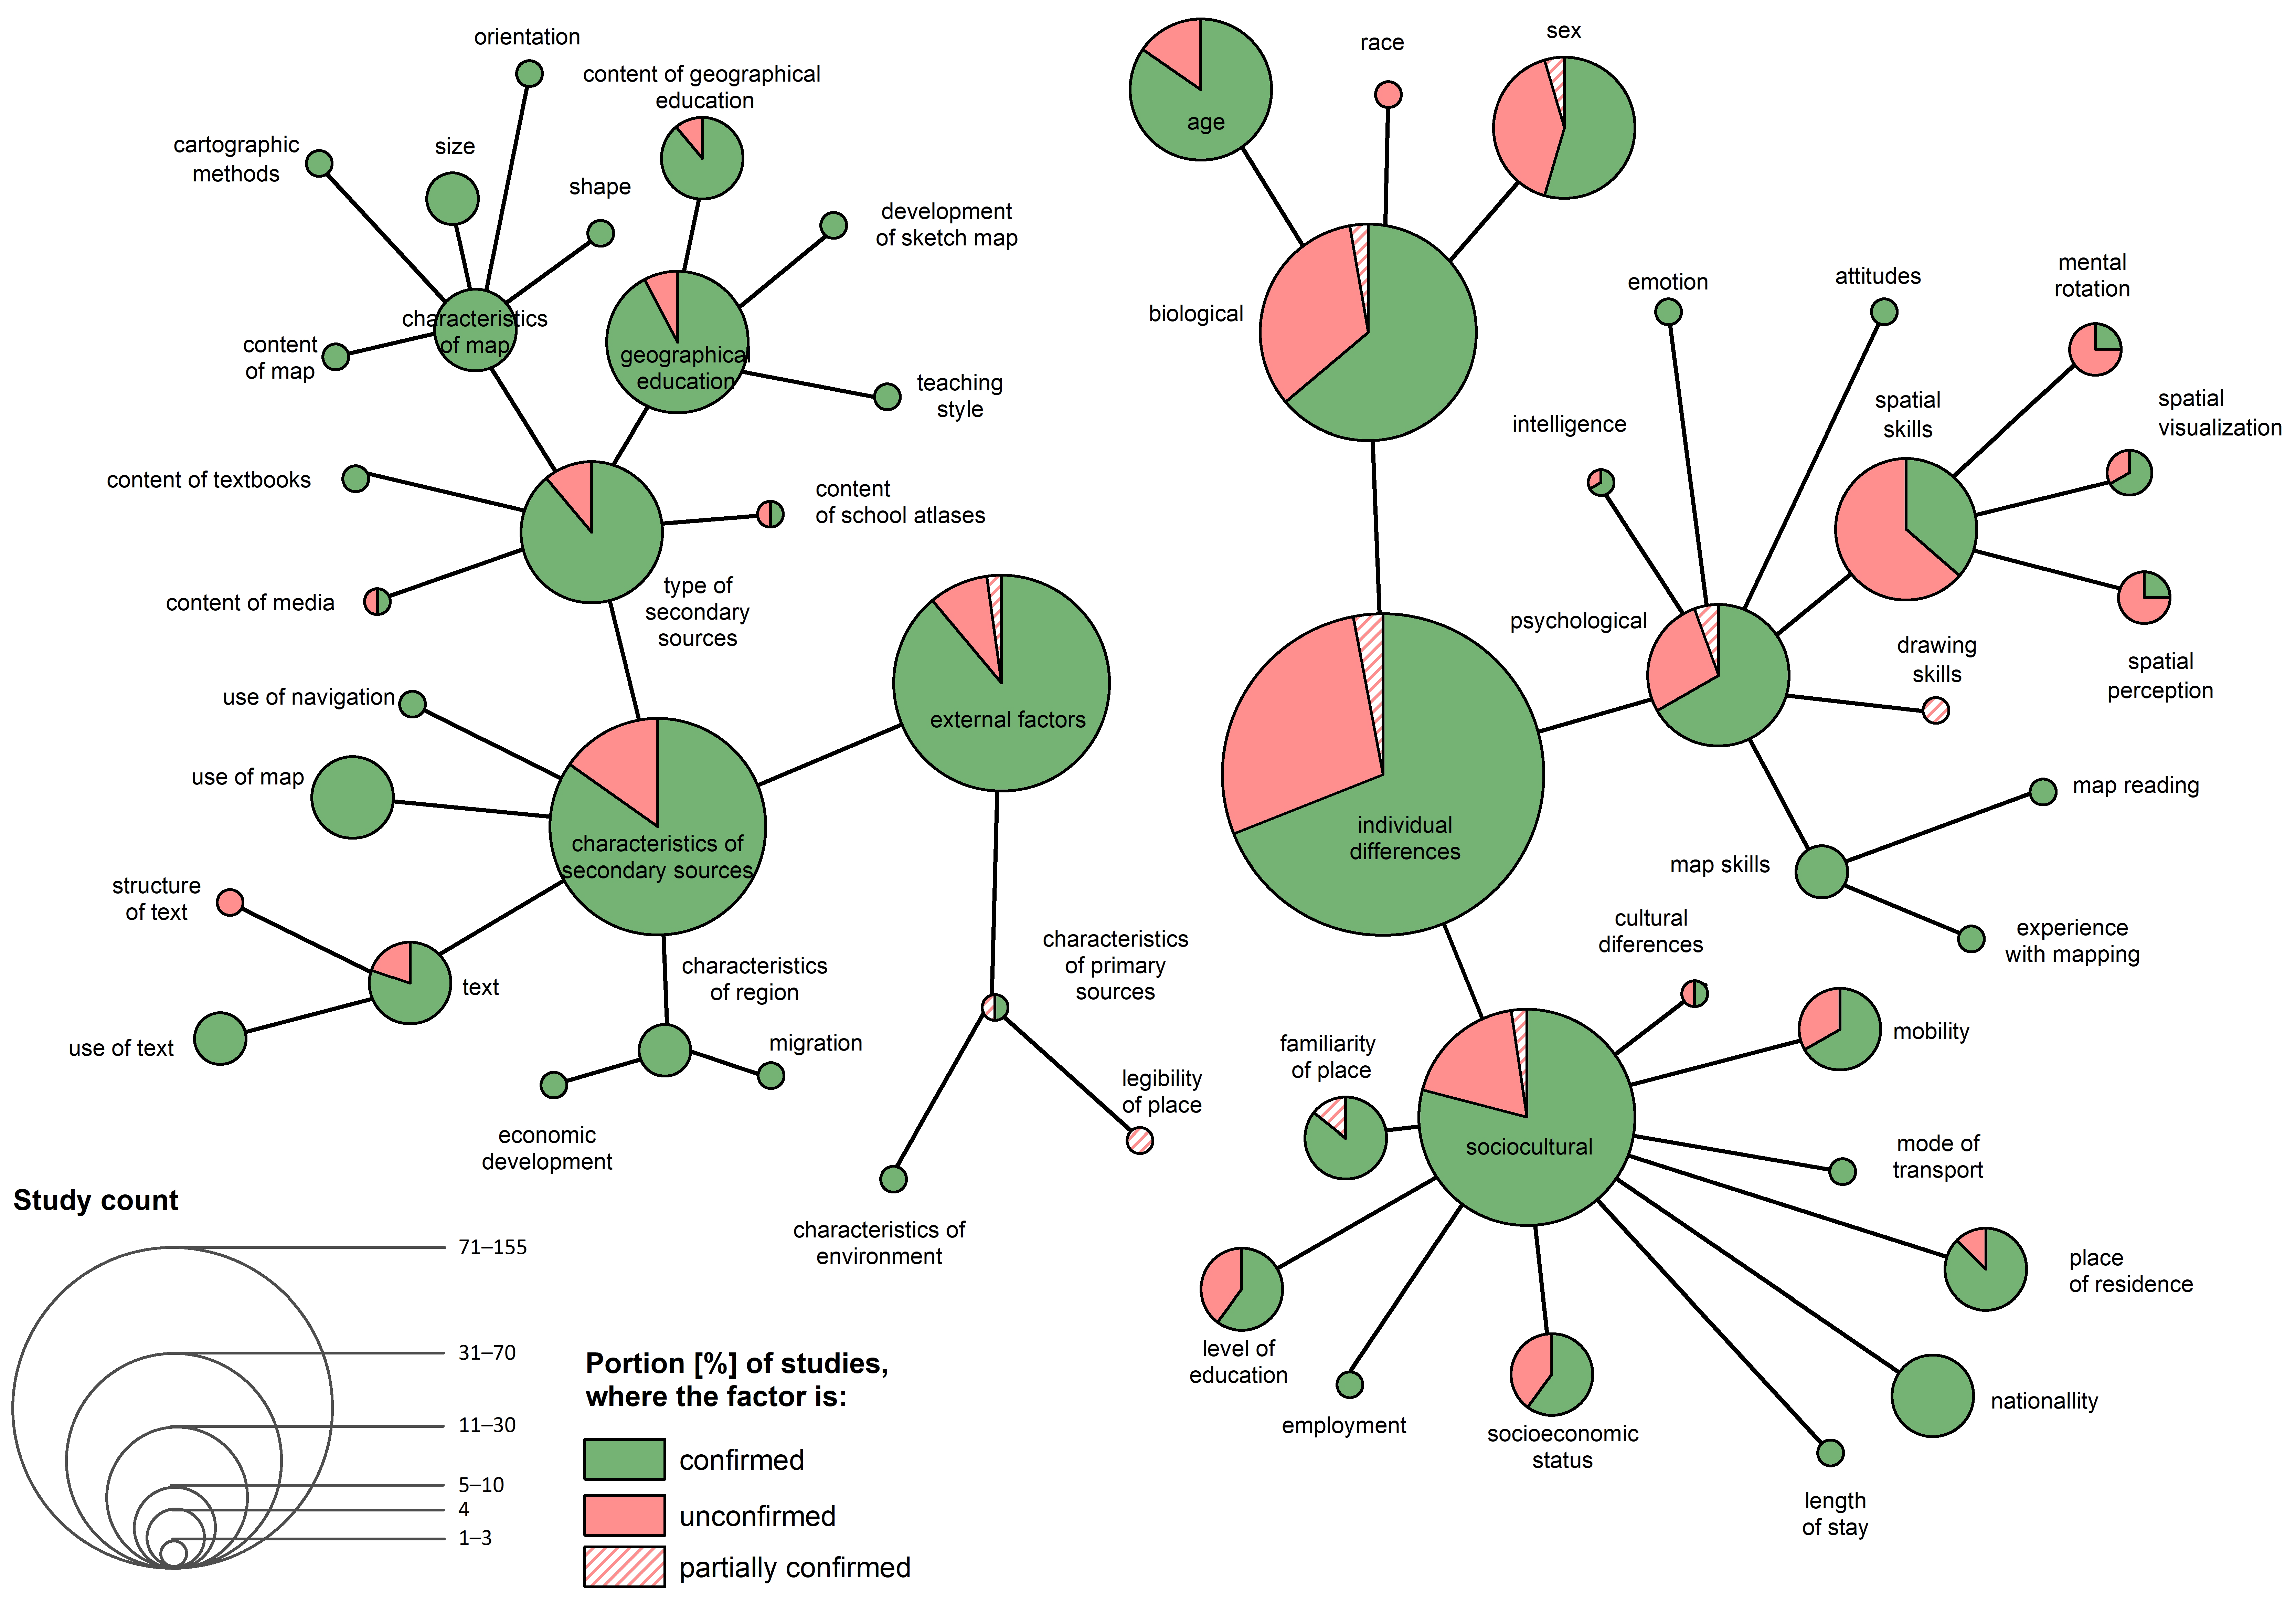
Figure 9.
Factors influencing the choice of cartographic method for the creation of sketch maps.


Table 1.
Designating the provability of the factors.
| Category | Provability (%) | Number of Studies |
|---|---|---|
| proven | 60–100 | ≥5 |
| debatable | 40–59 60–100 | >4 =4 |
| refuted | 0–39 | ≥4 |
| not enough evidence | 0–100 | ≤3 |
Table 2.
The provability of factors within the framework of overall sketch map quality and its parameters (✓: proven; ×: refuted; ?: debatable; –: insufficient number of studies; 0: not investigated).
Table 2.
The provability of factors within the framework of overall sketch map quality and its parameters (✓: proven; ×: refuted; ?: debatable; –: insufficient number of studies; 0: not investigated).
| Group | Sub-group | Factor | Overall Quality | Positional Accuracy | Content Frequency | Cartography Method Use |
|---|---|---|---|---|---|---|
| individual differences | biolo-gical | age | ✓ | ✓ | ✓ | ✓ |
| sex | ? | ✓ | ? | ✓ | ||
| race | – | – | – | – | ||
| psychological | attitudes | – | 0 | – | 0 | |
| drawing skills | – | – | – | 0 | ||
| area-related emotion | – | 0 | – | 0 | ||
| experience with mapping | – | – | – | 0 | ||
| intelligence | – | 0 | – | 0 | ||
| mental rotation skills | × | × | × | 0 | ||
| reading map skills | ✓ | – | – | 0 | ||
| spatial perception skills | × | ? | × | 0 | ||
| spatial visualization skills | ? | ? | – | 0 | ||
| sociocultural | activities in space | – | – | 0 | 0 | |
| cultural differences | – | – | – | 0 | ||
| employment | – | 0 | – | 0 | ||
| area familiarity | ✓ | – | ✓ | – | ||
| length of stay in the area | ? | 0 | – | – | ||
| level of education | ? | ✓ | ✓ | – | ||
| mobility (travel experience) | ✓ | ✓ | ✓ | – | ||
| mode of transport used | – | – | – | 0 | ||
| nationality | ✓ | – | ✓ | 0 | ||
| place of residence | ✓ | ✓ | ✓ | – | ||
| socioeconomic status | ✓ | – | ✓ | ? | ||
| external factors | primary sources | learning from environment | – | – | – | 0 |
| legibility of place | – | 0 | – | 0 | ||
| regularity of place | – | – | 0 | 0 | ||
| secondary sources | cartographic methods | – | 0 | – | 0 | |
| cartographic projection | ? | ? | 0 | 0 | ||
| colonial experience | – | – | 0 | 0 | ||
| content of map | – | 0 | – | 0 | ||
| development of sketch map | – | – | – | 0 | ||
| economic development | – | 0 | – | 0 | ||
| frequency of landmark | – | – | 0 | 0 | ||
| geographical education | ✓ | – | ✓ | – | ||
| learning from map | ✓ | ✓ | ✓ | 0 | ||
| learning from navigation | – | – | – | 0 | ||
| learning from text | ✓ | ✓ | ? | 0 | ||
| media usage | ? | – | – | 0 | ||
| migration | – | 0 | – | 0 | ||
| orientation of map | – | – | – | 0 | ||
| scale | – | – | 0 | 0 | ||
| school atlas | – | – | – | 0 | ||
| segmentation boundary | – | – | 0 | 0 | ||
| shape | – | – | – | 0 | ||
| size | ? | 0 | ? | 0 | ||
| structure of text | – | – | – | 0 | ||
| teaching style | – | 0 | – | 0 | ||
| textbooks | ? | – | – | 0 | ||
| type of text | – | – | 0 | 0 |
Note: Due to the high variability of studies analysed, factors are grouped on the basis of their generalised meaning. For this generalisation, the results for individual factors must always be seen in relation to the individual studies in which they were examined (for details, see Table S1—online supplemental material).
© 2020 by the authors. Licensee MDPI, Basel, Switzerland. This article is an open access article distributed under the terms and conditions of the Creative Commons Attribution (CC BY) license (http://creativecommons.org/licenses/by/4.0/).
Share and Cite
MDPI and ACS Style
Hátlová, K.; Hanus, M. A Systematic Review into Factors Influencing Sketch Map Quality. ISPRS Int. J. Geo-Inf. 2020, 9, 271. https://0-doi-org.brum.beds.ac.uk/10.3390/ijgi9040271
AMA Style
Hátlová K, Hanus M. A Systematic Review into Factors Influencing Sketch Map Quality. ISPRS International Journal of Geo-Information. 2020; 9(4):271. https://0-doi-org.brum.beds.ac.uk/10.3390/ijgi9040271
Chicago/Turabian StyleHátlová, Kateřina, and Martin Hanus. 2020. "A Systematic Review into Factors Influencing Sketch Map Quality" ISPRS International Journal of Geo-Information 9, no. 4: 271. https://0-doi-org.brum.beds.ac.uk/10.3390/ijgi9040271
Note that from the first issue of 2016, this journal uses article numbers instead of page numbers. See further details here.