Integrating Land-Use and Renewable Energy Planning Decisions: A Technical Mapping Guide for Local Government


Abstract
:1. Introduction
2. Background
2.1. Unused Potential Abound
2.2. Multi-Criteria Decision Analysis and RE Planning
3. Methods
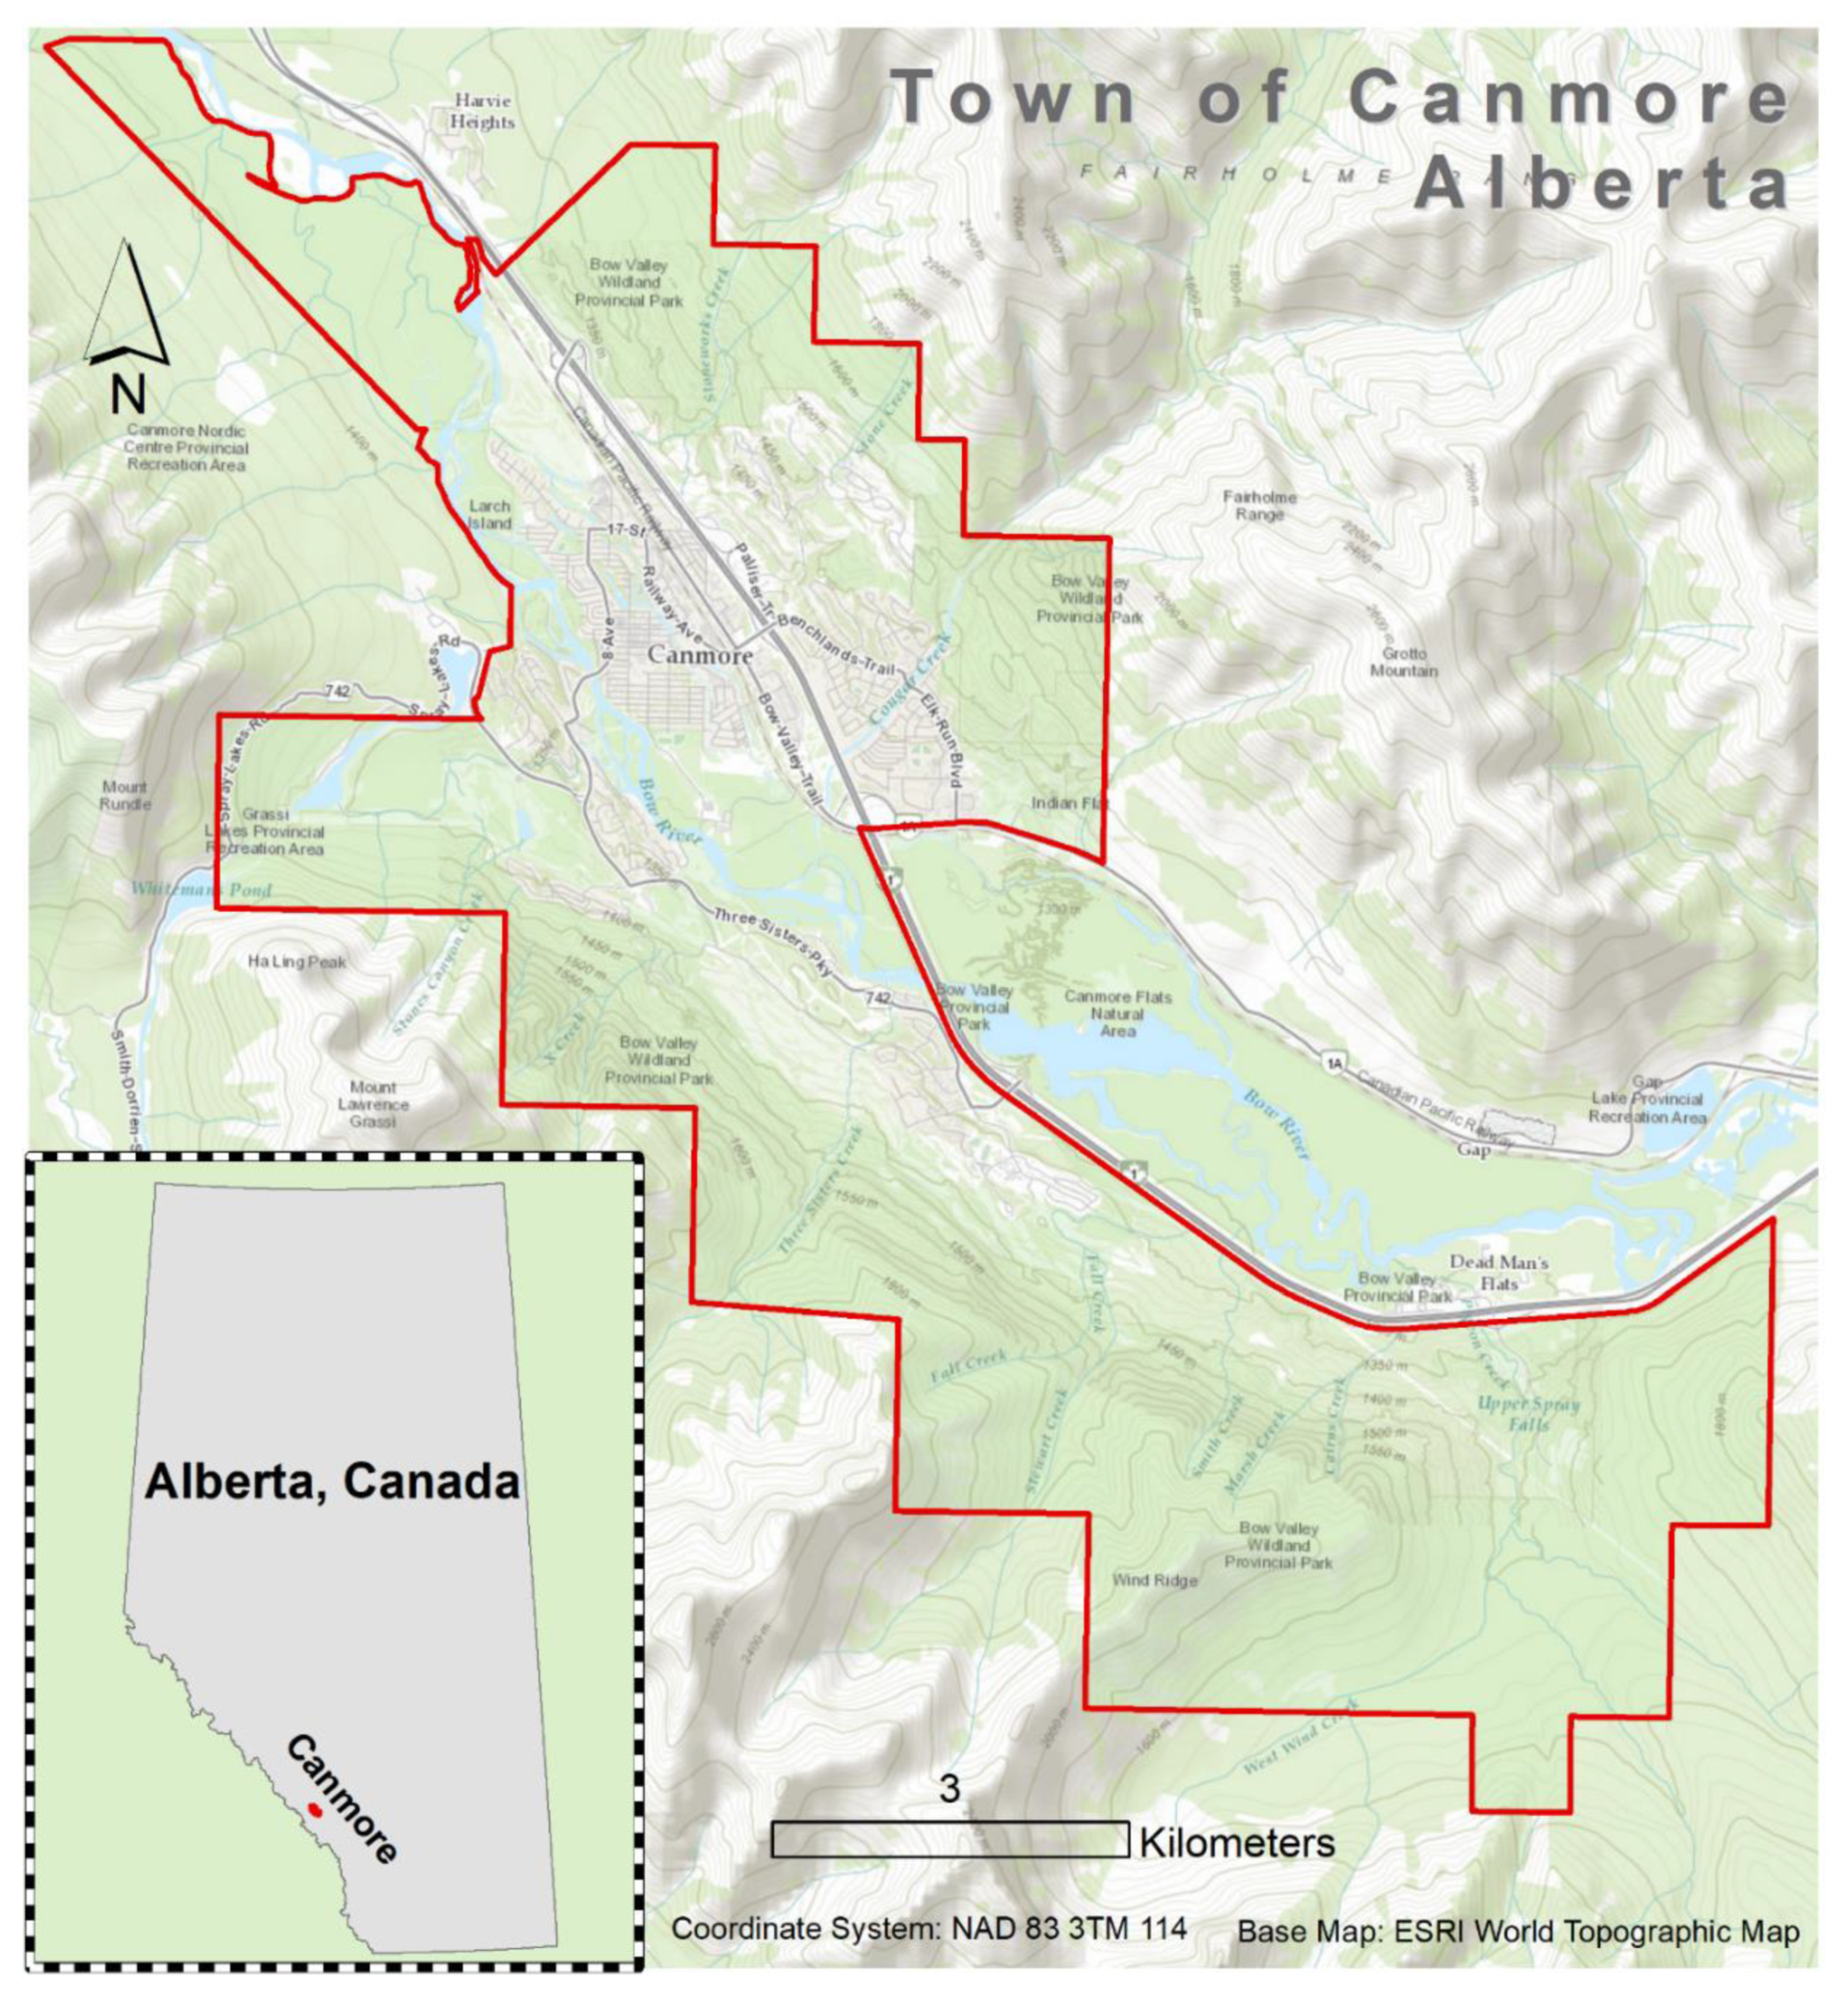
3.1. Study Site
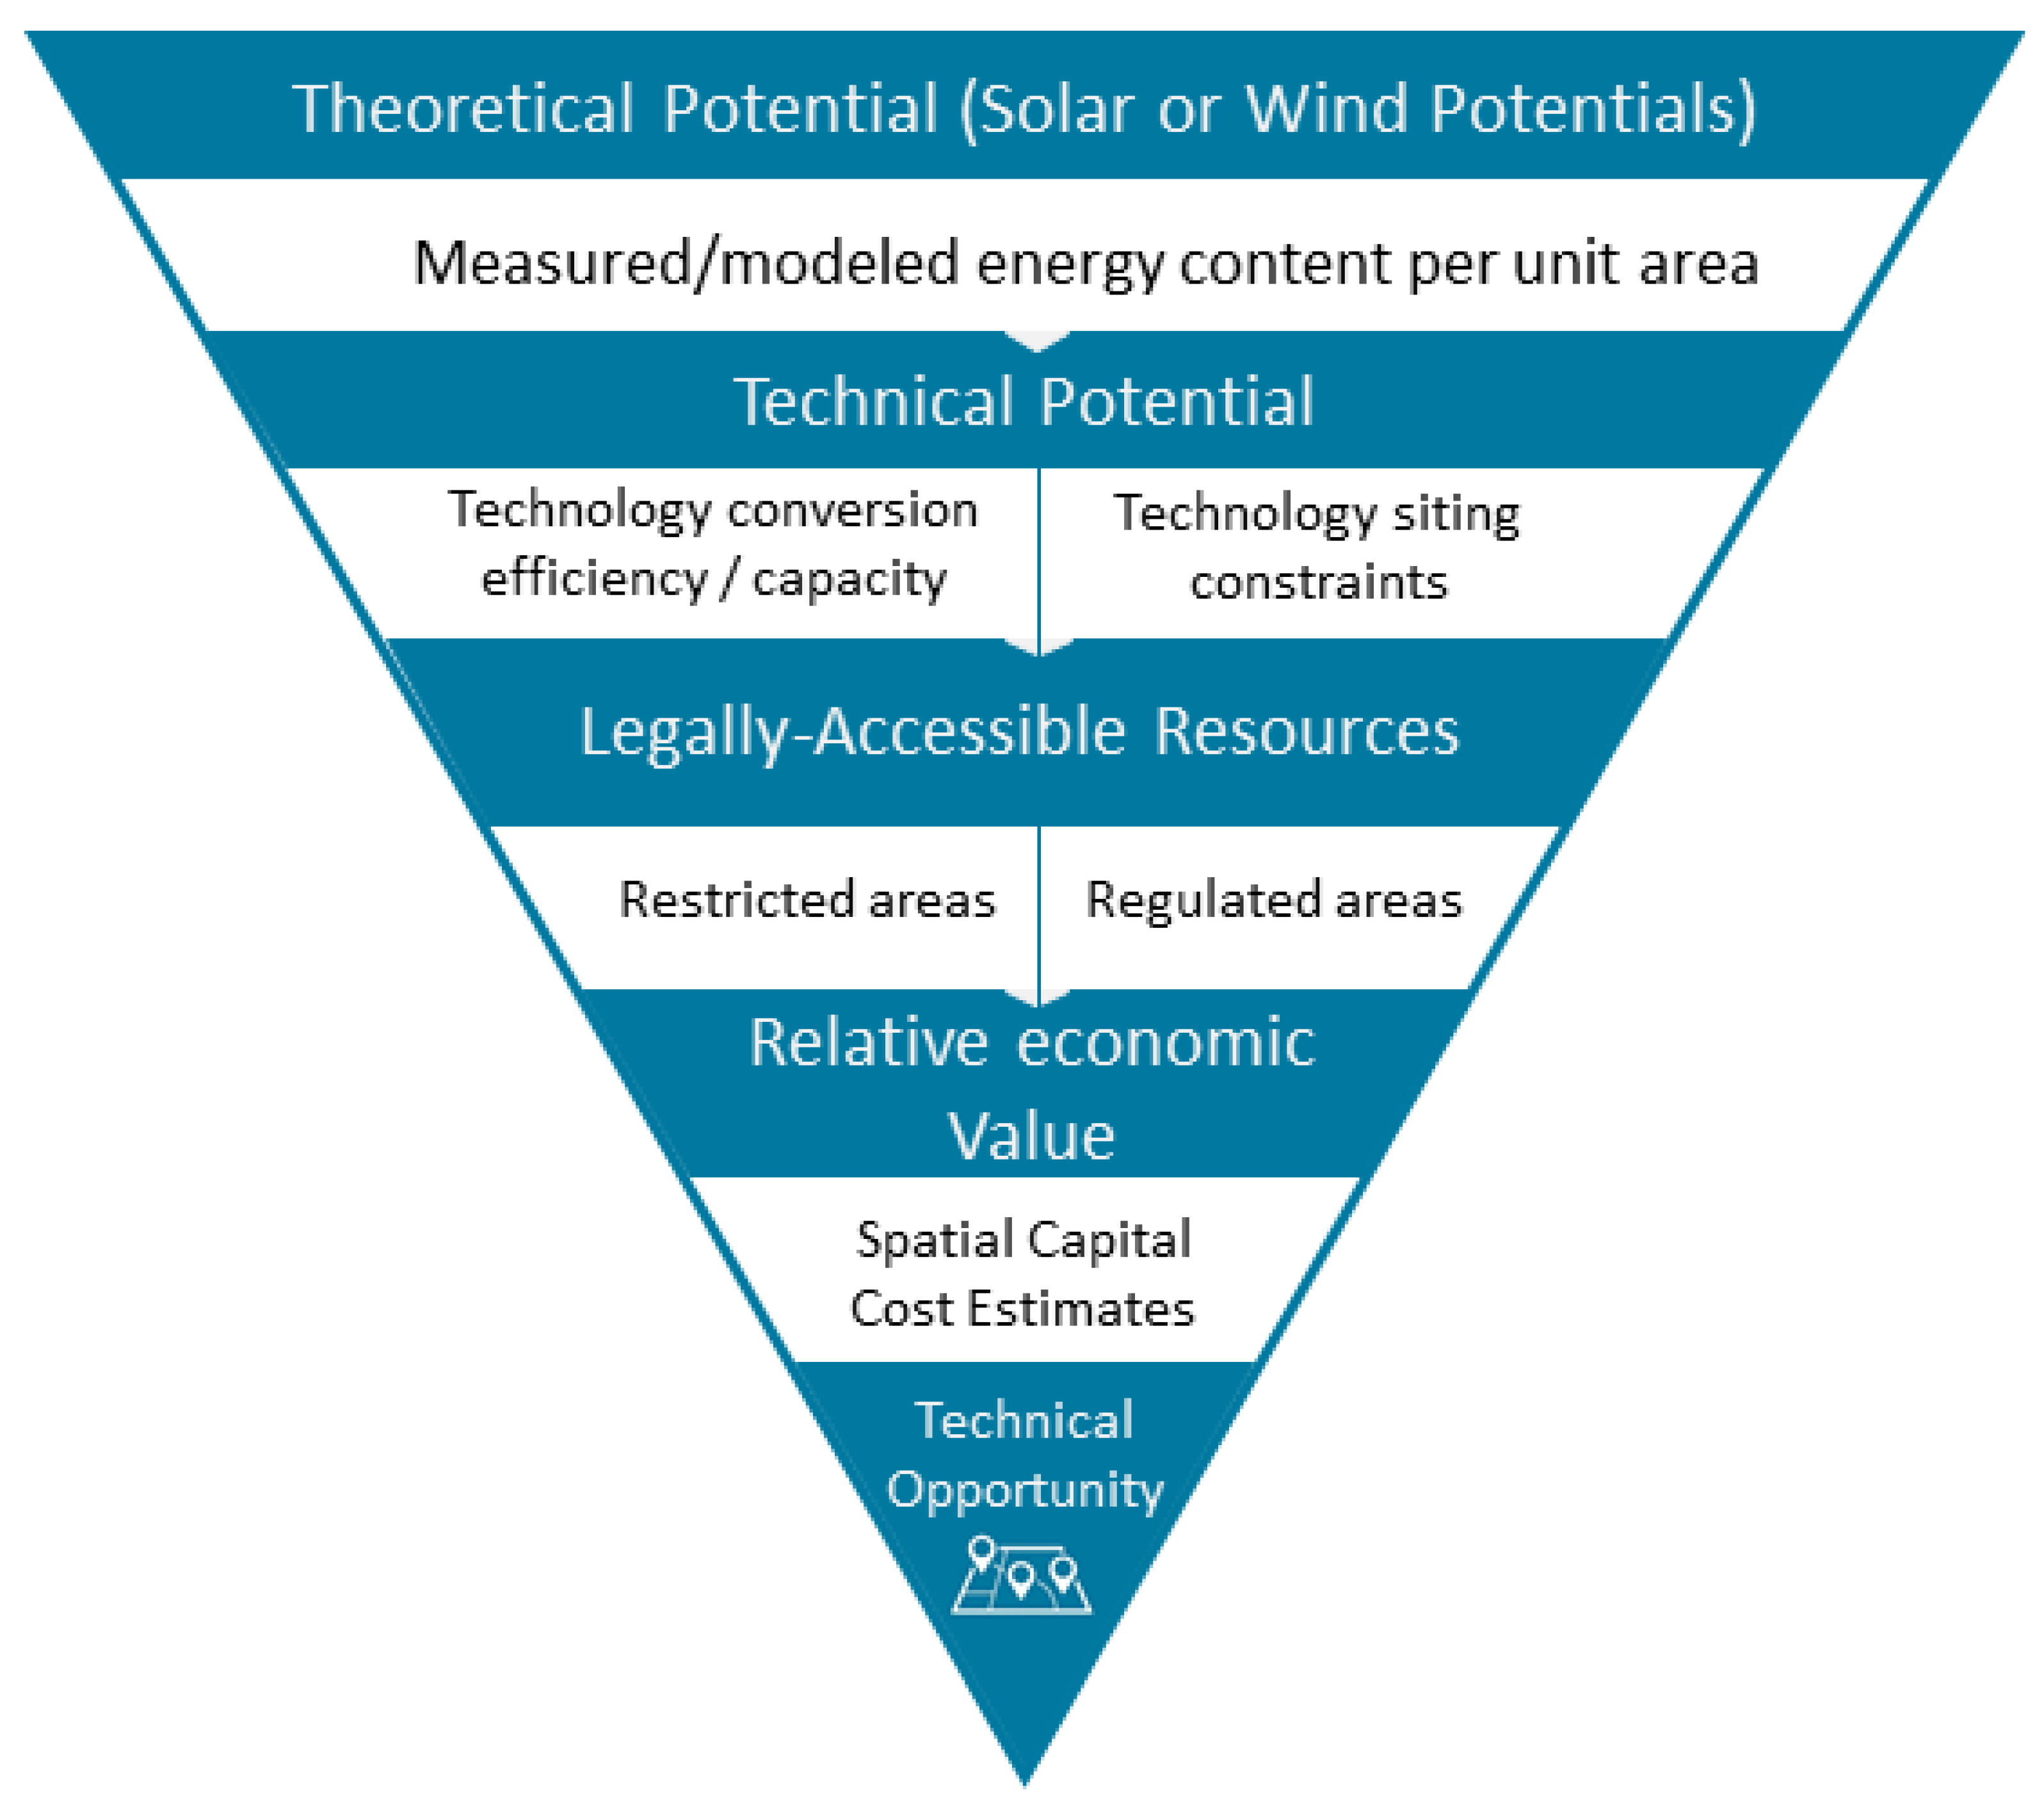
3.2. A Framework to Standardize RE Mapping
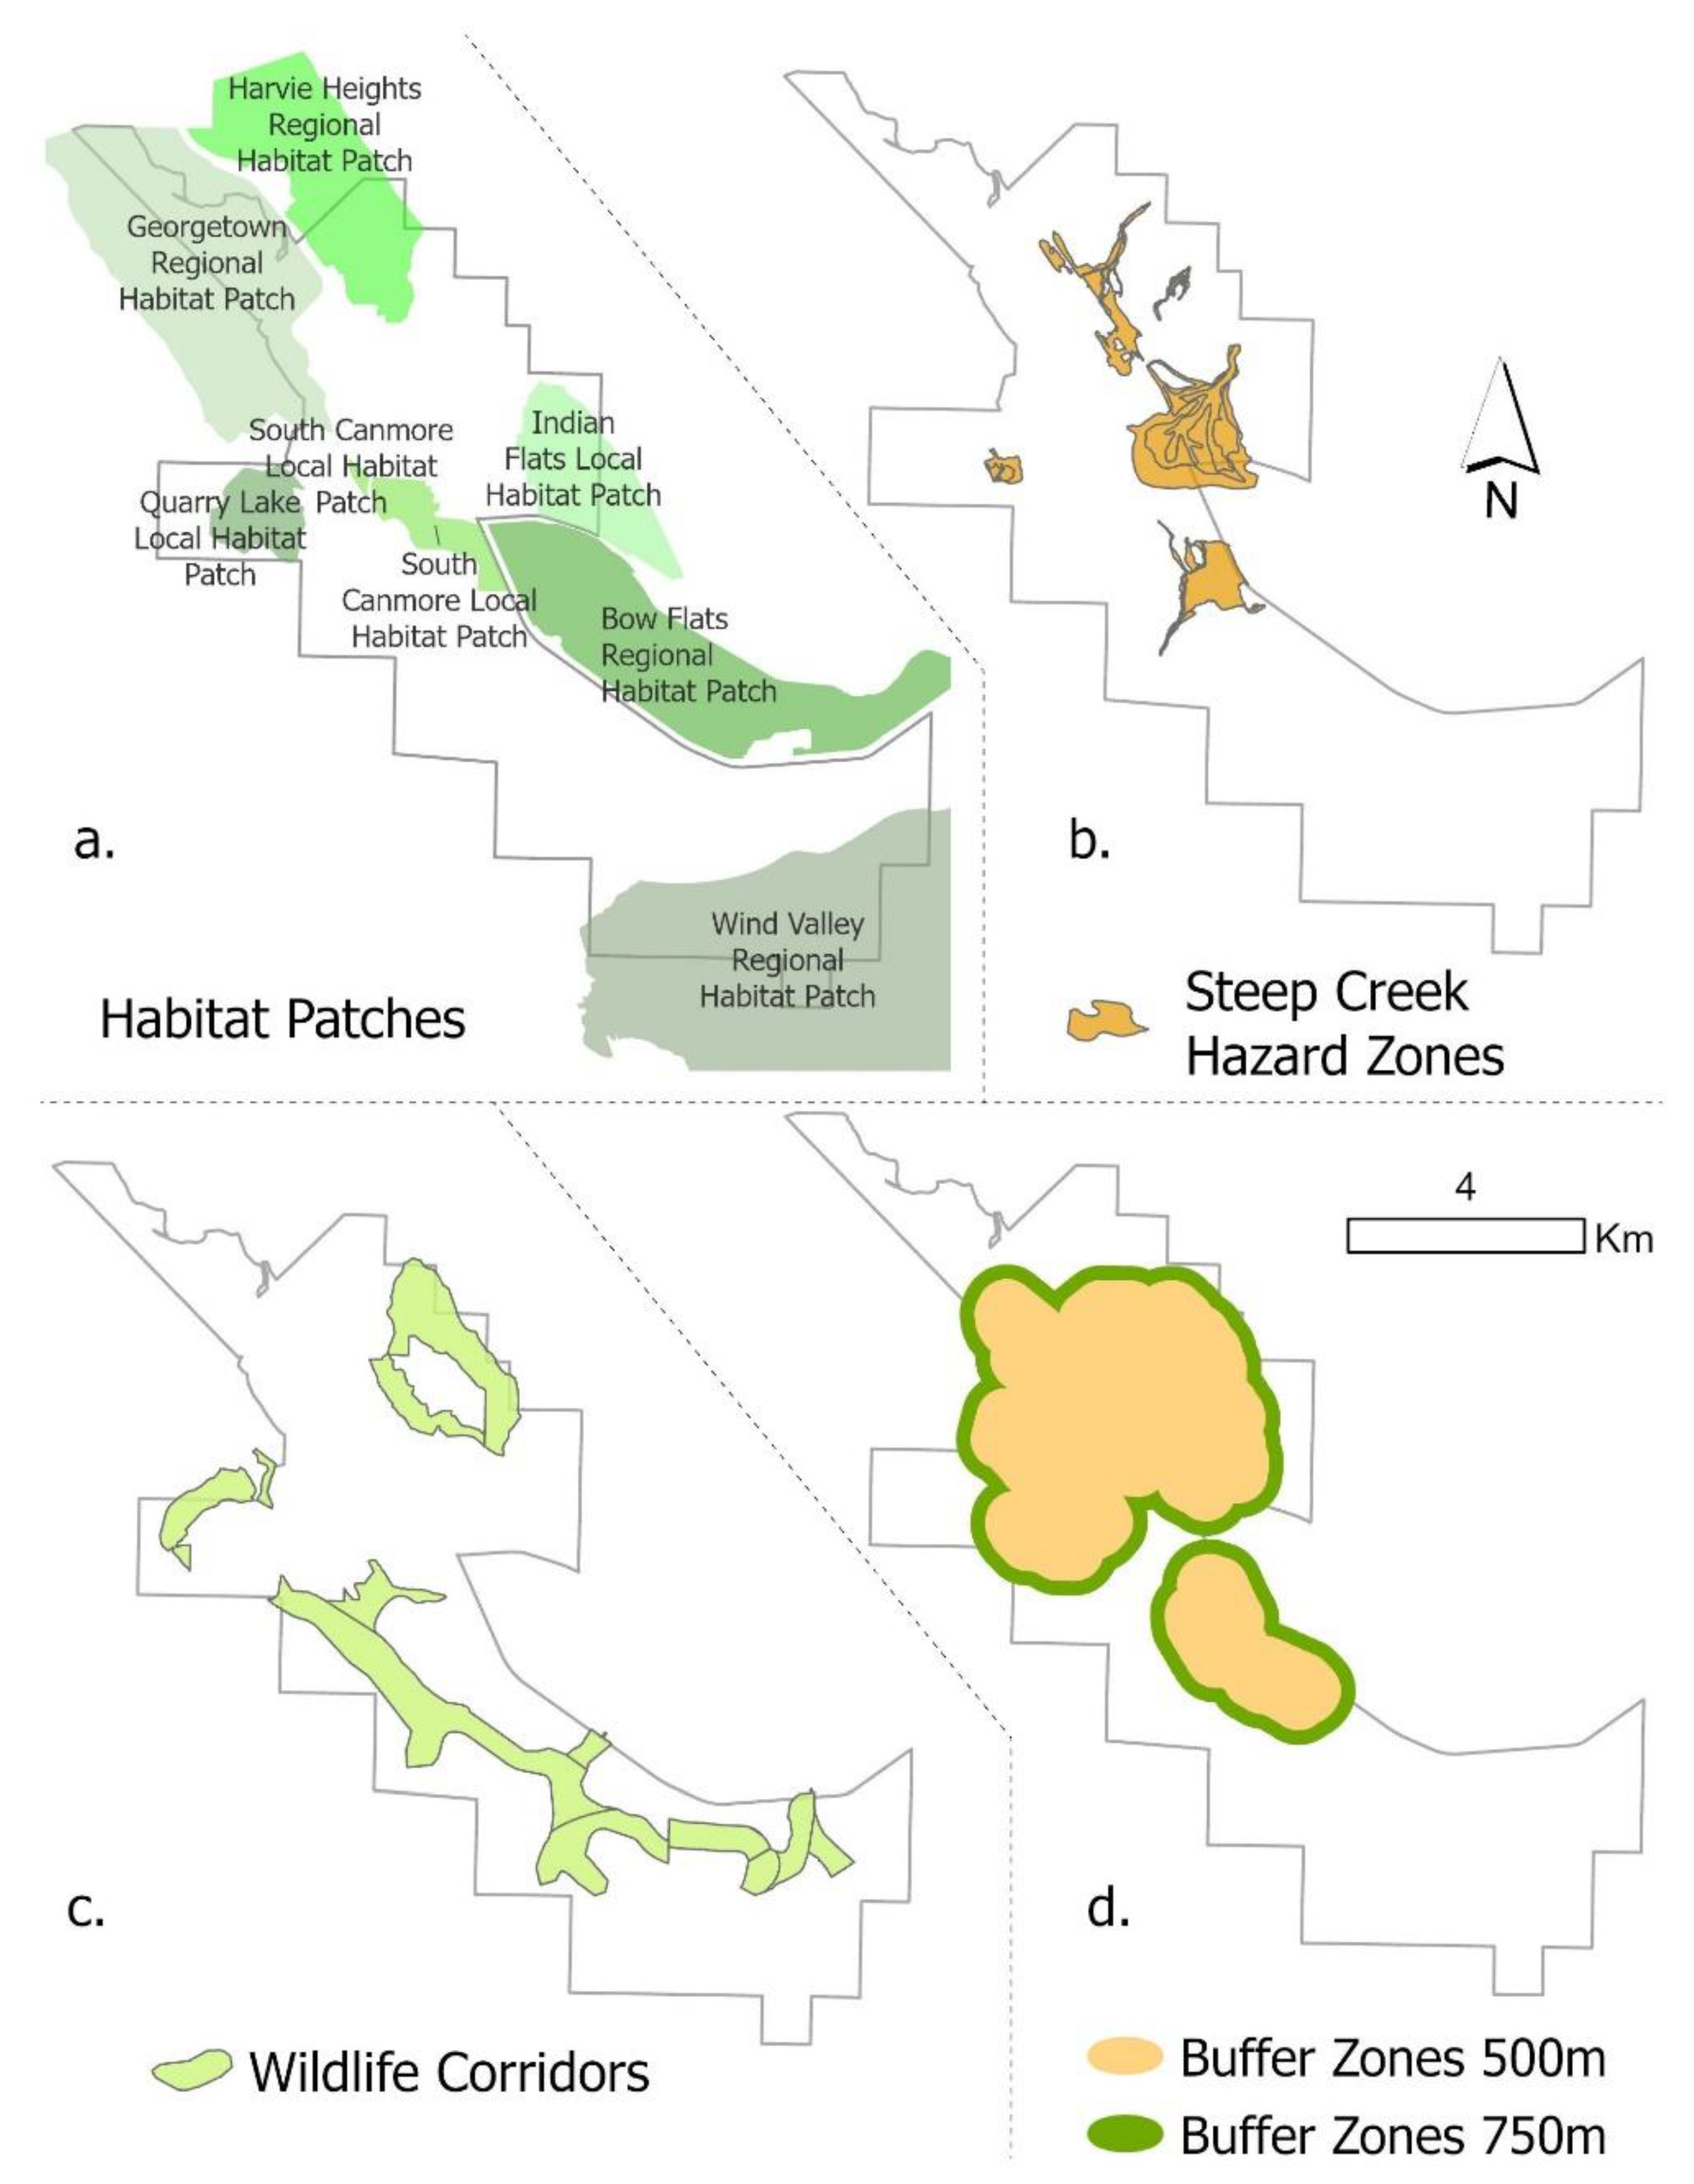
3.3. Regulatory Scenarios
4. Results
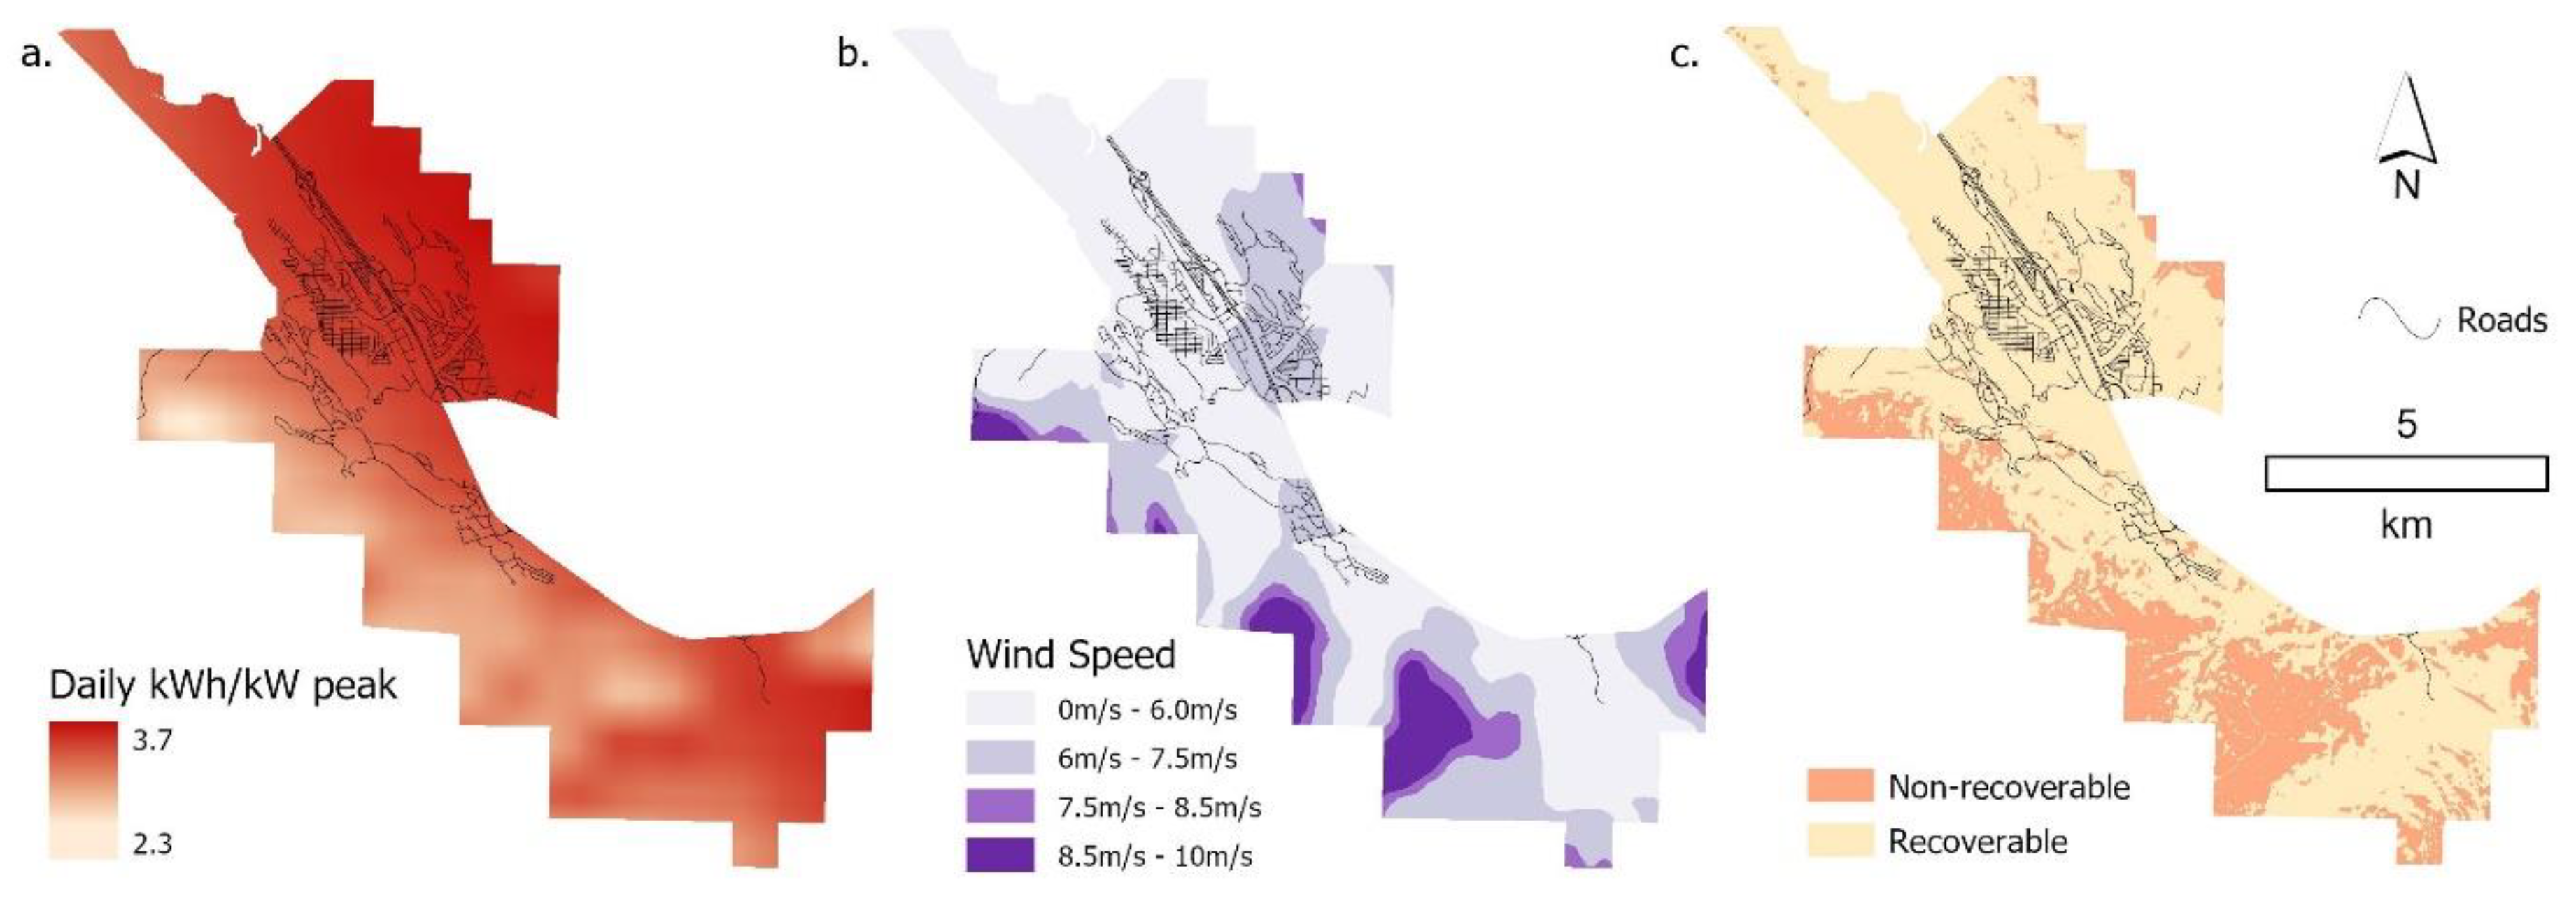
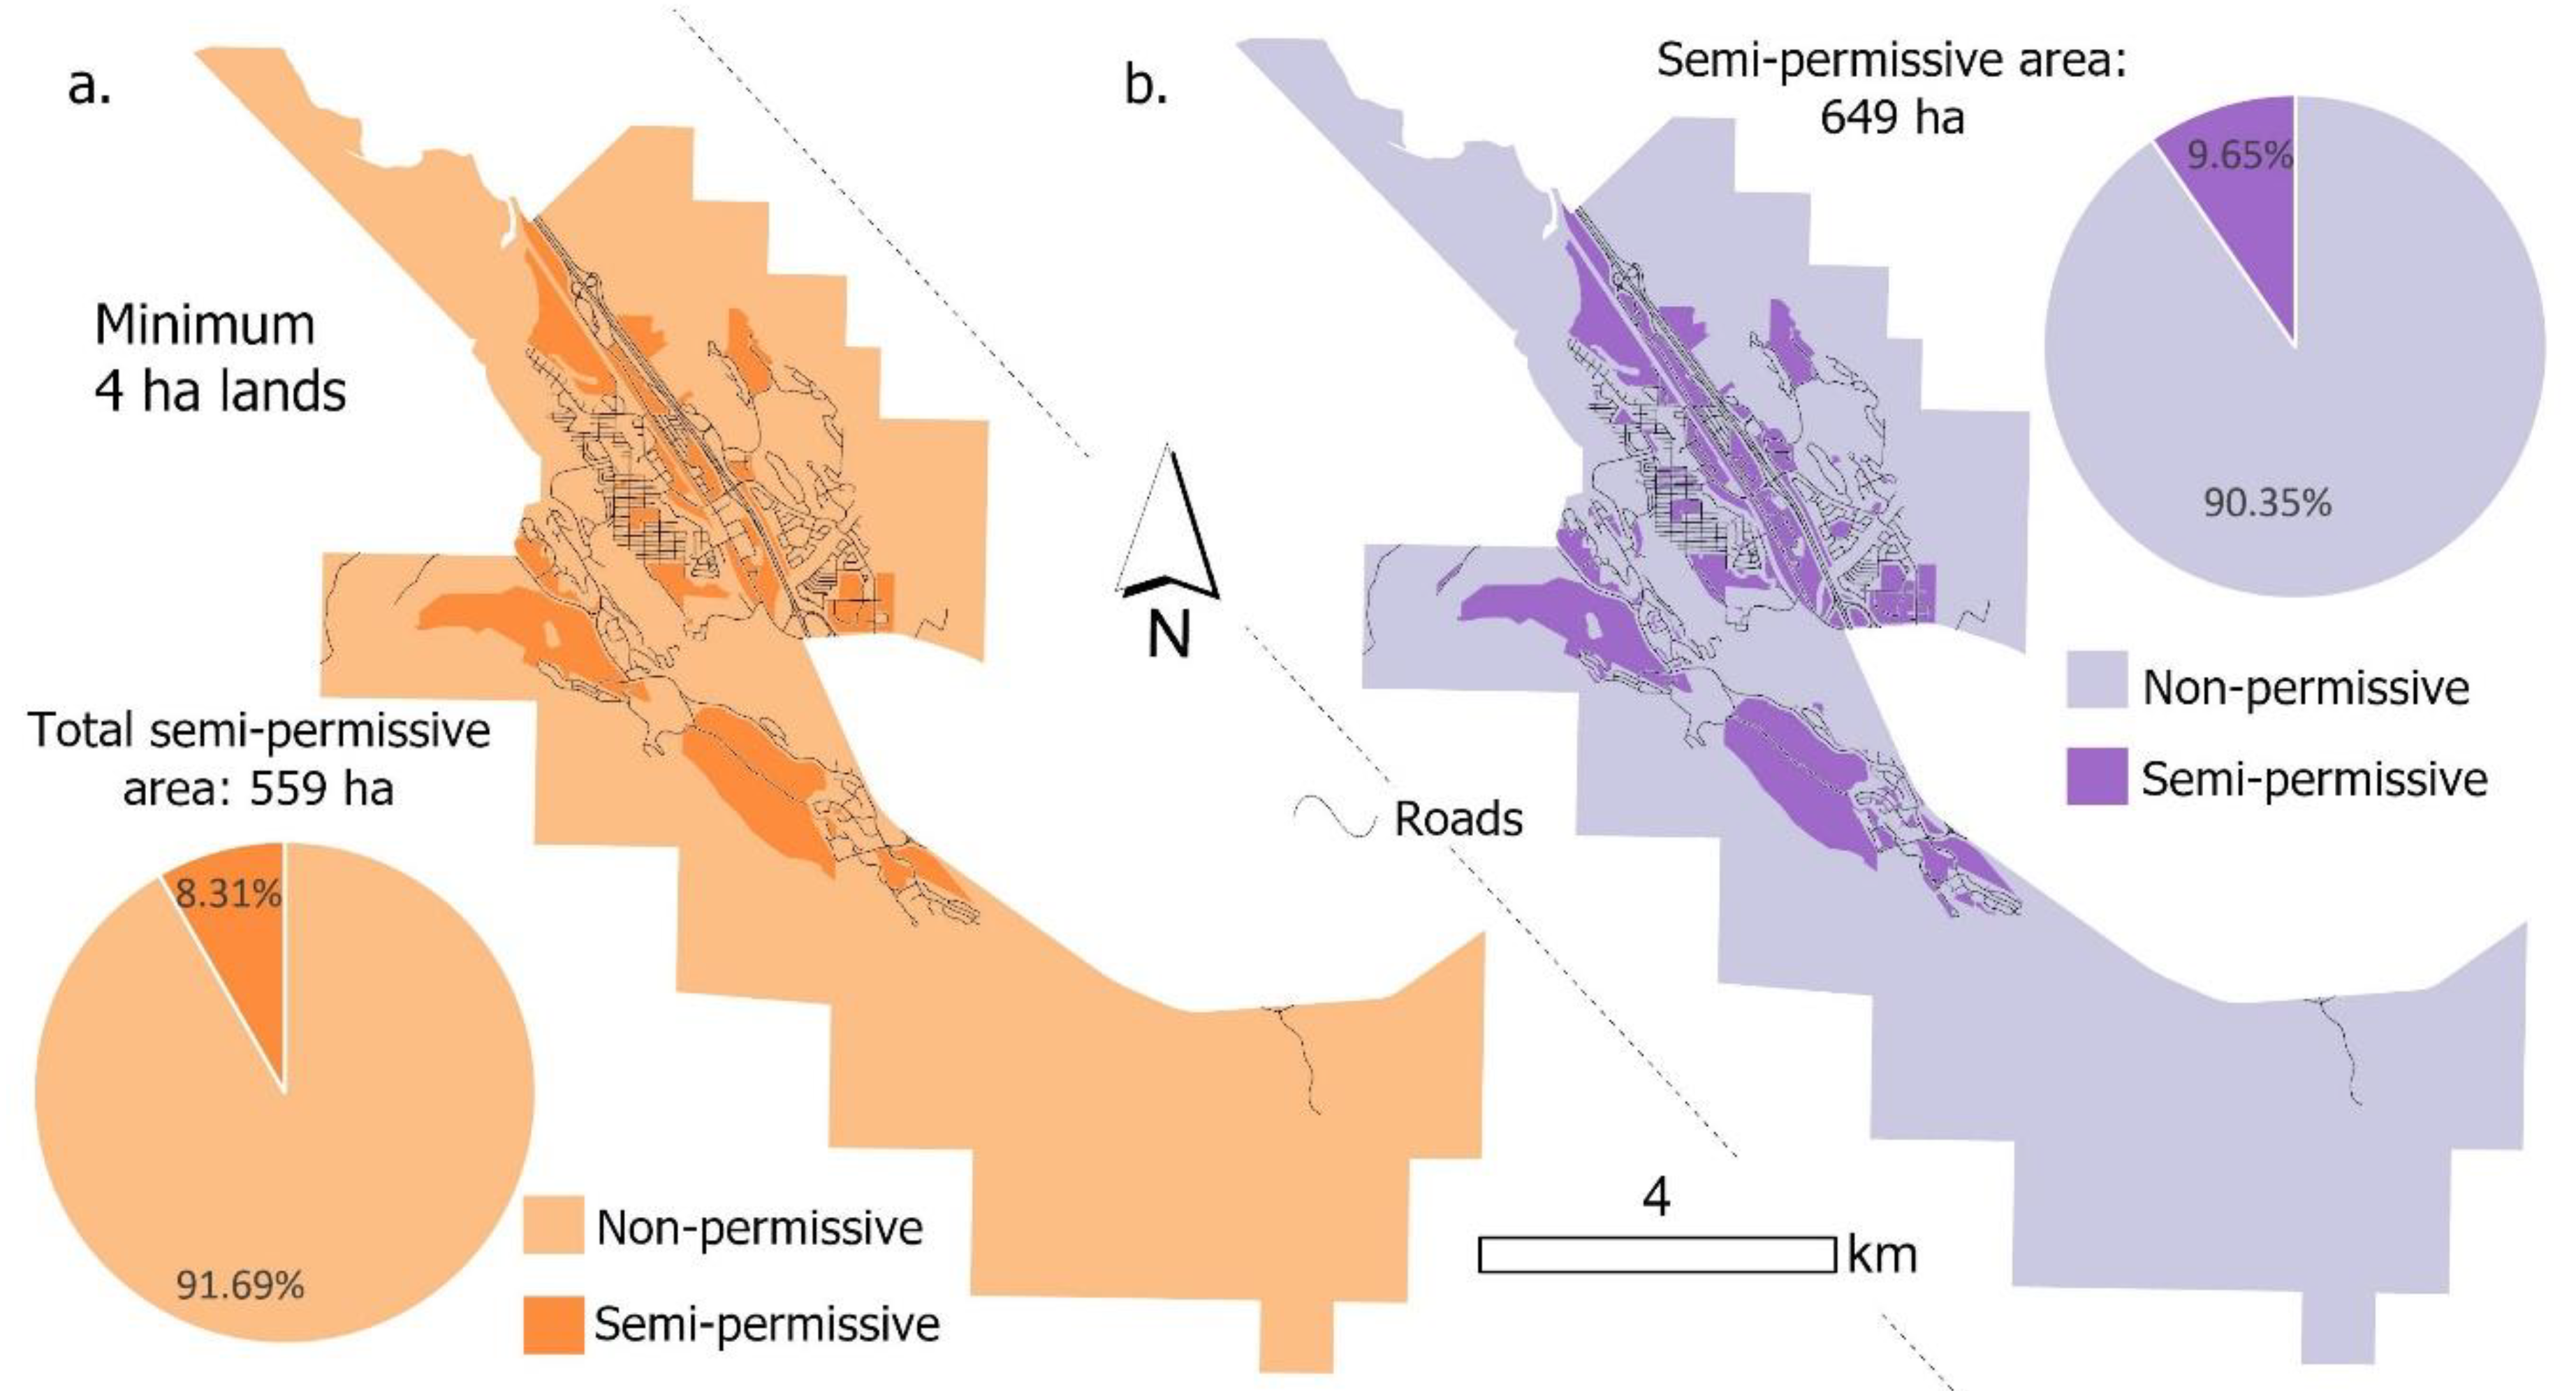
4.1. Accessible RE Resources
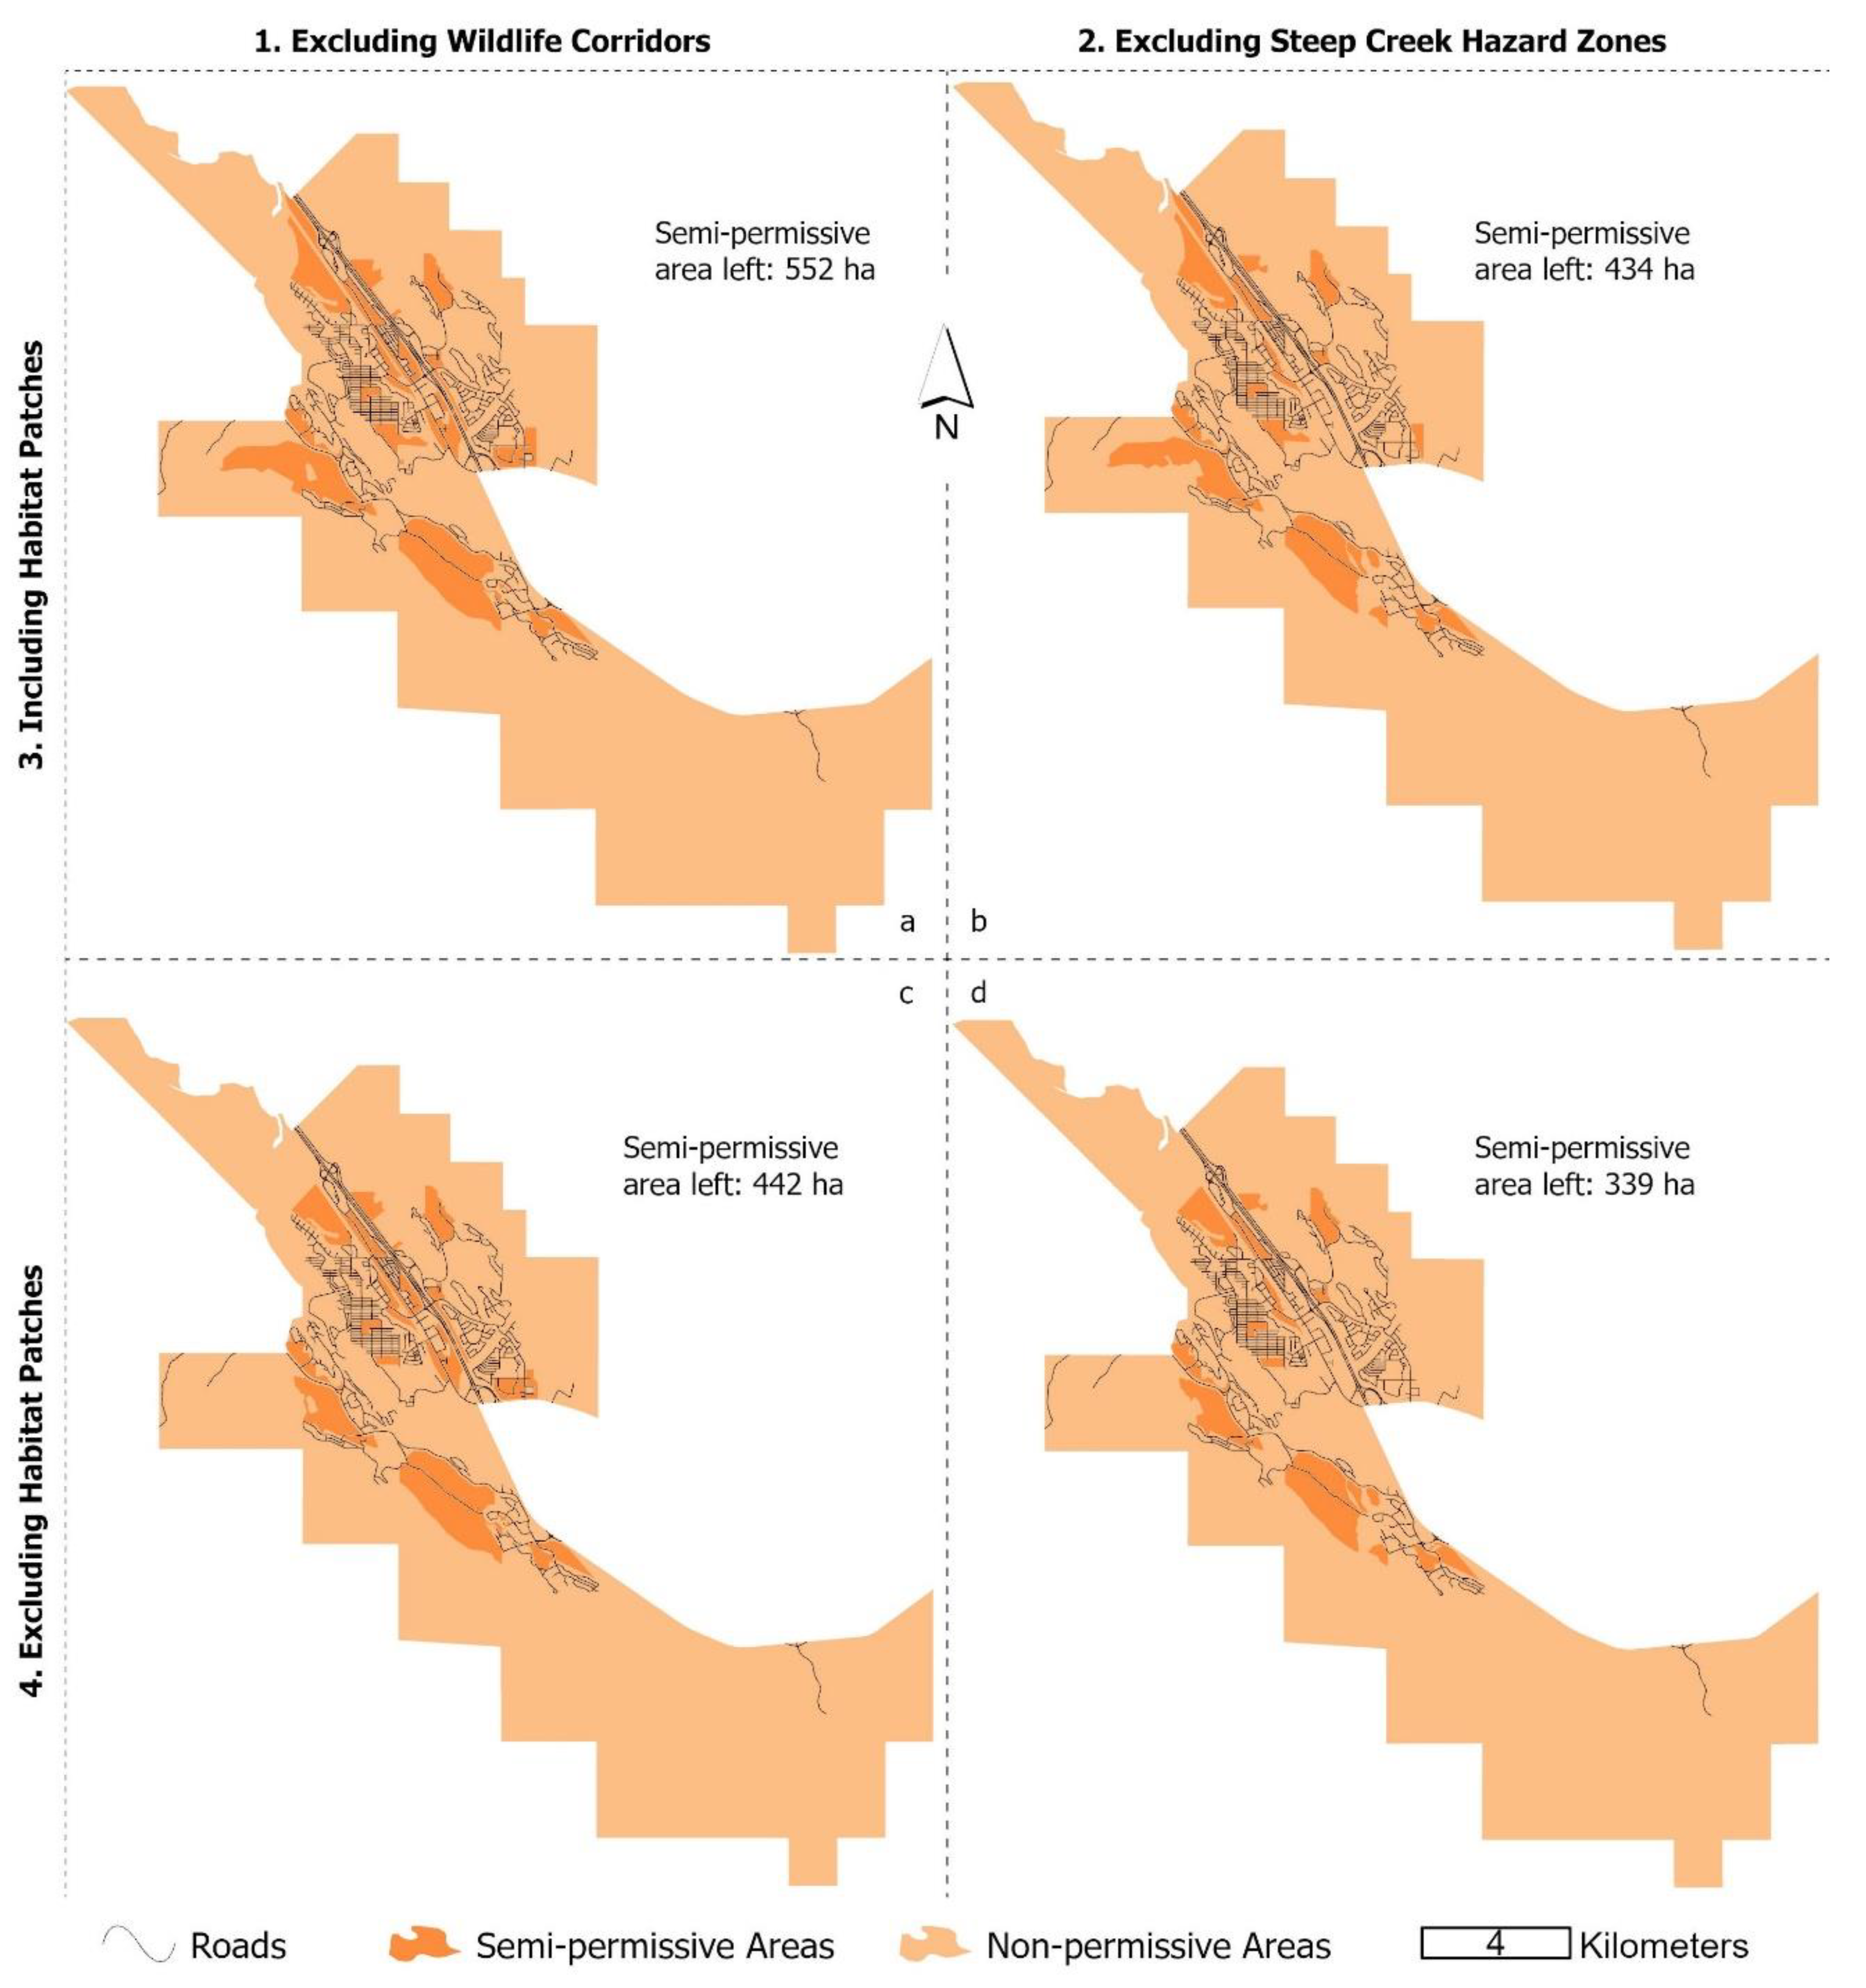
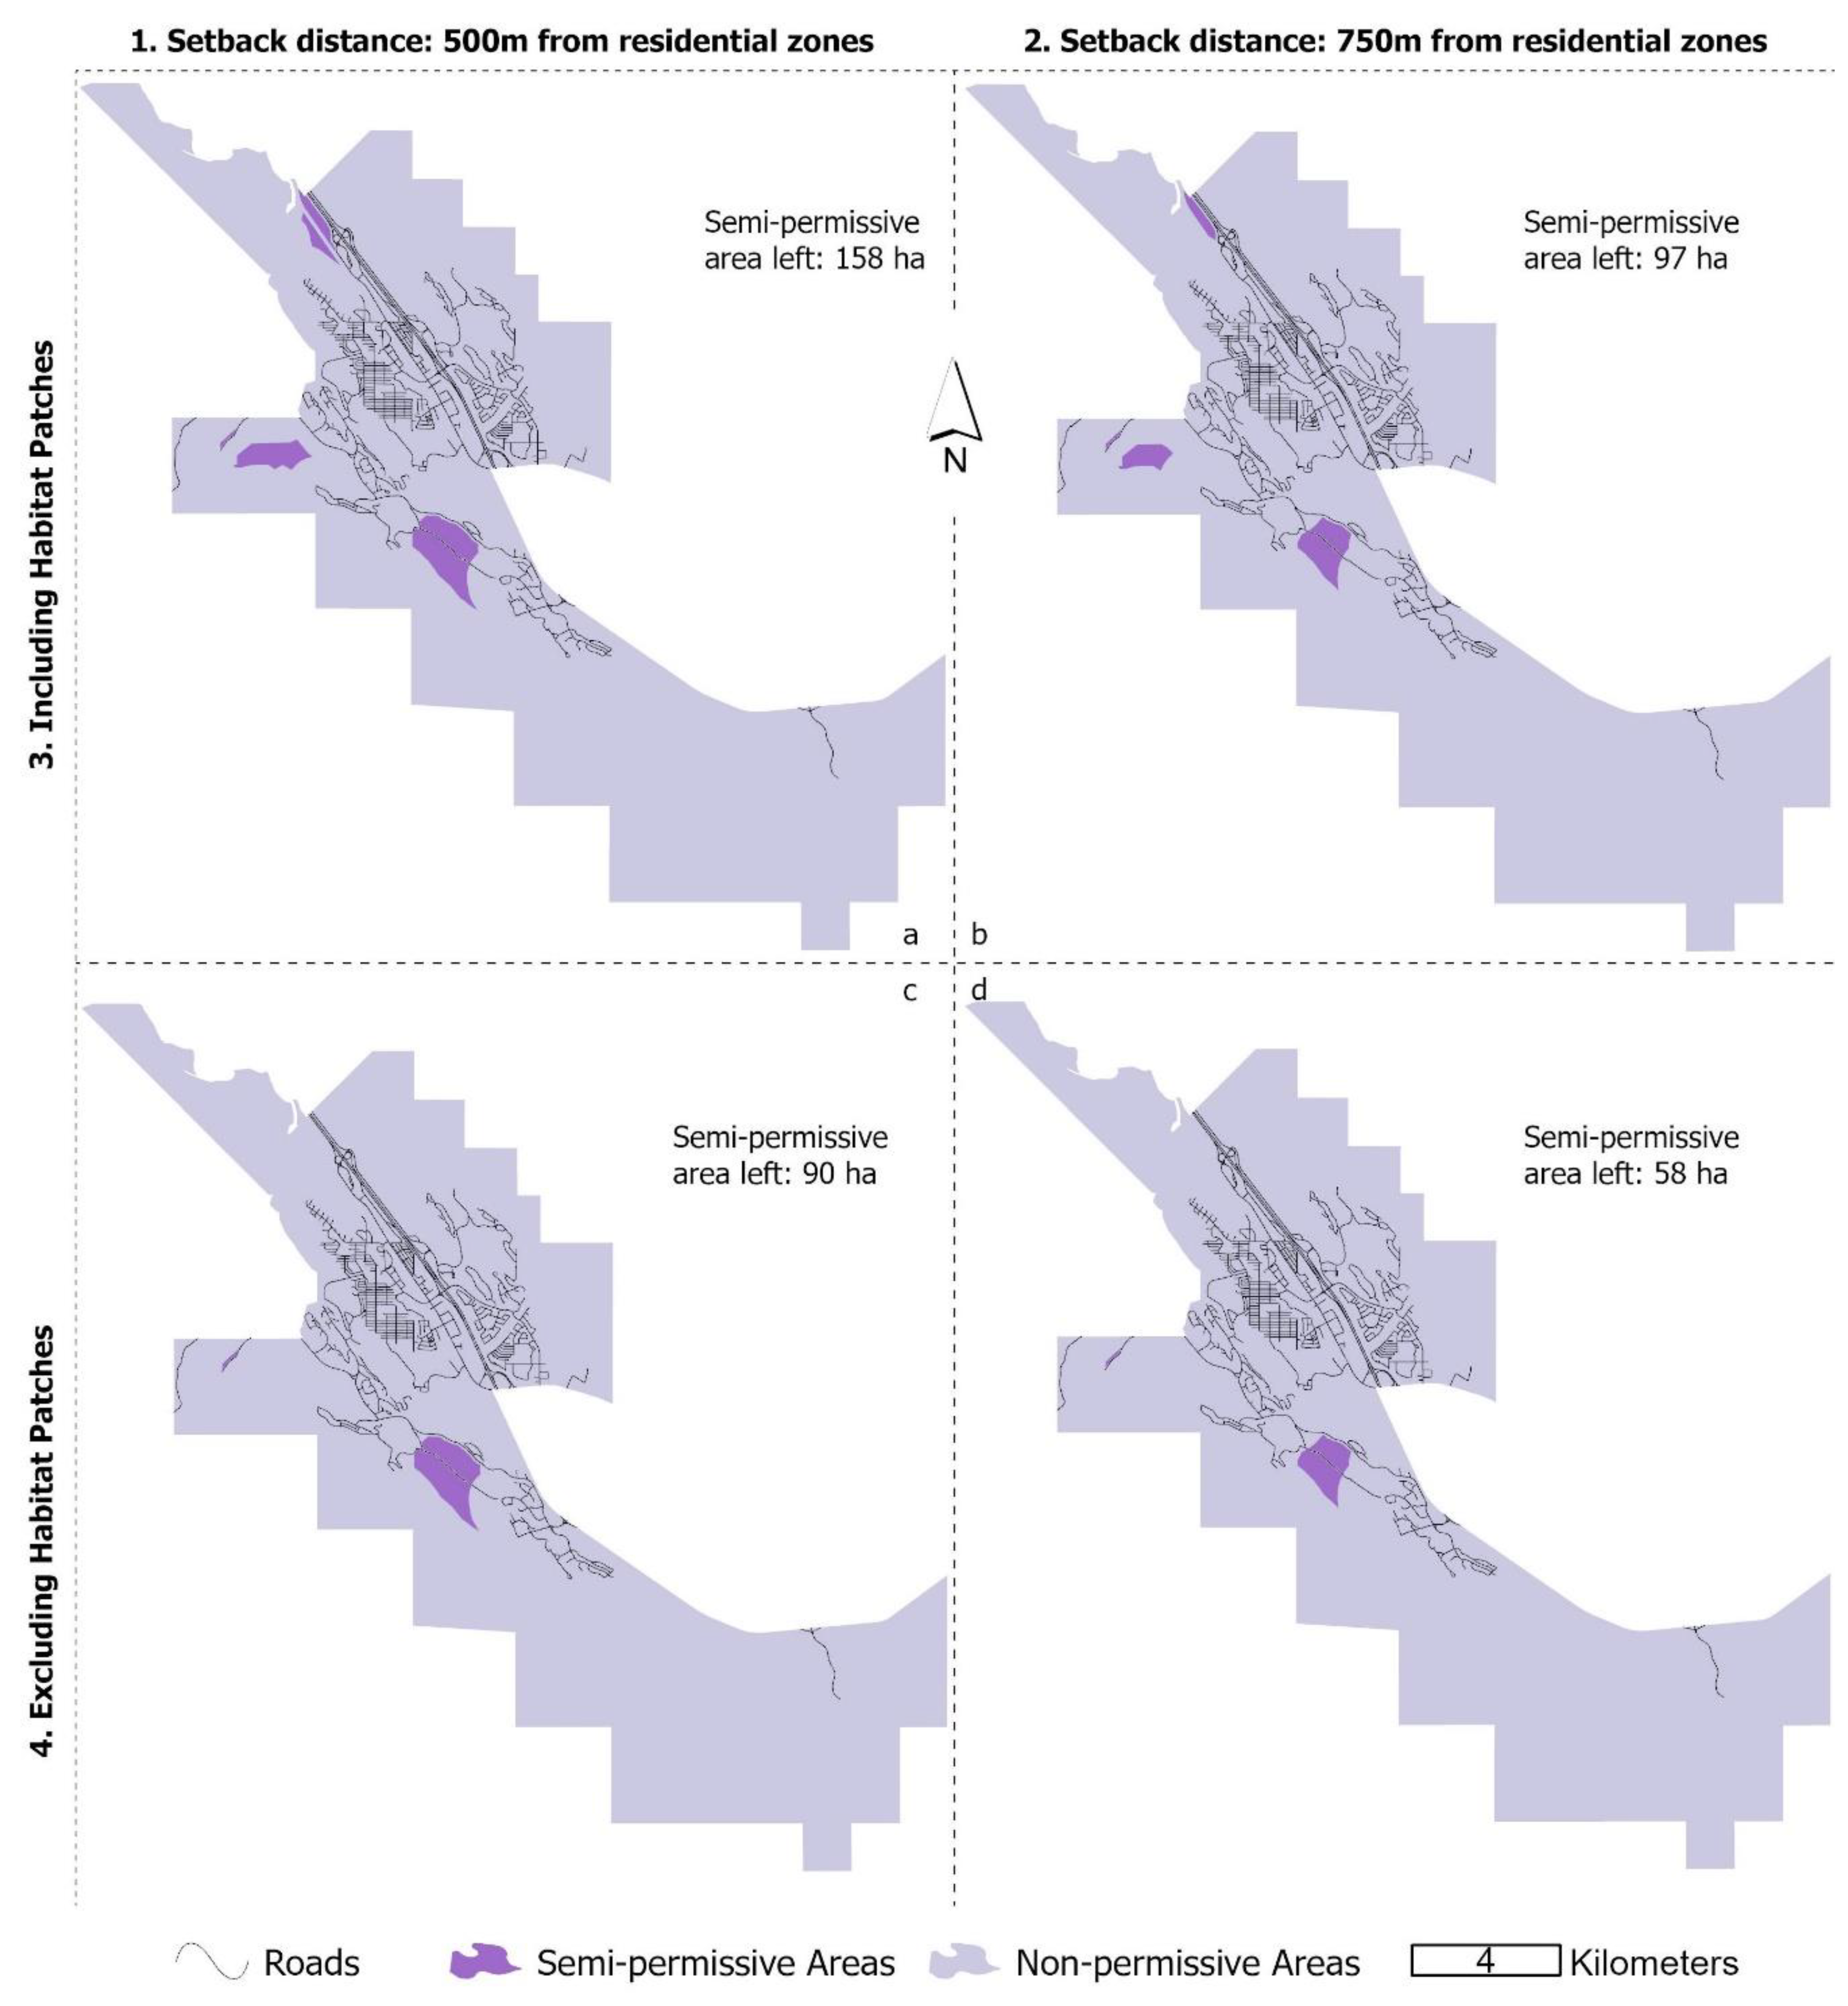
4.2. Scenario Maps
4.3. Estimating RE Generation
5. Discussion
6. Conclusions
Author Contributions
Funding
Acknowledgments
Conflicts of Interest
References
- Intergovernmental Panel on Climate Change. Climate Change 2013 – The Physical Science Basis: Working Group I Contribution to the Fifth Assessment Report of the Intergovernmental Panel on Climate Change; Cambridge University Press: Cambridge, UK, 2014. [Google Scholar]
- Edenhofer, O.; Madruga, R.P.; Sokona, Y.; Seyboth, K.; Matschoss, P.; Kadner, S.; Zwickel, T.; Eickemeier, P.; Hansen, G.; Schlömer, S.; et al. Renewable Energy Sources and Climate Change Mitigation: Special Report of the Intergovernmental Panel on Climate Change; Cambridge University Press: Cambridge, UK, 2011. [Google Scholar] [CrossRef] [Green Version]
- Busch, H.; McCormick, K. Local Power: Exploring the Motivations of Mayors and Key Success Factors for Local Municipalities to Go 100% Renewable Energy. Energy Sustain. Soc. 2014, 4, 1–15. [Google Scholar] [CrossRef]
- Eberhard, A.; Naude, R. The South African Renewable Energy Independent Power Producer Procurement Programme: A Review and Lessons Learned. J. Energy S. Afr. 2016, 27. [Google Scholar] [CrossRef] [Green Version]
- Hernik, J.; Noszczyk, T.; Rutkowska, A. Towards a Better Understanding of the Variables That Influence Renewable Energy Sources in Eastern Poland. J. Clean. Prod. 2019, 241. [Google Scholar] [CrossRef]
- Barrington-Leigh, C.; Ouliaris, M. The Renewable Energy Landscape in Canada: A Spatial Analysis. Renew. Sustain. Energy Rev. 2017, 75, 809–819. [Google Scholar] [CrossRef]
- Natural Resources Canada. Renewable Energy Facts. Available online: https://www.nrcan.gc.ca/science-data/data-analysis/energy-data-analysis/energy-facts/energy-and-greenhouse-gas-emissions-ghgs/20063 (accessed on 29 January 2020).
- Statistics Canada. Table 25-10-0020-01 Electric Power, Annual Generation by Class of Producer. Available online: https://www150.statcan.gc.ca/t1/tbl1/en/tv.action?pid=2510002001&pickMembers%5B0%5D=1.1&pickMembers%5B1%5D=3.1 (accessed on 28 January 2020). [CrossRef]
- Canada Energy Regulator. Provincial and Territorial Energy Profiles—Alberta. Available online: https://www.cer-rec.gc.ca/nrg/ntgrtd/mrkt/nrgsstmprfls/ab-eng.html (accessed on 10 January 2020).
- Bell, J.; Weis, T. Greening the Grid: Powering Alberta’s Future with Renewable Energy; The Pembina Institute: Drayton Valley, AB, Canada, 2009. [Google Scholar]
- Olateju, B.; Kumar, A.; Secanell, M. A Techno-Economic Assessment of Large Scale Wind-Hydrogen Production with Energy Storage in Western Canada. Int. J. Hydrogen Energy 2016, 41, 8755–8776. [Google Scholar] [CrossRef]
- Weldemichael, Y.; Assefa, G. Assessing the Energy Production and GHG (Greenhouse Gas) Emissions Mitigation Potential of Biomass Resources for Alberta. J. Clean. Prod. 2016, 112, 4257–4264. [Google Scholar] [CrossRef]
- Weldu, Y.W.; Assefa, G. The Search for Most Cost-Effective Way of Achieving Environmental Sustainability Status in Electricity Generation: Environmental Life Cycle Cost Analysis of Energy Scenarios. J. Clean. Prod. 2017, 142, 2296–2304. [Google Scholar] [CrossRef]
- Giesy, J.P.; Anderson, J.C.; Wiseman, S.B. Alberta Oil Sands Development. Proc. Natl. Acad. Sci. USA 2010. [Google Scholar] [CrossRef] [Green Version]
- Olmstead, D.E.H.; Ayres, M.J. Notes from a Small Market: The Energy-Only Market in Alberta. Electr. J. 2014, 27, 102–111. [Google Scholar] [CrossRef]
- Government of Alberta. Climate Leadership Plan|Alberta.Ca. June 2018. Available online: https://open.alberta.ca/dataset/da6433da-69b7-4d15 (accessed on 29 January 2020).
- Town of Canmore. Climate Change: Climate Action Plan. Available online: https://canmore.ca/residents/stewardship-of-the-environment/climate-change-adaptation-plan (accessed on 10 January 2020).
- Town of Canmore. Environmental Sustainability Action Plan. Available online: https://canmore.ca/documents/1016-environmental-sustainability-action-plan (accessed on 10 January 2020).
- Calvert, K.E. Measuring and Modelling the Land-Use Intensity and Land Requirements of Utility-Scale Photovoltaic Systems in the Canadian Province of Ontario. Can. Geogr. 2018, 62, 188–199. [Google Scholar] [CrossRef]
- Calvert, K. Mapping opportunities for land-based renewable energy generation in Ontario: A guidebook for local planners and analysts. Available online: https://www.cekap.ca/PDF/resources-mapping-opportunities-for-renewable-energy-a-guidebook.pdf (accessed on 12 May 2020).
- Rosenbloom, D.; Meadowcroft, J. Harnessing the Sun: Reviewing the Potential of Solar Photovoltaics in Canada. Renew. Sustain. Energy Rev. 2014, 40, 488–496. [Google Scholar] [CrossRef]
- CanSIA. Alberta Go Solar Guide.pdf. Available online: http://www.cansia.ca/uploads/7/2/5/1/72513707/alberta_go_solar_guide.pdf (accessed on 10 January 2020).
- Ehr, C.; Patterson, E.; Donegan, T. ROOFTOP SOLAR IN CANMORE A Neighbourhood by Neighbourhood Analysis; Pioneer Consulting: Calgary, AB, Canada, 2019. [Google Scholar]
- Jordan, P.G. Solar Energy Markets An Analysis of the Global Solar Industry; Elsevier Science: Burlington, NJ, USA, 2013. [Google Scholar]
- CANWEA. Installed Capacity. Available online: https://canwea.ca/wind-energy/installed-capacity/ (accessed on 29 January 2020).
- CANWEA. Affordable Power. Available online: https://canwea.ca/wind-facts/affordable-power/ (accessed on 5 February 2020).
- Hornung, R. Technology Advances Spurring Ever-Lower Wind Energy Costs. Available online: https://canwea.ca/blog/2018/02/26/technology-advances-spurring-ever-lower-wind-energy-costs/ (accessed on 22 December 2019).
- Pembina Institute. Wind Energy in Alberta: Benefits to Local Economies; Pembina Institute: Calgaray, AB, Canada, 2017. [Google Scholar]
- Calvert, K.; Mabee, W. More Solar Farms or More Bioenergy Crops? Mapping and Assessing Potential Land-Use Conflicts among Renewable Energy Technologies in Eastern Ontario, Canada. Appl. Geogr. 2015, 56, 209–221. [Google Scholar] [CrossRef]
- Van Haaren, R.; Fthenakis, V. GIS-Based Wind Farm Site Selection Using Spatial Multi-Criteria Analysis (SMCA): Evaluating the Case for New York State. Renew. Sustain. Energy Rev. 2011, 15, 3332–3340. [Google Scholar] [CrossRef]
- Lovett, A.A.; Sünnenberg, G.M.; Richter, G.M.; Dailey, A.G.; Riche, A.B.; Karp, A. Land Use Implications of Increased Biomass Production Identified by Gis-Based Suitability and Yield Mapping for Miscanthus in England. Bioenergy Res. 2009. [Google Scholar] [CrossRef]
- Djebbar, R.; Belanger, D.; Boutin, D.; Weterings, E.; Poirier, M. SolarPACES 2013 Potential of Concentrating Solar Power in Canada. Energy Procedia 2013, 49, 2303–2312. [Google Scholar] [CrossRef] [Green Version]
- Janke, J.R. Multicriteria GIS Modeling of Wind and Solar Farms in Colorado. Renew. Energy 2010. [Google Scholar] [CrossRef]
- Al-Yahyai, S.; Charabi, Y.; Gastli, A.; Al-Badi, A. Wind Farm Land Suitability Indexing Using Multi-Criteria Analysis. Renew. Energy 2012, 44, 80–87. [Google Scholar] [CrossRef]
- Sultana, A.; Kumar, A. Optimal Siting and Size of Bioenergy Facilities Using Geographic Information System. Appl. Energy 2012, 94, 192–201. [Google Scholar] [CrossRef]
- Uyan, M. GIS-Based Solar Farms Site Selection Using Analytic Hierarchy Process (AHP) in Karapinar Region Konya/Turkey. Renew. Sustain. Energy Rev. 2013, 28, 11–17. [Google Scholar] [CrossRef]
- Brewer, J.; Ames, D.P.; Solan, D.; Lee, R.; Carlisle, J. Using GIS Analytics and Social Preference Data to Evaluate Utility-Scale Solar Power Site Suitability. Renew. Energy 2015, 81, 825–836. [Google Scholar] [CrossRef]
- Mourmouris, J.C.; Potolias, C. A Multi-Criteria Methodology for Energy Planning and Developing Renewable Energy Sources at a Regional Level: A Case Study Thassos, Greece. Energy Policy 2013, 52, 522–530. [Google Scholar] [CrossRef]
- Perpiña Castillo, C.; Batista e Silva, F.; Lavalle, C. An Assessment of the Regional Potential for Solar Power Generation in EU-28. Energy Policy 2016, 88, 86–99. [Google Scholar] [CrossRef]
- Watson, J.J.W.; Hudson, M.D. Regional Scale Wind Farm and Solar Farm Suitability Assessment Using GIS-Assisted Multi-Criteria Evaluation. Landsc. Urban Plan. 2015. [Google Scholar] [CrossRef]
- Strantzali, E.; Aravossis, K. Decision Making in Renewable Energy Investments: A Review. Renew. Sustain. Energy Rev. 2016, 55, 885–898. [Google Scholar] [CrossRef]
- Mardani, A.; Zavadskas, E.K.; Khalifah, Z.; Zakuan, N.; Jusoh, A.; Nor, K.M.; Khoshnoudi, M. A Review of Multi-Criteria Decision-Making Applications to Solve Energy Management Problems: Two Decades from 1995 to 2015. Renew. Sustain. Energy Rev. 2017. [Google Scholar] [CrossRef]
- Voivontas, D.; Assimacopoulos, D.; Mourelatos, A.; Corominas, J. Evaluation of Renewable Energy Potential Using a GIS Decision Support System. Renew. Energy 1998. [Google Scholar] [CrossRef]
- Angelis-Dimakis, A.; Biberacher, M.; Dominguez, J.; Fiorese, G.; Gadocha, S.; Gnansounou, E.; Guariso, G.; Kartalidis, A.; Panichelli, L.; Pinedo, I.; et al. Methods and Tools to Evaluate the Availability of Renewable Energy Sources. Renew. Sustain. Energy Rev. 2011, 15, 1182–1200. [Google Scholar] [CrossRef]
- Lopez, A.; Roberts, B.; Heimiller, D.; Blair, N.; Porro, G. U.S. Renewable Energy Technical Potentials: A GIS-Based Analysis. Natl. Renew. Energy Lab. Doc. 2012, 1, 1–40. [Google Scholar] [CrossRef] [Green Version]
- Blankenhorn, V.; Resch, B. Determination of Suitable Areas for the Generation of Wind Energy in Germany: Potential Areas of the Present and Future. ISPRS Int. J. Geo-Inf. 2014, 3, 942–967. [Google Scholar] [CrossRef] [Green Version]
- Miller, R.G.; Sorrell, S.R. The Future of Oil Supply. Philos. Trans. R. Soc. A Math. Phys. Eng. Sci. 2014. [Google Scholar] [CrossRef] [Green Version]
- Huber, M.T.; McCarthy, J. Beyond the Subterranean Energy Regime? Fuel, Land Use and the Production of Space. Trans. Inst. Br. Geogr. 2017, 42, 655–668. [Google Scholar] [CrossRef]
- Hillman, J.R. Sustainable Energy – Without the Hot Air. By D. J. C. MacKay. Cambridge: IUT (2009), Pp. 366. ISBN 978-0-9544529-3-3. Exp. Agric. 2010, 46, 117. [Google Scholar] [CrossRef]
- Chen, F.; Lu, S.M.; Tseng, K.T.; Lee, S.C.; Wang, E. Assessment of Renewable Energy Reserves in Taiwan. Renew. Sustain. Energy Rev. 2010, 14, 2511–2528. [Google Scholar] [CrossRef]
- Polatidis, H.; Haralambopoulos, D.A.; Munda, G.; Vreeker, R. Selecting an Appropriate Multi-Criteria Decision Analysis Technique for Renewable Energy Planning. Energy Sources Part B Econ. Plan. Policy 2006, 1, 181–193. [Google Scholar] [CrossRef]
- Statistics Canada. Population and Dwelling Count Highlight Tables, 2016 Census. Available online: https://www12.statcan.gc.ca/census-recensement/2016/dp-pd/hlt-fst/pd-pl/index-eng.cfm (accessed on 23 July 2019).
- Calvert, K. Building Tools to Plan for the Transition to Distributed Renewable Energy. Available online: https://www.cekap.ca/blog/building-tools-to-plan-for-the-transition-to-distributed-renewable-energy/ (accessed on 10 January 2020).
- ArcGIS Desktop. How Focal Statistics Works. Available online: https://desktop.arcgis.com/en/arcmap/10.3/tools/spatial-analyst-toolbox/how-focal-statistics-works.htm (accessed on 12 July 2019).
- Town of Canmore. Canmore Land Use Bylaw. Available online: https://canmore.ca/documents/bylaws/land-use-bylaw (accessed on 10 January 2020).
- Miller, L.M.; Keith, D.W. Corrigendum: Observation-Based Solar and Wind Power Capacity Factors and Power Densities (Environmental Research Letters (2018) 13 (104008). Environ. Res. Lett. 2019, 14. [Google Scholar] [CrossRef]
- Ryberg, D.S.; Caglayan, D.G.; Schmitt, S.; Linßen, J.; Stolten, D.; Robinius, M. The Future of European Onshore Wind Energy Potential: Detailed Distribution and Simulation of Advanced Turbine Designs. Energy 2019, 182, 1222–1238. [Google Scholar] [CrossRef]
- Government of Alberta. Highway Geometric Design Guide—Table of Contents. Available online: https://www.alberta.ca/highway-geometric-design-guide-table-of-contents.aspx (accessed on 13 July 2019).
- Alberta Municipal Affairs. GUIDELINES ON VALUATIONS of Tangible Capital Assets for PSAB 3150. Available online: http://www.municipalaffairs.gov.ab.ca/documents/ms/AIV_TCA_manual_on_guidelines_on_valuations.pdf (accessed on 23 August 2019).
- AESO. 2018 ISO Tariff Application—Appendix D Transmission System Cost Causation Study 2018 Update. Available online: https://www.aeso.ca/assets/Uploads/Appendix-D-Transmission-System-Cost-Causation-Study-2018-Update.pdf (accessed on 23 August 2019).
- Global Solar Atlas. Available online: https://globalsolaratlas.info/download (accessed on 1 October 2019).
- Global Wind Atlas. Available online: https://globalwindatlas.info/downloads (accessed on 1 October 2019).
- AltaLIS. AltaLIS: Your Trusted Source of Spatial Data. Available online: https://www.altalis.com/ (accessed on 1 October 2019).
- Town of Canmore. Open Data Portal. Available online: http://opendata-canmore.opendata.arcgis.com/ (accessed on 12 May 2019).
- PEMBINA Institute. Wind Energy in Alberta: Sustainable Communities, Sustainable Environment—Local Government Capacity and Wind Energy; Pembina Institute: Calgary, AB, Canada, 2017. [Google Scholar]
- IEC. IEC 61400—Online Collection Wind Turbines. Available online: https://collections.iec.ch/std/catalog.nsf/collection.xsp?open&col=IEC61400 (accessed on 23 August 2019).
- Todea Solar. MW+ Commercial Solar Systems. Available online: https://www.todaesolar.com.au/commercial-solar/system-sizes/1mw-solar/ (accessed on 23 November 2019).
- EWEA. Wind Energy’s Frequently Asked Questions (FAQ). Available online: https://www.ewea.org/wind-energy-basics/faq/ (accessed on 19 November 2019).
- Awad, H.; Gül, M.; Salim, K.M.E.; Yu, H. Predicting the Energy Production by Solar Photovoltaic Systems in Cold-Climate Regions. Int. J. Sustain. Energy 2018, 37, 978–998. [Google Scholar] [CrossRef]
- Rowlands, I.H. Solar PV Electricity and Market Characteristics: Two Canadian Case-Studies. Renew. Energy 2005, 30, 815–834. [Google Scholar] [CrossRef]
- Collinge, B. Solar Power Industry Feeling Impact of Cancelled Rebate Program. Available online: https://www.mylloydminsternow.com/32868/local-solar-install-company-feeling-impact-of-cancelled-rebate-program/ (accessed on 10 January 2020).
- AESO. Renewable Electricity Program. Available online: https://www.aeso.ca/market/renewable-electricity-program/ (accessed on 8 January 2020).
- Duan, J.; McKenna, A.; Van Kooten, G.C.; Liu, S. Renewable Electricity Grids, Battery Storage and Missing Money: An Alberta Case Study. In Proceedings of the 30th International Conference of Agricultural Economists, Vancouver, BC, Canada, 28 July–2 August 2018. [Google Scholar] [CrossRef]


| Categories | Layers | Constraints | Resolution | Data source | |
|---|---|---|---|---|---|
| 1. Theoretical | Solar PV input | 1 km | Global Solar Atlas [61] | ||
| Wind speed at 100 m level | 200 m | Global Wind Atlas [62] | |||
| 2. Recoverable | Slope | <35° | 10 m | Derived from digital elevation model [63] | |
| Aspect | No north facing when slope > 10° | 10 m | |||
| 3. Legally accessible (according to LUB) | Water bodies | Bow River | 60 m setback distance | Vector | Town of Canmore [64] |
| Other Rivers | 20 m setback distance | ||||
| Floodway | 6 m setback distance | ||||
| Roads | Arterial | 9 m setback distance | |||
| Highways | 27.5 m setback distance | ||||
| Other roads | 5 m setback distance | ||||
| Railway | 27.5 m setback distance | ||||
| Environmental | Natural parks | Non-permissive | |||
| Wildlife corridor | |||||
| Provincial parks | Altalis [63] | ||||
| Flood fringe | Semi-permissive | ||||
| Environmental district | Town of Canmore [6] | ||||
| Wildland conservation | |||||
| Administrative | Public use districts | ||||
| Urban reserved district | |||||
| Restricted urban reserve district | |||||
| Industrial areas | |||||
| Municipal parking lots | |||||
| Commercial zones | Non-permissive | ||||
| Residential zones | |||||
| Direct Control (DC) districts | Non- or semi-permissive depending on DC types | ||||
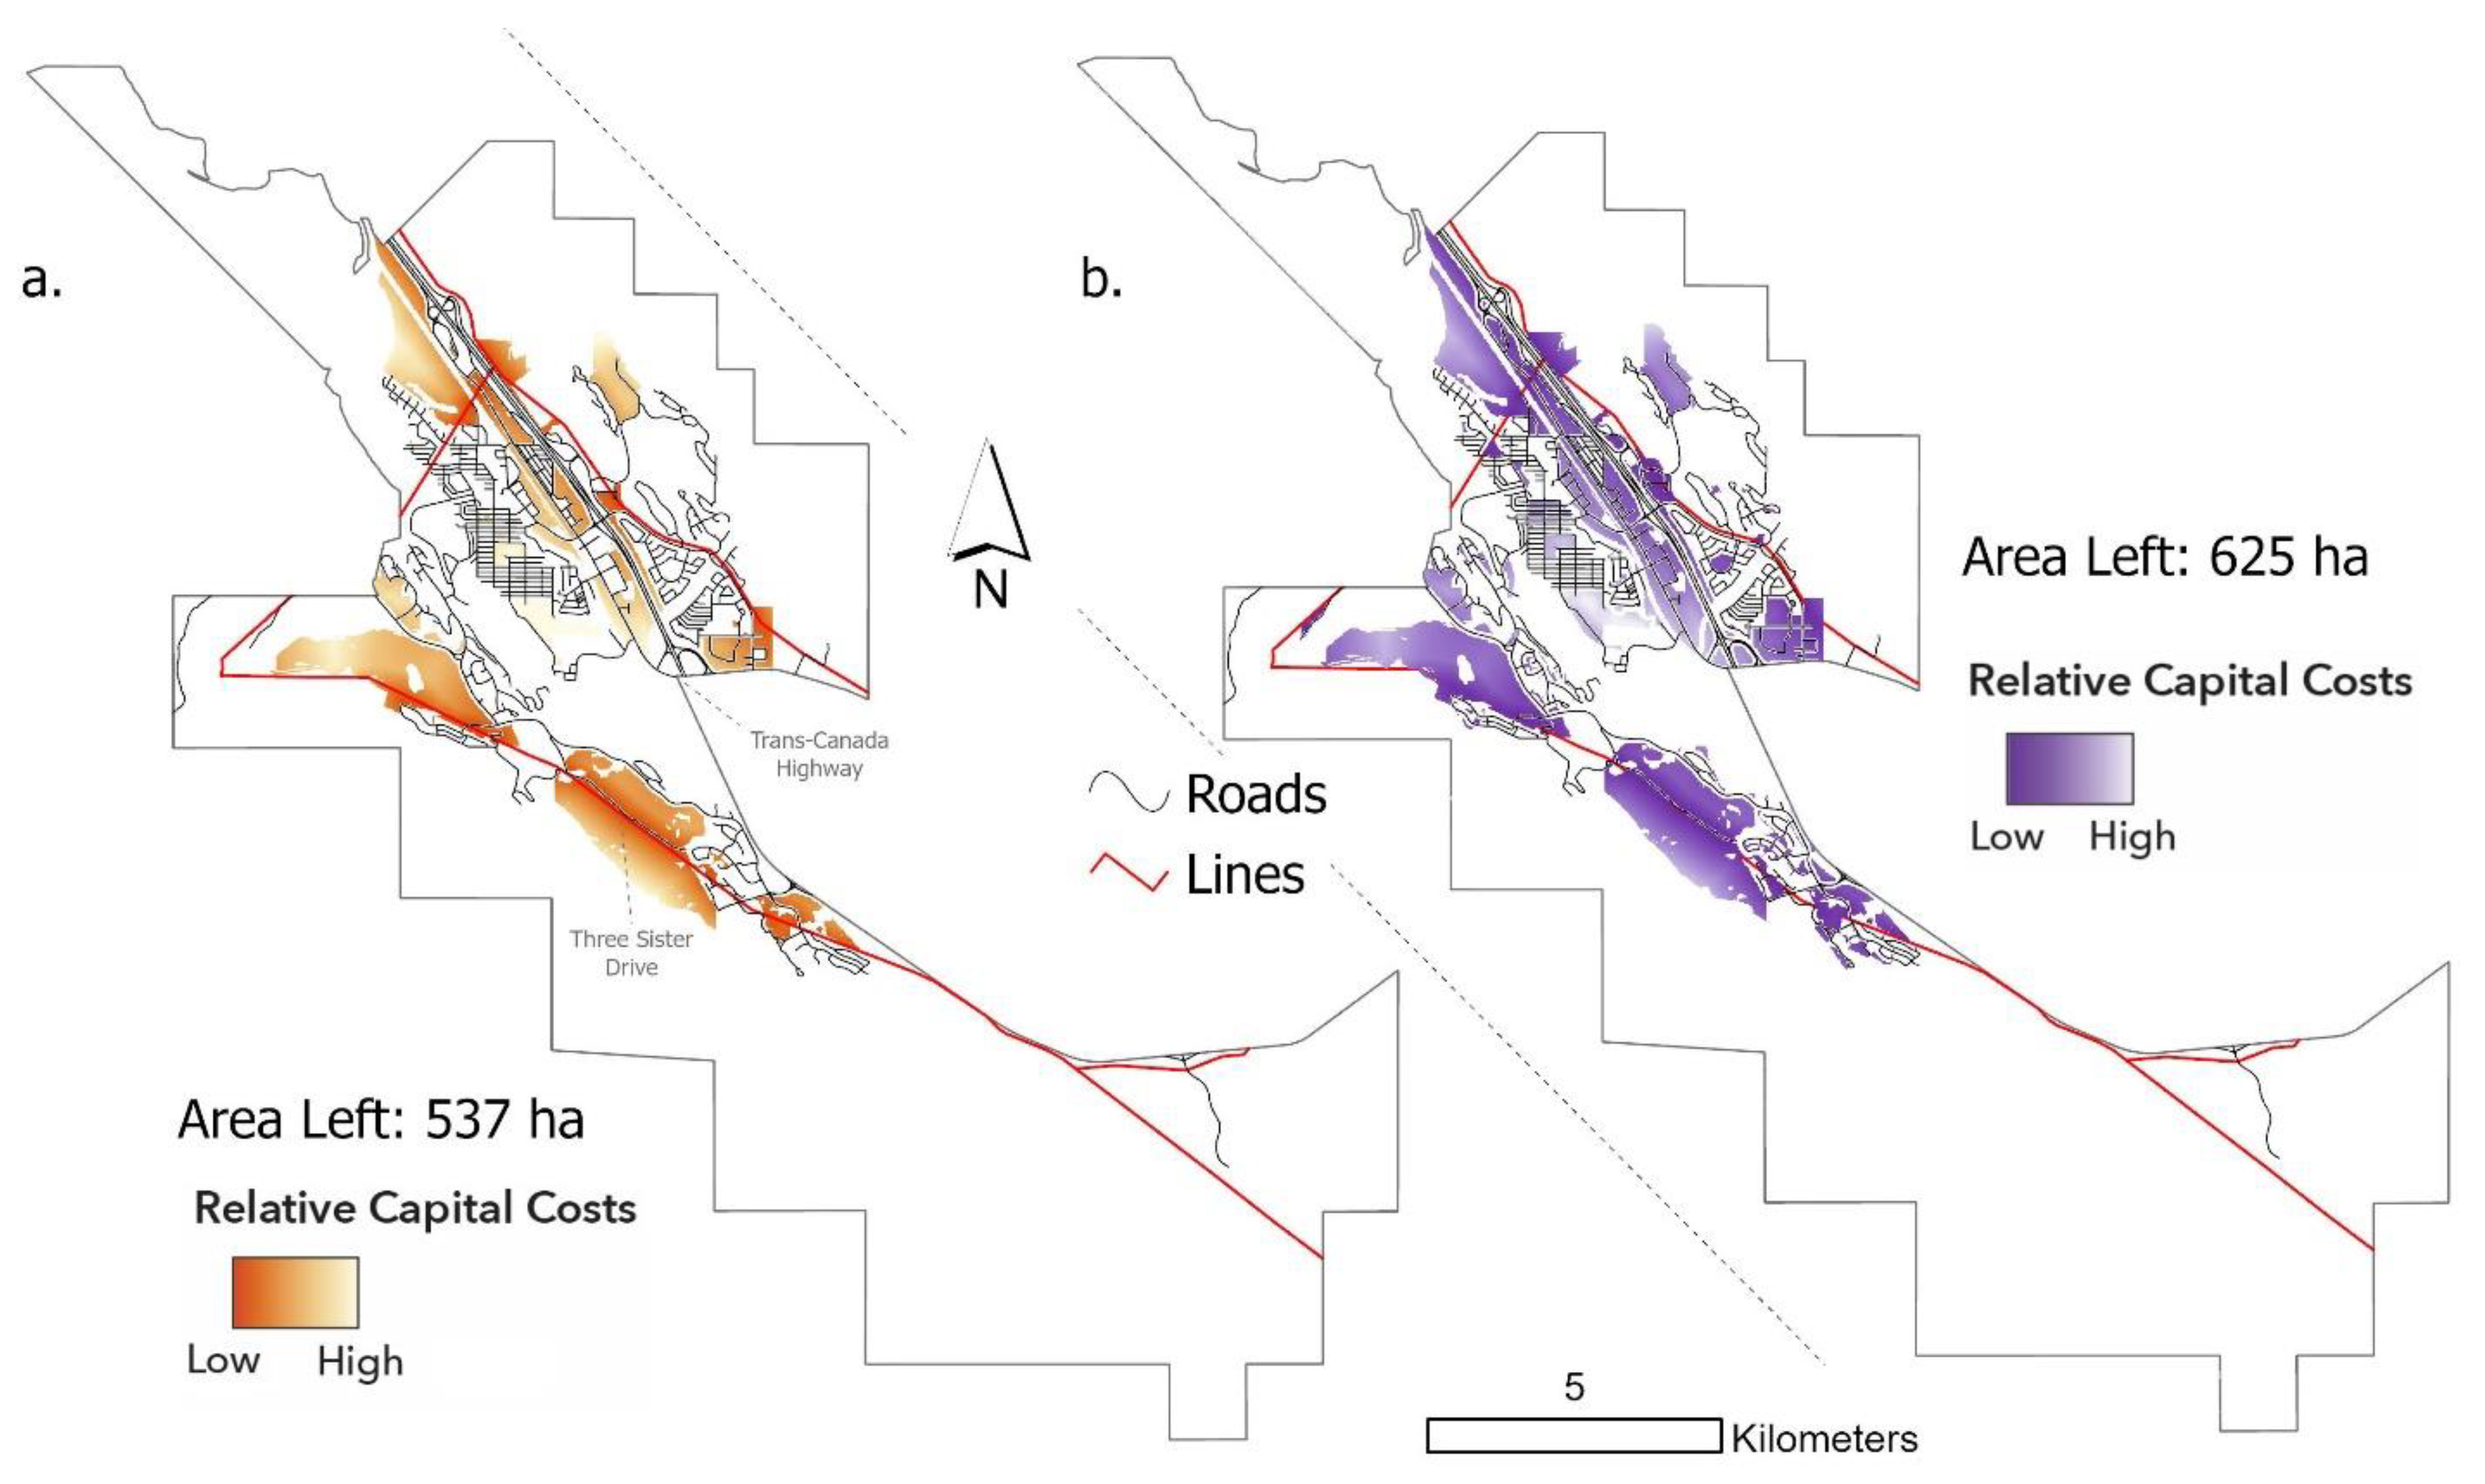
| 4. Economic | Transmission line cost | 10 m | AESO [60] | ||
| Road cost | Alberta Municipal Affairs [59] | ||||
| Scenarios | Solar Energy | Wind Energy | |||
|---|---|---|---|---|---|
| Excluding Wildlife Corridor | Excluding Steep Creek Hazard zones | Setback Distance | |||
| 500 m | 750 m | ||||
| Including | Habitat patches | 1. Only excludes the wildlife corridor that overlapped with legally accessible lands | 2. Steep creek hazard zones are extracted from scenario 1 | 1. Excludes lands within 500 m of noise receptors (residential zones) | 2. Excludes lands within 750 m of noise receptors (residential zones) |
| Excluding | 3. Habitat patches within Canmore boundary would be excluded + scenario 1 | 4. Both habitat patches and steep creek hazard zones are excluded. | 3. Excludes habitat patches + scenario 1 | 4. Excludes habitat patches + scenario 2 | |
| Population | Population Increase Rate | Per Capita Consumption | Population Projection | Total Electricity Demands (MWh) | ||
| 2000 | 10,517 | 33% | 9166 kWh (2008) | |||
| 2016 | 13,992 | |||||
| 2050 | >25,000 | 230,000 | ||||
| Required Lands (ha) | Yearly Production (MWh) | Semi-Permissive Lands (ha) | Maximum | |||
| Original | Recoverable | Yearly Production (MWh) | Total Capacity (MW) | |||
| A 2.5 MW wind turbine | 25–100 | ~6000 | 649 | 625 | 36,000–150,000 | 15–225 |
| A 1 MW solar farm | 4 | 1300–1600 | 559 | 537 | 174,000–215,000 | 134 |
© 2020 by the authors. Licensee MDPI, Basel, Switzerland. This article is an open access article distributed under the terms and conditions of the Creative Commons Attribution (CC BY) license (http://creativecommons.org/licenses/by/4.0/).
Share and Cite
Guo, J.; Fast, V.; Teri, P.; Calvert, K. Integrating Land-Use and Renewable Energy Planning Decisions: A Technical Mapping Guide for Local Government. ISPRS Int. J. Geo-Inf. 2020, 9, 324. https://0-doi-org.brum.beds.ac.uk/10.3390/ijgi9050324
Guo J, Fast V, Teri P, Calvert K. Integrating Land-Use and Renewable Energy Planning Decisions: A Technical Mapping Guide for Local Government. ISPRS International Journal of Geo-Information. 2020; 9(5):324. https://0-doi-org.brum.beds.ac.uk/10.3390/ijgi9050324
Chicago/Turabian StyleGuo, Jiaao, Victoria Fast, Philip Teri, and Kirby Calvert. 2020. "Integrating Land-Use and Renewable Energy Planning Decisions: A Technical Mapping Guide for Local Government" ISPRS International Journal of Geo-Information 9, no. 5: 324. https://0-doi-org.brum.beds.ac.uk/10.3390/ijgi9050324