A GIS-based DRASTIC Model and an Adjusted DRASTIC Model (DRASTICA) for Groundwater Susceptibility Assessment along the China–Pakistan Economic Corridor (CPEC) Route

 ,
,  , ,
, ,  , and
, and 
Abstract
:
1. Introduction
2. Materials and Methods
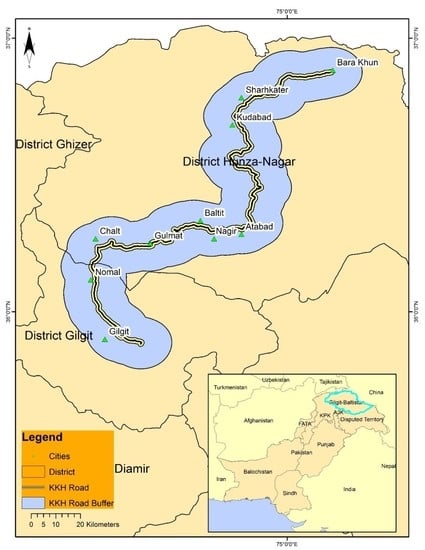
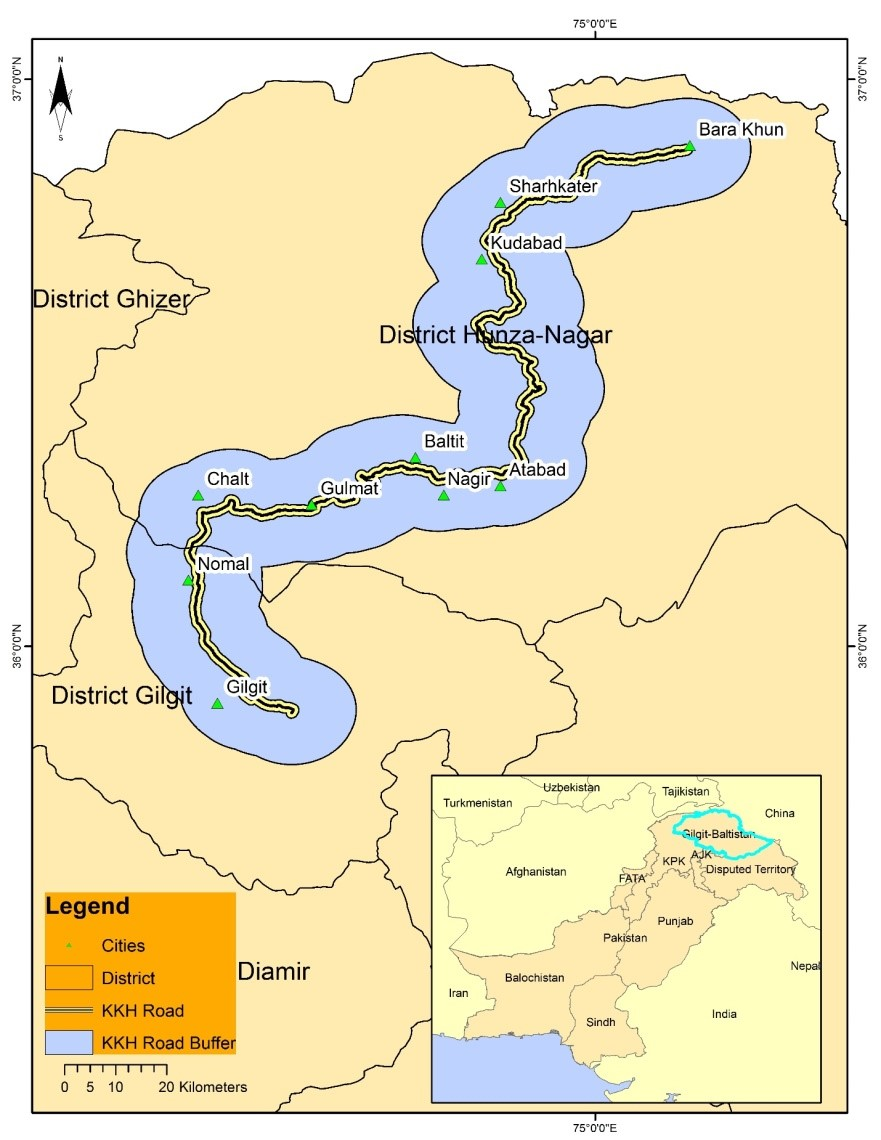
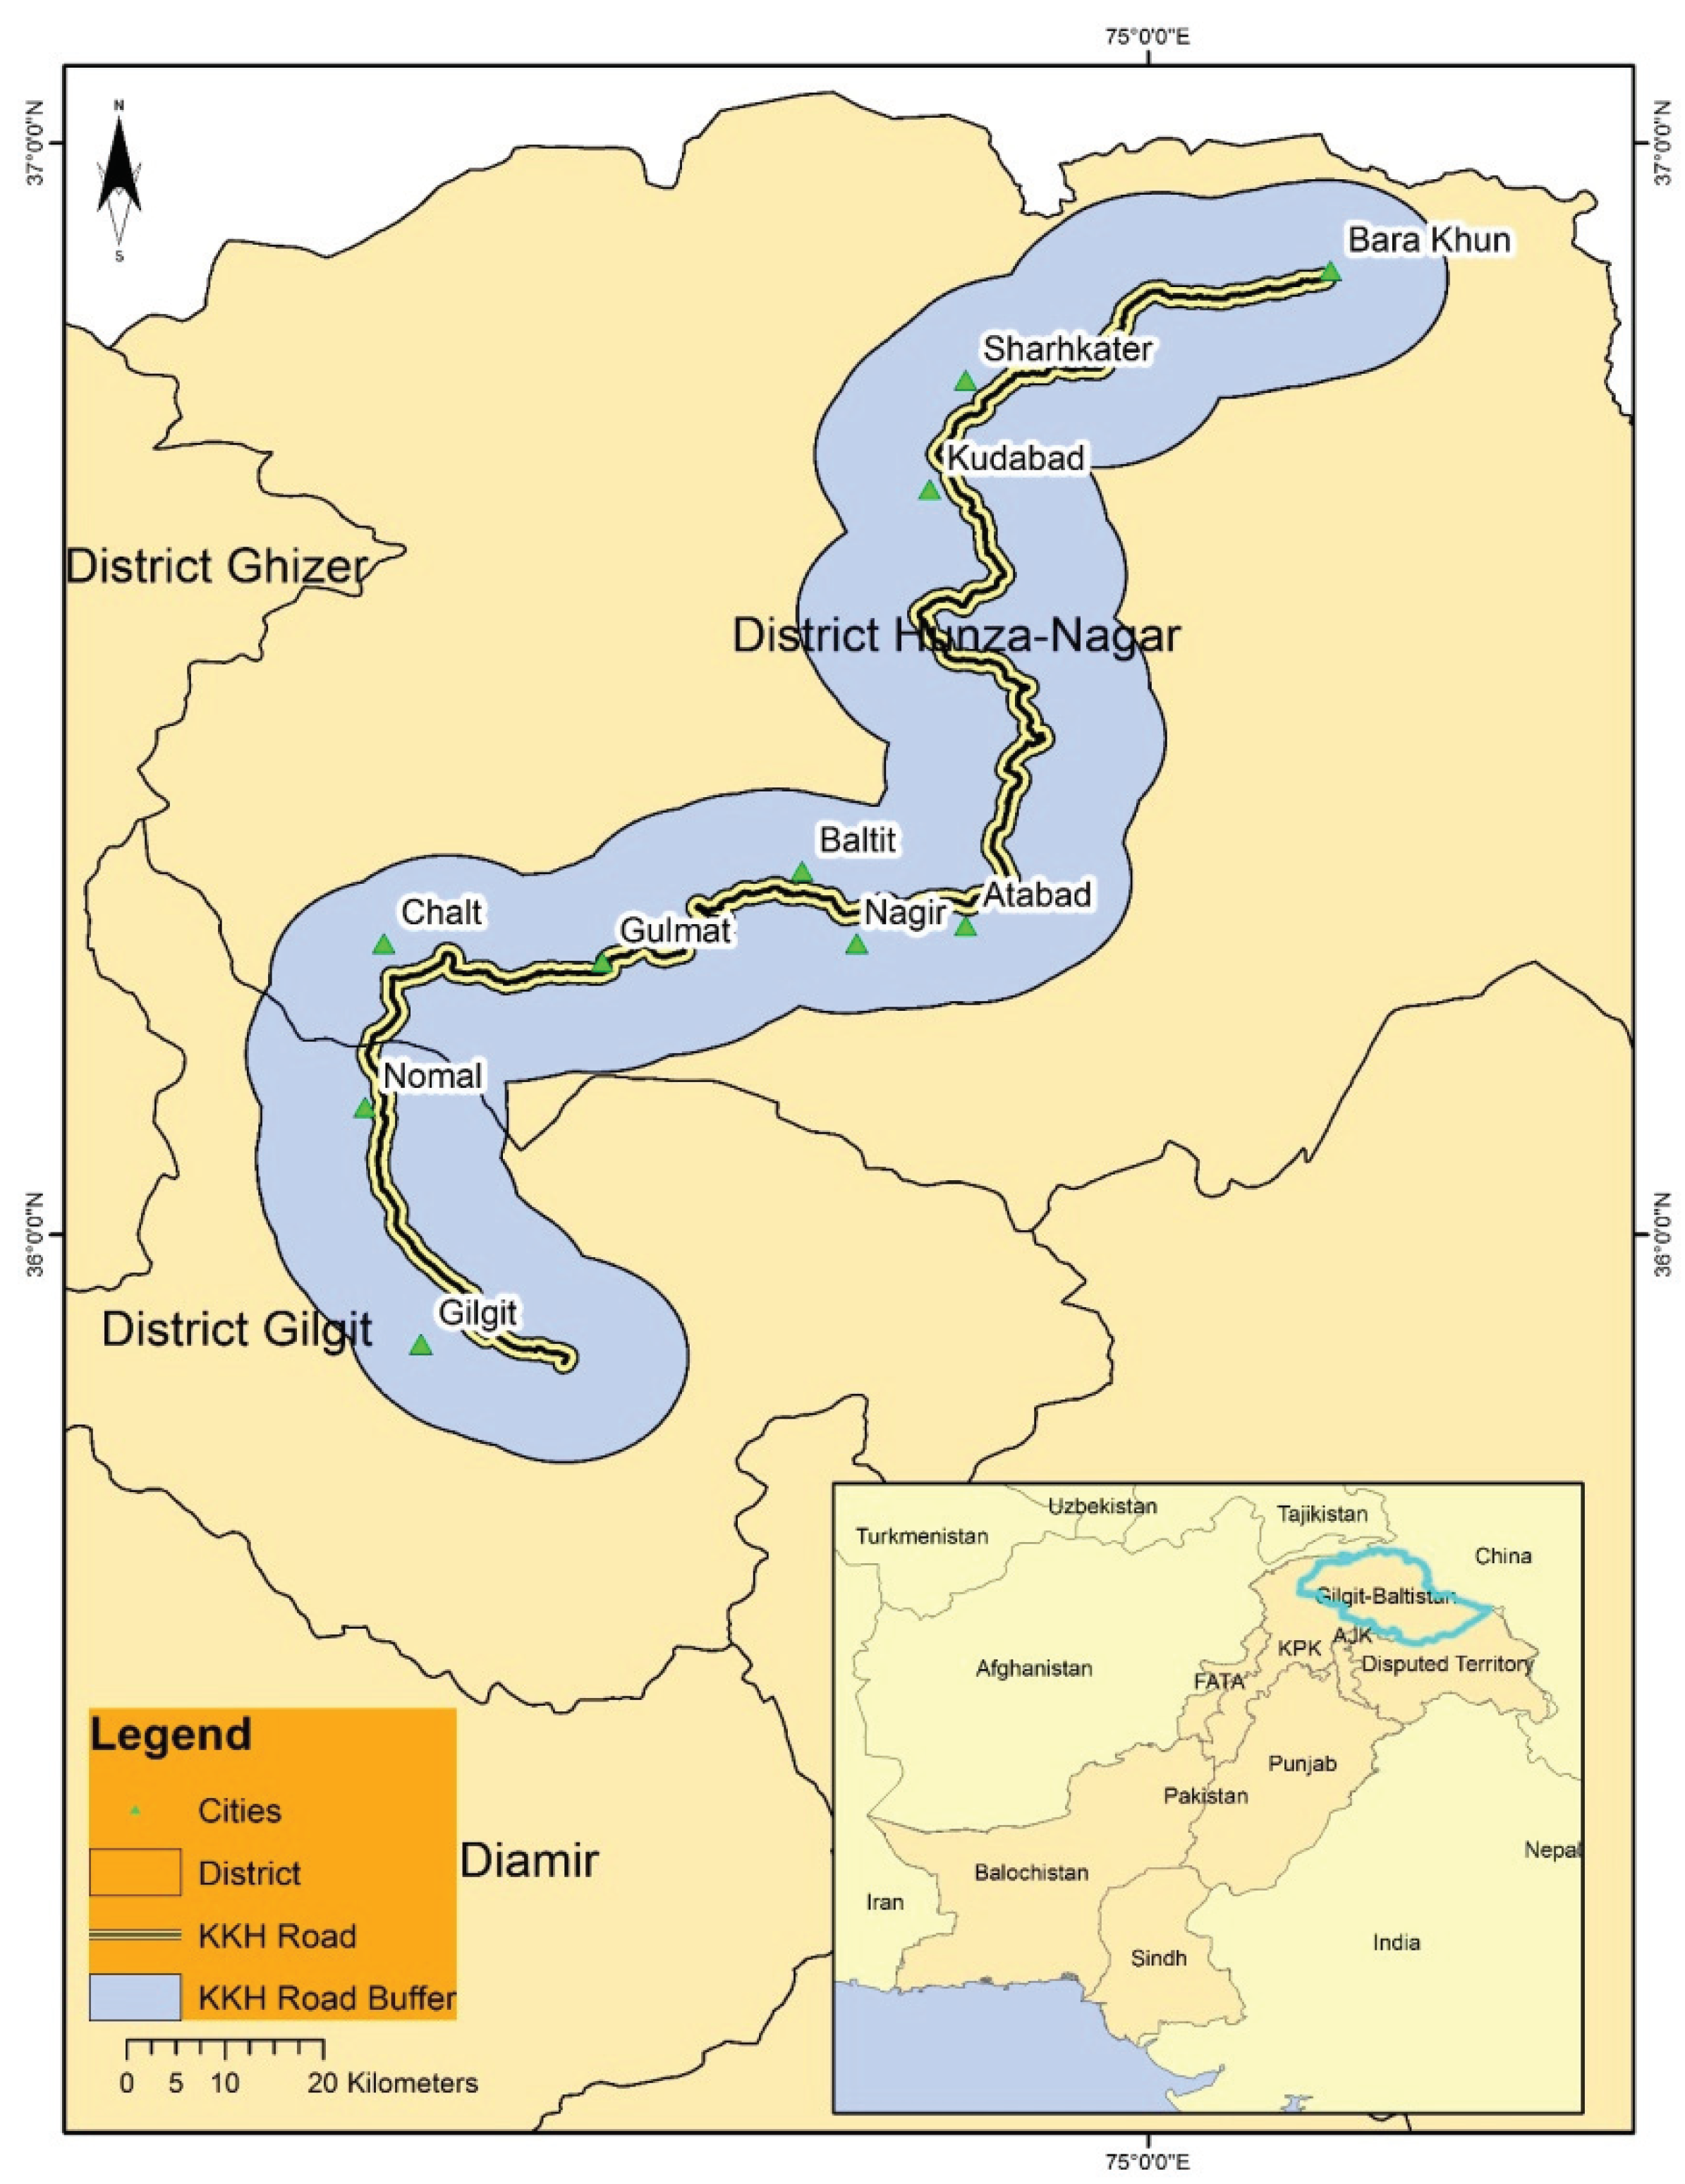
2.1. Study Area
2.2. DRASTIC Model
- r = ratings allocated to each parameter
- w = weights allocated to each parameter
2.3. Background Sources and Preparation of Input Datasets (Methodology)
3. Results
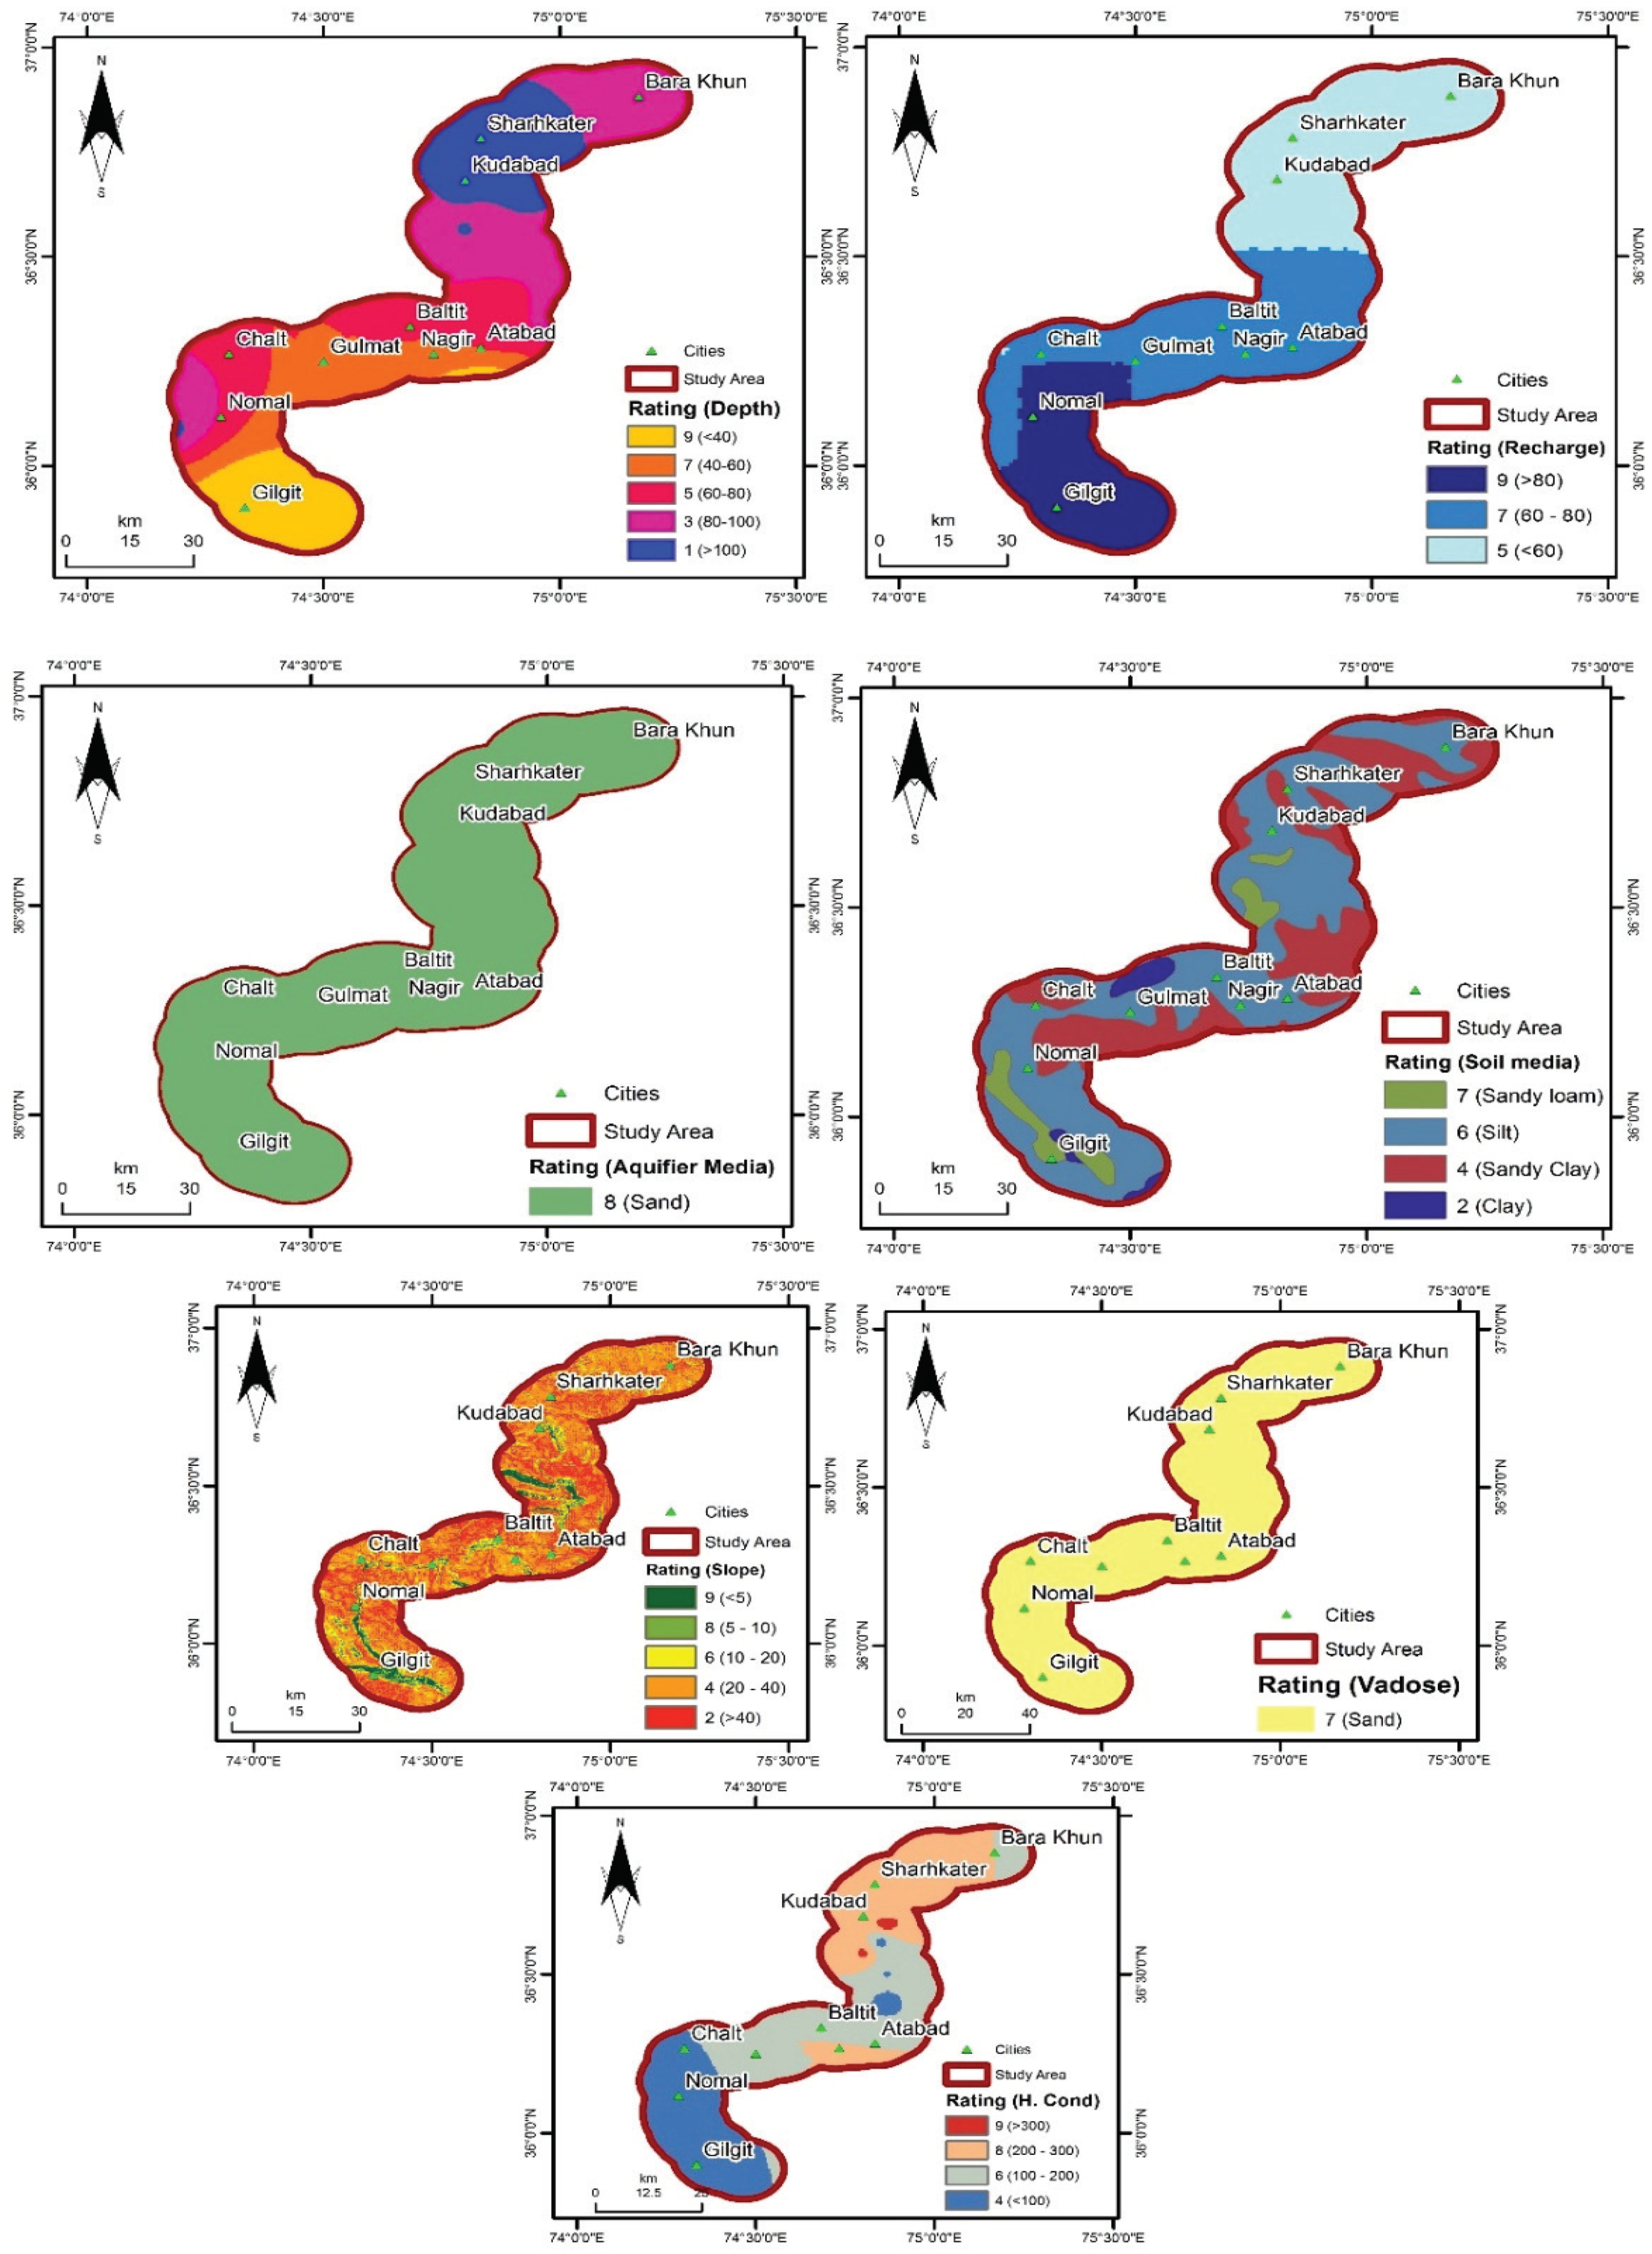
3.1. Thematic Maps of the Parameters
3.1.1. Depth to Water
3.1.2. Net Recharge
3.1.3. Aquifer Media
3.1.4. Soil Media
3.1.5. Topography
3.1.6. The Impact of the Vadose Zone
3.1.7. Hydraulic Conductivity
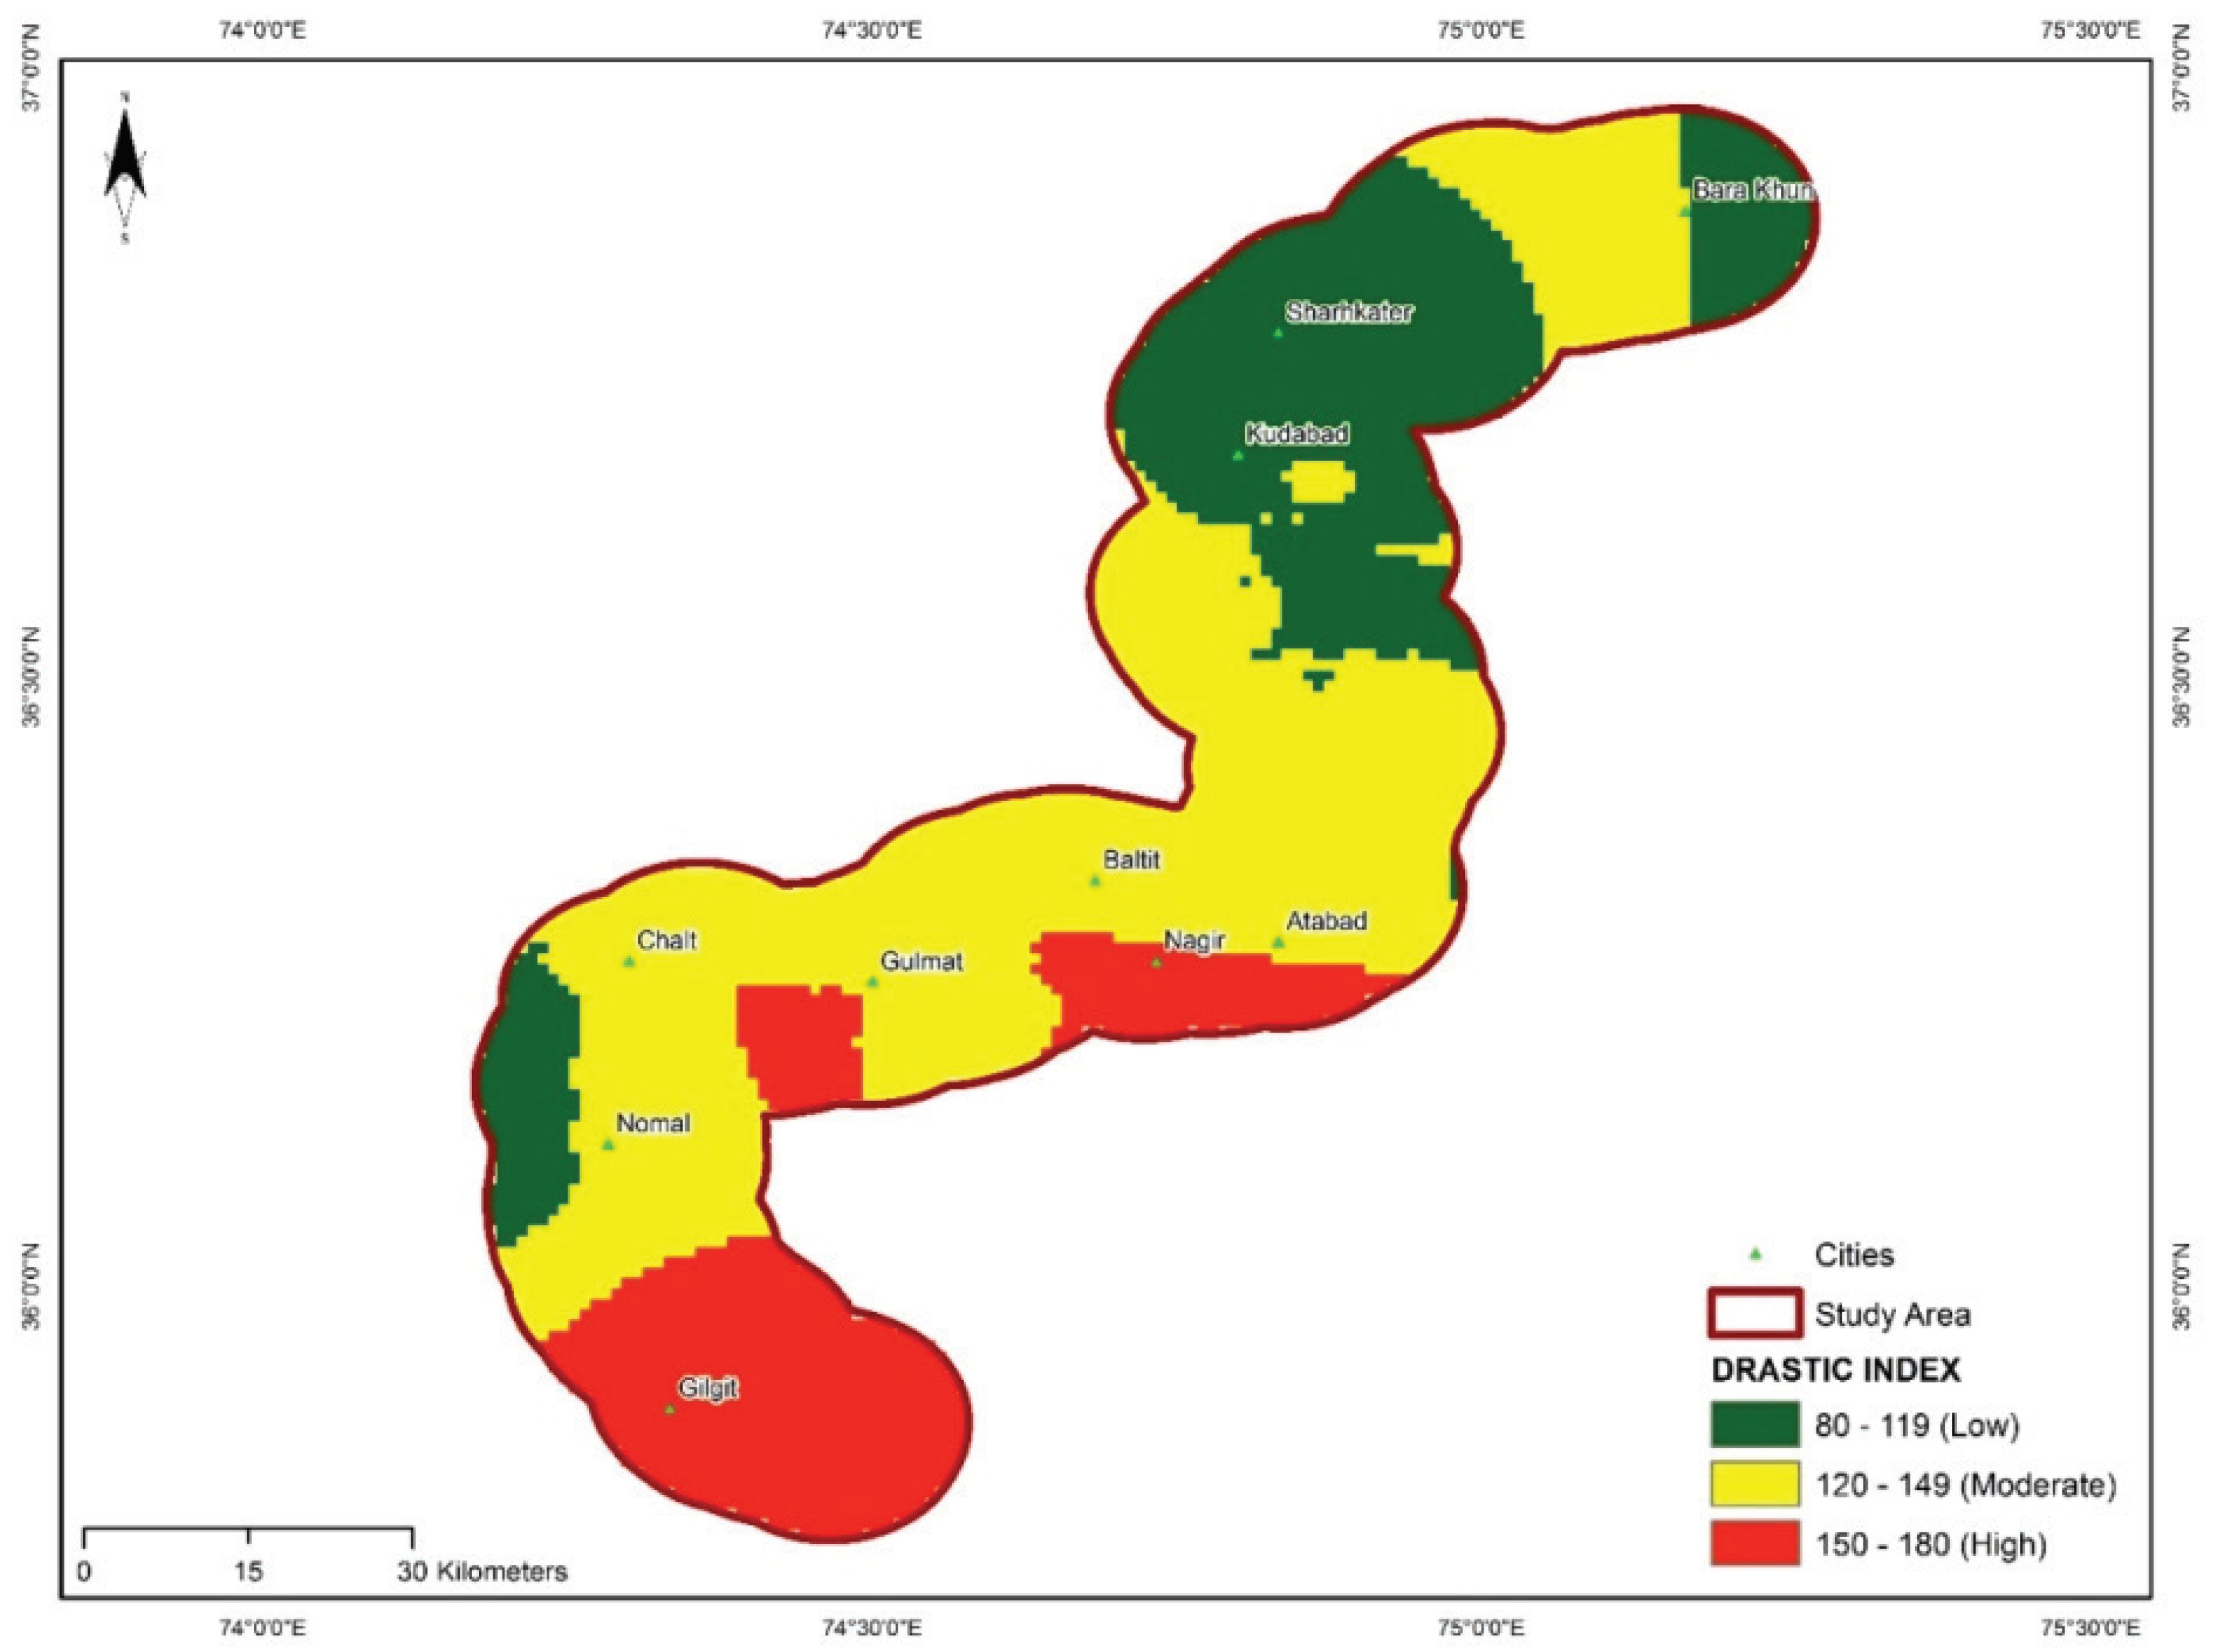
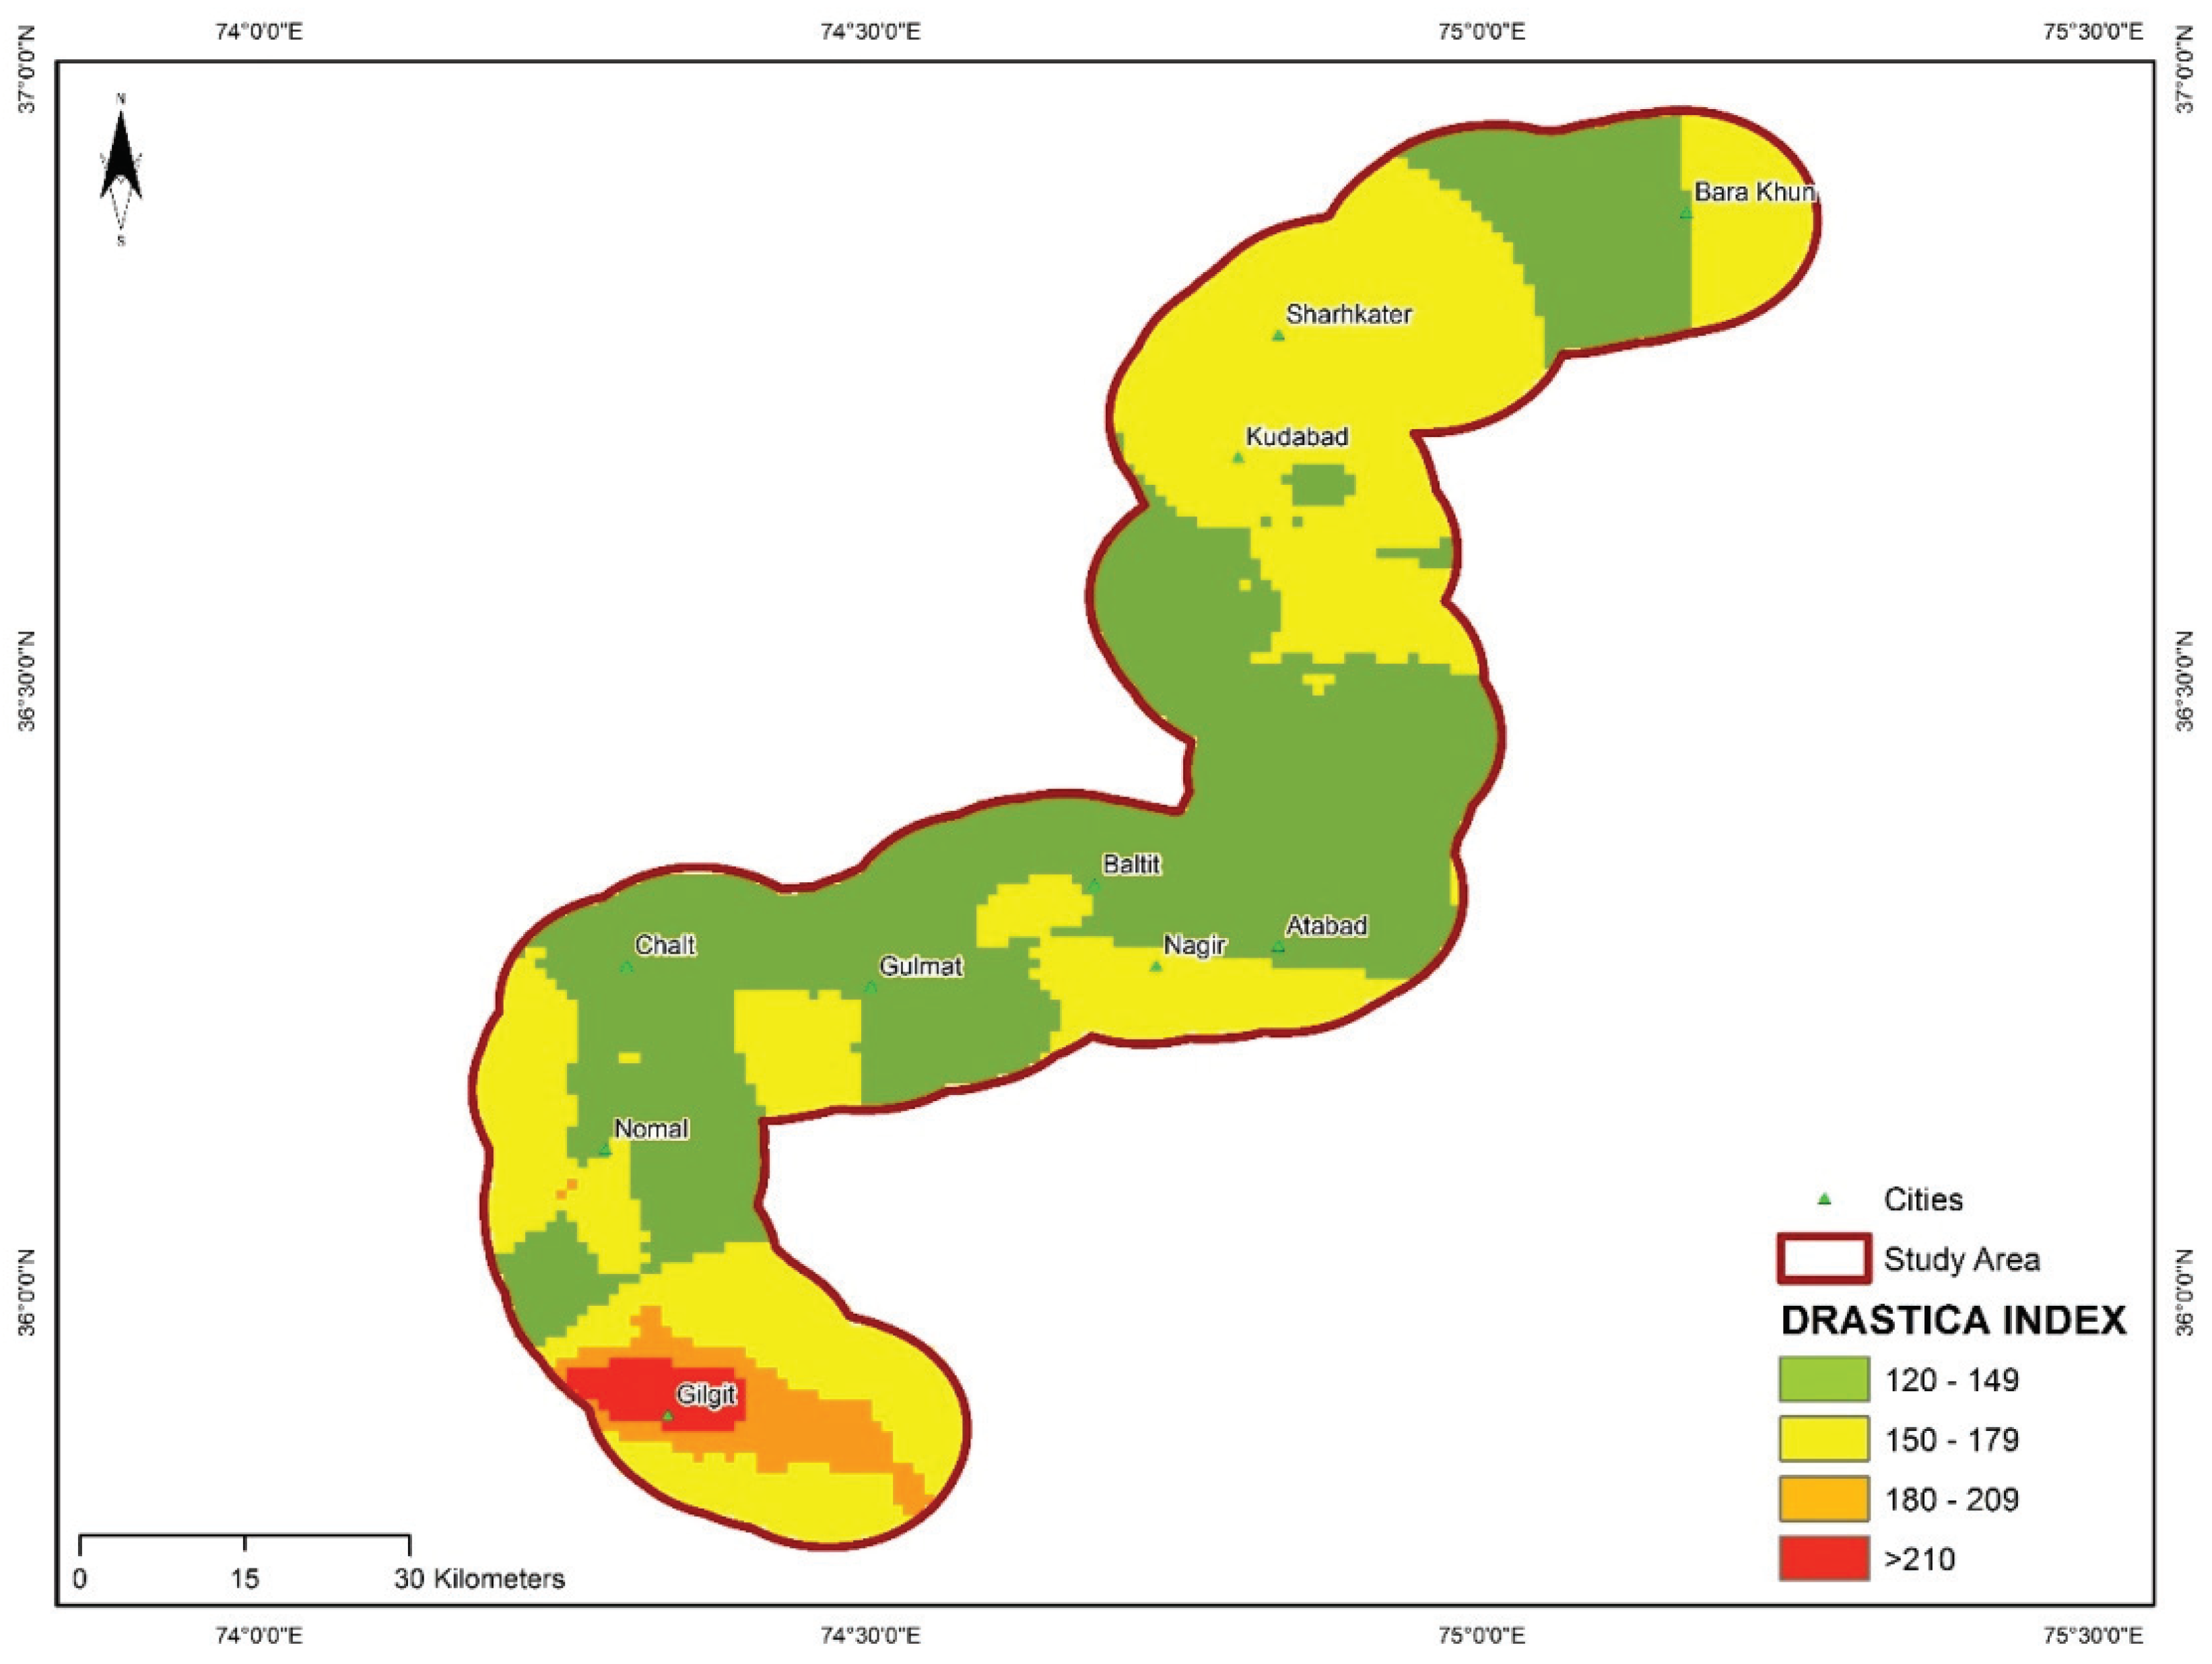
3.2. Preparation of DRASTIC Risk Map
3.3. Confines of the DRASTIC Model and Refinements
3.3.1. Formulation of an Anthropogenic Impact Map
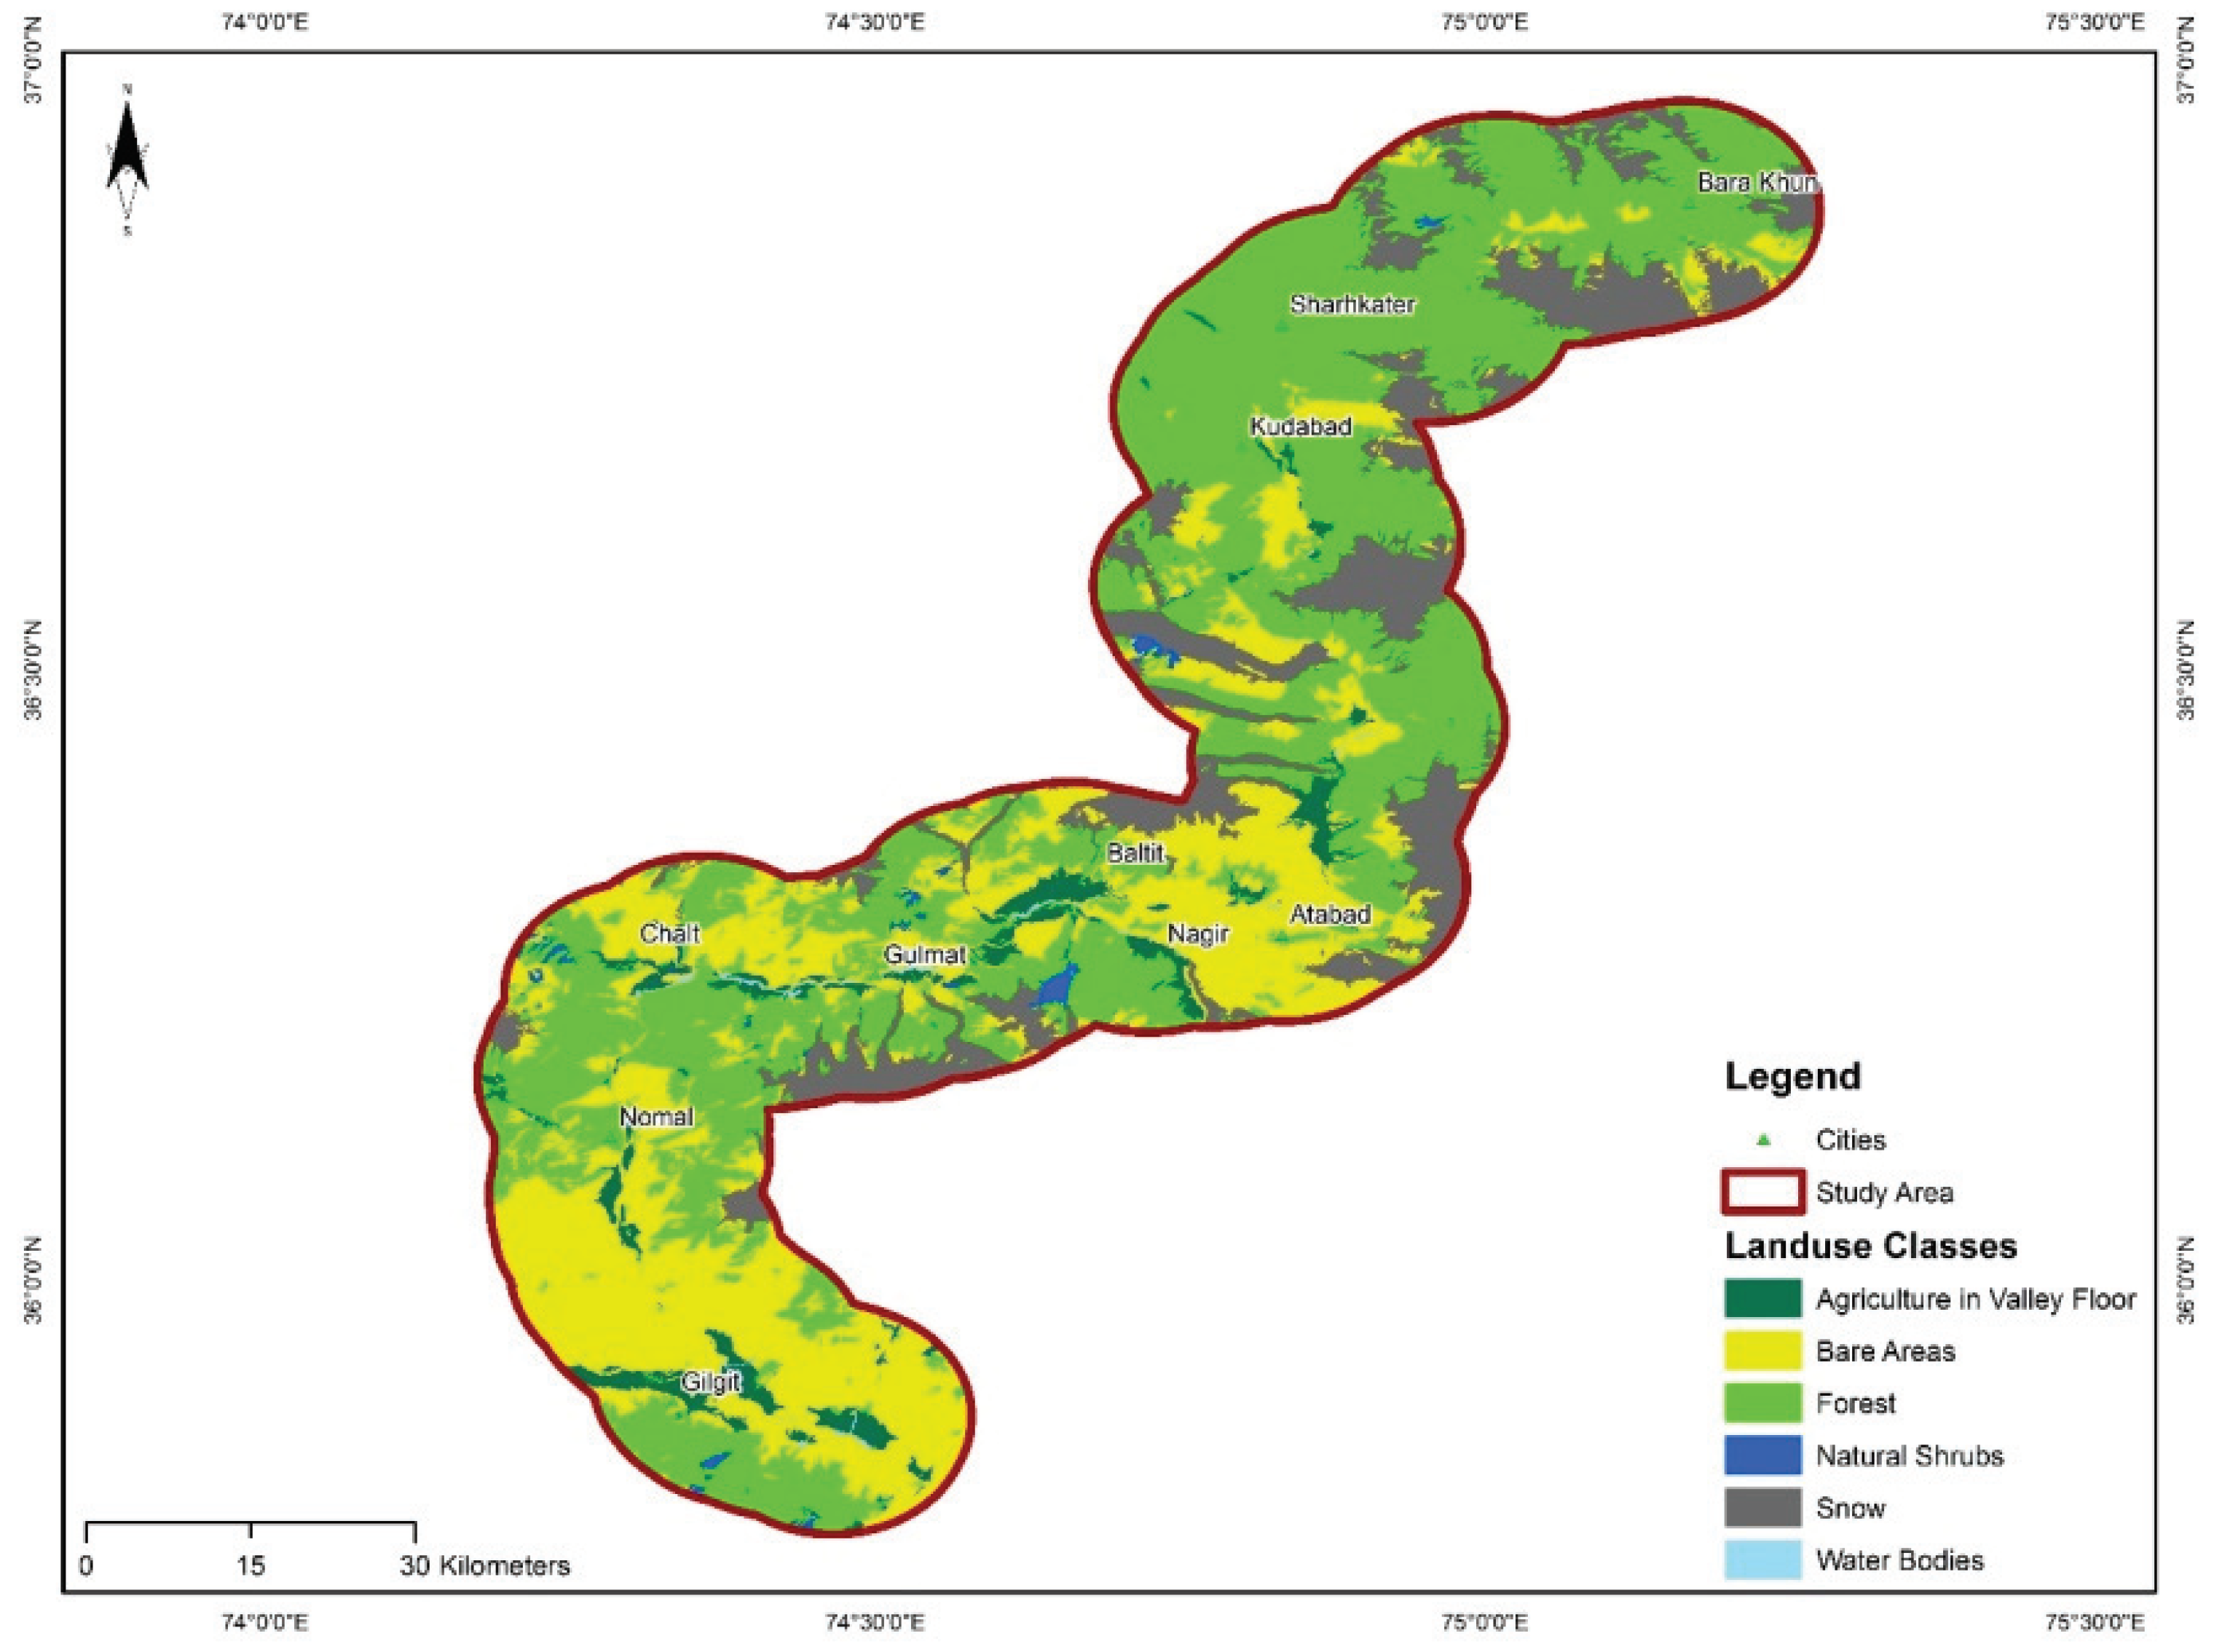
Land Use
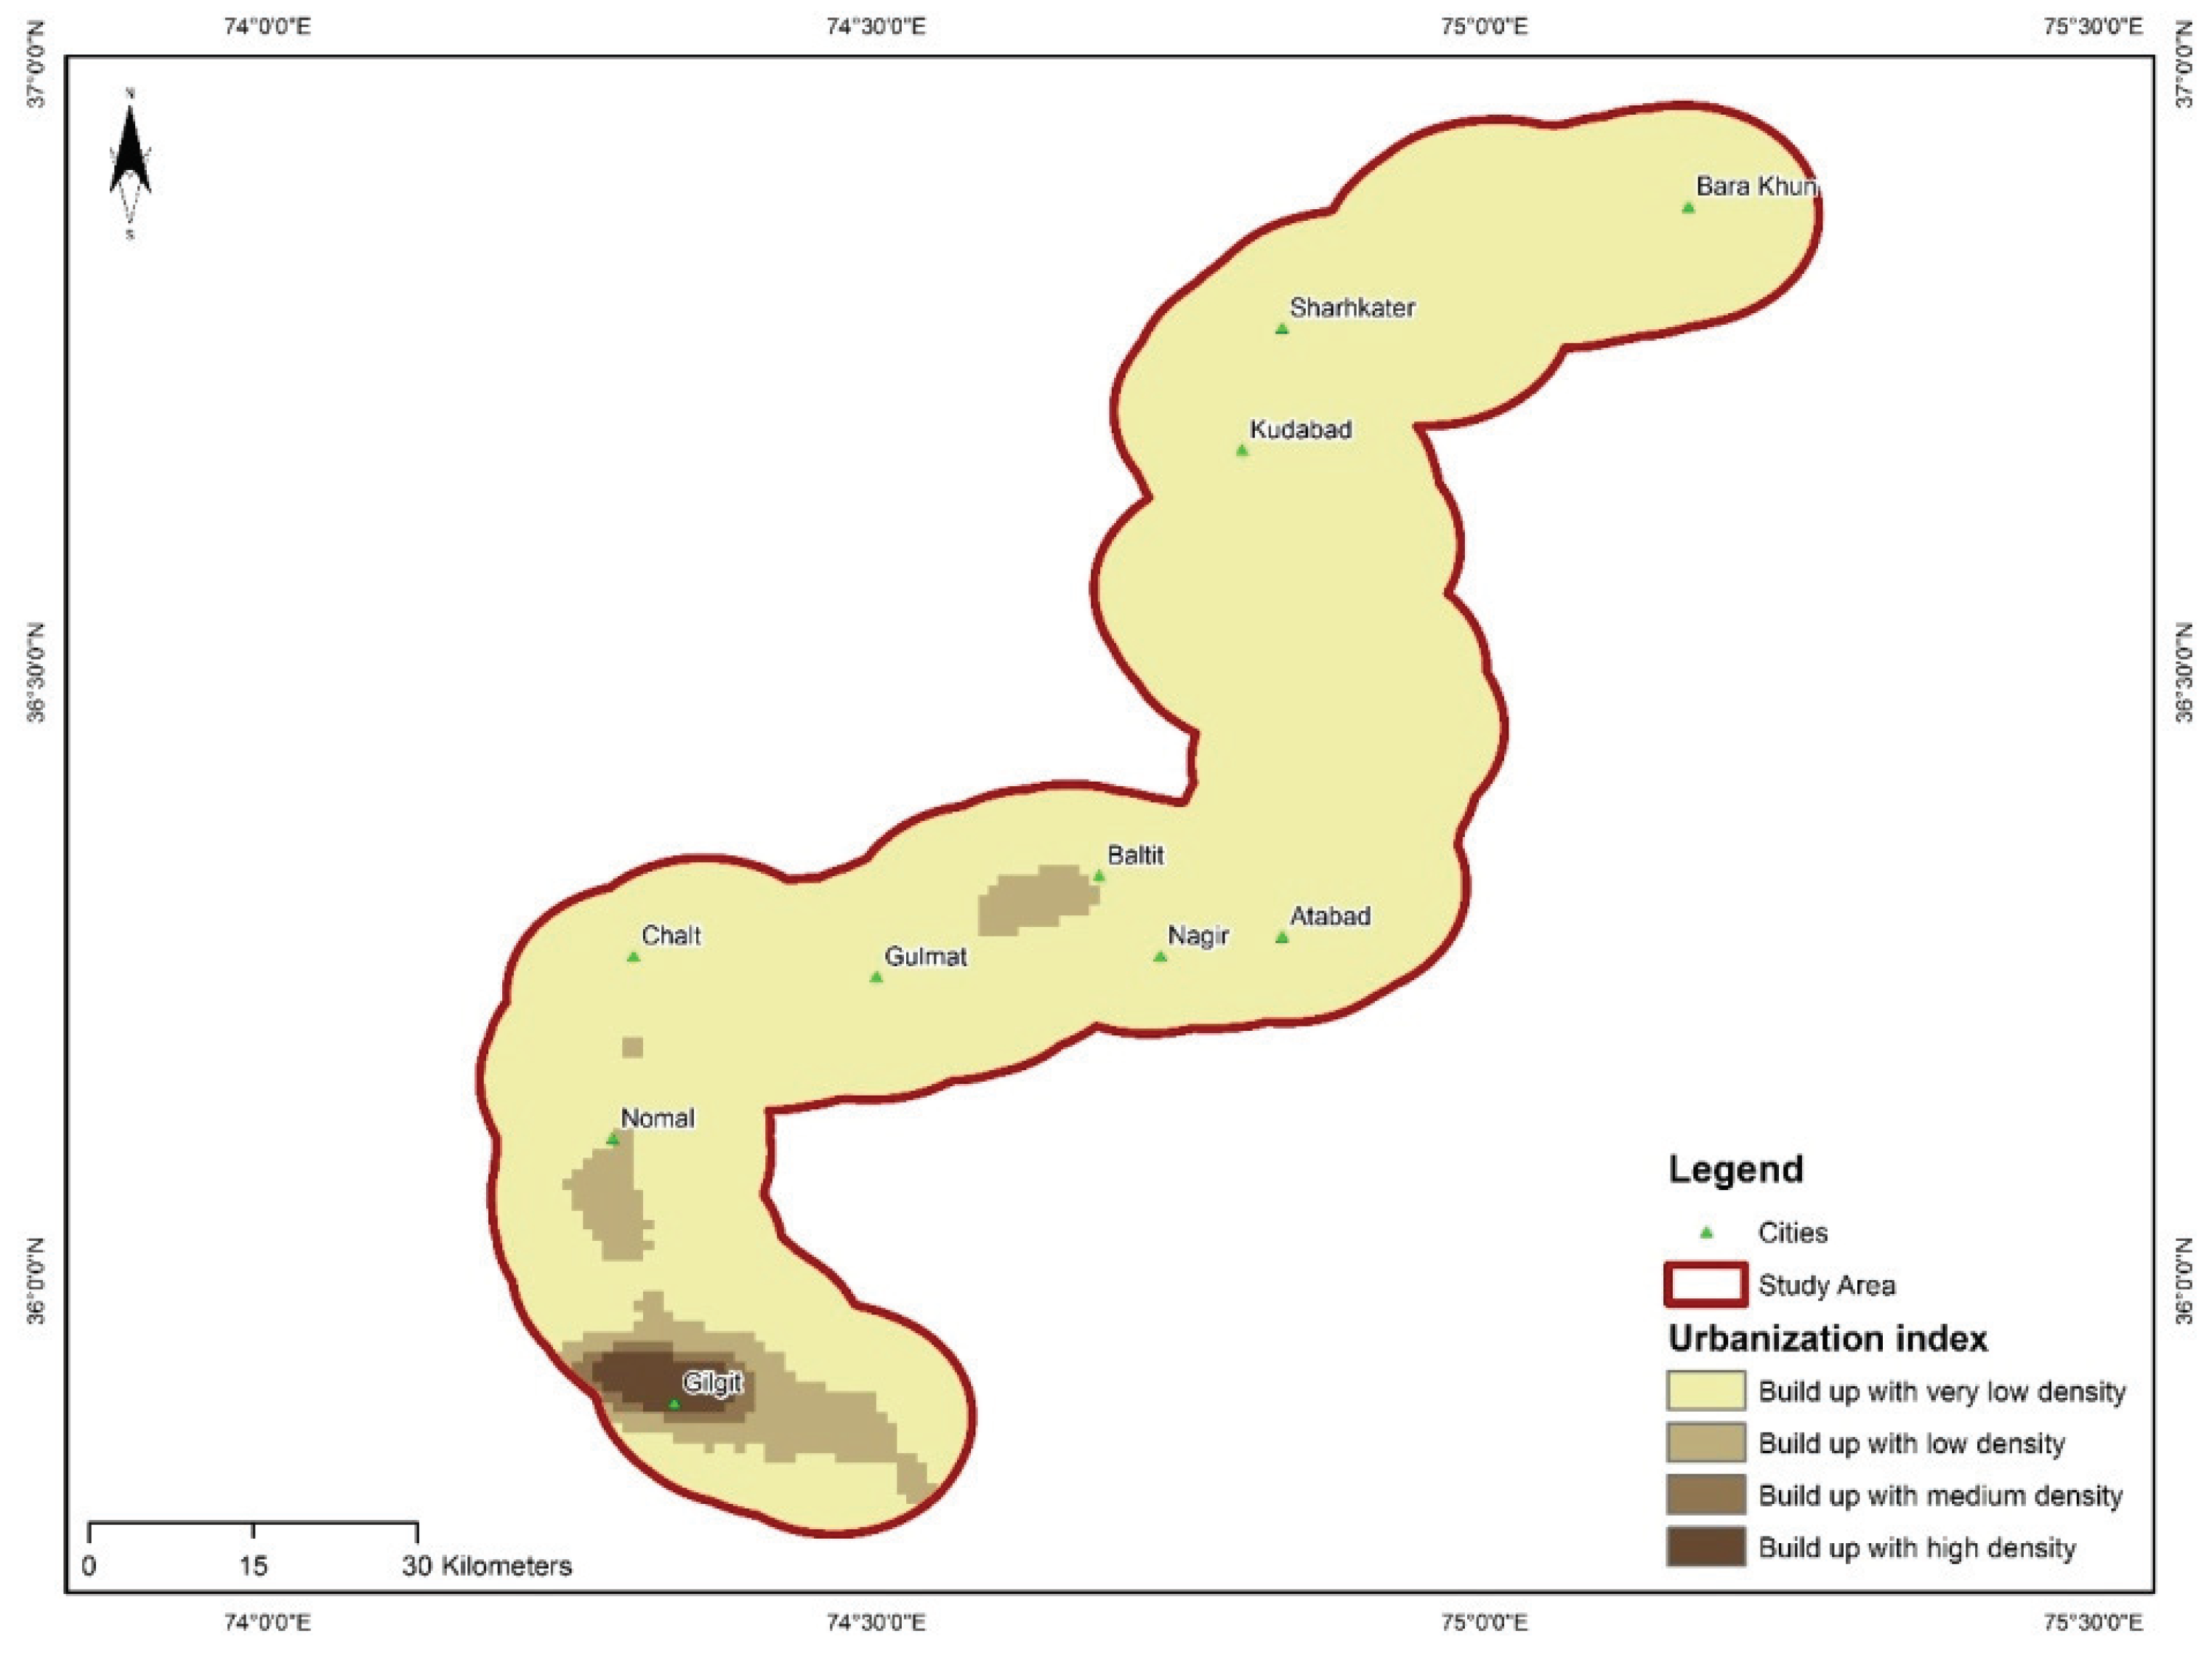
Urbanization Index
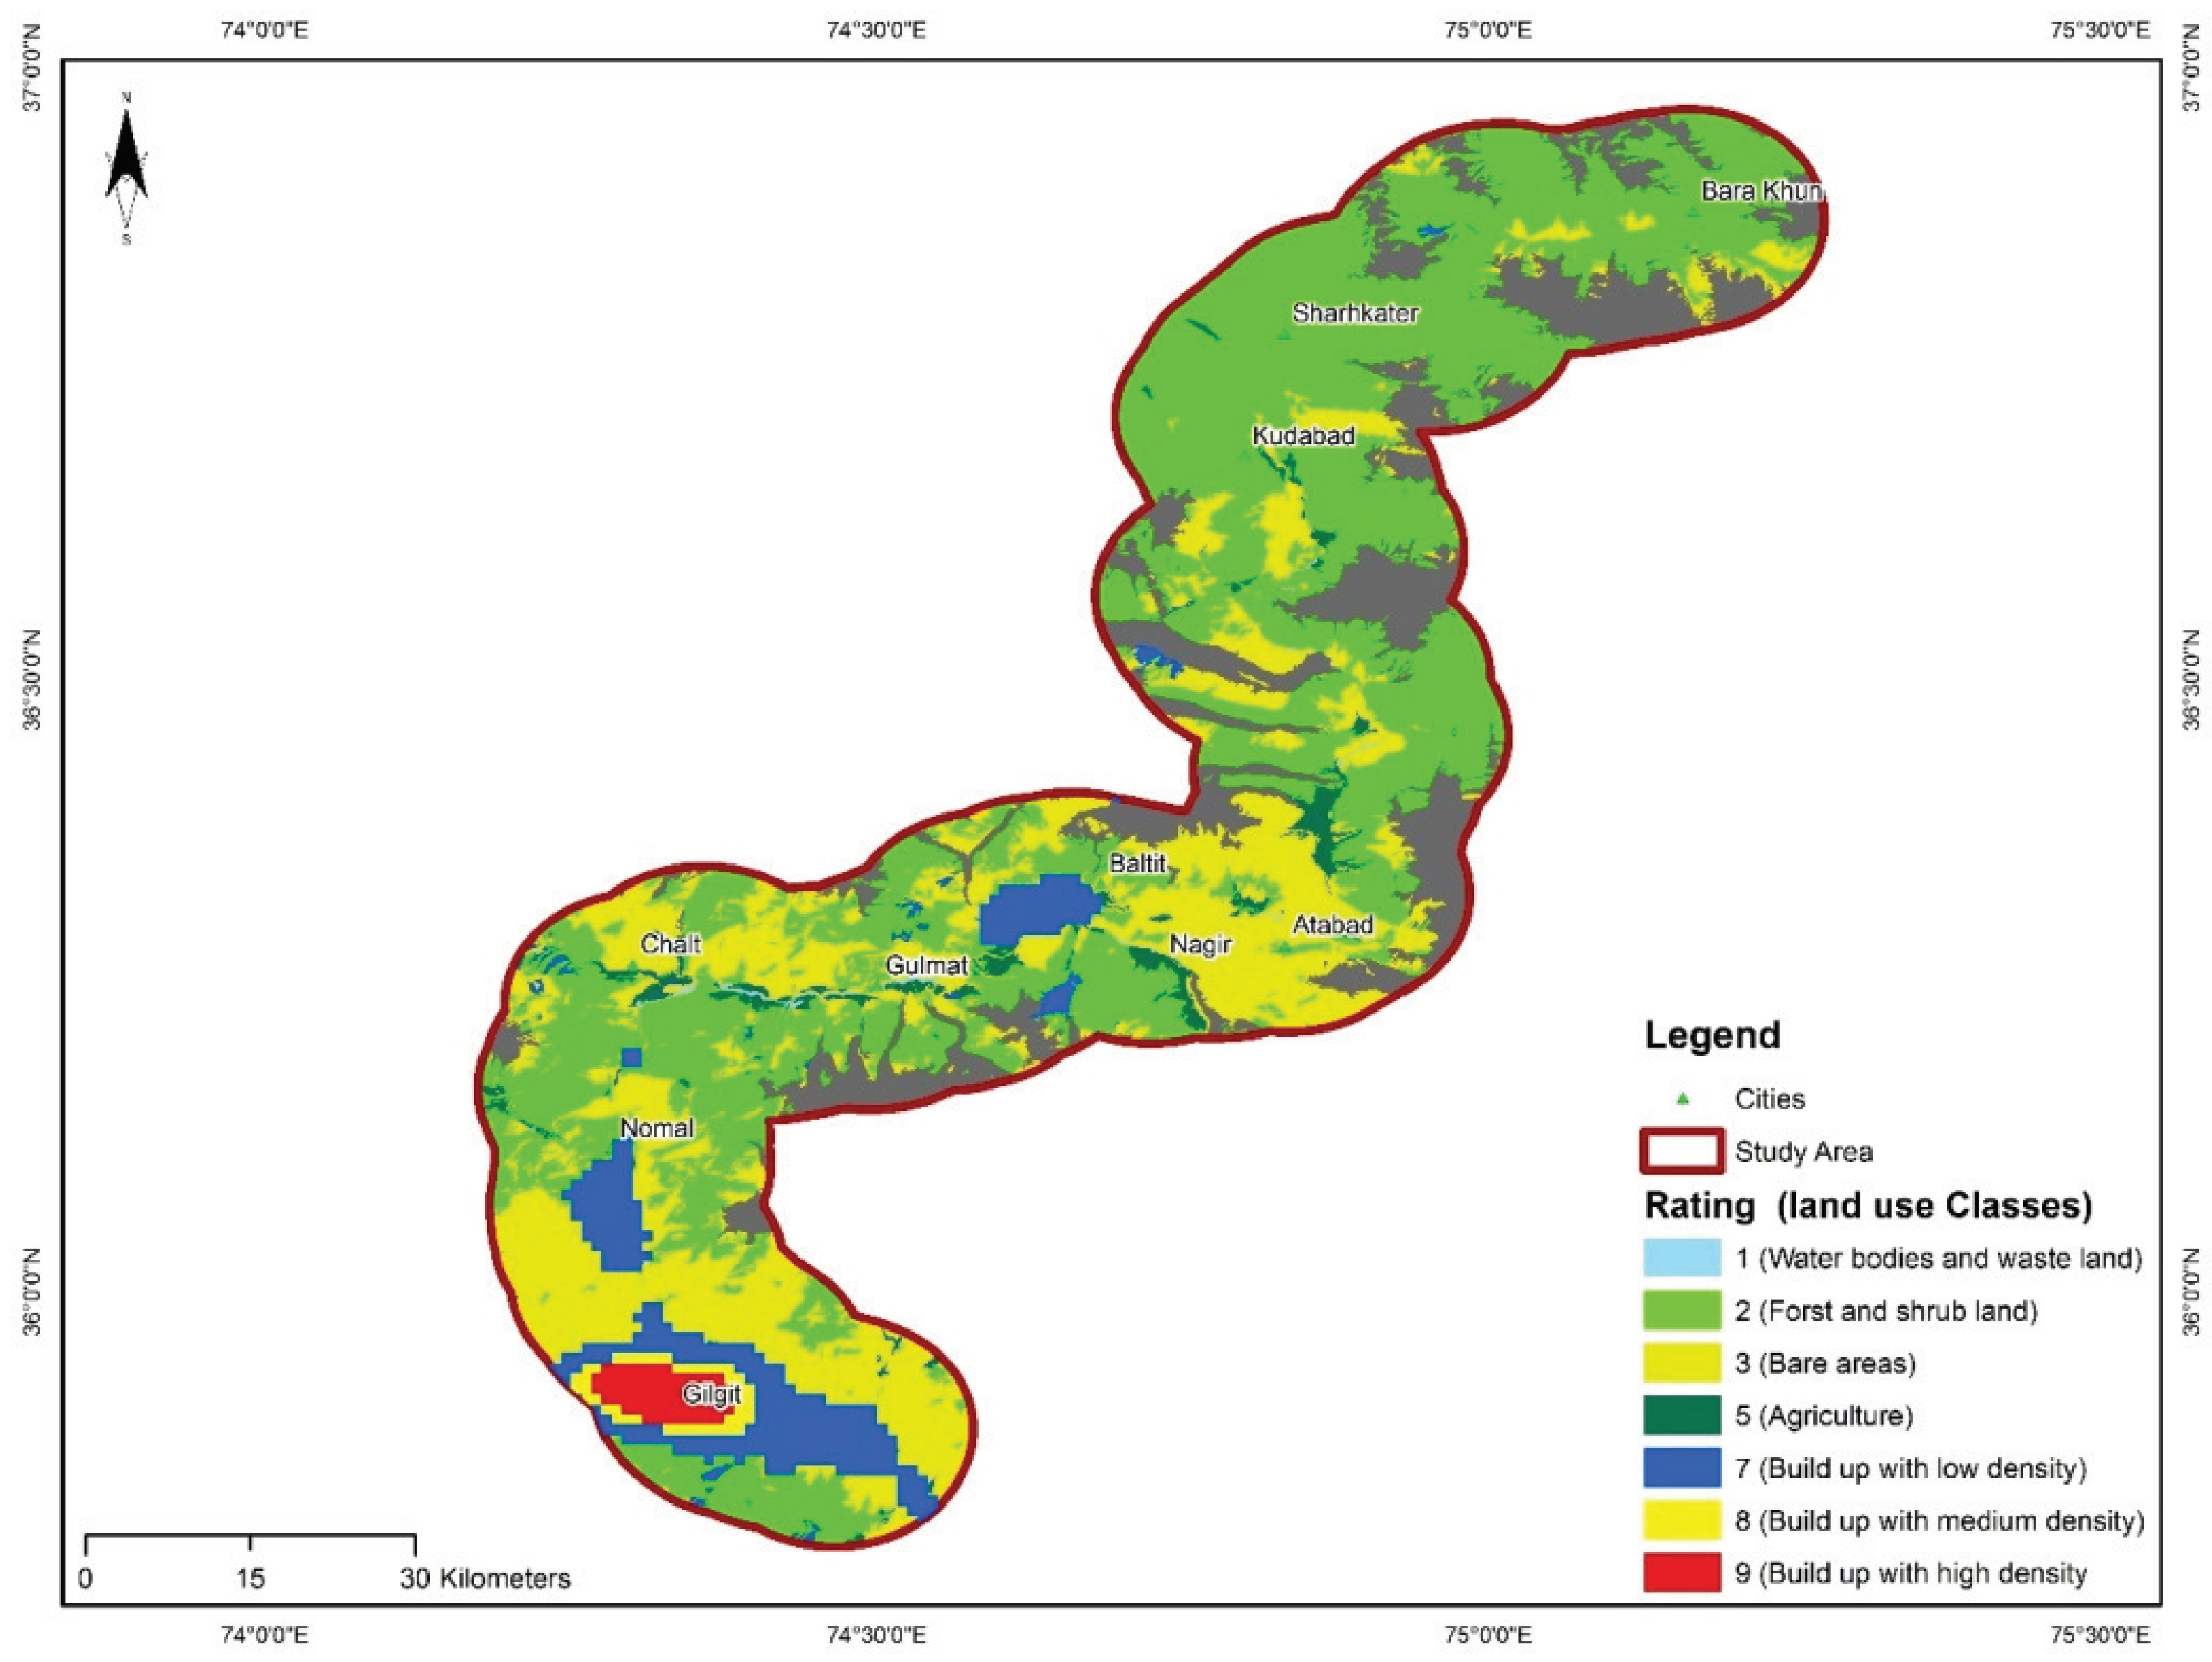
3.3.2. Formulation of an Anthropogenic Impact Map
- Ar = rate of the anthropogenic impact parameter
- Aw = weight of the anthropogenic impact parameter
4. Discussion
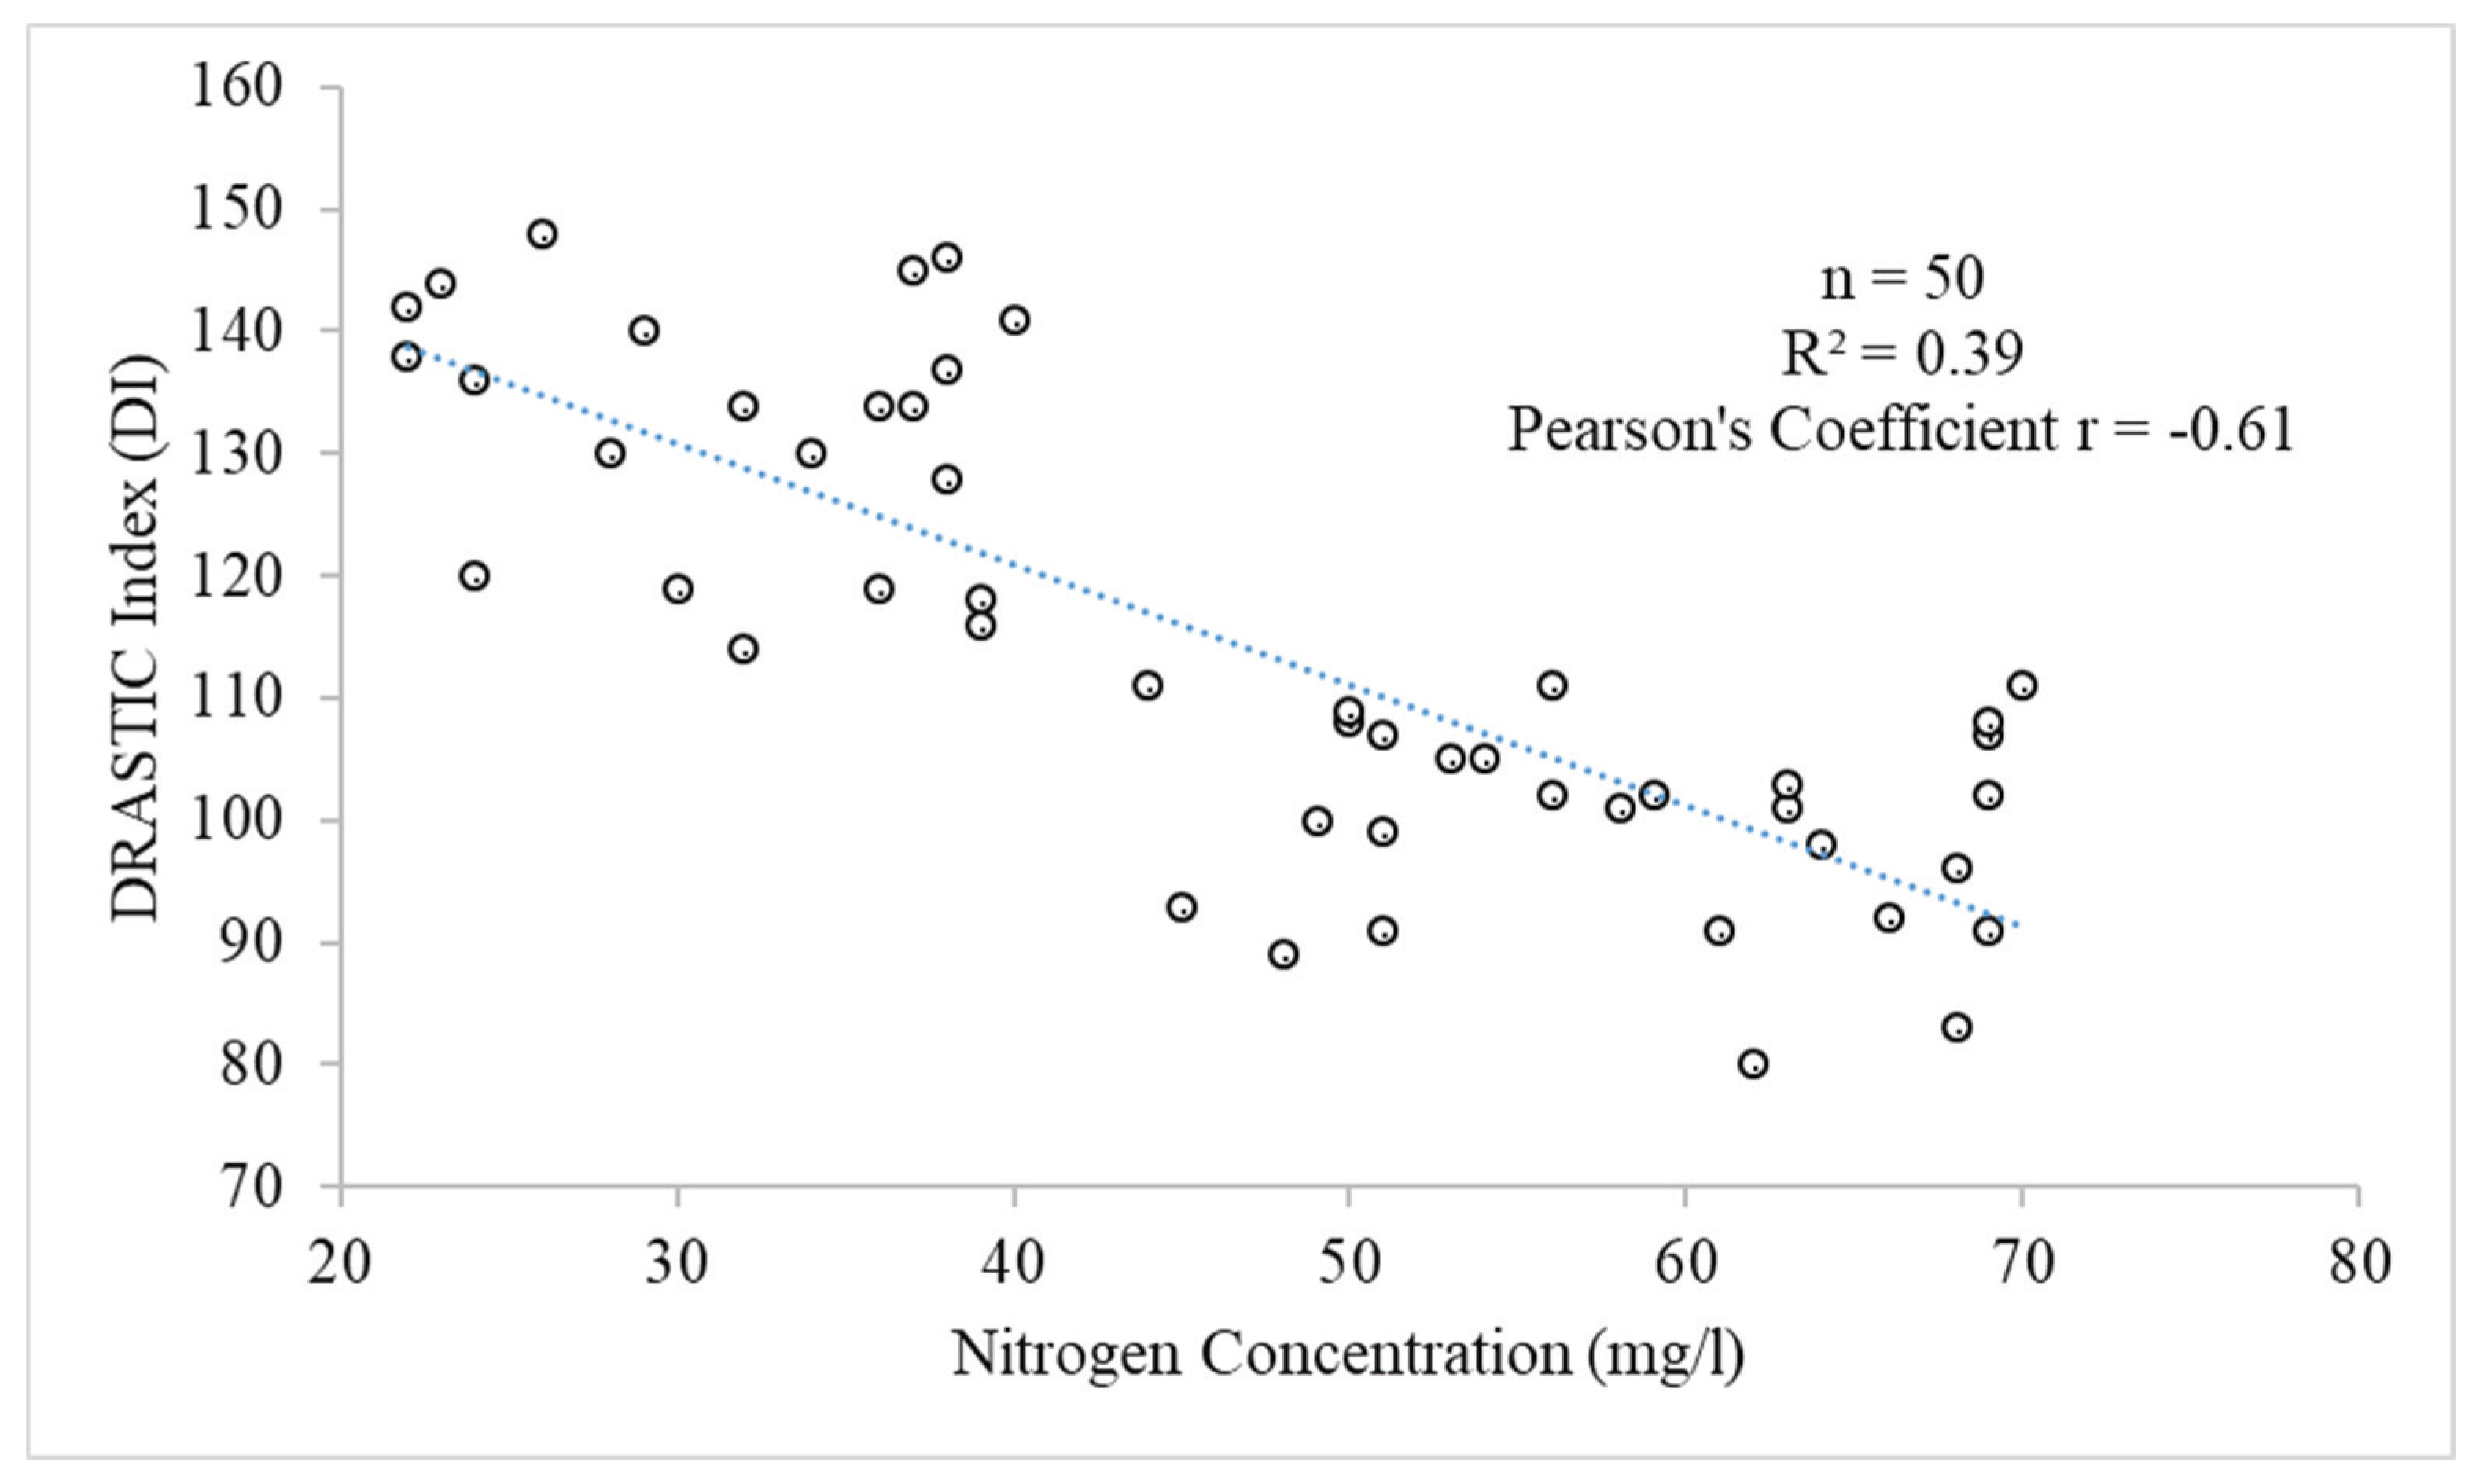
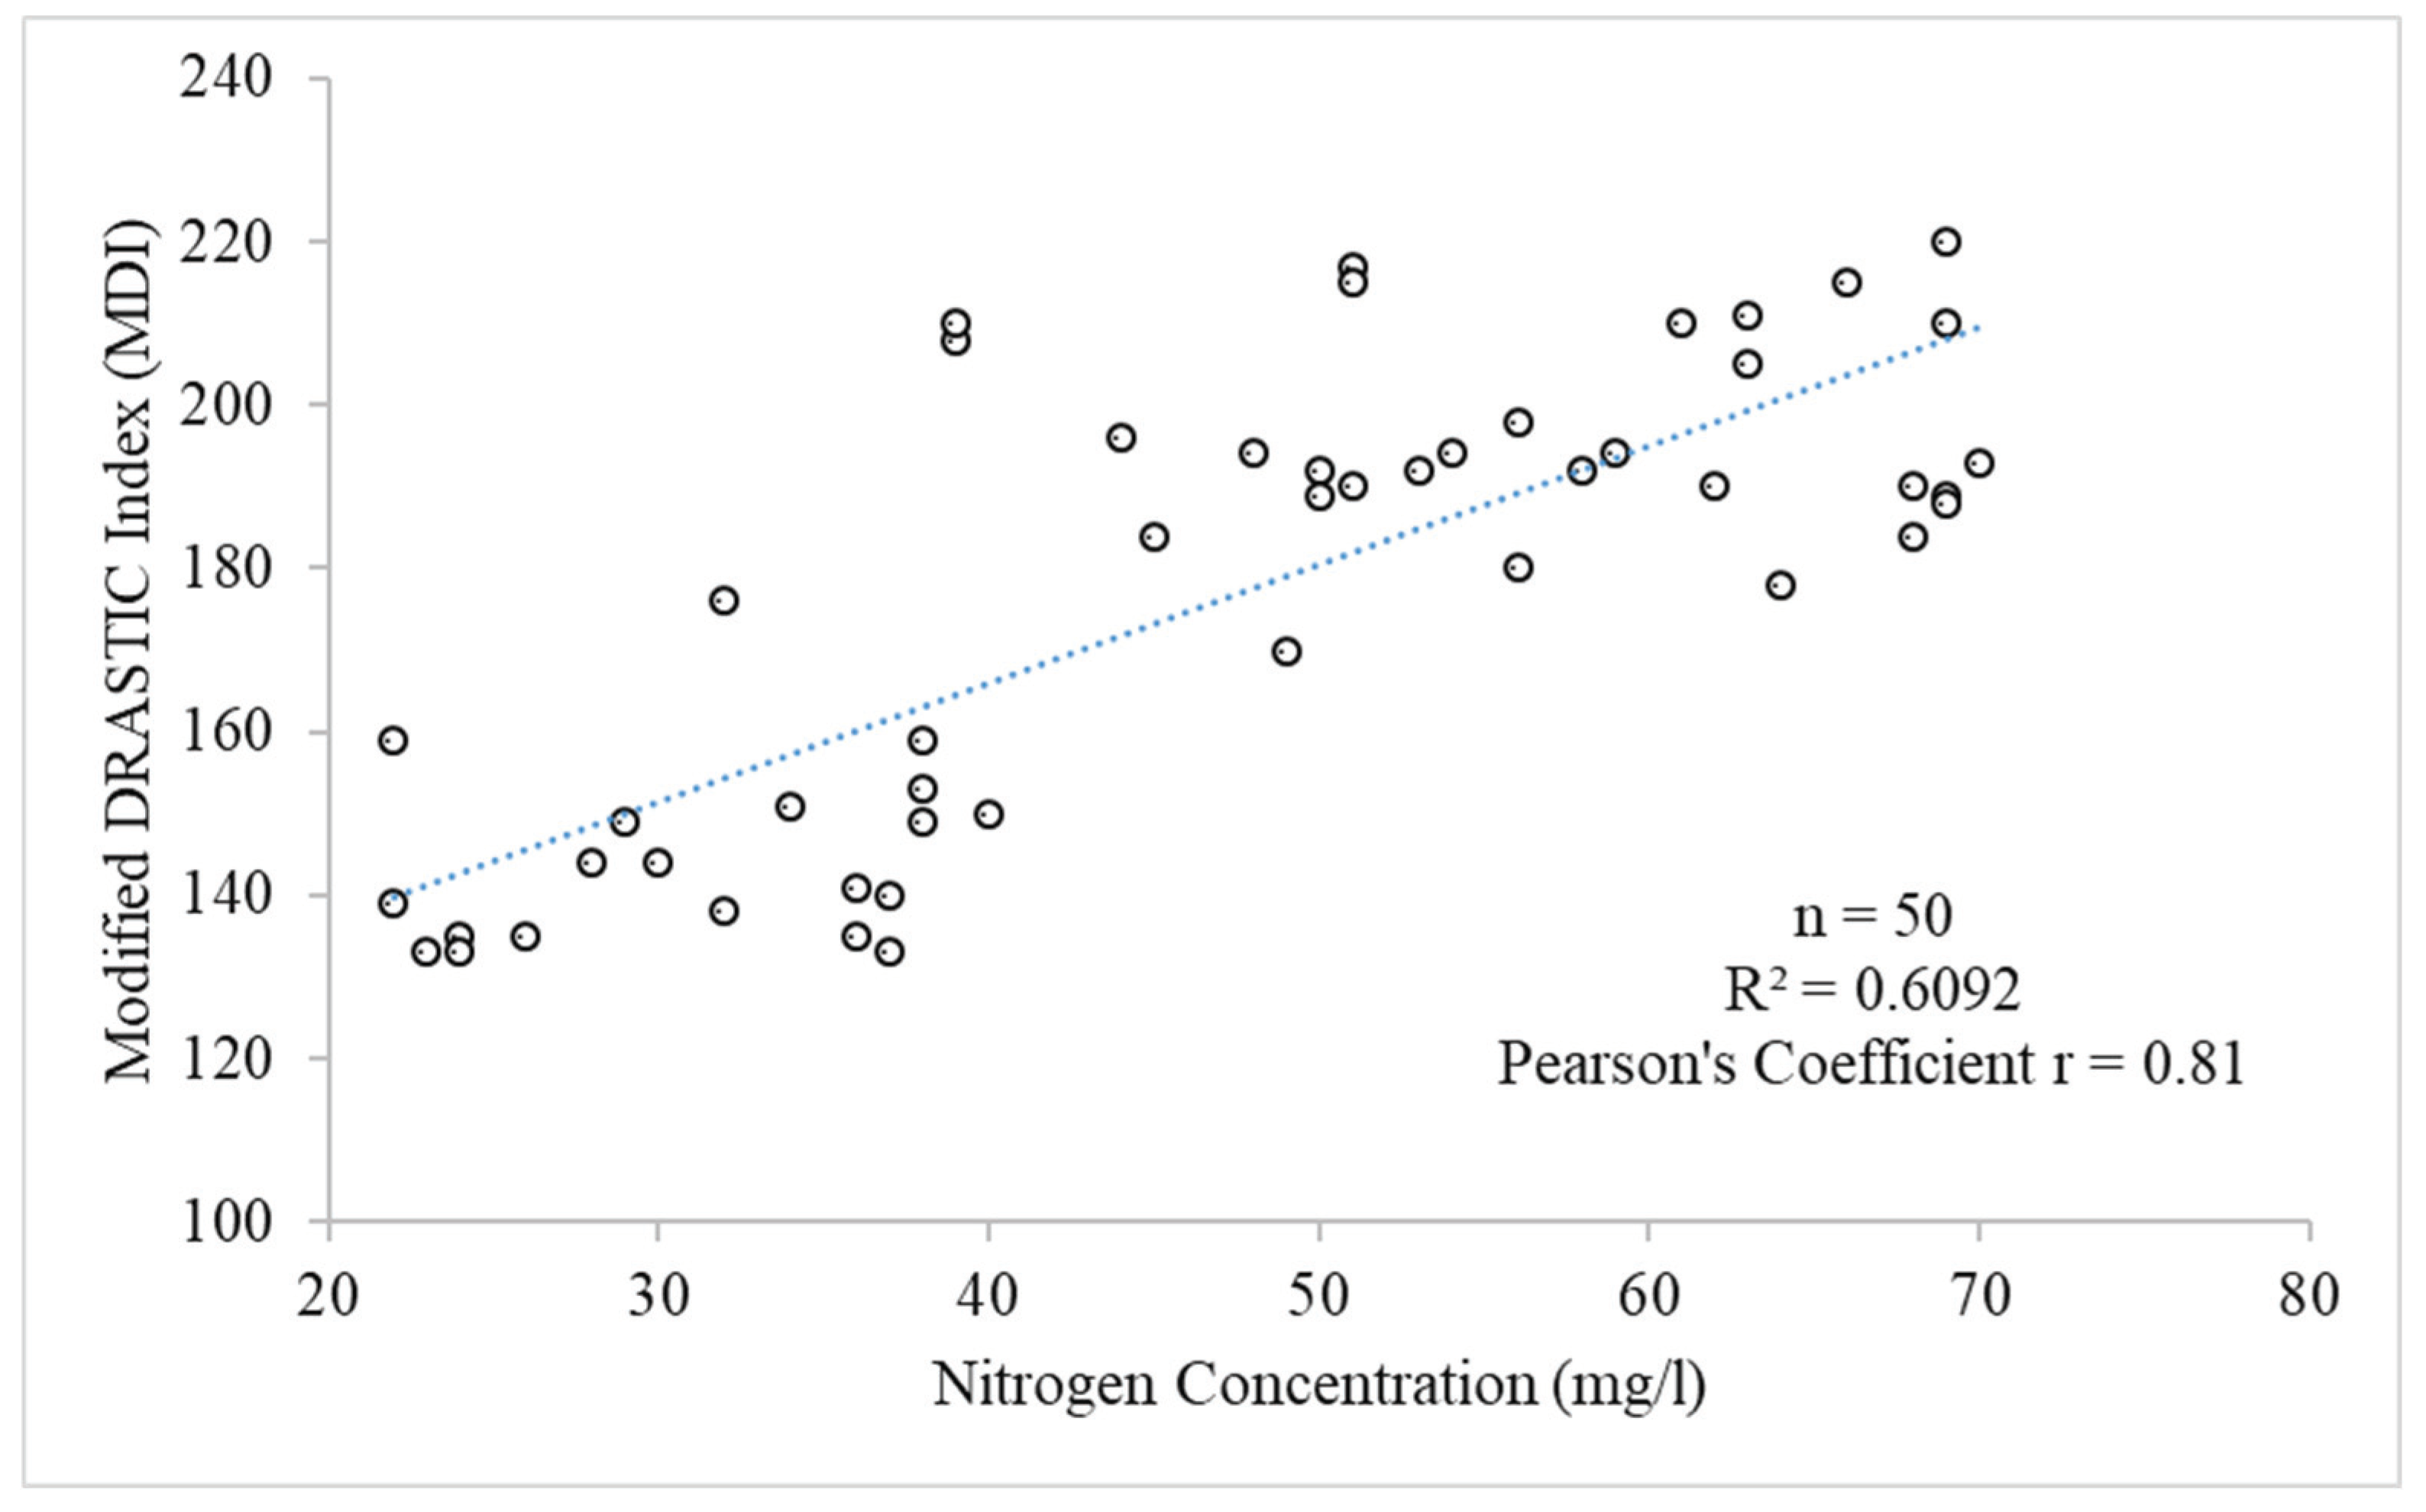
4.1. Confirmation of the Methods
4.2. Sensitivity Analysis
4.2.1. Map Removal Sensitivity Analysis
- S = sensitivity measure
- V = unagitated vulnerability index (all seven parameters were used to obtain the actual index)
- V’ =agitated vulnerability index (vulnerability index computed exercising a lesser quantity of constraints)
- N and n = to compute V and V’ the used number of data layers
4.2.2. Single Parameter Sensitivity Analysis
- Wpi = effective weight (%)
- Pri = rating of individual parameter
- Pwi = weight of individual parameter
- V = ultimate susceptibility index
5. Conclusions
Author Contributions
Funding
Acknowledgments
Conflicts of Interest
References
- Hoekstra, A.Y. Water scarcity challenges to business. Nat. Clim. Chang. 2014, 4, 318. [Google Scholar] [CrossRef]
- Mekonnen, M.M.; Hoekstra, A.Y. Four billion people facing severe water scarcity. Sci. Adv. 2016, 2, e1500323. [Google Scholar] [CrossRef] [PubMed] [Green Version]
- Qu, S.; Liang, S.; Konar, M.; Zhu, Z.; Chiu, A.S.; Jia, X.; Xu, M. Virtual water scarcity risk to the global trade system. Environ. Sci. Technol. 2018, 52, 673–683. [Google Scholar] [CrossRef]
- Hasan, M.; Islam, A.; Hasan, M.A.; Alam, J.; Peas, M.H. Groundwater vulnerability assessment in Savar upazila of Dhaka district, Bangladesh—A GIS-based DRASTIC modeling. Groundw. Sustain. Dev. 2019. [CrossRef]
- Shirazi, S.M.; Imran, H.M.; Akib, S.; Yusop, Z.; Harun, Z.B. Groundwater vulnerability assessment in the Melaka State of Malaysia using DRASTIC and GIS techniques. Environ. Earth Sci. 2013, 70, 2293–2304. [Google Scholar] [CrossRef]
- Guo, Q.; Wang, Y.; Gao, X.; Ma, T. A new model (DRARCH) for assessing groundwater vulnerability to arsenic contamination at basin scale: a case study in Taiyuan basin, northern China. Environ. Geol. 2007, 52, 923–932. [Google Scholar] [CrossRef]
- Rao, D.A.; Naik, P.K.; Jain, S.K.; Kumar, K.V.; Rao, E.D. Assessment of vulnerability zones for ground water pollution using GIS-DRASTIC-EC model: A field-based approach. J. Earth Syst. Sci. 2018, 127, 49. [Google Scholar]
- Hussain, Y.; Satgé, F.; Hussain, M.B.; Martinez-Carvajal, H.; Bonnet, M.P.; Cárdenas-Soto, M.; Akhter, G. Performance of CMORPH, TMPA, and PERSIANN rainfall datasets over plain, mountainous, and glacial regions of Pakistan. Theor. Appl. Climatol. 2018, 131, 1119–1132. [Google Scholar] [CrossRef]
- Saha, D.; Alam, F. Groundwater vulnerability assessment using DRASTIC and Pesticide DRASTIC models in intense agriculture area of the Gangetic plains, India. Environ. Monit. Assess. 2014, 186, 8741–8763. [Google Scholar] [CrossRef]
- Salam, M.; Alam, M. Identification and Delineation of Turag River Basin Boundary Using Remote Sensing Techniques. J. Environ. Sci. Nat. Resour. 2014, 7, 169–175. [Google Scholar] [CrossRef] [Green Version]
- Haque, E.; Reza, S.; Ahmed, R. Assessing the vulnerability of groundwater due to open pit coal mining using DRASTIC model: a case study of Phulbari Coal Mine, Bangladesh. Geosci. J. 2018, 22, 359–371. [Google Scholar] [CrossRef]
- Pfister, S.; Koehler, A.; Hellweg, S. Assessing the environmental impacts of freshwater consumption in LCA. Environ. Sci. Technol. 2009, 43, 4098–4104. [Google Scholar] [CrossRef] [PubMed] [Green Version]
- Luo, T.; Young, R.; Reig, P. Aqueduct Projected Water Stress Country Rankings; Technical Note; World Resources Institute: Washington, DC, USA, 2015. [Google Scholar]
- Fijani, E.; Nadiri, A.A.; Moghaddam, A.A.; Tsai, F.T.C.; Dixon, B. Optimization of DRASTIC method by supervised committee machine artificial intelligence to assess groundwater vulnerability for Maragheh–Bonab plain aquifer, Iran. J. Hydrol. 2013, 503, 89–100. [Google Scholar] [CrossRef]
- Sadeghfam, S.; Hassanzadeh, Y.; Nadiri, A.A.; Zarghami, M. Localization of groundwater vulnerability assessment using catastrophe theory. Water Resour. Manag. 2016, 30, 4585–4601. [Google Scholar] [CrossRef]
- Khosravi, K.; Sartaj, M.; Tsai, F.T.C.; Singh, V.P.; Kazakis, N.; Melesse, A.M.; Pham, B.T. A comparison study of DRASTIC methods with various objective methods for groundwater vulnerability assessment. Sci. Total Environ. 2018, 642, 1032–1049. [Google Scholar] [CrossRef] [PubMed]
- Rahman, A. A GIS based DRASTIC model for assessing groundwater vulnerability in shallow aquifer in Aligarh, India. Appl. Geogr. 2008, 28, 32–53. [Google Scholar] [CrossRef]
- Jaseela, C.; Prabhakar, K.; Harikumar, P.S.P. Application of GIS and DRASTIC modeling for evaluation of groundwater vulnerability near a solid waste disposal site. Int. J. Earth Sci. 2016, 7, 558. [Google Scholar] [CrossRef] [Green Version]
- Prior, J.C.; Boekhoff, J.L.; Howes, M.R.; Libra, R.D.; VanDorpe, P.E. Iowa’s Groundwater Basics: A Geological Guide to the Occurence, Use, and Vulnerability of Iowa’s Aquifers. 2003. Available online: http://worldcat.org/isbn/00967878616 (accessed on 21 February 2020).
- Wang, J.; He, J.; Chen, H. Assessment of groundwater contamination risk using hazard quantification, a modified DRASTIC model and groundwater value, Beijing Plain, China. Sci. Total Environ. 2012, 432, 216–226. [Google Scholar] [CrossRef]
- Gad, M.; El-Hattab, M. Integration of water pollution indices and DRASTIC model for assessment of groundwater quality in El Fayoum depression, western desert, Egypt. J. Afr. Earth Sci. 2019, 158, 103554. [Google Scholar] [CrossRef]
- Evans, B.M.; Myers, W.L. A GIS-based approach to evaluating regional groundwater pollution potential with DRASTIC. J. Soil Water Conserv. 1990, 45, 242–245. [Google Scholar]
- Secunda, S.; Collin, M.; Melloul, A.J. Groundwater vulnerability assessment using a composite model combining DRASTIC with extensive agricultural land use in Israel’s Sharon region. J. Environ. Manag. 1998, 54, 39–57. [Google Scholar] [CrossRef]
- Hasiniaina, F.; Zhou, J.; Guoyi, L. Regional assessment of groundwater vulnerability in Tamtsag basin, Mongolia using drastic model. J. Am. Sci. 2010, 6, 65–78. [Google Scholar]
- Farjad, B.; Shafri, H.Z.B.M.; Mohamed, T.A.; Pirasteh, S.; Wijesekara, N. Groundwater intrinsic vulnerability and risk mapping. Proc. Institut. Civil Eng. Water Manag. 2012, 165, 441–450. [Google Scholar] [CrossRef]
- Yin, L.; Zhang, E.; Wang, X.; Wenninger, J.; Dong, J.; Guo, L.; Huang, J. A GIS-based DRASTIC model for assessing groundwater vulnerability in the Ordos Plateau, China. Environ. Earth Sci. 2013, 69, 171–185. [Google Scholar] [CrossRef]
- Singh, A.; Srivastav, S.K.; Kumar, S.; Chakrapani, G.J. A modified-DRASTIC model (DRASTICA) for assessment of groundwater vulnerability to pollution in an urbanized environment in Lucknow, India. Environ. Earth Sci. 2015, 74, 5475–5490. [Google Scholar] [CrossRef]
- Aller, L. DRASTIC: A Standardized System for Evaluating Ground Water Pollution Potential Using Hydrogeologic Settings; Robert S. Kerr Environmental Research Laboratory, Office of Research and Development, US Environmental Protection Agency: Washington DC, USA, 1985. [Google Scholar]
- Hussain, Y.; Ullah, S.F.; Aslam, A.Q.; Hussain, M.B.; Akhter, G.; Martinez-Carvajal, H.E.; Satgé, F.; Ashraf, A.; Iqbal, B.; Cárdenas-Soto, M. Vulnerability assessment of an agro-stressed aquifer using a source-pathway-receptor model in GIS. MESE 2017, 3, 595–604. [Google Scholar] [CrossRef]
- Alam, F.; Umar, R.; Ahmed, S.; Dar, F.A. A new model (DRASTIC-LU) for evaluating groundwater vulnerability in parts of central Ganga Plain, India. Arab. J. Geosci. 2014, 7, 927–937. [Google Scholar] [CrossRef]
- Khan, M.M.A.; Umar, R.; Lateh, H. Assessment of aquifer vulnerability in parts of Indo Gangetic plain, India. Int J Phys Sci. 2010, 5, 1711–1720. [Google Scholar]
- Ckakraborty, S.; Paul, P.; Sikdar, P. Assessing aquifer vulnerability to arsenic pollution using DRASTIC and GIS of North Bengal Plain: a case study of English Bazar Block, Malda District, West Bengal, India. J. Spat. Sci. 2007, 7. [Google Scholar]
- Al-Adamat, R.A.; Foster, I.D.; Baban, S.M. Groundwater vulnerability and risk mapping for the Basaltic aquifer of the Azraq basin of Jordan using GIS, remote sensing and DRASTIC. Appl. Geogr. 2003, 23, 303–324. [Google Scholar] [CrossRef]
- Huan, H.; Wang, J.; Teng, Y. Assessment and validation of groundwater vulnerability to nitrate based on a modified DRASTIC model: a case study in Jilin City of northeast China. Sci. Total Environ. 2012, 440, 14–23. [Google Scholar] [CrossRef] [PubMed]
- Pacheco, F.A.; Fernandes, L.F.S. The multivariate statistical structure of DRASTIC model. J. Hydrol. 2013, 476, 442–459. [Google Scholar] [CrossRef]
- Stigter, T.; Ribeiro, L.; Dill, A.C. Evaluation of an intrinsic and a specific vulnerability assessment method in comparison with groundwater salinisation and nitrate contamination levels in two agricultural regions in the south of Portugal. Hydrogeol. J. 2006, 14, 79–99. [Google Scholar] [CrossRef]
- Xiaoyu, W.; Bin, L.; Chuanming, M. Assessment of groundwater vulnerability by applying the modified DRASTIC model in Beihai City, China. Environ. Sci. Pollut. Res. 2018, 25, 12713–12727. [Google Scholar]
- Masoud, M.; El Osta, M. Evaluation of groundwater vulnerability in El-Bahariya Oasis, Western Desert, Egypt, using modelling and GIS techniques: A case study. J. Earth Sys. Sci. 2016, 125, 1139–1155. [Google Scholar] [CrossRef] [Green Version]
- Neshat, A.; Pradhan, B.; Pirasteh, S.; Shafri, H.Z.M. Estimating groundwater vulnerability to pollution using a modified DRASTIC model in the Kerman agricultural area, Iran. Environ. Earth Sci. 2014, 71, 3119–3131. [Google Scholar]
- Sener, E.; Davraz, A. Assessment of groundwater vulnerability based on a modified DRASTIC model, GIS and an analytic hierarchy process (AHP) method: the case of Egirdir Lake basin (Isparta, Turkey). HydJ 2013, 21, 701–714. [Google Scholar]
- Neshat, A.; Pradhan, B.; Dadras, M. Groundwater vulnerability assessment using an improved DRASTIC method in GIS. Resour. Conserv. Recycl. 2014, 86, 74–86. [Google Scholar] [CrossRef]
- Neshat, A.; Pradhan, B. An integrated DRASTIC model using frequency ratio and two new hybrid methods for groundwater vulnerability assessment. Nat. Hazards 2015, 76, 543–563. [Google Scholar] [CrossRef] [Green Version]
- Edet, A. An aquifer vulnerability assessment of the Benin Formation aquifer, Calabar, southeastern Nigeria, using DRASTIC and GIS approach. Environ. Earth Sci. 2014, 71, 1747–1765. [Google Scholar] [CrossRef]
- Ouedraogo, I.; Defourny, P.; Vanclooster, M. Mapping the groundwater vulnerability for pollution at the pan African scale. Sci. Total Environ. 2016, 544, 939–953. [Google Scholar] [CrossRef]
- Usman, D. Evaluation of Models for Assessing Groundwater Vulnerability to Pollution in Niigeria. Bayero Pure Appl. Sci. 2009, 2, 138–142. [Google Scholar]
- Chitsazan, M.; Akhtari, Y. A GIS-based DRASTIC model for assessing aquifer vulnerability in Kherran Plain, Khuzestan, Iran. Water Resour. Manag. 2009, 23, 1137–1155. [Google Scholar] [CrossRef]
- Al-Abadi, A.M.; Al-Shamma’a, A.M.; Aljabbari, M.H. A GIS-based DRASTIC model for assessing intrinsic groundwater vulnerability in northeastern Missan governorate, southern Iraq. Applied Water Sci. 2017, 7, 89–101. [Google Scholar] [CrossRef] [Green Version]
- Ghosh, A.; Tiwari, A.K.; Das, S. A GIS based DRASTIC model for assessing groundwater vulnerability of Katri Watershed, Dhanbad, India. MESE 2015, 1, 11. [Google Scholar] [CrossRef] [Green Version]
- Neh, A.V.; Ako, A.A.; Ayuk II, A.R.; Hosono, T. DRASTIC-GIS model for assessing vulnerability to pollution of the phreatic aquiferous formations in Douala–Cameroon. J. Afr. Earth Sci. 2015, 102, 180–190. [Google Scholar]
- Ahmed, I.; Nazzal, Y.; Zaidi, F.K.; Al-Arifi, N.S.; Ghrefat, H.; Naeem, M. Hydrogeological vulnerability and pollution risk mapping of the Saq and overlying aquifers using the DRASTIC model and GIS techniques, NW Saudi Arabia. Environ. Earth Sci. 2015, 74, 1303–1318. [Google Scholar] [CrossRef]
- Nazzal, Y.; Howari, F.M.; Iqbal, J.; Ahmed, I.; Orm, N.B.; Yousef, A. Investigating aquifer vulnerability and pollution risk employing modified DRASTIC model and GIS techniques in Liwa area, United Arab Emirates. Groundw. Sustain. Dev. 2019, 8, 567–578. [Google Scholar] [CrossRef]
- Dimitriou, E.; Moussoulis, E. Land use change scenarios and associated groundwater impacts in a protected peri-urban area. Environ. Earth Sci. 2011, 64, 471–482. [Google Scholar] [CrossRef]
- Khan, H.H.; Khan, A.; Ahmed, S.; Perrin, J. GIS-based impact assessment of land-use changes on groundwater quality: study from a rapidly urbanizing region of South India. Environ. Earth Sci. 2011, 63, 1289–1302. [Google Scholar] [CrossRef]
- Hussain, Y. Hydrogeophysical Investigations and GIS Vulnerability Mapping of Kot Addu; Quaid-i-Azam University: Islamabad, Pakistan, 2014. [Google Scholar]
- Hussain, Y.; Ullah, S.F.; Hussain, M.B.; Aslam, A.Q.; Akhter, G.; Martinez-Carvajal, H.; Cárdenas-Soto, M. Modelling the vulnerability of groundwater to contamination in an unconfined alluvial aquifer in Pakistan. Environ. Earth Sci. 2017, 76, 84. [Google Scholar] [CrossRef]
- Hernández-Espriú, A.; Reyna-Gutiérrez, J.A.; Sánchez-León, E.; Cabral-Cano, E.; Carrera-Hernández, J.; Martínez-Santos, P.; Macías-Medrano, S.; Falorni, G.; Colombo, D. The DRASTIC-Sg model: an extension to the DRASTIC approach for mapping groundwater vulnerability in aquifers subject to differential land subsidence, with application to Mexico City. Hydrogeol. J. 2014, 22, 1469–1485. [Google Scholar] [CrossRef]
- Abdullah, T.; Ali, S.; Al-Ansari, N.; Knutsson, S. Groundwater vulnerability mapping using lineament density on standard DRASTIC model: case study in Halabja Saidsadiq Basin, Kurdistan Region, Iraq. Engineering 2015, 7, 644–667. [Google Scholar] [CrossRef] [Green Version]
- Ahmed, I.; Nazzal, Y.; Zaidi, F.; Ahmed, I.; Nazzal, Y.; Zaidi, F. Groundwater pollution risk mapping using modified DRASTIC model in parts of Hail region of Saudi Arabia. Environ. Eng. Res. 2017, 23, 84–91. [Google Scholar] [CrossRef] [Green Version]
- Zafar, M.; Ahmad, W. Water Quality Assessment and Apportionment of Northern Pakistan Using Multivariate Statistical Techniques–A Case Study. Int. J. Hydrol. 2018, 2, 00040. [Google Scholar]
- Snedecor, G.W.; Cochran, W.G. Statistical Methods, 7th ed.; Iowa State University: Ames, IA, USA, 1980; pp. 80–86. [Google Scholar]
- Pathak, D.R.; Hiratsuka, A.; Awata, I.; Chen, L. Groundwater vulnerability assessment in shallow aquifer of Kathmandu Valley using GIS-based DRASTIC model. Environ. Earth Sci. 2009, 57, 1569–1578. [Google Scholar] [CrossRef]
- Rosen, L. A study of the DRASTIC methodology with emphasis on Swedish conditions. Ground Water 1994, 32, 278–285. [Google Scholar] [CrossRef]
- Barber, C.; Bates, L.E.; Barron, R.; Allison, H. Assessment of the relative vulnerability of groundwater to pollution: a review and background paper for the conference workshop on vulnerability assessment. J. Aust. Geol. Geophys. 1993, 14, 1147–1154. [Google Scholar]
- Lodwick, W.A.; Monson, W.; Svoboda, L. Attribute error and sensitivity analysis of map operations in geographical informations systems: suitability analysis. Int. J. Geogr. Inf. Sci. 1990, 4, 413–428. [Google Scholar] [CrossRef]
- Napolitano, P.; Fabbri, A. Single-parameter sensitivity analysis for aquifer vulnerability assessment using DRASTIC and SINTACS. IAHS Publications-Series of Proceedings and Reports-Intern Assoc Hydrological Sciences 1996, No. 235. 1996, pp. 559–566. Available online: http://hydrologie.org/redbooks/a235/iahs_235_0559.pdf (accessed on 7 May 2020).
- Babiker, I.S.; Mohamed, M.A.; Hiyama, T.; Kato, K. A GIS-based DRASTIC model for assessing aquifer vulnerability in Kakamigahara Heights, Gifu Prefecture, central Japan. Sci. Total Environ. 2005, 345, 127–140. [Google Scholar] [CrossRef]


| 1 | Net Recharge | Rainfall Dataset of Pakistan Meteorological Department |
|---|---|---|
| 2 | Aquifer media | Soil Survey of Pakistan and Pakistan Council of Research in Water Resources (PCRWR) |
| 3 | Soil media | Soil Survey of Pakistan and Pakistan Council of Research in Water Resources (PCRWR) |
| 4 | Topography | Aster DEM, downloaded from (https://earthexplorer.usgs.gov/) |
| 5 | Impact of vadose zone | Soil Survey of Pakistan and Pakistan Council of Research in Water Resources (PCRWR) |
| 6 | Hydraulic conductivity | Soil Survey of Pakistan and Pakistan Council of Research in Water Resources (PCRWR) |
| 7 | Population Data | The Gridded Population of the World, Version 4 (GPWv4), downloaded from (https://sedac.ciesin.columbia.edu/data/set/gpw-v4-population-density-rev11) |
| 8 | Land Use Data | FAO Land use Data set, downloaded from (http://www.un-spider.org/links-and-resources/data-sources/land-cover-and-land-cover-change-himalaya-region-fao) |
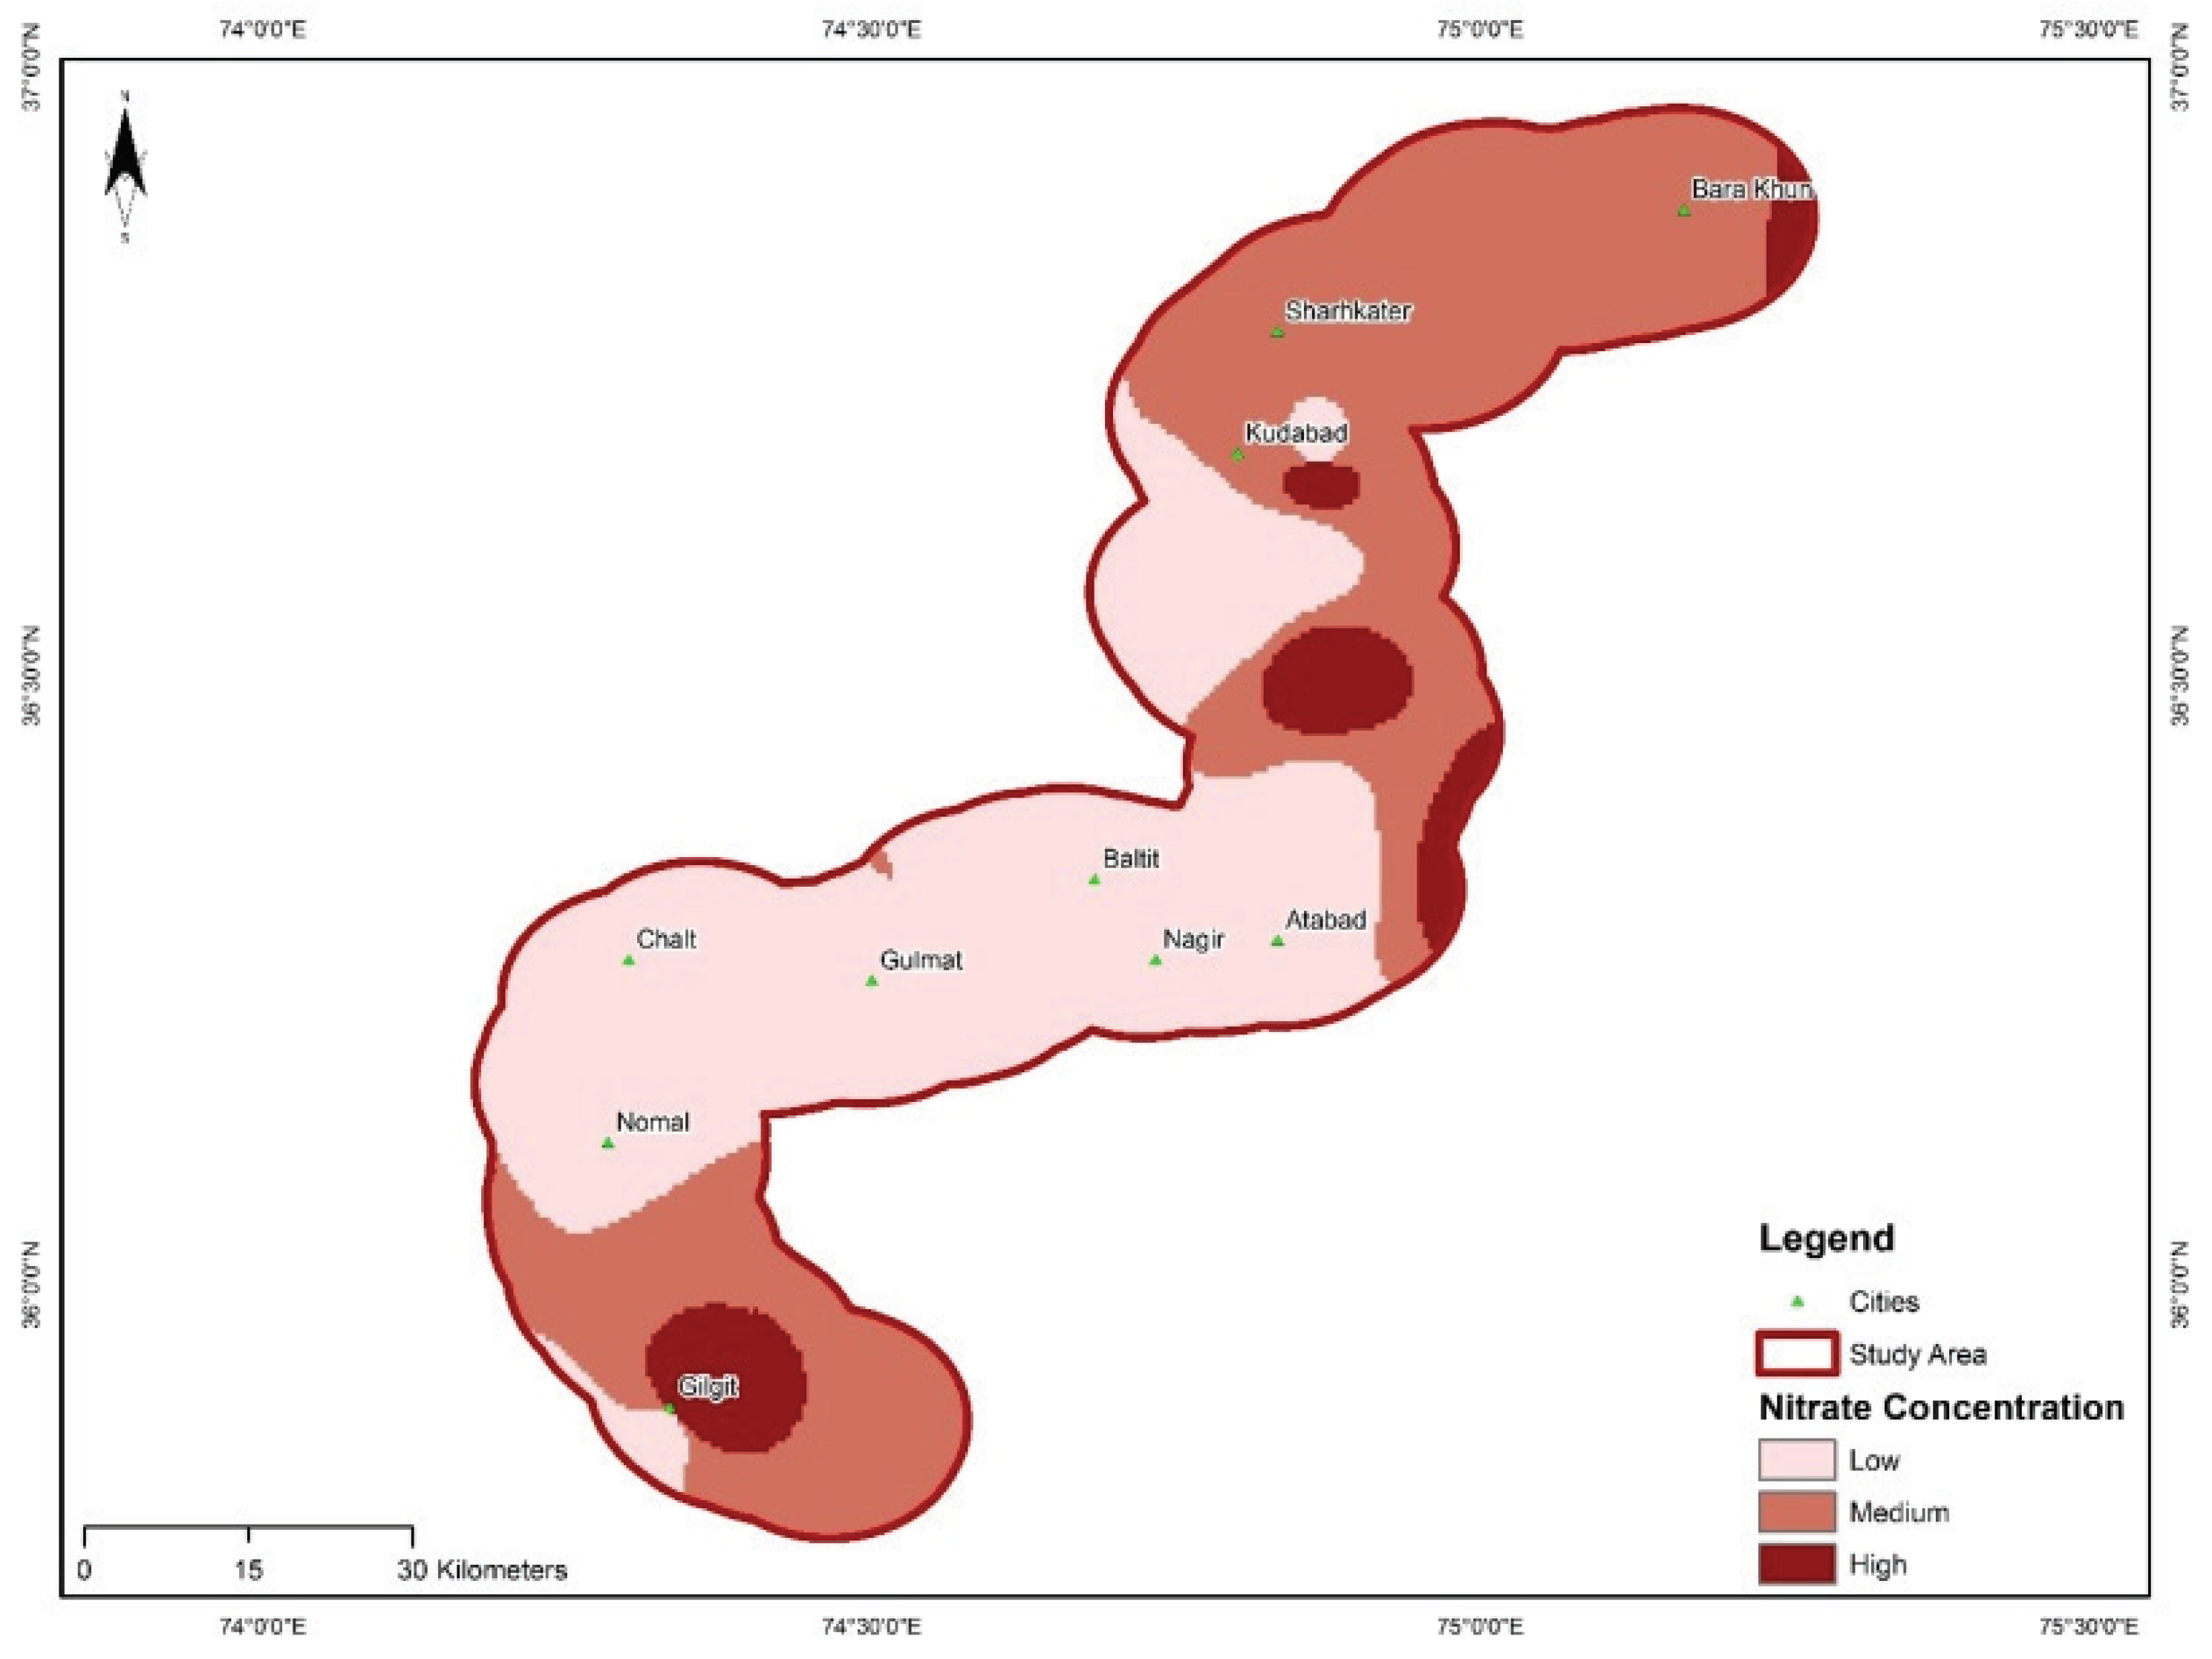
| 9 | Nitrate Concentration | Water Well Data |
| Parameter | Range | Rating | Weight |
|---|---|---|---|
| Depth to water table (m) | <40 | 9 | 5 |
| 40–60 | 7 | ||
| 60–80 | 5 | ||
| 80–100 | 3 | ||
| >100 | 1 | ||
| Net recharge (mm) | >80 | 9 | 4 |
| 60–80 | 7 | ||
| <60 | 5 | ||
| Aquifer media | Sand | 8 | 3 |
| Soil media | Sandy loam | 7 | |
| Silt | 6 | ||
| Sandy clay | 4 | 2 | |
| Clay | 2 | ||
| Topography | <5 | 9 | 1 |
| 5–10 | 8 | ||
| 10–20 | 6 | ||
| 20–40 | 4 | ||
| >40 | 2 | ||
| Impact of vadose zone | Sand | 7 | 5 |
| Hydraulic conductivity | >300 | 9 | 3 |
| 200–300 | 8 | ||
| 100–200 | 6 | ||
| <100 | 4 |
| Sr. No. | Land Use Classes | Area km2 | Area % |
|---|---|---|---|
| 1 | Agriculture | 467.5 | 11 |
| 2 | Bare areas | 1232.5 | 29 |
| 3 | Forest | 1317.5 | 31 |
| 4 | Natural shrubs | 382.5 | 9 |
| 5 | Snow | 595 | 14 |
| 6 | Water bodies | 255 | 6 |
| 7 | Total | 4250 | 100% |
| Land Use Classes | Ratings |
|---|---|
| Water bodies and wastelands | 1 |
| Forest and shrubland | 2 |
| Bare areas | 3 |
| Agriculture | 5 |
| Build up with low density | 7 |
| Build up with medium density | 8 |
| Build up with high density | 9 |
| Class | Index Ranges | DRASTIC | DRASTICA | ||||
|---|---|---|---|---|---|---|---|
| N. pixel | Area km2 | Area % | N. Pixel | Area km2 | Area % | ||
| 1 | <120 | 102,000 | 1020 | 24 | 8500 | 85 | 2 |
| 2 | 120–149 | 225,250 | 2252.5 | 53 | 157,250 | 1572.5 | 37 |
| 3 | 150–179 | 89,250 | 892.5 | 21 | 178,500 | 1785 | 42 |
| 4 | >180 | 8500 | 85 | 2 | 80,750 | 807.5 | 19 |
| Parameter Removed | Variation | Index % | ||
|---|---|---|---|---|
| Mean | Min | Max | SD | |
| D | 1.57 | 1.01 | 2.5 | 0.19 |
| R | 0.62 | 0.16 | 2.08 | 0.31 |
| A | 0.41 | 0.04 | 0.92 | 0.15 |
| S | 1.13 | 0.79 | 1.42 | 0.11 |
| T | 1.33 | 1.1 | 1.6 | 0.09 |
| I | 1.12 | 0.42 | 1.5 | 0.15 |
| C | 0.7 | 0 | 1.52 | 0.26 |
| A | 1.98 | 2.1 | 2.27 | 0.21 |
| Parameter Removed | Variation | Index% | ||
|---|---|---|---|---|
| Mean | Min | Max | SD | |
| D,R,S,T,I,C,A | 0.31 | 0 | 0.79 | 0.11 |
| D,S,T,I,C,A | 0.74 | 0 | 2.3 | 0.41 |
| D,S,T,I,A | 0.59 | 0 | 2.75 | 0.46 |
| D,S,T,A | 1.56 | 0 | 3.43 | 0.61 |
| D,T,A | 1.4 | 0 | 4.1 | 0.59 |
| D,A | 11.03 | 5.67 | 15.34 | 1.34 |
| A | 9.16 | 5.67 | 13.04 | 1.2 |
| Parameter Removed | Theoretical Weight | Theoretical Weight (%) | Experimental | Weight (%) | ||
|---|---|---|---|---|---|---|
| Mean | Min | Max | SD | |||
| D | 5 | 22.4 | 23.5 | 19.2 | 29.43 | 1.17 |
| R | 4 | 17.3 | 17.4 | 2.6 | 26.84 | 3.87 |
| A | 3 | 1.7 | 8.5 | 4.1 | 18.65 | 1.47 |
| S | 2 | 7.1 | 7.3 | 6.3 | 10.54 | 0.48 |
| T | 1 | 5.2 | 5.9 | 5.1 | 8.21 | 0.65 |
| I | 5 | 22.8 | 18.9 | 16.3 | 22 | 1.21 |
| C | 3 | 14.8 | 17.4 | 15.8 | 21.54 | 0.97 |
| A | 5 | 18.6 | 19.4 | 17.5 | 26.4 | 1.04 |
© 2020 by the authors. Licensee MDPI, Basel, Switzerland. This article is an open access article distributed under the terms and conditions of the Creative Commons Attribution (CC BY) license (http://creativecommons.org/licenses/by/4.0/).
Share and Cite
Maqsoom, A.; Aslam, B.; Khalil, U.; Ghorbanzadeh, O.; Ashraf, H.; Faisal Tufail, R.; Farooq, D.; Blaschke, T. A GIS-based DRASTIC Model and an Adjusted DRASTIC Model (DRASTICA) for Groundwater Susceptibility Assessment along the China–Pakistan Economic Corridor (CPEC) Route. ISPRS Int. J. Geo-Inf. 2020, 9, 332. https://0-doi-org.brum.beds.ac.uk/10.3390/ijgi9050332
Maqsoom A, Aslam B, Khalil U, Ghorbanzadeh O, Ashraf H, Faisal Tufail R, Farooq D, Blaschke T. A GIS-based DRASTIC Model and an Adjusted DRASTIC Model (DRASTICA) for Groundwater Susceptibility Assessment along the China–Pakistan Economic Corridor (CPEC) Route. ISPRS International Journal of Geo-Information. 2020; 9(5):332. https://0-doi-org.brum.beds.ac.uk/10.3390/ijgi9050332
Chicago/Turabian StyleMaqsoom, Ahsen, Bilal Aslam, Umer Khalil, Omid Ghorbanzadeh, Hassan Ashraf, Rana Faisal Tufail, Danish Farooq, and Thomas Blaschke. 2020. "A GIS-based DRASTIC Model and an Adjusted DRASTIC Model (DRASTICA) for Groundwater Susceptibility Assessment along the China–Pakistan Economic Corridor (CPEC) Route" ISPRS International Journal of Geo-Information 9, no. 5: 332. https://0-doi-org.brum.beds.ac.uk/10.3390/ijgi9050332