1. Introduction
Climate services (CS) have become even more popular in recent years as the perception of climate change has increased (
http://publications.jrc.ec.europa.eu/repository/handle/JRC72550) [
1,
2]. They invariably respond to very specific and local issues, but the limits of their coverage are unclear. They are still in an early phase of development, so no formal framework has yet emerged as a standard, either for their design or for their implementation while there are attempts to define guidelines and to theorize their development process. However, an essential CS feature is their intrinsic visual and geographic nature. CS are conceived to address issues identified on a given location and for well-identified subjects. Above all, the geographic position of their target is an essential dimension in the design process. At the first stage of the development and all along its life cycle, available related structured and unstructured data are potentially useful to extract information related to its geography.
For its part, the geographic-information-retrieval (GIR) domain combines both objectives of Information retrieval (IR) and geographic-information systems (GIS), and deals with the challenges of extracting geographic information from unstructured-data volumes, generally on the web. CS and GIR domains share this intrinsic geographic nature. Among multiple challenges posed in the relatively new field of GIR is the development of user interfaces that facilitate the search for information [
3,
4]. The platform presented in this paper is part of this theme.
We present the architecture and features of the Data and Knowledge Platform (DKP) geographic software that was conceived as support for climate-service elaboration in the context of the global change impact on given geographic locations. It is intended for a community of stakeholders who need visual and geographic tools to design services for improving the resilience of society in various domains. The DKP aims at providing visualization functions and a repository of geographically referenced resources that are useful for better understanding and design.
The DKP development process falls within the field of GIR, in that it has consisted in
providing support to CS providers in the search for geographic information;
storing voluminous and geographically labelled data of various types thanks to a very flexible NoSQL data structure; and
defining a user interface mainly on the basis of geographic views extracted from its data.
The platform was built within the framework of European project INNOVA (European Research Area for Climate Services, ERA4CS). The INNOVA project (
https://www.innovaclimate.org/)
considers climate-service innovations for transformational adaptation in addition to incremental adaptation. The project is organized around four local case studies called hubs, connected across the project. Each hub focuses on a specific geographic area in Europe, including overseas, on which climate-change impact is particularly awkward. While the current version of the DKP is only dedicated to the four INNOVA hubs, it is easily extended to any new similar case of CS design for which this task may be facilitated by the visualization of climate impact and correlated geographic information to address local climate-related risk issues.
The DKP design is generally intended to support CS suppliers in their task by allowing to: (a) gather georeferenced information on a given local climate-change case study for further design of solutions towards mitigation, (b) explore climate data and other categories of digital data into a geographic framework, and (c) act out climate-change scenarios related to a given activity. However, in this first version, it particularly fits the case of the French West Indies (Guadeloupe and Martinique islands) INNOVA hub in which the development of services is studied to assess the risk of the impact of climate change on island agriculture. In this paper, we discuss the use of the platform, and demonstrate its interest on this local case study.
The discovered knowledge using the platform is of three kinds, depending on the platform tool:
a data-search module that allows users to search and filter the database via a search engine in order to identify any DKP resource matching a user query;
a knowledge-extraction module that only focuses on climate data and is able to answer questions on the evolution of specific climatic conditions; and
a text-mining module that allows users to conduct deep analysis of DKP textual resources associated either to a given hub or resulting from a more complicated query.
The contribution of the work presented in this paper resides in the originality and novelty of the platform for the climate-service domain, i.e., not only its geographic support for the co-design of climate services, but also the contribution it makes to urgent local needs in the region, for example, for local and regional authorities and other regional decision makers. It falls within the domain of data and knowledge platforms that are designed for a given type of application or a dedicated user community.
The rest of this paper is structured in six sections.
Section 2 details (a) the area of climate services, design issues, and challenges; and (b) the objectives and geographic nature of the DKP.
Section 3 presents the data-storage management of the platform with data schema and techniques that were implemented.
Section 4 focuses on the visual and geographic staging of resources on the platform.
Section 5 shows how data may be analyzed and evaluated to extract useful knowledge for the design of a service. Finally, we unroll an example illustrating the implementation of the platform on a practical situation in
Section 6, and we conclude in
Section 7.
All maps that are demonstrators of platform functionalities and that display data in the paper were drawn on the basis of simulated data. They do not in any way reflect the reality of geography, climate, weather, climate-projection, or agricultural-production data in the targeted areas. Maps and views displaying potential risks on geolocalized agricultural parcels cannot be public. Their access is restricted to regional bodies in charge of agricultural-land management.
2. Climate Services and DKP Objectives
The notion of climate service (CS) includes a wide variety of views and objectives. One can find several ways to profile this complex and multivariate concept. First, CSs are built not only on climate information but also on weather. While climate deals with the conditions of the atmosphere of a given location in the medium and long term, weather is concerned with the short term, particularly with forecasts over days. Climatology studies are on the components and variations of climates on areas of Earth. Climate can also be seen as a succession of weather types, so that climatology is related to geographic indicators to produce projections on different types of climate.
By examining the different acceptances of the climate-service concept and climate-service examples all over the world, we can draw their essential characteristics. For instance, for the Global Framework for Climate Services (GFCS) (
https://gfcs.wmo.int/), which was created by the international community at the World Climate Conference-3 in 2009, CS goals were to enable the
better management of the risks of climate variability, and change and adaptation to climate change, through the development and incorporation of science-based climate information and prediction into planning, policy, and practice on the global, regional, and national scale. According to GFCS, CSs are expected to produce information for climate-related decision making. They are also intended to deliver not only information, but also products. In 2015, the European Commission [
5] defined a climate service as the transformation of climate-related data with other relevant information into customized products such as projections, forecasts, information, trends, economic analysis, assessments, counselling on best practices, the development and evaluation of solutions, and any other service in relation to climate that may be of use for society at large. The American National Oceanic and Atmospheric Administration (NOAA) for its part defines its climate-service directors as
support for the development and delivery of a wide range of place-based climate science and information products and services to help people make informed decisions.
Climate services are produced for a wide variety of application areas particularly affected by climate change, while some can be seen as priorities like water management, land planning, agriculture, health, and food. Numerous initiatives to promote solutions for climate adaptation are launched at the international, national, and regional scales. Nevertheless, in a number of research papers on the field [
2,
3] the lack of information on available climate services is pointed out with the strong need for classification [
4]. The design of climate services is also a subject that is currently addressed little. However, the interactive aspect of the design is regularly mentioned to highlight the necessary dialog between service providers and end users. Works on this subject report co-designing processes in which the end user is at the center of development [
6,
7,
8]. As these publications state, analysis of user expectations and climate-service needs is an arduous task that requires intensive dialog, since producing a valuable climate service is obviously fundamental. Then, the question arises of how to evaluate the service in relation to the situation it addresses. How can we tell if a service is good or bad, and if it needs to be improved? This question is reflected on the design stage. It is fundamentally at this stage that quality objectives must be targeted. Usability and usefulness are important criteria.
In the multiplicity of views on the concept of climate service, here we recall the strongest features:
- (A)
A climate service processes climate information obtained by analyzing (with scientific knowledge) massive datasets collected on weather (air pressure, temperature, humidity, and wind speed and direction), and climate datasets (precipitation and temperature);
- (B)
since climate data like climate projections are not directly usable by final users, and user needs are not obvious to identify, climate services fill the gap between climate data and the practical needs of end users;
- (C)
the design of a climate service requires numerous and time-consuming exchanges between suppliers and final users;
- (D)
climate services are used in the context of climate adaptation and they are inseparable from sustainable-development solutions; and
- (E)
climate services are primarily used to support decision making on local issues.
To that extent, the overall objective in building the DK platform presented in this paper is to produce a geographic and visual support tool useful to the supplier–user dialog of climate-service co-design. More precisely, DKP development was goal-oriented according to three initial goals:
- (G1)
Geographically facilitate the local understanding of climate at the very preliminary phase of the co-design process. At this stage, end users are aware of climate-change expression, but coanalysis and co-observation with the provider of current tendencies and projections reported by climate-related geographic information extracted from numeric data and other resources (narratives, videos, images, links) available on the platform make it easier for them to express their concerns in terms of change.
- (G2)
Provide support in assessing climate-related risks at the more advanced stage of the process. The platform should assist co-design from the point of view of risk assessment by storing and providing narratives, videos, and images, and allowing to investigate tendencies and risk-impact degree. The risk is generally assessed on a well-identified problem related, for instance, to a very local activity that should be visualized on the platform, preferably under different prisms.
- (G3)
Deliver pieces of knowledge, including geographic knowledge extracted from platform resources that are actionable to develop the climate service. This takes place at the most elaborate stage of the platform-usage process for CS development.
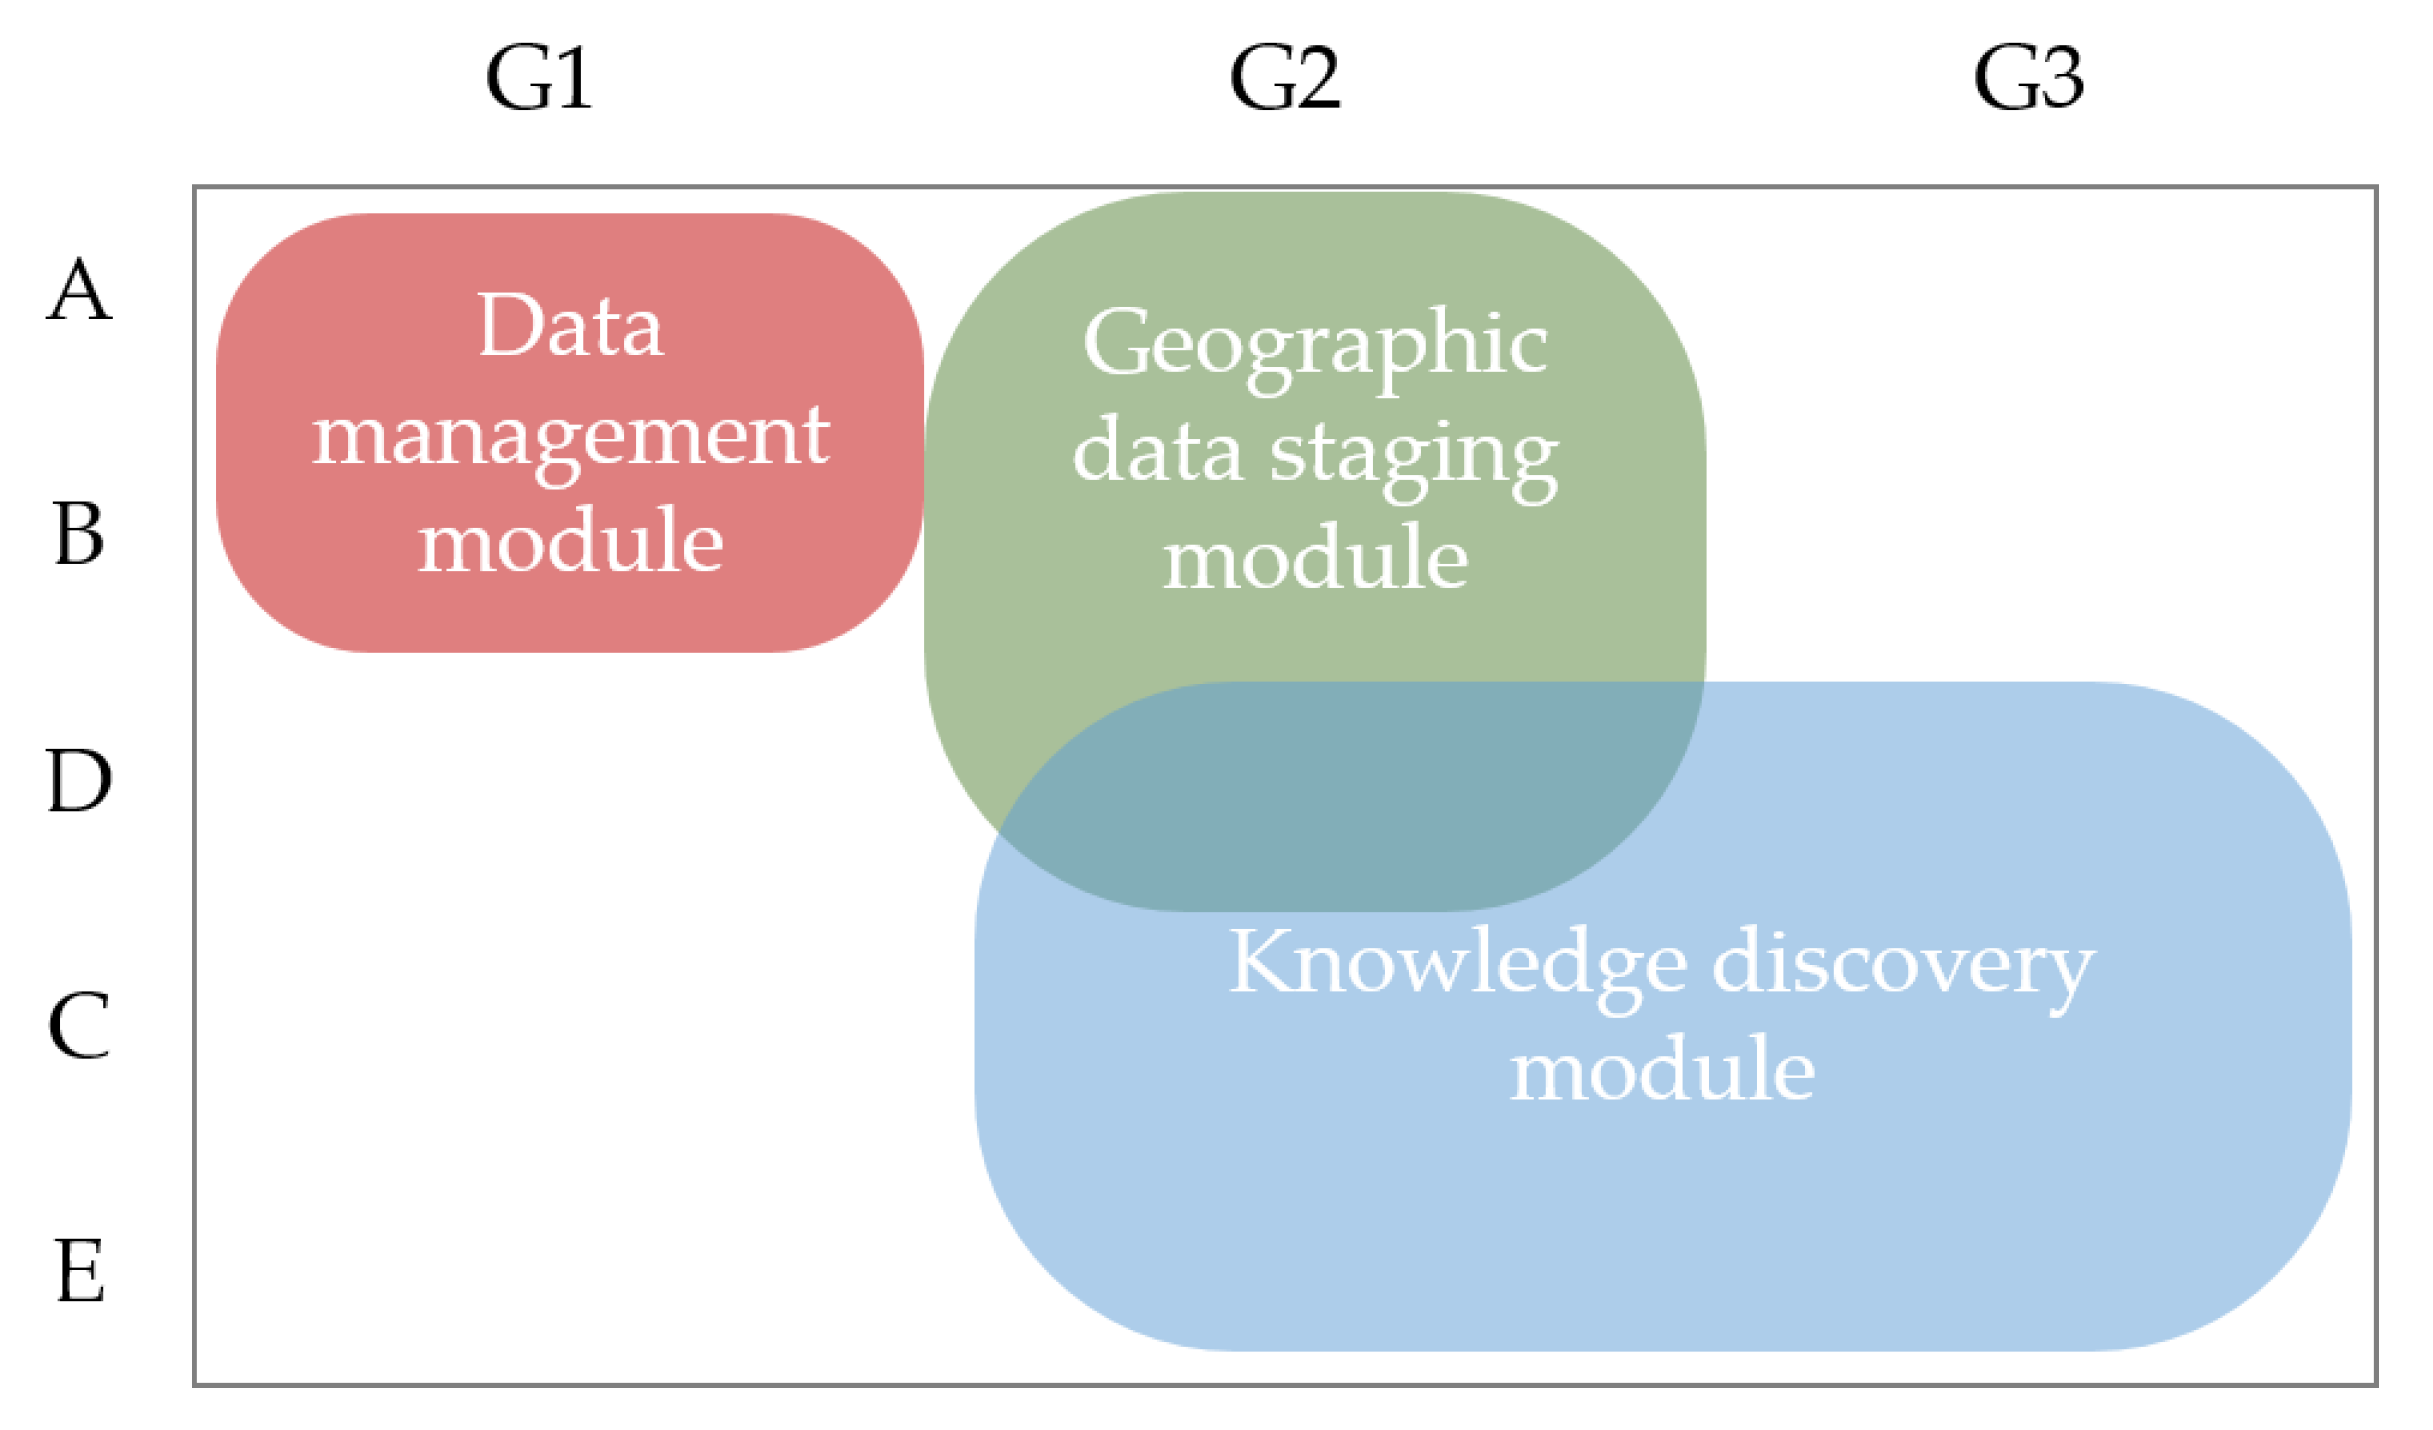
The platform is functionally structured in three modules, each corresponding to a specific activity in the co-design process: (a) data-management, (b) geographic-data-staging, and (c) knowledge-discovery modules.
Figure 1 shows how these three modules are correlated with CS Features A to E and Objectives G1, G2, G3. Data management achieves G1 and contributes to the design of CS Features A and B, since CS co-designers are able to explore a variety of climate-data representations according to visual and geographic views through the platform. Geographic-data staging achieves G2 and contributes to the design of CS Features A, B, and D, since CS co-designers can easily visualize and directly compare both local climate tendencies and other local risk-relevant indicators on maps through the platform. Knowledge discovery achieves G2 and G3, and contributes to the design of CS Features D, C, and E, since CS providers and end users are able to deliver visual and geographic items through the platform that form a useful and usable baseline for CS deployment.
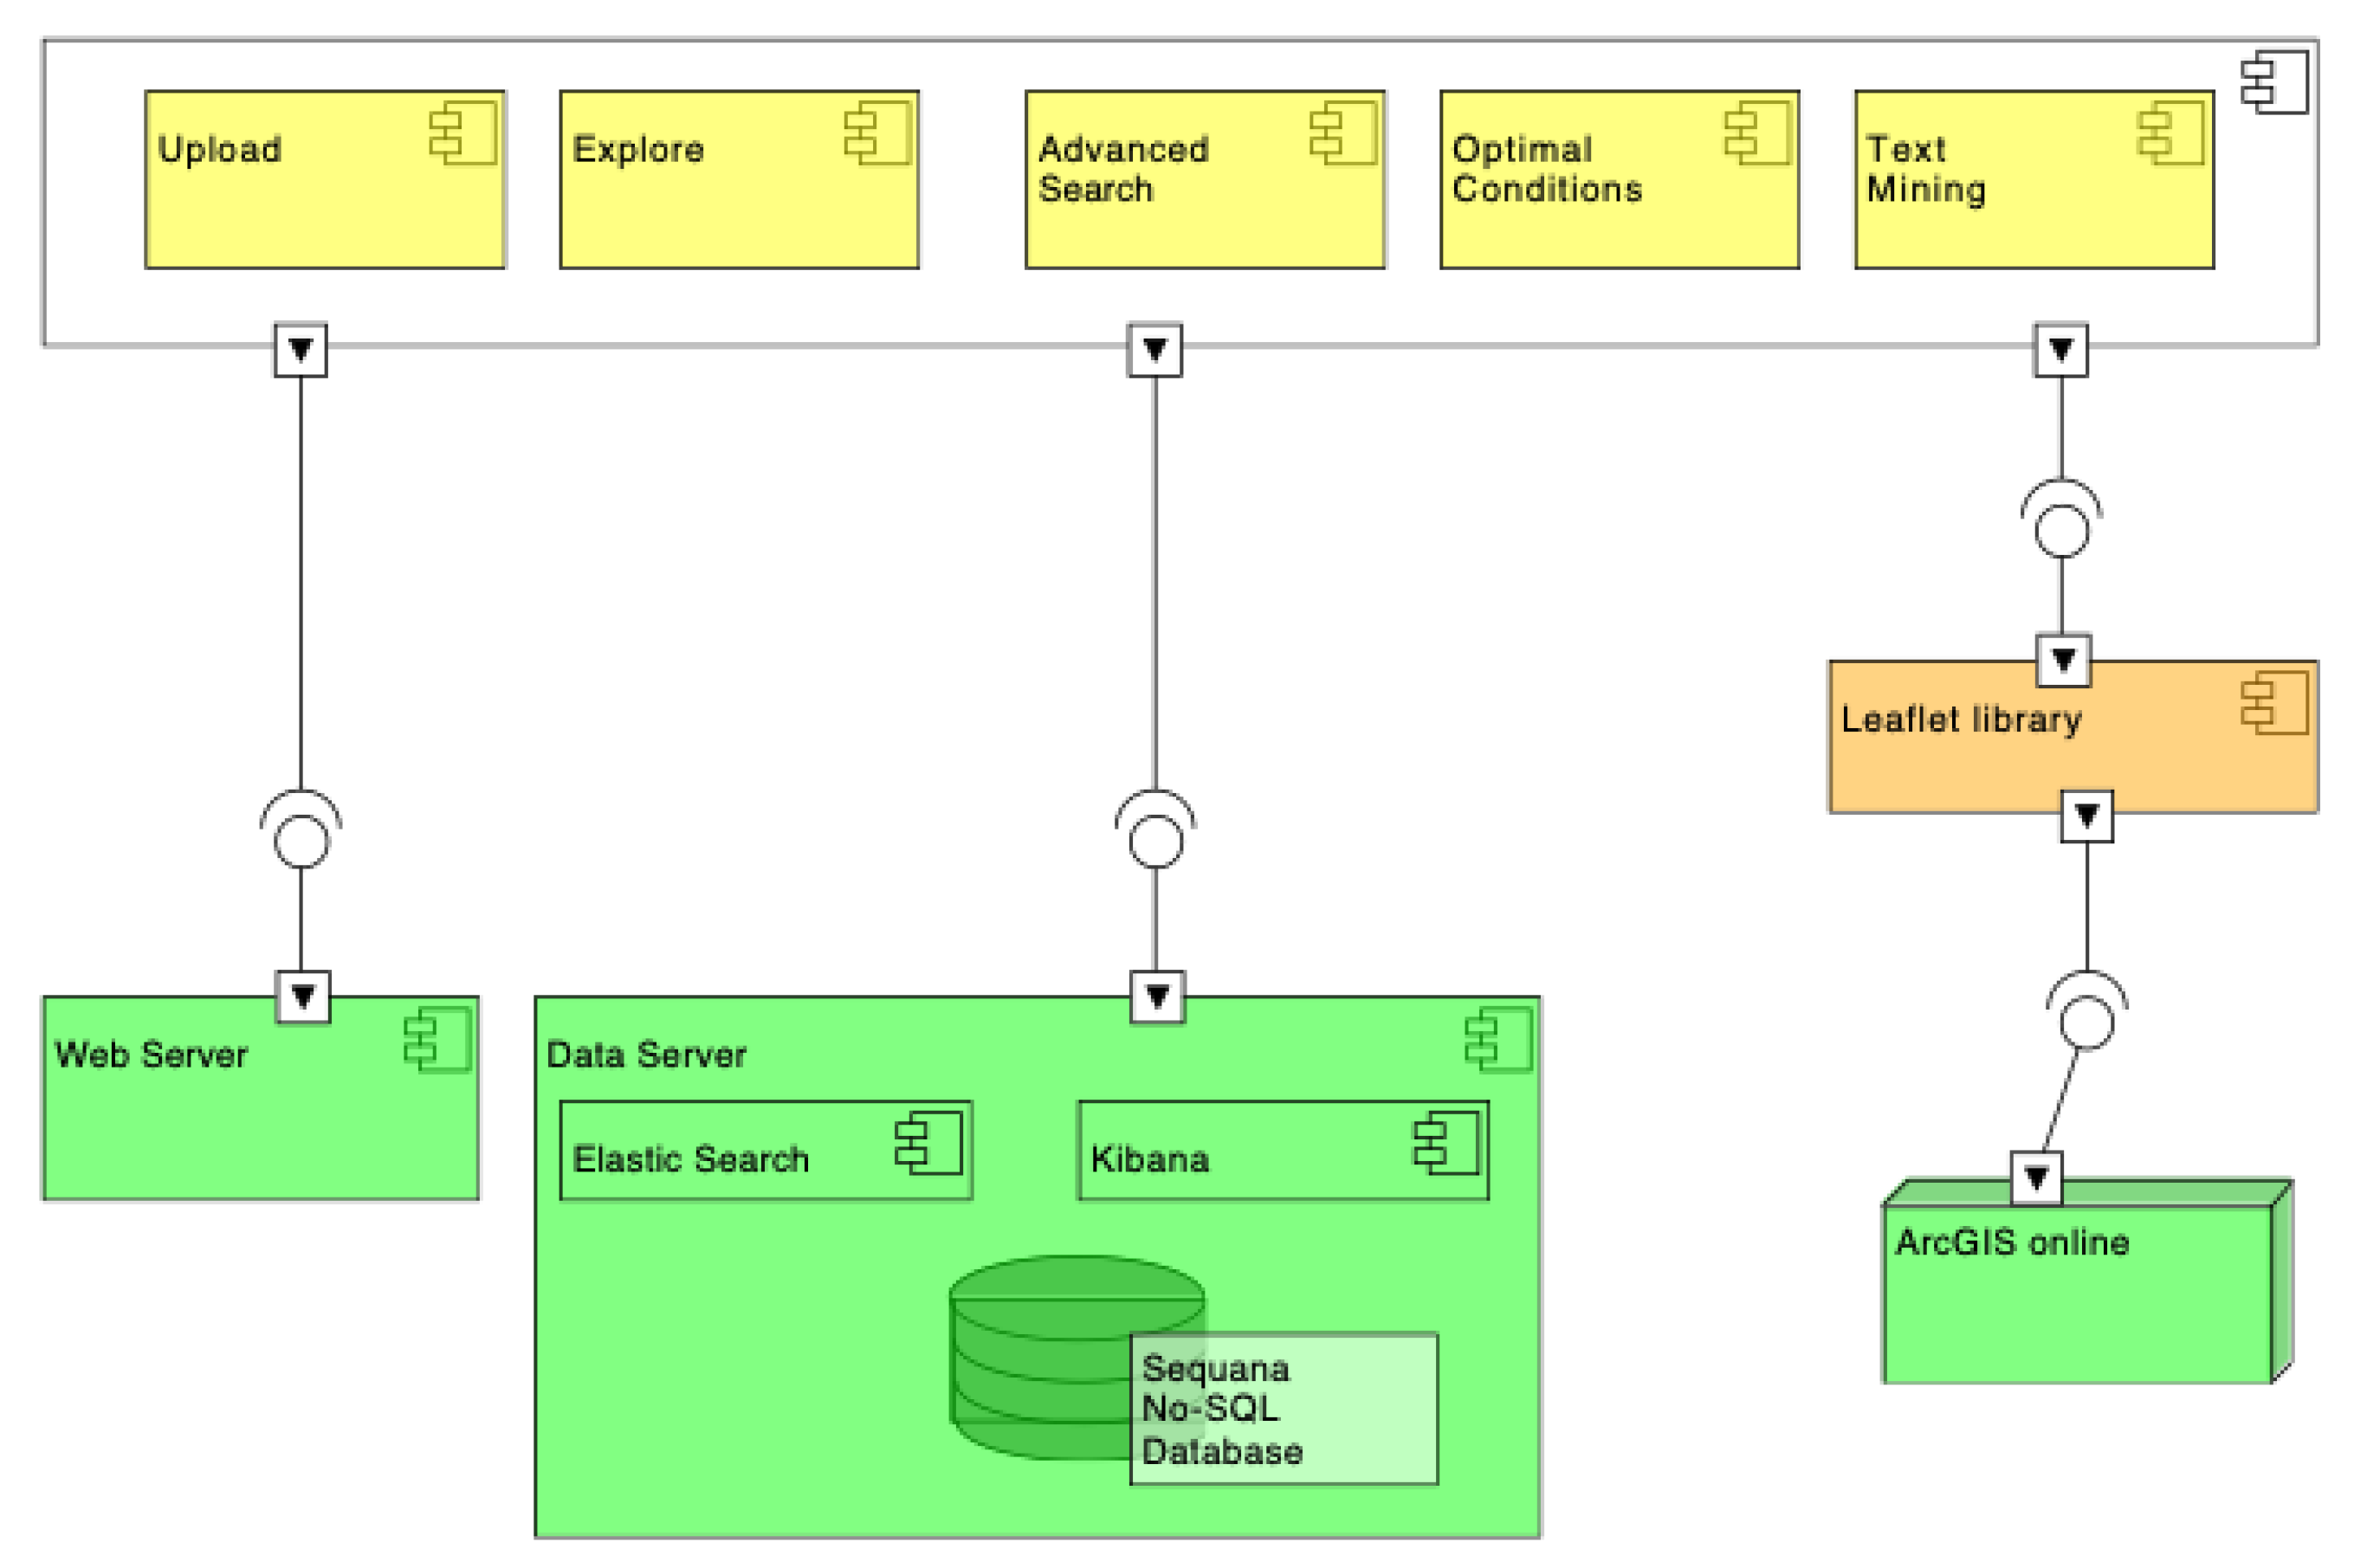
The DKP software architecture (
Figure 2) is
n-Tiers web application hosted on a big-data BULL-ATOS Sequana server. Its components listed below implement the three above-mentioned functional modules:
- -
Upload implements the function for storing on the server either data files or resources like documents, images, and videos associated to a hub;
- -
Explore implements the navigation function among the resources available on each hub;
- -
Advanced Search implements the search function on the basis of a number of criteria, including geographic references, on one or more hubs;
- -
Optimal Conditions implements the function to analyze the evolution of specific climate conditions;
- -
Text Mining implements an advanced text-analysis function on the textual corpus available on the platform;
- -
- -
the ArcGIS online server, of which the services are used by Leaflet; and
- -
The first five components have a layered MVC (Model, View, Component)-type software architecture.
In the following sections, the data-management, geographic-data-staging, and knowledge-discovery modules are described in detail with their relationships with CS features and DKP initial goals.
3. Data Management: Spatiotemporal and Geographic Context
One of the most important points of the DKP, with the aim of developing services, is its ability to store heterogeneous data for linking climate data, some of which can be georeferenced, to observations on other domains such as agriculture, health, biodiversity, or economy. For this purpose, the DKP adopts a simple but scalable data structure for storing heterogeneous data that may come from various domains and/or sources. This functionality is crucial in the development of a climate service, since it implements climate-service characteristics (
A) and (
B) defined in the
Section 1, namely, (
A) the ability to gather climate data and (
B) the gap reduction between climate data and the needs of end users. It therefore meets Objective
of climate-service design (as defined in the
Section 1) of facilitating local understanding of the climate through data exploration.
More precisely, the DKP exploits a NoSQL database known to be efficient for storing and managing massive data that structures data with JavaScript object notation (JSON) format [
9]. Two kinds of data are stored in the DKP: (i) Spatiotemporal data that relate exclusively to dated numerical values that can be linked to a geographic area (e.g., average temperature on a region, corn production on a country, and number of tourists in a city). Spatiotemporal data can be linked to the whole territory, a region, or a specific GPS point on the map. (ii) Related resources that relate to all other resources associated to the study (images, videos, documents, etc.).
Figure 3 describes the adopted structure for storing (a) spatiotemporal and (b) related resource data.
Three families of NoSQL databases can be distinguished by those based on key values, on columns, and on documents. For the DKP, we chose to use ElasticSearch that implements a document-based approach. The approach based on documents is the most powerful for data containing information with a complex structure (types, lists, nesting). In addition, ElasticSearch has the particularity of efficiently indexing textual data, thus simplifying the text-mining methods detailed below.
(i) Spatiotemporal data allow to store numerical values attached to a geographic area. (see
Figure 3a). Each spatiotemporal datum added to the DKP has to define: the date (in year-month-day format, e.g., 1960-01-01), the related country (e.g., Guadeloupe), the data domain and subdomain (e.g., domain = Climate and subdomain = Temperature), the source where the data comes from (e.g.,
French weather institute), the identifiers of the layer and the associated geographic area to make the link with the area in the geographic information system (GIS), and the stored values (e.g., min = 24 and max = 32).
Obviously, on the same date, we may have data on several countries, domains, subdomains, sources, or geographic areas. For instance, data can be provided by several sources; we may store temperature values coming from the public French Weather Institute and by independent surveys. More generally, the JSON format used by the NoSQL database of the DKP allows the structure to grow easily by adding new branches to the underlying structure. Finally, geographic areas are stored into GeoJSON files [
10] that contain all unit areas in which data can be associated. Obviously, several GeoJSON files can be uploaded to associate data with different geographic divisions.
(ii) Related-resource data cover all related resources that have to be stored. This may be pictures, videos, documents, or external links. Each resource added to the DKP is described by using the Dublin core metadata [
11], and it defines: the related country (e.g., Guadeloupe), the type of resource (e.g., document), the label given to the resource (e.g., survey on rainfalls), the domain of the resource (e.g., climate), the source from where the data come (e.g., French Weather Institute), the creation date (e.g., 2017-01-01), the associated description and keywords (e.g., description = survey conducted by the French Weather Institute on rainfall in the last decades, and keywords = climate; rainfall), the geolocation, if known, by specifying latitude and longitude, and the associated file that has to be stored (e.g., survey-fwi-rainfall.pdf).
Thus, for a given country, resources are stored in a JSON table to index all these associated resources. As for spatiotemporal data, the data structure adopted here can easily evolve, and allows to store data coming from different countries, types, or sources.
Thus, the DKP includes two modules that facilitate data visualization and management.
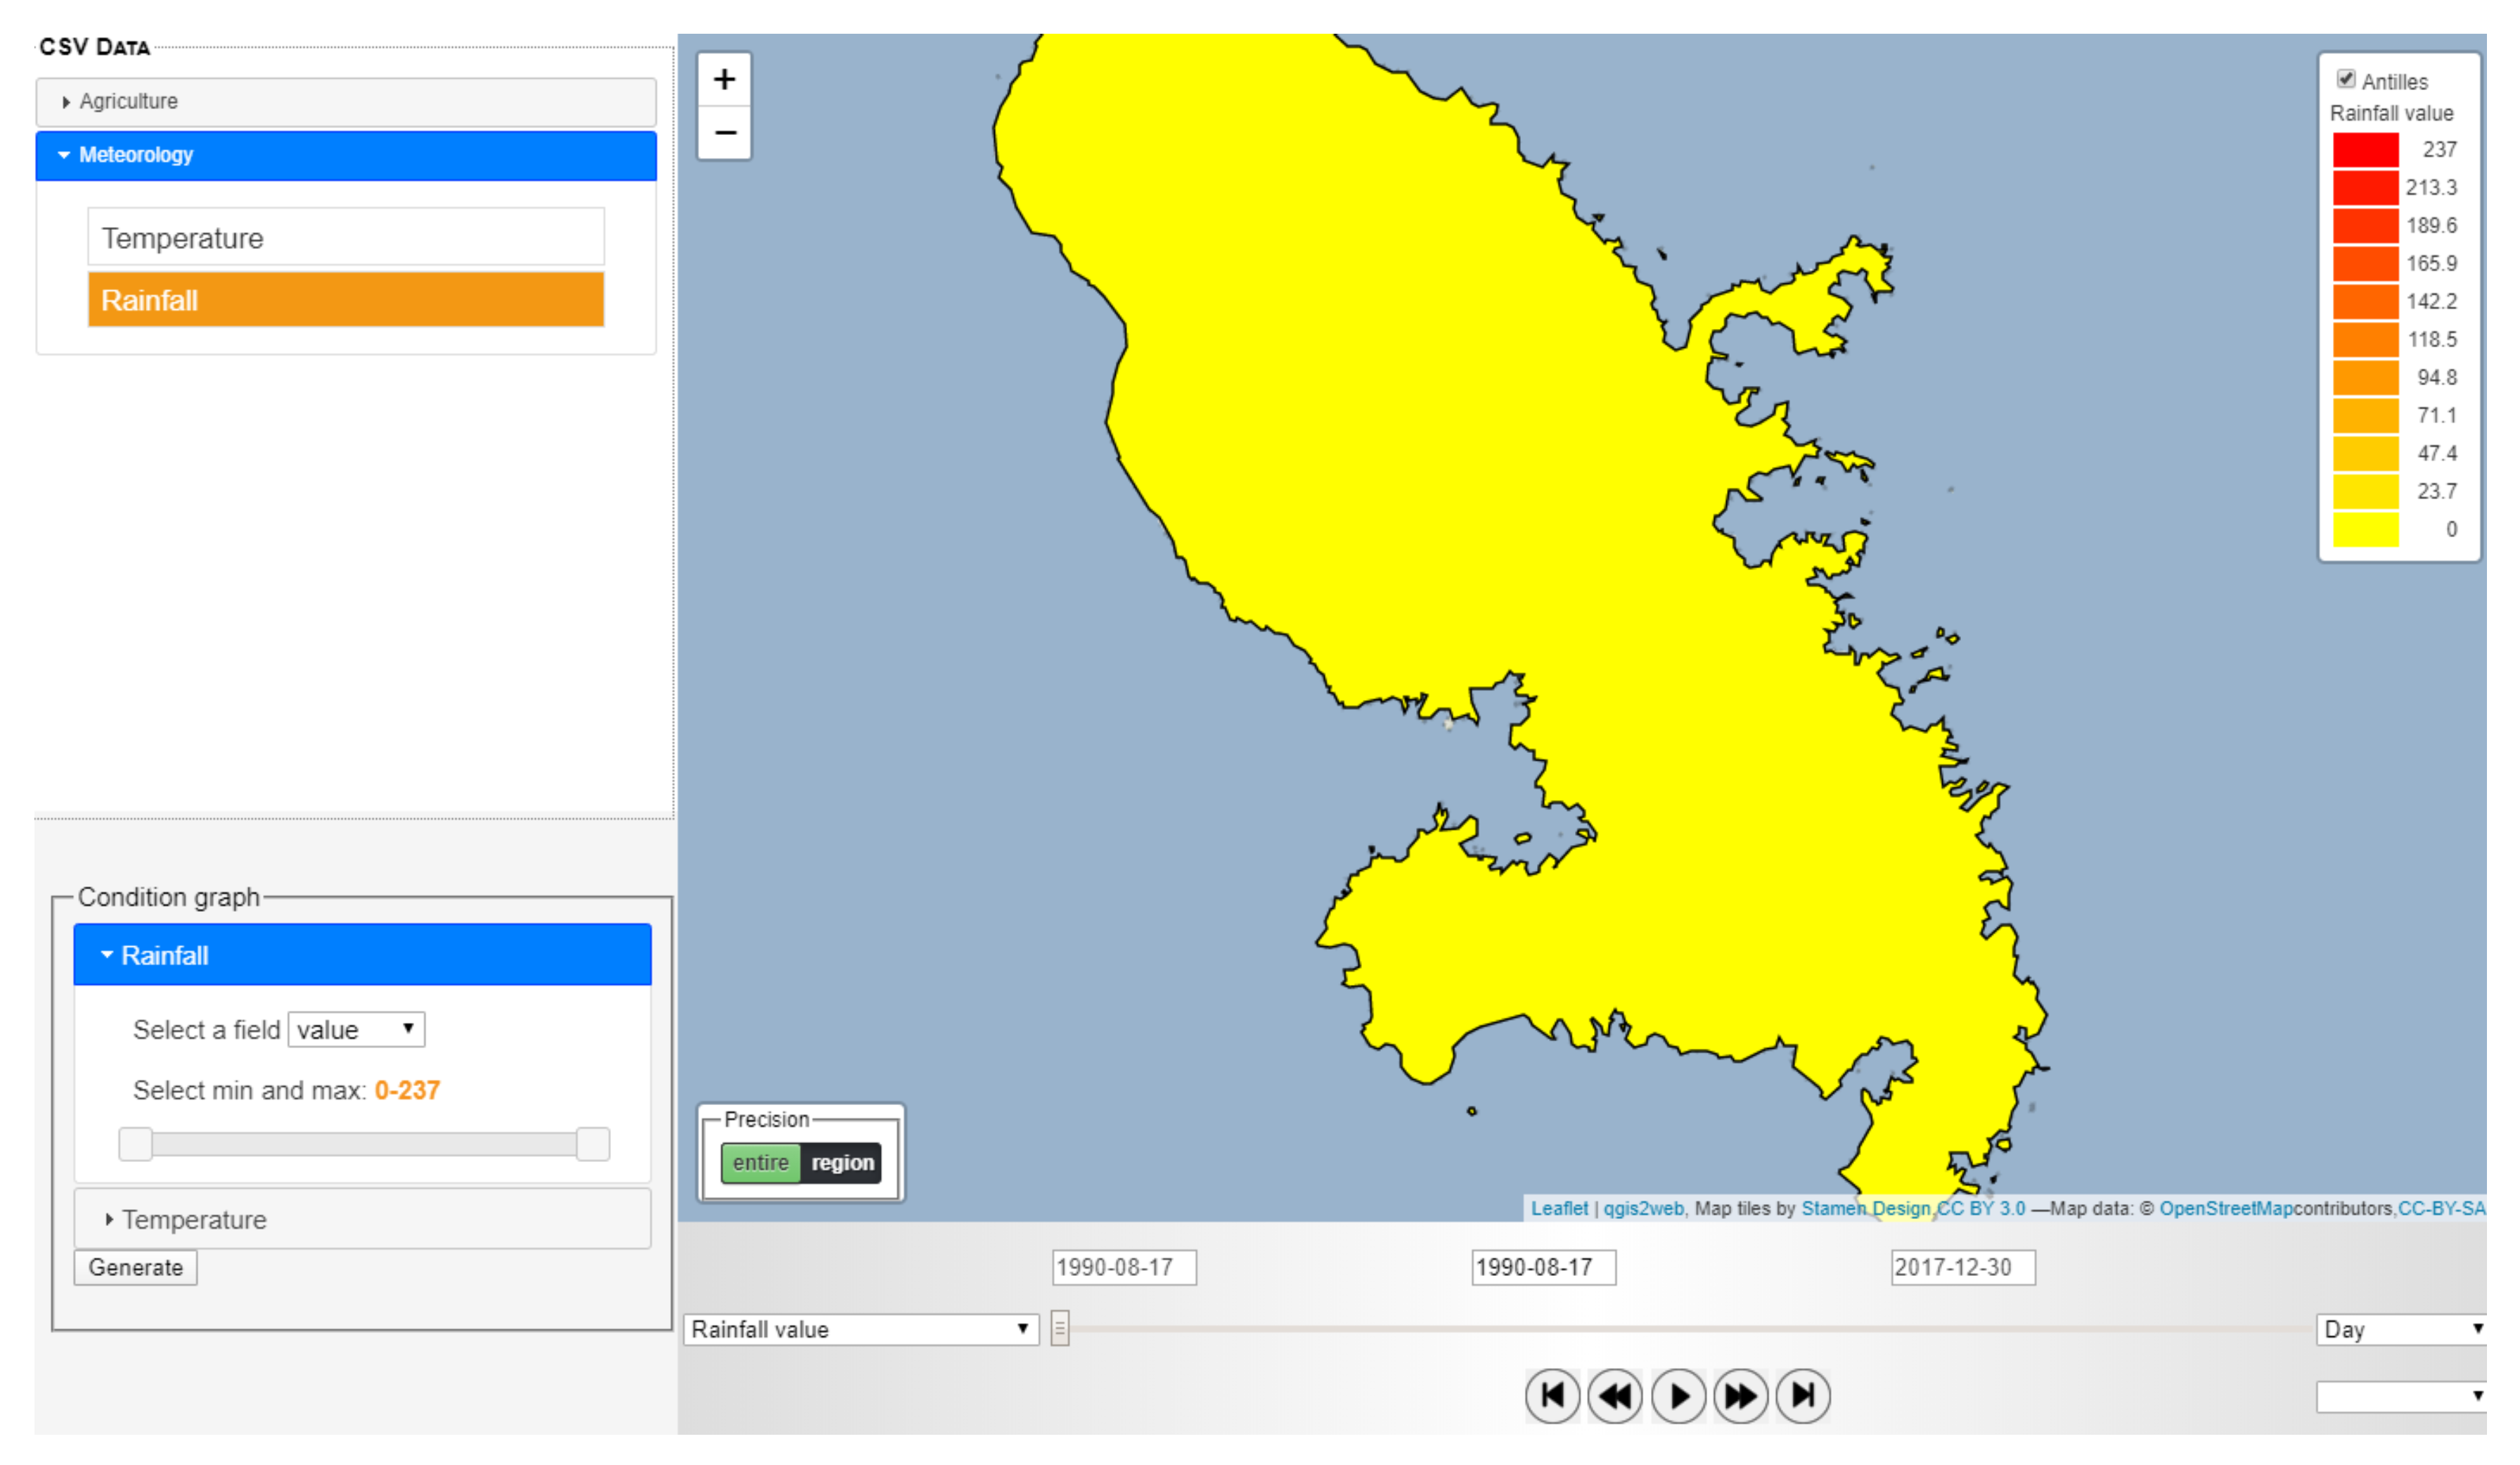
A data-exploration module that facilitates data visualization. For instance,
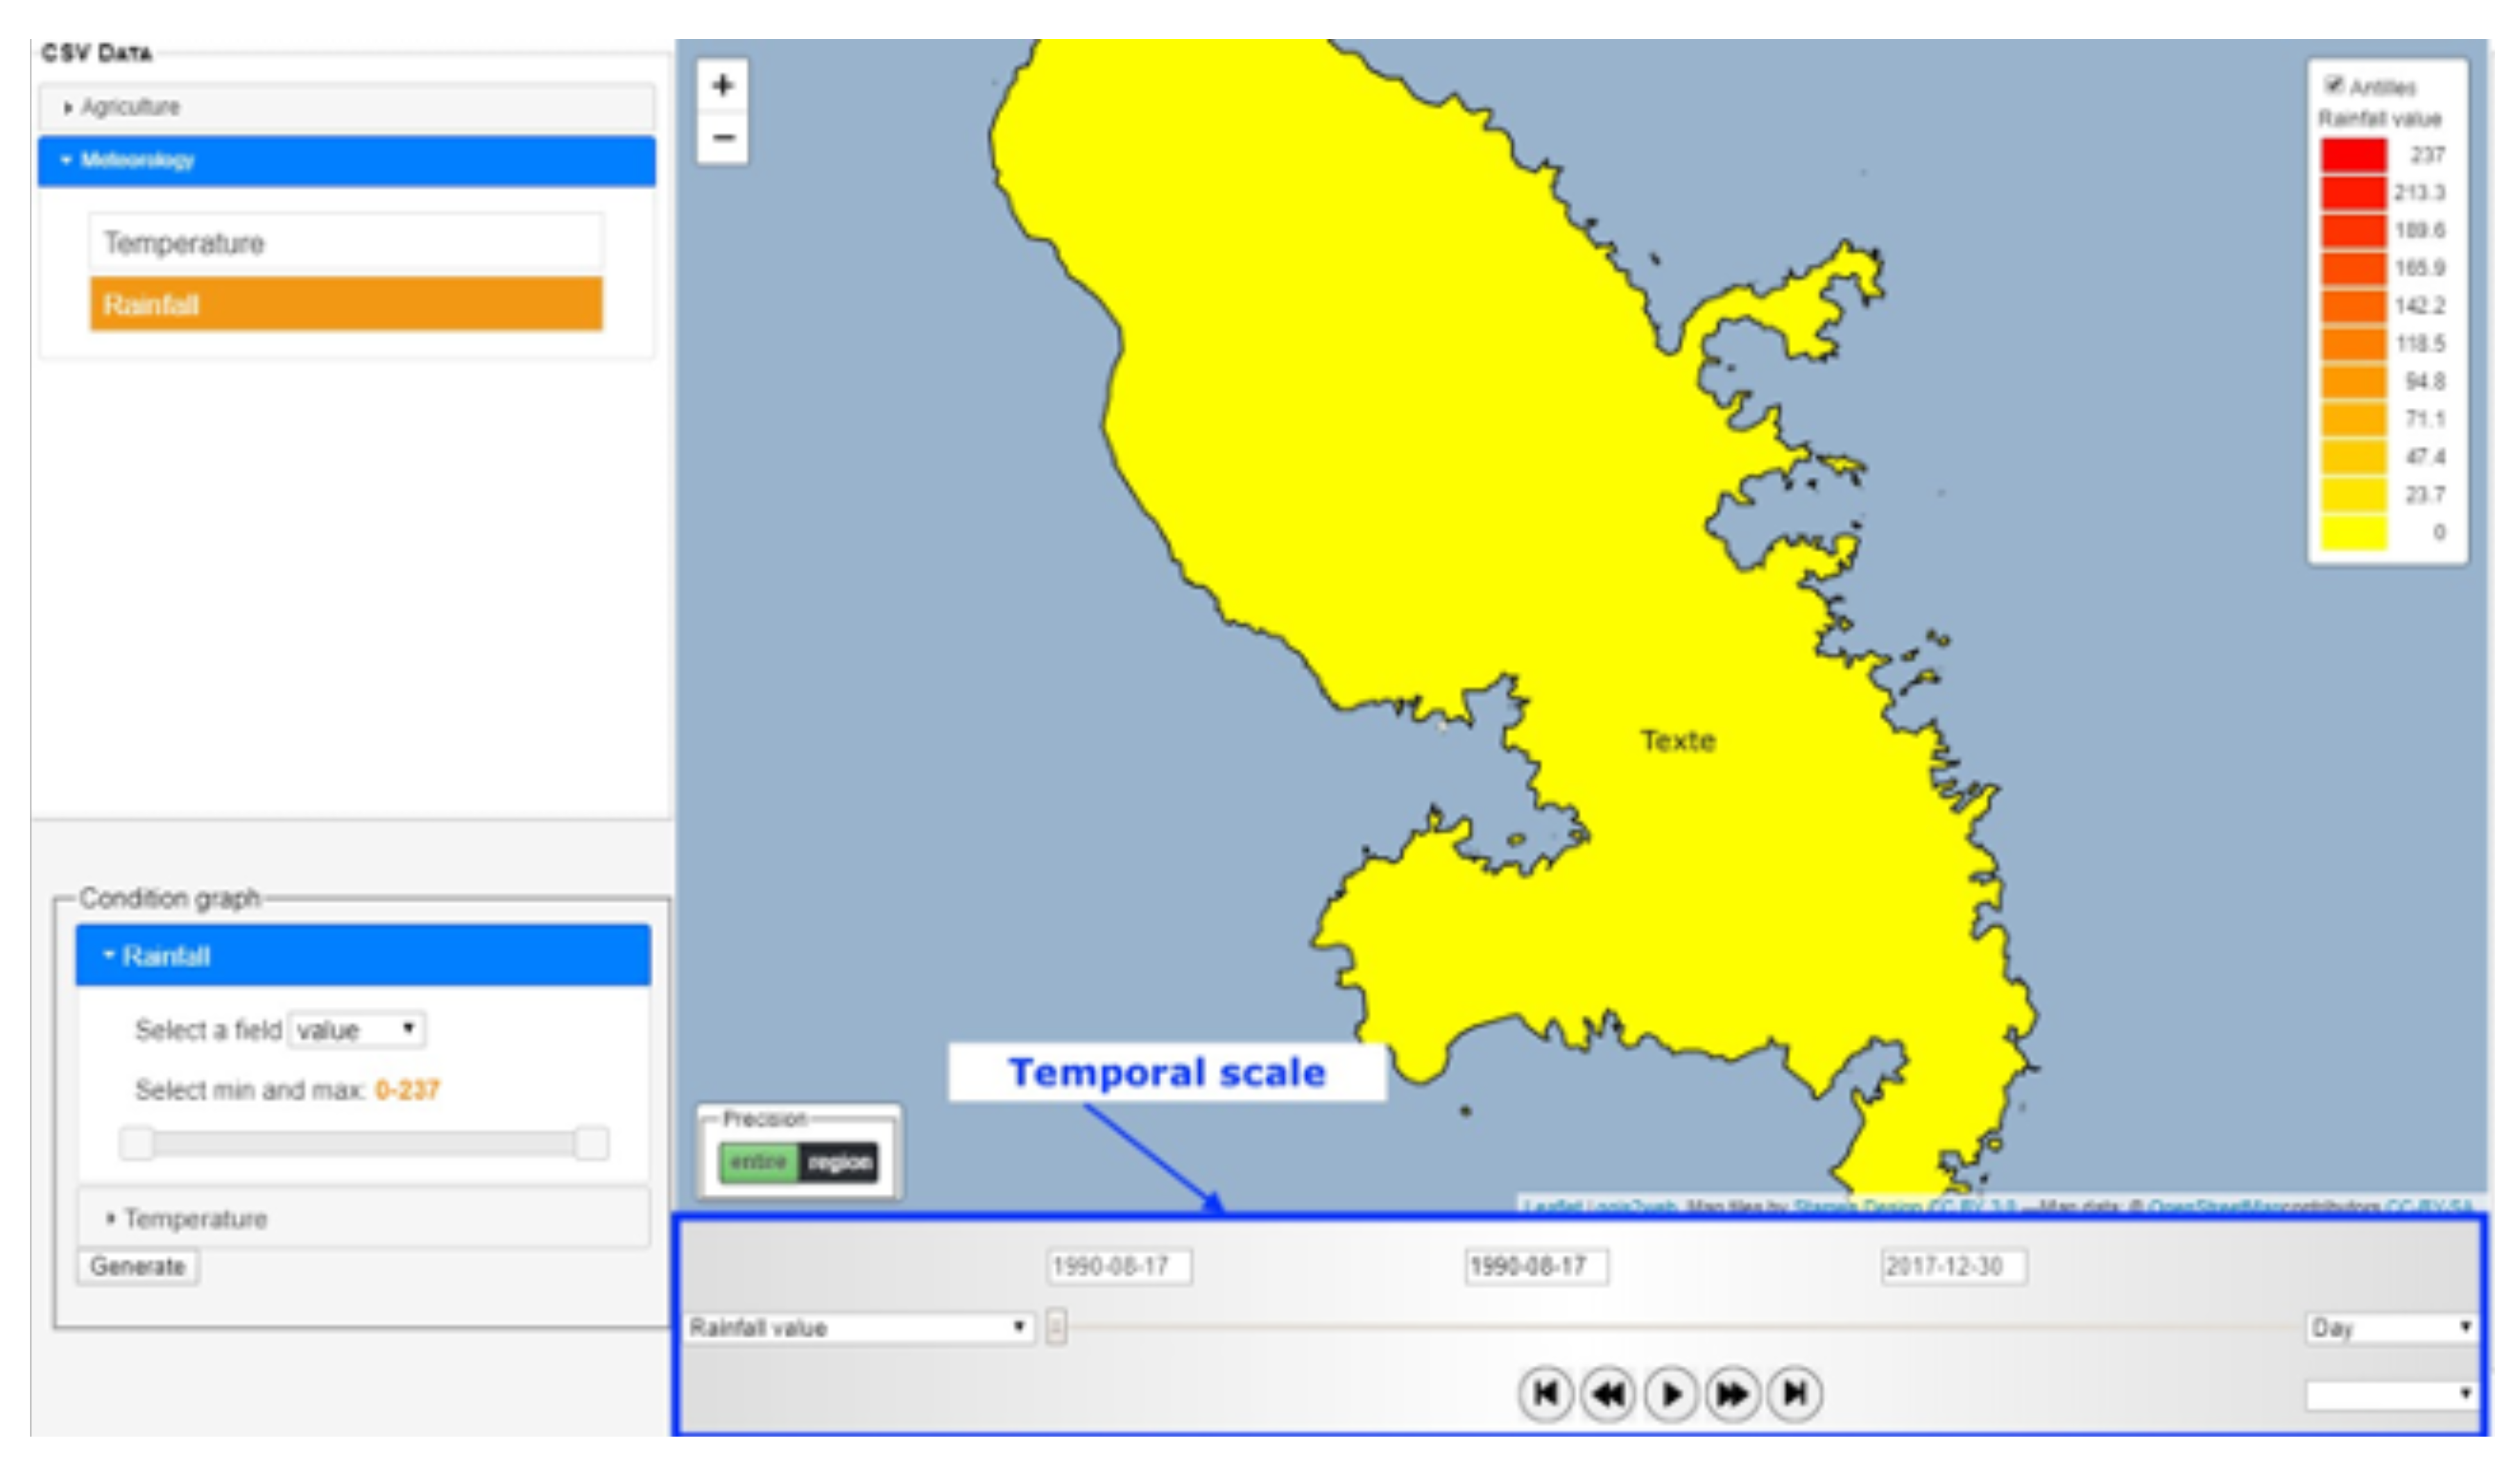
Figure 4 shows how spatiotemporal data and resources are displayed in the DKP exploration module. The left panel of the application allows to choose one of the spatiotemporal data added to the application. Once spatiotemporal data are selected, they can be visualized on the center panel on a map through the GIS. On the example of
Figure 4, rainfall data collected on the whole Martinique island on a given date are displayed in the center. Finally, the right panel of the application is devoted to the visualization of related resources. This interface also allows to delete or update existing resources.
A data-upload module that facilitates imports into the NoSQL database of the DKP. Indeed, the backend part of the DKP implements several forms to simplify imports of spatiotemporal data and resources. For instance,
Figure 5 shows the form that allows users to add new resources into the DKP. Once the form is completed, the building process of the underlying JSON document and the insertion into the correct branch of the NoSQL database is automatically performed by the DKP. In addition, during the import process of spatiotemporal data, the user may import data time series by providing a CSV file containing dates. When data are uploaded, the user may choose to link data to the whole territory, a given region, or a specific GPS point.
4. Geographic Staging of DKP Resources
Another important feature of the DKP is the ability to dynamically visualize on a map previously stored and organized spatiotemporal data in order to meet Objective G2, i.e., support users in managing climate-related risks. For this purpose, a geographic information system (GIS) [
12] was integrated to manage cartographic data. GIS are particularly well-suited for manipulating georeferenced data as they facilitate their treatment by offering multiple tools to store, analyze, and display them. A user who has uploaded spatiotemporal agricultural data about sugarcane plantations in a given geographic region can use the graphical interface of the DKP in order to see their spatial distribution on a map and their evolution over time thanks to a slide allowing to navigate past, present, and future values. Related-resource data can also be represented as points on a region map.
These resources are linked to keywords so they can be queried using geographic-information-retrieval tools. For instance, pictures or texts associated to a location may be accessible on the map while using the DKP for visual analysis. This additional information may be particularly useful for the user as they try to better understand the context.
The DKP offers multiple tools allowing the user to perform data staging in order have a more accurate view of the stored data. In
Figure 4, we can see the DKP interface allowing to dynamically visualize spatiotemporal data over the selected time periods. The type of displayed spatiotemporal data can be chosen on the left panel. Data are organized into main categories such as agriculture or meteorology. The central panel shows the map of the concerned region. By default, an entire selected region is displayed, here being the island of Martinique, but the user can zoom in or out by using dedicated buttons on the top left of the map or by scrolling up or down when the cursor is positioned on the map. A color scale shown on the upper-right part of the map is used to graphically represent the data values. The user can choose to consider the whole region as a single part, or to see multiple subregions (towns, localities, etc.). By moving the slide under the map from left to right, the user can see the evolution of the selected dataset over the time. It is possible to change the considered timescale (minutes, months, years) with a menu on the right of the slide as shown in
Figure 6. The dates corresponding to the beginning of the available time period, current position of the slide, and end of the period can be seen in the left, center, and right boxes above the slide, respectively. At the bottom of the center part, a media-player-type interface is available in order to play, stop, rewind, and accelerate the visualization according to the selected timescale. This is a very useful feature as it allows the user to create, view, and compare different scenarios about the evolution of spatiotemporal data such as crop quantities. Specifically, meteorological-projection data that are estimates of future climate characteristics, such as temperature or precipitations, based on more or less optimistic representative-concentration-pathway (RCP) scenarios, can be integrated in the DKP as spatiotemporal data in order to assess the sustainability of a crop in the future.
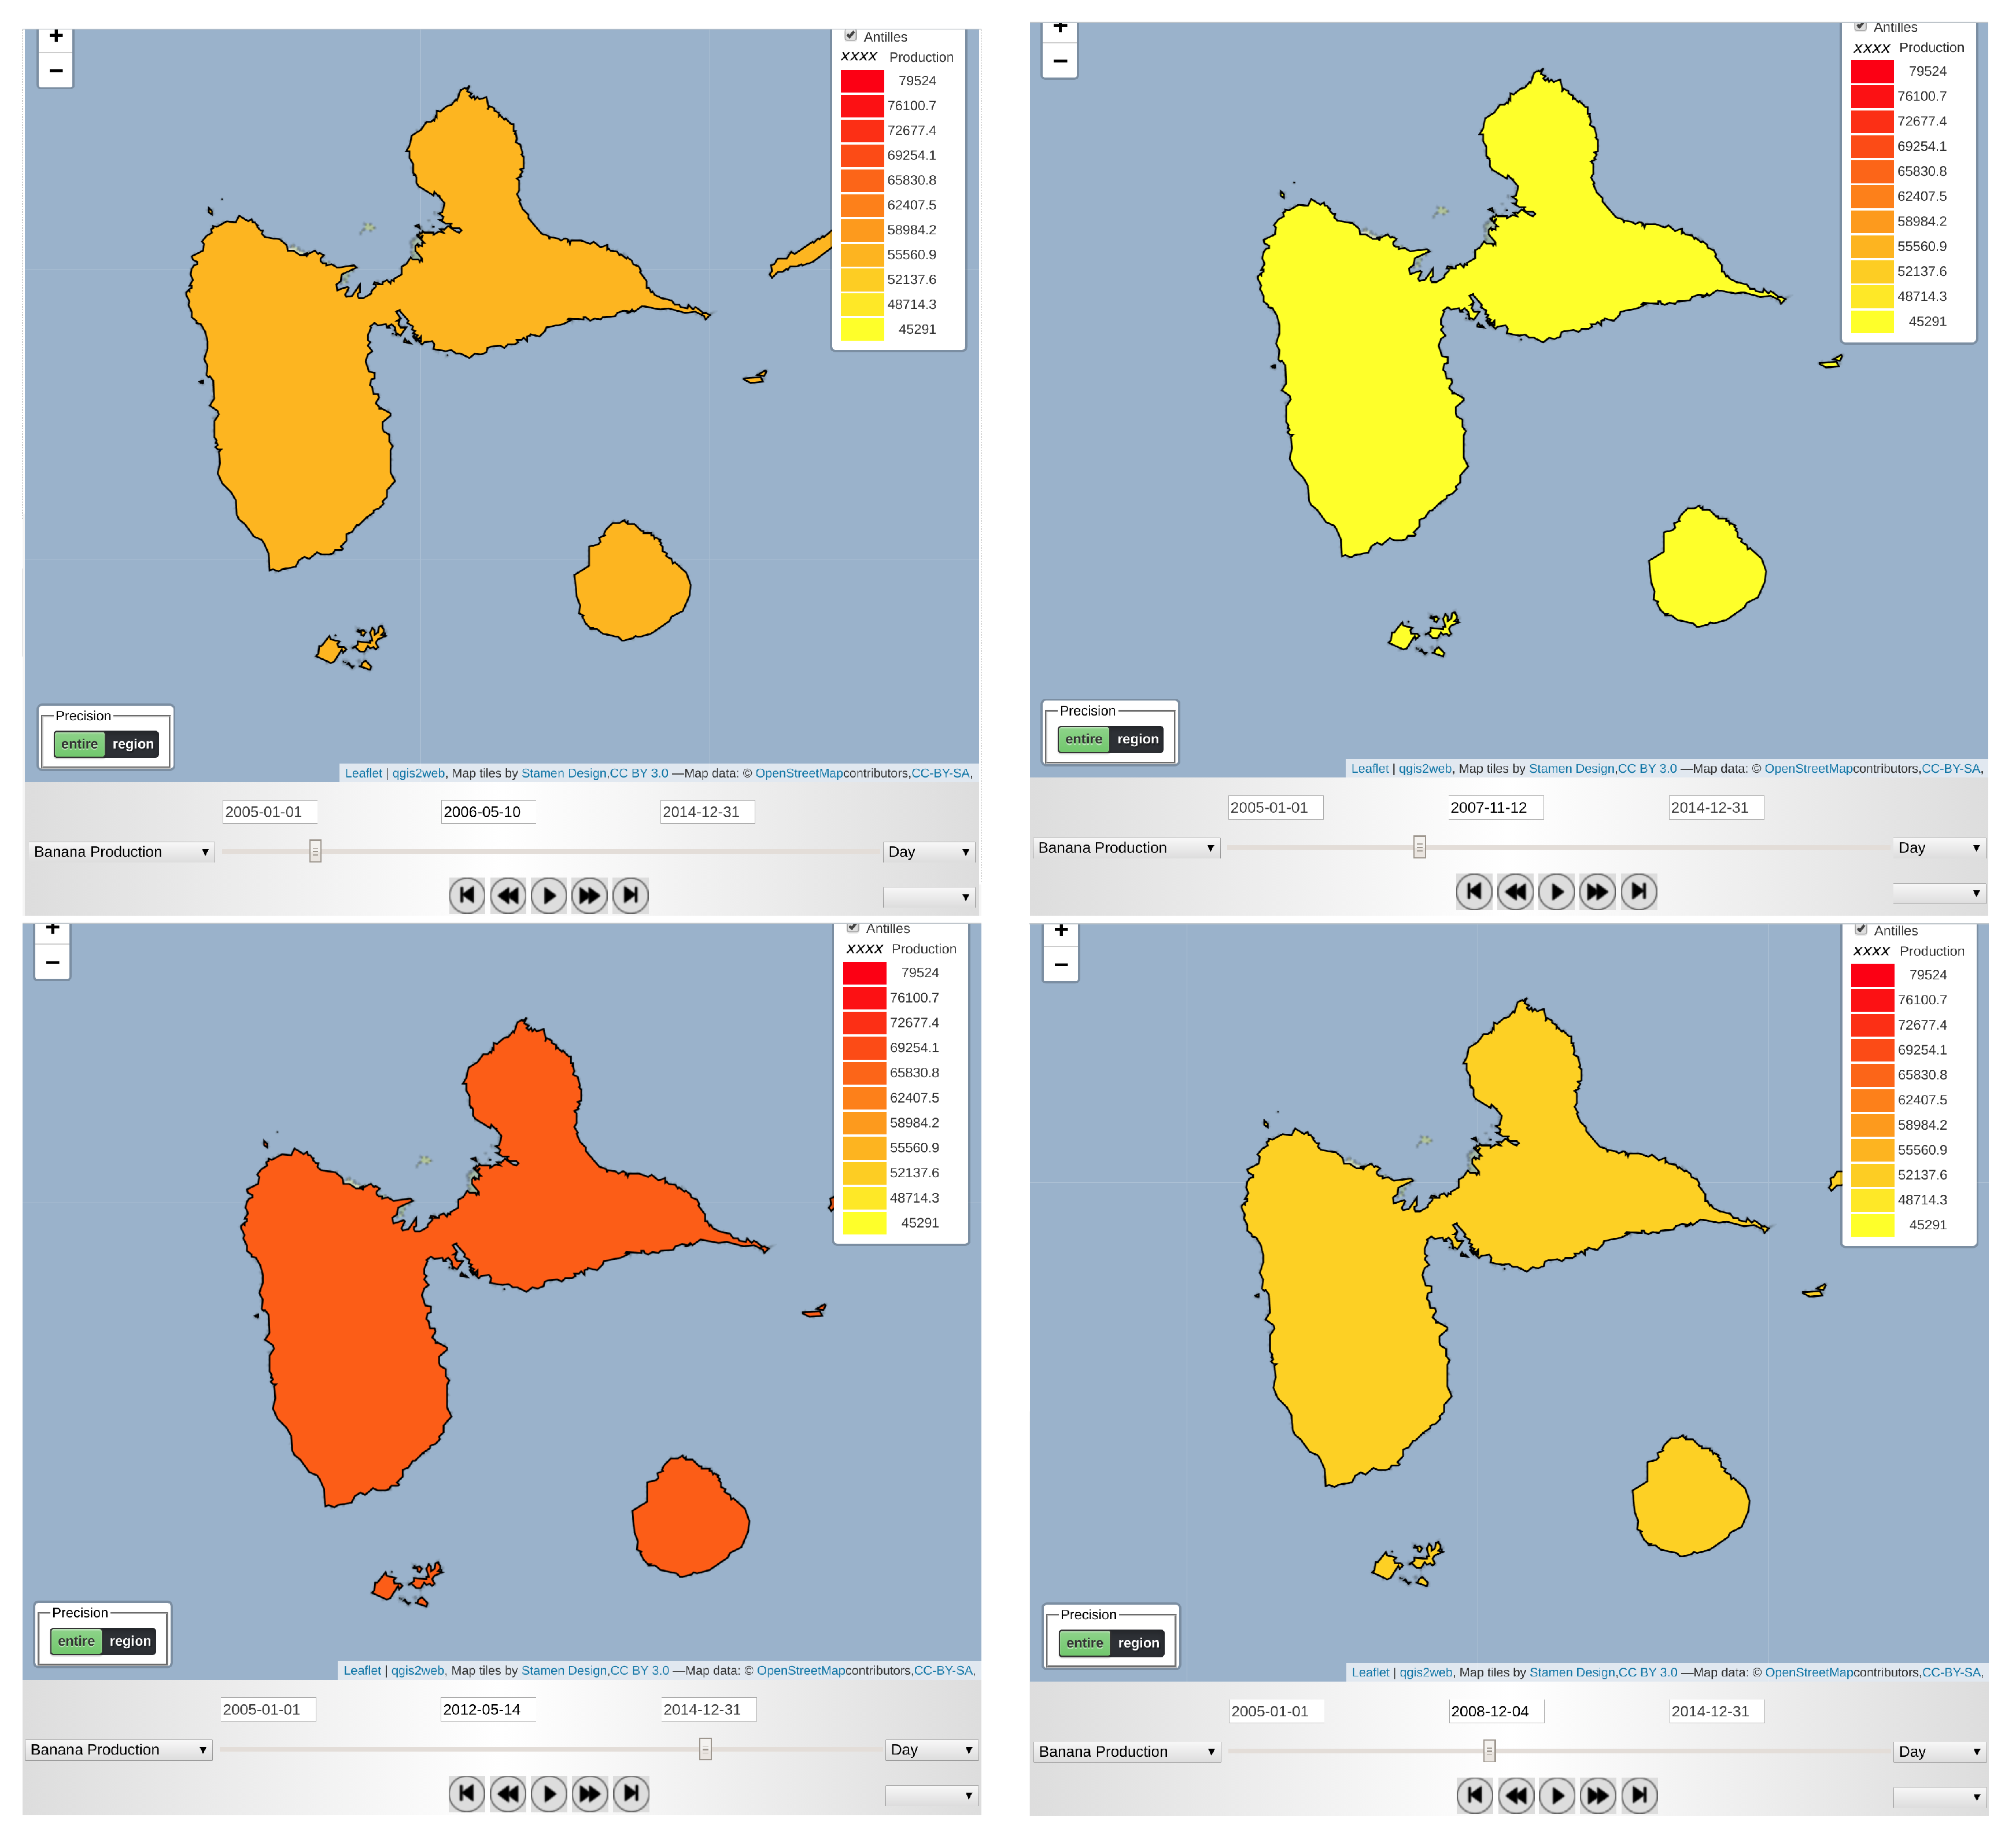
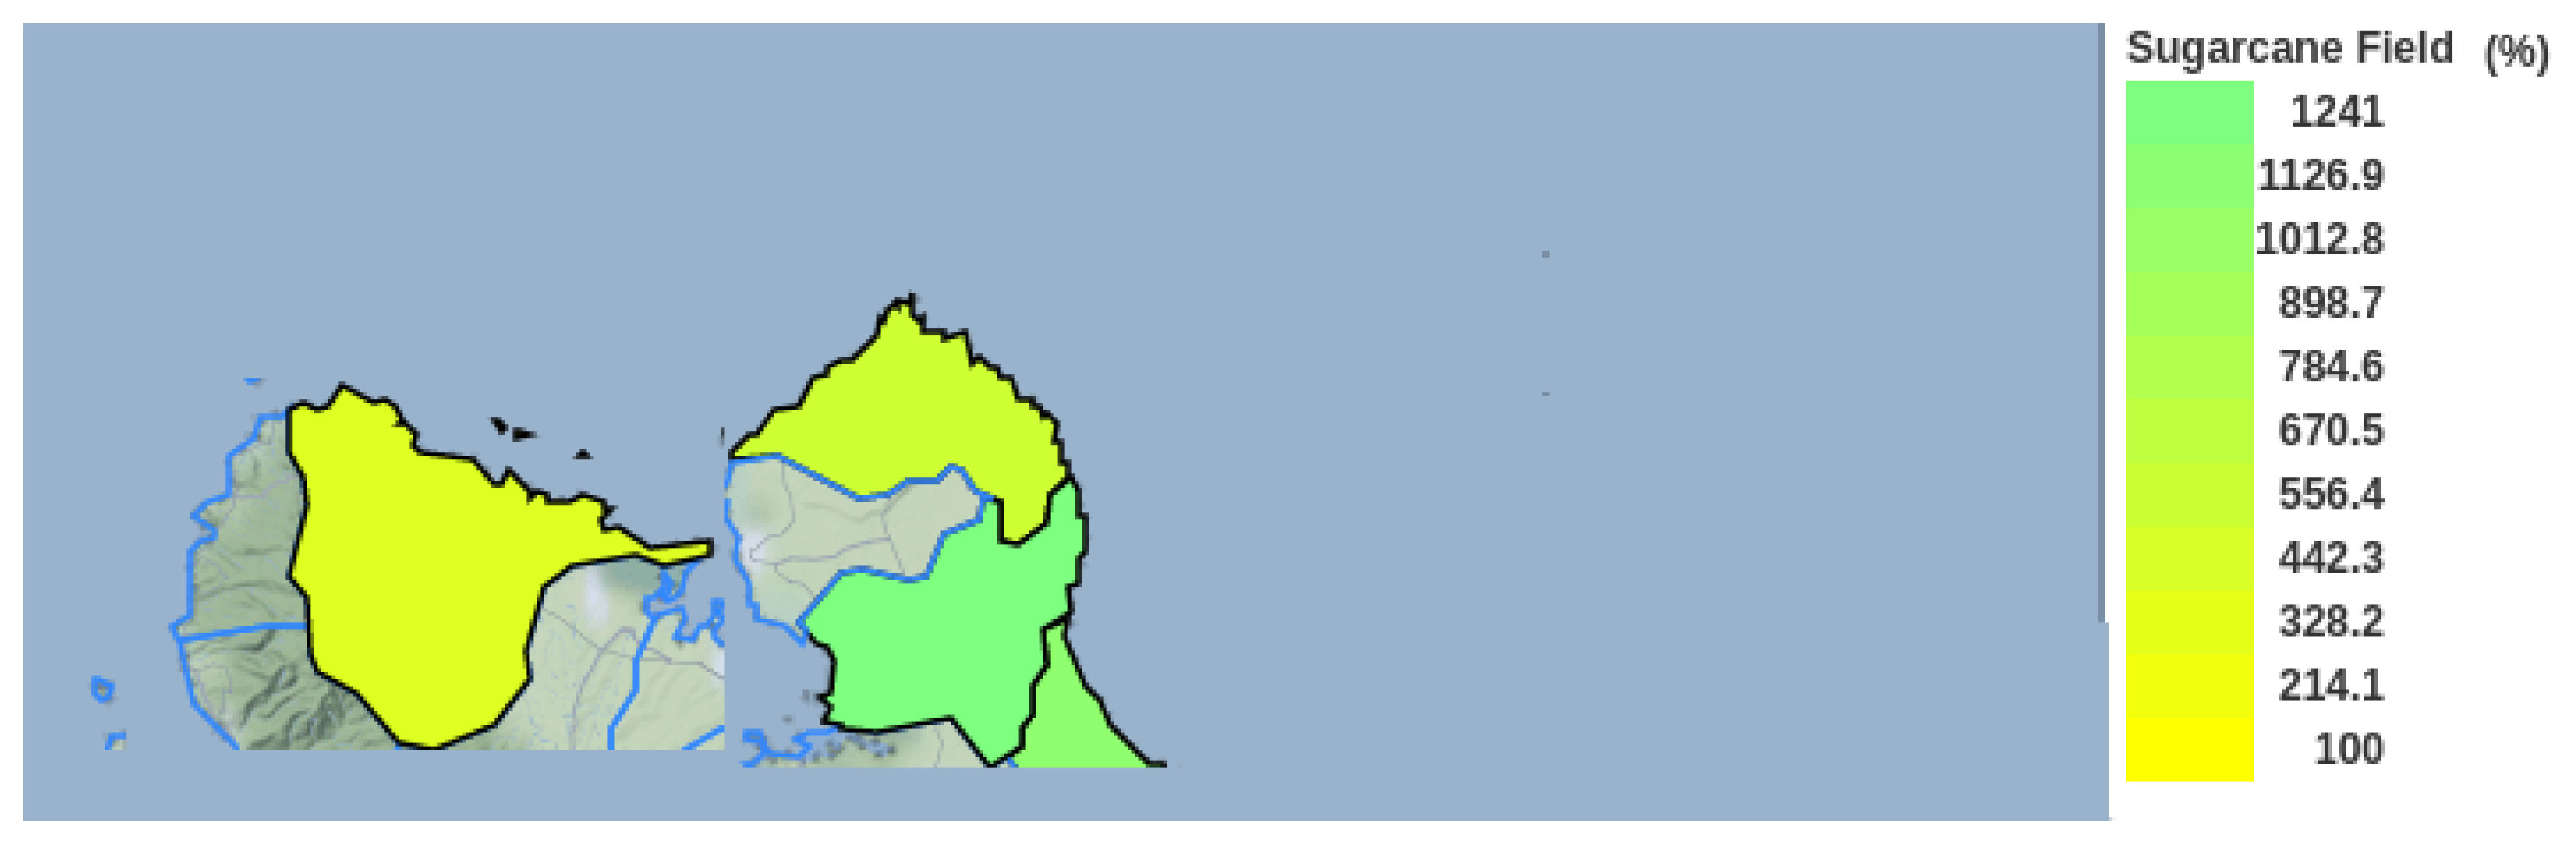
Figure 7 shows an example of the use of DKP data on given crop data on the island of Guadeloupe at different times. The slider was moved from one picture to another, and the represented value on the map (surface area of the crop) evolves over time.
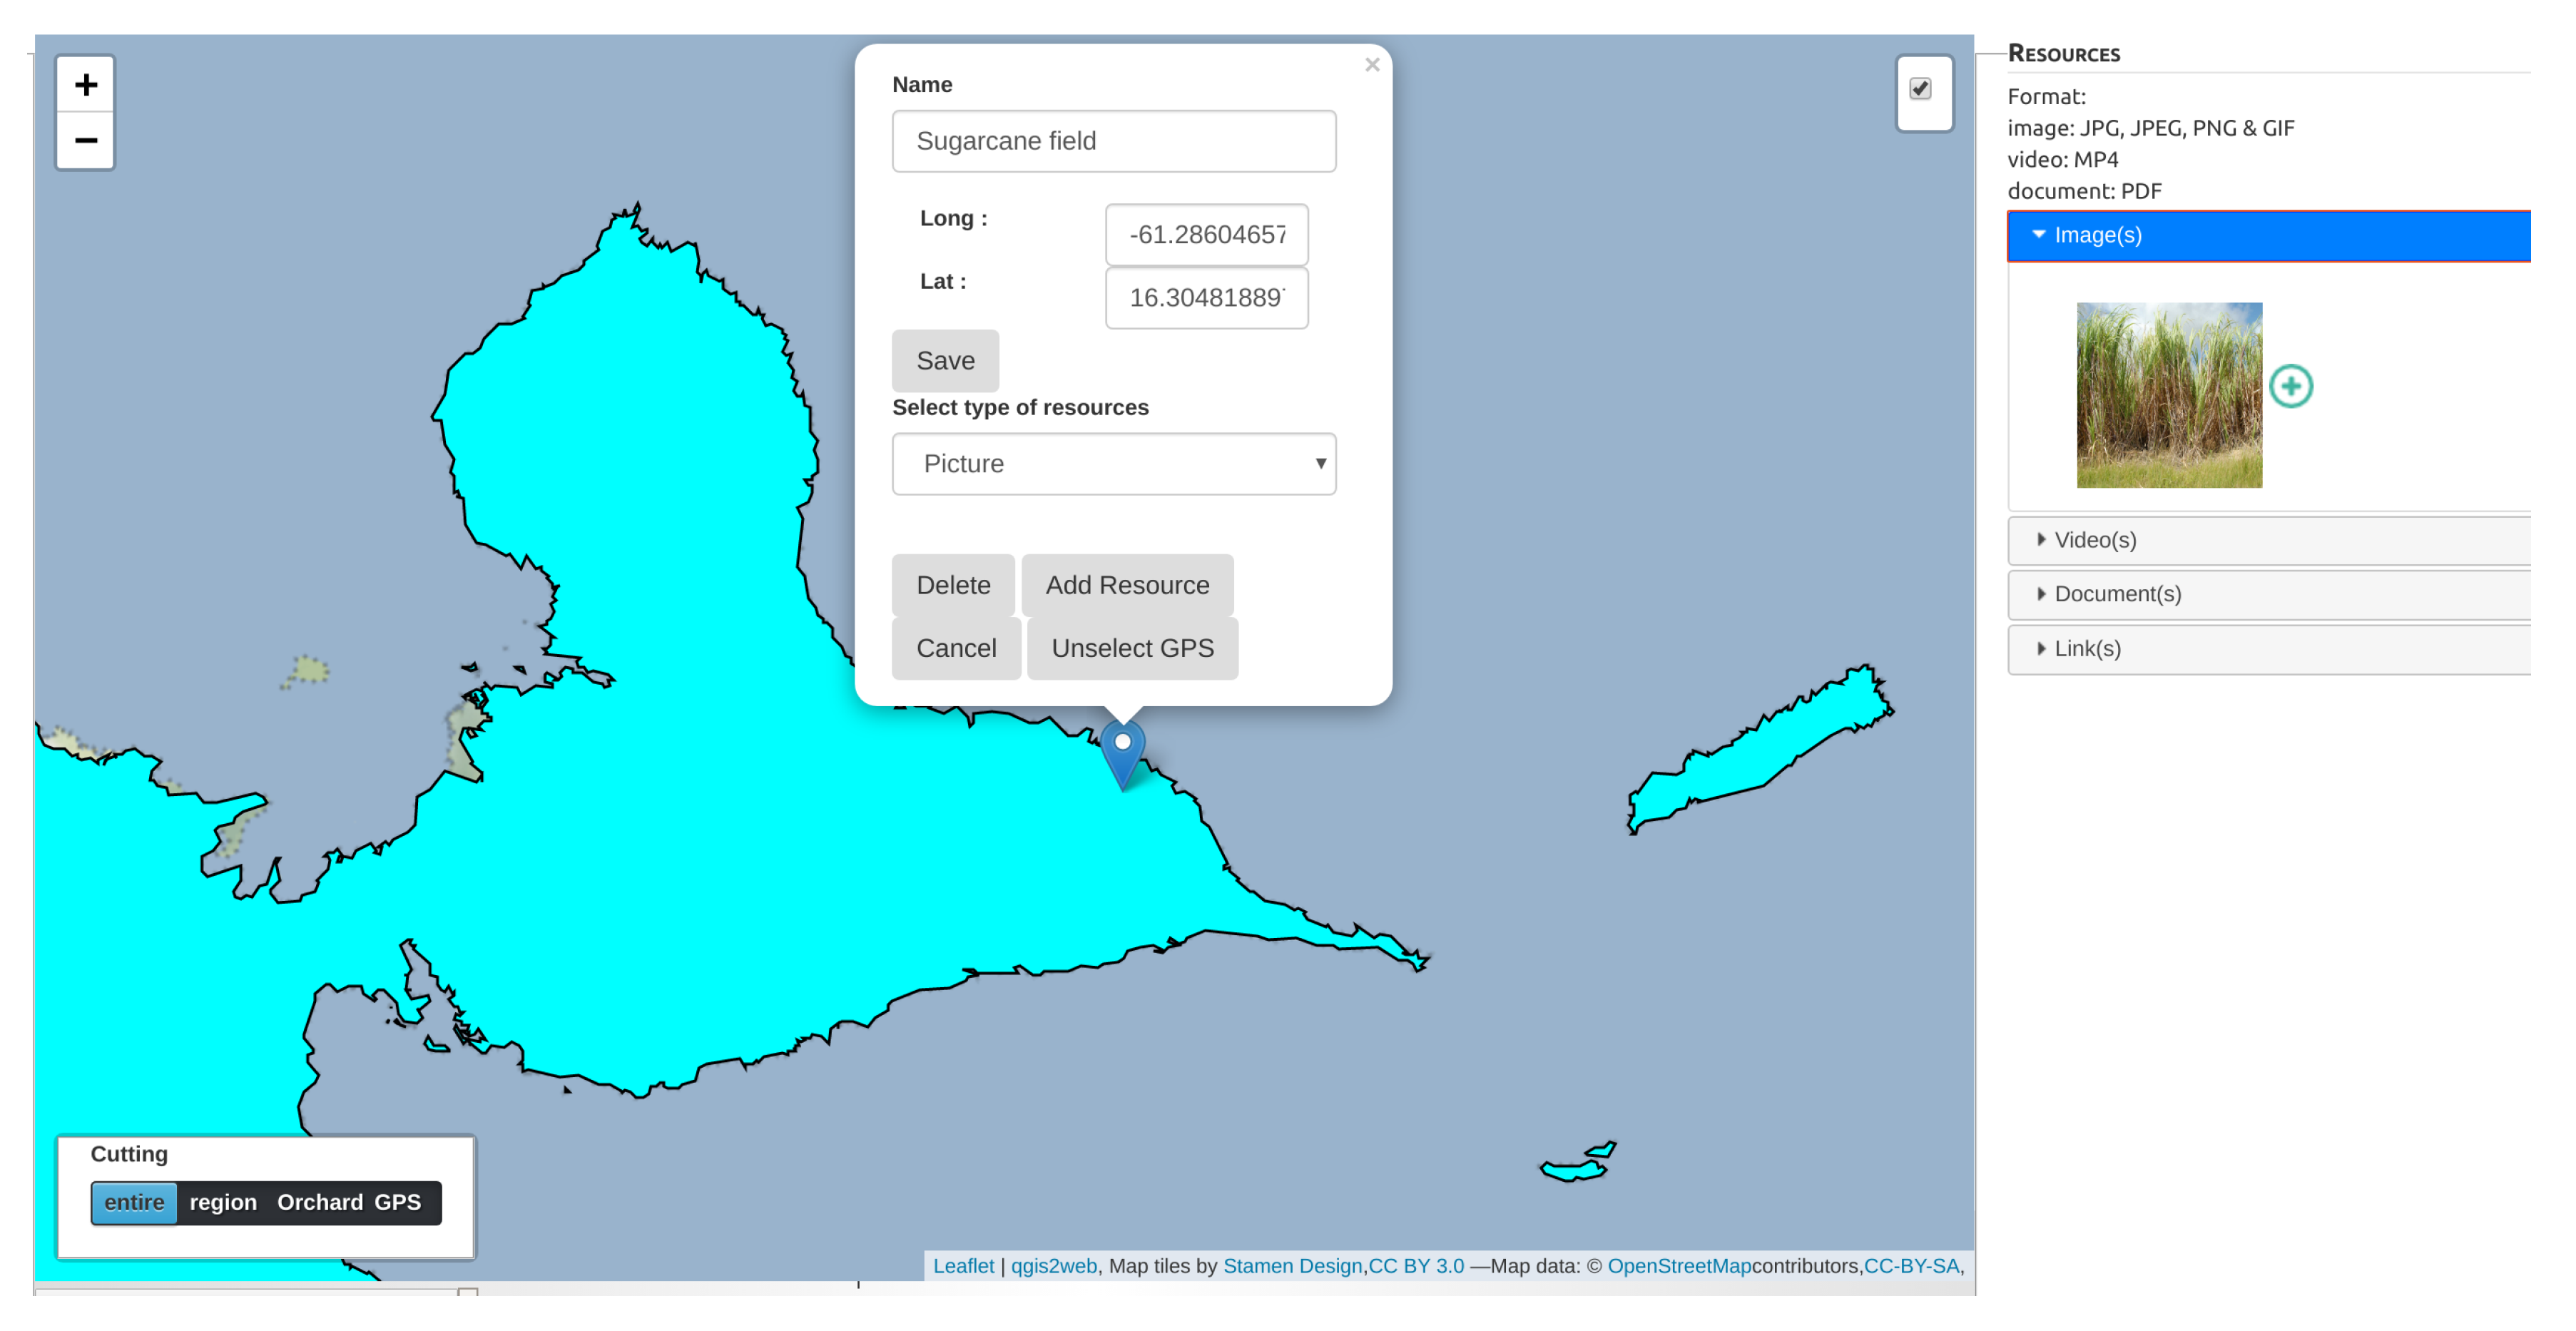
Figure 8 shows an example of resource data associated to a point on a map through its latitude and longitude co-ordinates. Here, it is a picture of a sugarcane field is linked to its actual georeferenced position. After clicking on the point of interest, a menu allows to select all related data on the resource menu on the right. All unrelated resources to the point disappear so that the user can focus on the desired data.
From a technical point of view, when the user creates a geographic point, its co-ordinates are stored into the NoSQL database of the architecture. When resources are added to the DKP, their co-ordinates are also stored in a dedicated table. When a point is selected, an SQL query searches for all resources matching its co-ordinates. They are then displayed in the corresponding menu.
5. Knowledge Discovery and Geographic Resources
In the previous sections, we showed how the DKP is used to store heterogeneous data and stage them through a GIS. The last important feature of the DKP is its ability to explore and analyze all data uploaded through two analytic approaches that work on data: (i) a data-search module that allows users to search and filter data in DKP via a search engine, (ii) a knowledge-extraction module that only focuses on climate data and searches for the evolution of specific climatic conditions given by a domain expert, and (iii) a text-mining module that allows users to analyze all documents either associated to a hub or resulting from a search. As described in climate-service characteristics
D and
E (
Section 1), this functionality is important for the development of climate services since it highlights useful knowledge for climate adaptation. Such knowledge can then be used to support decision making. These modules thus aim to fully respond to two of the main objectives of climate-service design described in the
Section 1: (2) support users in managing climate-related risks and (3) support the co-design of a climate service.
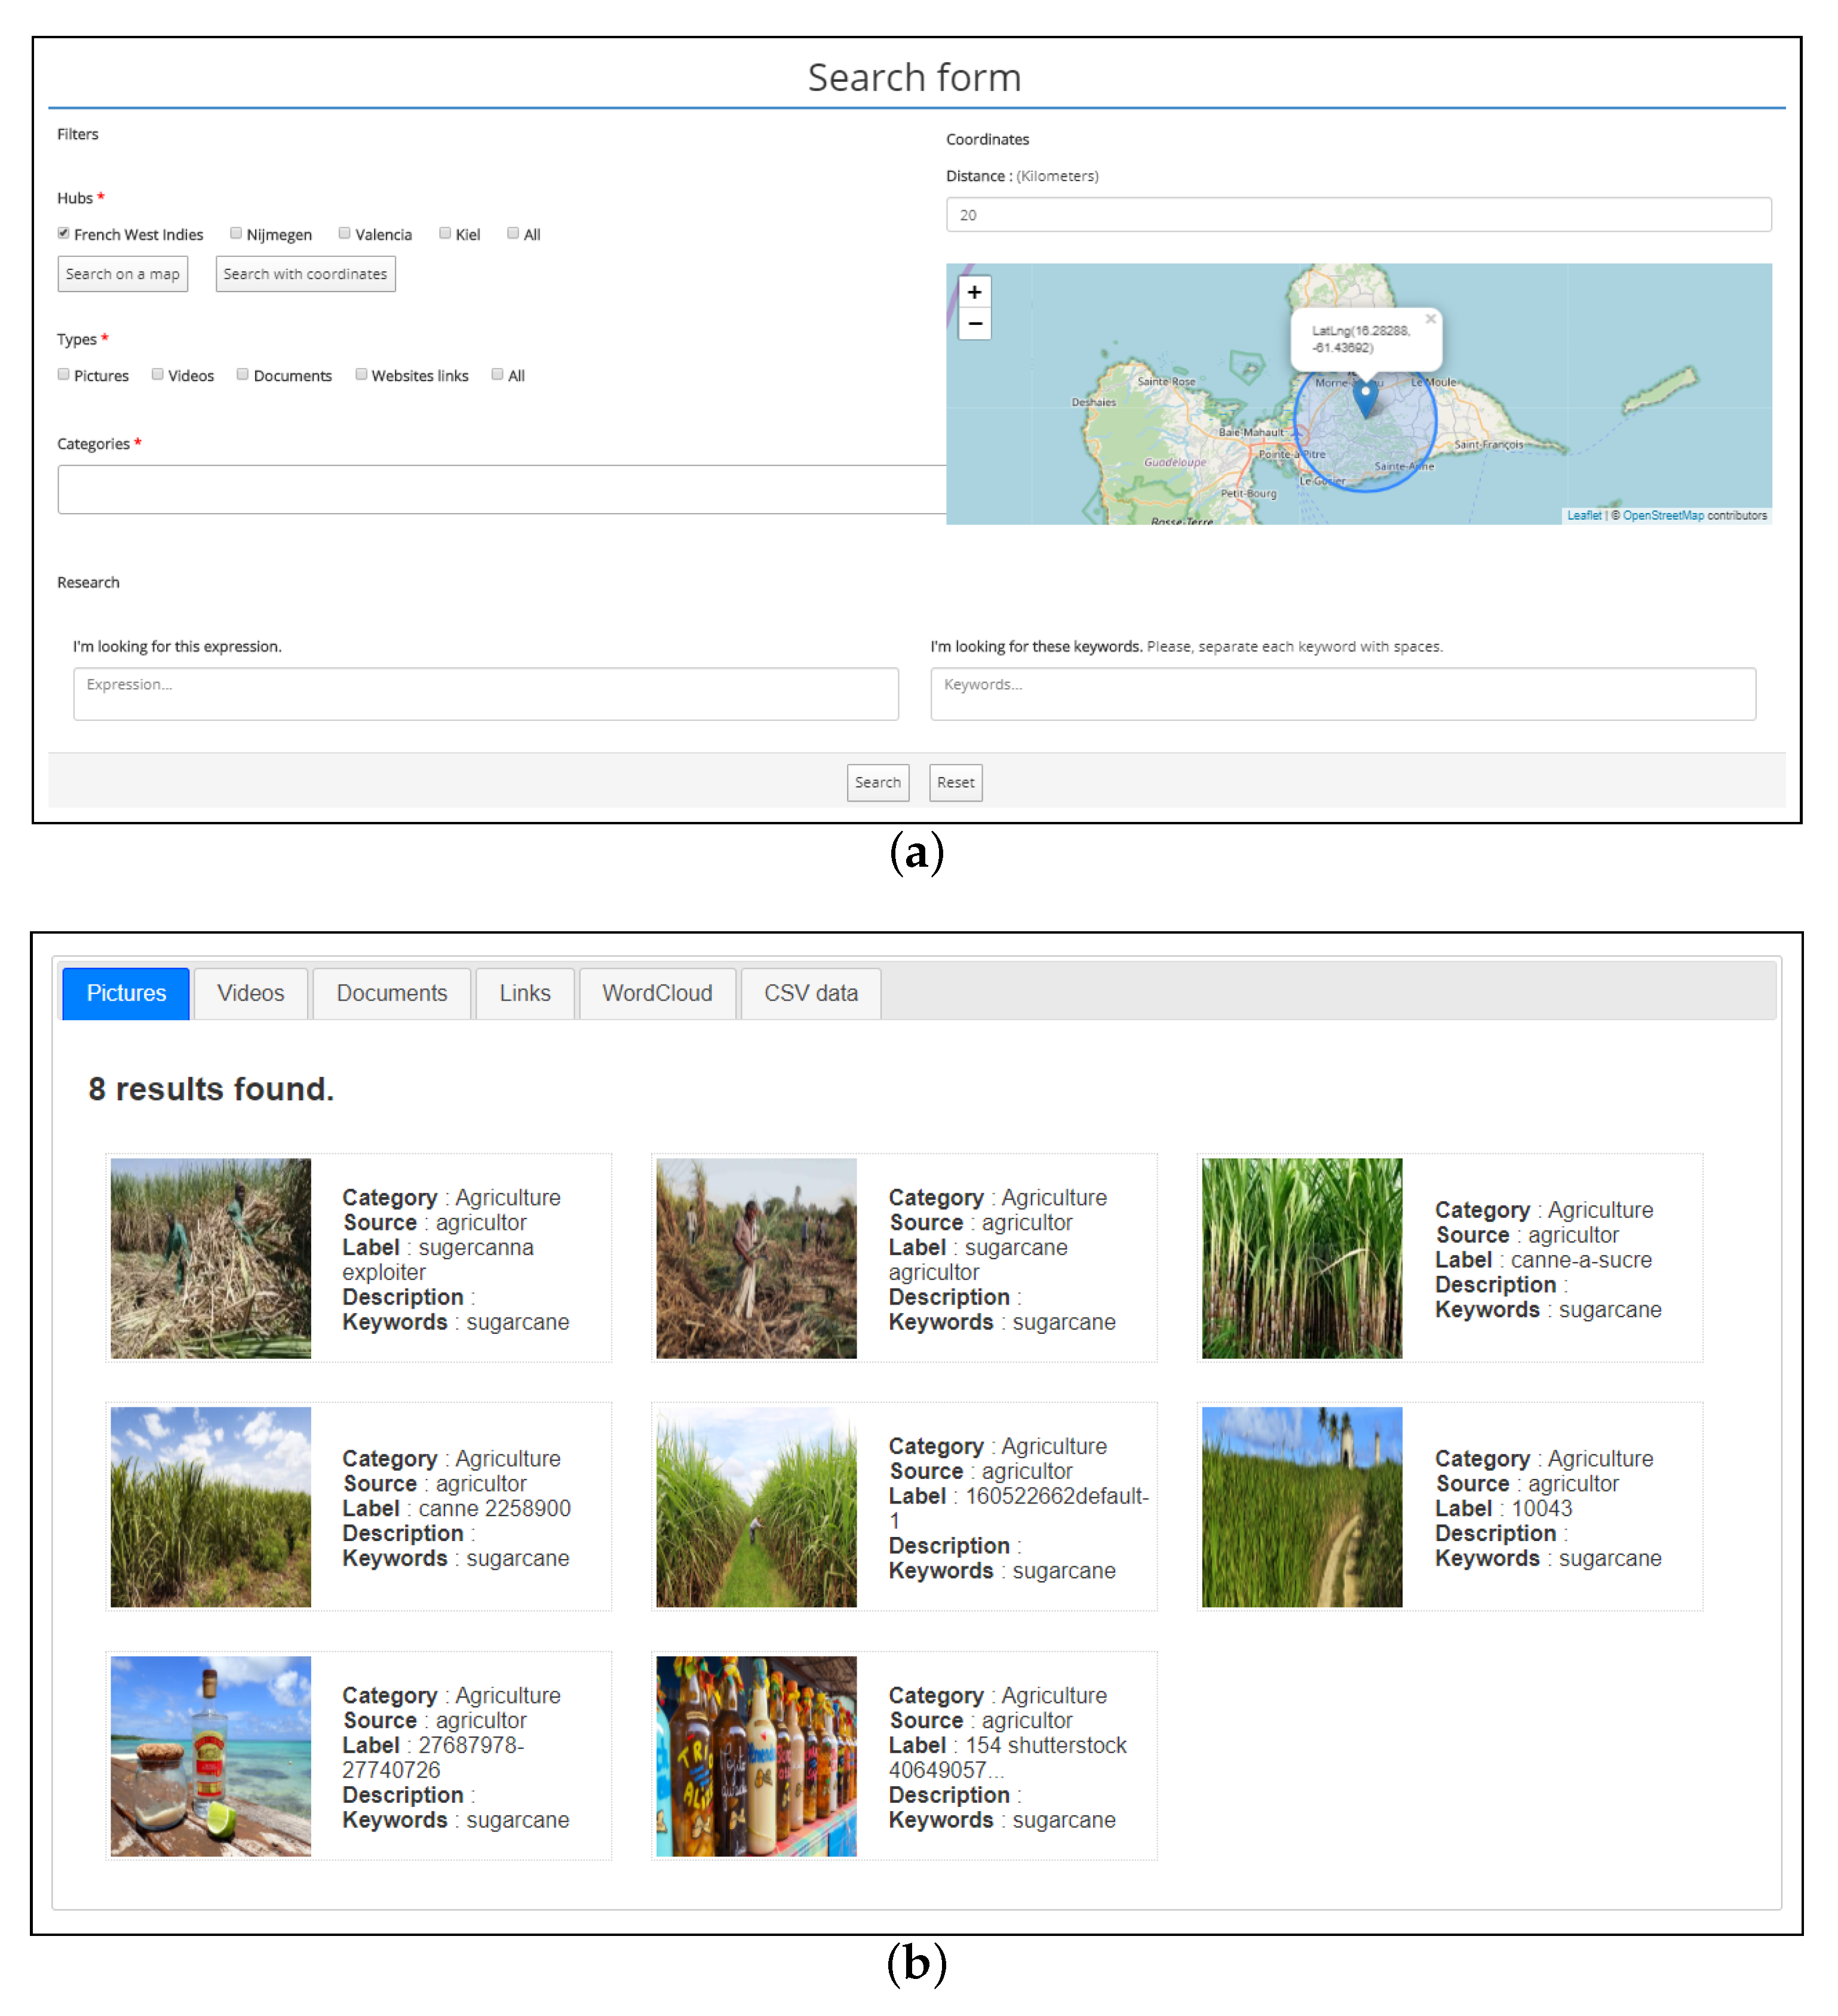
(i) The DKP search engine allows to search for data according to various filters given by the user, such as hubs, kinds of resources, categories, or various keywords. The search engine also allows to search for resources around a GPS point. On the example of
Figure 9a, resources are searched within a radius of 20 km around the GPS point provided by the user. Indeed, if the DKP can store a large amount of heterogeneous data, it is important to be able to navigate these data and select the relevant resources for the purpose of developing climate services. Thus, the DKP exploits all metadata associated to uploaded data and, in particular, Dublin core metadata, to filter data that are proposed to the user during the search process.
This module works as follows.
The user starts describing his search with a set of terms or keywords (eg. “sugar” and “cane”).
The DKP analyzes all types of data, including spatiotemporal data and resources, and only selects those whose metadata match with the user request.
Results are displayed as tabs by classifying them according to their type (pictures, videos, documents, or links), as shown on
Figure 9.
If documents are found, they are analyzed to extract a word cloud that summarizes the most frequent words found in all documents resulting from the request. The associated word cloud is displayed in a new tab. In the same way, if spatiotemporal data are found, the DKP offers the possibility to download them into a CSV file. In such a file, the first column corresponds to the dates for which data are found, and the other columns correspond to values for each date. These data are available from the CSV Data tab. For instance, with the terms “sugar” and “cane”, we can download data on the production of sugarcane each year on the island of Guadeloupe.
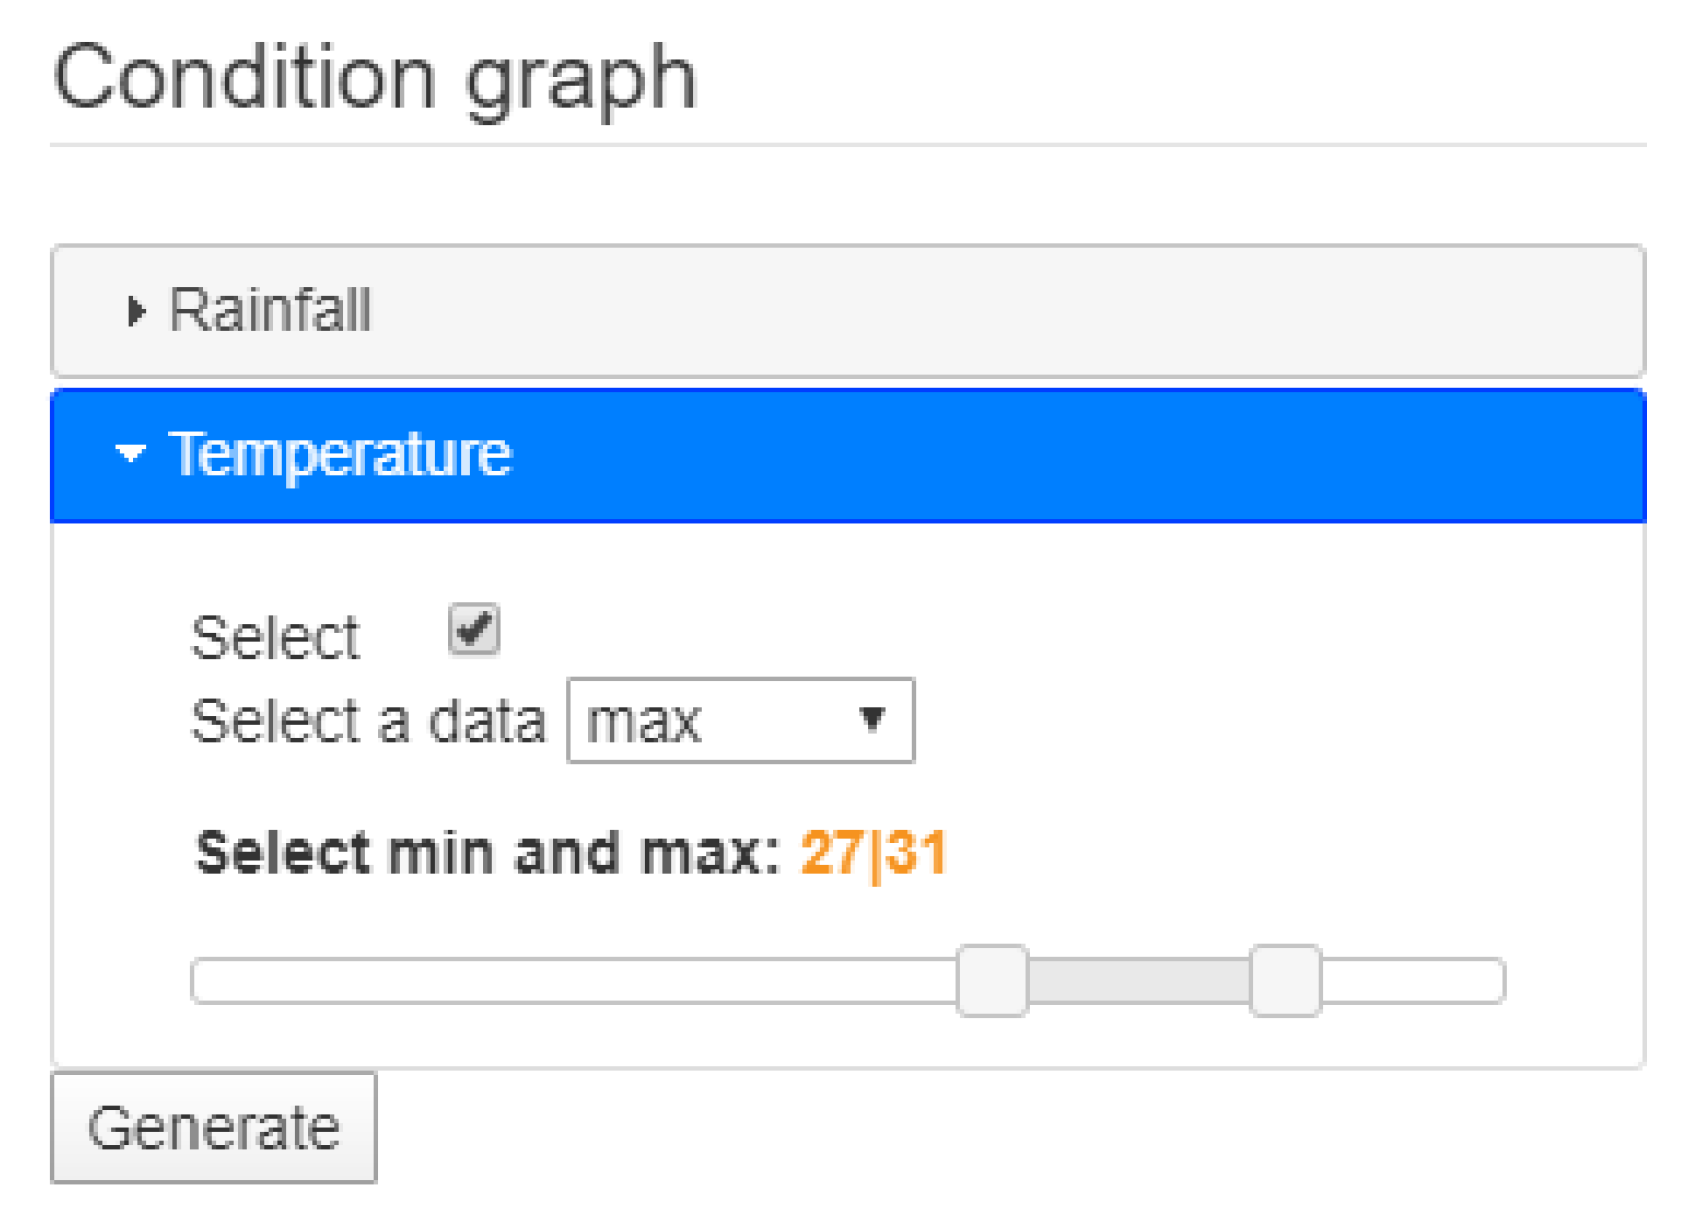
(ii) The search for the evolution of specific climate conditions is mainly dedicated to domain experts who want to analyze the evolution of specific climate conditions. Indeed, this module that only works on DKP climate data allows users to define climate conditions on one or more attributes. The platform then analyzes and aggregates data to highlight how the occurrence of the given conditions evolved over time. For instance,
Figure 10 shows how the DKP is used to define conditions on temperature data (in the example of
27
C and
31
C).
More specifically, this module performs as follows.
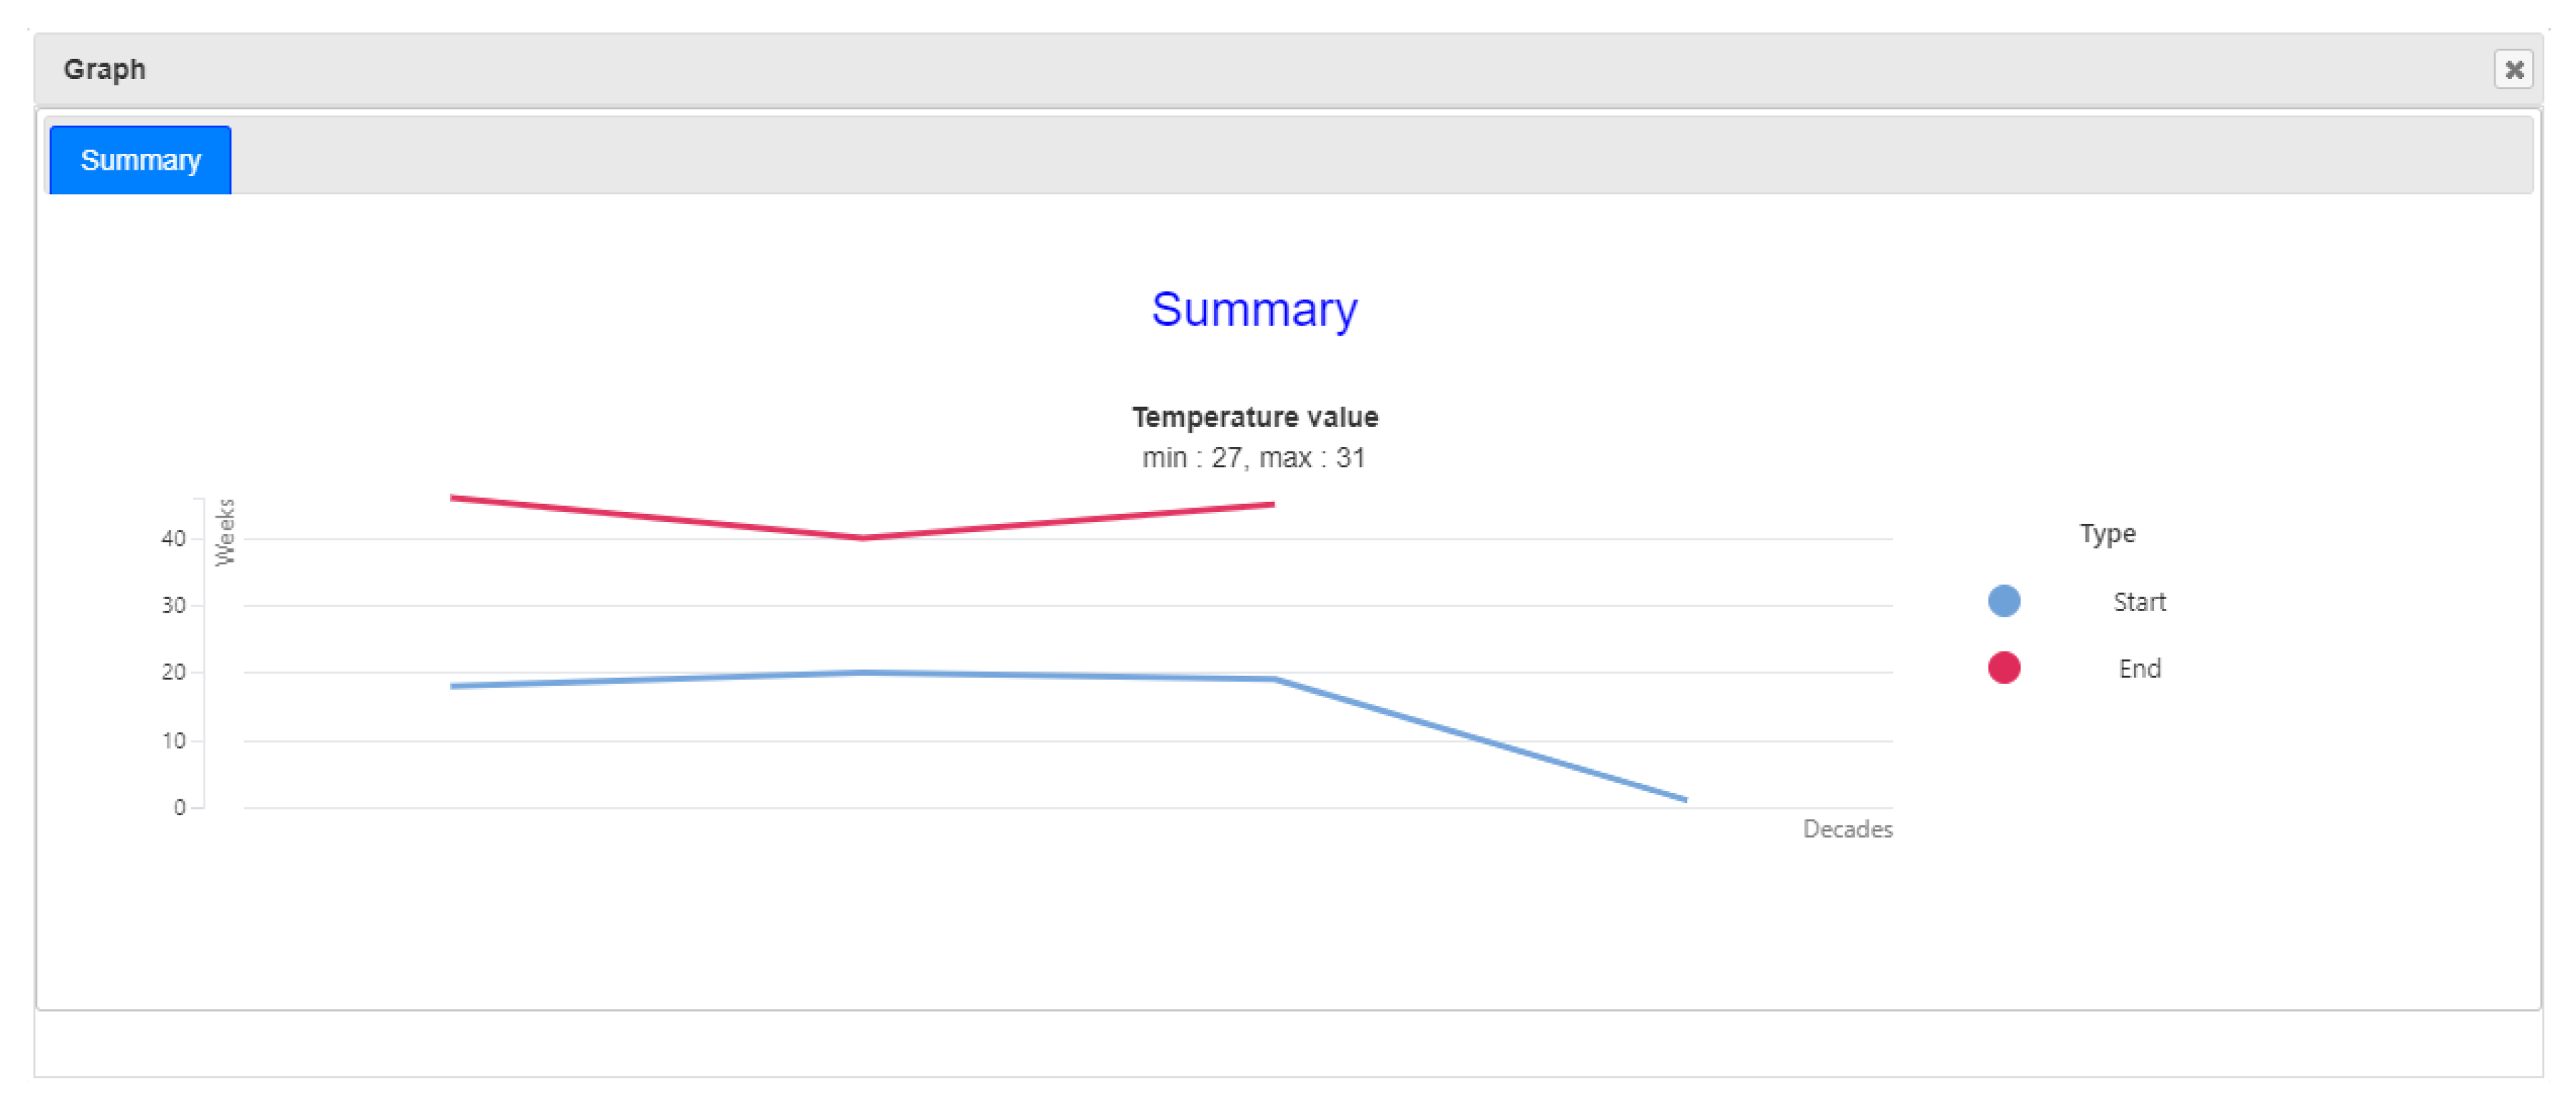
If several climate attributes are selected for analysis, the system shows the occurrence intersection of all conditions on the “summary” tab, but also displays the separate results for each attribute in a new tab. In the example of
Figure 11, we can observe that, for the first decade of 1970–1980, the defined conditions on temperature (
27
C and
31
C) were obtained from week 18 to 45. For the next decade of 1980–1990, the same conditions were obtained form week 20 to 40, which suggests a tightening of the period when these conditions are found.
(iii) The search for knowledge based on text mining allows to analyze textual documents on the basis of various text-mining approaches. The objective is to extract more semantic knowledge on the documents, and thus have a synthetic view of hub documents or the result of a search. For this purpose, documents are classified according to a taxonomy of climate change that includes eight topics: (i) Risk/Disaster, (ii) Politics/Opinion, (iii) Economy, (iv) Energy, (v) Ocean/Water, (vi) Weather, (vii) Agriculture/Forestry, and (viii) Arctic. Each document is thus labeled according to a topic to perform analysis.
This module works as follows:
The user first selects a hub or performs a search on the basis of keywords.
The system selects all the files responding to the user request.
The system analyzes the resulting documents by using different text mining methods: clustering (dendrogram, relevant terms and sizes), histograms with topic density, data tables, word cloud, etc.
All text mining results are displayed on a dashboard that summarizes the extracted knowledge as shown on
Figure 12.
6. DKP at Work: Simulating Hazard Assessment
In order to illustrate the value of the platform, we describe how it could be carried out on a practical case. We ran a co-design cycle on the basis of the platform on a virtual, though believable, example that we assumed to be located in the French West Indies. For many years, habits and customs have been built in the agricultural sector in order to fit the reality of the two traditional seasons. Nevertheless, it is quite strong evidence that agricultural practices have to adapt to the new climate in the short- and midterm. In this context, it is quite appropriate to develop climate services leveraging geographic information from the DKP database to provide support in the search for local adaptation solutions in this field.
Let us assume that the context for this example of DKP implementation is related to drought hazard that may occur at times when sugarcane fields could severely suffer. The CS provider could be a research institute in agronomy, and end users could be group of farmers who are already experiencing the effect of change. Sugarcane production is a very sensible case as its development depends on two distinct phases, growing and maturing. During the growing period, sugarcane needs a high level of humidity in order to gain height. This phase takes place during the wet season. Afterwards, the crop needs to mature. In this phase, water stress caused by moist deprivation is an important factor that increases the sucrose concentration of the cane. This phase takes place during the dry season. The new issue is that the two seasons are no longer stable because of climate change. Thus, it is essential to further investigate, particularly the evolution of drought periods for the next years and even decades. With this example, as shown by
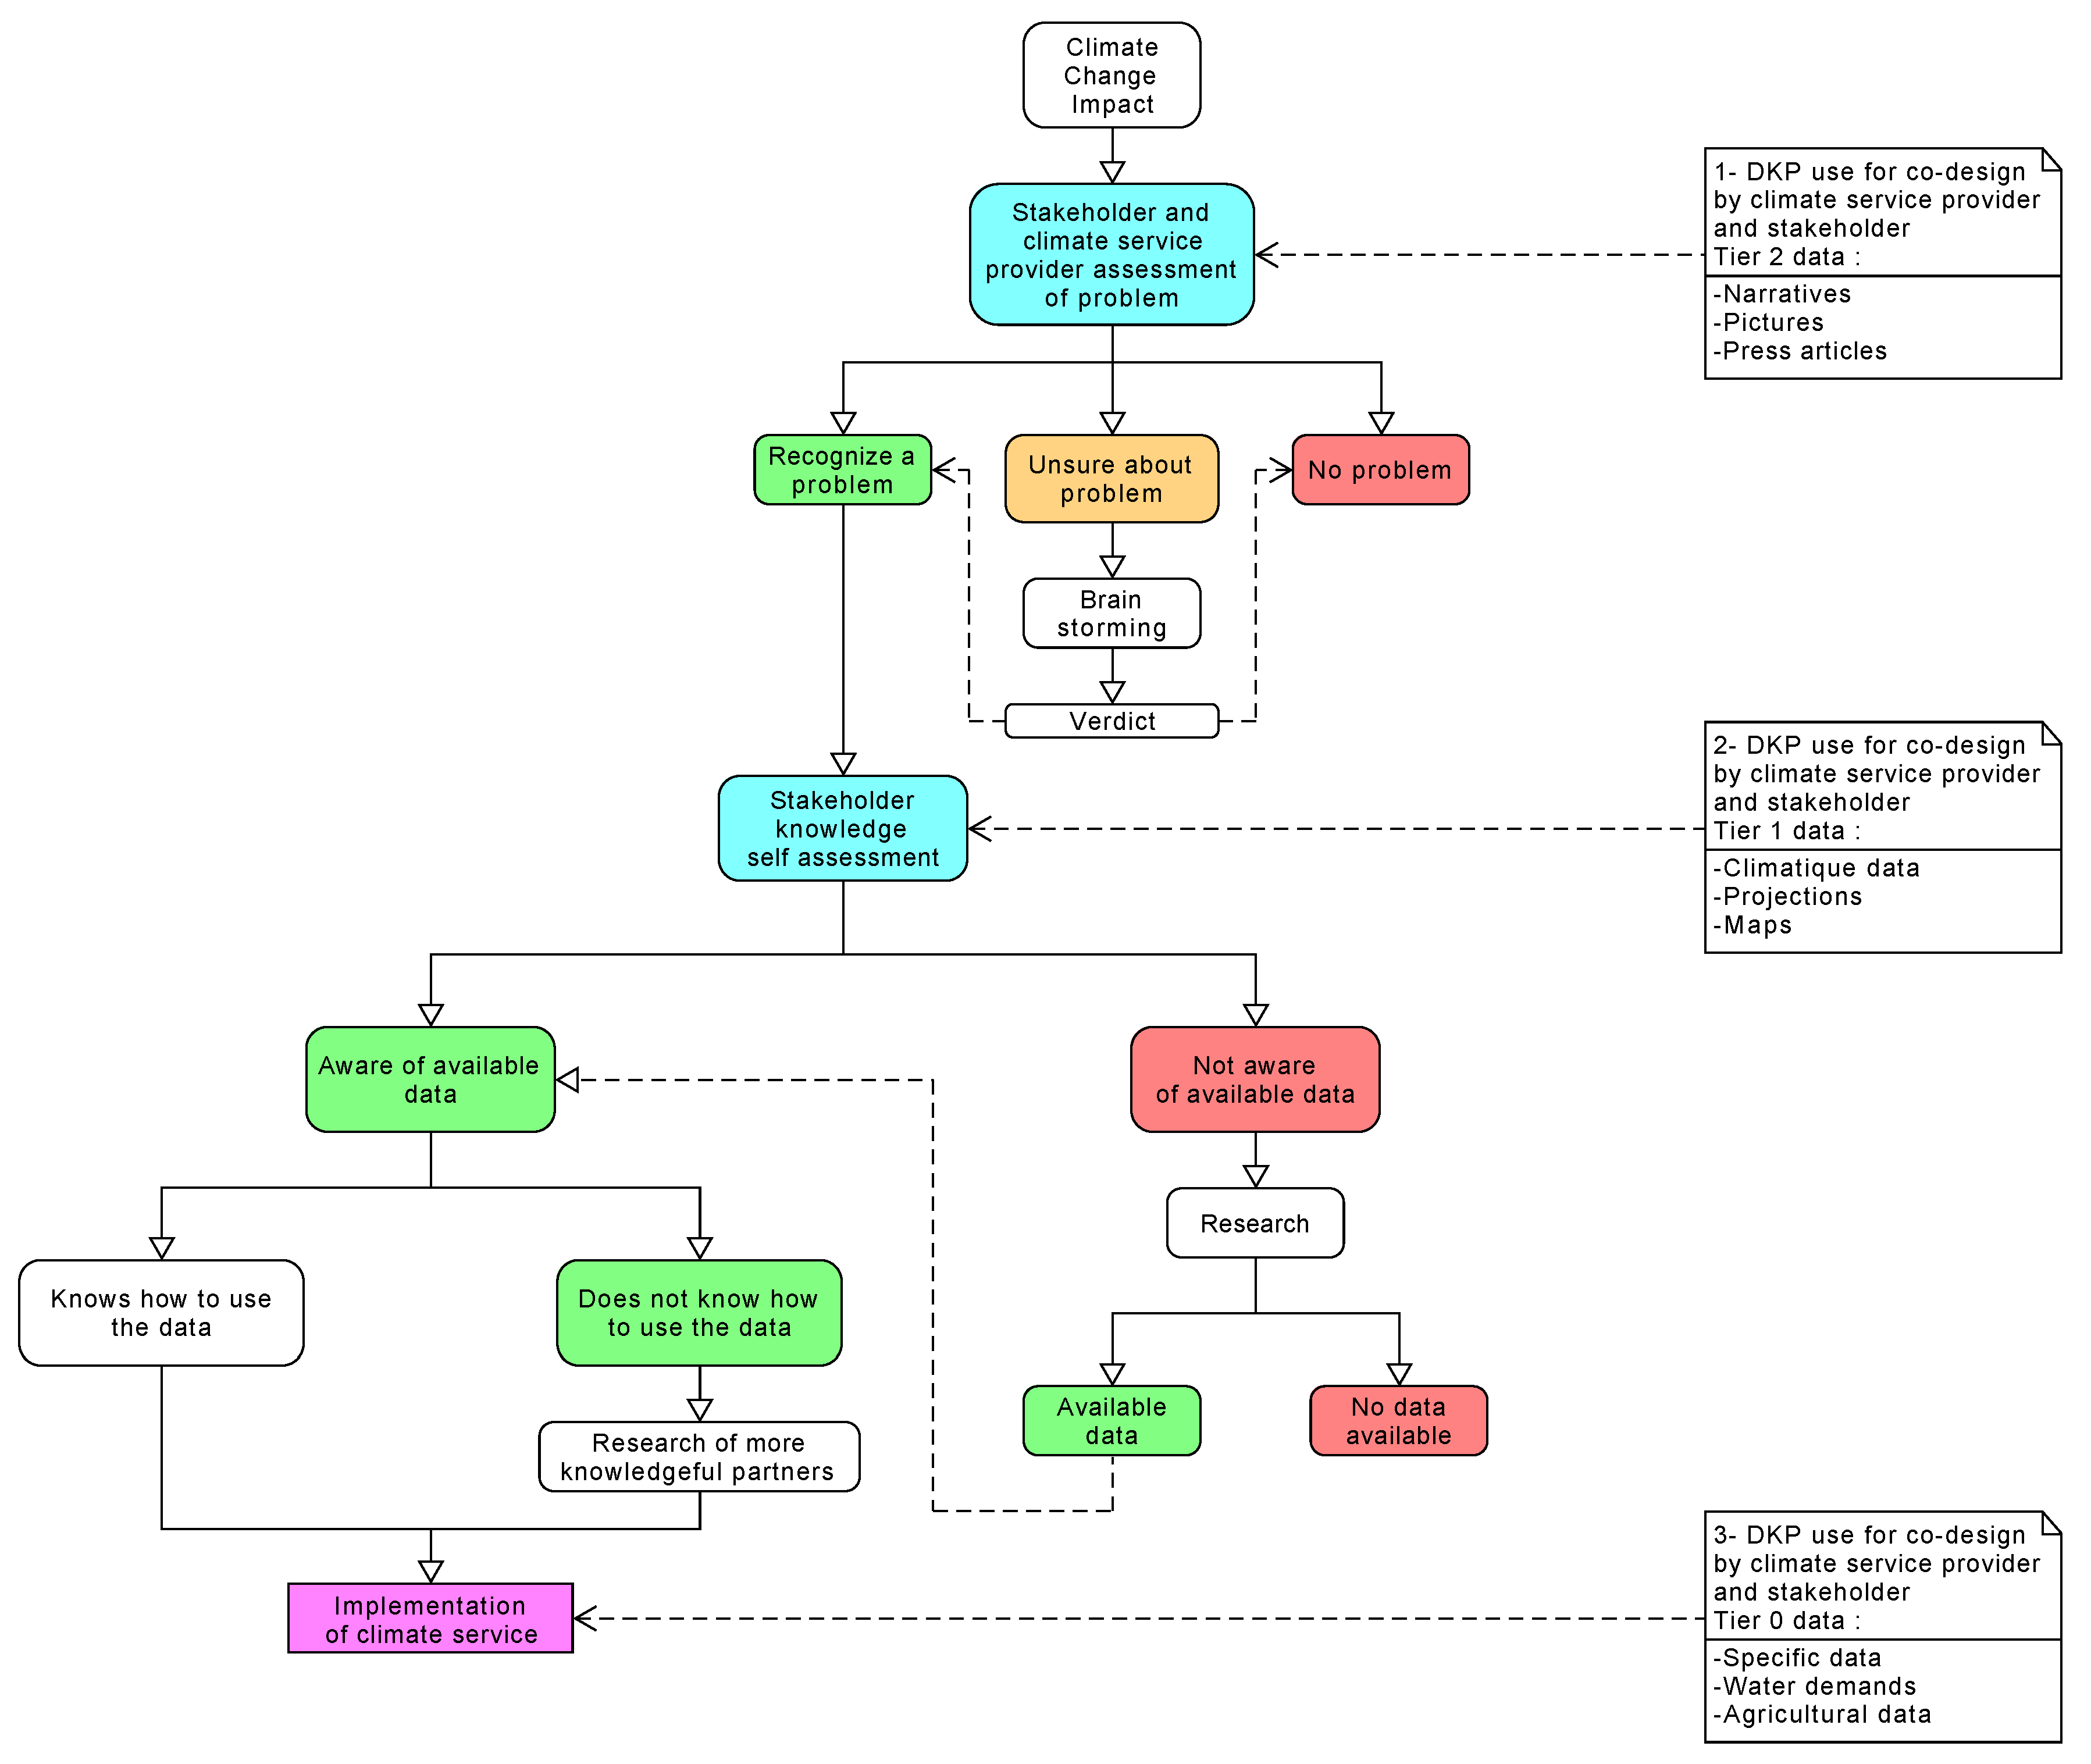
Figure 13, we also introduced a co-design flow much inspired by the model defined by INNOVA project partners, and we show how the platform may contribute to and facilitate the process.
Figure 13 represents the typical steps followed as in the flow diagram defined by [
13].
First, (see
Figure 13), both co-design actors may explore available documentary resources on the platform such as narratives or images as described to meet Objective G1 of local understanding. The research institute as a CS provider and the end user are able to together explore all pieces of geographic information in DKP comprising scientific reports, news articles, stories, pictures, or videos that provide descriptions of the impact of the current situation of climate change on sugarcane production.
Figure 9a shows how resources may be searched around geographic markers.
Second (see
Figure 13), once the stakeholders have a sufficient understanding of the impacts, they can use and display raw data such as numeric data on current temperature and rain, and on local climate projections with a geographic dimension using DKP exploration as shown on
Figure 4.
Third, stakeholders may introduce specific data related to the target issue and geographically stage them. It essentially covers domain data (see
Figure 13) with which they correlate climate projections, agricultural data, and knowledge on sugarcane, and the knowledge that was acquired throughout the process. In the current example, they would target geographic and agricultural areas that could be impacted (
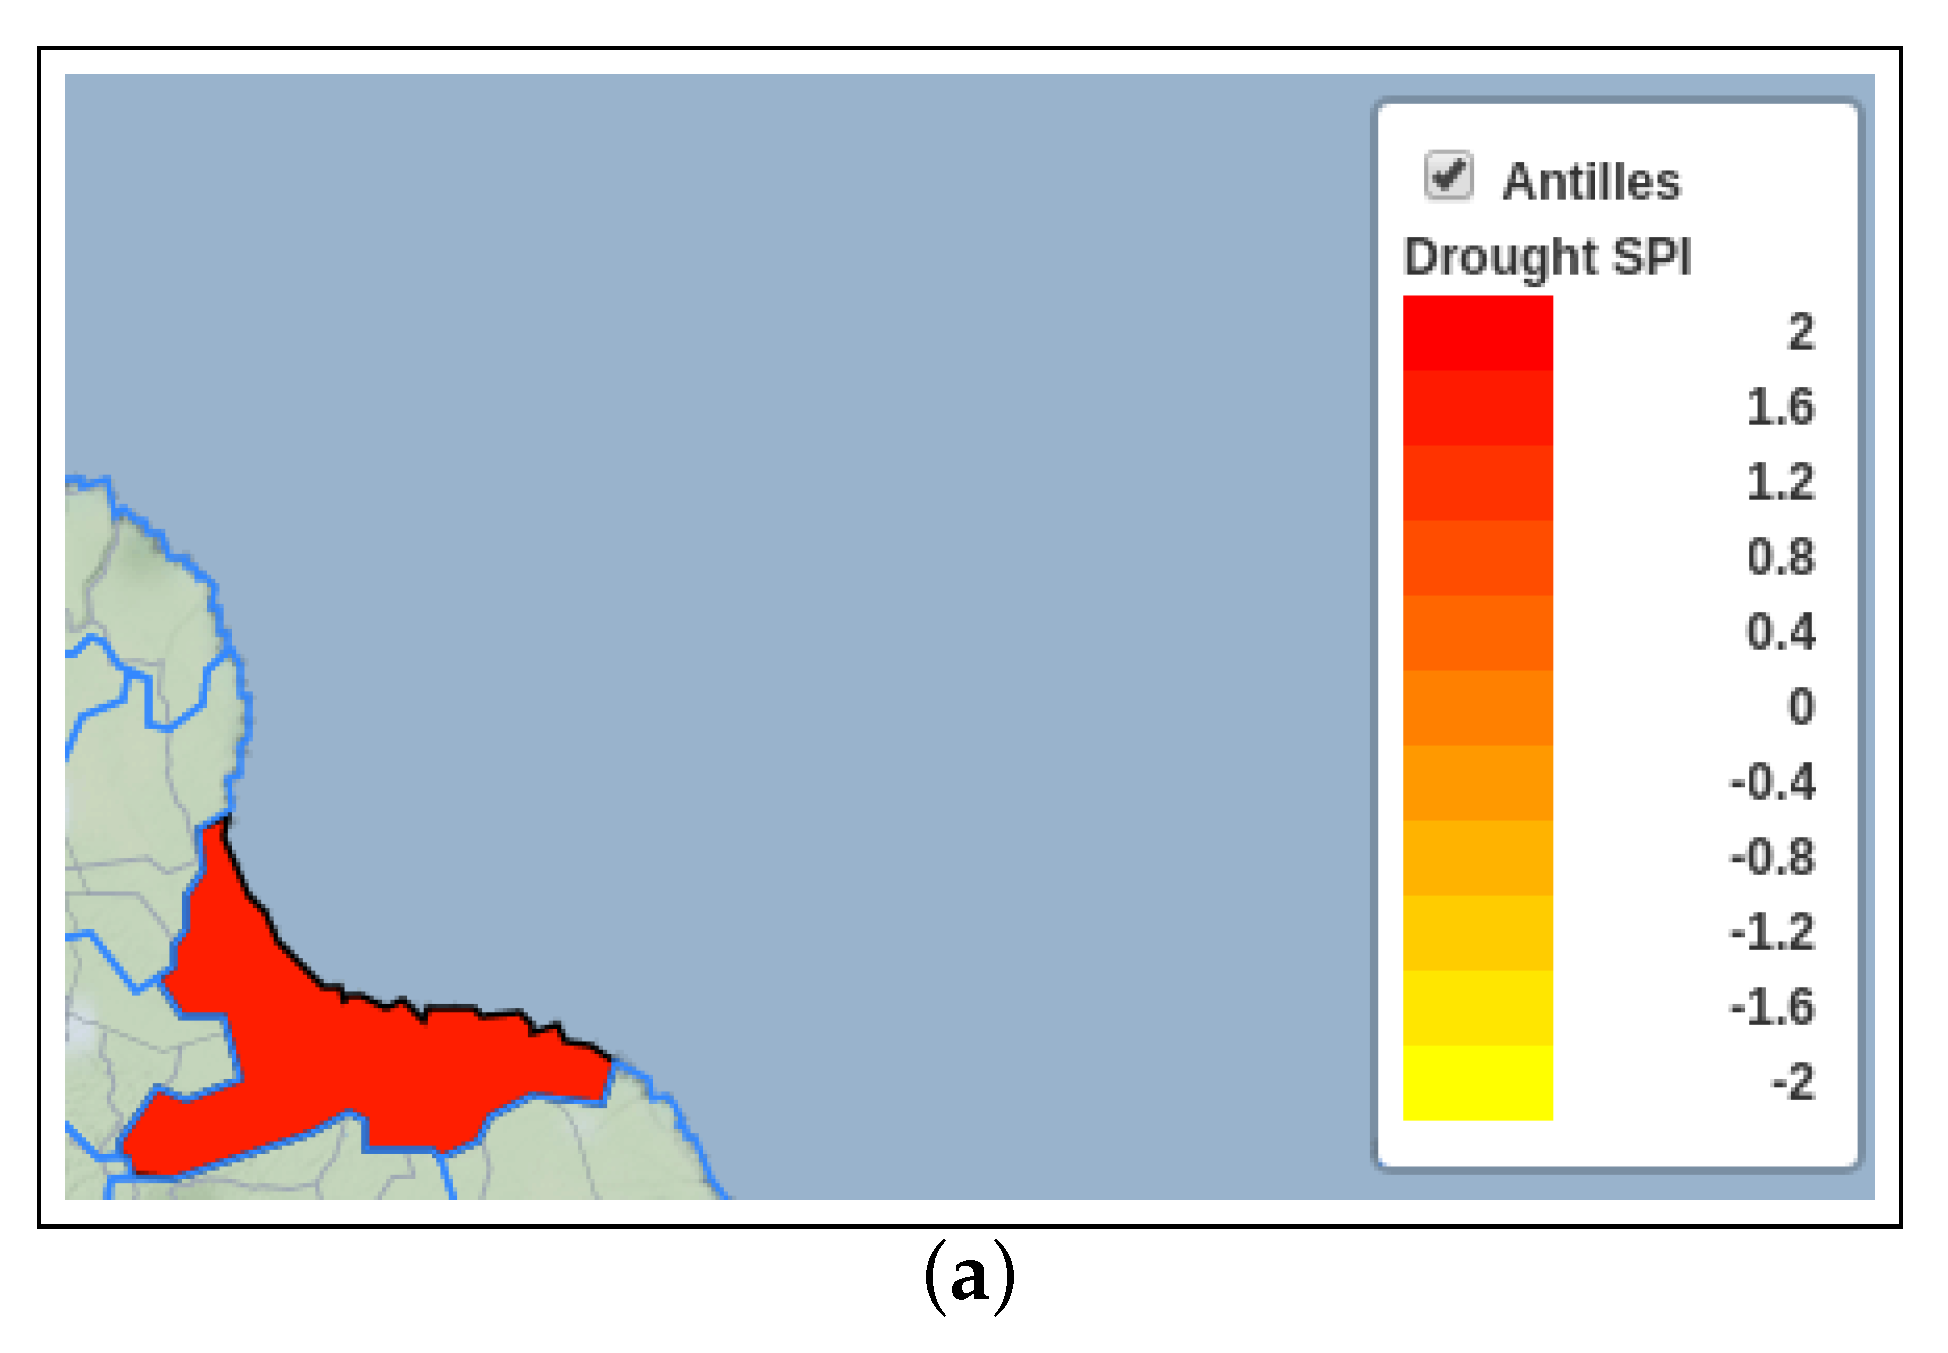
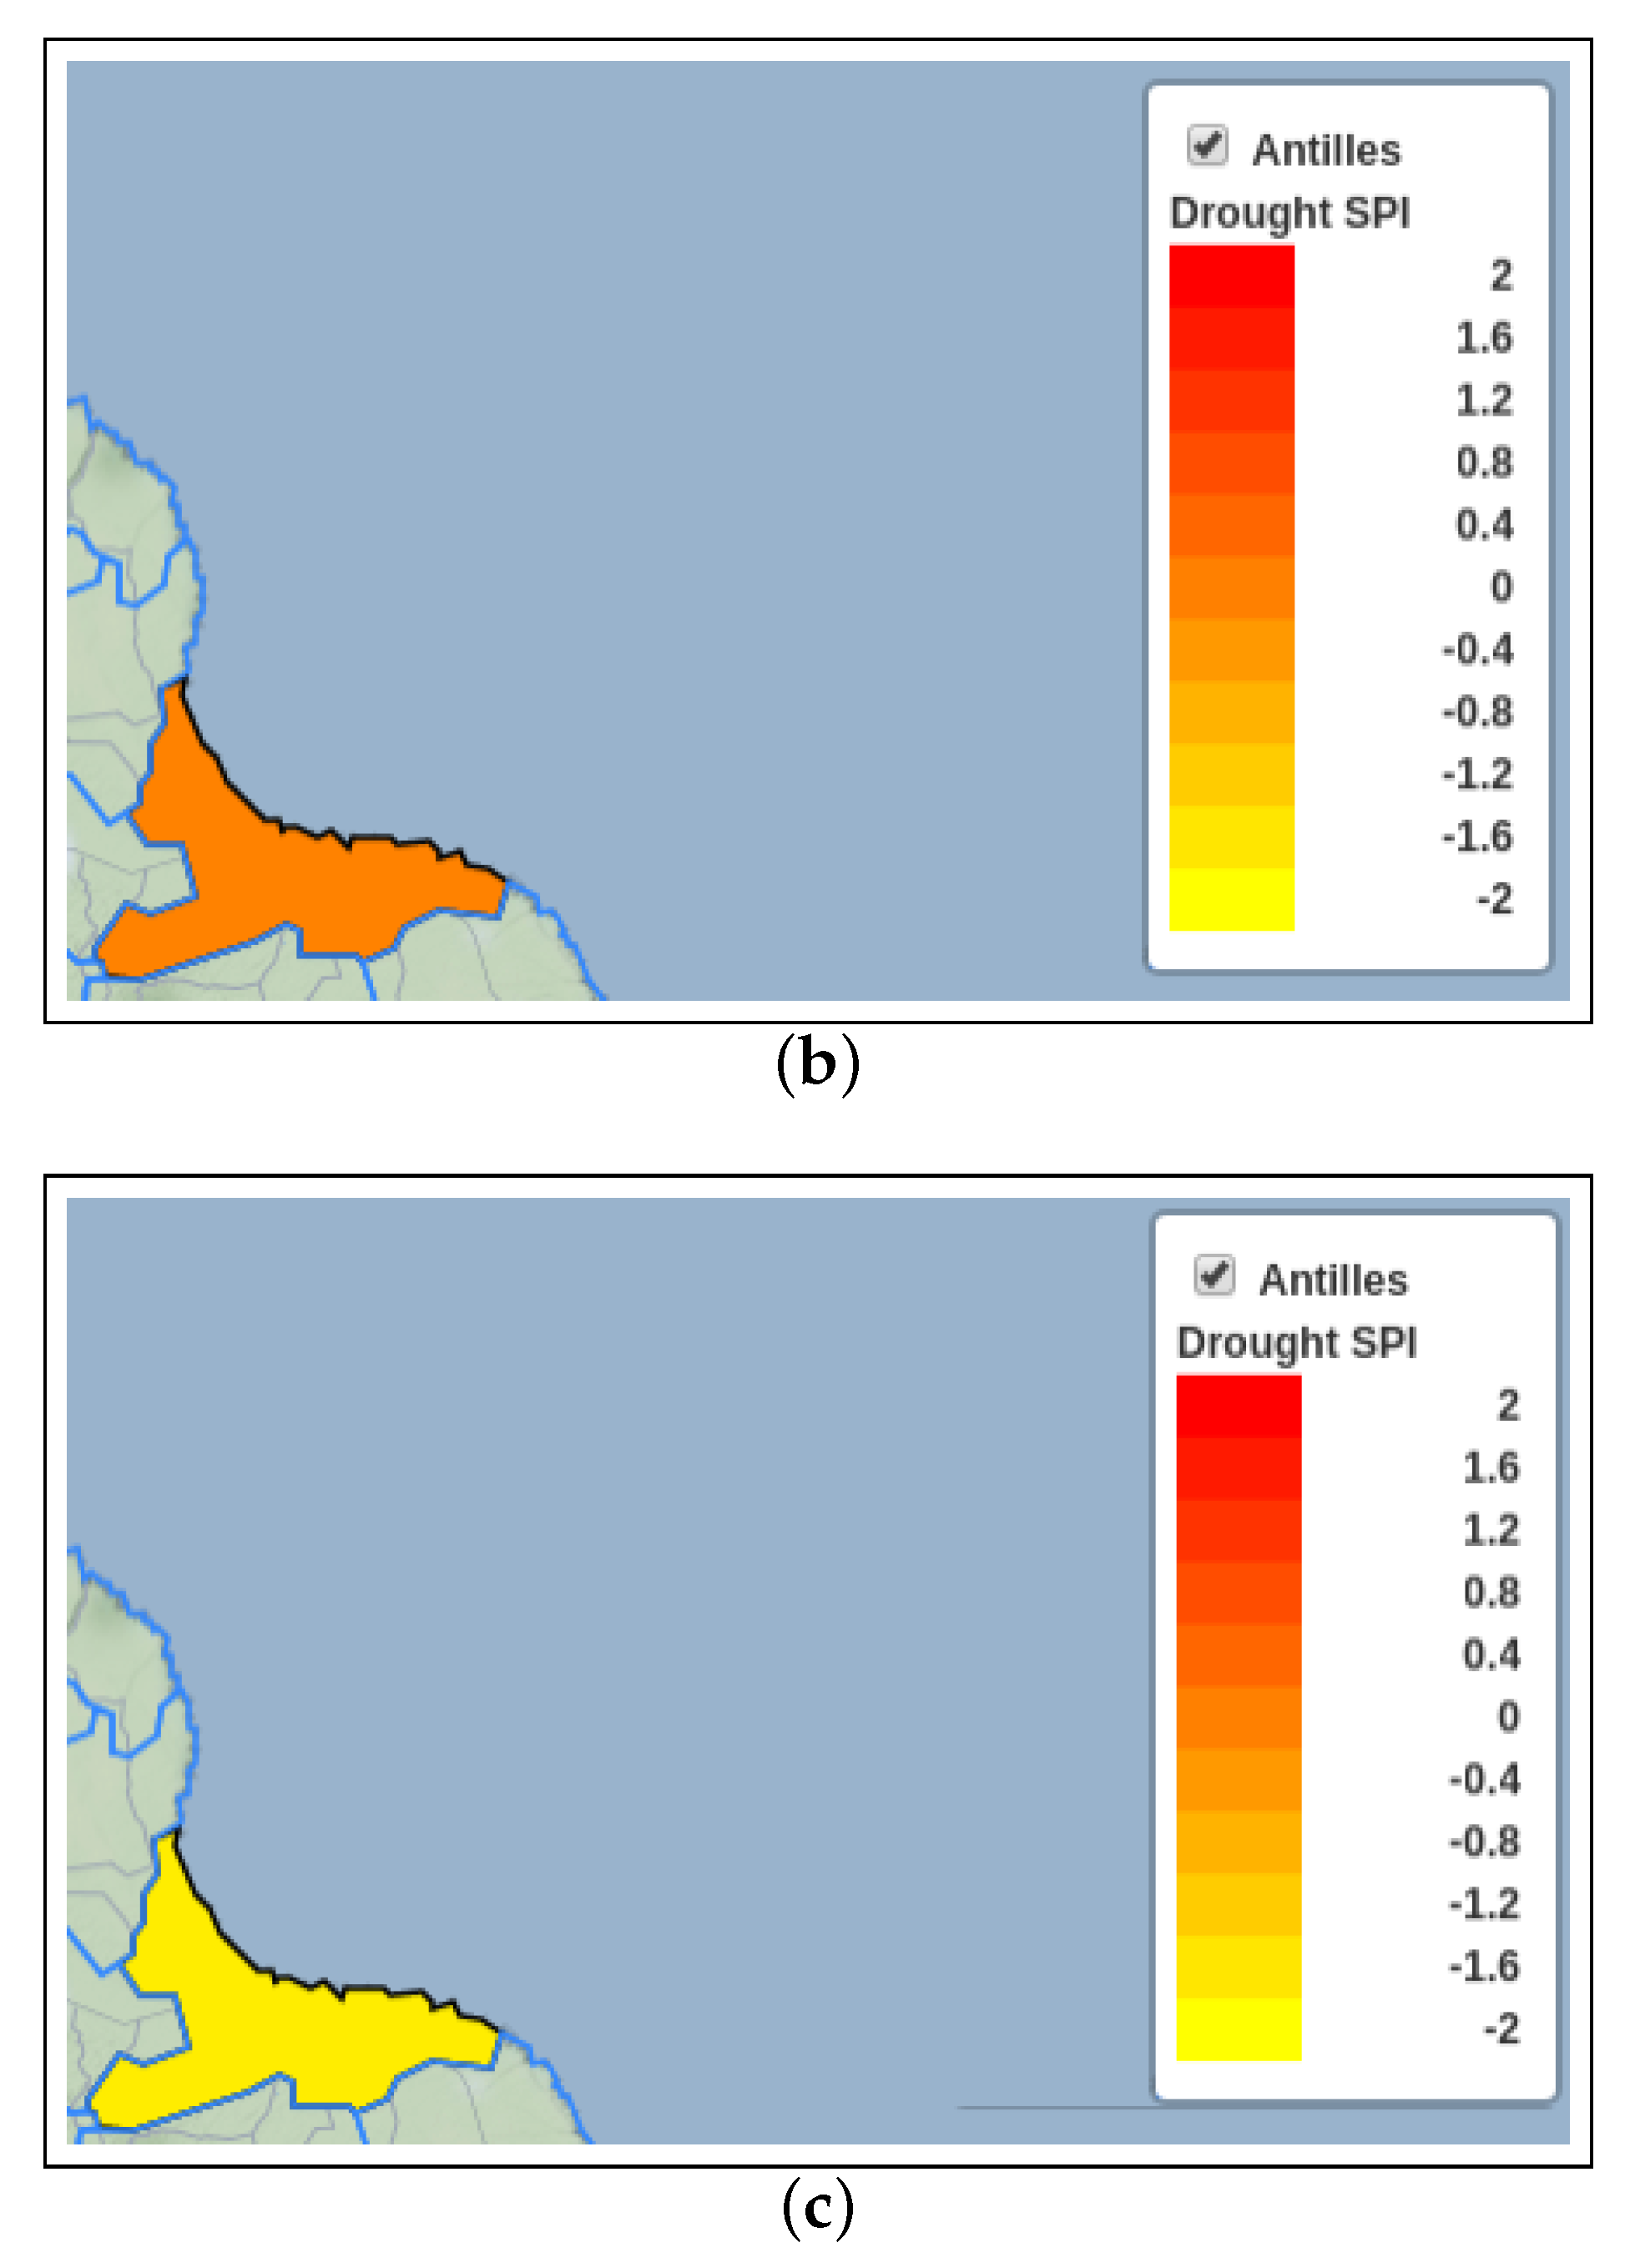
Figure 13), and they were warning indicators like drought indices. The DKP gives the capacity to geographically display this information. For instance,
Figure 14 simulates the display of standardized-precipitation-index (SPI) indicator projections at various times in the future. The SPI is a drought indicator that can be easily interpreted [
14,
15,
16]. At a near-zero value, the SPI expresses a level of humidity that could be qualified as normal in comparison with past records. If the value ever reaches −1, we can consider a dry period that continues until it becomes positive again.
14 displays simulated data in a given area that gathers hectares of sugarcane fields.
On the basis of that information, in
Figure 14a, stakeholders would observe a high SPI for September 2020, an encouraging prediction for farmers. In March 2033 (
Figure 14b), however, the SPI is near 0, and thus near the observed normal. This would not be a warning value, as it is in the “dry season” in the island. Nevertheless, an SPI value near
would be observed in November 2085 (
Figure 14c). November is usually one of the wettest months of the year, and such a low SPI would indicate a very dry month.
Thus, being aware of the data available on the DKP as shown by (
Figure 15), such as records on sugarcane production, climate projections, narratives on similar case studies, the co-designers can focus on every useful geographic information in order to highlight geographic areas vulnerability.
7. Conclusions
In this paper, we presented the INNOVA Data and Knowledge Platform (DKP) developed within the framework of European project INNOVA that was built to meet the needs of the four hubs of the project, but which is also an extensible tool that can be tailored to new local issues requiring the development of climate services.
We set the scene for supporting climate-service elaboration:
- -
a local issue on an identified geographic climate-related risk;
- -
CS providers and end users who have to work in a co-design dynamic, analyze local trends in numerical indicators and other available resources (images, videos, narratives, scientific publications), and assess the risk on the basis of visualizations and geographic representations.
The originality of the DKP lies in (i) its NoSQL data structure and its visual interface that both allow to geographically upload, store, and stage a wide variety of information on weather, climate change, and related domains; and (ii) the geographic information that it is able to deliver to stakeholders: resources (raw data, documents, pictures, videos) associated to an area or GPS point that matches their queries to assess the impact of climate change by visualization. The DKP offers, in a way, GIR functionalities by enabling the exploration of large volumes of structured and unstructured data stored in a NoSQL-type database associated to geographic areas.
Thus, we presented in detail the three modules that make up the geographic platform to meet the objectives of providing the best possible support for the CS co-design process: to gather geographic and georeferenced information on a given local climate-change case study for further design of solutions towards mitigation, to explore climate data and other categories of digital data into a geographic framework, and act out climate-change scenarios related to a given activity.
