Developing Vulnerability Index to Quantify Urban Heat Islands Effects Coupled with Air Pollution: A Case Study of Camden, NJ


Abstract
:
1. Introduction
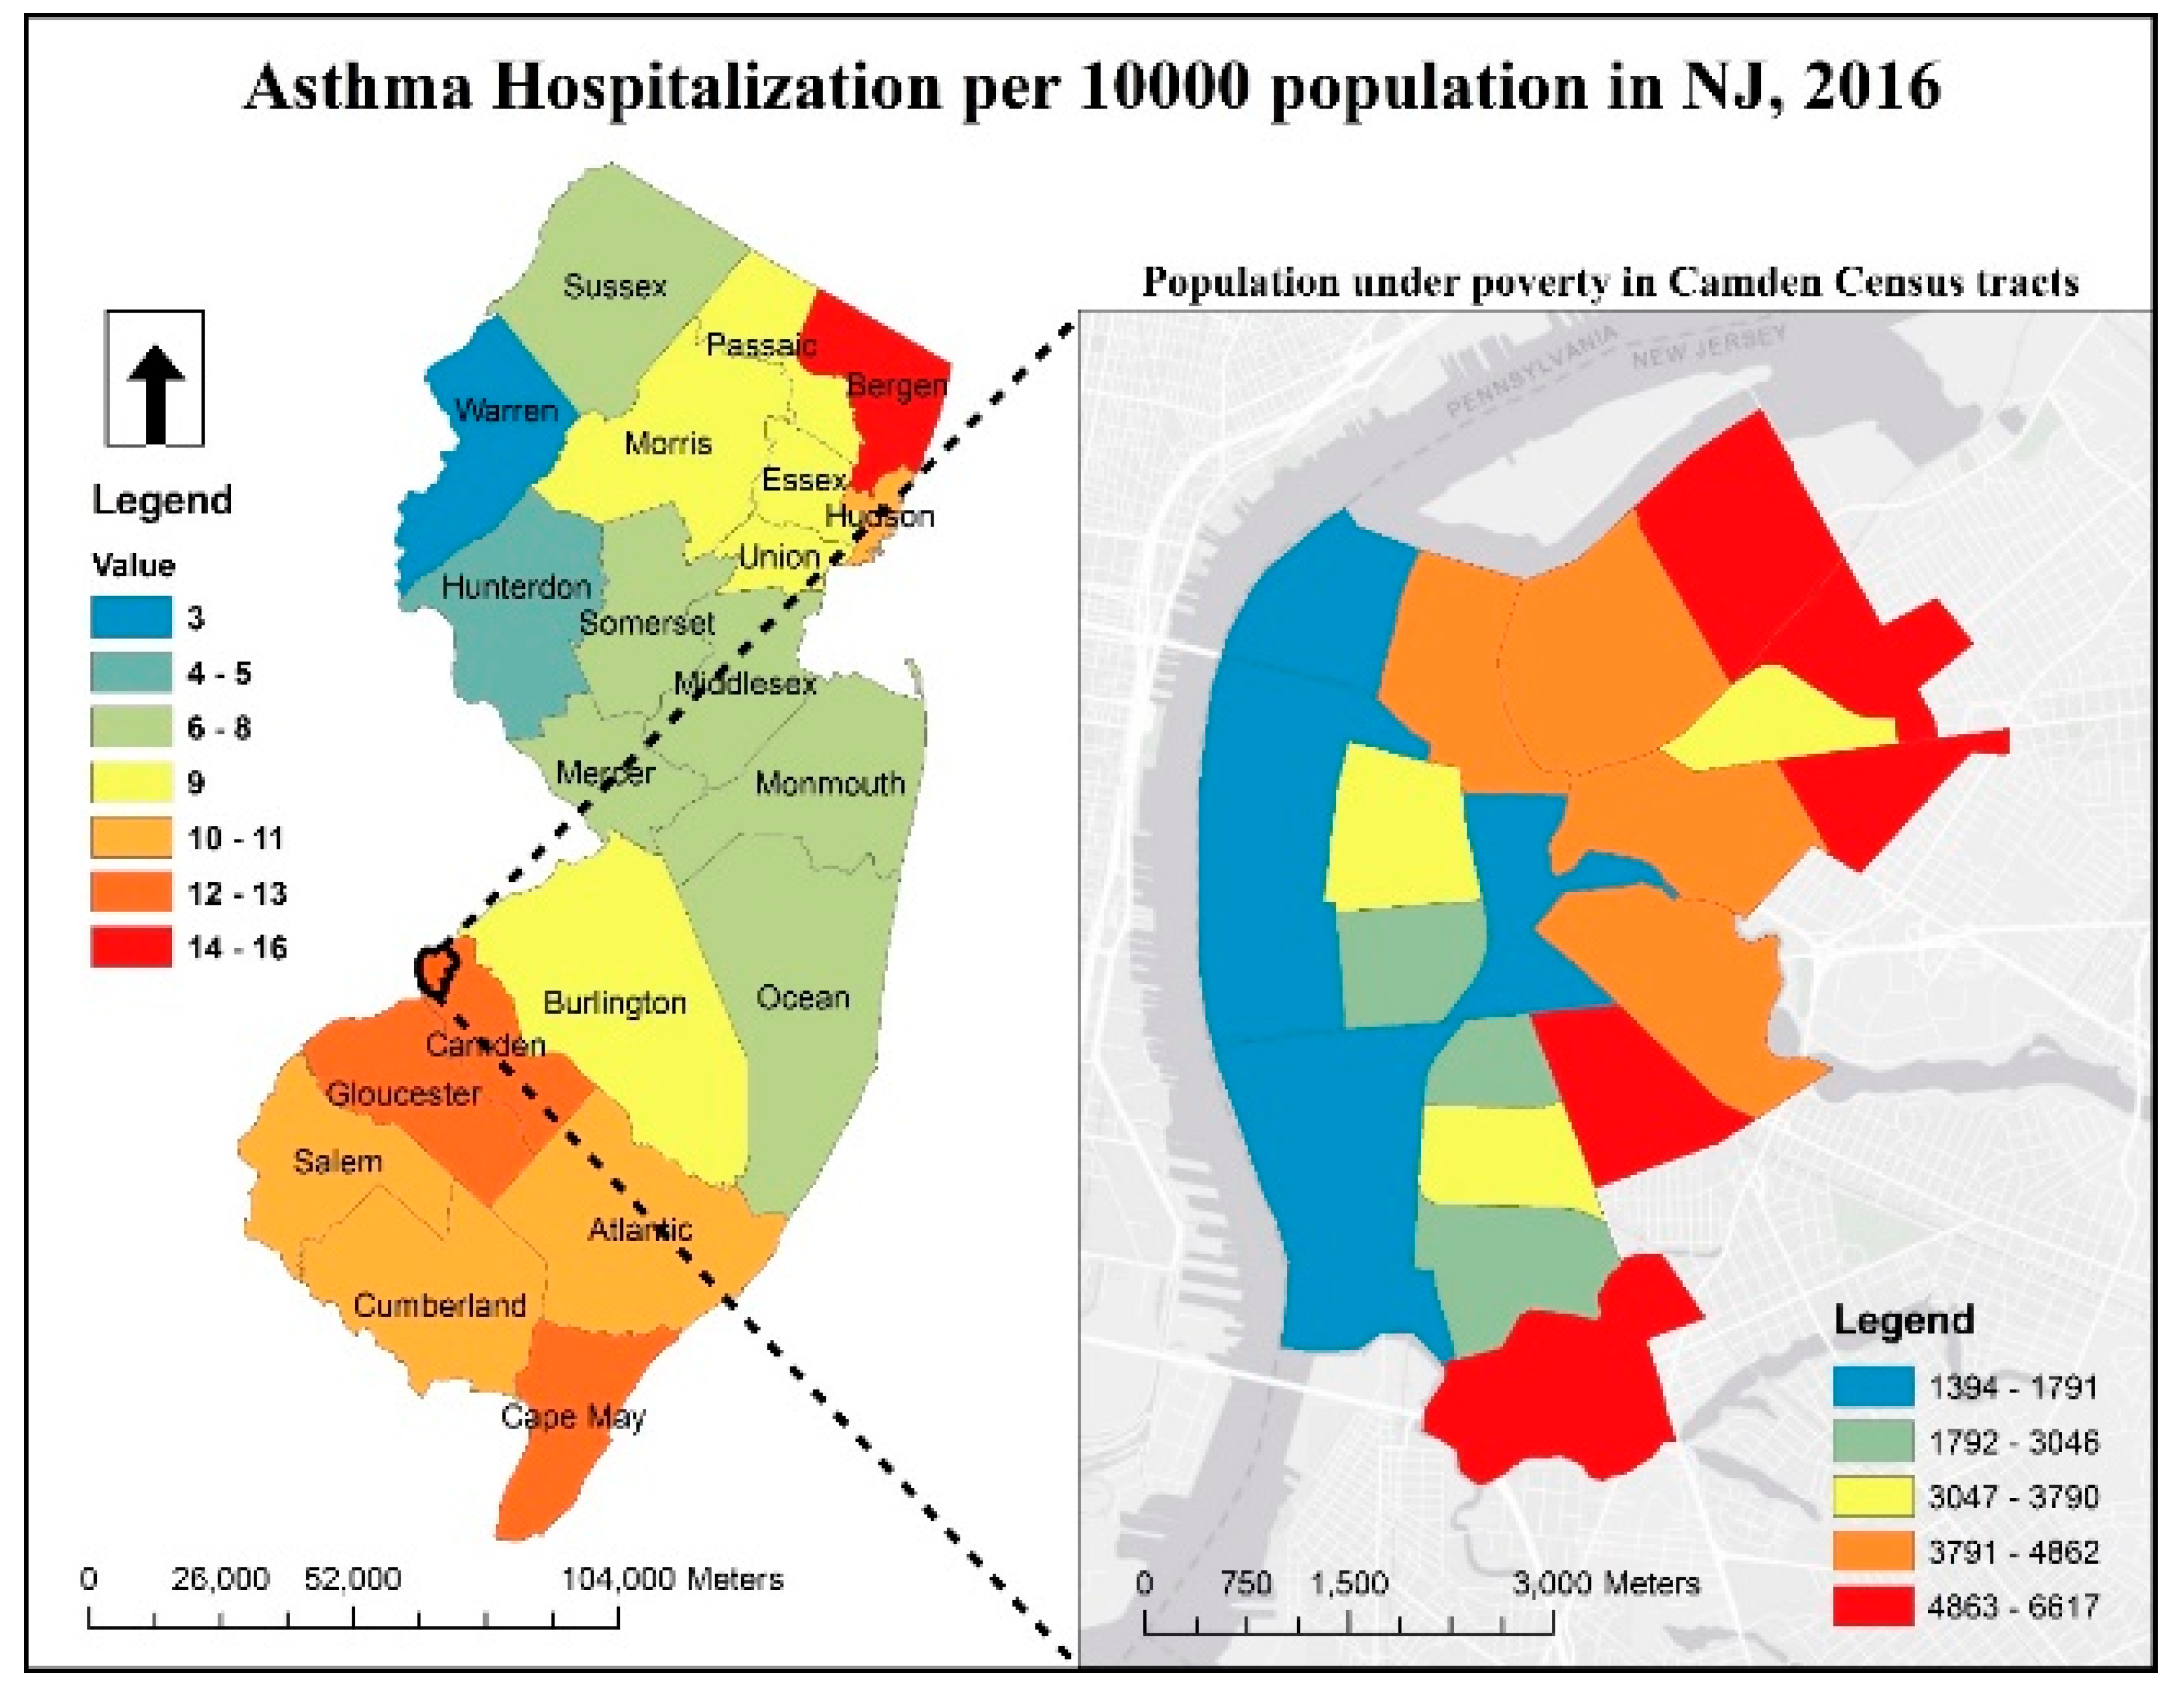
2. Study Area
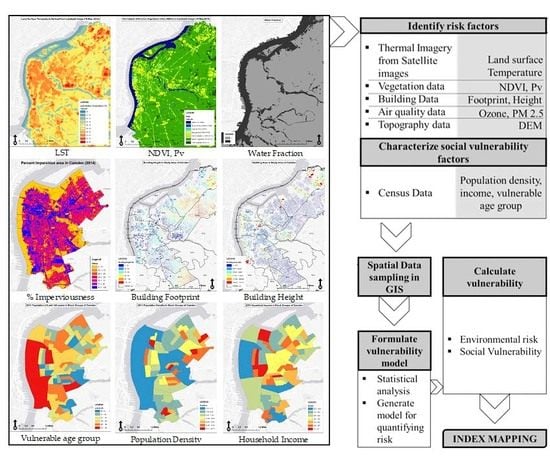
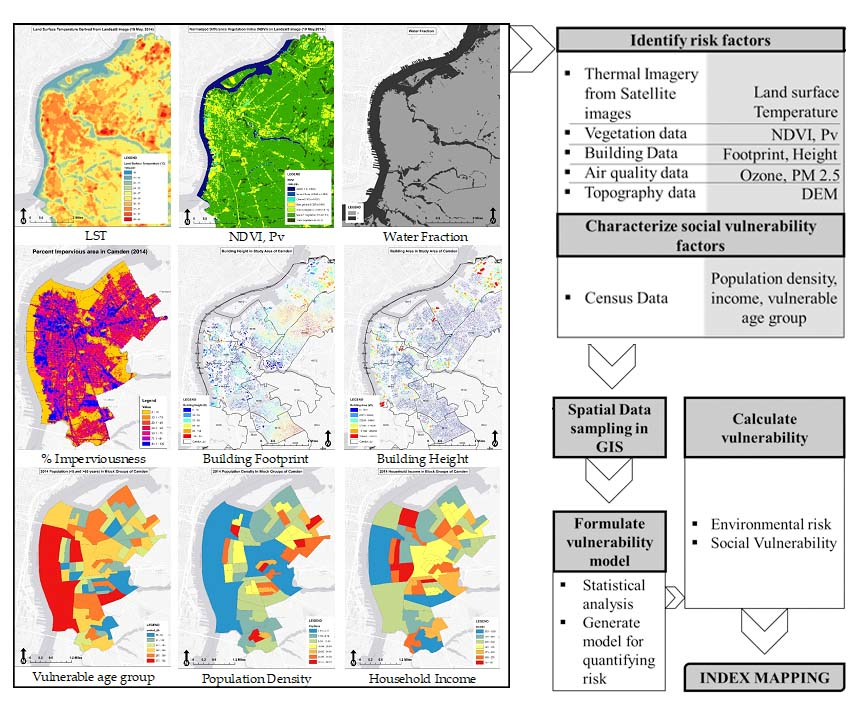
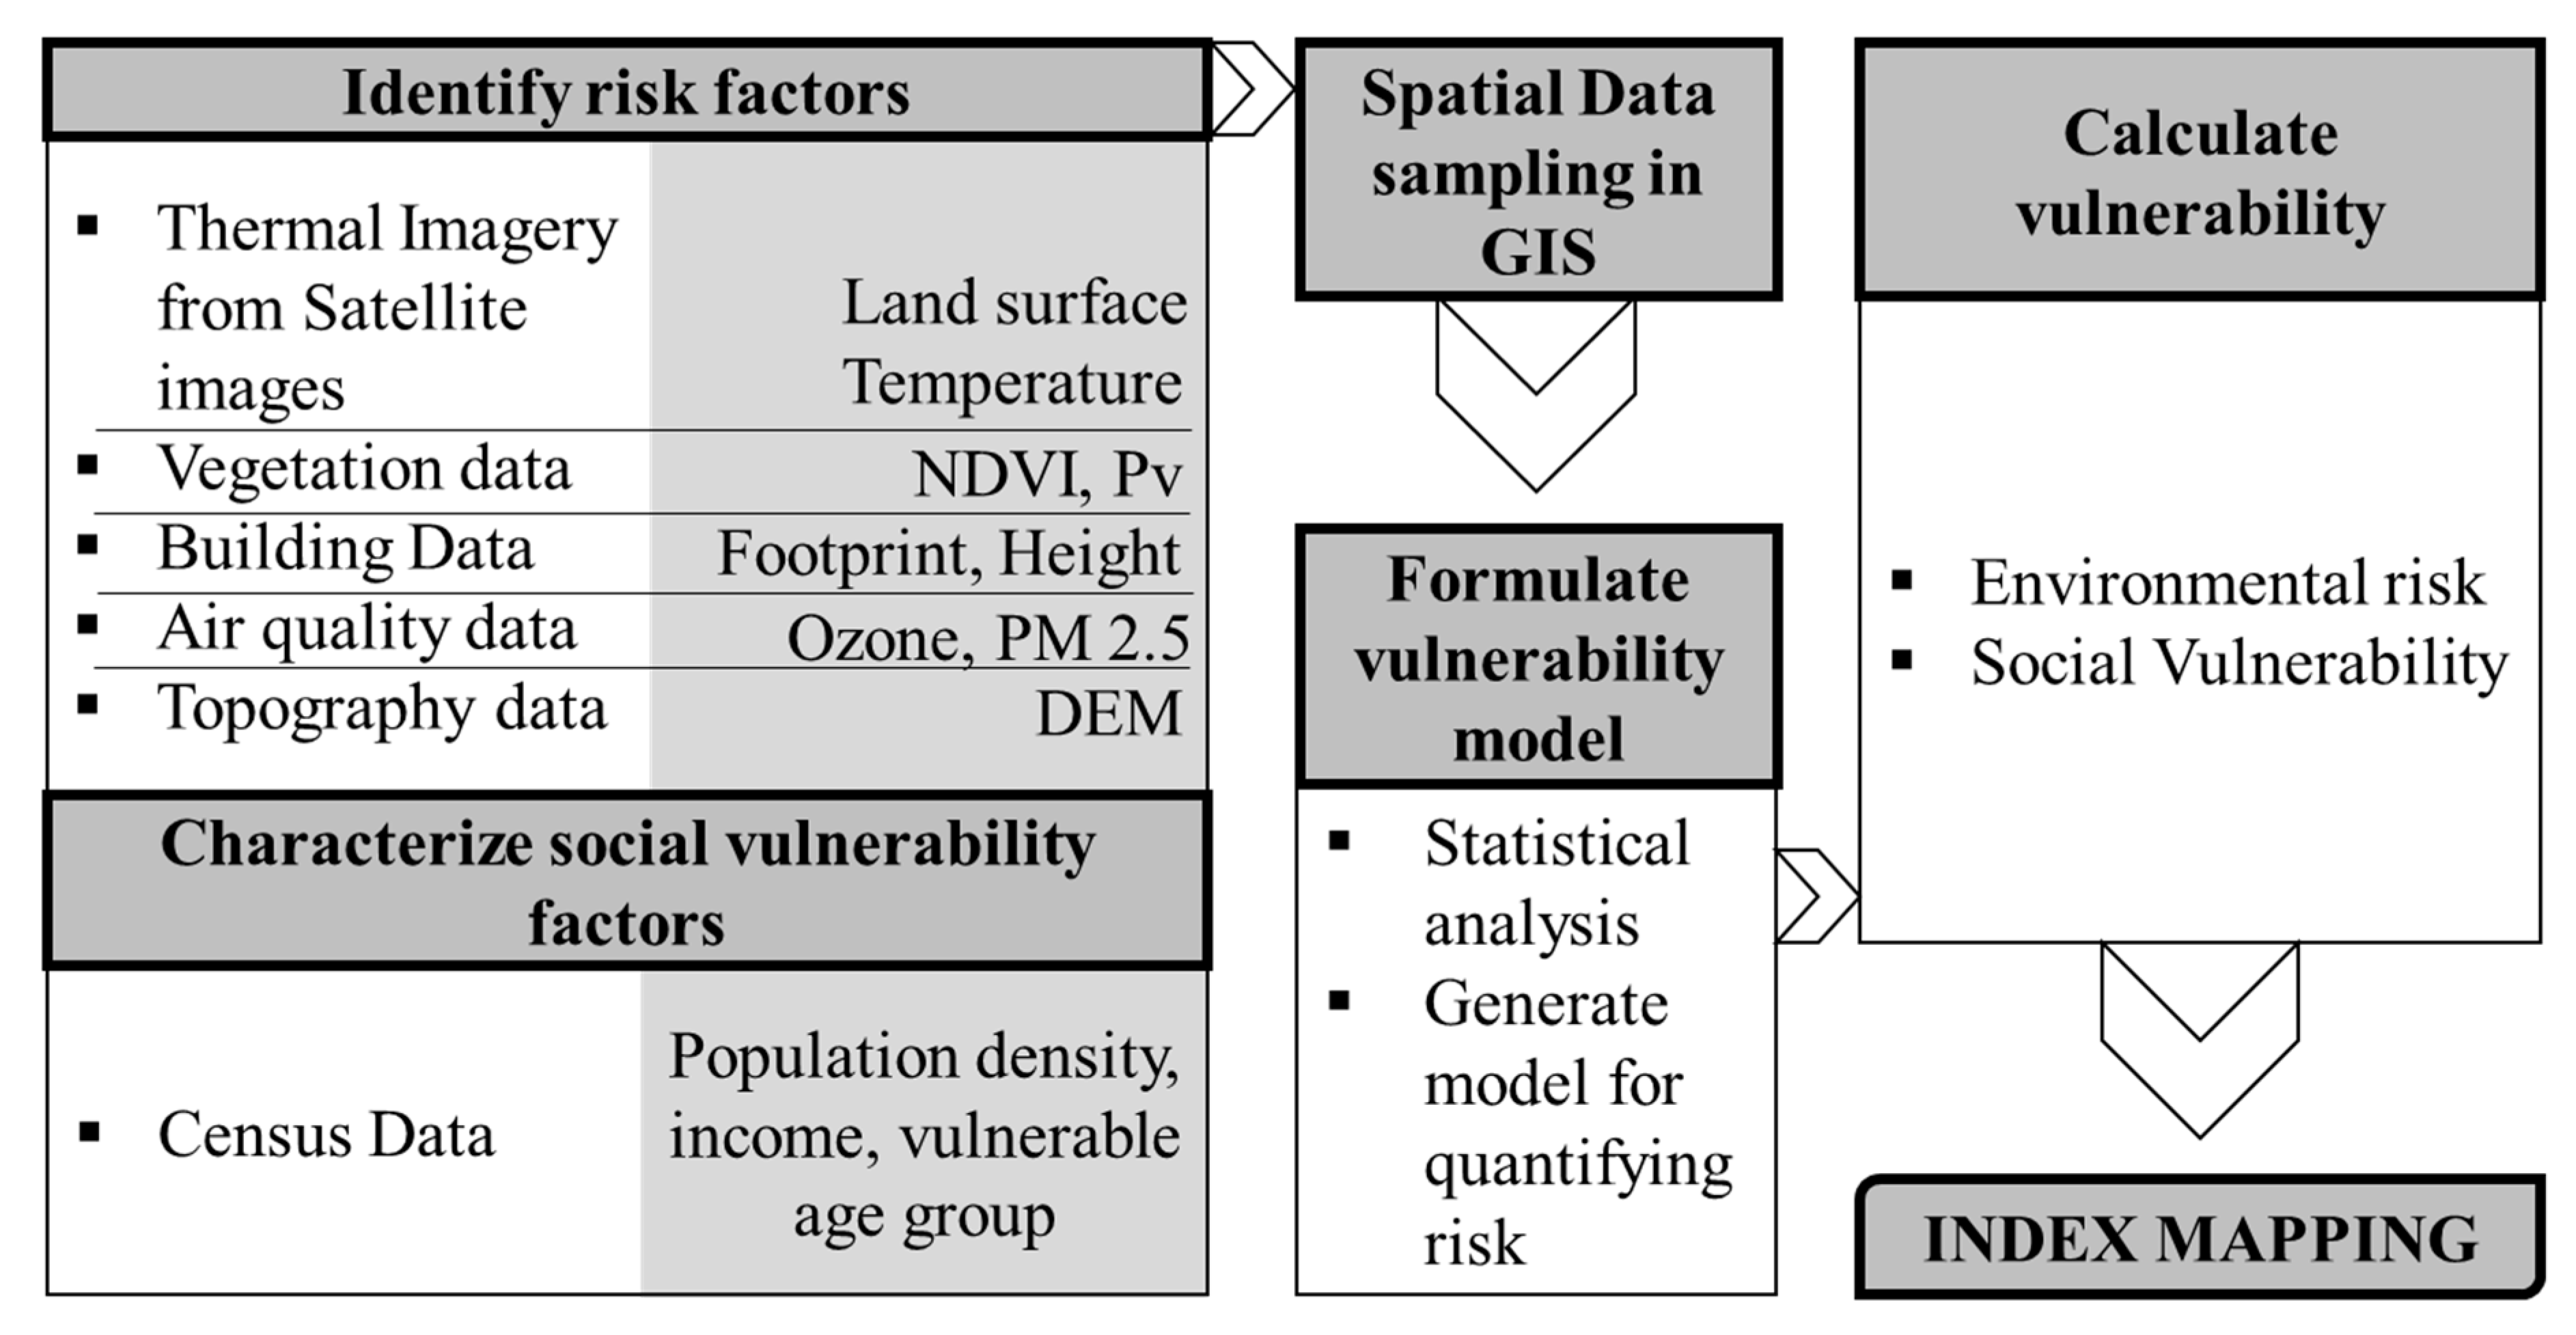
3. Methodology
4. Data Collection
5. Analysis and Discussion
5.1. Risk Index Models
5.2. Model Results
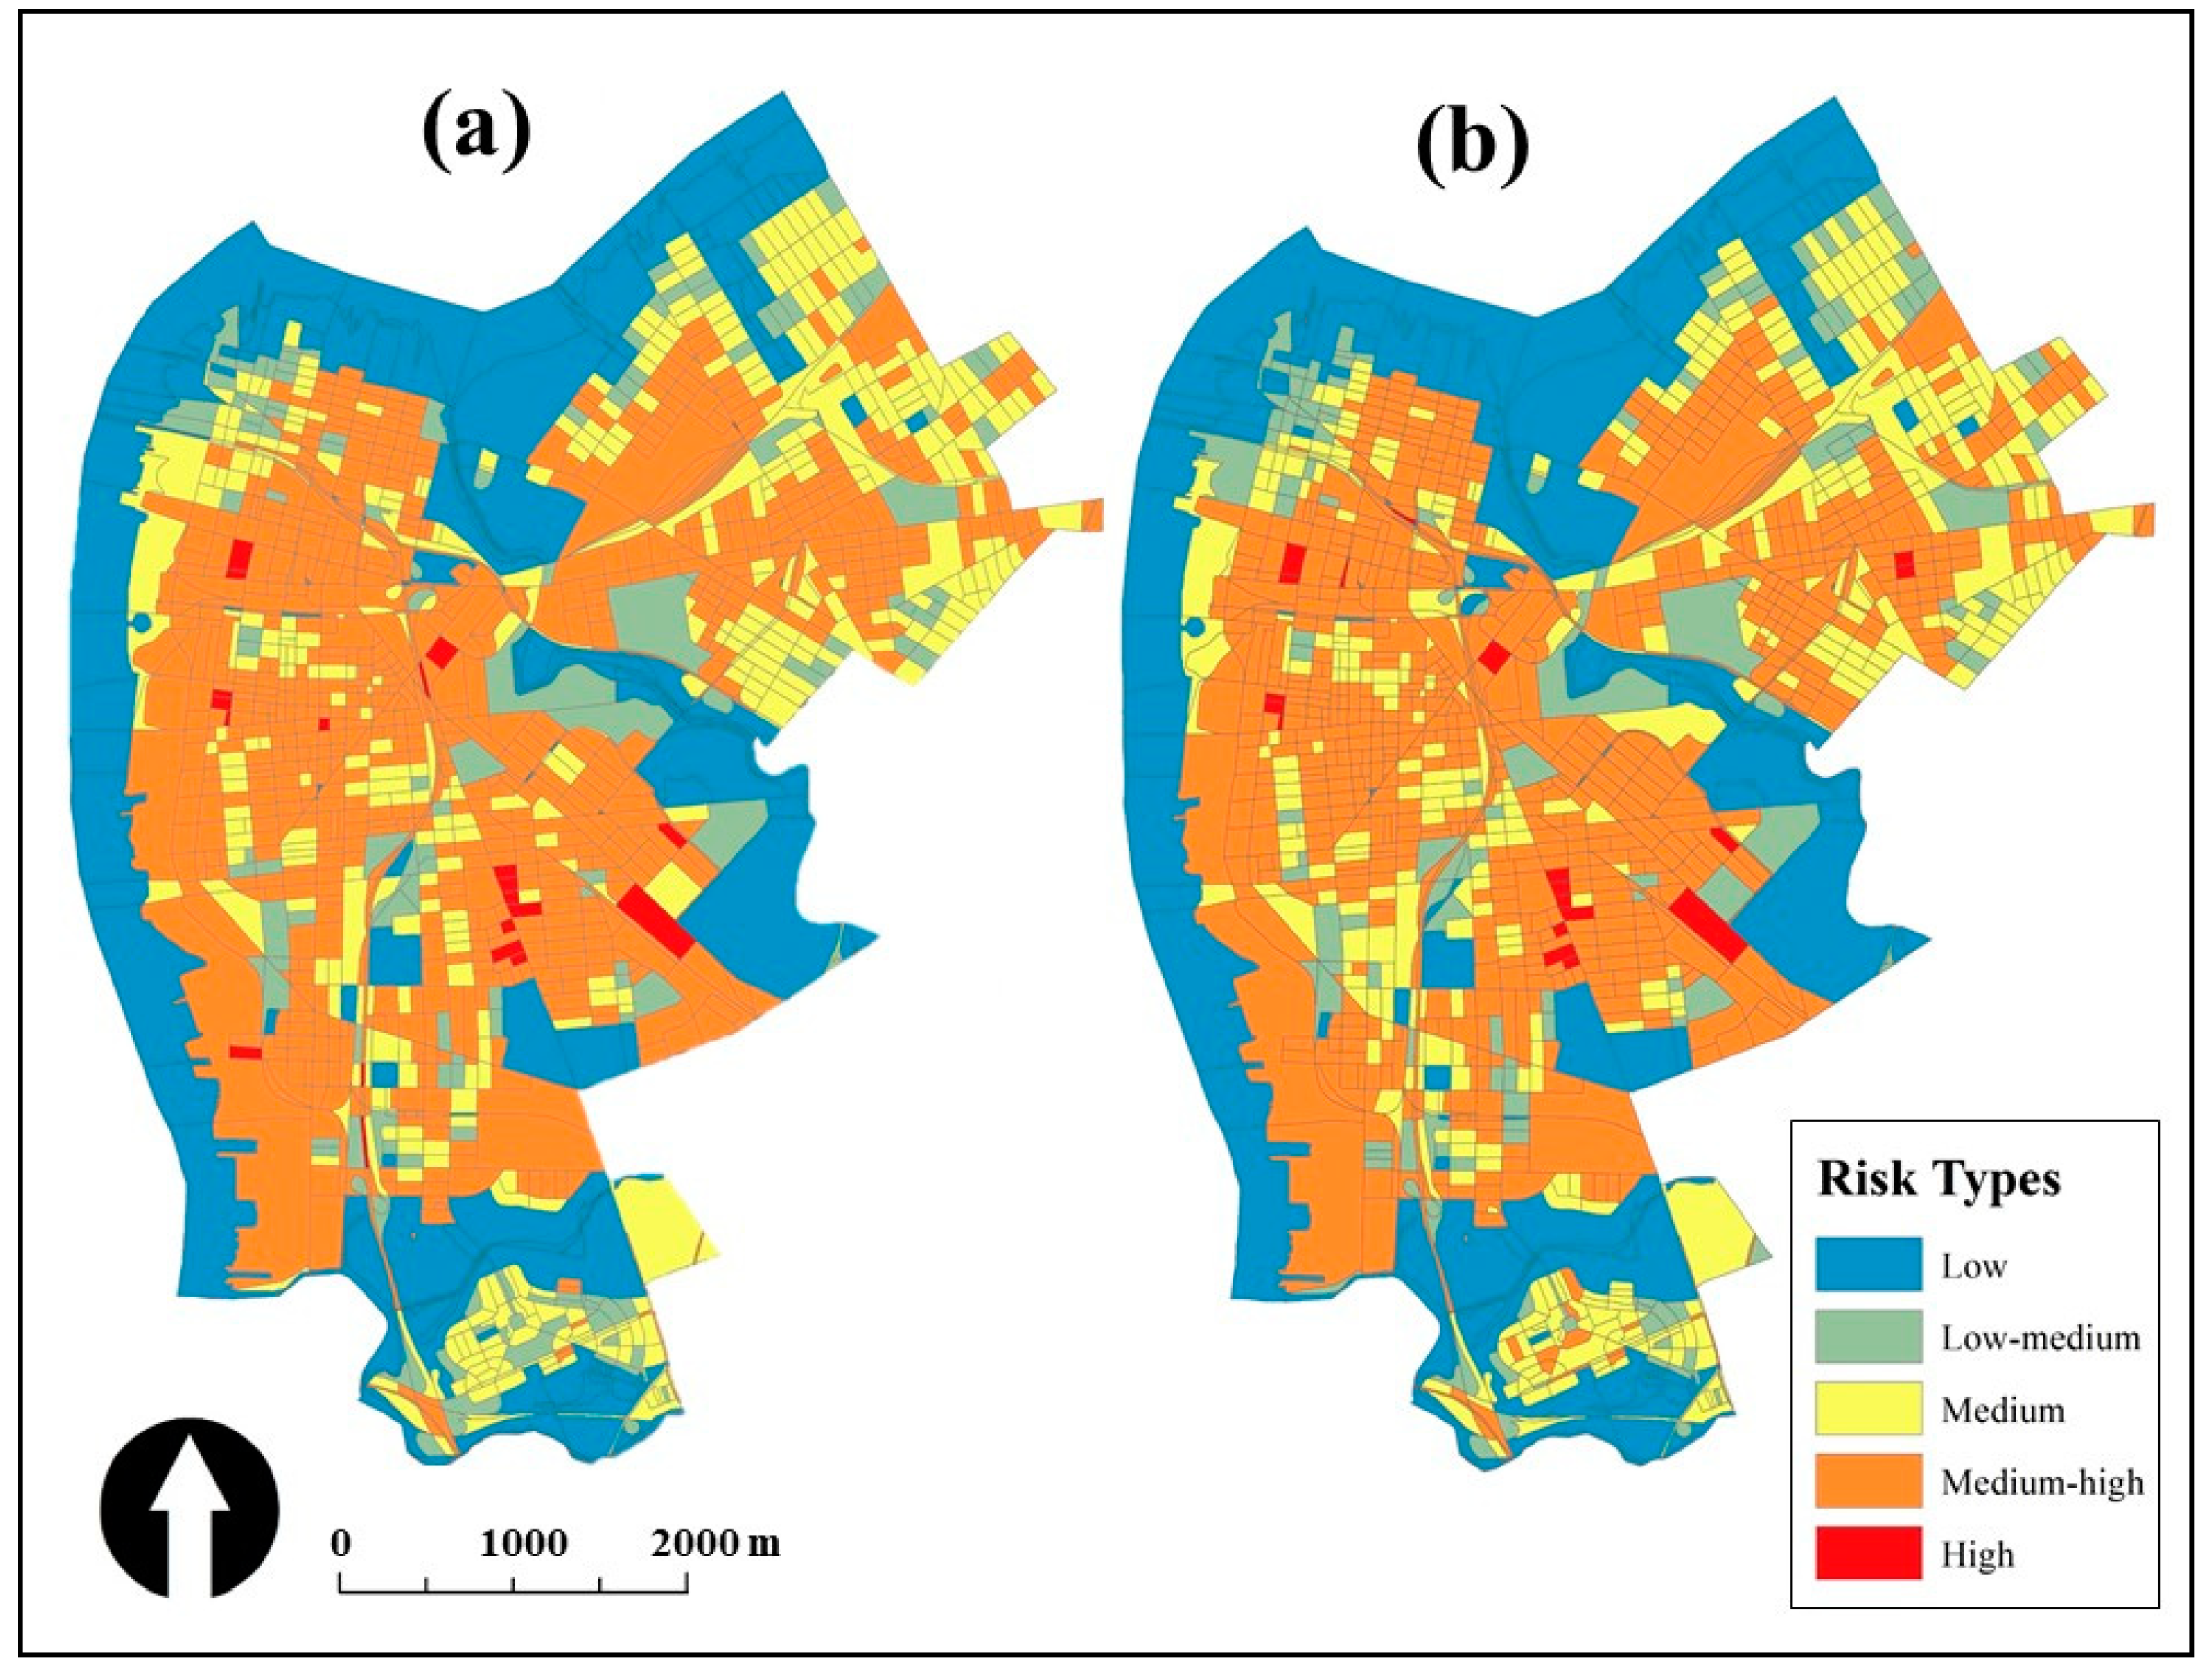
5.3. Index Mapping to Identify Vulnerability
6. Conclusions
Author Contributions
Funding
Conflicts of Interest
References
- Kohler, M.; Tannier, C.; Blond, N.; Aguejdad, R.; Clappier, A. Impacts of several urban-sprawl countermeasures on building (space heating) energy demands and urban heat island intensities. A case study. Urban Clim. 2017, 19, 92–121. [Google Scholar] [CrossRef]
- Karimi, M.; Nazari, R.; Dutova, D.; Khanbilvardi, R.; Ghandehari, M. A conceptual framework for environmental risk and social vulnerability assessment in complex urban settings. Urban Clim. 2018, 26, 161–173. [Google Scholar] [CrossRef]
- Seto, K.C.; Shepherd, J.M. Global urban land-use trends and climate impacts. Curr. Opin. Environ. Sustain. 2009, 1, 89–95. [Google Scholar] [CrossRef]
- Zhang, P.; Imhoff, M.L.; Wolfe, R.E.; Bounoua, L. Characterizing urban heat islands of global settlements using MODIS and nighttime lights products. Can. J. Remote Sens. 2010, 36, 185–196. [Google Scholar] [CrossRef] [Green Version]
- Stone, B.; Vargo, J.; Habeeb, D. Managing climate change in cities: Will climate action plans work? Landsc. Urban Plan. 2012, 107, 263–271. [Google Scholar] [CrossRef]
- Fahad, M.G.R.; Saiful Islam, A.; Nazari, R.; Alfi Hasan, M.; Tarekul Islam, G.; Bala, S.K. Regional changes of precipitation and temperature over Bangladesh using bias-corrected multi-model ensemble projections considering high-emission pathways. Int. J. Climatol. 2018, 38, 1634–1648. [Google Scholar] [CrossRef]
- Limaye, V.S.; Vargo, J.; Harkey, M.; Holloway, T.; Patz, J.A. Climate change and heat-related excess mortality in the Eastern USA. EcoHealth 2018, 15, 485–496. [Google Scholar] [CrossRef]
- Anderson, G.B.; Bell, M.L. Heat waves in the United States: Mortality risk during heat waves and effect modification by heat wave characteristics in 43 US communities. Environ. Health Perspect. 2011, 119, 210–218. [Google Scholar] [CrossRef] [Green Version]
- Montero, J.; Mirón, I.; Criado-Álvarez, J.; Linares, C.; Díaz, J. Influence of local factors in the relationship between mortality and heat waves: Castile-La Mancha (1975–2003). Sci. Total Environ. 2012, 414, 73–80. [Google Scholar] [CrossRef]
- World Health Organization. Quantitative Risk Assessment of the Effects of Climate Change on Selected Causes of Death, 2030s and 2050s; WHO: Geneva, Switzerland, 2014. [Google Scholar]
- Jerrett, M.; Burnett, R.T.; Pope, C.A., III; Ito, K.; Thurston, G.; Krewski, D.; Shi, Y.; Calle, E.; Thun, M. Long-term ozone exposure and mortality. N. Engl. J. Med. 2009, 360, 1085–1095. [Google Scholar] [CrossRef] [Green Version]
- Ghude, S.D.; Chate, D.; Jena, C.; Beig, G.; Kumar, R.; Barth, M.; Pfister, G.; Fadnavis, S.; Pithani, P. Premature mortality in India due to PM2. 5 and ozone exposure. Geophys. Res. Lett. 2016, 43, 4650–4658. [Google Scholar] [CrossRef] [Green Version]
- Sun, J.; Fu, J.S.; Huang, K.; Gao, Y. Estimation of future PM2.5-and ozone-related mortality over the continental United States in a changing climate: An application of high-resolution dynamical downscaling technique. J. Air Waste Manag. Assoc. 2015, 65, 611–623. [Google Scholar] [CrossRef] [Green Version]
- U.S. EPA. The Benefits and Costs of the Clean Air Act: 1990 to 2010; Office of Air and Radiation: Washington, DC, USA, 2011. Available online: https://www.epa.gov/sites/production/files/2015-07/documents/fullrept.pdf (accessed on 26 May 2020).
- Stafoggia, M.; Schwartz, J.; Forastiere, F.; Perucci, C. Does temperature modify the association between air pollution and mortality? A multicity case-crossover analysis in Italy. Am. J. Epidemiol. 2008, 167, 1476–1485. [Google Scholar] [CrossRef] [Green Version]
- Kim, S.E.; Lim, Y.-H.; Kim, H. Temperature modifies the association between particulate air pollution and mortality: A multi-city study in South Korea. Sci. Total Environ. 2015, 524, 376–383. [Google Scholar] [CrossRef]
- Heaviside, C.; Macintyre, H.; Vardoulakis, S. The urban heat island: Implications for health in a changing environment. Curr. Environ. Health Rep. 2017, 4, 296–305. [Google Scholar] [CrossRef]
- Birkmann, J.; Böhm, H.R.; Buchholz, F.; Büscher, D.; Daschkeit, A.; Ebert, S.; Fleischhauer, M.; Frommer, B.; Köhler, S.; Kufeld, W. Klimawandel und Raumentwicklung. Glossar Klimawandel und Raumentwicklung. E-paper der ARL No. 10. Hanover. 2013. Available online: http://nbn-resolving.de/urn:nbn:de:0156-73571 (accessed on 28 January 2020).
- Birkmann, J.; Bach, C.; Vollmer, M. Tools for resilience building and adaptive spatial governance. Raumforsch. Raumordn. 2012, 70, 293–308. [Google Scholar] [CrossRef]
- Riegel, C.; Trum, A.; Maximini, C.; Vallée, D. Klimaschutzteilkonzept “Anpassung an den Klimawandel für die Städte Solingen und Remscheid”; ISB: Aachen, Germany, 2013; Available online: http://www.bergisches-dreieck.de/fileadmin/user_upload/wirtschaftsregion/PDFs/Taetigkeitsbericht_2012_b.pdf (accessed on 29 January 2020).
- Leal Filho, W.; Icaza, L.E.; Neht, A.; Klavins, M.; Morgan, E.A. Coping with the impacts of urban heat islands. A literature based study on understanding urban heat vulnerability and the need for resilience in cities in a global climate change context. J. Clean. Prod. 2018, 171, 1140–1149. [Google Scholar] [CrossRef] [Green Version]
- Uddin, M.N.; Islam, A.S.; Bala, S.K.; Islam, G.T.; Adhikary, S.; Saha, D.; Haque, S.; Fahad, M.G.R.; Akter, R. Mapping of climate vulnerability of the coastal region of Bangladesh using principal component analysis. Appl. Geogr. 2019, 102, 47–57. [Google Scholar] [CrossRef]
- Harlan, S.L.; Ruddell, D.M. Climate change and health in cities: Impacts of heat and air pollution and potential co-benefits from mitigation and adaptation. Curr. Opin. Environ. Sustain. 2011, 3, 126–134. [Google Scholar] [CrossRef]
- Basu, R. High ambient temperature and mortality: A review of epidemiologic studies from 2001 to 2008. Environ. Health 2009, 8, 40. [Google Scholar] [CrossRef] [Green Version]
- Johnson, D.P.; Stanforth, A.; Lulla, V.; Luber, G. Developing an applied extreme heat vulnerability index utilizing socioeconomic and environmental data. Appl. Geogr. 2012, 35, 23–31. [Google Scholar] [CrossRef]
- Reid, C.E.; O’neill, M.S.; Gronlund, C.J.; Brines, S.J.; Brown, D.G.; Diez-Roux, A.V.; Schwartz, J. Mapping community determinants of heat vulnerability. Environ. Health Perspect. 2009, 117, 1730–1736. [Google Scholar] [CrossRef]
- Rosenthal, J.K.; Kinney, P.L.; Metzger, K.B. Intra-urban vulnerability to heat-related mortality in New York City, 1997–2006. Health Place 2014, 30, 45–60. [Google Scholar] [CrossRef] [Green Version]
- Rosenthal, J.K.; Brechwald, D. Climate adaptive planning for preventing heat-related health impacts in New York City. In Climate Change Governance; Springer: Berlin/Heidelberg, Germany, 2013; pp. 205–225. [Google Scholar]
- Donaldson, G.; Keatinge, W.; Näyhä, S. Changes in summer temperature and heat-related mortality since 1971 in North Carolina, South Finland, and Southeast England. Environ. Res. 2003, 91, 1–7. [Google Scholar] [CrossRef]
- Wolf, T.; McGregor, G. The development of a heat wave vulnerability index for London, United Kingdom. Weather Clim. Extrem. 2013, 1, 59–68. [Google Scholar] [CrossRef] [Green Version]
- Méndez-Lázaro, P.; Muller-Karger, F.E.; Otis, D.; McCarthy, M.J.; Rodríguez, E. A heat vulnerability index to improve urban public health management in San Juan, Puerto Rico. Int. J. Biometeorol. 2018, 62, 709–722. [Google Scholar] [CrossRef]
- O’Lenick, C.R.; Wilhelmi, O.V.; Michael, R.; Hayden, M.H.; Baniassadi, A.; Wiedinmyer, C.; Monaghan, A.J.; Crank, P.J.; Sailor, D.J. Urban heat and air pollution: A framework for integrating population vulnerability and indoor exposure in health risk analyses. Sci. Total Environ. 2019, 660, 715–723. [Google Scholar] [CrossRef]
- Gray, A.R. Analyzing the Urban Heat Island Effect in the City of Westminster, Maryland, with Attention to Mitigative and Adaptive Measures. Master’s Thesis, Towson University, Towson, MD, USA, 2019. Available online: http://hdl.handle.net/11603/14291 (accessed on 31 January 2020).
- Lesnikowski, A. Adaptation to Urban Heat Island Effect in Vancouver, BC: A Case Study in Analyzing Vulnerability and Adaptation Opportunities. Ph. D. Thesis, University of British Columbia, Vancouver, BC, Canada, 2014. Available online: https://open.library.ubc.ca/collections/graduateresearch/310/items/1.0075852 (accessed on 31 January 2020).
- Sanchez, L.; Reames, T.G. Cooling Detroit: A socio-spatial analysis of equity in green roofs as an urban heat island mitigation strategy. Urban For. Urban Green. 2019, 44, 126331. [Google Scholar] [CrossRef]
- Santamouris, M. Recent progress on urban overheating and heat island research. Integrated assessment of the energy, environmental, vulnerability and health impact. Synerg. Glob. Clim. Chang. Energy Build. 2020, 207, 109482. [Google Scholar]
- Solecki, W.; Rosenzweig, C.; Pope, G.; Chopping, M.; Goldberg, R.; Polissar, A. Urban Heat Island and Climate Change: An Assessment of Interacting and Possible Adaptations in the Camden, New Jersey Region. Environmental Assessment and Risk Analysis Element. Research Project Summary. State of New Jersey, Department of Environmental Protection, Division of Science, Research and Technology, 5p. 2004. Available online: https://www.state.nj.us/dep/dsr/research/urbanheat.pdf (accessed on 15 September 2019).
- Solecki, W.D.; Rosenzweig, C.; Parshall, L.; Pope, G.; Clark, M.; Cox, J.; Wiencke, M. Mitigation of the heat island effect in urban New Jersey. Glob. Environ. Chang. Part B Environ. Hazards 2005, 6, 39–49. [Google Scholar] [CrossRef]
- State of New Jersey, Department of Health. Camden County. Available online: https://www.state.nj.us/health/ceohs/environmental-occupational/hazardous-waste-sites/camden/ (accessed on 2 December 2019).
- City of Camden, Camden Redevelopment Agency. Available online: http://camdenredevelopment.org/ (accessed on 30 November 2019).
- Ridlington, E.; Leavitt, C. Trouble in the Air; Environment America Research & Policy Center: Denver, CO, USA, 2018; Available online: https://environmentamerica.org/sites/environment/files/reports/Trouble%20in%20the%20Air%20vUS.pdf (accessed on 31 January 2020).
- Jahan, K.; Orlins, J.; Hasse, J.; Everett, J.; Miller, D. Community outreach for watershed protection. Proc. Water Environ. Fed. 2004, 2004, 1364–1377. [Google Scholar] [CrossRef]
- Lai, L.-W.; Cheng, W.-L. Air quality influenced by urban heat island coupled with synoptic weather patterns. Sci. Total Environ. 2009, 407, 2724–2733. [Google Scholar] [CrossRef]
- Lai, L.-W.; Cheng, W.-L. 0> Urban Heat Island and Air Pollution—An Emerging Role for Hospital Respiratory Admissions in an Urban Area. J. Environ. Health 2010, 72, 32–36. [Google Scholar]
- Kovats, R.S.; Hajat, S. Heat stress and public health: A critical review. Annu. Rev. Public Health 2008, 29, 41–55. [Google Scholar] [CrossRef]
- Chen, K.; Wolf, K.; Breitner, S.; Gasparrini, A.; Stafoggia, M.; Samoli, E.; Andersen, Z.J.; Bero-Bedada, G.; Bellander, T.; Hennig, F. Two-way effect modifications of air pollution and air temperature on total natural and cardiovascular mortality in eight European urban areas. Environ. Int. 2018, 116, 186–196. [Google Scholar] [CrossRef]
- De Sario, M.; Katsouyanni, K.; Michelozzi, P. Climate change, extreme weather events, air pollution and respiratory health in Europe. Eur. Respir. J. 2013, 42, 826–843. [Google Scholar] [CrossRef] [Green Version]
- Karimi, M.; Nazari, R.; Vant-Hull, B.; Khanbilvardi, R. Urban Heat Island Assessment with Temperature Maps Using High Resolution Datasets Measured at Street Level. Int. J. Constr. Environ. 2015, 6, 17–28. [Google Scholar] [CrossRef]
- Shen, X.; Cao, L.; Liu, K.; She, G.; Ruan, H. Aboveground biomass estimation in a subtropical forest using airborne hyperspectral data. In Proceedings of the 2016 4th International Workshop on Earth Observation and Remote Sensing Applications (EORSA), Guangzhou, China, 4–6 July 2016; IEEE: Piscataway, NJ, USA, 2016; pp. 391–394. [Google Scholar]
- Hofierka, J.; Gallay, M.; Onačillová, K.; Hofierka, J., Jr. Physically-based land surface temperature modeling in urban areas using a 3-D city model and multispectral satellite data. Urban Clim. 2020, 31, 100566. [Google Scholar] [CrossRef]
- Equere, V.; Mirzaei, P.A.; Riffat, S. Definition of a new morphological parameter to improve prediction of urban heat island. Sustain. Cities Soc. 2020, 56, 102021. [Google Scholar] [CrossRef]
- Dian, C.; Pongrácz, R.; Dezső, Z.; Bartholy, J. Annual and monthly analysis of surface urban heat island intensity with respect to the local climate zones in Budapest. Urban Clim. 2020, 31, 100573. [Google Scholar] [CrossRef]
- Galdies, C.; Lau, H.S. Urban Heat Island Effect, Extreme Temperatures and Climate Change: A Case Study of Hong Kong SAR. In Climate Change, Hazards and Adaptation Options; Springer: Berlin/Heidelberg, Germany, 2020; pp. 369–388. [Google Scholar]
- Chakraborty, T.; Hsu, A.; Manya, D.; Sheriff, G. Urban Heat Island Calculations for Decision Making in the United States: Characterization and Implications. EarthArXiv. 2020. Available online: https://0-doi-org.brum.beds.ac.uk/10.31223/osf.io/59tf8 (accessed on 25 April 2020).
- Portela, C.I.; Massi, K.G.; Rodrigues, T.; Alcântara, E. Impact of urban and industrial features on land surface temperature: Evidences from satellite thermal indices. Sustain. Cities Soc. 2020, 56, 102100. [Google Scholar] [CrossRef]
- Sobrino, J.A.; Jiménez-Muñoz, J.C.; Sòria, G.; Romaguera, M.; Guanter, L.; Moreno, J.; Plaza, A.; Martínez, P. Land surface emissivity retrieval from different VNIR and TIR sensors. IEEE Trans. Geosci. Remote Sens. 2008, 46, 316–327. [Google Scholar] [CrossRef]
- Stathopoulou, M.; Cartalis, C. Daytime urban heat islands from Landsat ETM+ and Corine land cover data: An application to major cities in Greece. Sol. Energy 2007, 81, 358–368. [Google Scholar] [CrossRef]
- Ivajnšič, D.; Kaligarič, M.; Žiberna, I. Geographically weighted regression of the urban heat island of a small city. Appl. Geogr. 2014, 53, 341–353. [Google Scholar] [CrossRef]
- Patro, S.; Sahu, K.K. Normalization: A preprocessing stage. arxiv 2015, arXiv:1503.06462. [Google Scholar] [CrossRef]


| ERII Parameters (E) | Coefficient | VIF Value | Social Parameters (S) | Coefficient | VIF Value | Correlation with LST |
|---|---|---|---|---|---|---|
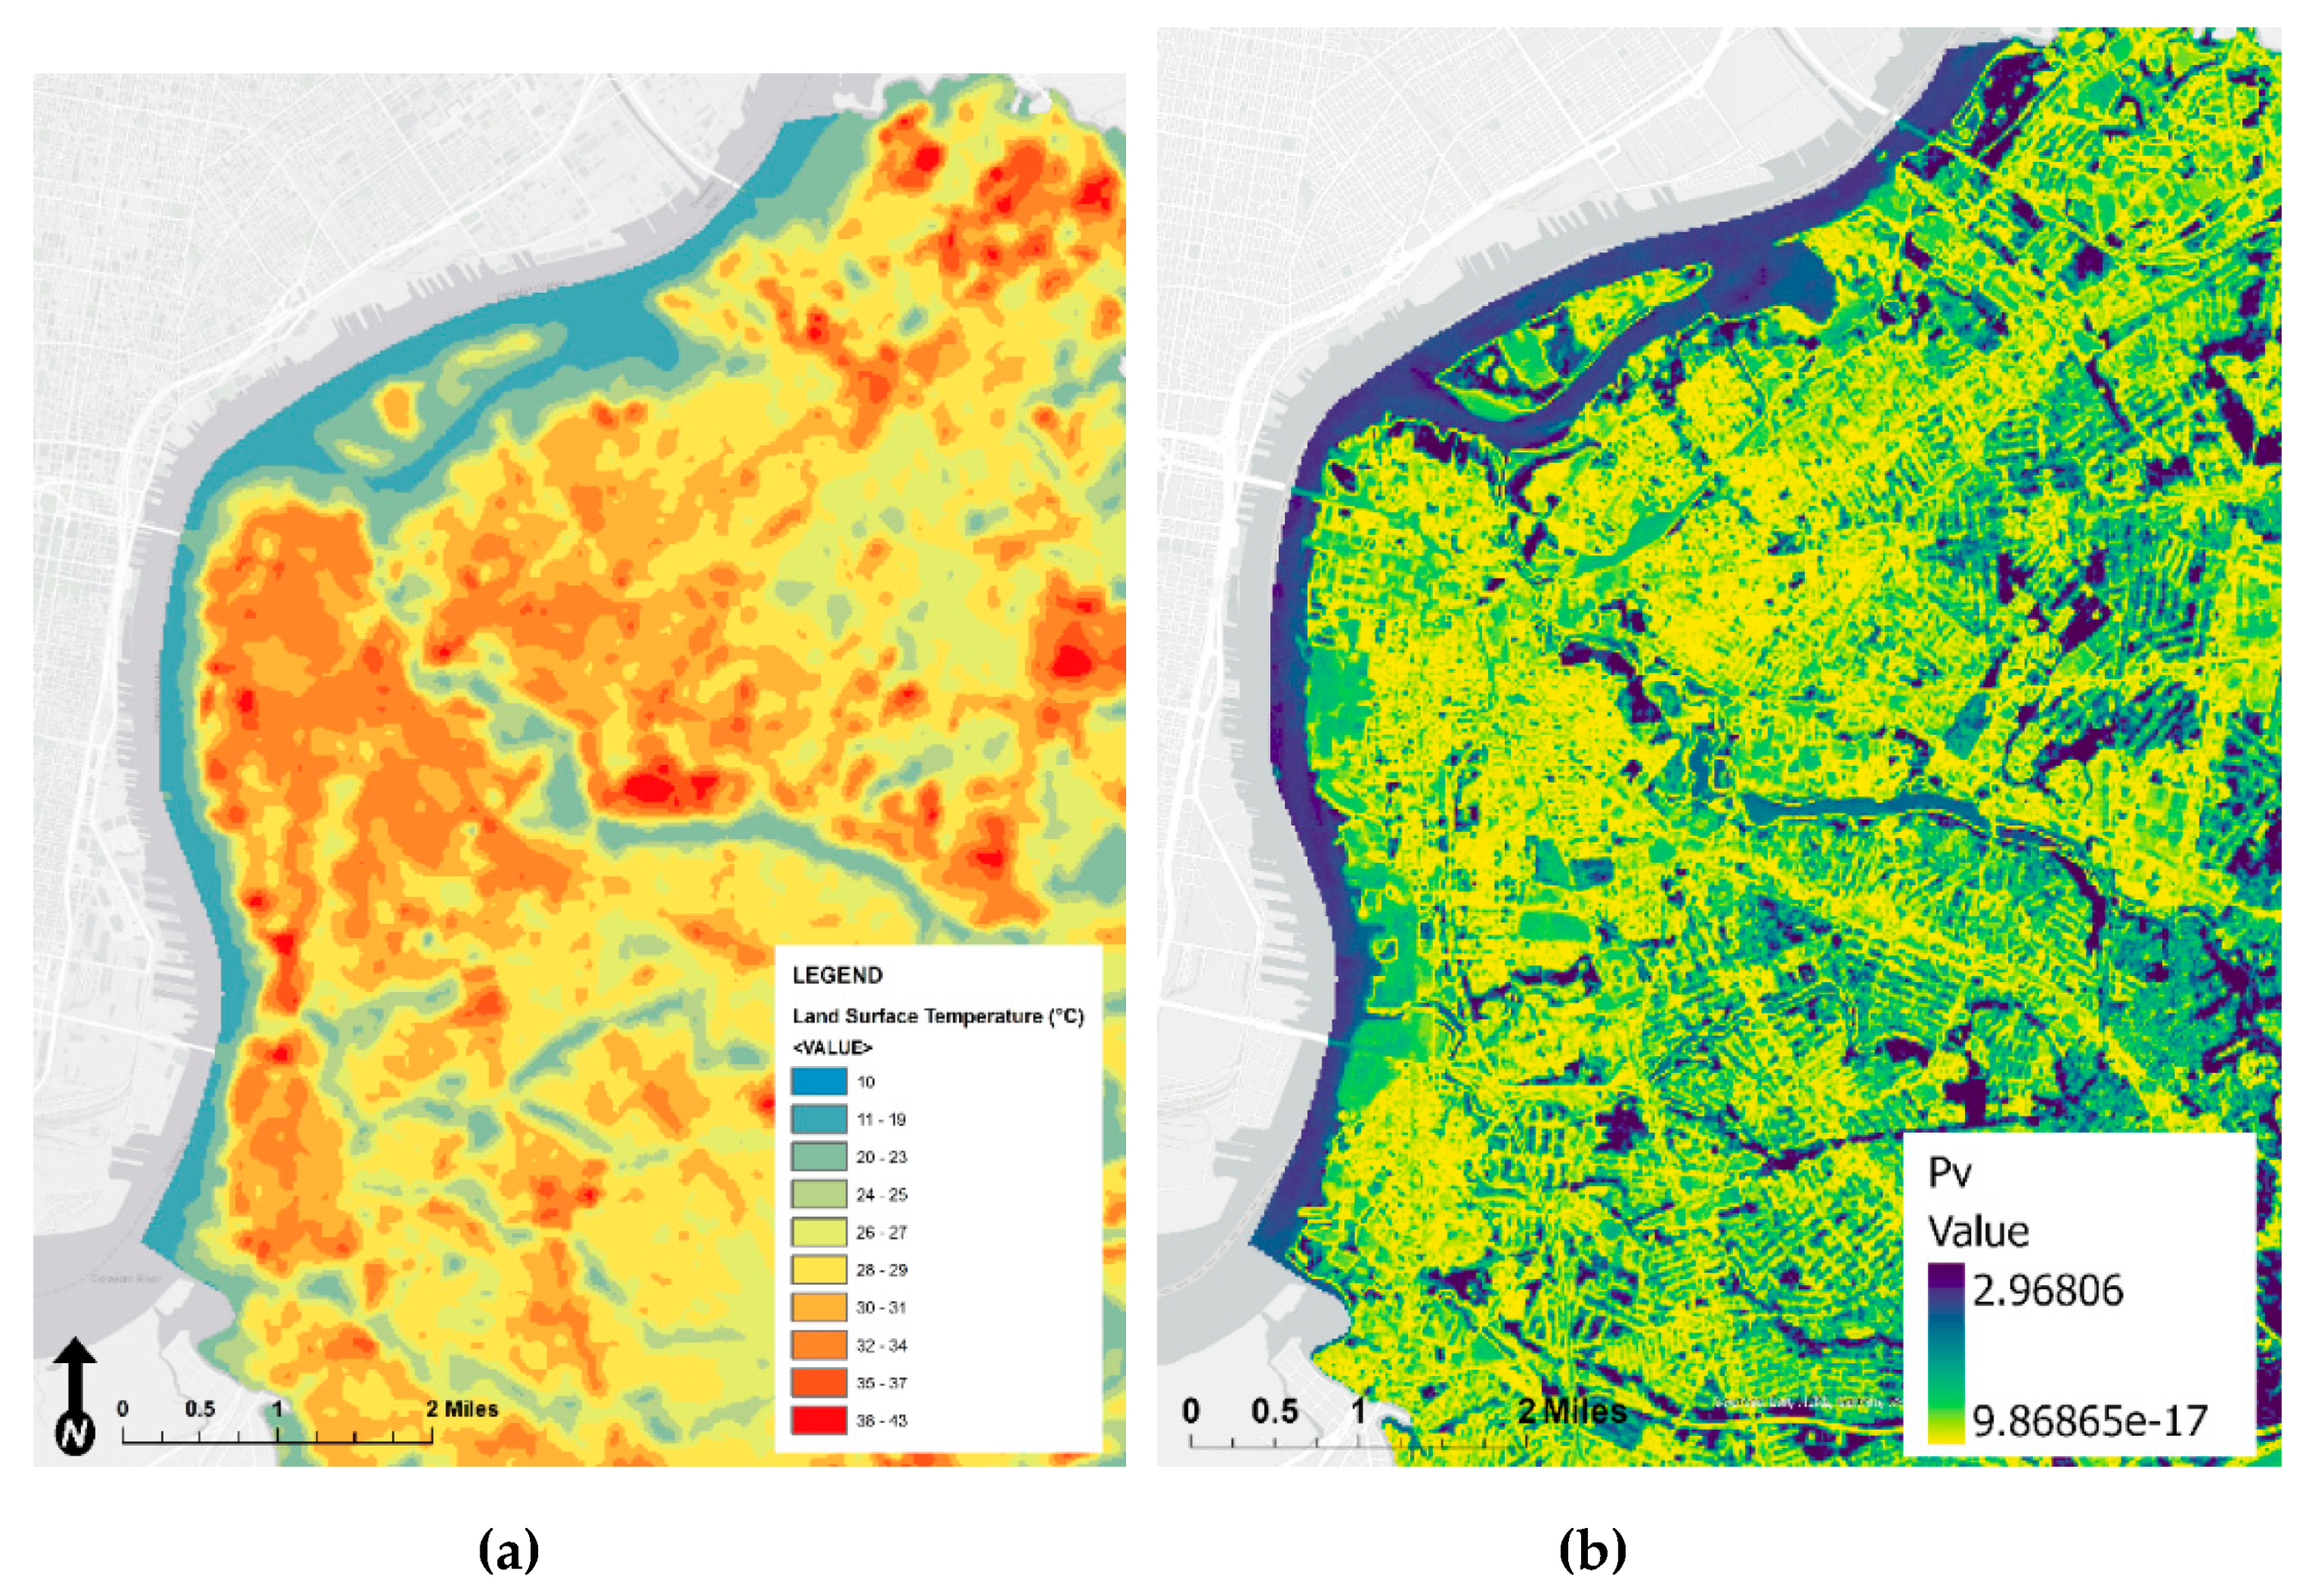
| Proportional vegetation (Pv) | −2.83 *** (b) | 1.65 | Proportional vegetation (Pv) | −2.683 *** (b′) | 1.71 | 0.65 *** |
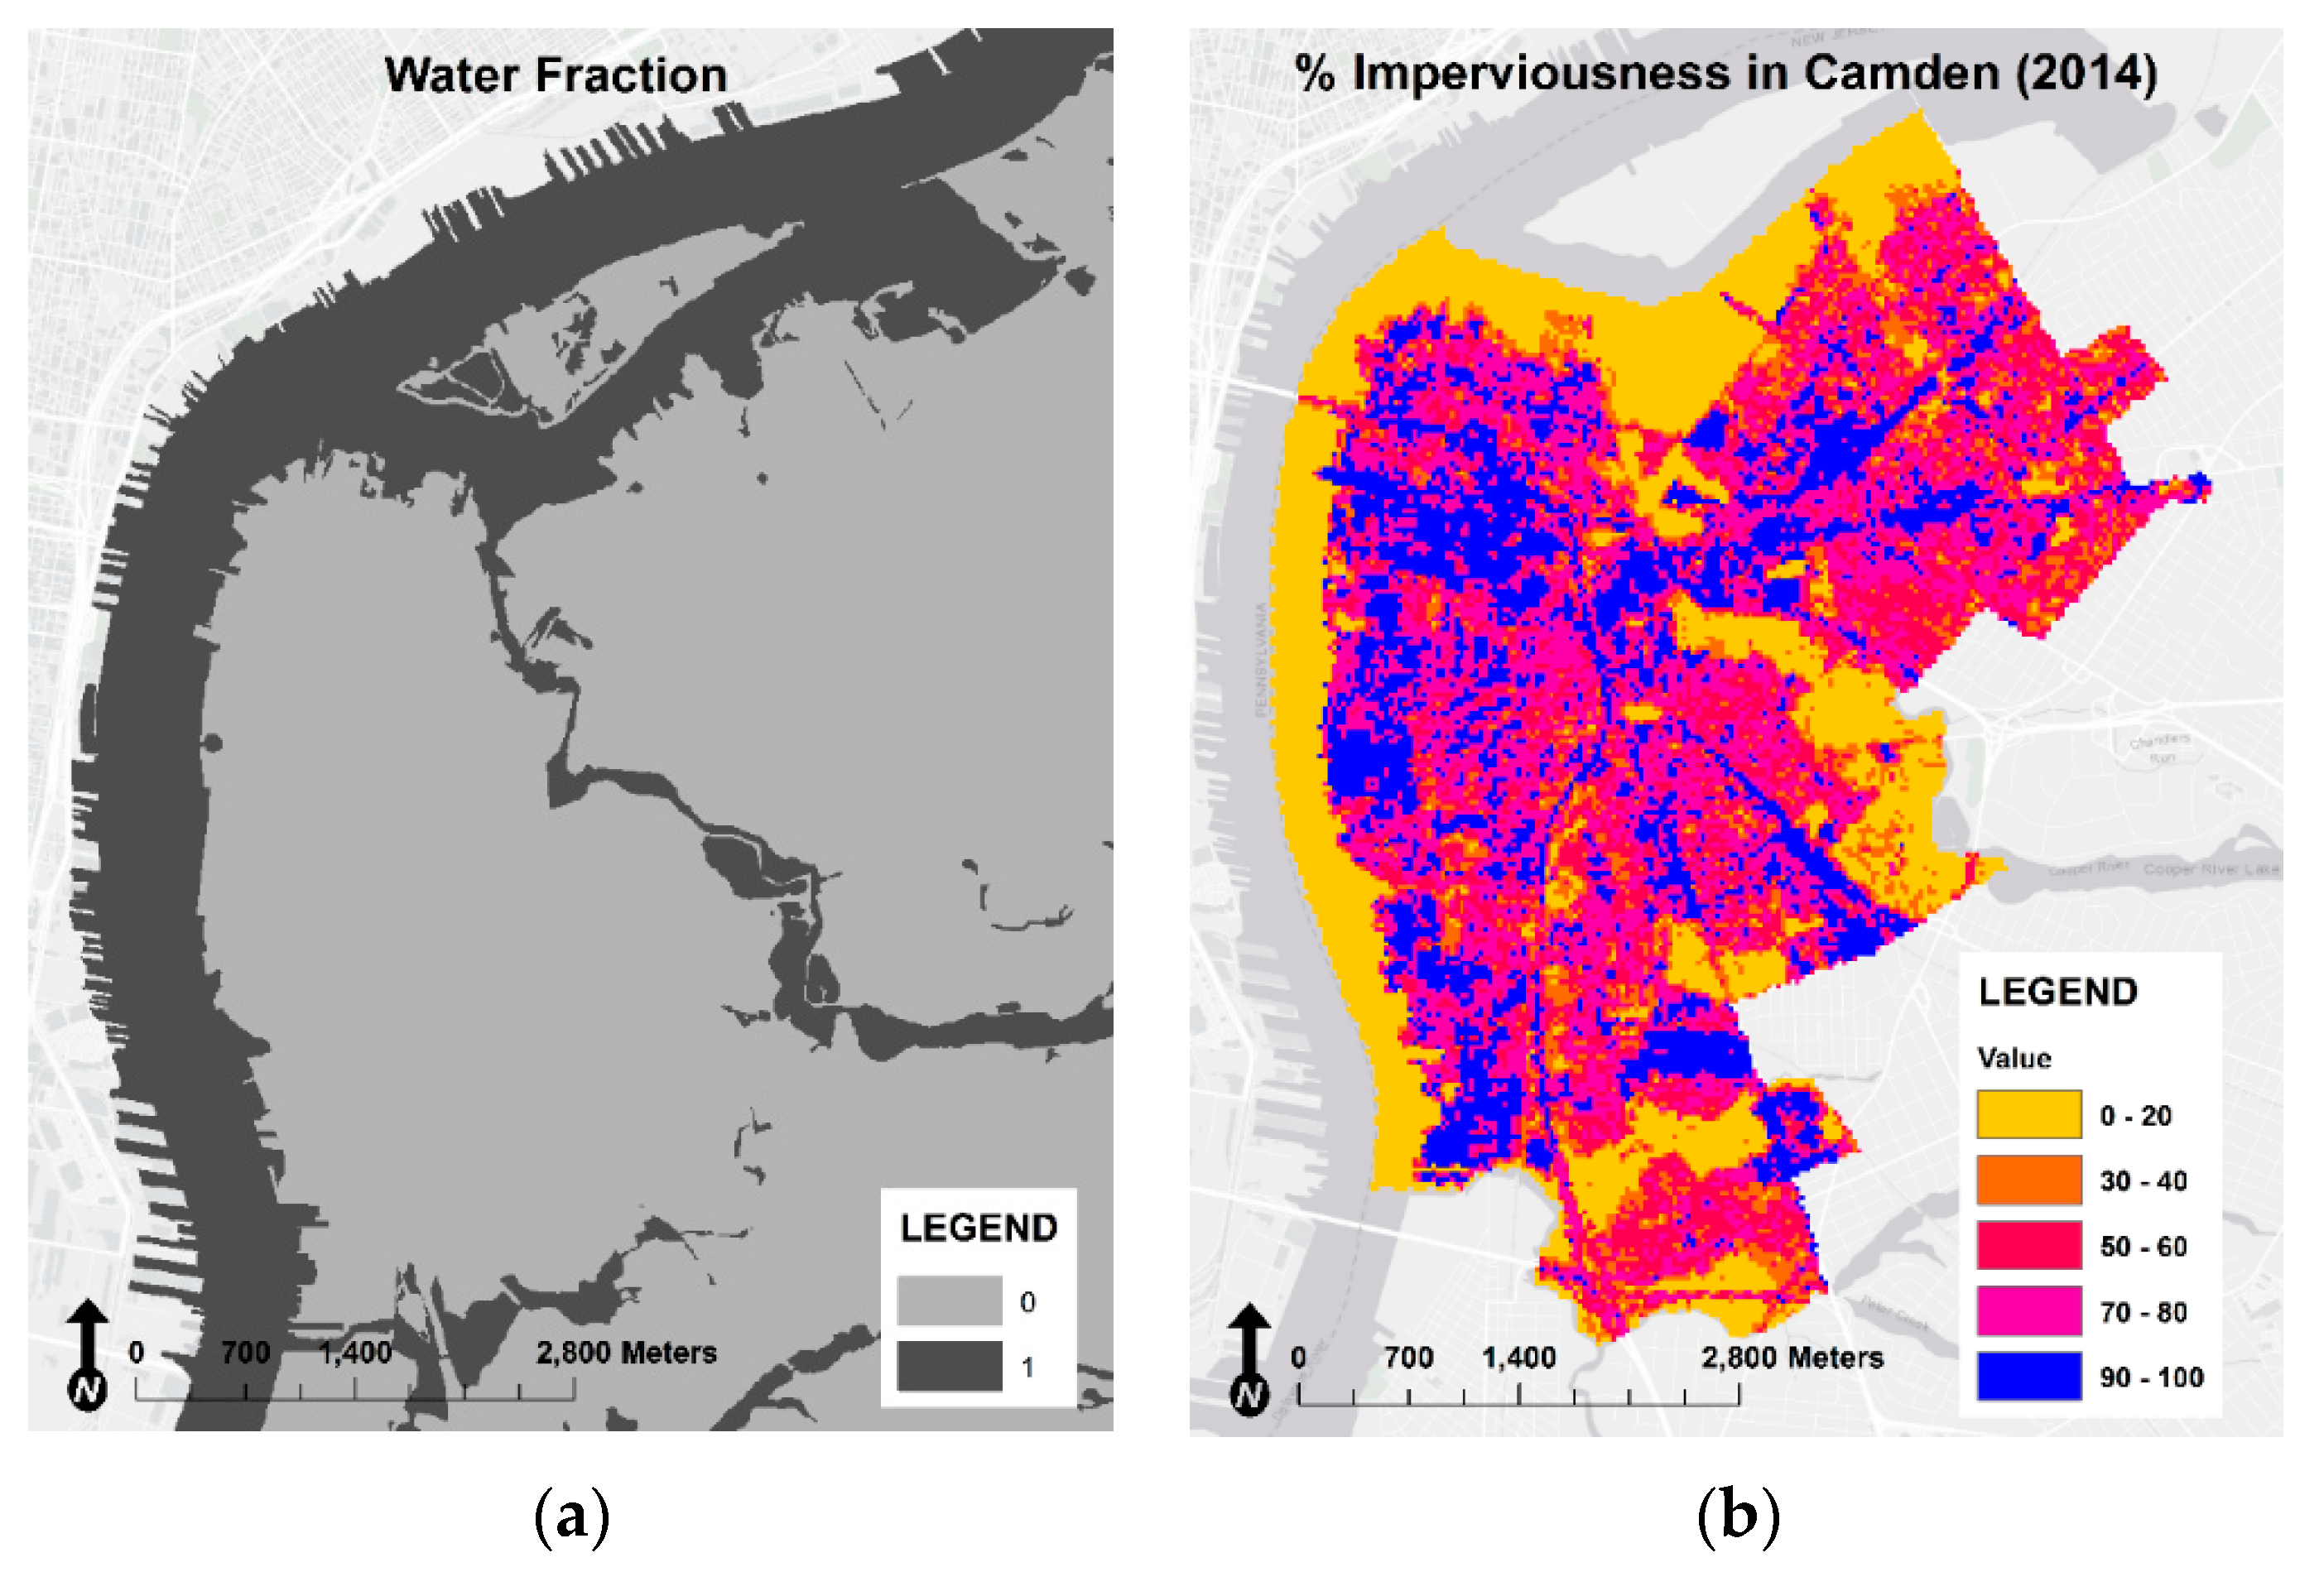
| Water fraction (Wf) | −4.16 *** (c) | 2.24 | Water fraction (Wf) | −4.11 *** (c′) | 2.36 | 0.78 *** |
| Building footprint area (Bfz) | 0.35 *** (d) | 1.23 | Building footprint area (Bfz) | 0.37 *** (d′) | 1.24 | 0.17 *** |
| Building height (Bhz) | 0.025 ¨ (e) | 1.28 | Building height (Bhz) | 0.007 ˙ (e′) | 1.3 | 0.23 *** |
| DEM (Em) | 0.12 *** (f) | 1.57 | DEM (Em) | 0.094 *** (f′) | 1.8 | 0.46 *** |
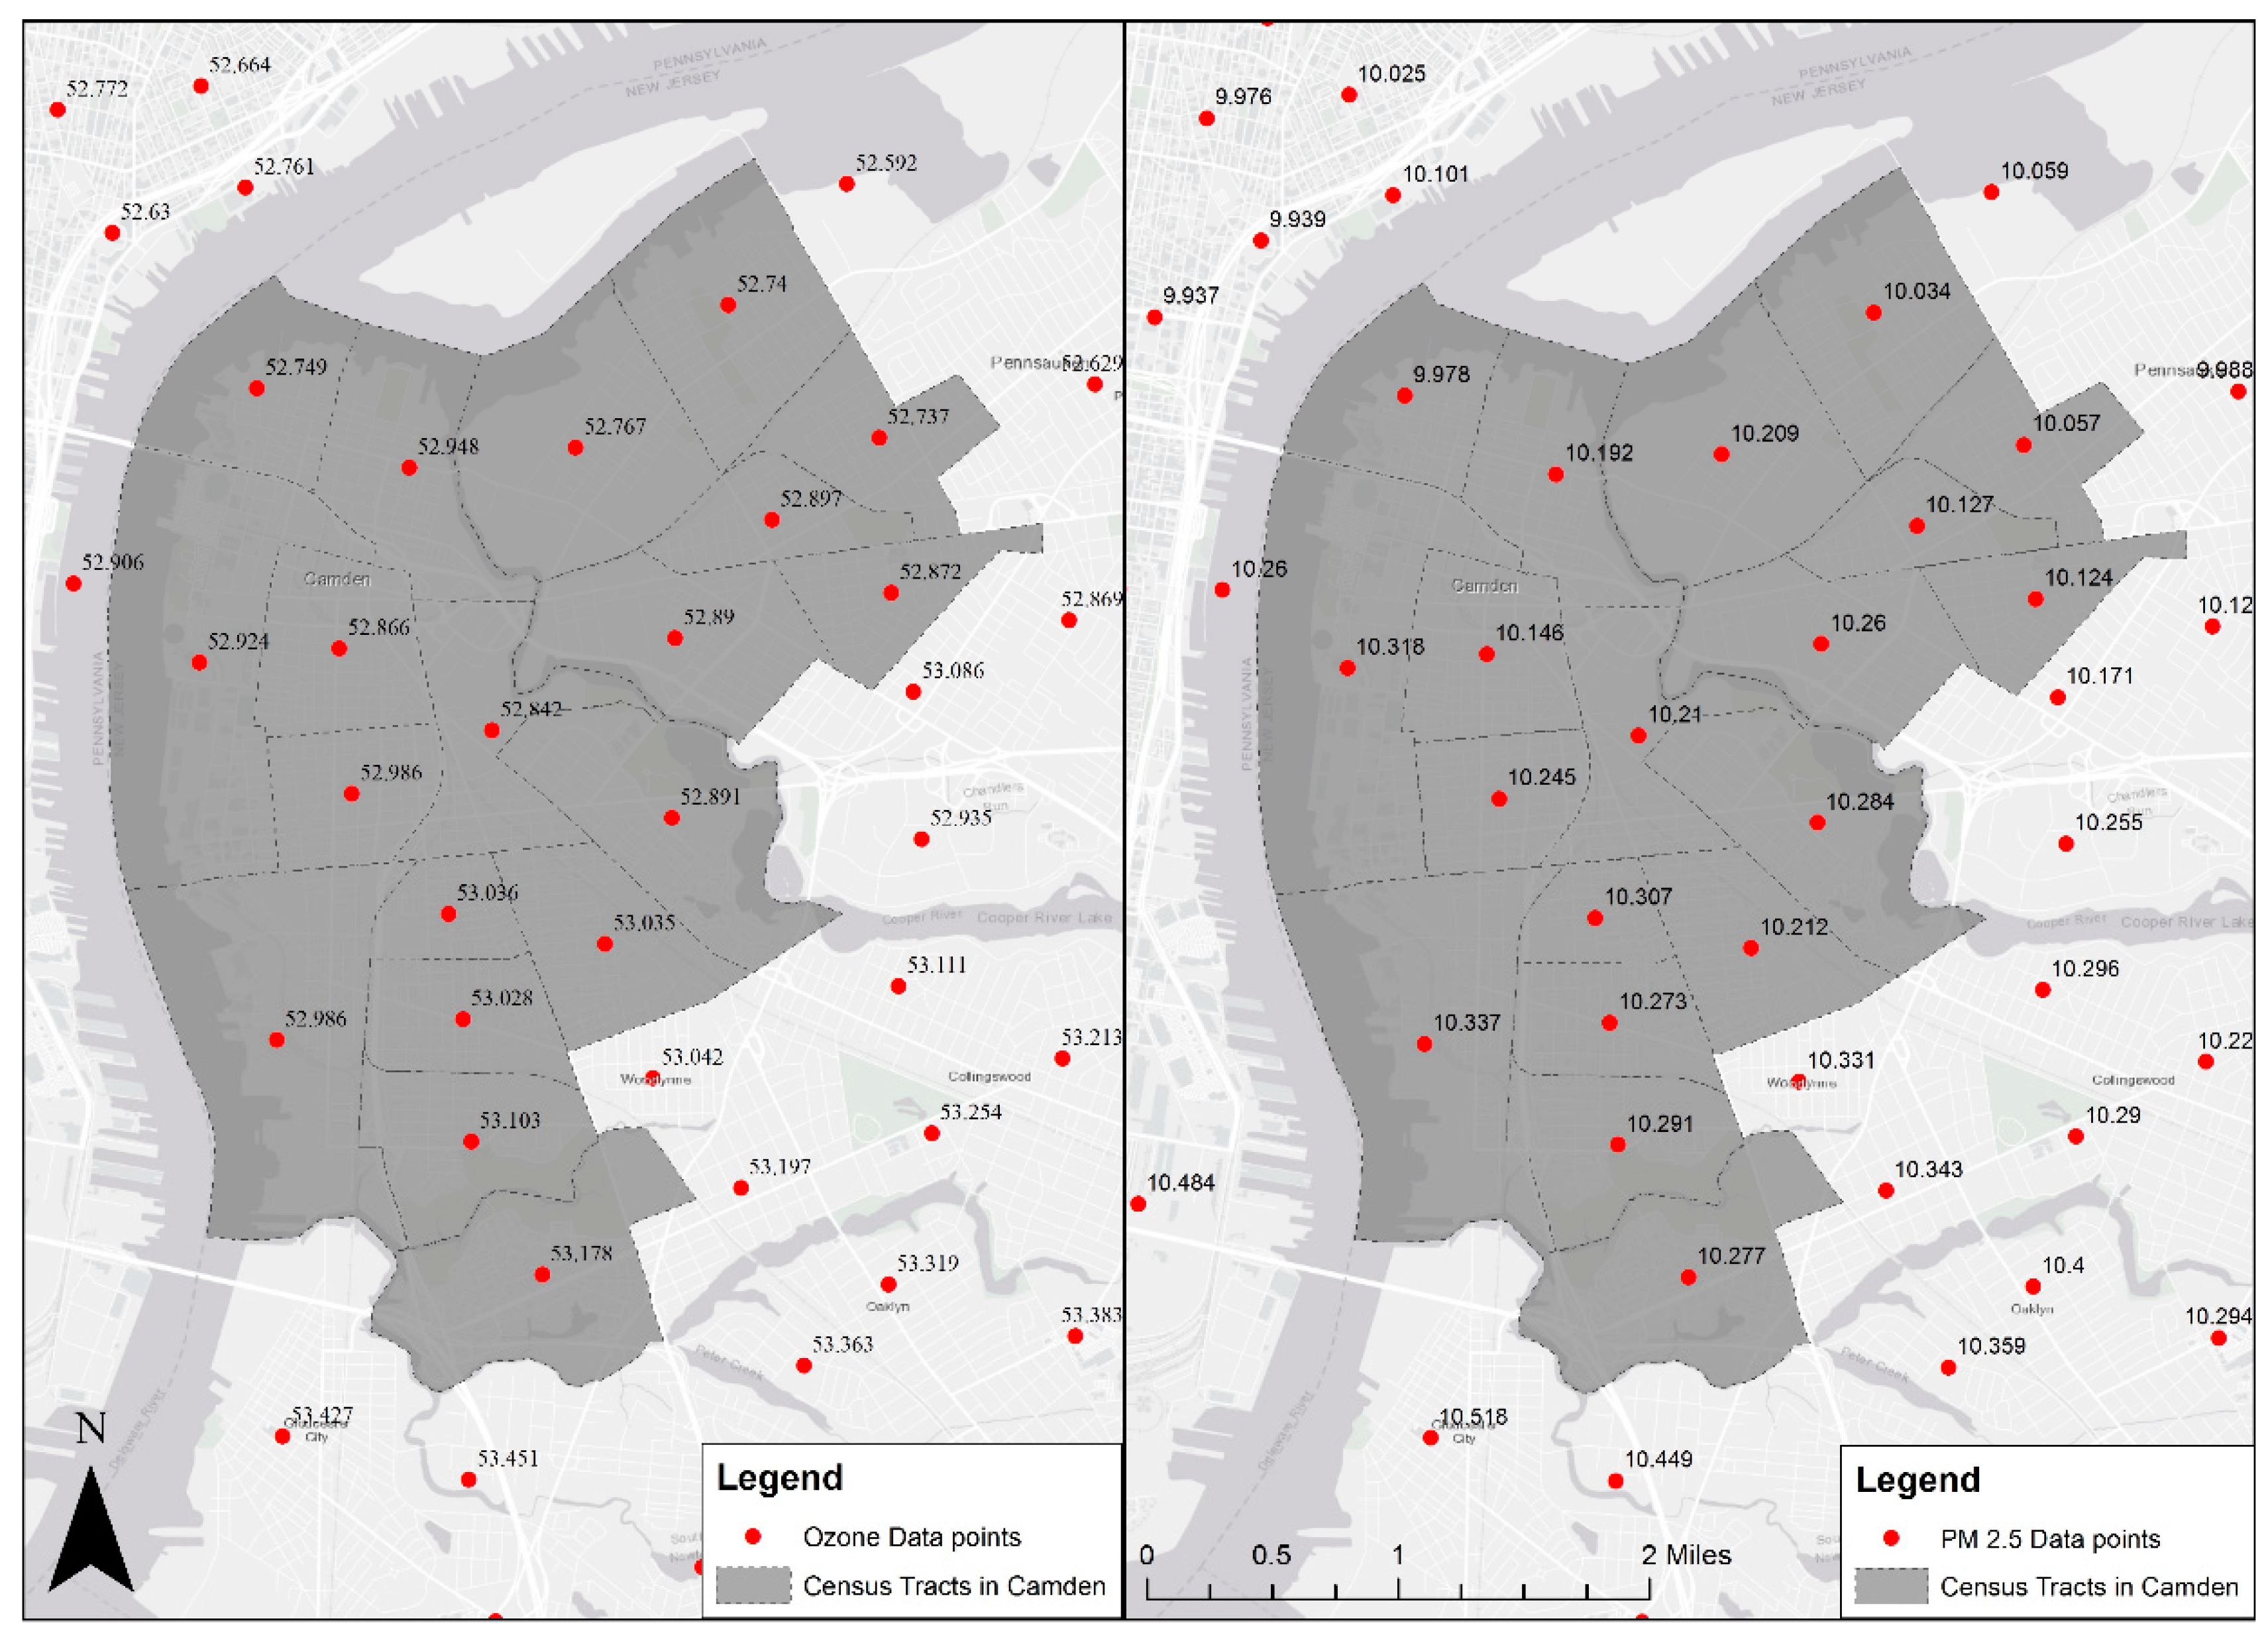
| PM2.5 concentration (Pm) | 8.11 *** (g) | 4.59 | PM2.5 concentration (Pm) | 9.96 *** (g′) | 5.0 | 0.07 *** |
| Ozone concentration (Oz) | −3.26 *** (h) | 4.36 | Ozone concentration (Oz) | −4.26 *** (h′) | 4.72 | 0.05 *** |
| % Imperviousness (Imz) | 1.49 *** (i) | 2.04 | % Imperviousness (Imz) | 1.51 *** (i′) | 2.10 | 0.77 *** |
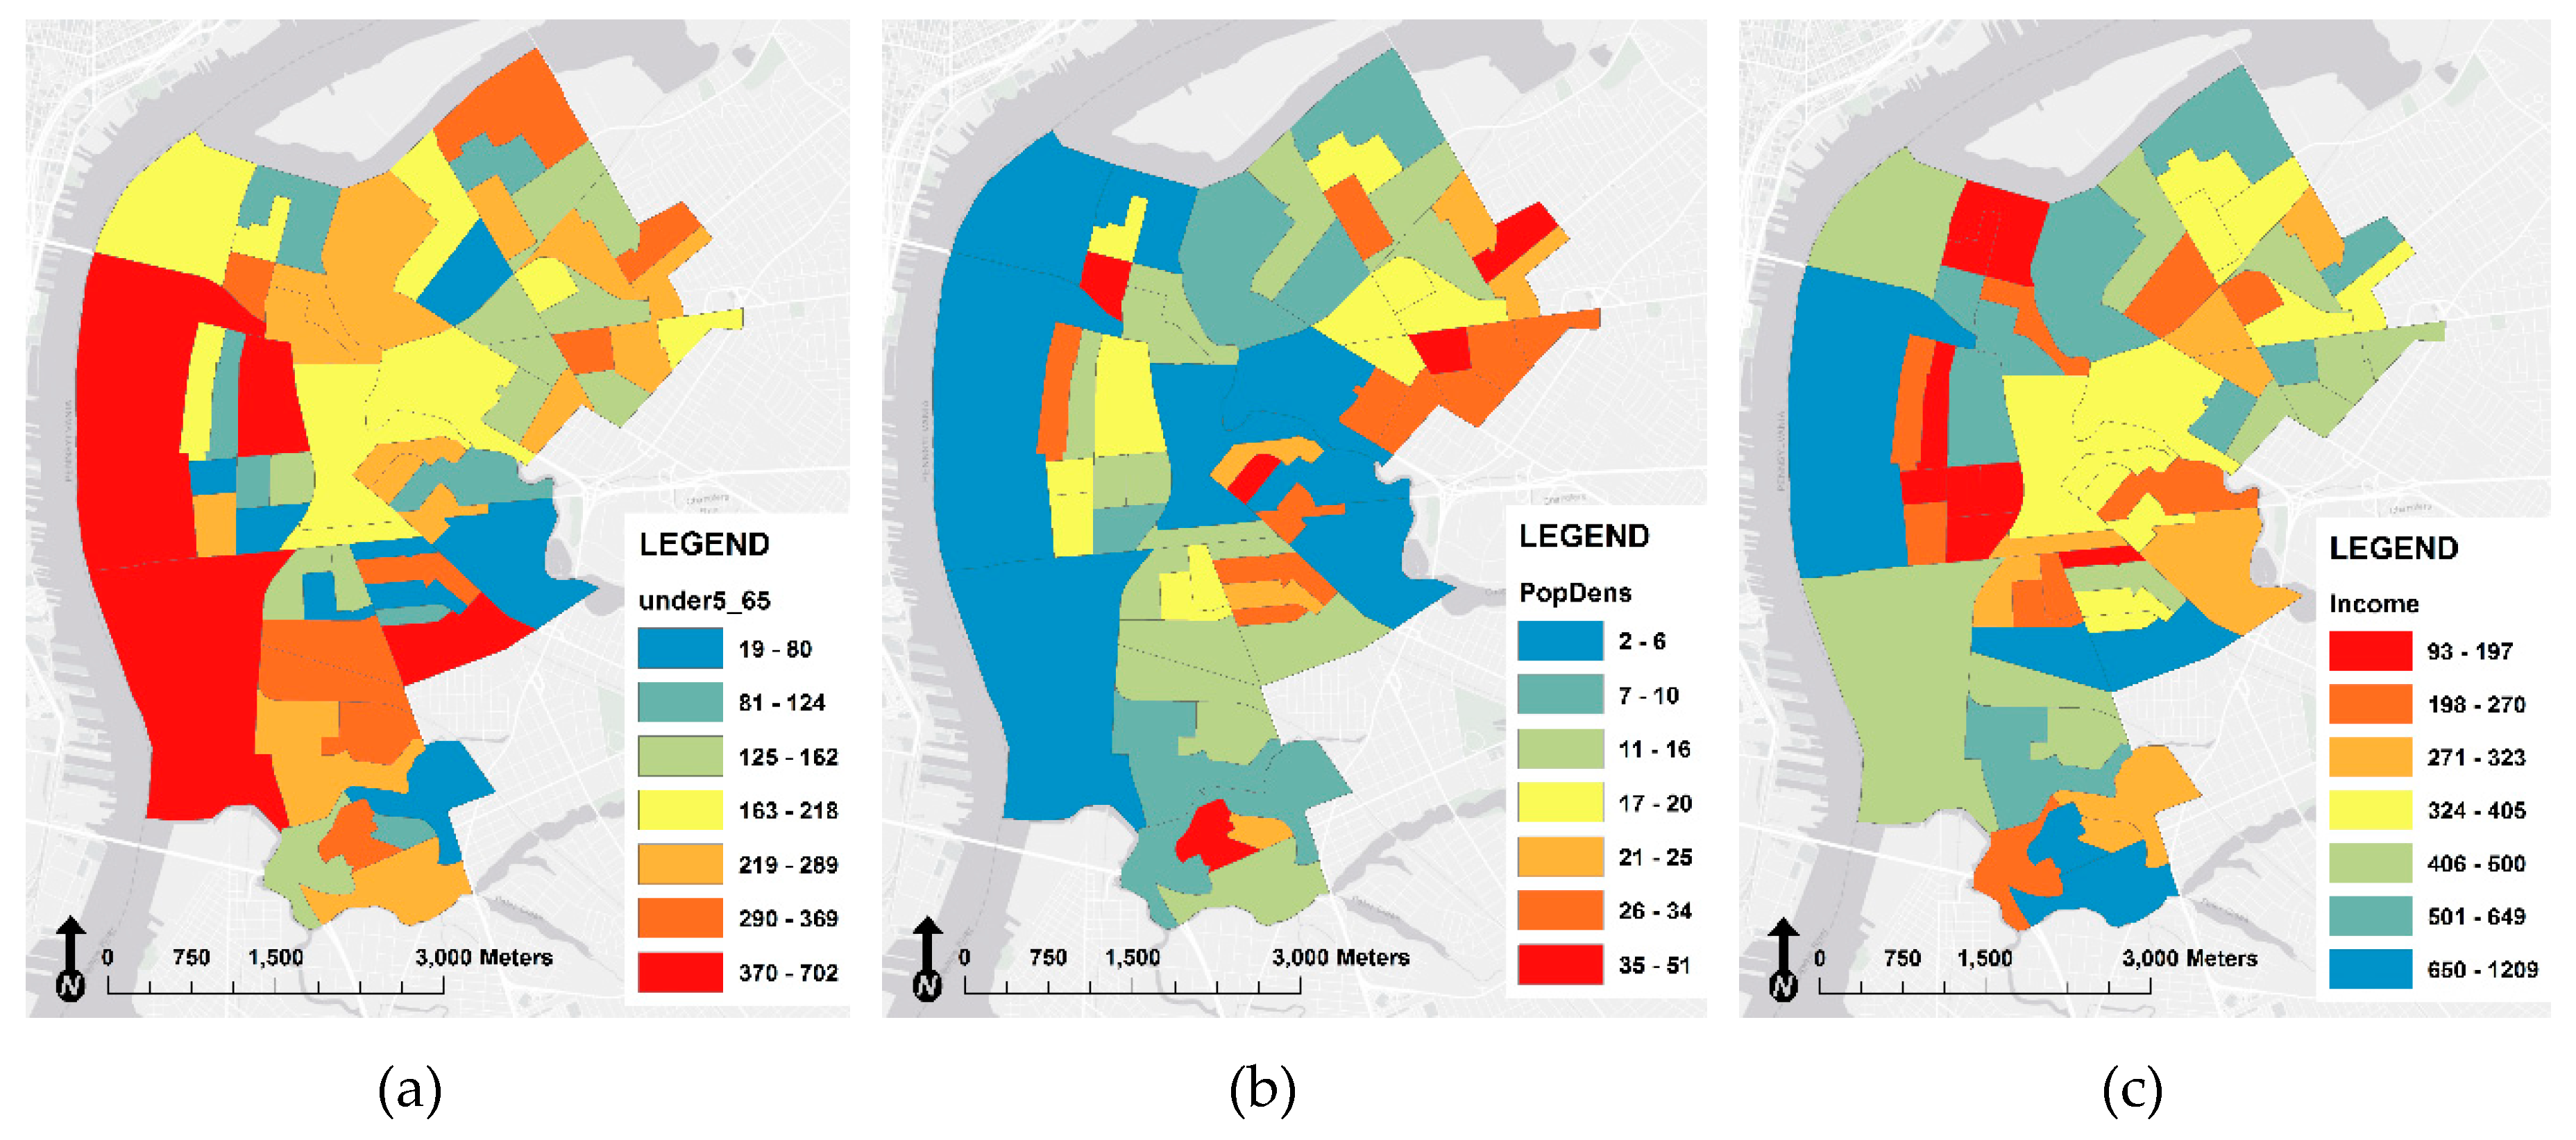
| Population in <5 and >65 age group (Paz) | −0.09 *** (j) | 2.04 | 0.06 *** | |||
| Population density (Pdz) | 0.24 *** (k) | 1.53 | 0.3 *** | |||
| Monthly income (Miz) | 0.06 *** (l) | 1.94 | 0.1 *** | |||
| Intercept (a) | 118.84 | Intercept (a′) | 152.9 | |||
| Adjusted R-squared | 0.7734 | Adjusted R-squared | 0.7758 | |||
| Residual standard error | 1.984 | Residual standard error | 1.973 |
| Variables | Relative Weights of Variables (%) | |
|---|---|---|
| ERII | SVII | |
| Proportional Vegetation | 20.5 | 19.6 |
| Water Fraction | 33.5 | 32.4 |
| Building footprint Area | 1.6 | 1.7 |
| Building height | 1.6 | 1.5 |
| DEM | 9.0 | 8.0 |
| PM2.5 | 0.9 | 1.2 |
| Ozone | 0.4 | 0.5 |
| % Imperviousness | 32.5 | 32.0 |
| Population Density | - | 2.9 |
| Monthly Income | - | 0.3 |
| Population <5 & >65 | - | 0.2 |
© 2020 by the authors. Licensee MDPI, Basel, Switzerland. This article is an open access article distributed under the terms and conditions of the Creative Commons Attribution (CC BY) license (http://creativecommons.org/licenses/by/4.0/).
Share and Cite
Sabrin, S.; Karimi, M.; Nazari, R. Developing Vulnerability Index to Quantify Urban Heat Islands Effects Coupled with Air Pollution: A Case Study of Camden, NJ. ISPRS Int. J. Geo-Inf. 2020, 9, 349. https://0-doi-org.brum.beds.ac.uk/10.3390/ijgi9060349
Sabrin S, Karimi M, Nazari R. Developing Vulnerability Index to Quantify Urban Heat Islands Effects Coupled with Air Pollution: A Case Study of Camden, NJ. ISPRS International Journal of Geo-Information. 2020; 9(6):349. https://0-doi-org.brum.beds.ac.uk/10.3390/ijgi9060349
Chicago/Turabian StyleSabrin, Samain, Maryam Karimi, and Rouzbeh Nazari. 2020. "Developing Vulnerability Index to Quantify Urban Heat Islands Effects Coupled with Air Pollution: A Case Study of Camden, NJ" ISPRS International Journal of Geo-Information 9, no. 6: 349. https://0-doi-org.brum.beds.ac.uk/10.3390/ijgi9060349