Evaluation of Driving Forces of Land Use and Land Cover Change in New England Area by a Mixed Method


Abstract
:1. Introduction
2. Methods
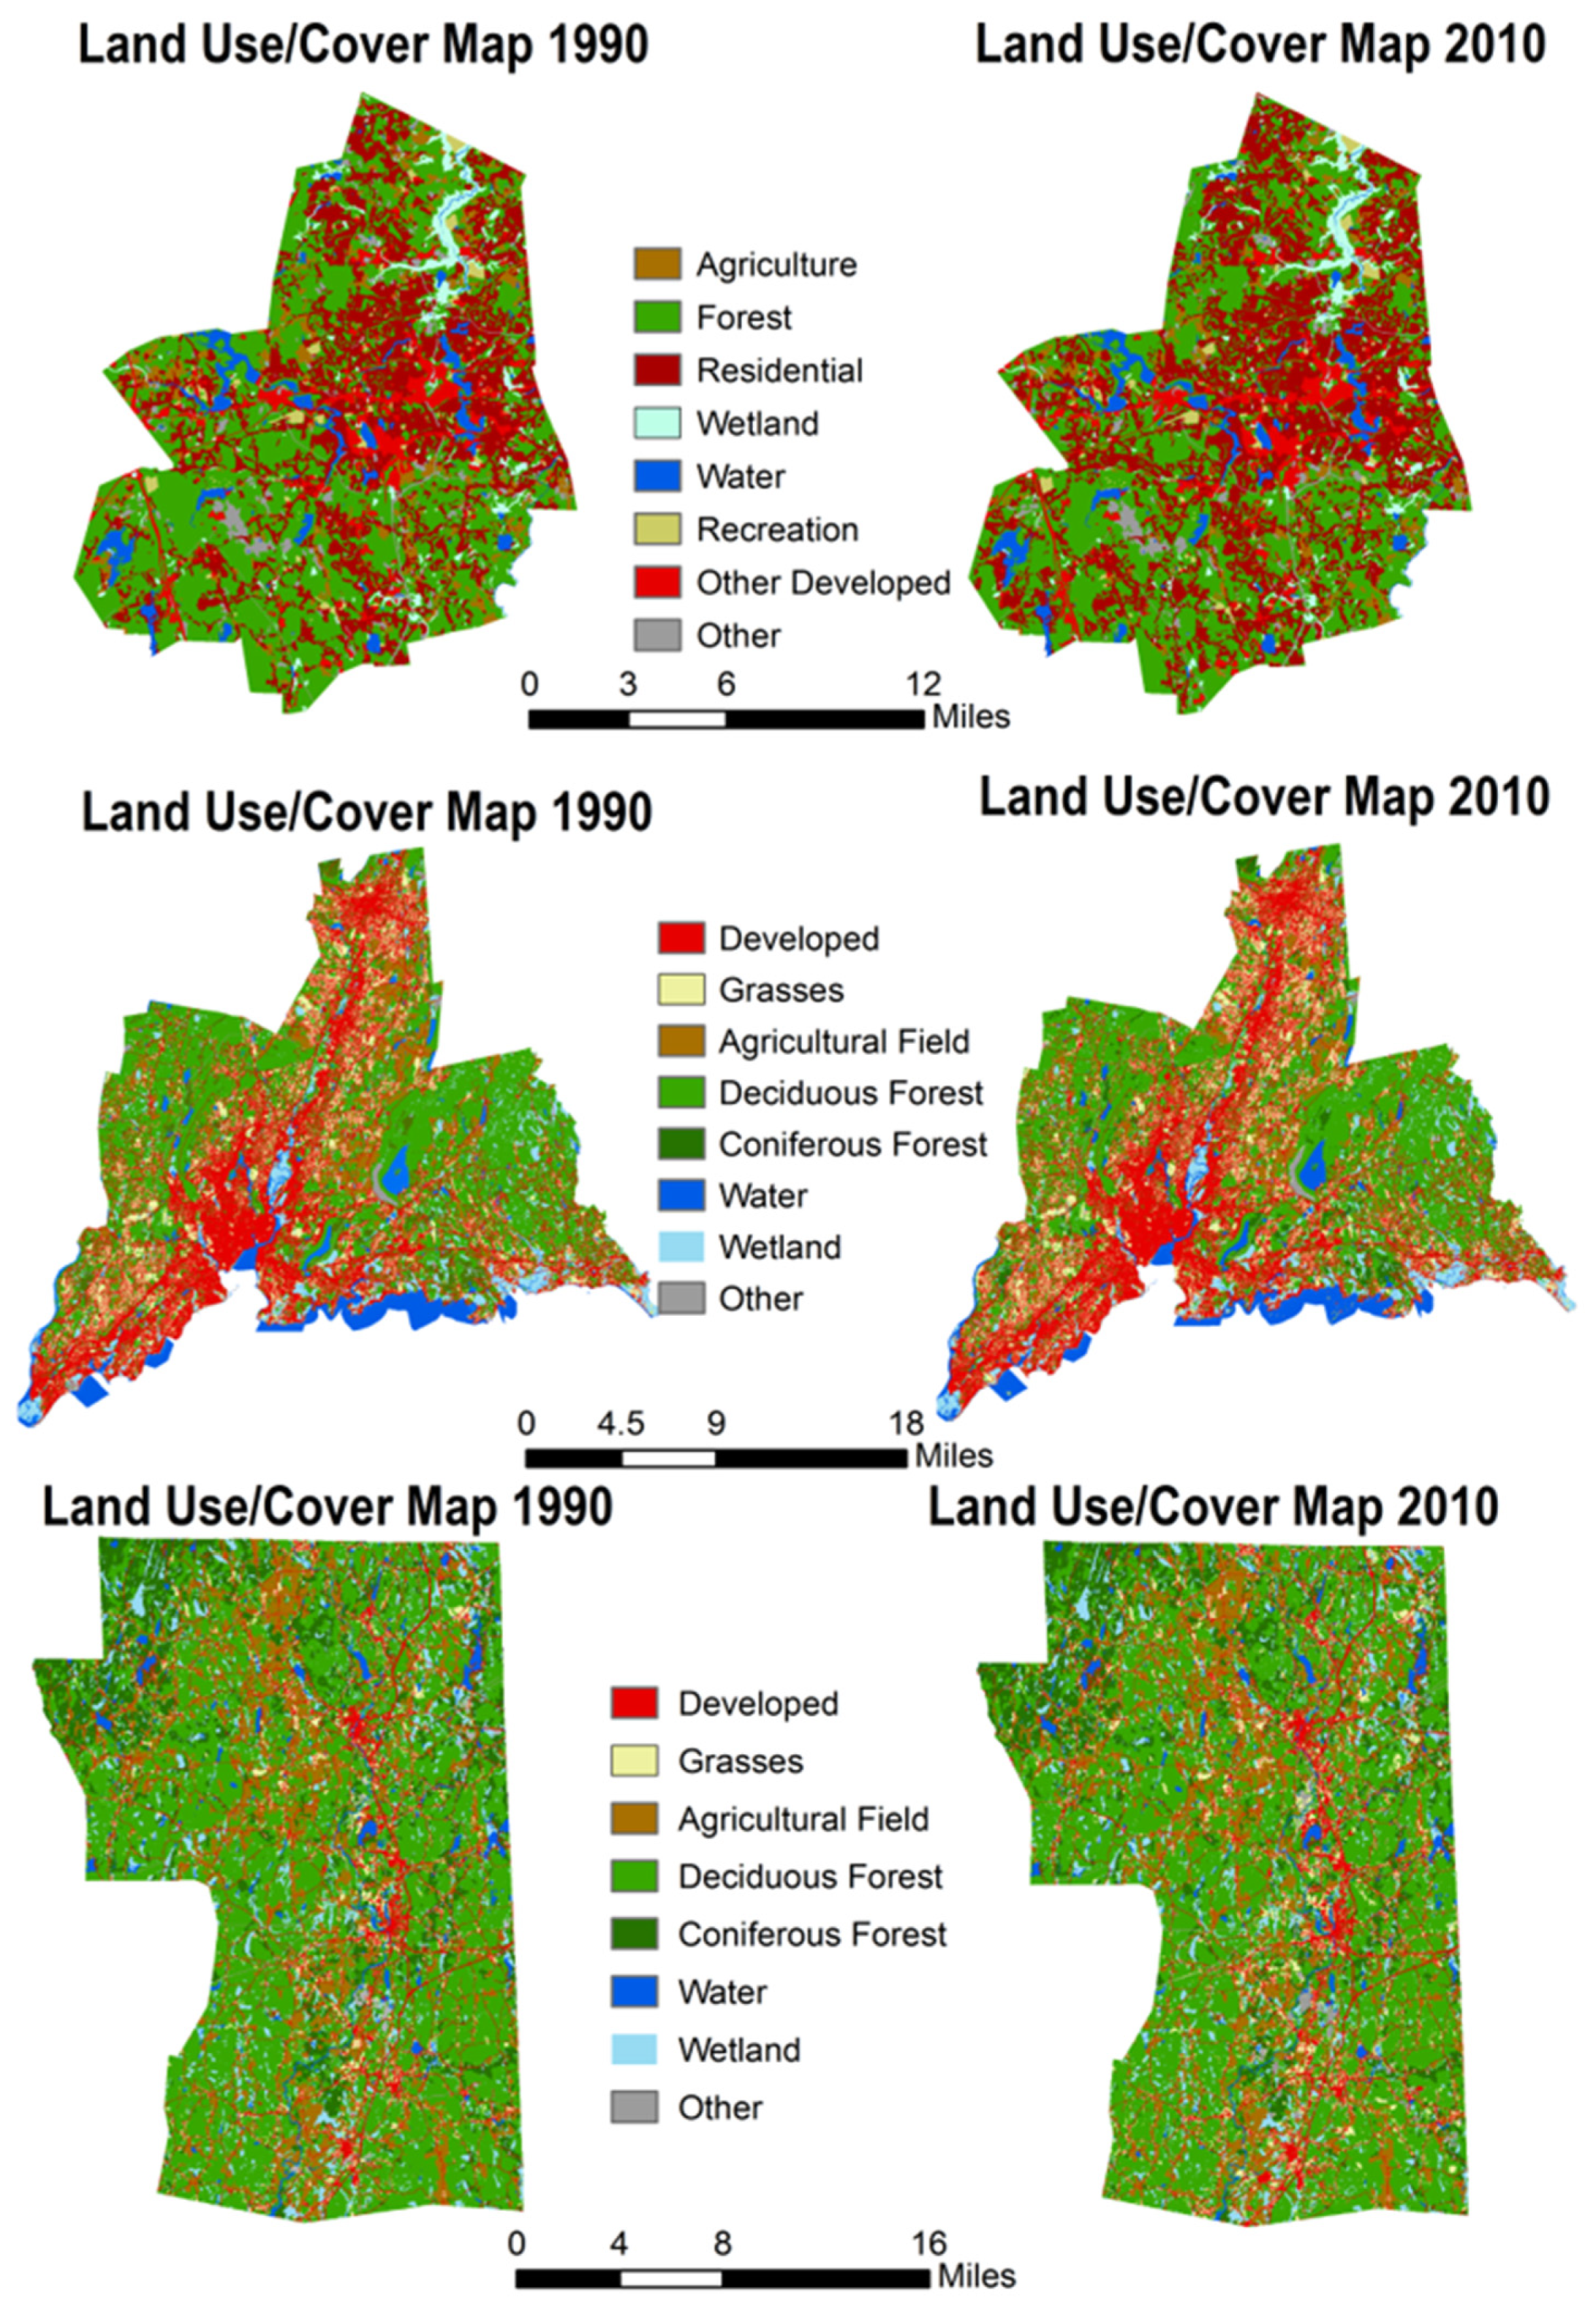
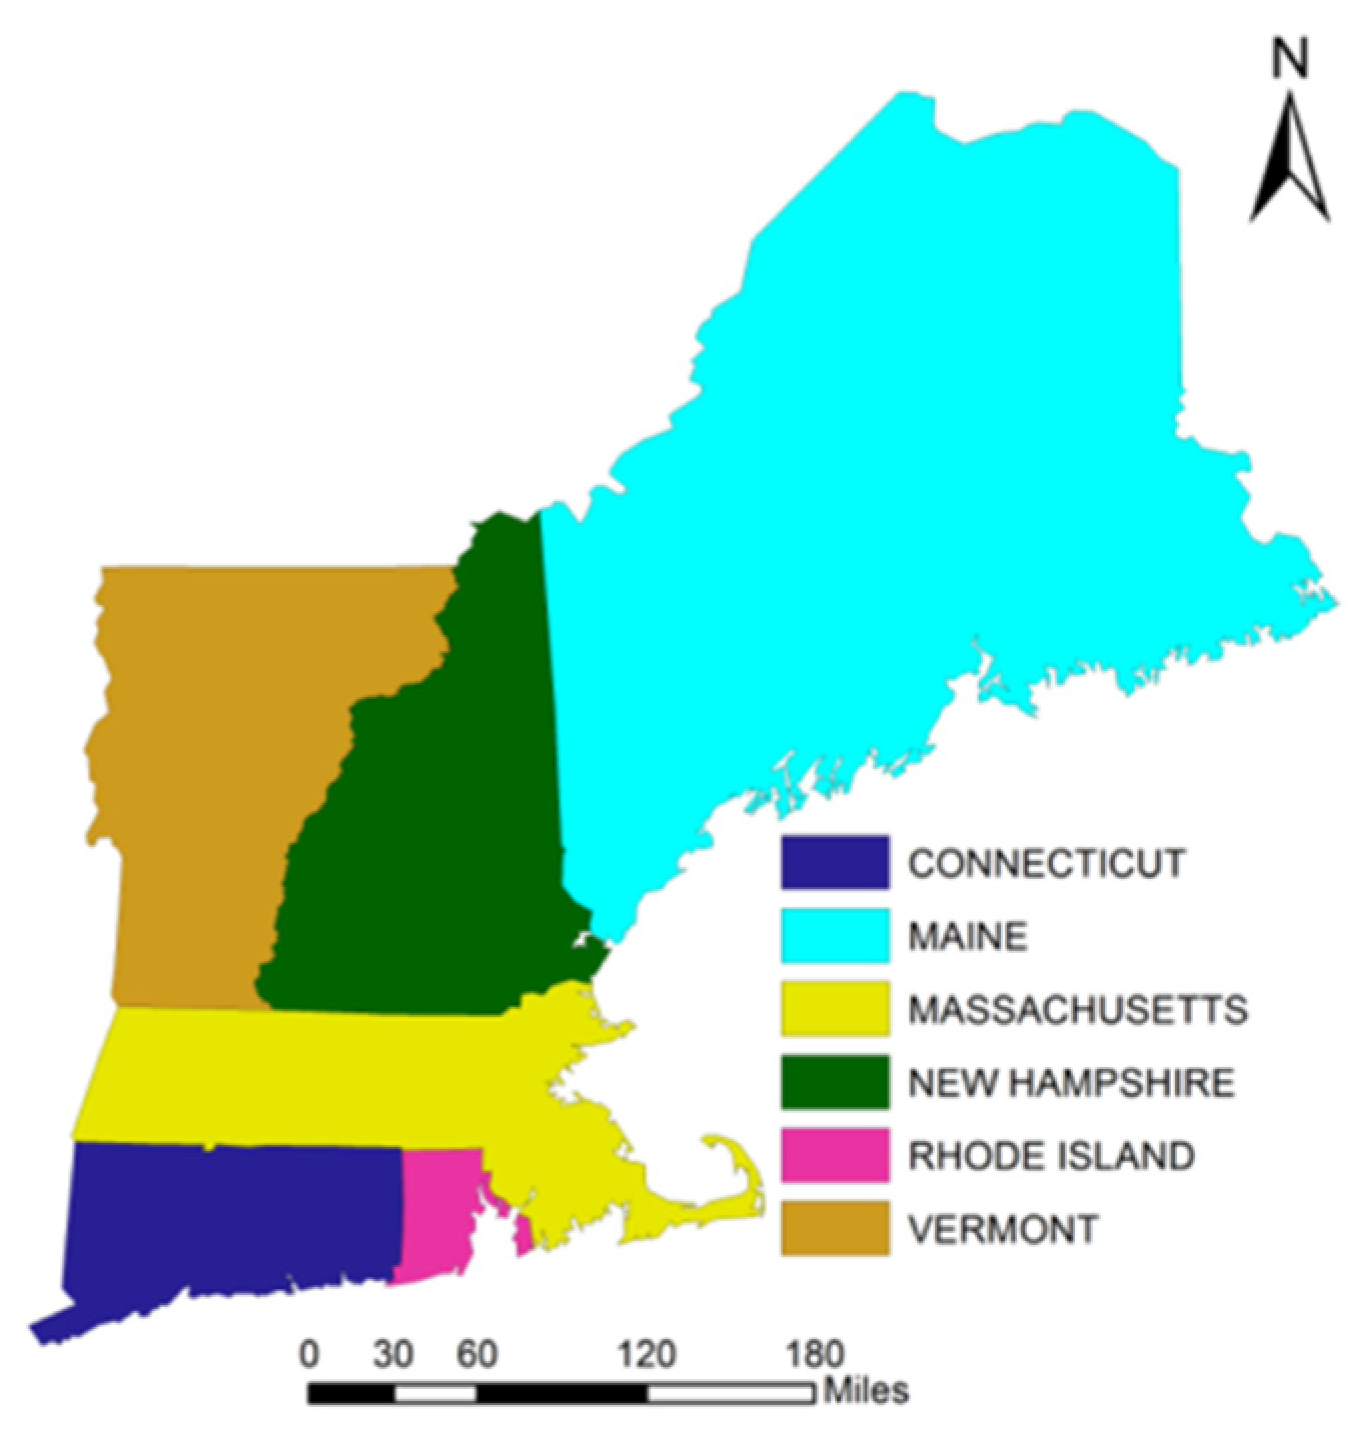
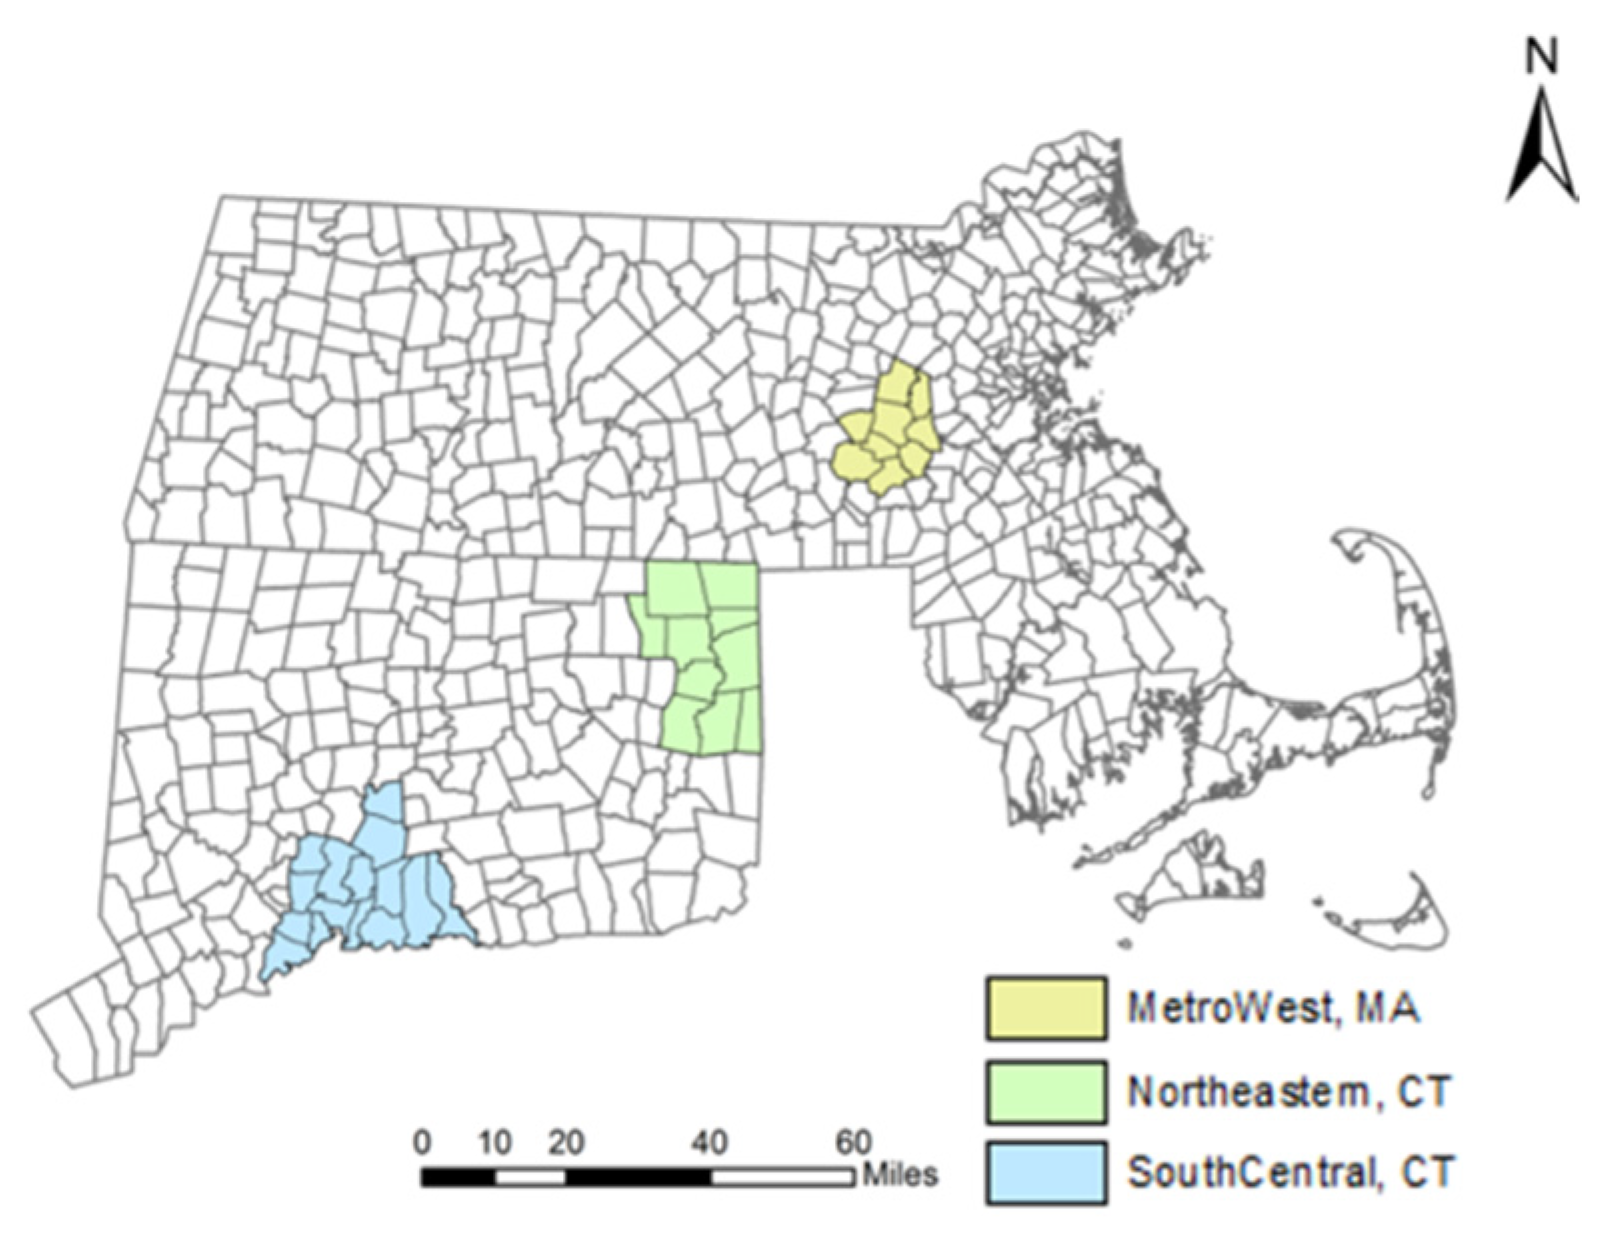
2.1. Study Area
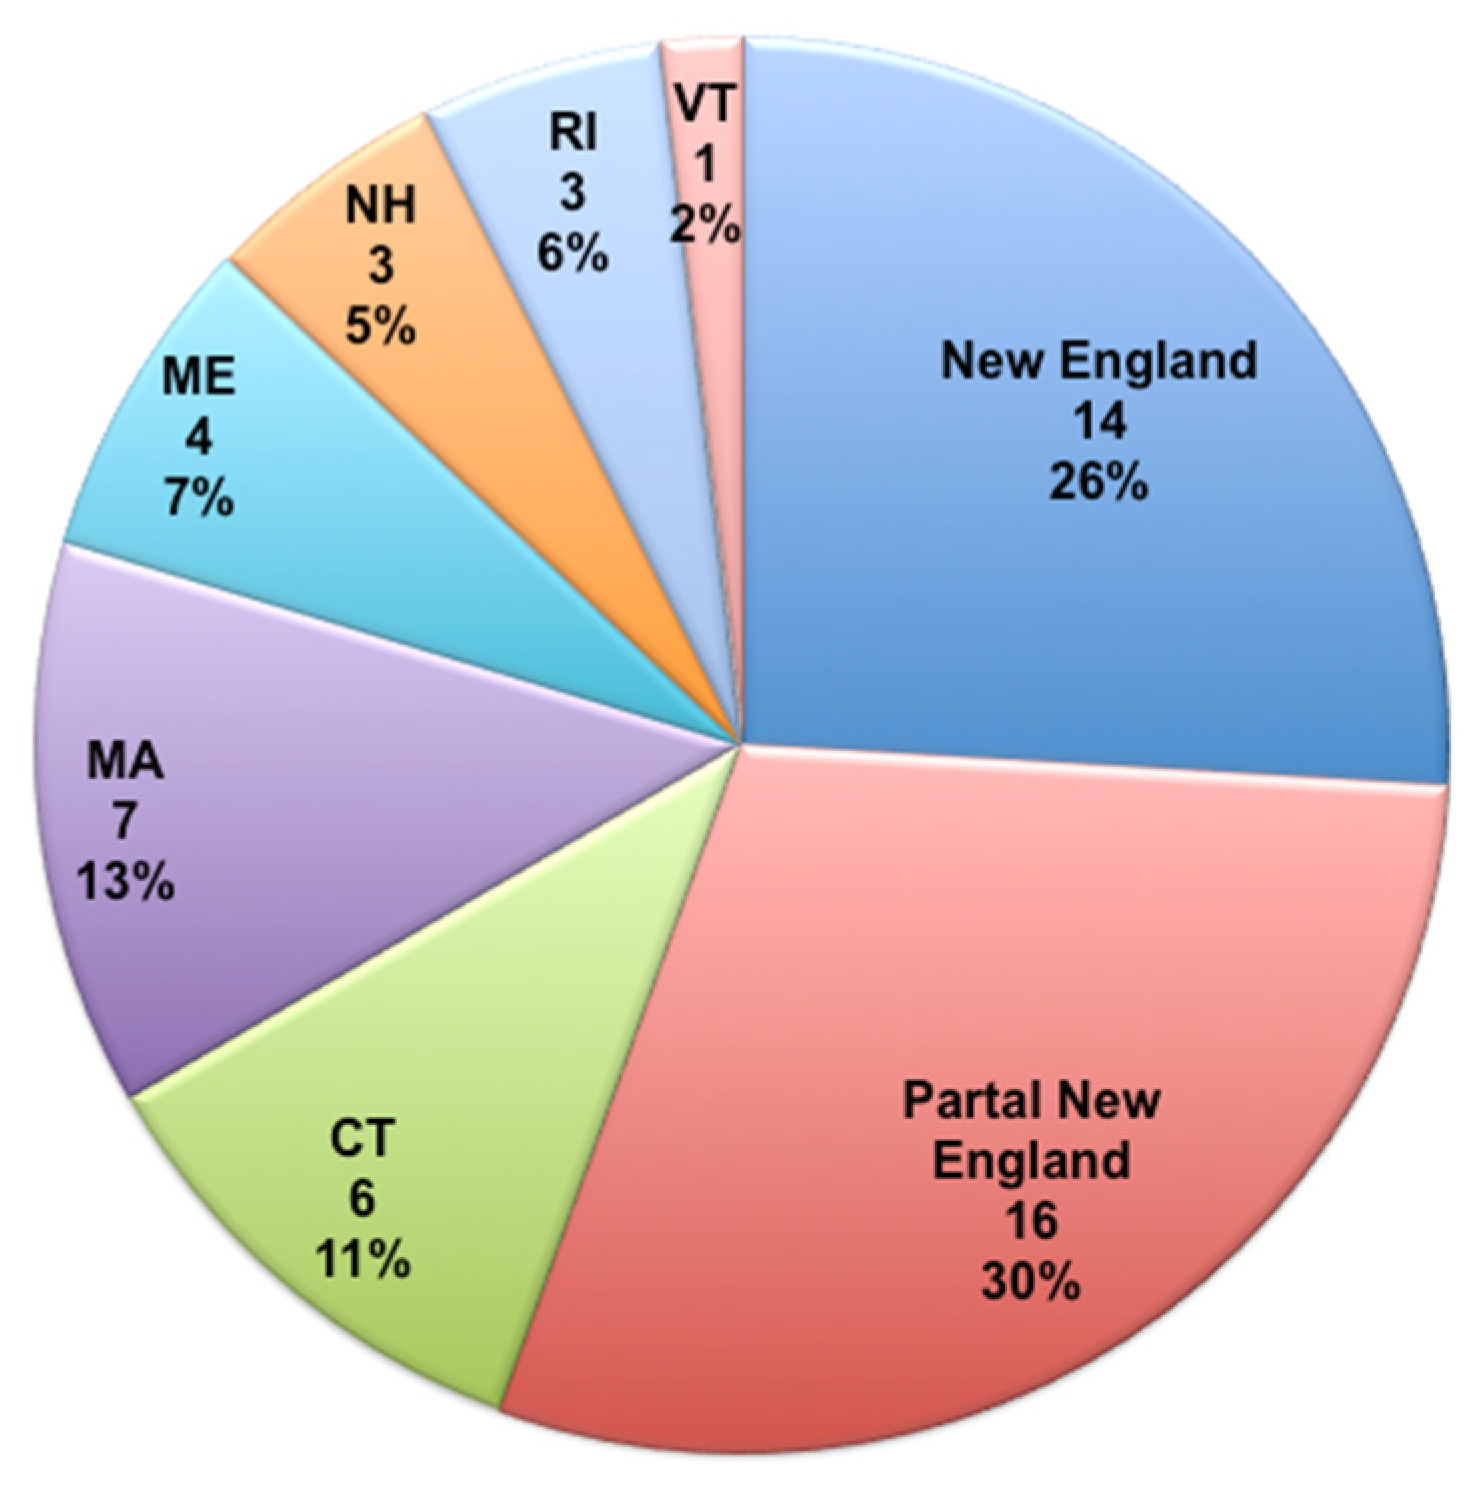
2.2. Meta-Study
2.3. The Random Forests (RF) Approach
2.4. Driver Classification and Data
3. Results
3.1. Meta-Study Results
3.2. Results of the Random Forest Approach
4. Discussion
4.1. Land Use/Cover Change Studies in New England Area from the Meta-Study
4.2. Consistency and Difference of the Meta-Study and the RF Method
4.3. Model Suitability and Reliability
5. Conclusions
Supplementary Materials
Author Contributions
Funding
Conflicts of Interest
References
- Newbold, T.; Hudson, L.; Hill, S.L.L.; Contu, S.; Lysenko, I.; Senior, R.; Börger, L.; Bennett, D.J.; Choimes, A.; Collen, B.; et al. Global effects of land use on local terrestrial biodiversity. Nature 2015, 520, 45–50. [Google Scholar] [CrossRef] [PubMed] [Green Version]
- Biro, K.; Pradhan, B.; Buchroithner, M.; Makeschin, F. Land use/land cover change analysis and its impact on soil properties in the northern part of gadarif region, sudan. Land Degrad. Dev. 2011, 24, 90–102. [Google Scholar] [CrossRef]
- Clerici, N.; Paracchini, M.L.; Maes, J. Land-cover change dynamics and insights into ecosystem services in European stream riparian zones. Ecohydrol. Hydrobiol. 2014, 14, 107–120. [Google Scholar] [CrossRef]
- Rogger, M.; Agnoletti, M.; Alaoui, A.; Bathurst, J.C.; Bodner, G.; Borga, M.; Chaplot, V.; Gallart, F.; Glatzel, G.; Hall, J.; et al. Land use change impacts on floods at the catchment scale: Challenges and opportunities for future research. Water Resour. Res. 2017, 53, 5209–5219. [Google Scholar] [CrossRef] [Green Version]
- Lambin, E.F.; Turner, B.; Geist, H.J.; Agbola, S.B.; Angelsen, A.; Bruce, J.W.; Coomes, O.T.; Dirzo, R.; Fischer, G.; Folke, C.; et al. The causes of land-use and land-cover change: Moving beyond the myths. Glob. Environ. Chang. 2001, 11, 261–269. [Google Scholar] [CrossRef]
- Mallinis, G.; Koutsias, N.; Arianoutsou, M. Monitoring land use/land cover transformations from 1945 to 2007 in two peri-urban mountainous areas of Athens metropolitan area, Greece. Sci. Total Environ. 2014, 490, 262–278. [Google Scholar] [CrossRef]
- Veldkamp, A.; Lambin, E.F. Predicting Land-Use Change; Elsevier: Amsterdam, The Netherlands, 2001. [Google Scholar]
- Alexander, P.; Rounsevell, M.D.; Dislich, C.; Dodson, J.; Engström, K.; Moran, D. Drivers for global agricultural land use change: The nexus of diet, population, yield and bioenergy. Glob. Environ. Chang. 2015, 35, 138–147. [Google Scholar] [CrossRef] [Green Version]
- Campbell, D.J.; Lusch, D.P.; Smucker, T.A.; Wangui, E.E. Multiple Methods in the Study of Driving Forces of Land Use and Land Cover Change: A Case Study of SE Kajiado District, Kenya. Hum. Ecol. 2005, 33, 763–794. [Google Scholar] [CrossRef]
- Bajocco, S.; Ceccarelli, T.; Smiraglia, D.; Salvati, L.; Ricotta, C. Modeling the ecological niche of long-term land use changes: The role of biophysical factors. Ecol. Indic. 2016, 60, 231–236. [Google Scholar] [CrossRef]
- Patarasuk, R.; Binford, M.W. Longitudinal analysis of the road network development and land-cover change in Lop Buri province, Thailand, 1989–2006. Appl. Geogr. 2012, 32, 228–239. [Google Scholar] [CrossRef]
- Teixeira, Z.; Teixeira, H.; Marques, J.C. Systematic processes of land use/land cover change to identify relevant driving forces: Implications on water quality. Sci. Total Environ. 2014, 470, 1320–1335. [Google Scholar] [CrossRef] [PubMed] [Green Version]
- Chen, L.; Ren, C.; Zhang, B.; Wang, Z.; Liu, M. Quantifying Urban Land Sprawl and its Driving Forces in Northeast China from 1990 to 2015. Sustainability 2018, 10, 188. [Google Scholar] [CrossRef] [Green Version]
- Kolb, M.; Mas, J.-F.; Galicia, L. Evaluating drivers of land-use change and transition potential models in a complex landscape in Southern Mexico. Int. J. Geogr. Inf. Sci. 2013, 27, 1804–1827. [Google Scholar] [CrossRef]
- Beilin, R.; Lindborg, R.; Stenseke, M.; Pereira, H.; Llausàs, A.; Slätmo, E.; Cerqueira, Y.; Navarro, L.M.; Rodrigues, P.; Reichelt, N.; et al. Analysing how drivers of agricultural land abandonment affect biodiversity and cultural landscapes using case studies from Scandinavia, Iberia and Oceania. Land Use Policy 2014, 36, 60–72. [Google Scholar] [CrossRef]
- Plieninger, T.; Draux, H.; Fagerholm, N.; Bieling, C.; Bürgi, M.; Kizos, T.; Kuemmerle, T.; Primdahl, J.; Verburg, P.H. The driving forces of landscape change in Europe: A systematic review of the evidence. Land Use Policy 2016, 57, 204–214. [Google Scholar] [CrossRef] [Green Version]
- Bürgi, M.; Hersperger, A.M.; Schneeberger, N. Driving forces of landscape change—Current and new directions. Landsc. Ecol. 2005, 19, 857–868. [Google Scholar] [CrossRef]
- Van Vliet, J.; Magliocca, N.R.; Büchner, B.; Cook, E.; Benayas, J.M.R.; Ellis, E.C.; Heinimann, A.; Keys, E.; Lee, T.M.; Liu, J.; et al. Meta-studies in land use science: Current coverage and prospects. Ambio 2016, 45, 15–28. [Google Scholar] [CrossRef] [Green Version]
- Breiman, L. Random forests. Mach. Learn. 2001, 45, 5–32. [Google Scholar] [CrossRef] [Green Version]
- Ge, G.; Shi, Z.; Zhu, Y.; Yang, X.; Hao, Y. Land use/cover classification in an arid desert-oasis mosaic landscape of China using remote sensed imagery: Performance assessment of four machine learning algorithms. Glob. Ecol. Conserv. 2020, 22, e00971. [Google Scholar] [CrossRef]
- Gislason, P.O.; Benediktsson, J.A.; Sveinsson, J. Random Forests for land cover classification. Pattern Recognit. Lett. 2006, 27, 294–300. [Google Scholar] [CrossRef]
- Thompson, J.R.; Carpenter, D.N.; Cogbill, C.V.; Foster, D.R. Four Centuries of Change in Northeastern United States Forests. PLoS ONE 2013, 8, e72540. [Google Scholar] [CrossRef] [PubMed] [Green Version]
- Jeon, S.B.; Olofsson, P.; Woodcock, C.E. Land use change in New England: A reversal of the forest transition. J. Land Use Sci. 2013, 9, 105–130. [Google Scholar] [CrossRef]
- Zhai, R.; Zhang, C.; Li, W.; Boyer, M.A.; Hanink, D.M. Prediction of Land Use Change in Long Island Sound Watersheds Using Nighttime Light Data. Land 2016, 5, 44. [Google Scholar] [CrossRef] [Green Version]
- Zhai, R.; Zhang, C.; Allen, J.M.; Li, W.; Boyer, M.A.; Segerson, K.; Foote, K.E. Predicting land use/cover change in Long Island Sound Watersheds and its effect on invasive species: A case study for glossy buckthorn. Ann. GIS 2018, 24, 83–97. [Google Scholar] [CrossRef] [Green Version]
- Seto, K.C.; Fragkias, M.; Güneralp, B.; Reilly, M.K. A Meta-Analysis of Global Urban Land Expansion. PLoS ONE 2011, 6, e23777. [Google Scholar] [CrossRef]
- Van Asselen, S.; Verburg, P.H.; Vermaat, J.E.; Janse, J.H. Drivers of Wetland Conversion: A Global Meta-Analysis. PLoS ONE 2013, 8, e81292. [Google Scholar] [CrossRef] [Green Version]
- Geist, H.J.; Lambin, E.F. Proximate Causes and Underlying Driving Forces of Tropical Deforestation Tropical forests are disappearing as the result of many pressures, both local and regional, acting in various combinations in different geographical locations. BioScience 2002, 52, 143–150. [Google Scholar] [CrossRef]
- Geist, H.J.; Lambin, E.F. Dynamic Causal Patterns of Desertification. AIBS Bull. 2004, 54, 817. [Google Scholar] [CrossRef] [Green Version]
- Keys, E.; McConnell, W.J. Global change and the intensification of agriculture in the tropics. Glob. Environ. Chang. 2005, 15, 320–337. [Google Scholar] [CrossRef]
- Wang, H.; Stephenson, S.R. Quantifying the impacts of climate change and land use/cover change on runoff in the lower Connecticut River Basin. Hydrol. Process. 2018, 32, 1301–1312. [Google Scholar] [CrossRef]
- Zhang, X.; Schaaf, C.B.; Gao, F.; Friedl, M.A.; Strakler, A.H.; Hodges, J.C. Mapping land cover and green vegetation abundance using MODIS-like data: A case study of New England. In Proceedings of the IEEE 2000 International Geoscience and Remote Sensing Symposium. Taking the Pulse of the Planet: The Role of Remote Sensing in Managing the Environment. Proceedings (Cat. No. 00CH37120), Honolulu, HI, USA, 24–28 July 2000; Volume 5, pp. 2005–2007. [Google Scholar]
- Zhai, R.; Li, W.; Zhang, C.; Zhang, W.; Wang, W. The transiogram as a graphic metric for characterizing the spatial patterns of landscapes. Landsc. Ecol. 2018, 34, 2103–2121. [Google Scholar] [CrossRef]
- Dietterich, T.G. Ensemble Methods in Machine Learning. In International Workshop on Multiple Classifier Systems; Springer: Berlin/Heidelberg, Germany, 2000. [Google Scholar]
- Chan, J.C.-W.; Paelinckx, D. Evaluation of Random Forest and Adaboost tree-based ensemble classification and spectral band selection for ecotope mapping using airborne hyperspectral imagery. Remote Sens. Environ. 2008, 112, 2999–3011. [Google Scholar] [CrossRef]
- Ghimire, B.; Rogan, J.; Miller, J. Contextual land-cover classification: Incorporating spatial dependence in land-cover classification models using random forests and the Getis statistic. Remote Sens. Lett. 2010, 1, 45–54. [Google Scholar] [CrossRef] [Green Version]
- Guo, L.; Chehata, N.; Mallet, C.; Boukir, S. Relevance of airborne lidar and multispectral image data for urban scene classification using Random Forests. ISPRS J. Photogramm. Remote Sens. 2011, 66, 56–66. [Google Scholar] [CrossRef]
- Latifi, H.; Nothdurft, A.; Koch, B. Non-parametric prediction and mapping of standing timber volume and biomass in a temperate forest: Application of multiple optical/LiDAR-derived predictors. Forestry 2010, 83, 395–407. [Google Scholar] [CrossRef] [Green Version]
- Martinuzzi, S.; Vierling, L.A.; Gould, W.; Falkowski, M.J.; Evans, J.; Hudak, A.T.; Vierling, K.T. Mapping snags and understory shrubs for a LiDAR-based assessment of wildlife habitat suitability. Remote Sens. Environ. 2009, 113, 2533–2546. [Google Scholar] [CrossRef] [Green Version]
- Waske, B.; Braun, M.H. Classifier ensembles for land cover mapping using multitemporal SAR imagery. ISPRS J. Photogramm. Remote Sens. 2009, 64, 450–457. [Google Scholar] [CrossRef]
- Wang, Q.; Ren, Q.; Liu, J. Identification and apportionment of the drivers of land use change on a regional scale: Unbiased recursive partitioning-based stochastic model application. Agric. Ecosyst. Environ. 2016, 217, 99–110. [Google Scholar] [CrossRef]
- Qasim, M.; Hubacek, K.; Termansen, M. Underlying and proximate driving causes of land use change in district Swat, Pakistan. Land Use Policy 2013, 34, 146–157. [Google Scholar] [CrossRef]
- Van Vliet, J.; De Groot, H.L.; Rietveld, P.; Verburg, P.H. Manifestations and underlying drivers of agricultural land use change in Europe. Landsc. Urban Plan. 2015, 133, 24–36. [Google Scholar] [CrossRef]
- Lilieholm, R.J.; Meyer, S.; Johnson, M.L.; Cronan, C.S. Land Conservation in the Northeastern United States: An Assessment of Historic Trends and Current Conditions. Environ. Sci. Policy Sustain. Dev. 2013, 55, 3–14. [Google Scholar] [CrossRef]
- Helmreich, J.E. Regression Modeling Strategies with Applications to Linear Models, Logistic and Ordinal Regression and Survival Analysis, 2nd ed.; Springer: Berlin/Heidelberg, Germany, 2015. [Google Scholar]
- Amaratunga, D.; Baldry, D.; Sarshar, M.; Newton, R. Quantitative and qualitative research in the built environment: Application of “mixed” research approach. Work Study 2002, 51, 17–31. [Google Scholar] [CrossRef]
- Malina, M.A.; Nørreklit, H.S.; Selto, F.H. Lessons learned: Advantages and disadvantages of mixed method research. Qual. Res. Account. Manag. 2011, 8, 59–71. [Google Scholar] [CrossRef] [Green Version]
- Brewer, J.; Hunter, A. Multimethod Research: A Synthesis of Styles; Sage Publications Inc.: New York, NY, USA, 1989. [Google Scholar]


| Category | Descriptions | Examples |
|---|---|---|
| Demographic drivers | Demographic factors that affect size and composition of population and households. | Emigration/immigration, population |
| Economic drivers | Economic factors that are the components of economic developments and determinants. | Incomes/households |
| Political drivers | Diverse policies that affect land use/cover change at various government levels. | Owners/planning polices |
| Biophysical drivers | Natural factors including topography and climatic conditions that affect land use/cover change. | Elevation/slope Climate |
| Location drivers | Drivers that focus on location, which may include human activities or immediate actions at the local level. | Distance to road Distance to water |
| Acronyms | Drivers | Descriptions |
|---|---|---|
| DEM | Elevation | Elevation in m |
| SL | Slope | Slope in degrees |
| AS | Aspect | Aspect in degrees |
| ST | Soil type a | Categorical soil type data |
| POPE | Population density earlier b | Population density of earlier year |
| POPL | Population density Later c | Population density of later year |
| POPC | Population density change | Changes in population density from the earlier year to the later year |
| MDA | Median age d | Median age of the population at census block level in 1990 |
| PCI | Per capital income | Averaged income earned per person in 1990 |
| MHI | Median house income e | Median household income at census block level in 1990 |
| MHV | Median house value | Median house value at census block level in 1990 |
| PA | Protected area | Reserved area, no development allowed |
| DW | Distance to water | Euclidean distance from water |
| DR | Distance to roads | Euclidean distance from roads |
| DD | Distance to development | Euclidean distance from existed developed area |
| RD | Roads | Binary roads data |
| RI | Rivers | Binary rivers data |
| HUSE | House density earlier b | House density of the earlier year |
| HUSL | House density Later c | House density of the later year |
| HUSC | House density change | Changes in House density from the earlier year to the later year |
| All Cases (N = 54) | NE (N = 14) | Partial NE (N = 16) | South NE (N = 16) | North NE (N = 8) | ||||||
|---|---|---|---|---|---|---|---|---|---|---|
| No. | pct | No. | pct | No. | pct | No. | pct | No. | pct | |
| Land cover type | ||||||||||
| All types | 30 | 55% | 7 | 50% | 8 | 50% | 8 | 50% | 7 | 88% |
| Forest-only | 16 | 30% | 7 | 50% | 5 | 31% | 3 | 19% | 1 | 12% |
| Other | 8 | 15% | 0 | 0% | 3 | 19% | 5 | 31% | 0 | 0% |
| Proportion of the LUCC study | ||||||||||
| <50% content | 26 | 48% | 8 | 57% | 7 | 44% | 6 | 38% | 4 | 50% |
| >50% content | 28 | 52% | 6 | 43% | 9 | 56% | 10 | 62% | 4 | 50% |
| Driver included | ||||||||||
| Comprehensive drivers | 23 | 43% | 8 | 57% | 6 | 38% | 6 | 38% | 3 | 38% |
| Simple drivers | 18 | 33% | 5 | 36% | 4 | 25% | 5 | 31% | 4 | 50% |
| No driver | 13 | 24% | 1 | 7% | 6 | 37% | 5 | 31% | 1 | 12% |
| All Cases Including Drivers (N = 41) | NE (N = 13) | Partial NE (N = 10) | South NE (N = 11) | North NE (N = 7) | ||||||
|---|---|---|---|---|---|---|---|---|---|---|
| No. | pct | No. | pct | No. | pct | No. | pct | No. | pct | |
| Study Methods | ||||||||||
| Descriptive methods | 30 | 73% | 11 | 85% | 6 | 60% | 8 | 73% | 5 | 71% |
| Quantitative methods | 11 | 27% | 2 | 15% | 4 | 40% | 3 | 27% | 2 | 29% |
| Specific drivers | ||||||||||
| Population | 35 | 85% | 11 | 85% | 9 | 90% | 9 | 82% | 6 | 86% |
| Economics | 26 | 63% | 10 | 77% | 8 | 80% | 5 | 45% | 3 | 43% |
| Topography | 16 | 39% | 5 | 38% | 4 | 40% | 6 | 55% | 1 | 14% |
© 2020 by the authors. Licensee MDPI, Basel, Switzerland. This article is an open access article distributed under the terms and conditions of the Creative Commons Attribution (CC BY) license (http://creativecommons.org/licenses/by/4.0/).
Share and Cite
Zhai, R.; Zhang, C.; Li, W.; Zhang, X.; Li, X. Evaluation of Driving Forces of Land Use and Land Cover Change in New England Area by a Mixed Method. ISPRS Int. J. Geo-Inf. 2020, 9, 350. https://0-doi-org.brum.beds.ac.uk/10.3390/ijgi9060350
Zhai R, Zhang C, Li W, Zhang X, Li X. Evaluation of Driving Forces of Land Use and Land Cover Change in New England Area by a Mixed Method. ISPRS International Journal of Geo-Information. 2020; 9(6):350. https://0-doi-org.brum.beds.ac.uk/10.3390/ijgi9060350
Chicago/Turabian StyleZhai, Ruiting, Chuanrong Zhang, Weidong Li, Xiang Zhang, and Xueke Li. 2020. "Evaluation of Driving Forces of Land Use and Land Cover Change in New England Area by a Mixed Method" ISPRS International Journal of Geo-Information 9, no. 6: 350. https://0-doi-org.brum.beds.ac.uk/10.3390/ijgi9060350