Experiment in Finding Look-Alike European Cities Using Urban Atlas Data


Department of Geoinformatics, Faculty of Science, Palacký University, 17. listopadu 50, 779 00 Olomouc, Czech Republic
ISPRS Int. J. Geo-Inf. 2020, 9(6), 406; https://0-doi-org.brum.beds.ac.uk/10.3390/ijgi9060406
Submission received: 26 May 2020
/
Revised: 22 June 2020
/
Accepted: 24 June 2020
/
Published: 26 June 2020
(This article belongs to the Special Issue Geographic Complexity: Concepts, Theories, and Practices)
Abstract
:The integration of geography and machine learning can produce novel approaches in addressing a variety of problems occurring in natural and human environments. This article presents an experiment that identifies cities that are similar according to their land use data. The article presents interesting preliminary experiments with screenshots of maps from the Czech map portal. After successfully working with the map samples, the study focuses on identifying cities with similar land use structures. The Copernicus European Urban Atlas 2012 was used as a source dataset (data valid years 2015–2018). The Urban Atlas freely offers land use datasets of nearly 800 functional urban areas in Europe. To search for similar cities, a set of maps detailing land use in European cities was prepared in ArcGIS. A vector of image descriptors for each map was subsequently produced using a pre-trained neural network, known as Painters, in Orange software. As a typical data mining task, the nearest neighbor function analyzes these descriptors according to land use patterns to find look-alike cities. Example city pairs based on land use are also presented in this article. The research question is whether the existing pre-trained neural network outside cartography is applicable for categorization of some thematic maps with data mining tasks such as clustering, similarity, and finding the nearest neighbor. The article’s contribution is a presentation of one possible method to find cities similar to each other according to their land use patterns, structures, and shapes. Some of the findings were surprising, and without machine learning, could not have been evident through human visual investigation alone.

1. Introduction
The field of artificial intelligence (AI) has made rapid progress in recent years. AI has received tremendous attention from academia, industry, and also the general population. Machine learning (ML) is a subfield of artificial intelligence [1].
Machine learning encompasses learning without any type of supervision (unsupervised learning) and learning with full supervision (supervised learning). Unsupervised learning examines uncategorized data to discover patterns. No correct answers are given to the machine during learning. The natural patterns in data are expected to guide the machine in learning to detect key patterns and group data according to those patterns (i.e., unsupervised learning involves machines attempting to learn “on their own”, without assistance from categorized data). Unsupervised learning tasks can be solved as either clustering or association problems, depending on the application [2]. Deep learning (DL) is a special type of machine learning that leverages multiple layers of nonlinear processing units or neurons. The rapid progress in ML can be attributed to three main reasons: vast quantities of available data, powerful computing capabilities, and improvements in algorithms, such as deep neural networks. The unsupervised deep learning method was selected for this study to find similar maps.
Recently the field of geography has turned towards AI. As a new term, GeoAI expresses the interdisciplinary combination of geography and artificial intelligence. The integration of geography with AI offers novel approaches in addressing a variety of problems in the natural environment and human society [1].
Esri, a leading company in GIS software, has invested heavily in these emerging technologies and created a new research and development (R&D) center in New Delhi focused on AI and deep learning applied to satellite imagery and location data [3]. Esri applies computer vision to geospatial analysis object detection and semantic segmentation, for example, to extract road networks from satellite imagery. The software ArcGIS includes built-in Python raster functions for object detection and classification workflows using CNTK, Keras, PyTorch, fast.ai, and TensorFlow, as mentioned by Rohit Singh, head of the R&D center [4].
The use of AI in conservation, for example, is supported by Microsoft AI for Earth. The company also actively awards grants to support projects which use AI for Earth and apply AI in changing how people and organizations monitor, model, and manage the Earth’s natural systems [5].
The Copernicus Land Monitoring Service Urban Atlas provides information about comparable land use across Europe and land cover data for functional urban areas (FUAs). A functional urban area consists of a city and its commuting zone. Functional urban areas, therefore, consist of a densely inhabited city and a less densely populated commuting zone whose labor market is highly integrated with the city [6].
The older Urban Atlas data set is from 2006, the newer dataset is for 2012 reference year. The Urban Atlas 2018 is recently available, but it is not completed nor validated yet. The presented research used the Urban Atlas 2012 data set. The valid year is recorded in each metadata description of the downloaded set. The valid period varies from 2015 (2014 only for one set) up to 2018 (around 300 datasets).
The European Urban Atlas was designed to compare the land use patterns in major European cities and hence provide benchmarking of these cities. The data are frequently used in various kinds of research such as the identification of the relationship between human connectivity dynamics and land use [7] or assessing green infrastructure connectivity of European city regions (Manchester, UK; Ruhr, Germany; Copenhagen, Denmark) [8]. The Urban Atlas data was also used for comparison by patch perimeter metrics of four large metropolitan regions in southern Europe: Lisbon (Portugal), Barcelona (Spain), Rome (Italy), and Athens (Greece) [9]. Without this cross border data set it is not possible to run these types of research.
Several attempts and methods were used during the investigation to find similar cities. Street networks can be thought of as a simplified schematic view of cities, which capture a large part of their structure and organization [10]. Research by Louf and Barthelemy (2014) classified cities according to their street patterns [11]. They created a dendrogram of clusters which identified at a lower level of the classification that most European and American cities in a sample of 131 cities fall in their sub-category; although, they encountered the problem of too high a similarity of street networks in most cities. They tried to solve this problem by focusing on the geometry of the city blocks that the street networks create. As a result of this work, cities were divided into four groups based on the shape and size of city blocks.
Research by Boeing (2018) was also oriented on the street network [12]. They downloaded and processed 27,000 US street networks from OpenStreetMap at the metropolitan, municipal, and neighborhood scales. The same author subsequently developed a new indicator of orientation-order that quantifies how a city’s street network follows the geometric ordering logic of a single grid. The study examined street network orientation, configuration, and entropy in 100 cities around the world. It measured the entropy of street bearings in weighted and unweighted network models, along with each city’s typical street segment length, average circuity, average node degree, and the network’s proportions of four-way intersections and dead-ends [13]. Moreover, Boeing suggested common dimensions for measuring the complexity of urban form and design [14]. The dimensions are temporal, visual, spatial, scaling, and connectivity.
Courtat et al. (2011) made a static analysis of several French towns and hypothesized that the development of a city follows a logic of division or extension of space [15]. Sandu prepared a comparison of only two cities: Iasi in Romania and Lyon in France. The exploration is based on Urban Atlas data [16]. The comparison emphasized urban development of these cities under different political and socio-economical regimes after World War II. The urban areas from Romania tried to copy the Western model of the capitalist city, but without a solid legislative and financial back-up and confronted with socialist heritage, it resulted in a hybrid urban development [16].
Koperski (1995) presented the use of spatial association rules as one of the data mine techniques for investigation of cities. He looked for association rules for cities in British Columbia, a province in Canada. Frequent occurrences describe the cities and their features like water, roads, and administrative boundaries. The frequent itemsets are based on topological relations (inside, contains, intersect, and equal) of features and the city [17]. Cities that belong to frequent itemsets can be assumed similar.
The finding of similar cities based on Urban Atlas data was processed by Janousek’s diploma theses [18]. The areas of towns were divided by circular sectors into eight sections and eight circles. The selected categories from Urban Atlas were intersected with circular sectors to calculate the area index to express the coverage by the category in each sector. Based on the 8 × 8 matrix (together 64) values of indexes, the correlation and hierarchical clustering were processed. The base set was 100 European cities from 50,000 to 200,000 inhabitants.
The article presents the use of the Painters pre-trained neural network as a new method for quick results in identifying similar cities according to land use images without considering the size of the cities, their histories, appearances, layouts or description. The benefit of Orange software is its simple application in this task. Validation of this new concept is expected in the future.
2. Materials and Methods
The main dataset (i.e., the maps explored in the present research) was downloaded from the European Urban Atlas [19]. The present research also used maps from the Czech map portal (https://mapy.cz) as a training pilot set. A small set of screenshots of various map types (historical, aerial, and base maps) was manually prepared to test the abilities of the Orange data mining software and add-on Image Analytics. The Orange software and source data are described in detail in the following sections.
2.1. Orange Software and Embedded Image Analytics Widget
Orange software [20] is a visual data mining software developed by the Bioinformatics Laboratory at the University of Ljubljana in Slovenia. The software is non-commercial and available for free use. Orange software is primarily designed for educational purposes, but it is very useful for practical data processing. The intuitive interface and non-commercial platform make it suitable for wider use in data analysis and data mining tasks. Its functionality can be extended with add-on widgets such as Time Series, Associate, Geo, Text, Image Analytics, etc.
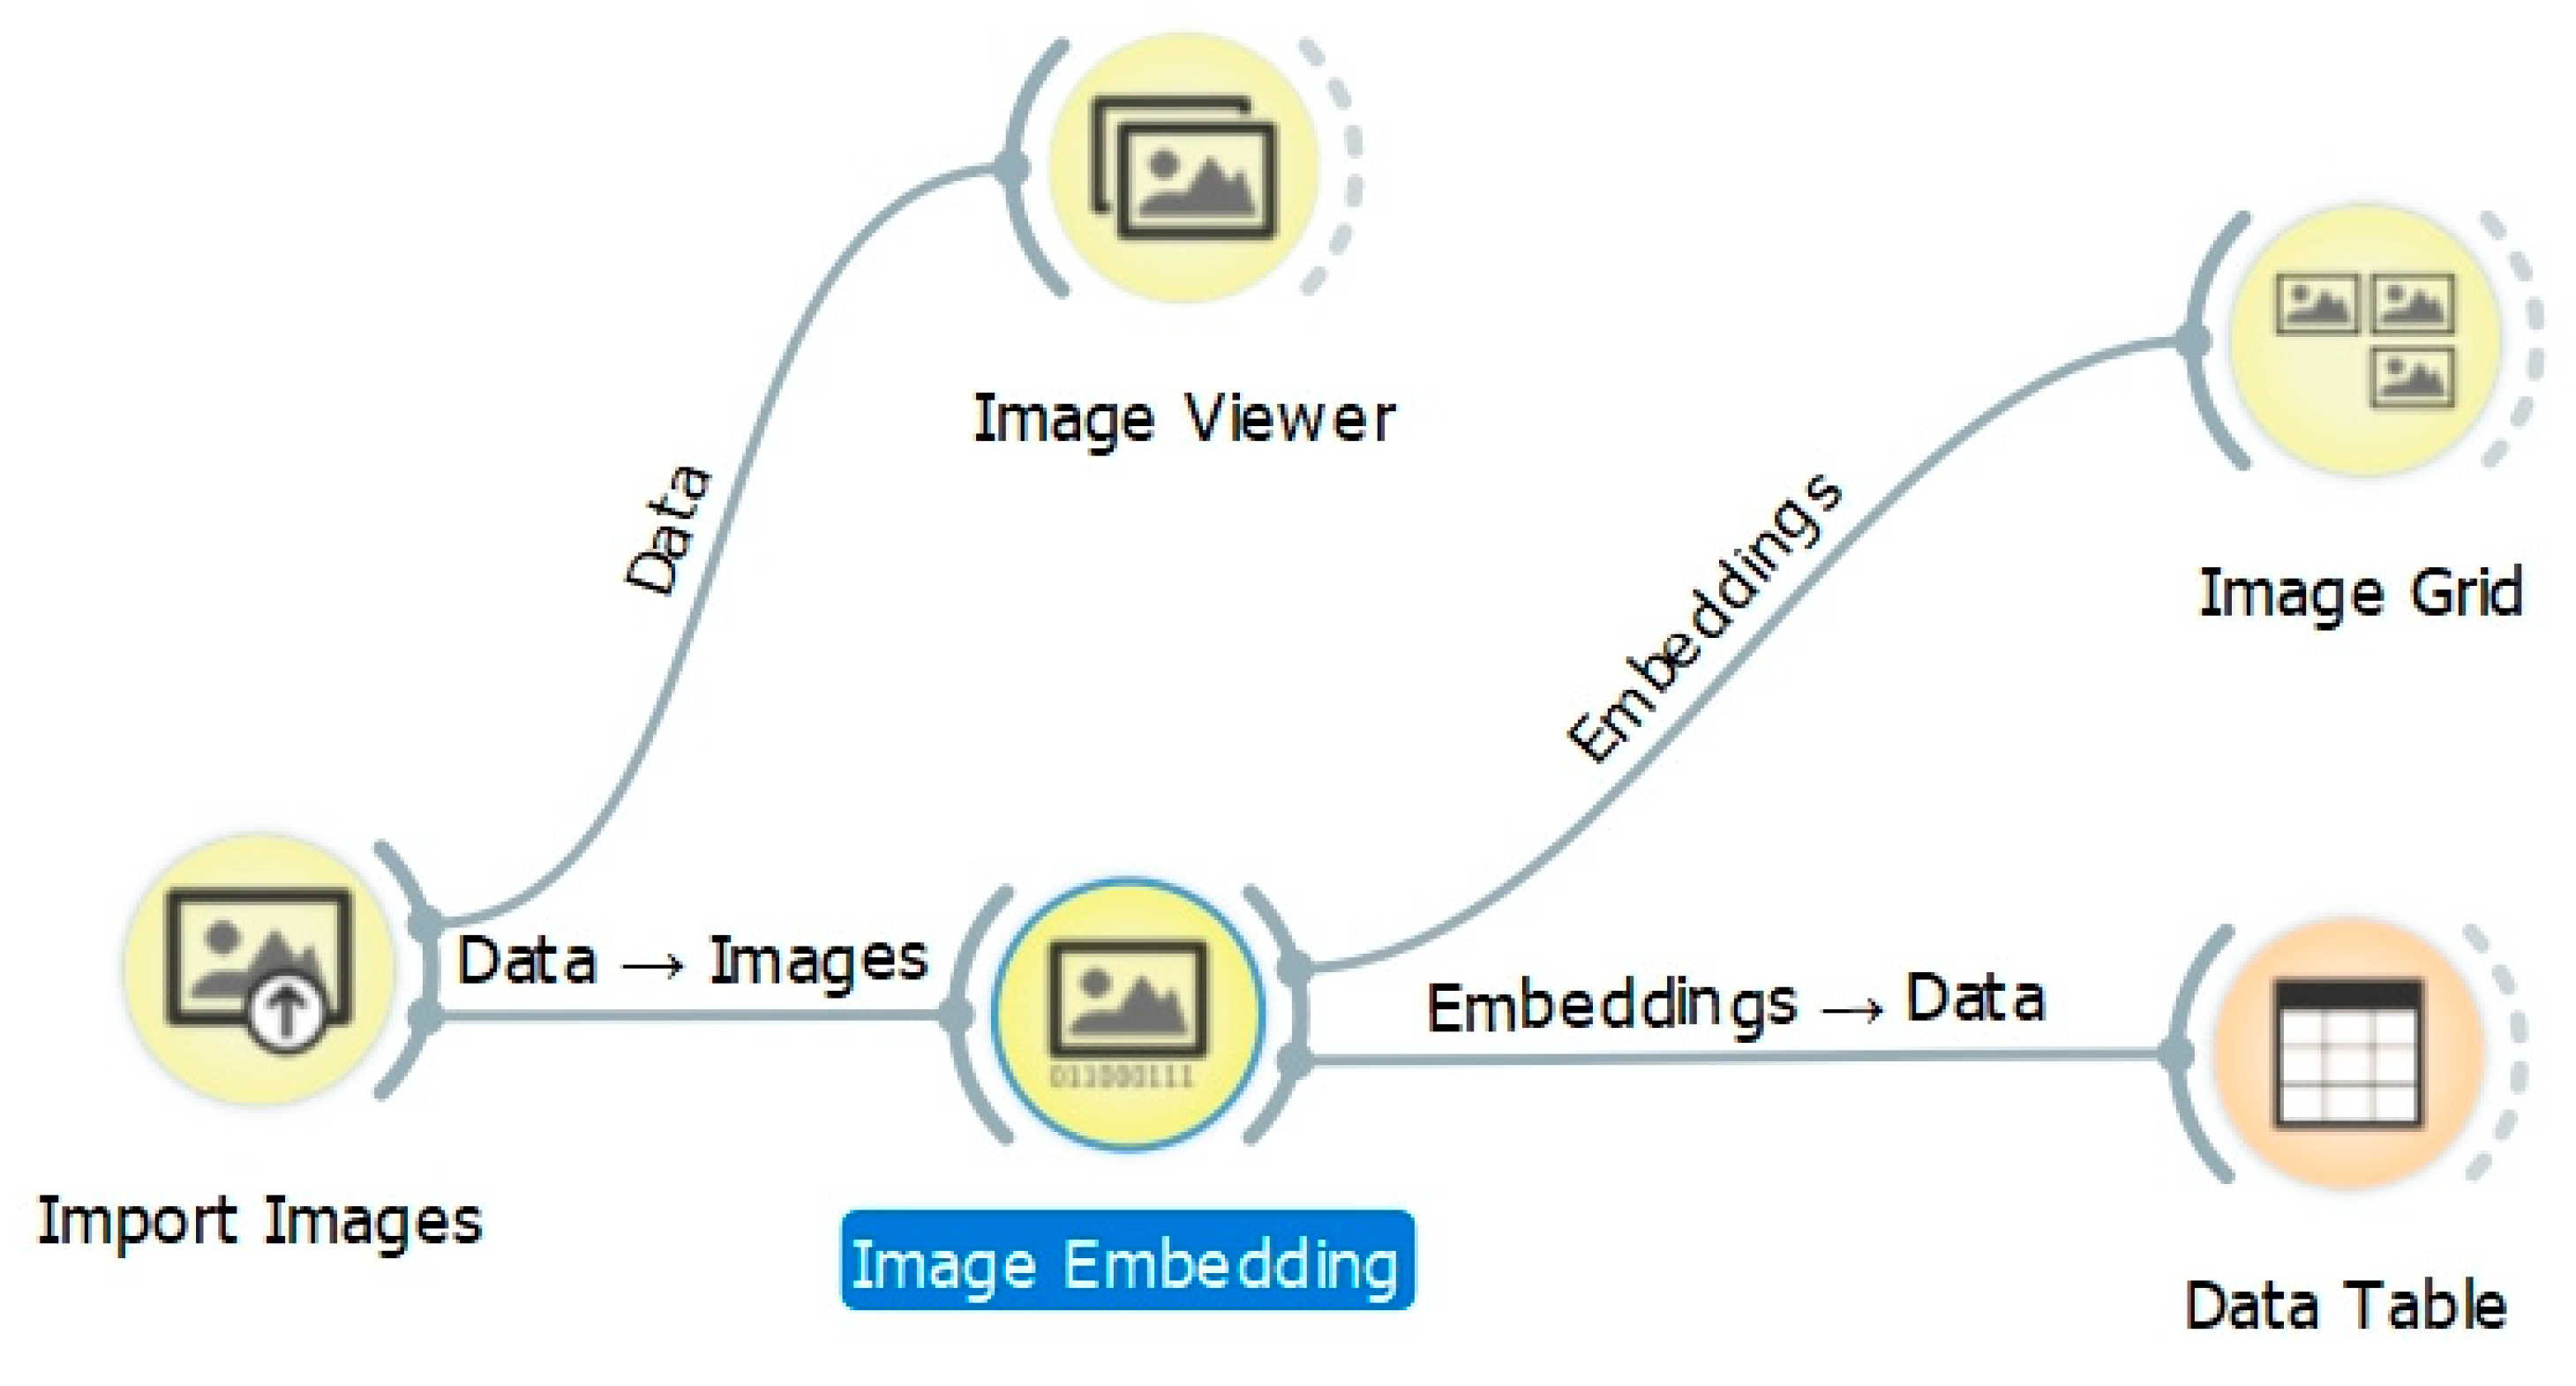
The Image Analytics add-on is designed to use images for unsupervised machine learning. The add-on has five widgets: Import Images, Image Viewer, Image Embedding, Image Grid, and Save Image (in version 0.4.1). The process is designed as a visual workflow with a chain of widgets (Figure 1). The widgets from Image Analytics are indicated as yellow nodes in the workflow. The core widget is Image Embedding and offers several embedders, each trained for a specific task. Image Embedding offers six pre-trained artificial deep neural networks [21]:
- SqueezeNet model for image recognition trained on ImageNet.
- Inception v3 (Google’s Inception v3) model trained on ImageNet.
- VGG-16 (16-layer image recognition model) trained on ImageNet.
- VGG-19 (19-layer image recognition model) trained on ImageNet.
- Painters model trained to predict the artists of artwork images.
- DeepLoc model trained to analyze yeast cell images.
The Painters embedder was selected for use in the present study. The author of Painters is Nejc Ilenič, who trained the convolutional neural network on 79,433 existing artwork images produced by 1584 different artists. The test set was composed of 23,817 instances [22]. This neural network can be used to find similar artwork paintings in educational videos [23] or for images that include animals, photos, traffic signs, etc. [24].
In each of the embedders, input images are sent to a server or evaluated locally on the user’s computer, and vector representations of the images are computed. An enhanced data table is then returned with additional columns (image descriptors). For each input image, one output feature vector is calculated. Examples of the enhanced data table are shown in Figure 2. The embedder represents each image with a vector feature, allowing Orange’s standard functions to be used for clustering, classification or any other kind of feature-based analysis.
The results from the Image Embedding widget could be depicted more simply with the Image Grid widget (final yellow node in Figure 1). Another option is to find clusters of images by calculating distances and applying hierarchical clustering. The final dendrogram shows clusters of similar images. Hierarchical clustering as a fundamental data mining task is demonstrated in an educational video on the Image Analytics widget [25]. This method has also been used in previous research on land use patterns to find cities in Europe that showed similarities [26]. The dendrogram was also constructed for 787 cities. The size is huge, and the similar cities are placed at the lowest level.
The Neighbors widget can also be combined with the results of the Image Embedding widget. The Neighbors widget is not often used in Orange [24]. The source for the Neighbors widget is a matrix of features produced using the Image Embedding widget (Figure 2). The Neighbors widget computes the nearest neighbors of a selected reference (image or map in the present study) and the selected type of distance measurement. The selected reference can be either a single instance or more instances. The widget outputs the nearest n instances in the data, where n is set in the widget according to the user’s choice. The second parameter for computing neighbors is a distance measurement. Supported measurements are Euclidean, Manhattan, Mahalanobis, Cosine, Jaccard, Spearman, absolute Spearman, Pearson, and absolute Pearson [27]. Cosine similarity is preferred for calculating the distance above an attribute’s height, where a descriptive vector consists of 2048 real numbers n0, n1, … n2047 in the case of the Painters embedder. Cosine distance was parameter selected to calculate the nearest neighbor distance in all the presented experiments. Outputs from the Neighbors widget were selected as the main data for determining similar maps of land use in the present research.
2.2. Copernicus Urban Atlas and Data Pre-Processing
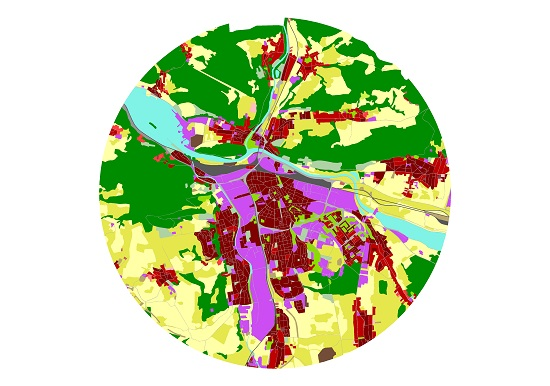
The Urban Atlas uses satellite images to create reliable, cost-efficient, and comparable high-resolution vector maps of urban land [28]. Urban Atlas does not directly provide data for entire cities but in units designated as functional urban areas and for their surroundings (over 50,000 inhabitants). The 2012 reference year has almost 800 FUAs. The data can be downloaded free in vector format (shapefiles), together with metadata, a map, and color legend (Figure 3a) for land use categories.
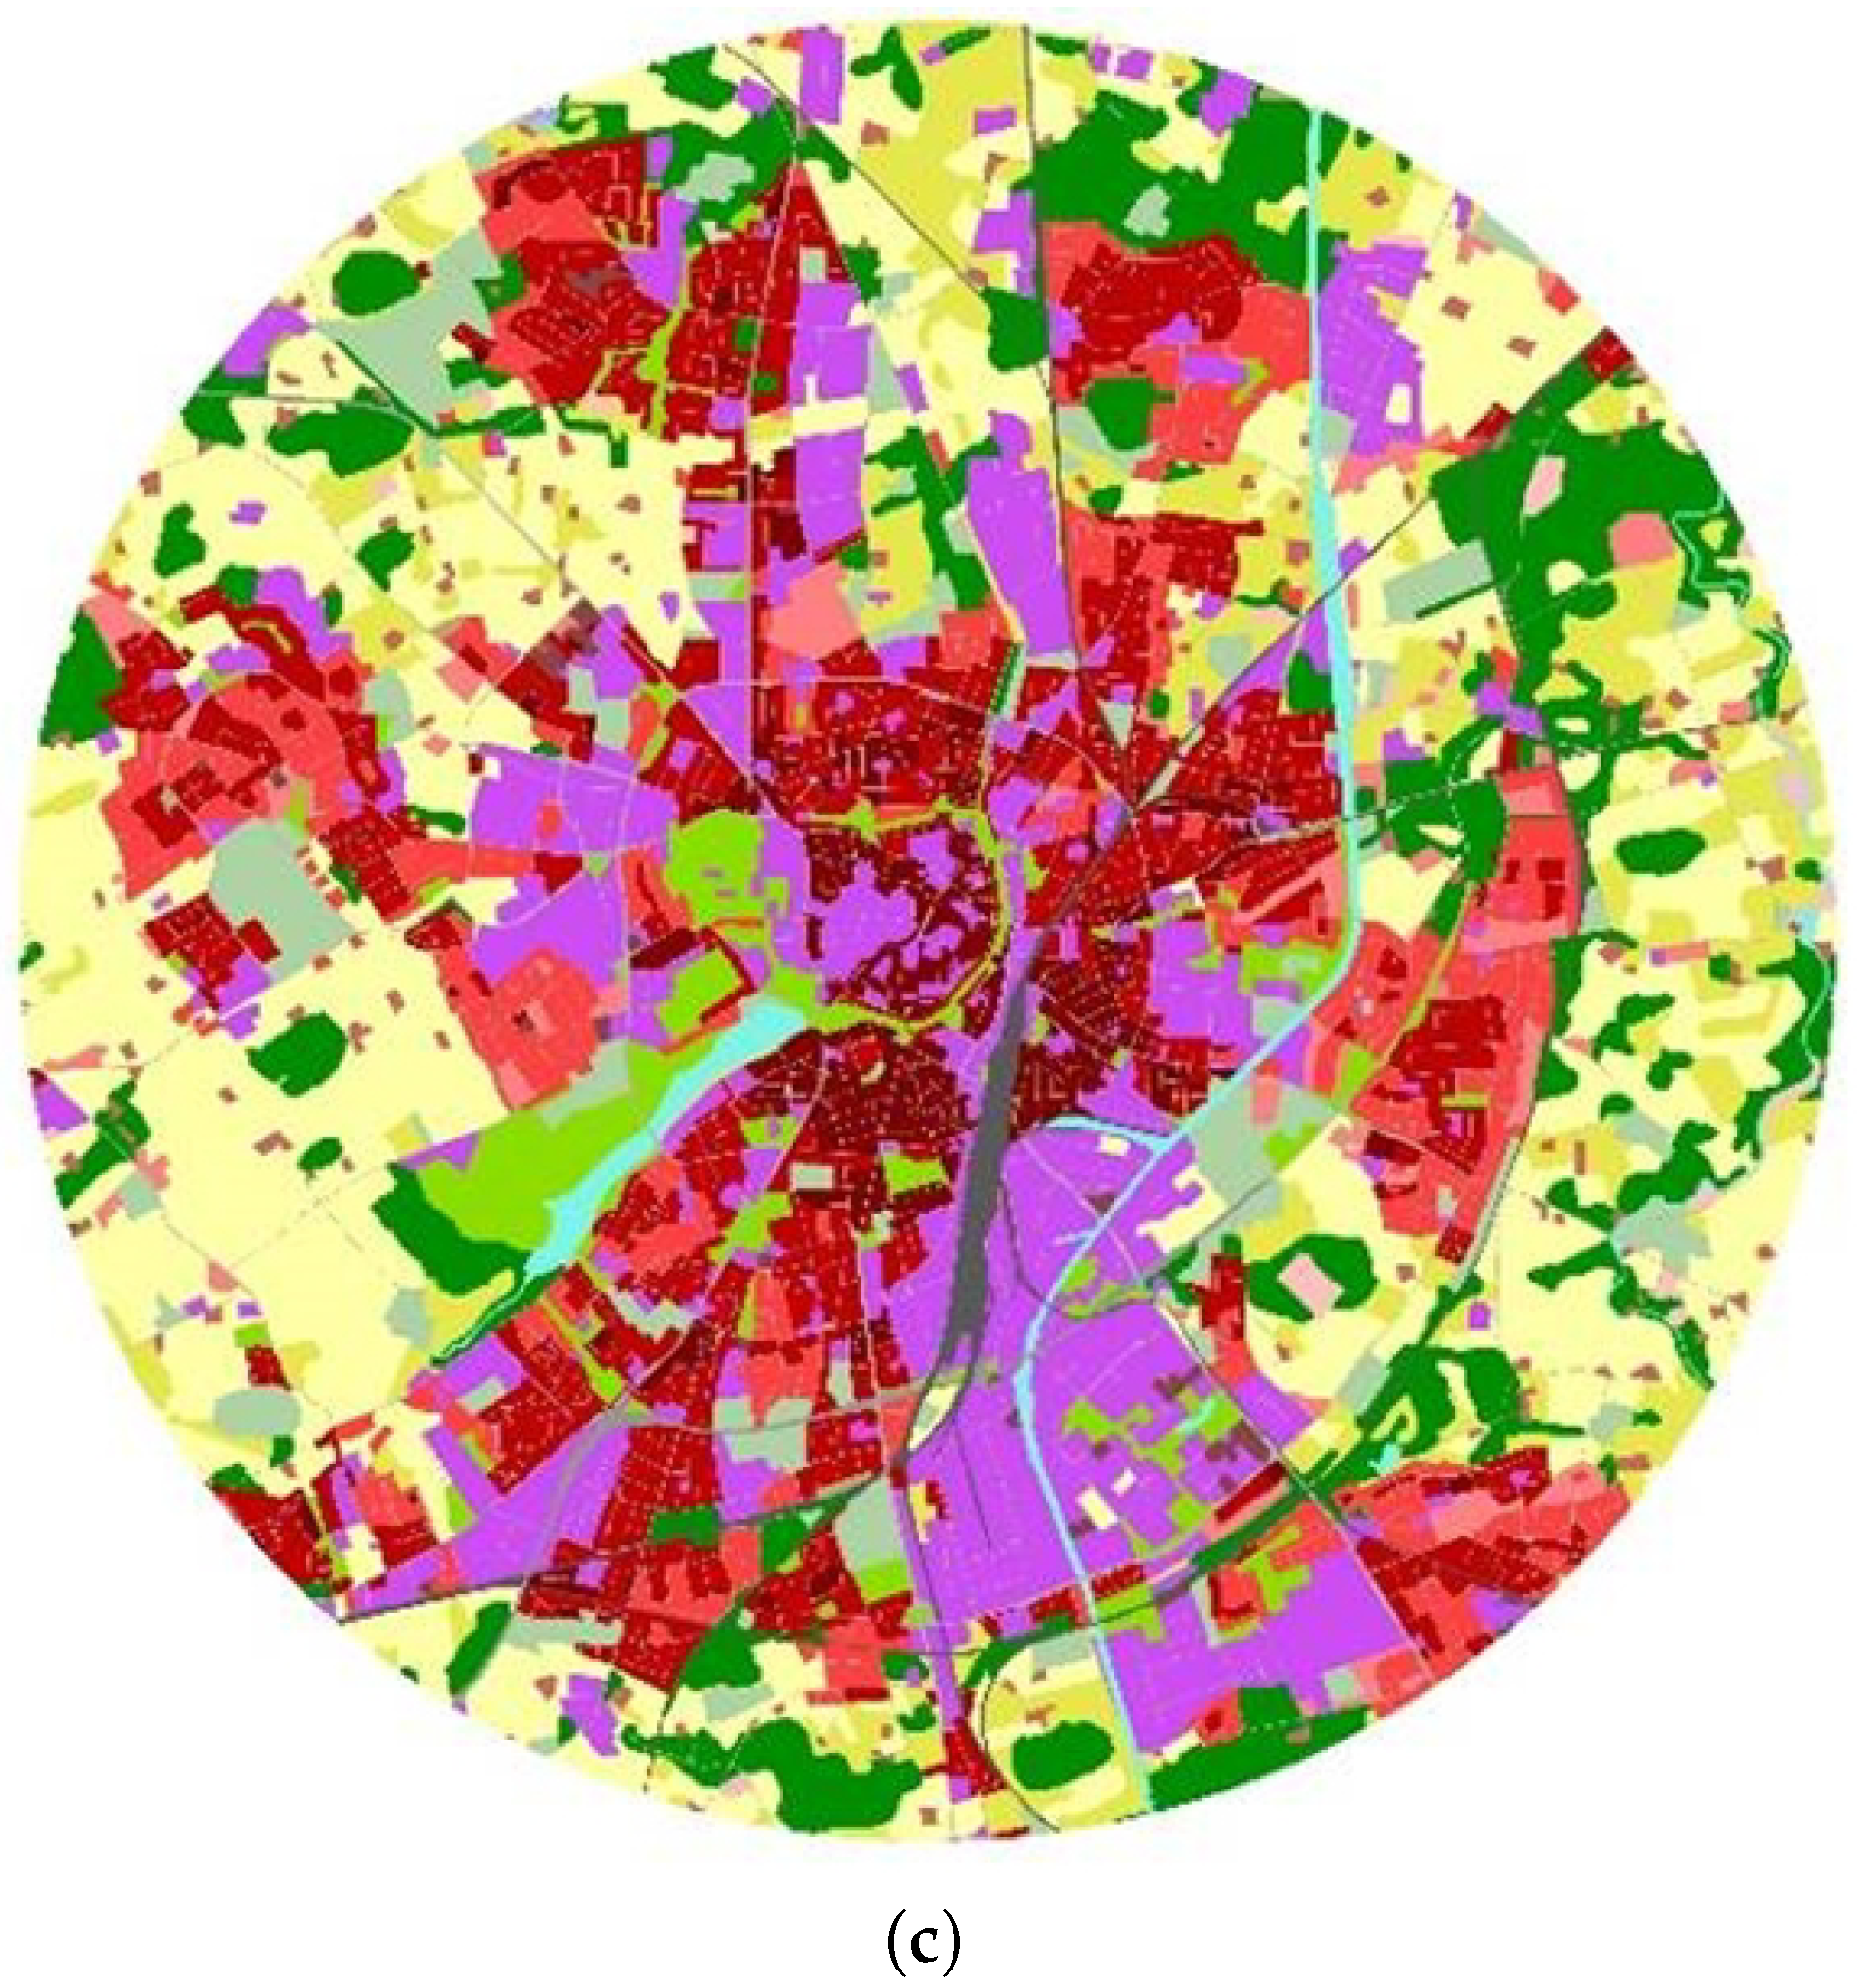
Land use is sorted accordingly around 30 different hierarchical classes grouped into several main categories: urban fabric with different densities; industrial and commercial areas; transit and railway areas; water, green and sports and leisure facilities; forests and other green areas [30]. Spatial resolution relies on class; the minimum mapping unit is 0.25 ha for class 1, and 1 ha for class 2–5, respectively (Figure 3a). The minimum mapping width is 10 m. Each category has its own color in the map and legend. Red color tones are used for urban fabric; blue tones for water and wetlands; yellow for arable land (pastures); green for green urban areas (forests, vegetation, sports areas); grey for transit roads and railways. Specific areas such as construction sites, ports, and airports are also indicated (Figure 3).
The main experiment commenced with preparing the data for European cities from Urban Atlas. A total of 787 datasets of functional urban areas (FUAs) was downloaded. City centers were selected from the FUAs. Since the source data contained not only cities but also surrounding areas that included other cities, suburbs, towns, and villages (whole FUA), the central areas of cities were selected manually by circumscribing only their main sections in the FUA. The central points of cities were set primarily according to their historical centers or a location of importance. The centers were main squares or important buildings, such as churches, city halls, municipal buildings or centers of commercial activity or traffic [18]. A circular extract of the main central extent of cities was clipped from the shapefiles. Data were processed in ArcMap for Desktop in ArcGIS v. 10.6, and the circular color maps were then exported from ArcGIS in JPG format according to a previous procedure (see [26]).
2.3. Identifying Similar Maps
The preliminary research tested a small dataset with map screenshots from the map portal: https://mapy.cz. A set of 20 different base maps was prepared using a random selection of inhabited and sparsely inhabited areas. Scale was set in each to approximately 1:200,000. Size was not specifically the same since image similarity did not depend on the size of the artworks [22]. The scheme depicted in Figure 4 indicates how a similar base map was found by searching for the nearest neighbor using cosine distance. The pair in Figure 5a shows a reference map for the surroundings of the town of Třeboň and several water bodies (ponds). This is the nearest map to the town of Hustopeče, which is also surrounded by water bodies (Nové Mlýny reservoir and smaller ponds). The second pair of neighbor maps is shown in Figure 5b. These two neighbor maps indicate several comparable mid-sized settlements and several lines and crossings of first and second class roads (but greater density), and a small number of green woods and water bodies. Automated discovery of neighbor couples from base maps in this manner showed promise. Other pairs were also explored (but are not presented), and the visual comparison satisfied the author’s expectations in finding look-alike extracts from base maps.
The next experiment attempted to work with four types of screenshot maps from the same map portal. This included historical maps, aerial maps, and base maps converted into black and white images. In total, the second test sample contained 65 maps of four types. The widget Image Grid shows a similarity grid (i.e., images with similar content were grouped with each other). The widget can be used to compare images and search for similarities or differences in the selected data instances. The resulting image grid for the 65 maps is shown in Figure 6. The result suggests that the four types of maps were automatically separated into four different clusters. The results of unsupervised learning by the Painters embedder once again demonstrated promising results in processing maps.
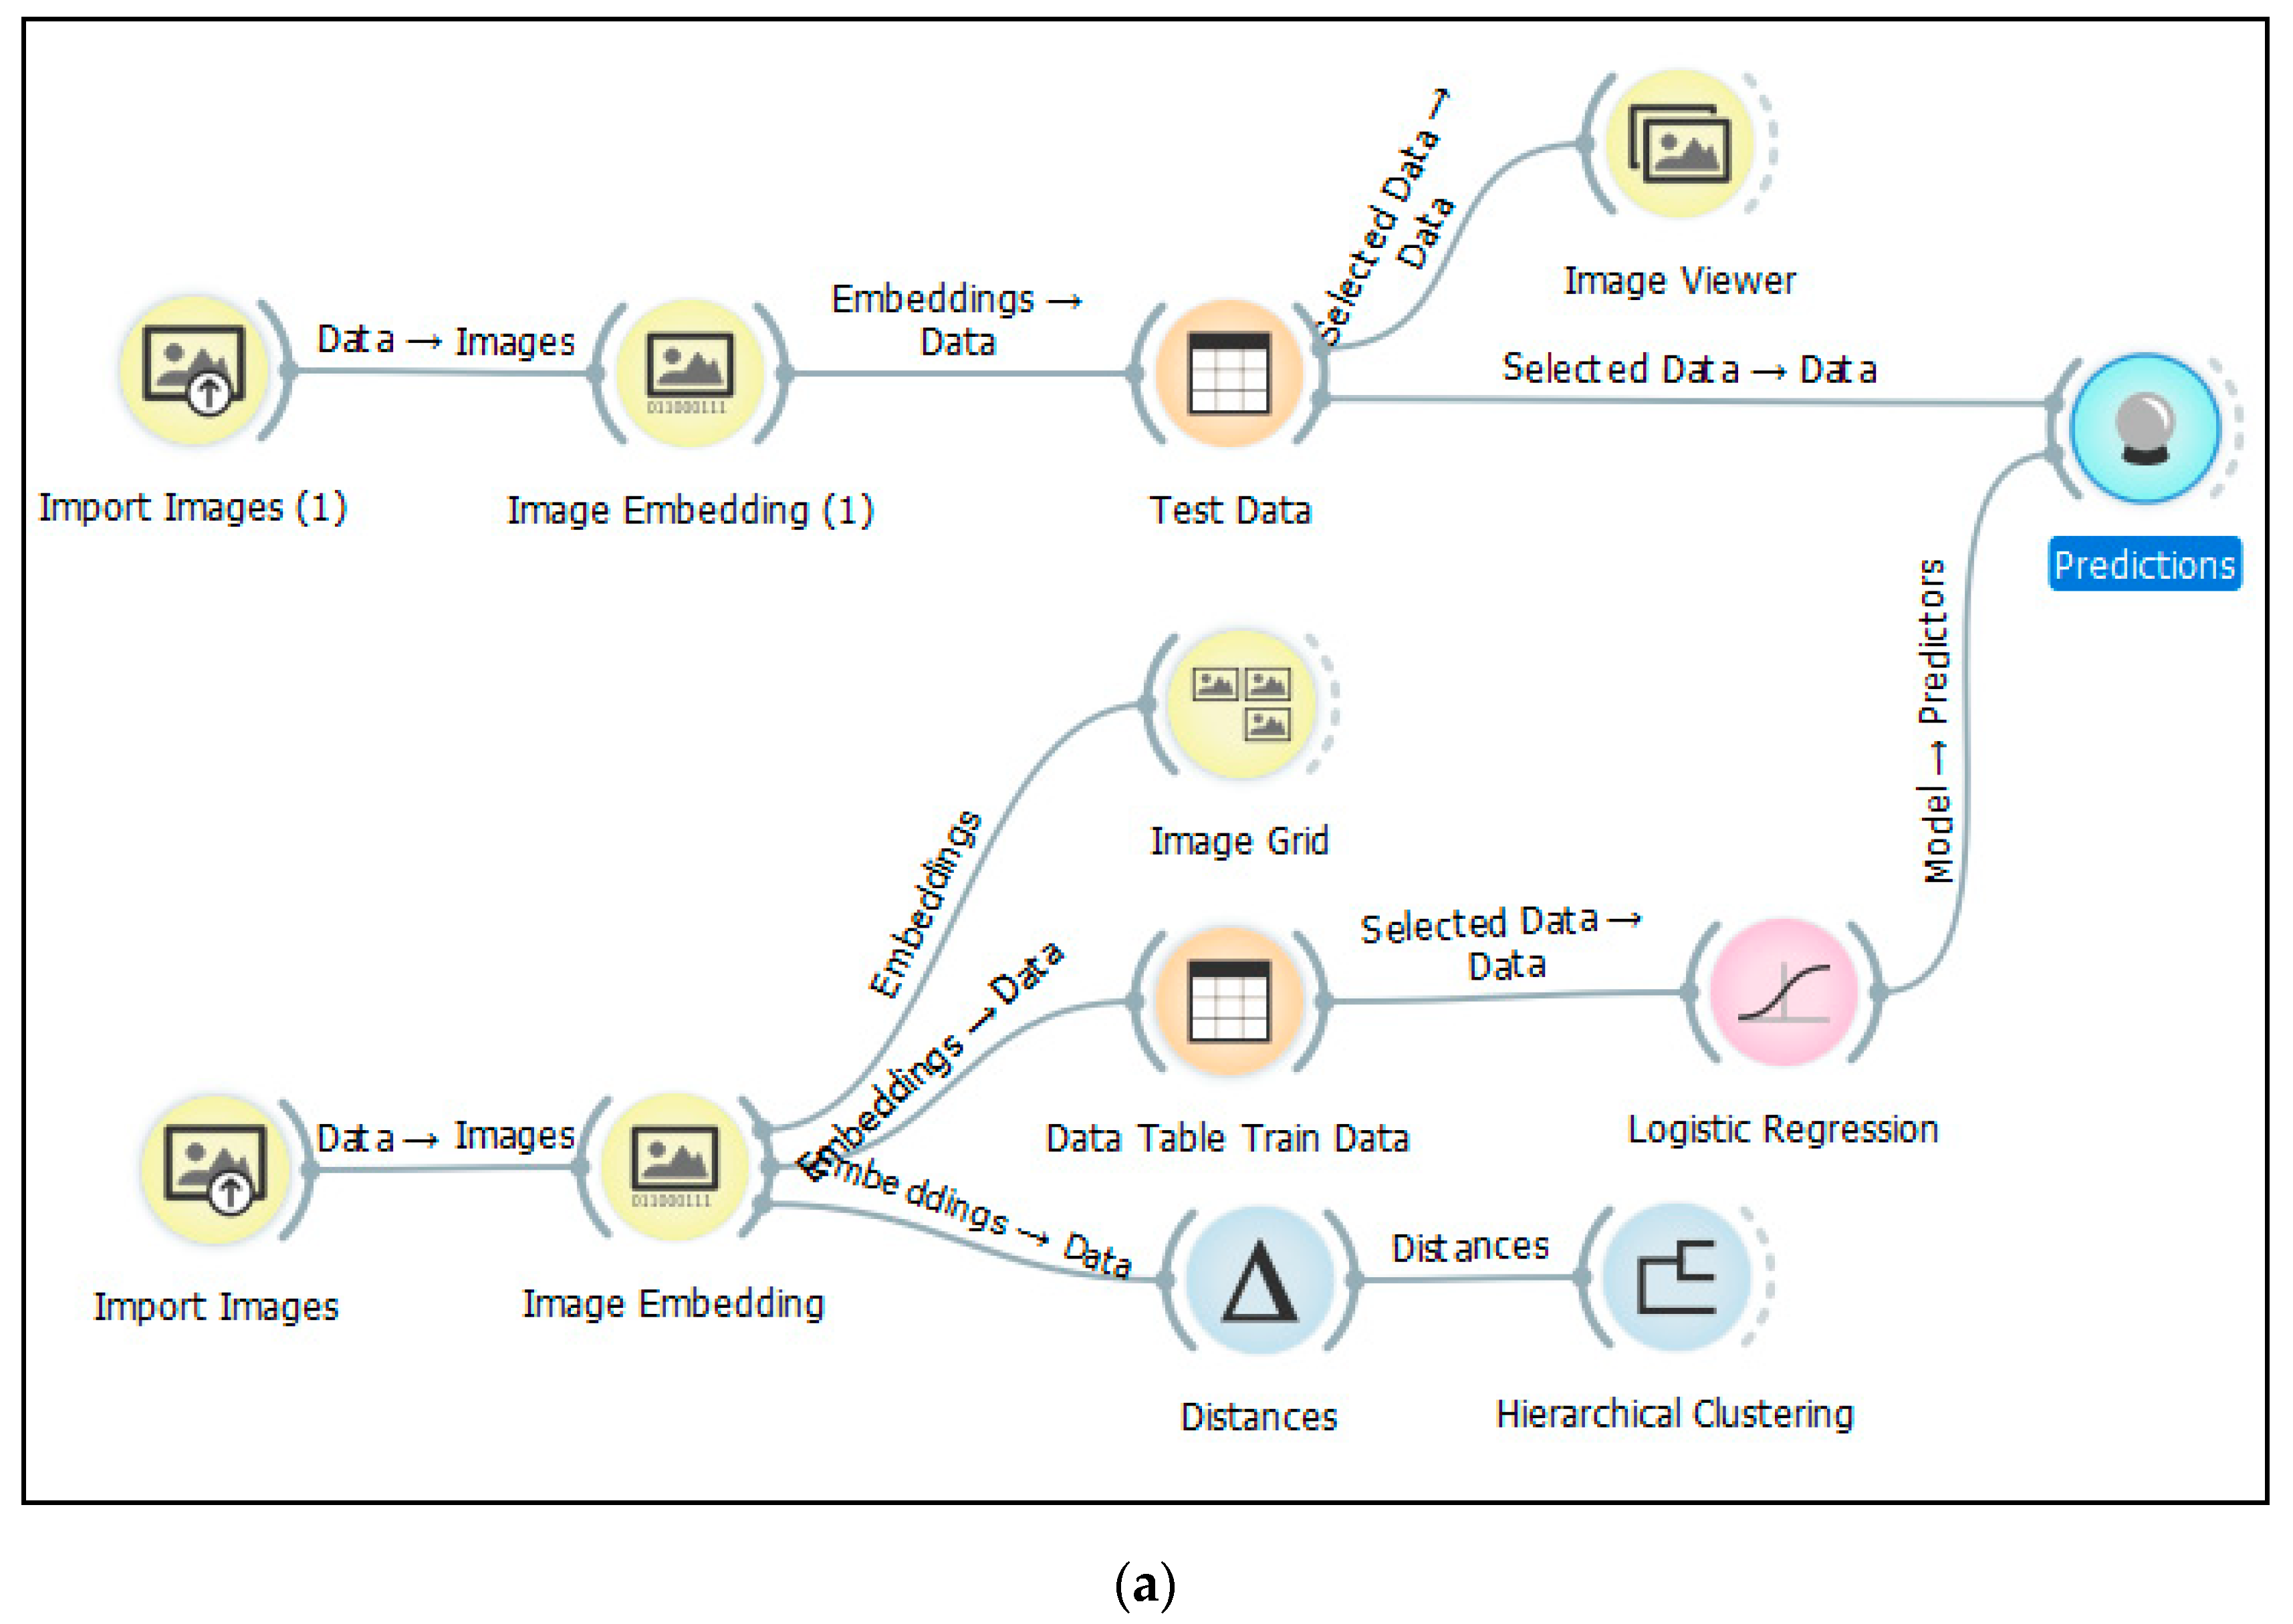
The final experiment in the preliminary testing attempted to predict the type of map according to known categories. Four more sample maps were prepared, consisting of two historical maps and two aerial maps. The Painter embedder calculated the feature descriptor for these four maps. The second Painter embedder in the workflow calculated the feature vector for the set of 65 maps according to category. Allocation to a category was achieved with the Logistic Regression and Prediction widgets, as indicated in the workflow (Figure 7a). The resulting allocation of new maps into categories was correct with a high degree of probability (Figure 7b). Two aerial maps were assigned to the aerial map category (probability 1 and 0.99) and two historical maps were assigned to the historical map category (probability 0.95 and 0.99).
3. Results of Look-Alike Cities from Urban Atlas
After preliminary testing with maps from the map portal, the following experiment using land use of cities was accomplished. The second experiment also discovered that the existing pre-trained neural network Painters, which is outside cartography, is applicable for categorization of land use maps with data mining tasks such as clustering, similarity, and finding the nearest neighbor. A detailed description of the second experiment follows.
GIS software ArcGIS for Desktop v. 10.6 [31] was used to process the downloaded data from Urban Atlas (shp format). The methodology from Section 2.2 was applied. The circular area was defined using proper central point and buffer operation in ArcGIS. Each city was clipped into a circular shape with a different diameter. The extent of these areas considered all parts of the cities, including continuously connected suburban areas. The definition of diameters was made with punctual consideration to cover an important part of cities including partial surrounding. If the shape of the city was elongated, the extent contained meadows, fields, and forests in the greater portion. The Urban Atlas joins the common unified color legend together with downloaded data. In ArcGIS, the same color legend (UrbanAtlas2012.lyr) for land use categories was applied to the previously prepared circular extracts of cities. Maps were exported into JPG images with a resolution of 300 dpi from ArcGIS. The final data set contained 787 images of circular maps. Then the data mining process continued in Orange software.
For processing in Orange, the same workflow used in preliminary testing was applied (Figure 4). In Section 2.3, the workflow was able to find the nearest neighbor pairs (triplets, etc.) of images; for example, map extracts in preliminary testing. This workflow’s advantage is that it may be used with any other data set in Orange, and it is therefore very effective. Only the working directory must be set to process new data in the Import Images widget. Subsequent widgets in the workflow calculate new data automatically. To process around 800 pictures of land use maps of cities, the software requires several minutes because the embedder sends data to a server containing the pre-trained neural network Painters. The image descriptors are then returned shortly after. Image descriptors is the matrix of 787 × 2048 cells where each row is descriptor for one picture.
Previous research investigated only a subset of 100 European cities [26]. The results from this subset were taken and compared in the present study with a new, larger dataset. The previous processing applied hierarchical clustering with cosine distance and Ward’s method of linkage. The first resultant pair was the city of Maribor (Slovenia) and Bern (Switzerland). They were also the nearest neighbors in the larger dataset in this new investigation. The widget also offers a parameter which can find two or more neighbors. Results are pairs, triplets, quartets, etc., of look-alike cities. The nearest city to this pair was Pontevedra (Spain), where curve-shaped land use areas dominate. Image analysis revealed the curved land use shapes. The next pair of cities was Warwick and Cambridge in England, also found using the Neighbor widget. The next nearest city was Preston in England. These three cities were similar in shape due to their surrounding pastures. History and geographical conditions may also affect the similarity of cities. Frequently, cities from the same country are similar due to their historical evolutions and geographical locations, as well as the specific evolution of industry in that country. Another resultant pair was the Czech cities České Budějovice and Hradec Králové. These cities are typified by a regular mix of continuous urban fabric with discontinuous medium density urban fabric in isolated patterns (former small settlements which have merged to become city districts).
The present study followed with a systematic selection of cities and the identification of similar cities using the Neighbor widget (Figure 4). The nearest neighbor analysis was selected as the main method in finding look-alike cities. The resultant pairs of cities from different countries were the most interesting. Examples are presented in Figure 8 and the other 12 pairs are in Appendix A.
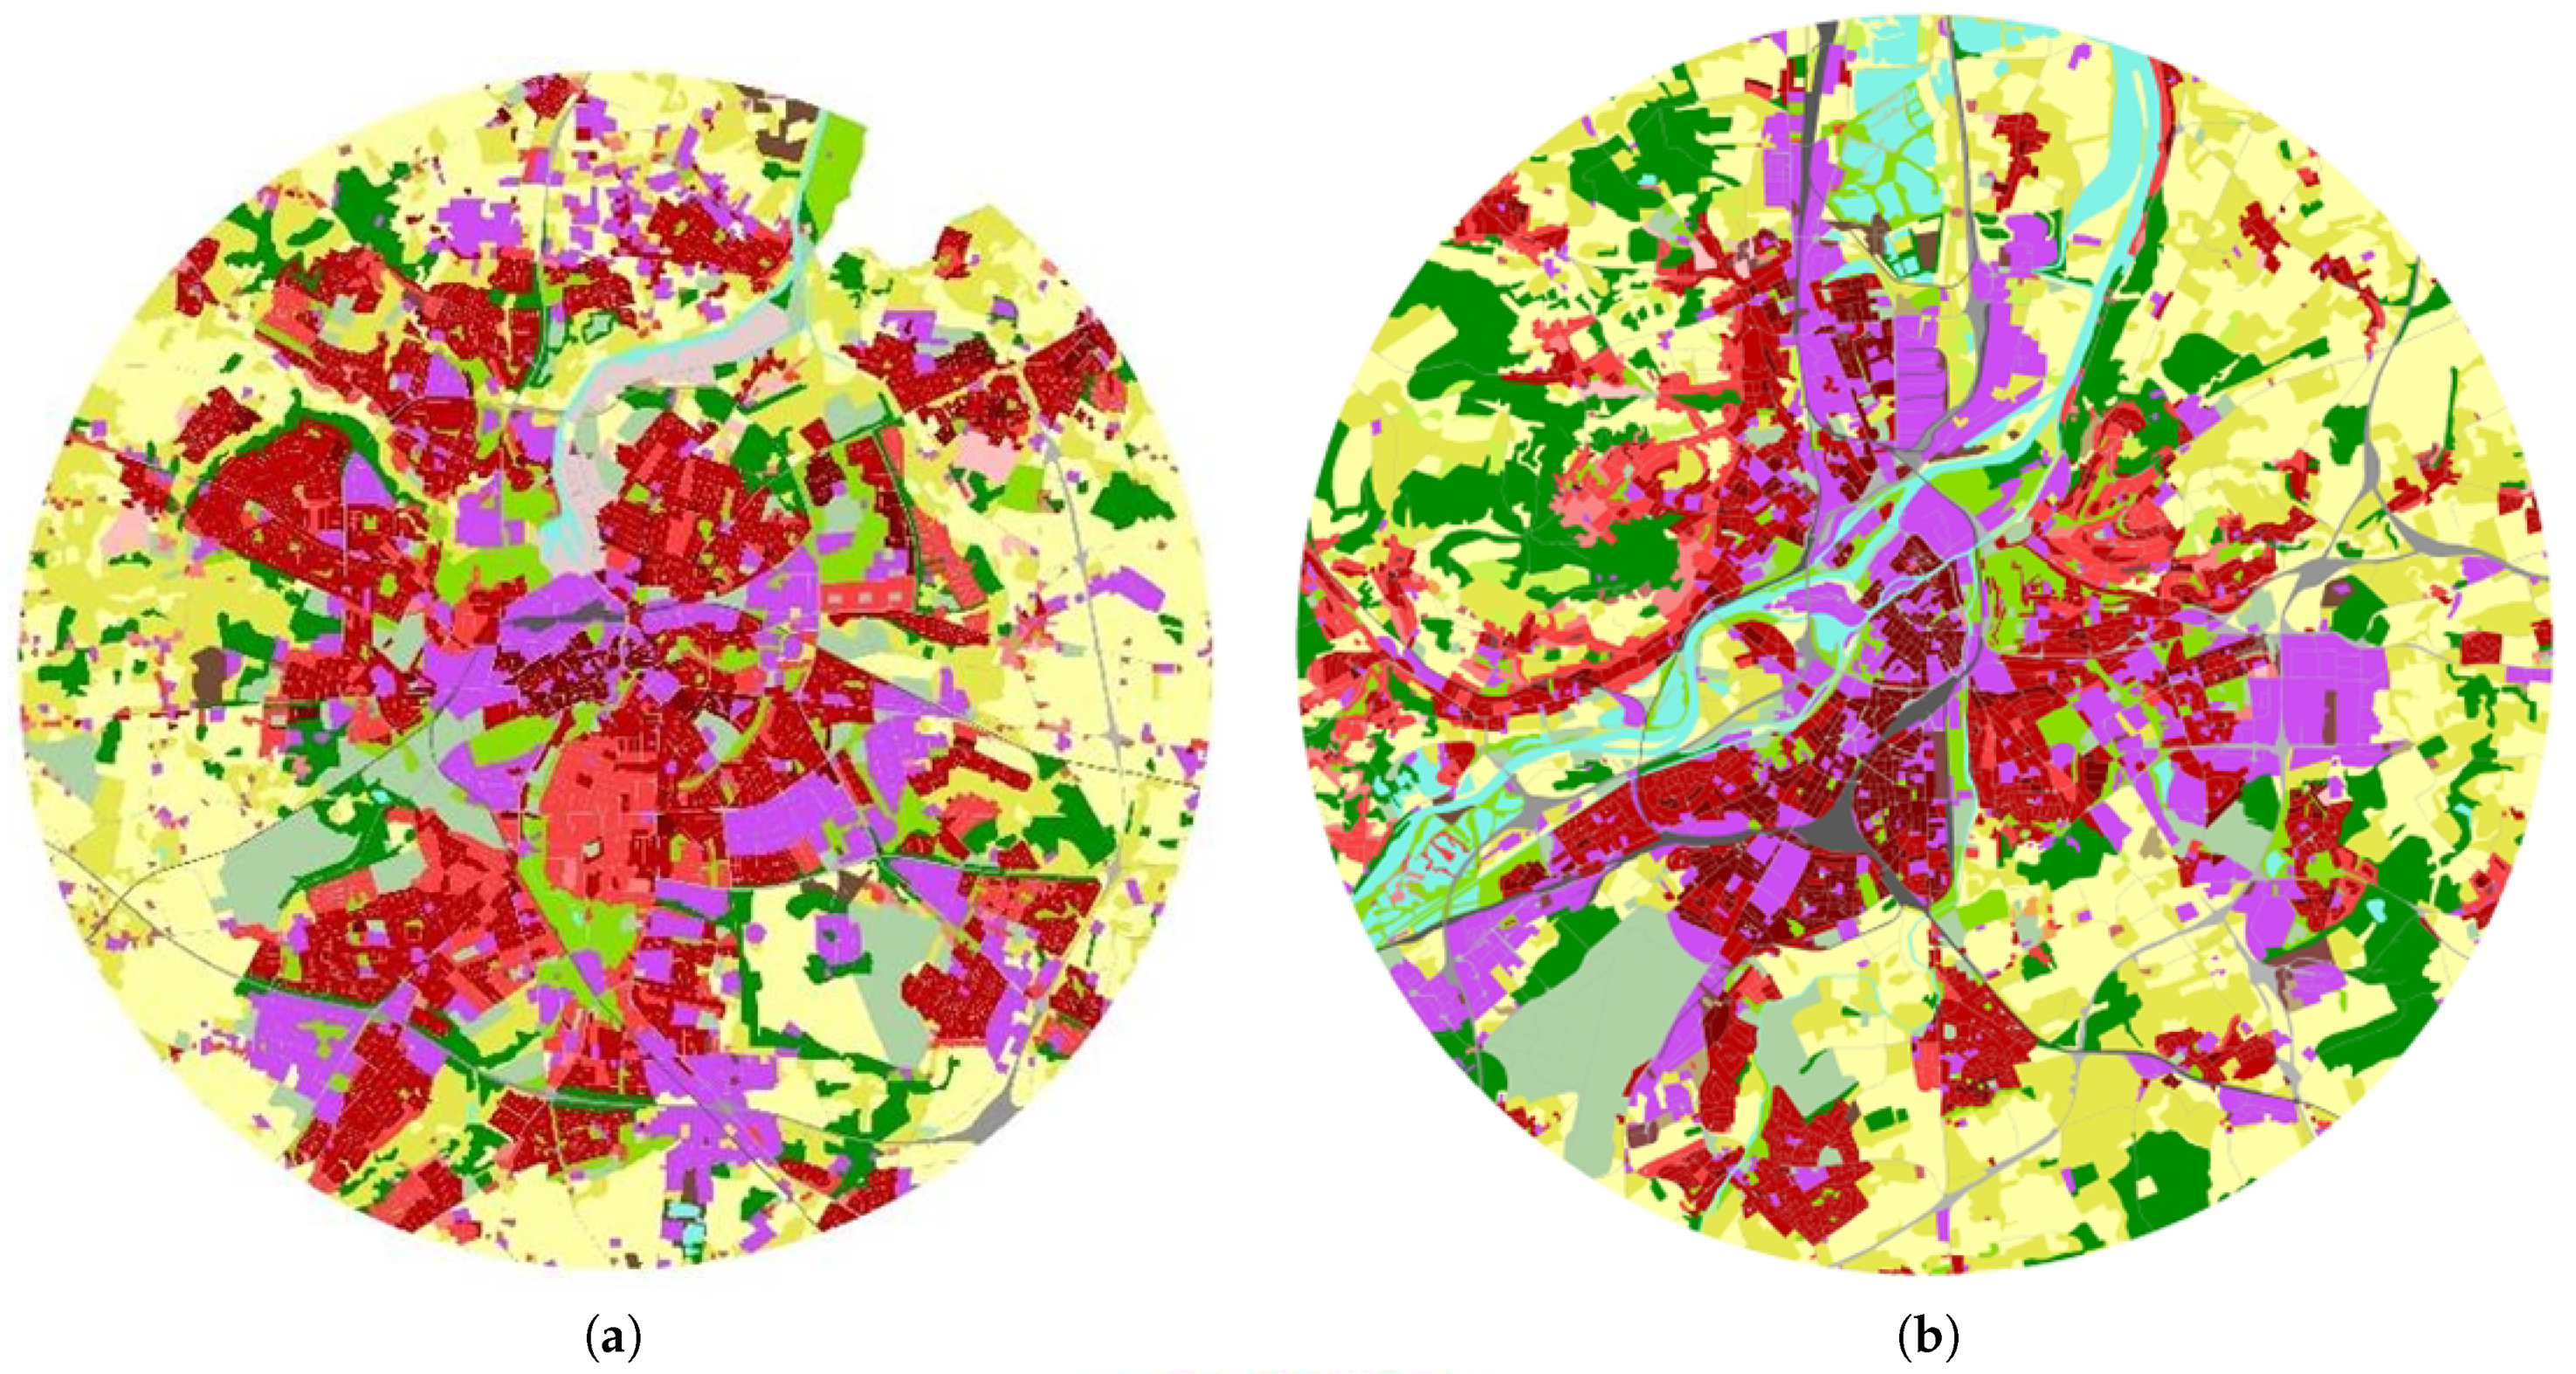
An interesting nearest neighbor pair was Zalaegerszeg (Hungary) and Žilina (Slovak Republic). Both cities contain several large and continuous industrial areas (violet color), and the urban edges touch many forest areas. A continuous urban fabric over an urban fabric with low density with low occurrence prevails in the centers (density > 80%) of these two cities (Figure 8). Both cities were formerly under a communist regime, which is perhaps a contributory reason for their similarity. In addition, the size of both cities is from the same category under 100,000 inhabitants. Žilina has 81,000 and Zalaegerszeg has 61,600 inhabitants. Both are located near the river and absorbed many surrounding villages in the second part of the 20th century. It is visible by isolated kernels of the continuous urban fabric. Both cities have local importance by their industry.
Figure 8 shows also shows another interesting pair: Novi Sad (Serbia) and Tarbes (France). In both cities, a rectangular array of patterns in the urban fabric dominates. Both cities have only a single, dominant center with a high-density urban fabric (historical center with old buildings). A discontinuous urban fabric (density 50–80%) covers a greater area than a continuous urban fabric. Forested areas are few or absent in the surroundings of these cities. Both cities are surrounded mainly by arable land and fields.
The results for three look-alike cities are shown in Figure 9. The cities Odense (Denmark), Metz (France), and Münster (Germany) represent cities with a typical sprawl towards several parts (suburbs at the peripheries) and a non-homogenous layout. The non-typical layouts of these cities are due to the existence of industrial and commercial areas in their centers and across the entire city. The industrial areas are not very continuous and are spread out.
A high occurrence of discontinuous medium density urban fabric can be seen in opposition to a continuous urban fabric. This is typical of Western European cities, but not Eastern European cities (e.g., cities of Zalaegerszeg and Žilina). Forests exist in small isolated pockets. The land use pattern is a mosaic of various types. Salzburg (Figure 3) also approximates the third group. Neighbor cities can thus be explored by defining groups of similar cities according to the typical character of their land use arrangement.
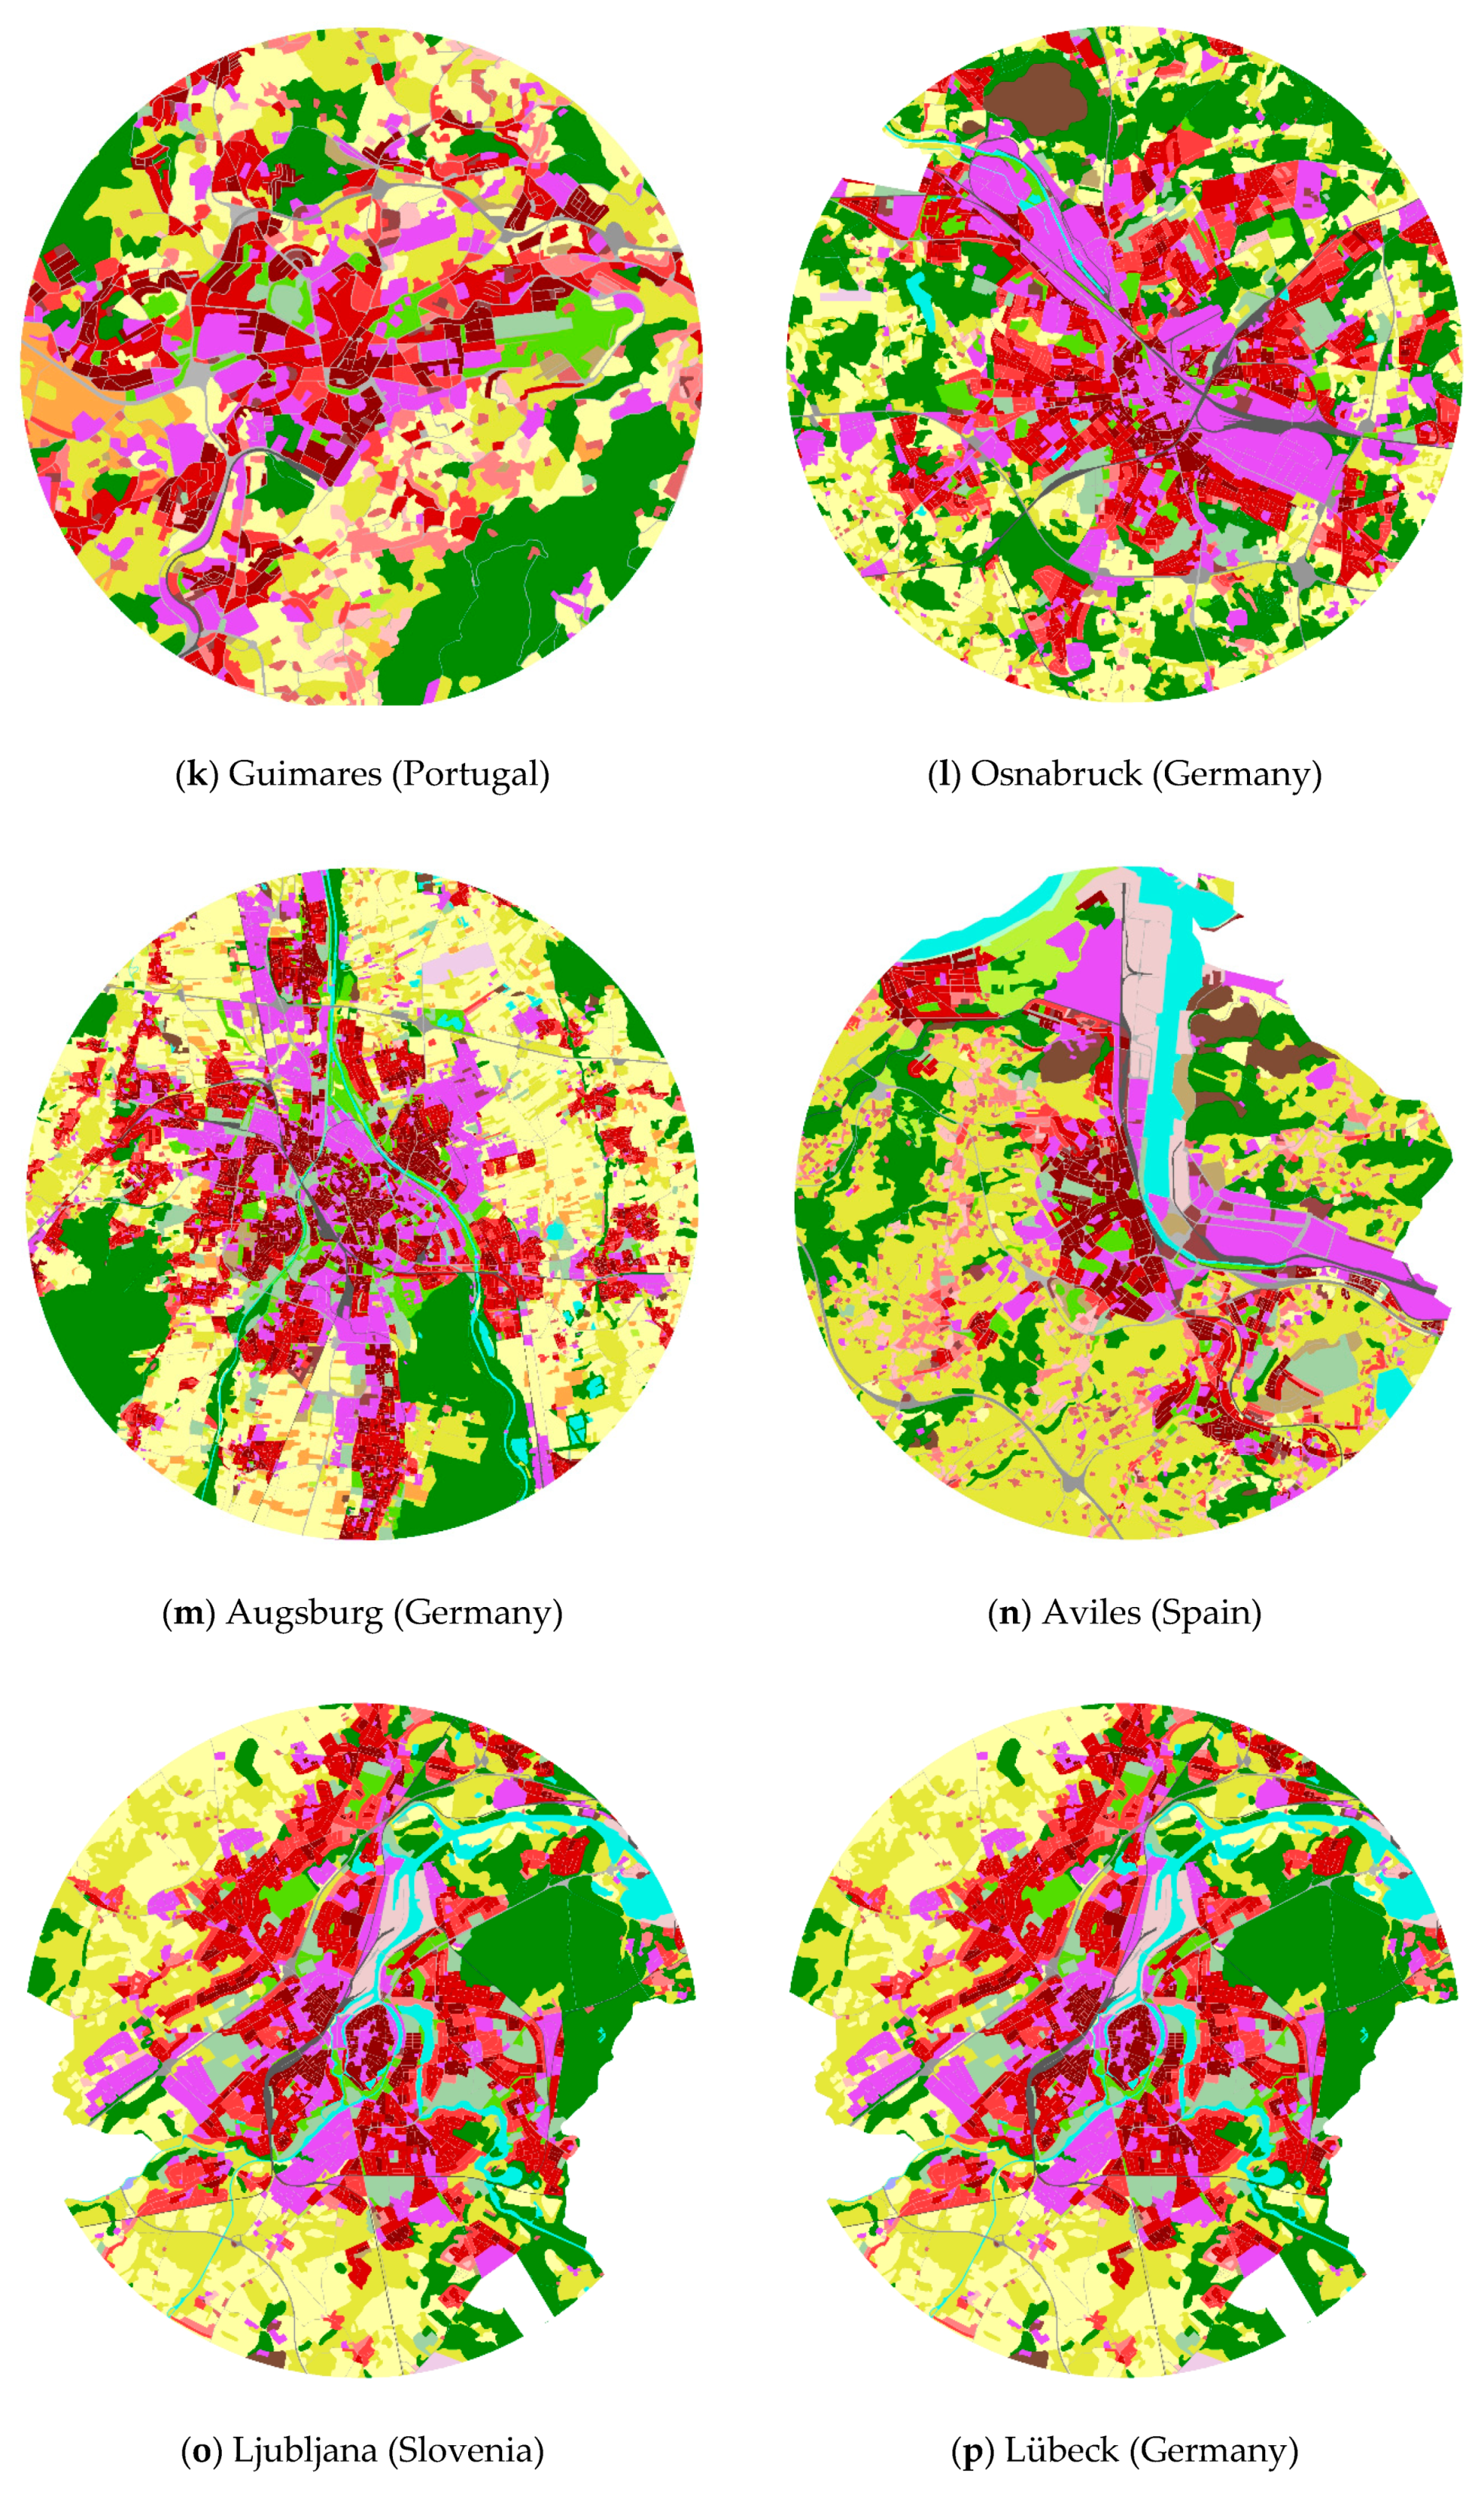
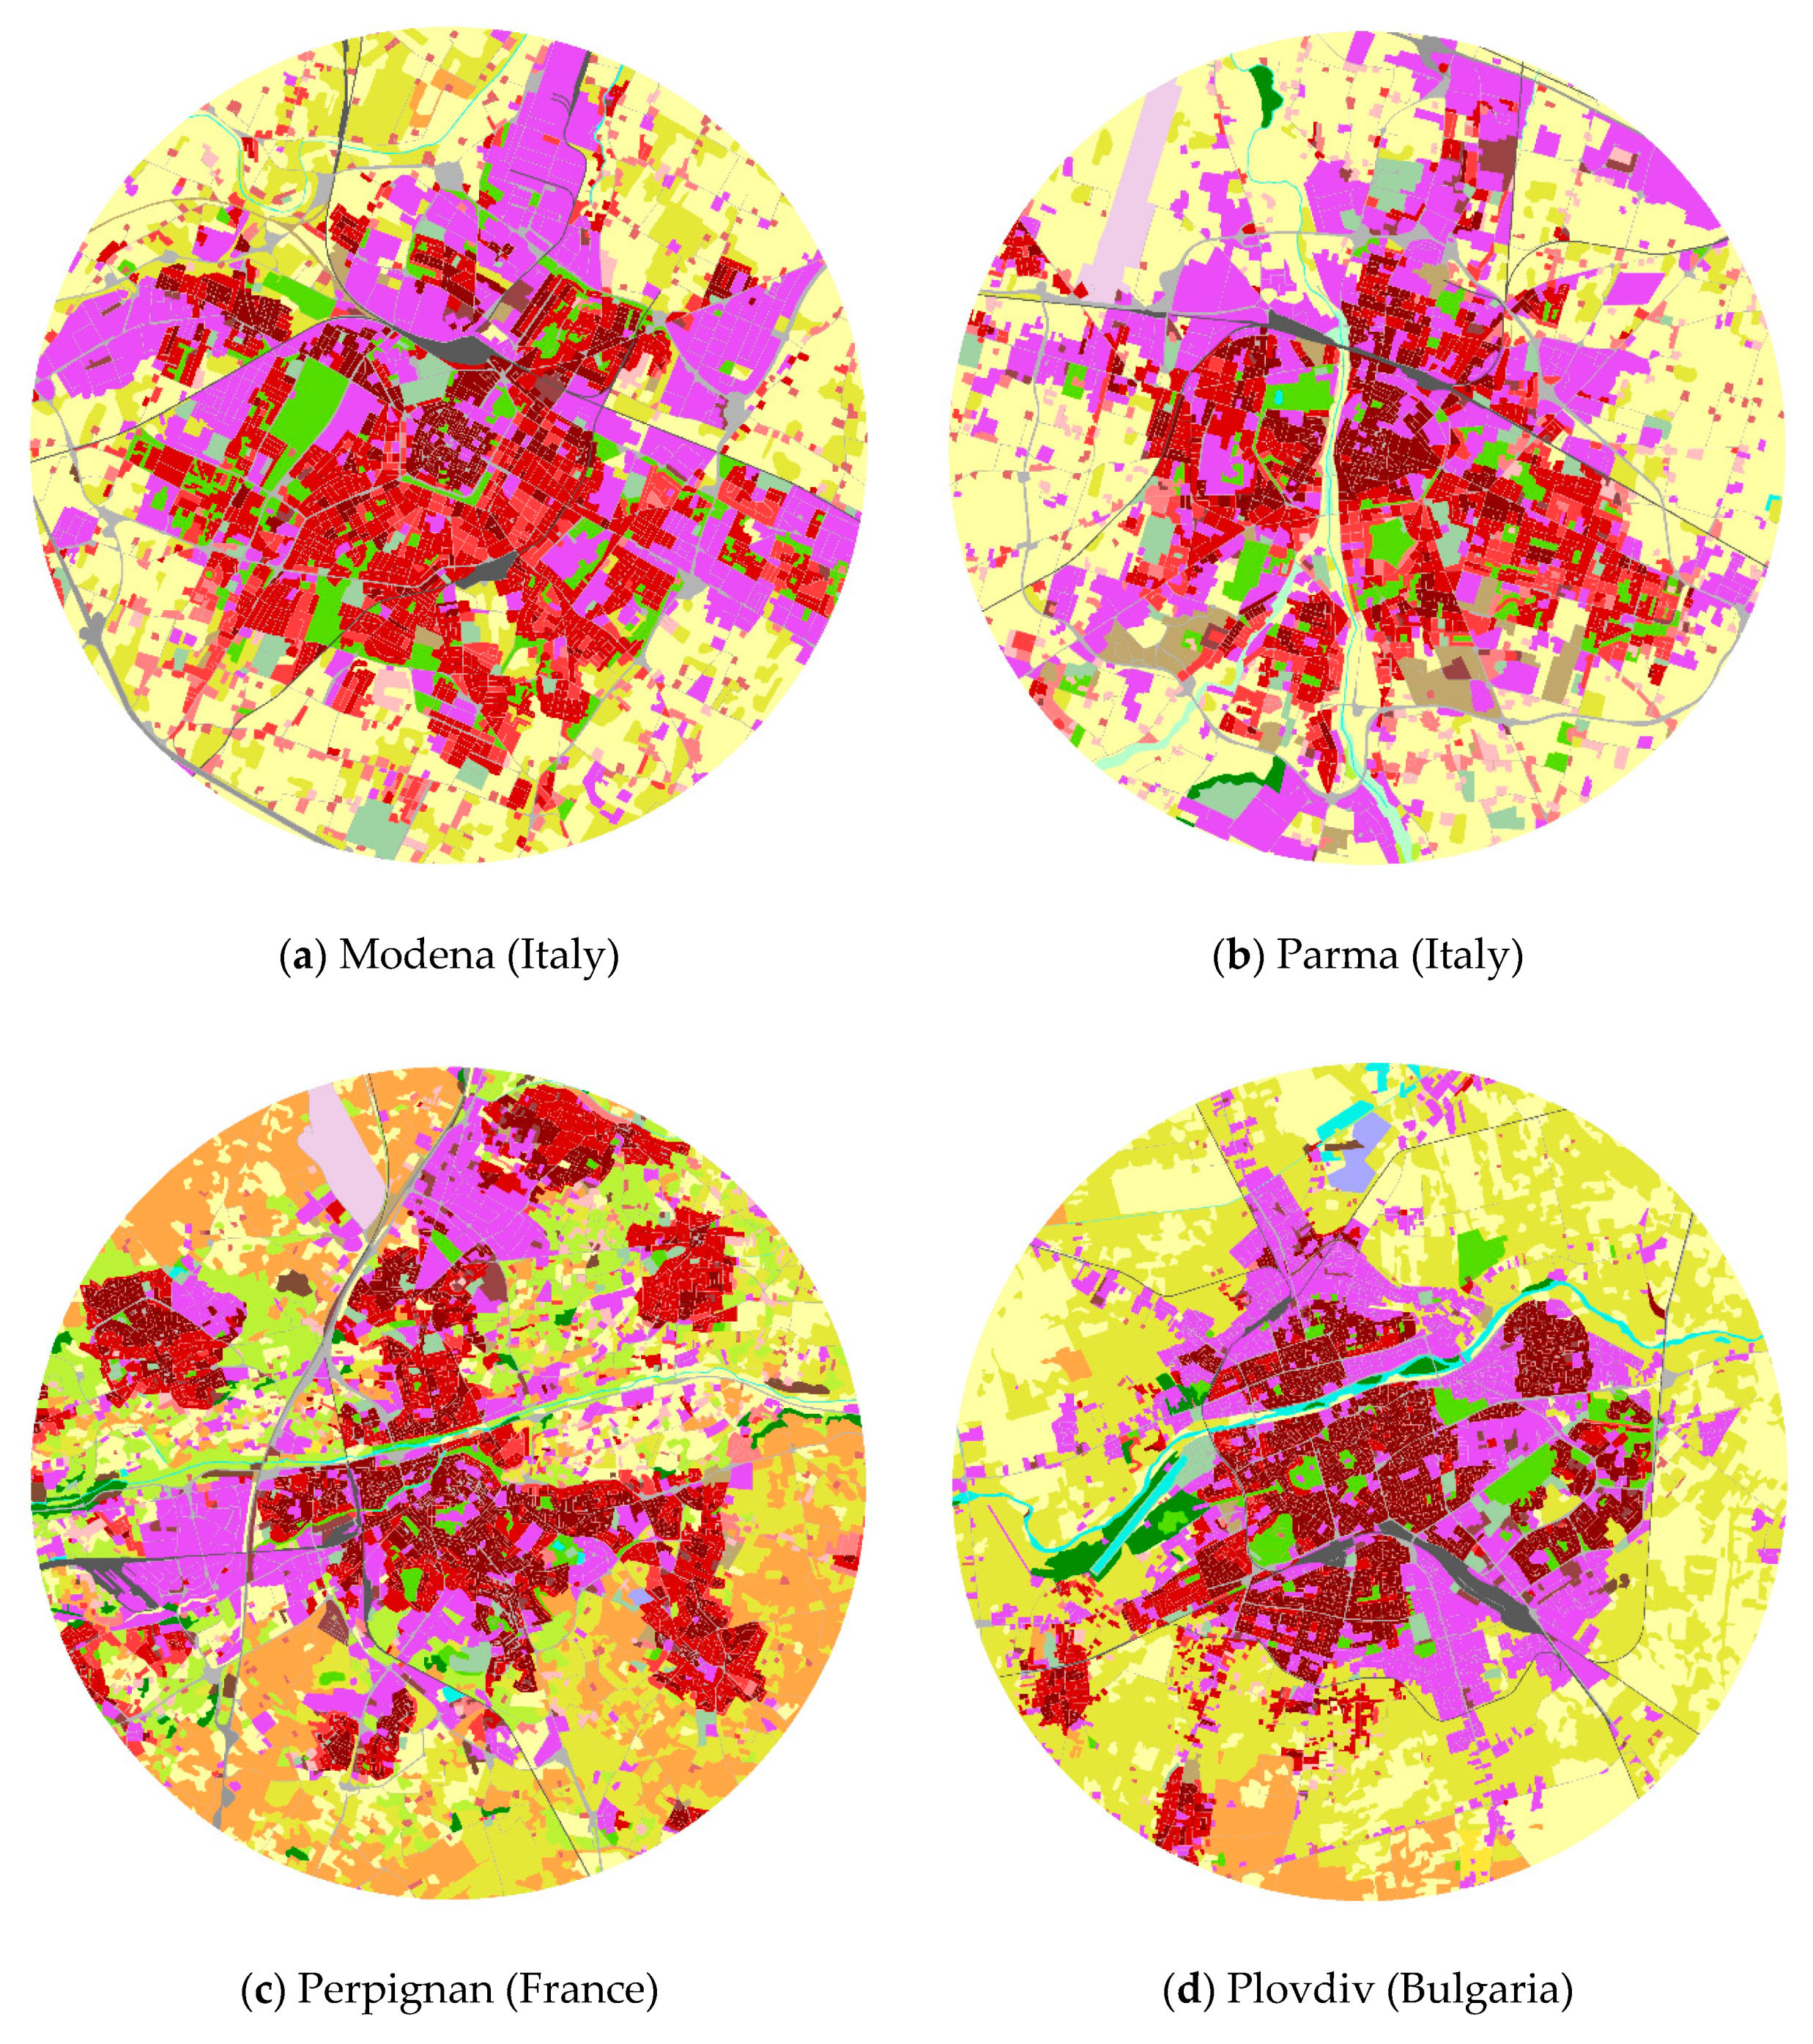
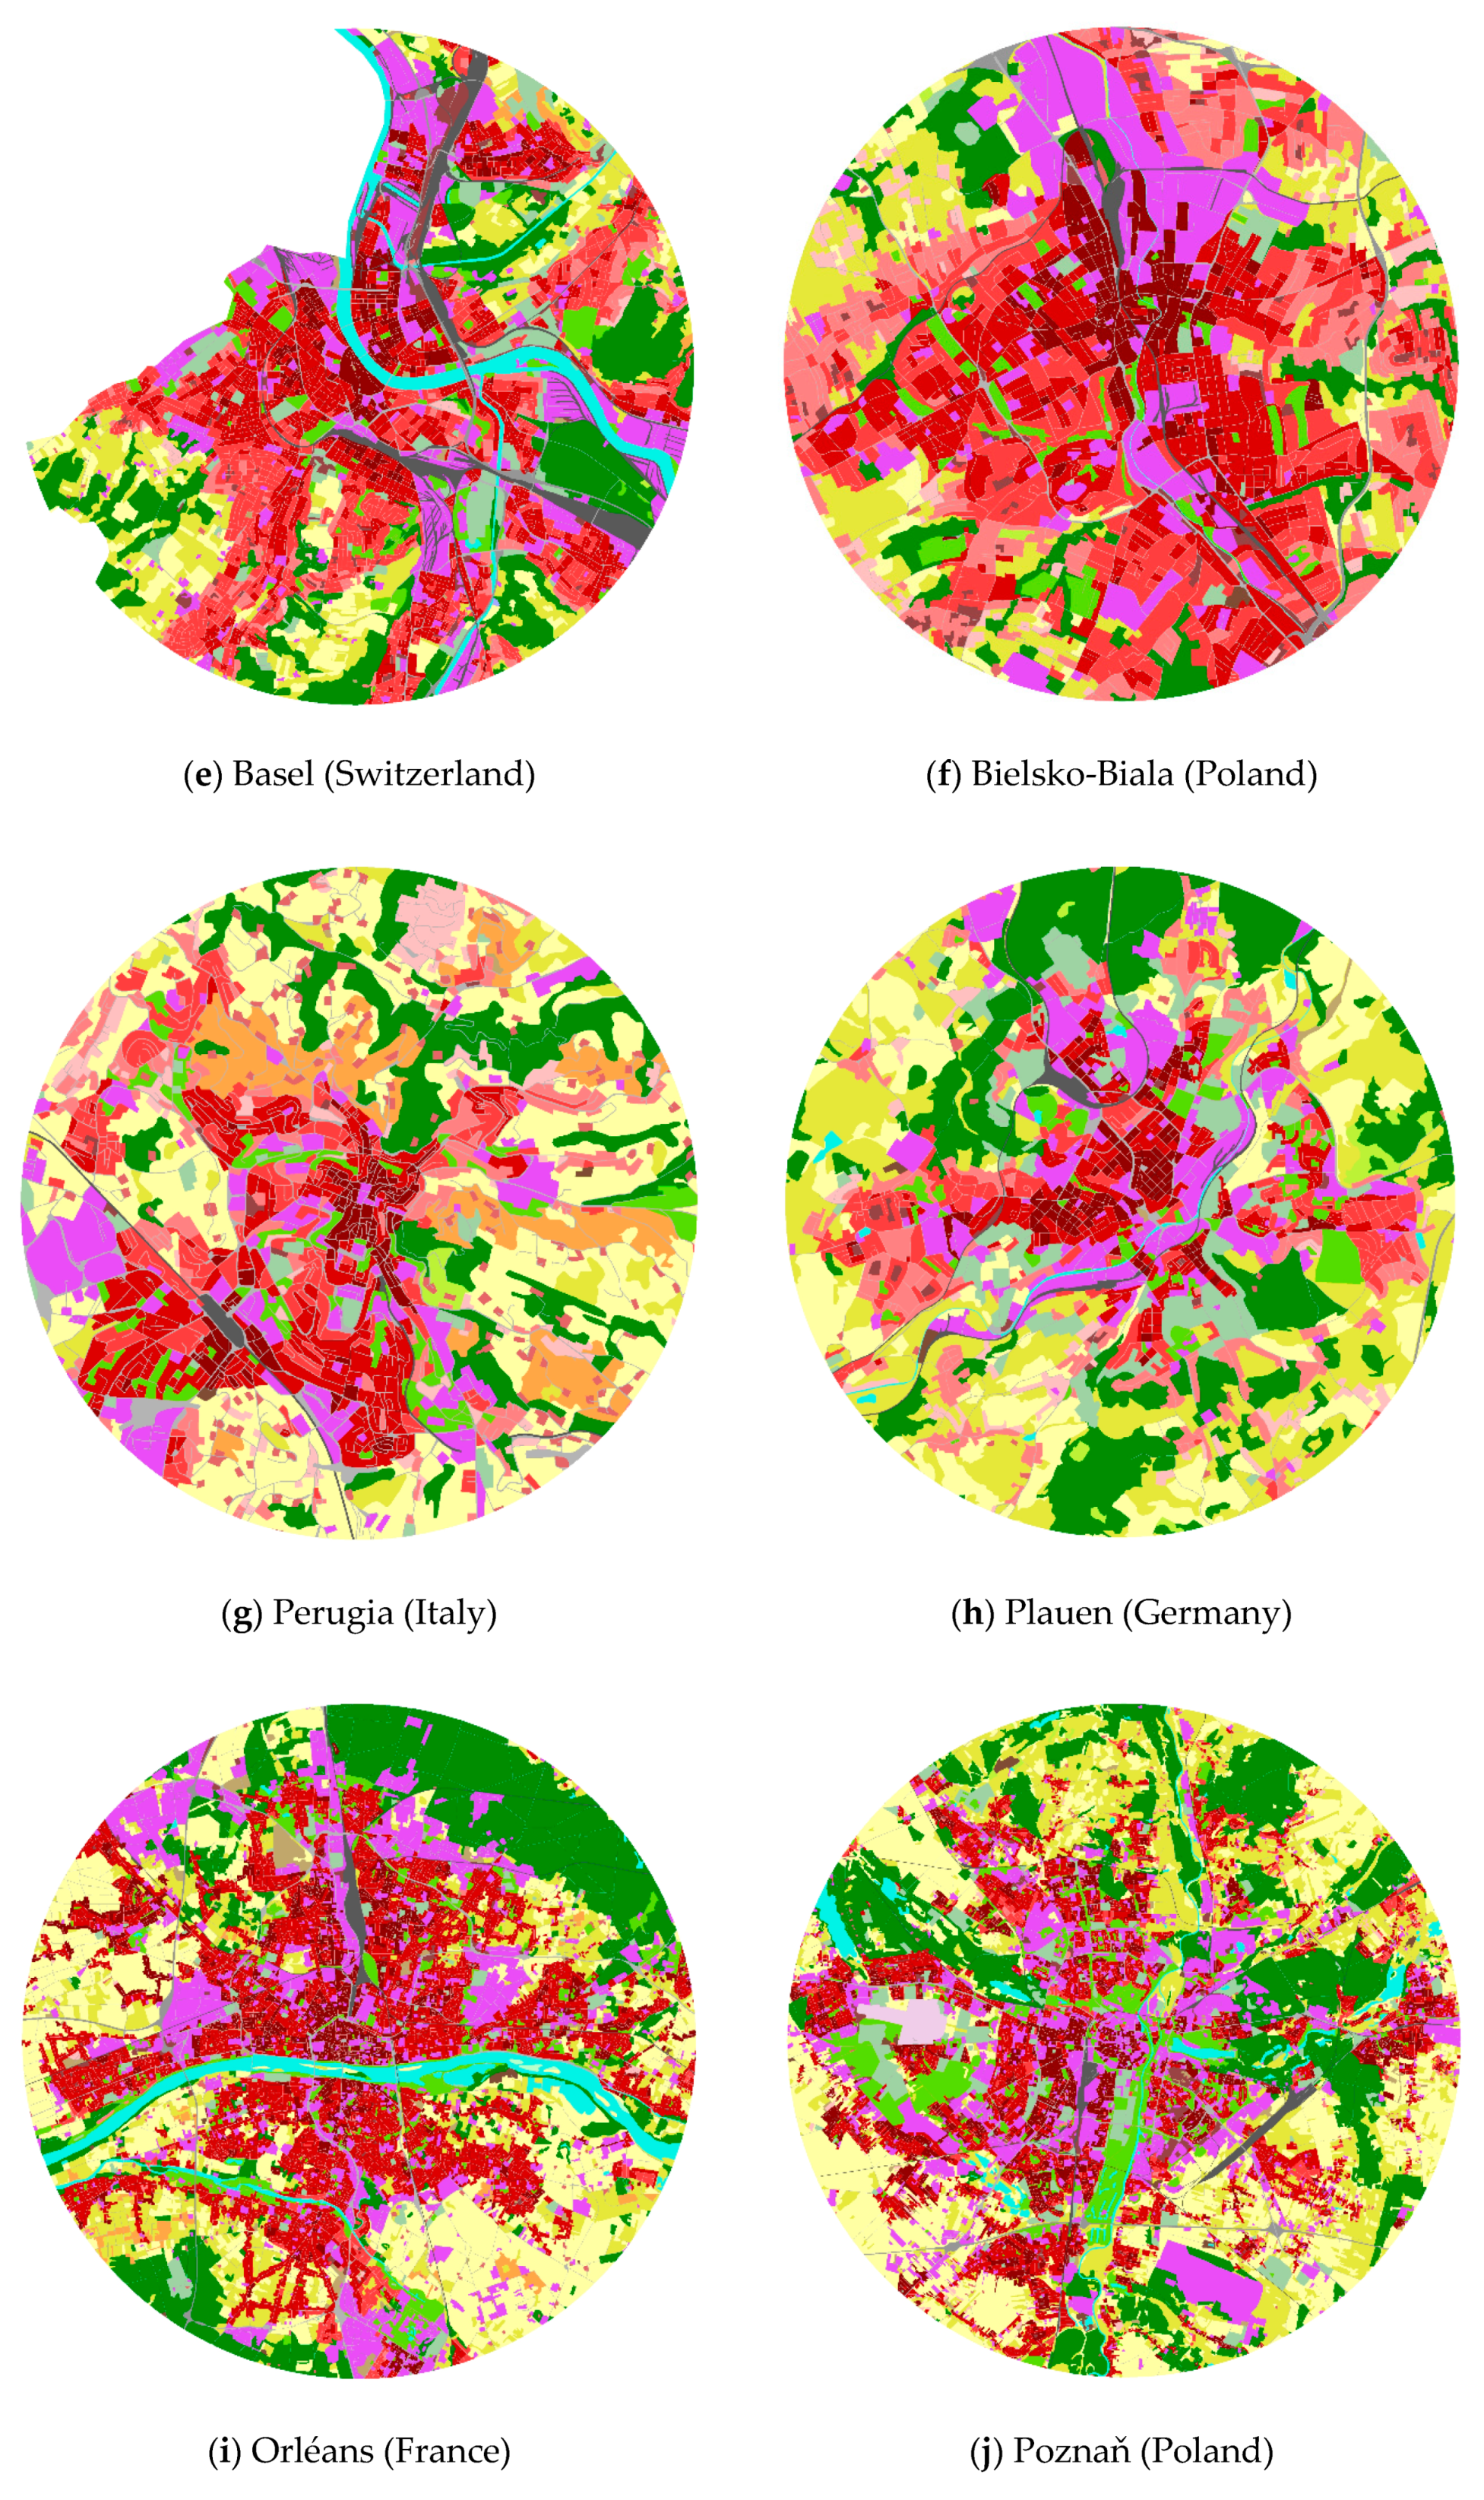
In addition to the aforementioned pairs and triplets, some typical pairs are presented in Appendix A. Firstly the hierarchical clustering was made using cosine distance and Ward’s method. The selection of 12 pairs was taken from the lowest level of the dendrogram. They have the shortest cosine distance from each other. The pairs are across European countries. The similar patterns of pairs are visible. Principally, the nearest neighbor could be found for each city, as presented in the previous paragraphs of the article. The distance between the nearest pair naturally varies and sometimes is larger than the 12 pairs shown in Appendix A.
The findings of similar cities will be beneficial for governmental cooperation between partner cities or twinned towns, as cooperation is frequently established between cities in Europe. Finding new similar couples creates the opportunity to join new ones. The government of the cities share their experiences on how to plan and manage the cities. When the cities are similar from the land use form there is an expectation of similar urban planning tasks related to living, public, commercial, and industry areas. Urban designers can also utilize these findings.
Moreover, the presented research brings an idea to a new branch that is labeled ‘science of cities’ [32]. This science has the aim of understanding and modeling phenomena taking place in cities. Urban morphology, the activity of inhabitants, the residence location choice, urban sprawl and the evolution of urban networks, and location of industry areas are important processes that have been discussed for a long time. The comparison of look-alike cities brings a new point of view to understand the city structure evolution.
4. Discussion
The presented experiment try to find the nearest neighbor cities according to spatial arrangements of urban land use structure. The pre-trained neural network has no preliminary information about cities and classification categories. The neural network also does not need previous information about classification rules. Classification by neural network is titled “unsupervised learning”. It is a big advantage of the neural networks. Other investigations tried to state the metrics or one detailed feature, like streets or building blocks [12,13], and evaluate cities according to these metrics and feature. It is evident, that presented findings of nearest neighbor are predominantly based on the size and shapes of areas, colors, and patterns of land use.
Other metrics like circular sectors by Janousek consider orientation [18]. The circular sector has strict geographical orientation. Subsequently, similar cities are similar by the existence of the same land use in the same orientation. The advantage of using a neural network is that the evaluation does not depend on the direction in which a certain structure is oriented in the city (industrial areas in the south, green areas in the north, etc.). The presented pre-trained neural network does not have this type of limitation. This method takes into account multiple pattern distributions.
Boeing measured the complexity of urban form [14]. In comparison with Boeing’s research, the presented method belongs to two dimensions offered by him: spatial and scaling dimension. The spatial dimension is described by land patterns and grain, particularly in terms of diversity, block size and shapes, the spatial distribution of urban forms, surface textures, and fractal urban forms. From this point, the land use data from Urban Atlas express static information about the city. Other dimensions for complexity measure, like temporal and visual dimensions, consider human behavior (population growth and decline, traffic jams, etc.) and perception of the built environment (sunlight patterns, tree canopy, etc.).
The reliability of findings by neural network and nearest neighbor depends on the quality of the input data. The first point is setting the center of the circular extract in the city in the data preparation phase. It is a user-defined setting. The same criteria were applied to historical centers, historical buildings, etc., for all cites. Therefore, the influence could be minimal. Higher influence on the reliability of the result considers the surroundings of the cities, especially when the shape of the town is prolonged. The future experiments could prepare data in a smaller diameter to cover only the inner inscribed circle.
Data mining software Orange has intuitive interface thanks to the visual form of design of workflow. The workflows are comprehensible. Orange software and the Image Analyst embedder Painters are very simple to use and useful in data processing. In addition to these tools, the investigative steps used in the present study may be employed as a practical lecture for university studies in geoinformatics and urban planning [33]. Orange software is a good choice for specialists in geoinformatics that have base knowledge and skills in data mining. Data preparation by ArcGIS software is routine and could be assumed as the expectable advanced skill of geoinformatics.
5. Conclusions
The use of machine learning in discovering patterns of land use in cities opens up new knowledge. The processing of nearly 800 European cities revealed examples of look-alike cities that could be described according to a typical arrangement of land use as in the presented examples. Cities with mosaic patterns and cities with dominant land use categories (some types of urban fabric) were identified. The arrangement of commercial and industrial areas is also important. Some cities are typified by prevailing curve-shaped areas, while others demonstrate land use according to strict rectangular shapes. Some cities are compact, while others tend to contain more isolated districts and suburbs. The similarity in cities is sometimes determined by the surrounding nature and arrangement of green areas, forests, and arable land. In addition to the nearest neighbor pairs mentioned in the text, some typical pairs are presented in Appendix A. These pairs were taken from the lowest level of dendrogram as a result of hierarchical clustering.
The presented experiment is an example of the democratization of data and software. The data from the Urban Atlas and pre-trained neural network are examples of freely available data and software (data mining Orange software). When the data and software are freely available, the original producers can suppose much wider and various areas of utilization for problem solutions than could natively imagine. Sometimes the domains of utilizations are unexpectable. The democratization of data and software is beneficial. In the case of Urban Atlas data, the primary aim is comparison and investigation of the land use change patterns. The findings of look-alike cities were not originally supposed.
The author will continue with a deeper investigation of the Copernicus data for Europe. The results of the present study show promise for additional research on urban structures. The author plans to validate these results. Identifying similar cities should be done with care, as some pairs were not especially similar. During analysis, the historical parameters, size, and natural conditions of the cities should be removed. Some results from the land use patterns could be used as an orientation for determining the clusters and groups of common characteristics in cities according to these land use patterns. Clustering, the classification of cities, and allocation of typical representative cities for each category need more work in combining other characteristics of cities. The author assumes that some cities will remain outside clusters because of their specific land use arrangement. The new method applied in the present study is only one method for identifying cities which may be similar.
Funding
This research received no external funding.
Acknowledgments
Thanks to Blaž Zupan, leader of the workshop at Symposium GIS Ostrava 2019, the Czech Republic, for the interesting presentation of Orange software. Thanks to students of the Geoinformatics study branch at Palacký University, attending Data Mining course, and for support in data collection.
Conflicts of Interest
The author declares no conflicts of interest.
Appendix A
Figure A1.
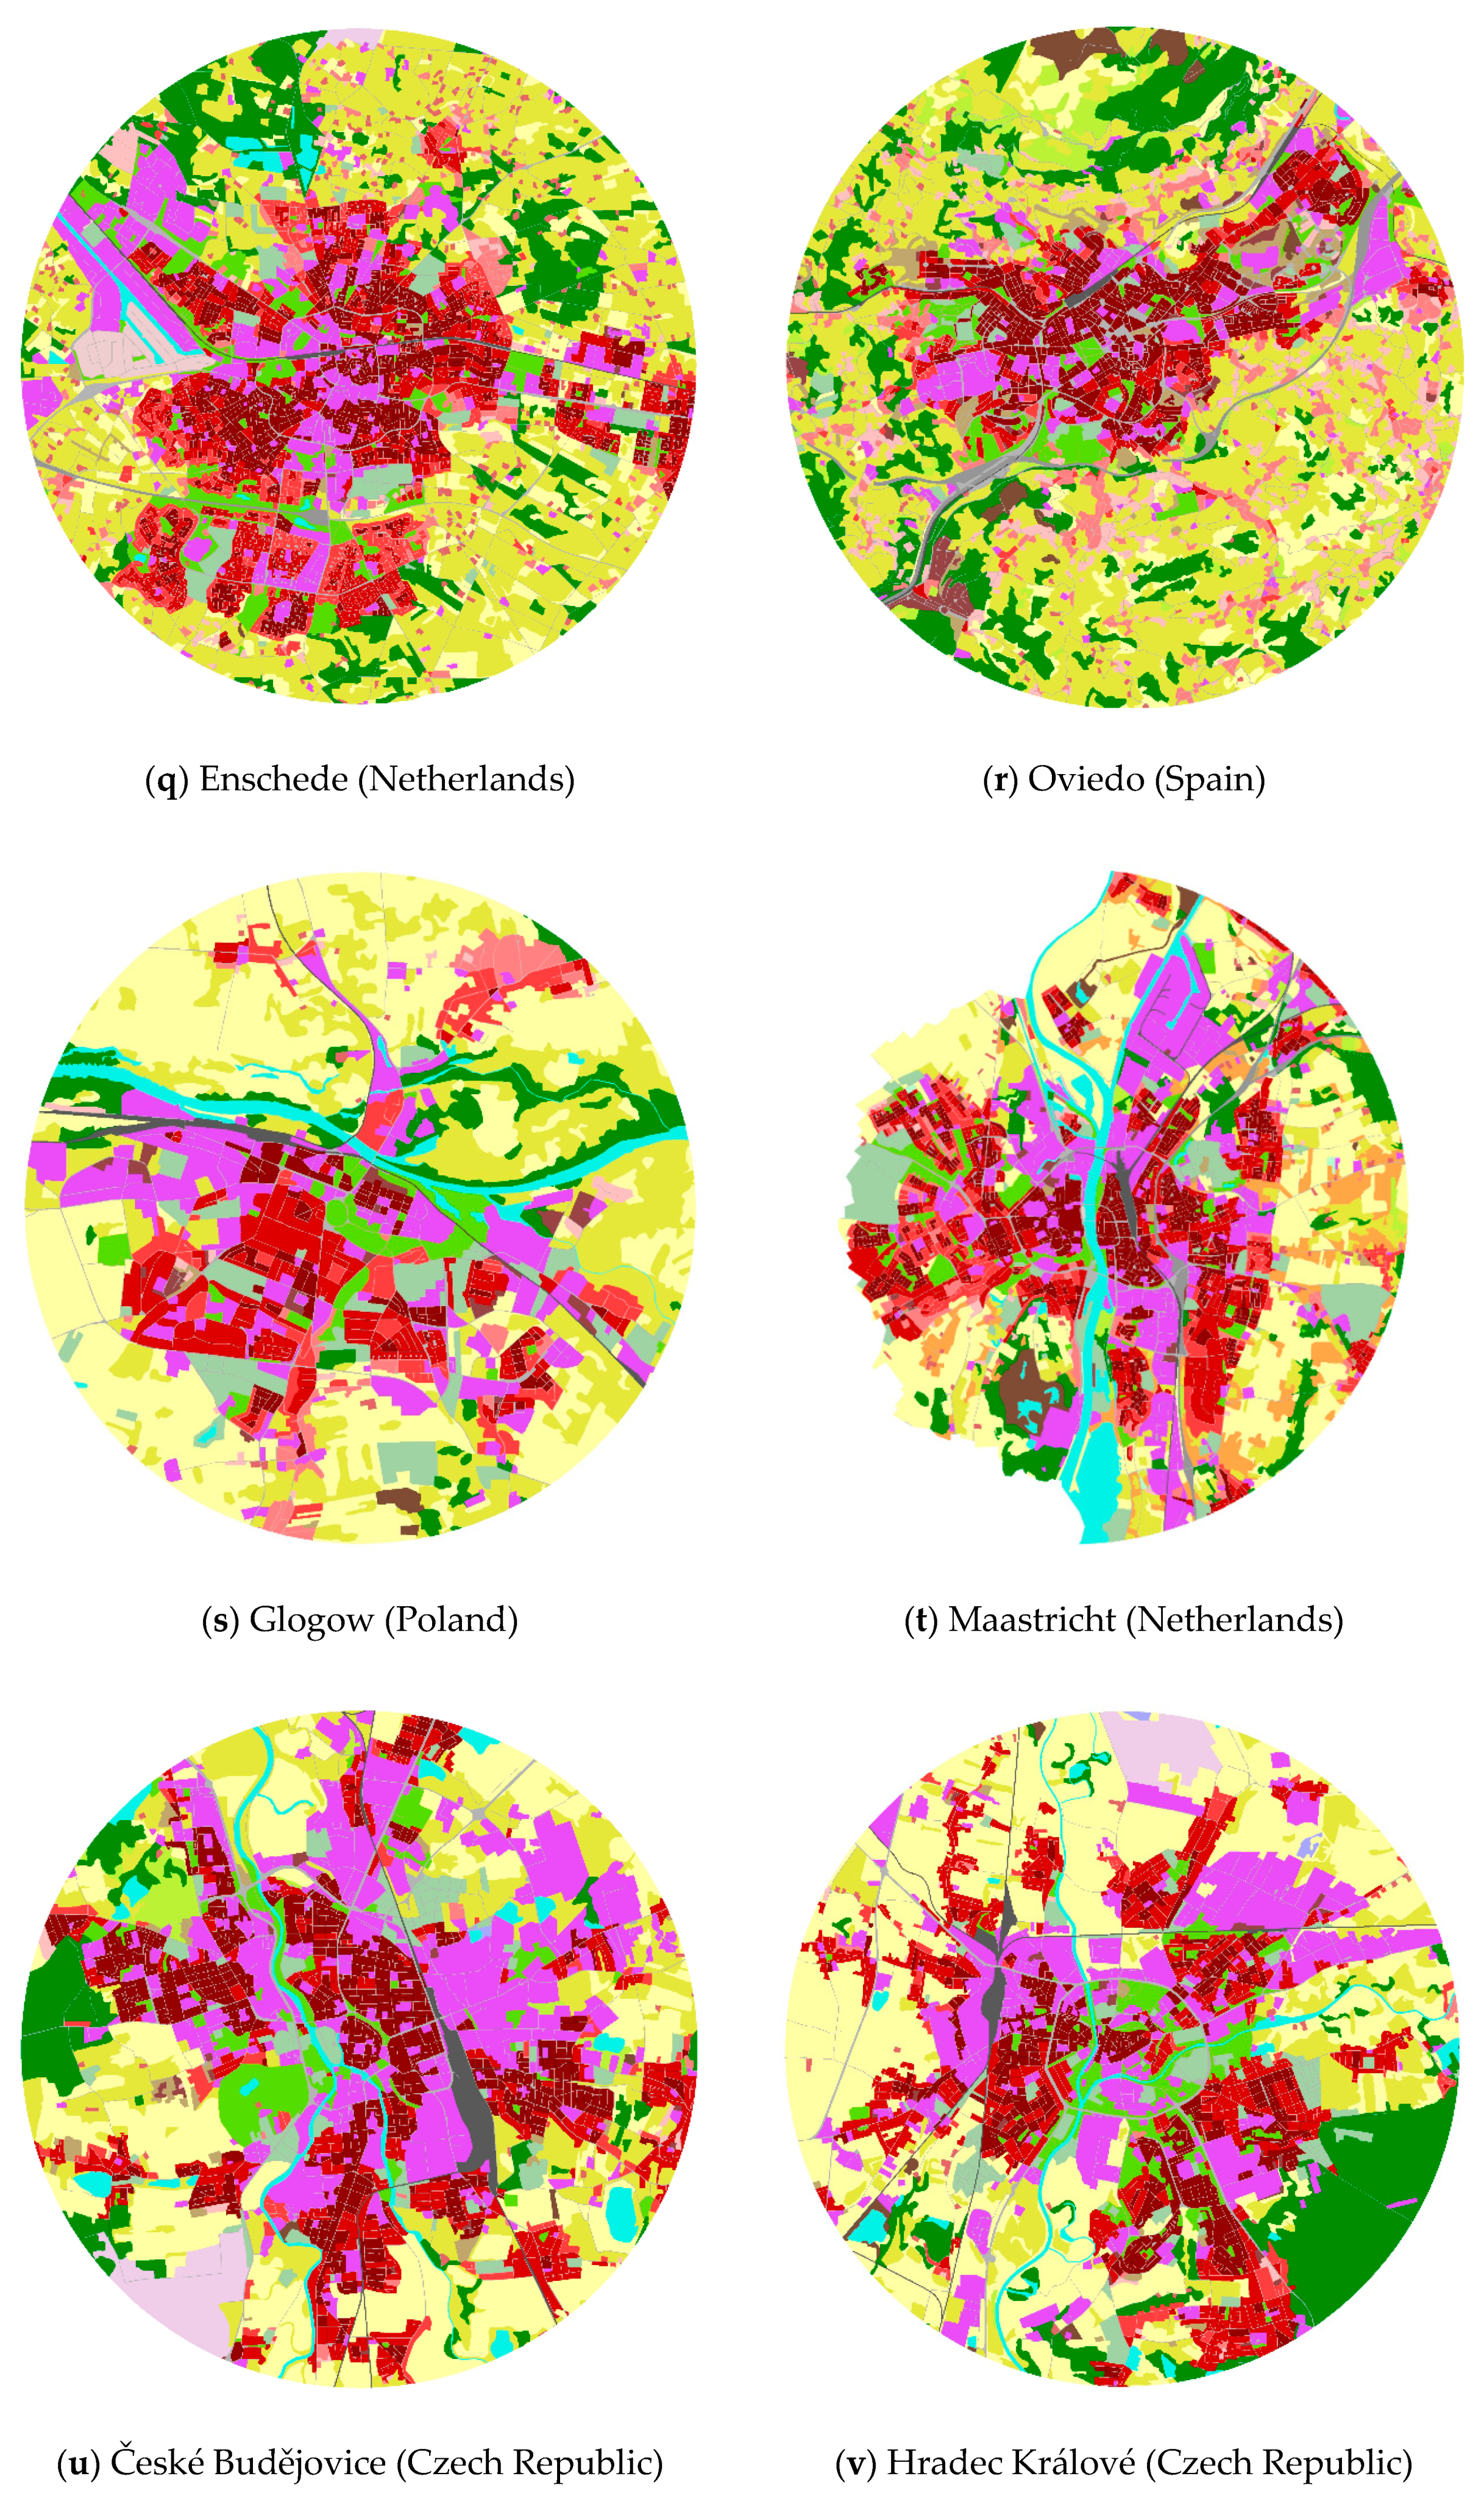
Pairs of similar cities according to land use produced by hierarchical clustering. (a) Modena (Italy); (b) Parma (Italy); (c) Perpignan (France); (d) Plovdiv (Bulgaria); (e) Basel (Switzerland); (f) Bielsko-Biala (Poland); (g) Perugia (Italy); (h) Plauen (Germany); (i) Orléans (France); (j) Poznaň (Poland); (k) Guimares (Portugal); (l) Osnabrück (Germany); (m) Augsburg (Germany); (n) Aviles (Spain); (o) Ljubljana (Slovenia); (p) Lübeck (Germany); (q) Enschede (Netherlands); (r) Oviedo (Spain); (s) Glogow (Poland); (t) Maastricht (Netherlands); (u) České Budějovice (Czech Republic); (v) Hradec Králové (Czech Republic); (w) Crawley (UK); (x) Örebro (Sweden).
Figure A1.
Pairs of similar cities according to land use produced by hierarchical clustering. (a) Modena (Italy); (b) Parma (Italy); (c) Perpignan (France); (d) Plovdiv (Bulgaria); (e) Basel (Switzerland); (f) Bielsko-Biala (Poland); (g) Perugia (Italy); (h) Plauen (Germany); (i) Orléans (France); (j) Poznaň (Poland); (k) Guimares (Portugal); (l) Osnabrück (Germany); (m) Augsburg (Germany); (n) Aviles (Spain); (o) Ljubljana (Slovenia); (p) Lübeck (Germany); (q) Enschede (Netherlands); (r) Oviedo (Spain); (s) Glogow (Poland); (t) Maastricht (Netherlands); (u) České Budějovice (Czech Republic); (v) Hradec Králové (Czech Republic); (w) Crawley (UK); (x) Örebro (Sweden).


References
- Hu, Y.; Li, W.; Wright, D.; Aydin, O.; Wilson, D.; Maher, O.; Raad, M. Artificial Intelligence Approaches. In The Geographic Information Science & Technology Body of Knowledge; Wilson, J.P., Ed.; UCGIS: Ithaca, NY, USA, 2019. [Google Scholar]
- Lunga, D. Artificial Intelligence Tools and Platforms for GIS. In The Geographic Information Science & Technology Body of Knowledge; Wilson, J.P., Ed.; UCGIS: Ithaca, NY, USA, 2019. [Google Scholar]
- Esri. Esri R&D Center. Available online: https://newdelhi.esri.com (accessed on 11 November 2019).
- Singh, R. Integrating Deep Learning with GIS. Available online: https://medium.com/geoai/integrating-deep-learning-with-gis-70e7c5aa9dfe (accessed on 10 September 2019).
- Microsoft. Take part in AI for Earth. Available online: https://www.microsoft.com/en-us/ai/ai-for-earth (accessed on 11 December 2019).
- Eurostat. Statistics Explained. Glossary: Functional Urban Area. Available online: https://ec.europa.eu/eurostat/statistics-explained/index.php/Glossary:Functional_urban_area (accessed on 5 May 2020).
- Novovic, O.; Brdar, S.; Mesaros, M.; Crnojevic, V.; Papadopoulos, A.N. Uncovering the Relationship between Human Connectivity Dynamics and Land Use. Isprs Int. J. Geo-Inf. 2020, 9, 140. [Google Scholar] [CrossRef] [Green Version]
- Rusche, K.; Reimer, M.; Stichmann, R. Mapping and Assessing Green Infrastructure Connectivity in European City Regions. Sustainability 2019, 11, 1819. [Google Scholar] [CrossRef] [Green Version]
- Zambon, I.; Serra, P.; Pili, S.; Bernardini, V.; Ferrara, C.; Salvati, L. A New Approach to Land-Use Structure: Patch Perimeter Metrics as a Spatial Analysis Tool. Sustainability 2018, 10, 2147. [Google Scholar] [CrossRef] [Green Version]
- Southworth, M.; Ben-Joseph, E. Streets and the Shaping of Towns and Cities; Island Press: Washington, DC, USA, 2013. [Google Scholar]
- Louf, R.; Barthelemy, M. A typology of street patterns. Interface 2014, 11. [Google Scholar] [CrossRef] [PubMed] [Green Version]
- Boeing, G. A multi-scale analysis of 27,000 urban street networks: Every US city, town, urbanized area, and Zillow neighborhood. Environ. Plan. B Urban Anal. City Sci. 2018, 47, 590–608. [Google Scholar] [CrossRef] [Green Version]
- Boeing, G. Urban spatial order: Street network orientation, configuration, and entropy. Appl. Netw. Sci. 2019, 4, 67. [Google Scholar] [CrossRef] [Green Version]
- Boeing, G. Measuring the complexity of urban form and design. Urban Des. Int. 2018, 23, 281–292. [Google Scholar] [CrossRef] [Green Version]
- Courtat, T.; Gloaguen, C.; Douady, S. Mathematics and morphogenesis of cities: A geometrical approach. Phys. Rev. E 2011, 83. [Google Scholar] [CrossRef] [PubMed] [Green Version]
- Sandu, A. A comparative study of the urban morphology in Europe using GMES Urban Atlas: The post-socialist city vs. the capitalist city (Romania vs. Franc). Informatics, Geoinformatics and Remote Sensing Conference Proceedings, Vol III. In Proceedings of the 16th International Multidisciplinary Scientific GeoConference SGEM, At Albena, Bulgaria, 28 June–6 July 2016. [Google Scholar]
- Koperski, K.; Han, J. Discovery of spatial association rules in geographic information databases. In Proceedings of the 4th International Symposium on Large Spatial Databases (SSD 95), Portland, ME, USA, 6–9 August 1995. [Google Scholar]
- Janousek, M. Comparison of Urban Area by Circular Sectors. Master’s Thesis, Palacky University, Olomouc, Czech, 2019. [Google Scholar]
- Copernicus Programme. Urban Atlas. Available online: https://land.copernicus.eu/local/urban-atlas (accessed on 1 October 2019).
- Biolab. Orange. Available online: https://orange.biolab.si (accessed on 4 May 2019).
- Biolab. Orange3 Image Analytics Documentation. Available online: https://buildmedia.readthedocs.org/media/pdf/orange3-imageanalytics/latest/orange3-imageanalytics.pdf (accessed on 19 May 2019).
- Kaggle. Painter by Numbers Competition, 1st Place Winner’s Interview: Nejc Ilenič. Available online: http://blog.kaggle.com/2016/11/17/painter-by-numbers-competition-1st-place-winners-interview-nejc-ilenic/ (accessed on 1 July 2010).
- Biolab. Orange Data Mining, Image Analytics: Finding the Lost Monet. Available online: https://www.youtube.com/watch?v=6srGs5w9x8w (accessed on 5 January 2020).
- Zupan, B. Look-Alike Images. Available online: https://orange.biolab.si/blog/2020/2020-01-08-neighbors-images/ (accessed on 27 January 2020).
- Biolab. Getting Started with Orange 14: Image Analytics—Clustering. Available online: https://www.youtube.com/watch?v=Iu8g2Twjn9U (accessed on 12 October 2019).
- Dobesova, Z. The Similarity of European Cities Based on Image Analysis. In Intelligent Systems Applications in Software Engineering; Silhavy, R., Silhavy, P., Prokopova, Z., Eds.; Springer International Publishing: Cham, Switzerland, 2019; pp. 341–348. [Google Scholar] [CrossRef]
- Biolab. Orange Visual Programming Documentation, Release 3. Available online: https://buildmedia.readthedocs.org/media/pdf/orange-visual-programming/latest/orange-visual-programming.pdf (accessed on 24 January 2020).
- Copernicus Programme. Copernicus Land Monitoring Service. Available online: https://land.copernicus.eu/ (accessed on 5 May 2019).
- European Commission. Urban Atlas 2012. Download. FUA Delivery Report. Available online: https://land.copernicus.eu/local/urban-atlas/urban-atlas-2012?tab=download (accessed on 8 February 2020).
- European Environment Agency. European Environment Agency: Updated CLC Illustrated Nomenclature Guidelines. Available online: https://land.copernicus.eu/user-corner/technical-library/corine-land-cover-nomenclature-guidelines/docs/pdf/CLC2018_Nomenclature_illustrated_guide_20170930.pdf (accessed on 3 February 2019).
- Esri. ArcMap for Desktop. Available online: http://desktop.arcgis.com/en/arcmap/ (accessed on 2 March 2019).
- Batty, M. The New Science of Cities; MIT Press: Cambridge, UK, 2013. [Google Scholar]
- Dobesova, Z. Teaching database systems using a practical example. Earth Sci. Inform. 2016, 9, 215–224. [Google Scholar] [CrossRef]
Figure 1.
Workflow in Orange with widgets from the Image Analytics add-on.

Figure 2.
Table of enhanced output data with image descriptors (attributes n0, n1, n2 …) for each source image processed using the Image Analytics widget (only partial extract of descriptors).
Figure 2.
Table of enhanced output data with image descriptors (attributes n0, n1, n2 …) for each source image processed using the Image Analytics widget (only partial extract of descriptors).

Figure 3.
Example data: (a) categories of land use in Urban Atlas 2012; (b) circular extract of the city of Salzburg, source: [29], final validation 29 June 2018; circular extract – author’s work.
Figure 3.
Example data: (a) categories of land use in Urban Atlas 2012; (b) circular extract of the city of Salzburg, source: [29], final validation 29 June 2018; circular extract – author’s work.
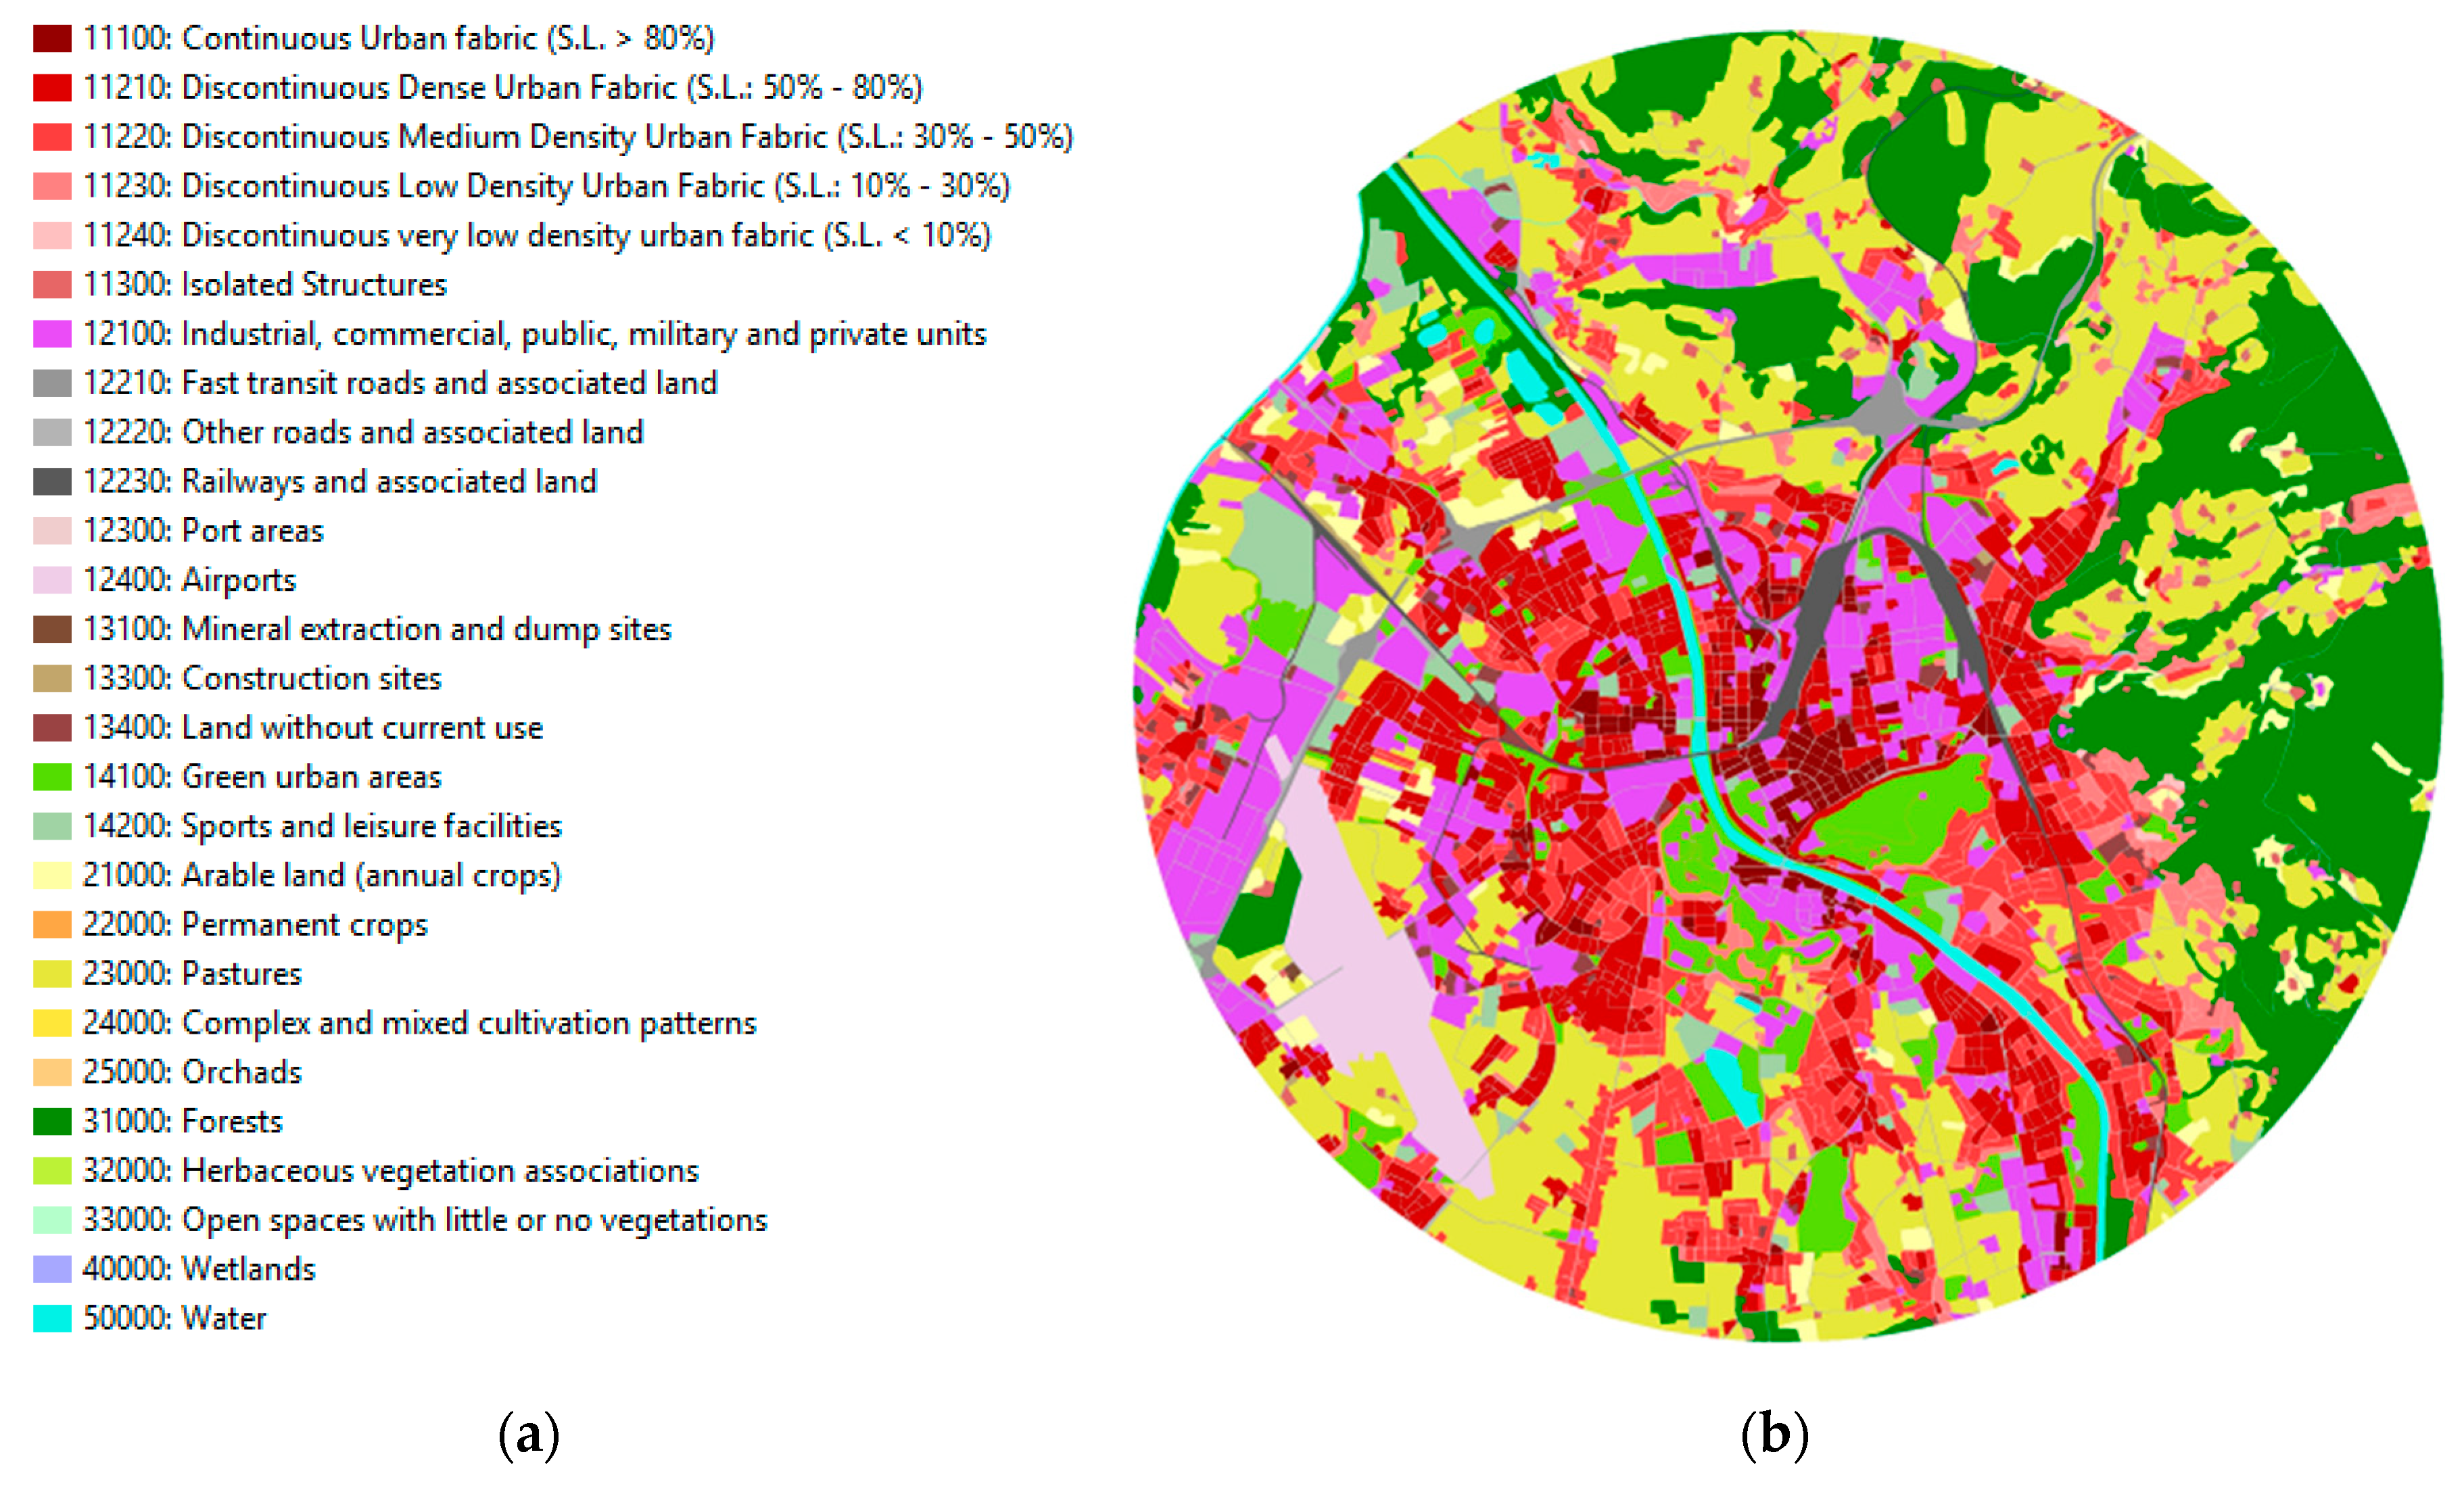
Figure 4.
Workflow with the Image Embedding and Neighbors widgets in Orange.
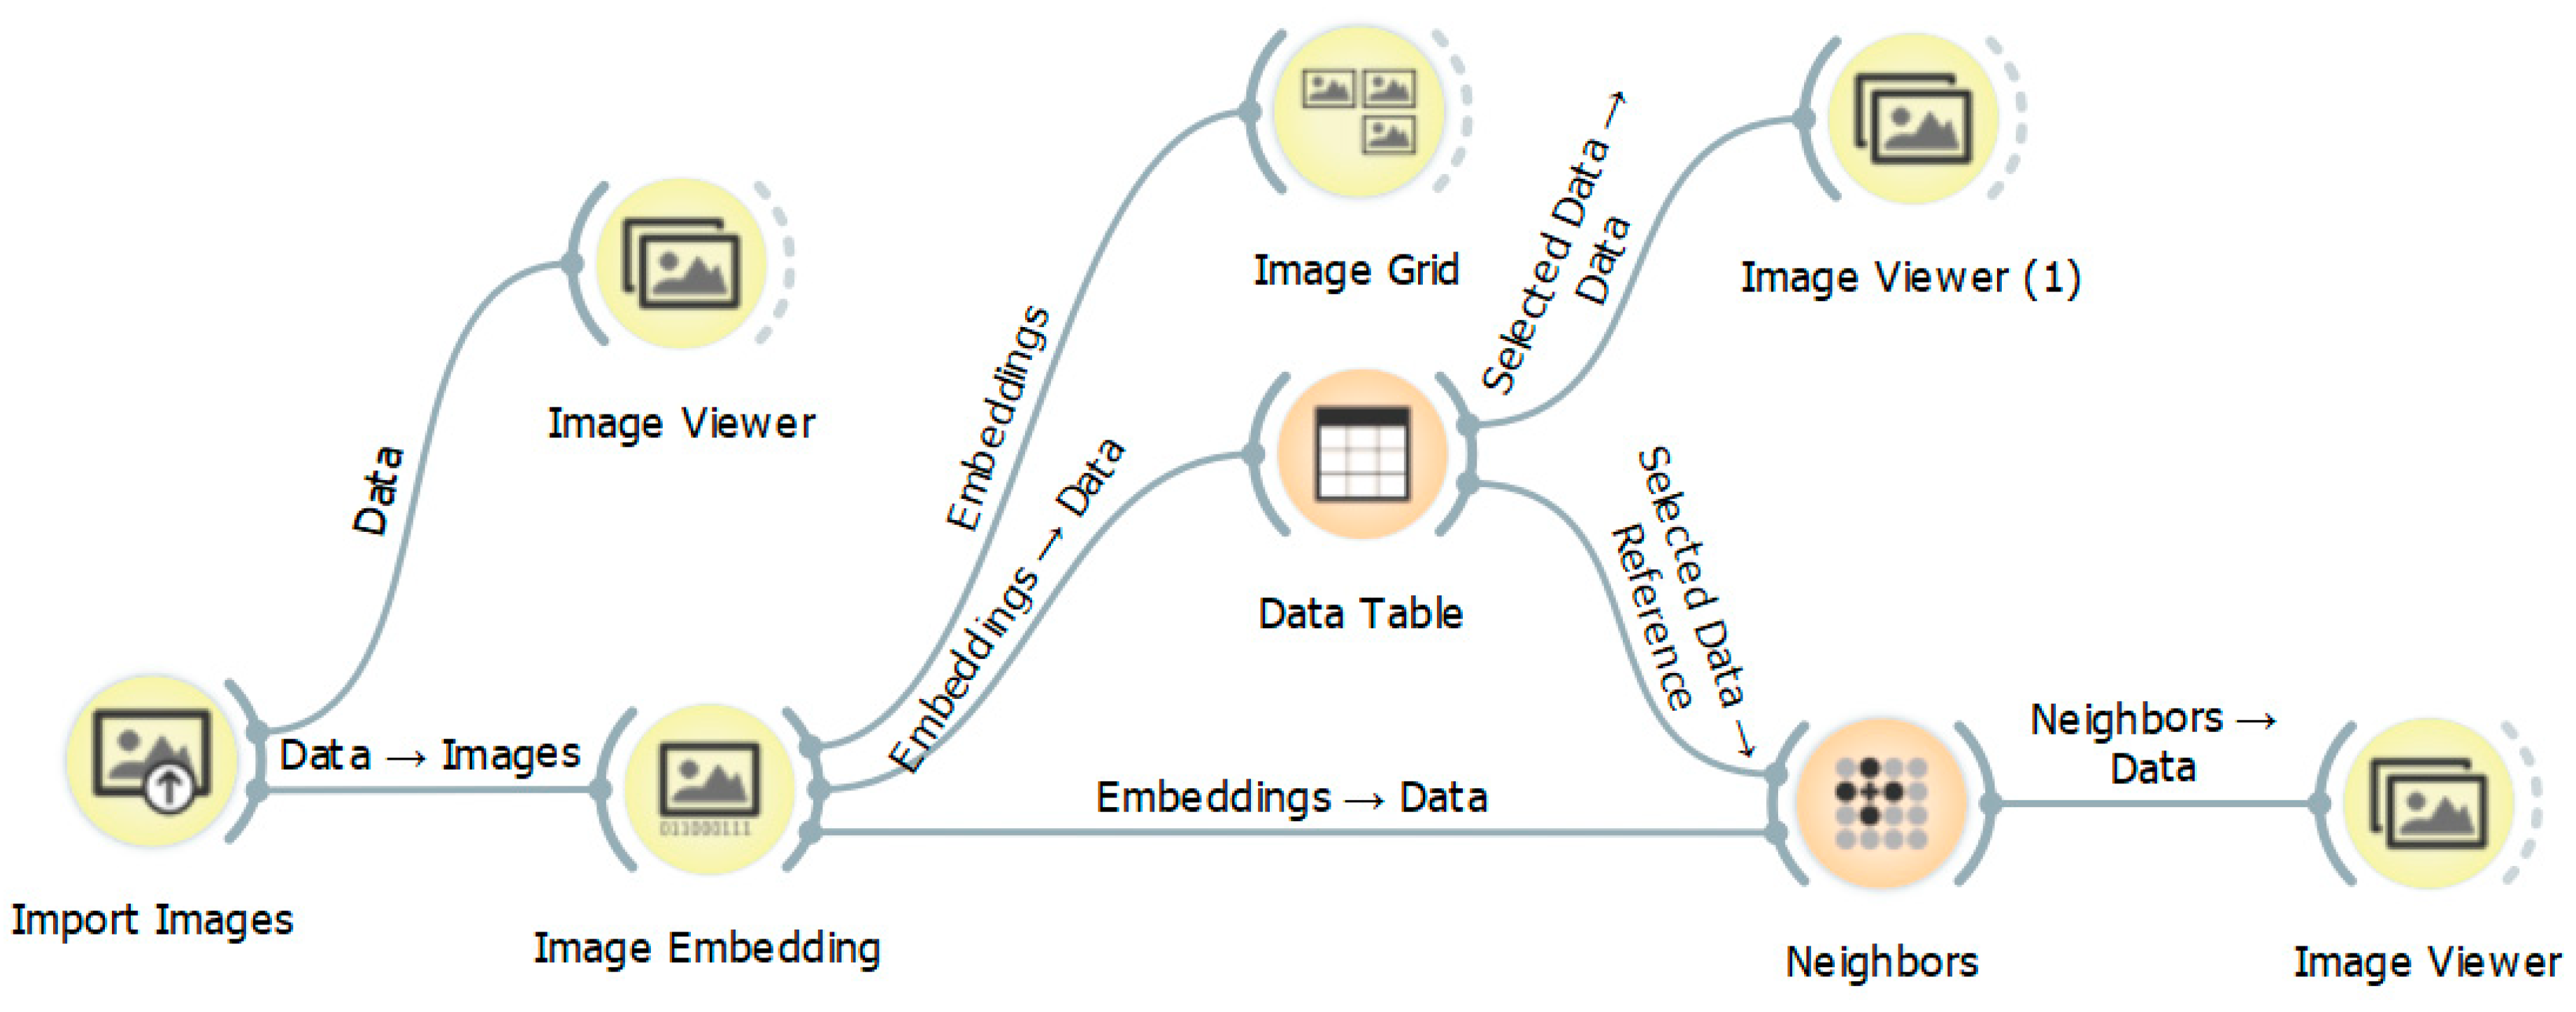
Figure 5.
Two pairs with similar maps: (a) neighbor maps with water bodies; (b) neighbor maps with first and second class roads (extracts are author’s work from portal: https://mapy.cz, accessed 10 September 2019).
Figure 5.
Two pairs with similar maps: (a) neighbor maps with water bodies; (b) neighbor maps with first and second class roads (extracts are author’s work from portal: https://mapy.cz, accessed 10 September 2019).
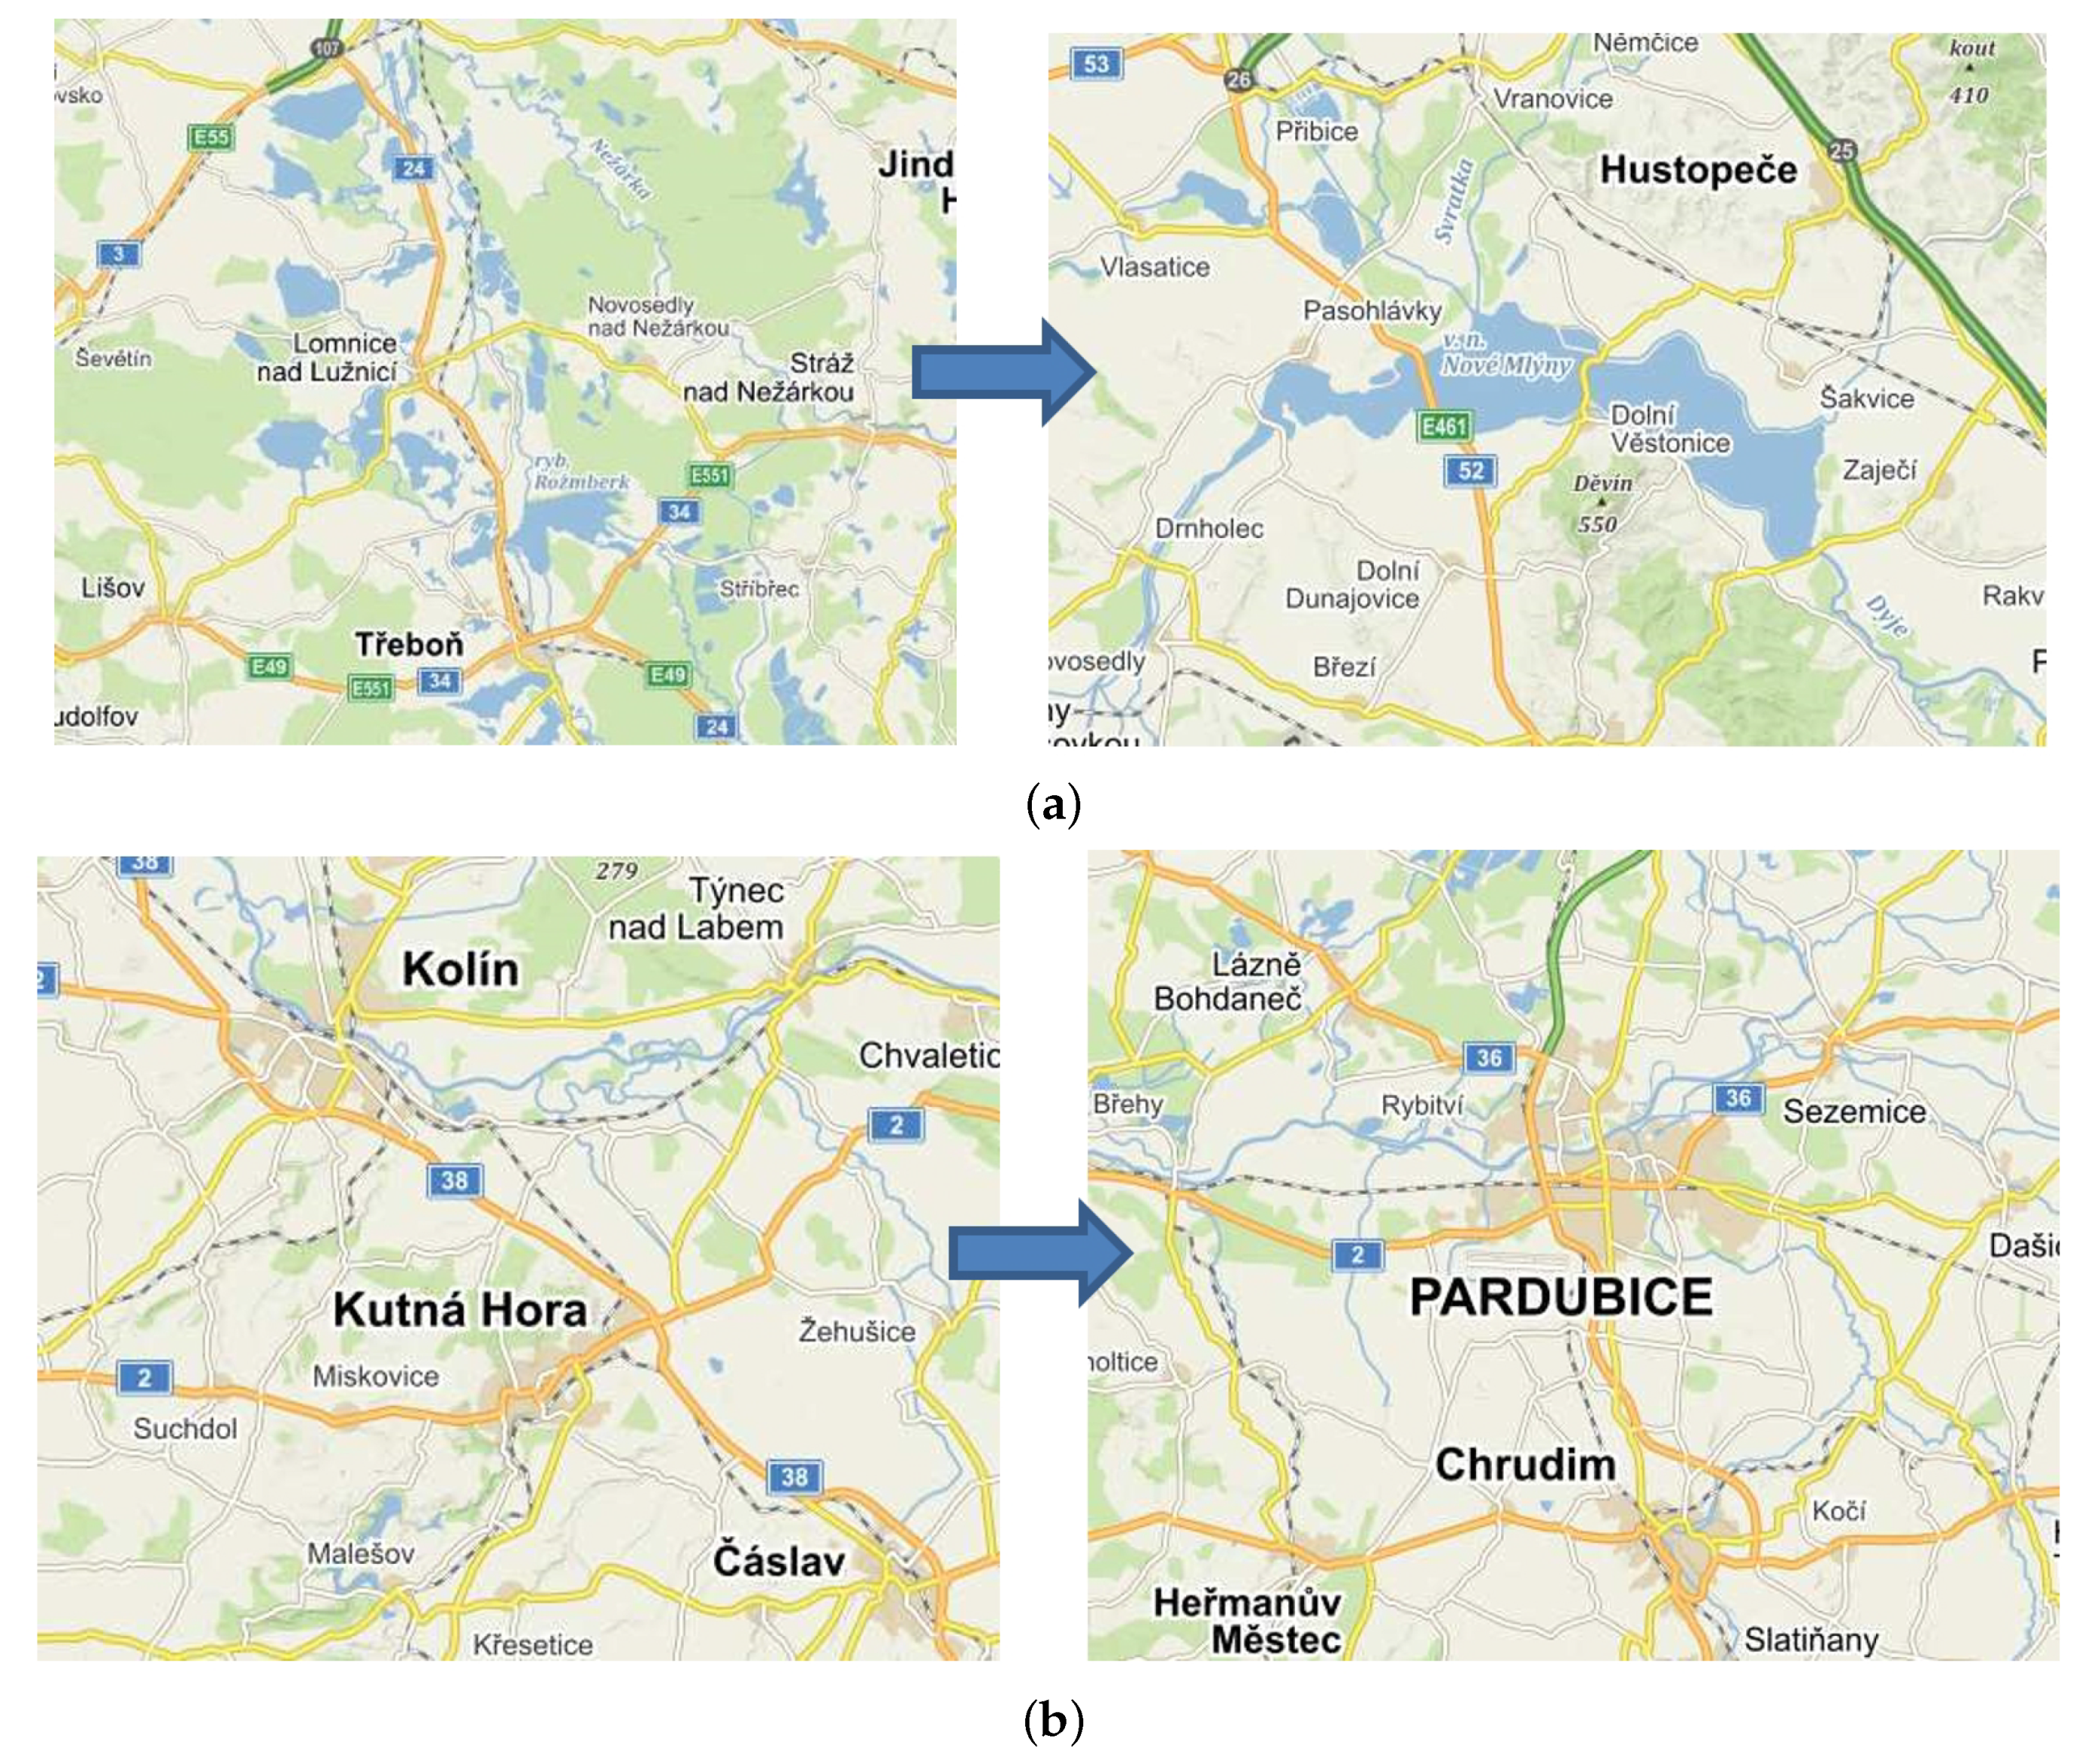
Figure 6.
Image grid in Orange with the thumbnail of the tested map, with four evident clusters arranged according to base maps, historical, aerial, and black and white (author’s work).
Figure 6.
Image grid in Orange with the thumbnail of the tested map, with four evident clusters arranged according to base maps, historical, aerial, and black and white (author’s work).

Figure 7.
Map category prediction: (a) workflow for predicting map category using the Logistic Regression and Prediction widgets; (b) output table of predictions with probabilities for four maps.
Figure 7.
Map category prediction: (a) workflow for predicting map category using the Logistic Regression and Prediction widgets; (b) output table of predictions with probabilities for four maps.

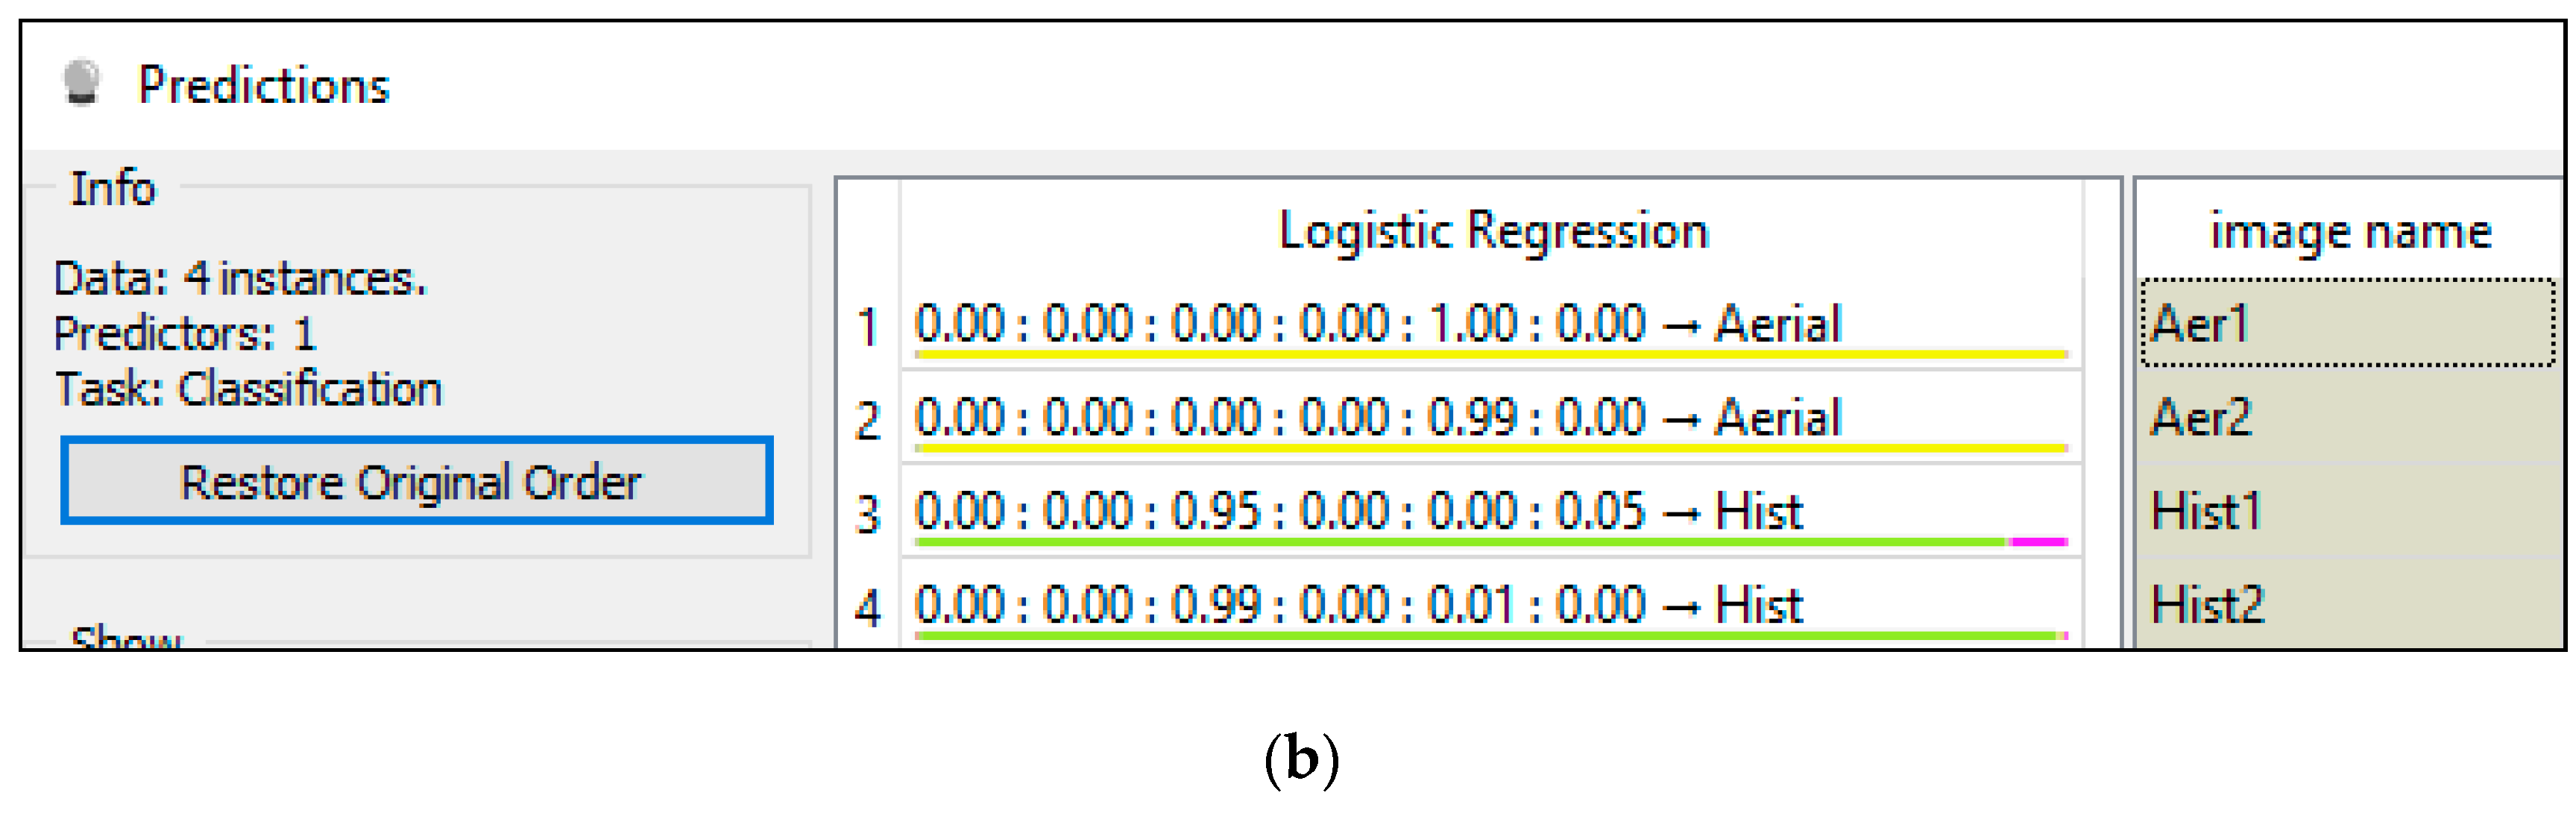
Figure 8.
Interesting look-alike city pairs. (Source: [29], final validation Zalaegerszeg 29 June 2018, Žilina 16 December 2015, Novi Sad 22 May 2018, Tarbes 29 January 2016; circular extracts – author’s work).
Figure 8.
Interesting look-alike city pairs. (Source: [29], final validation Zalaegerszeg 29 June 2018, Žilina 16 December 2015, Novi Sad 22 May 2018, Tarbes 29 January 2016; circular extracts – author’s work).
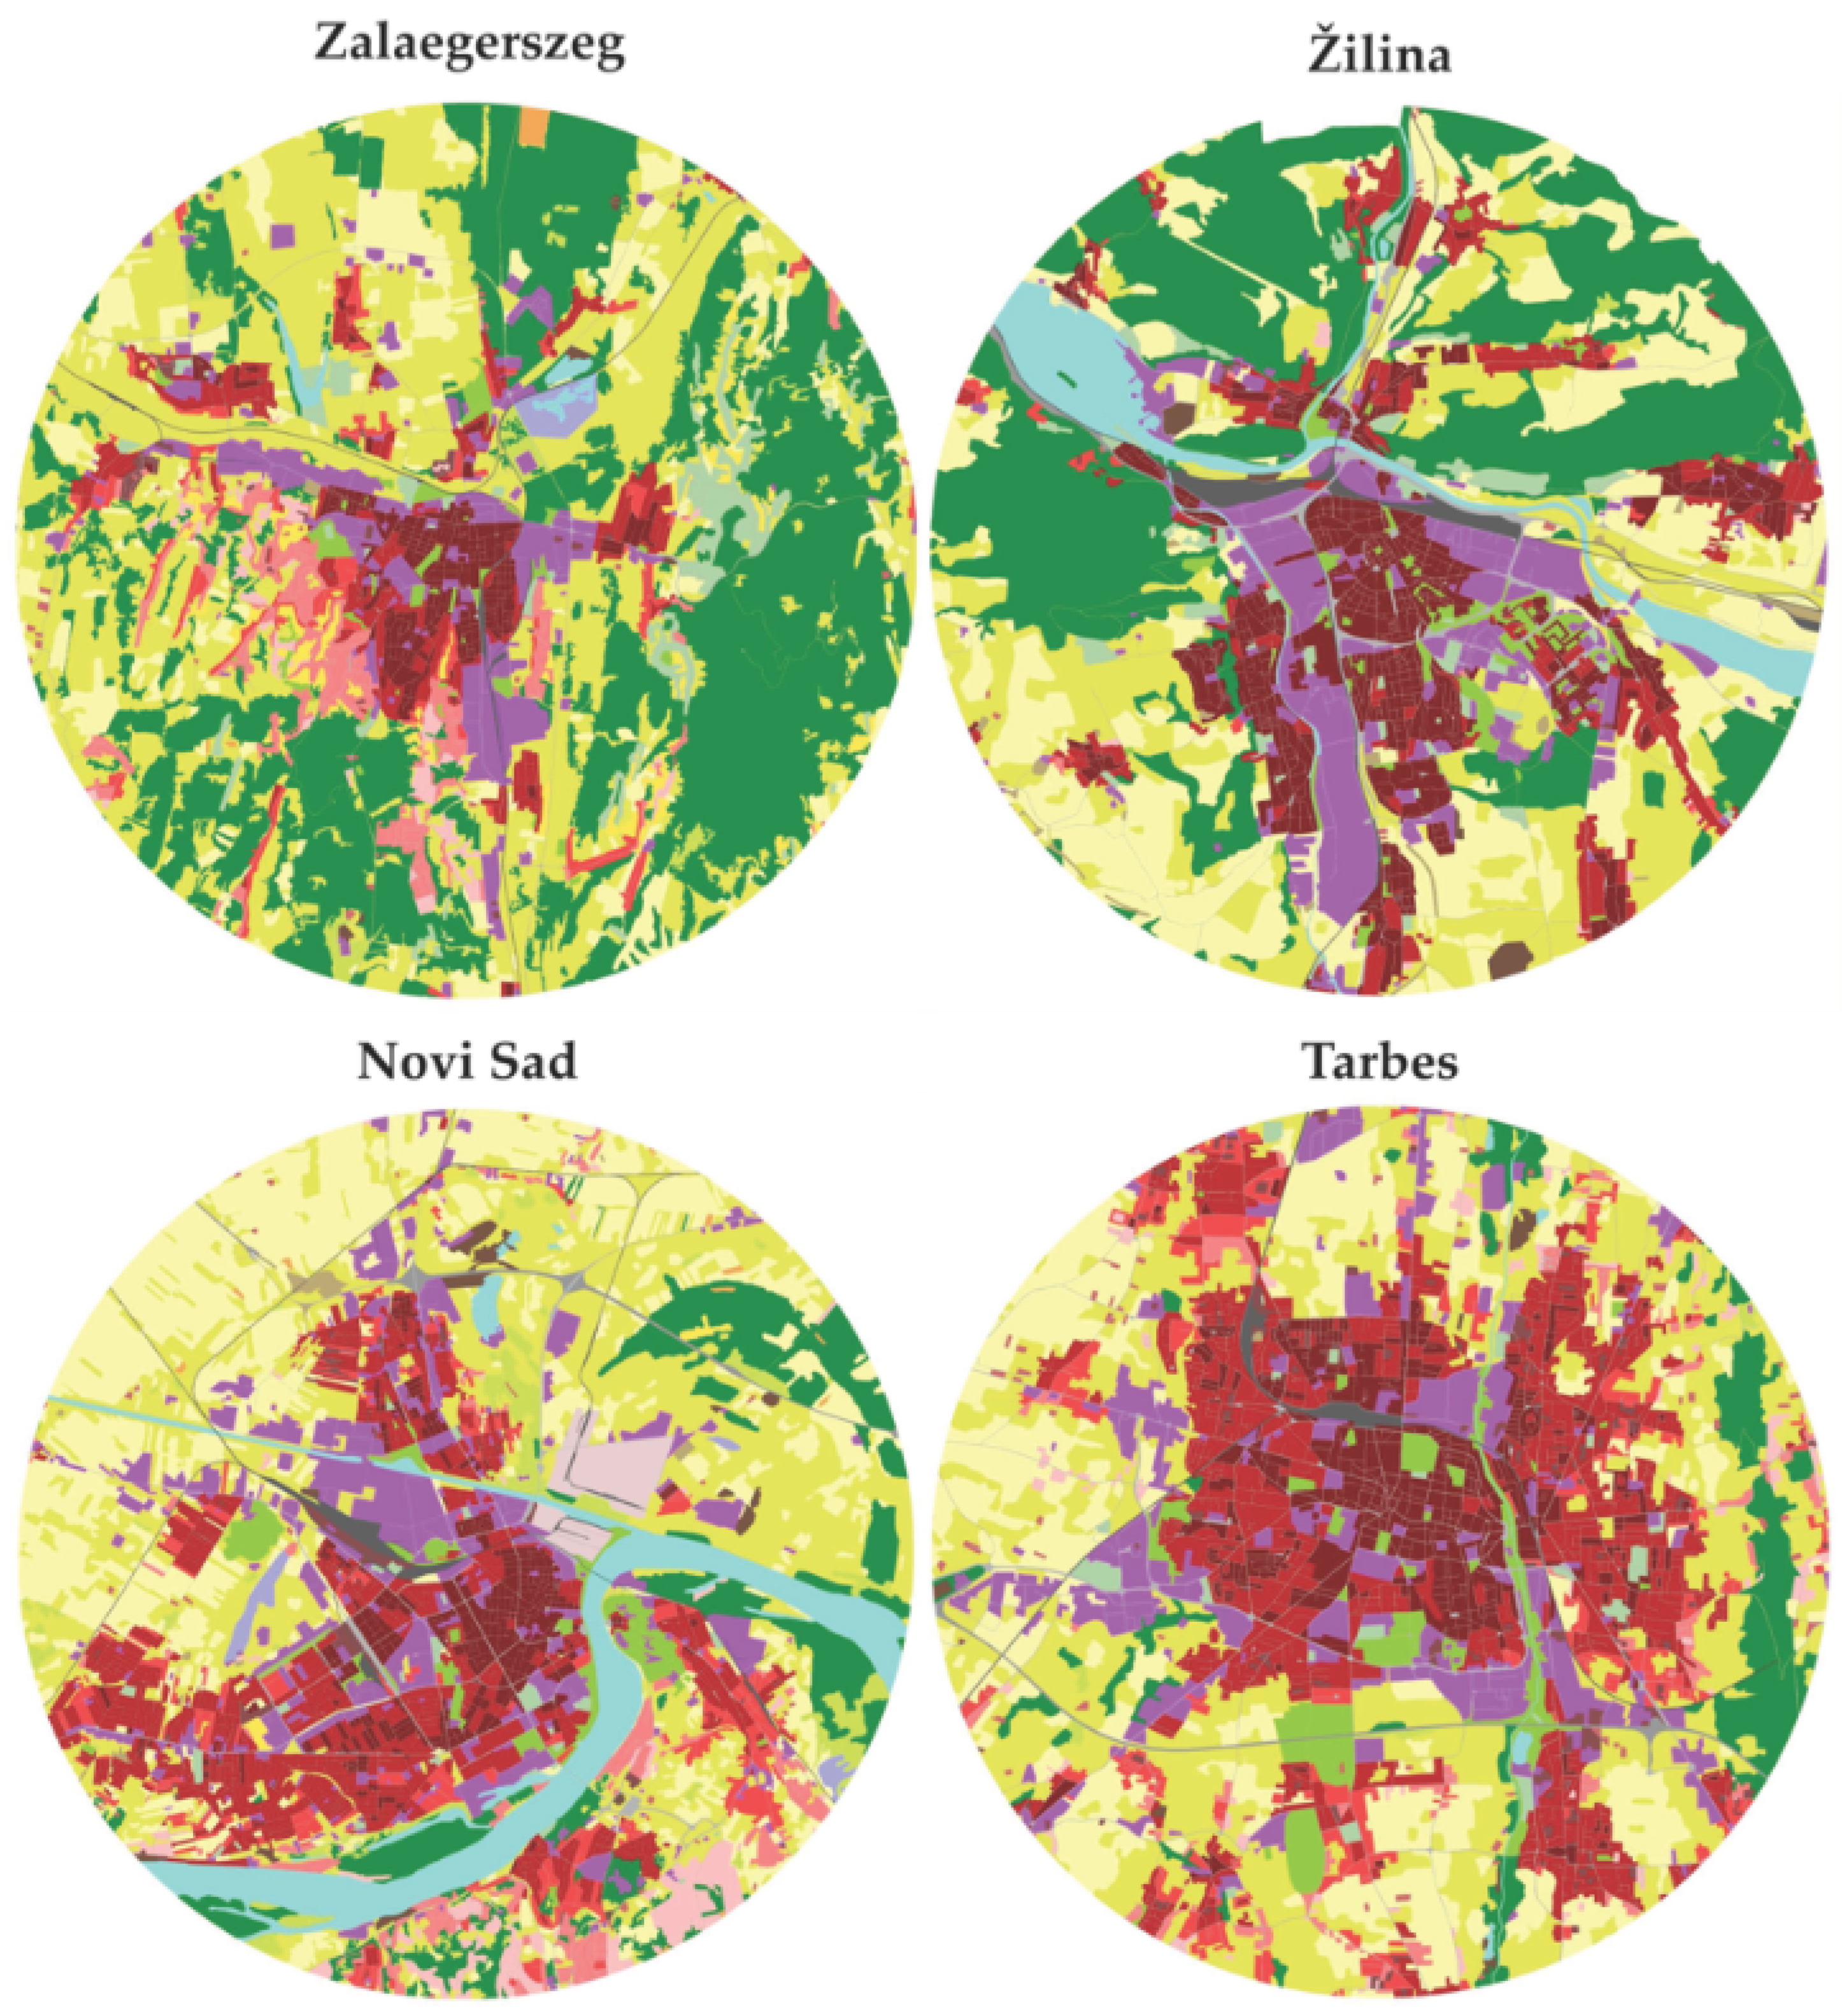
Figure 9.
An interesting triplet of look-alike cities. (a) Odense; (b) Metz; (c) Münster. (Source: [29], Metz 16 December 2015, Münster 23 March 2018; circular extracts – author’s work).
Figure 9.
An interesting triplet of look-alike cities. (a) Odense; (b) Metz; (c) Münster. (Source: [29], Metz 16 December 2015, Münster 23 March 2018; circular extracts – author’s work).


© 2020 by the author. Licensee MDPI, Basel, Switzerland. This article is an open access article distributed under the terms and conditions of the Creative Commons Attribution (CC BY) license (http://creativecommons.org/licenses/by/4.0/).
Share and Cite
MDPI and ACS Style
Dobesova, Z. Experiment in Finding Look-Alike European Cities Using Urban Atlas Data. ISPRS Int. J. Geo-Inf. 2020, 9, 406. https://0-doi-org.brum.beds.ac.uk/10.3390/ijgi9060406
AMA Style
Dobesova Z. Experiment in Finding Look-Alike European Cities Using Urban Atlas Data. ISPRS International Journal of Geo-Information. 2020; 9(6):406. https://0-doi-org.brum.beds.ac.uk/10.3390/ijgi9060406
Chicago/Turabian StyleDobesova, Zdena. 2020. "Experiment in Finding Look-Alike European Cities Using Urban Atlas Data" ISPRS International Journal of Geo-Information 9, no. 6: 406. https://0-doi-org.brum.beds.ac.uk/10.3390/ijgi9060406
Note that from the first issue of 2016, this journal uses article numbers instead of page numbers. See further details here.