1. Introduction
Due to the increasing number of various geoinformation applications, new challenges appear in the field of geovisualisation and map design. One of them is the visualisation of the interior of buildings. This is evident e.g., in the Location Based Systems (LBS) research agenda [
1], where the authors note: “There has been an increasing demand in expanding LBS from outdoors to indoors, and from navigation systems and mobile guides to more diverse applications (e.g., Healthcare, transportation, and gaming).” This is, among other things, because both indoor positioning systems and users’ needs are developing and growing. The positioning uses the signal from Wi-Fi routers, beacons which use Bluetooth technology, UWB (Ultra-wide band) transmitters, RFID (Radio-frequency identification) tags or uses magnetic field measurements [
2,
3,
4,
5,
6,
7]. The image-based positioning of mobile devices is another interesting solution proposed by Liang et al., in [
8]. These are just a few examples of methods from a very long list of technologies tested and implemented today. There is extensive literature on this subject, but the question of the positioning method itself is beyond the scope of the article.
The growing significance of research in the field of indoor cartography was perfectly analysed by Chen et al., in their work [
9], in which cartography’s potential role in the emerging field of indoor mapping was shown.
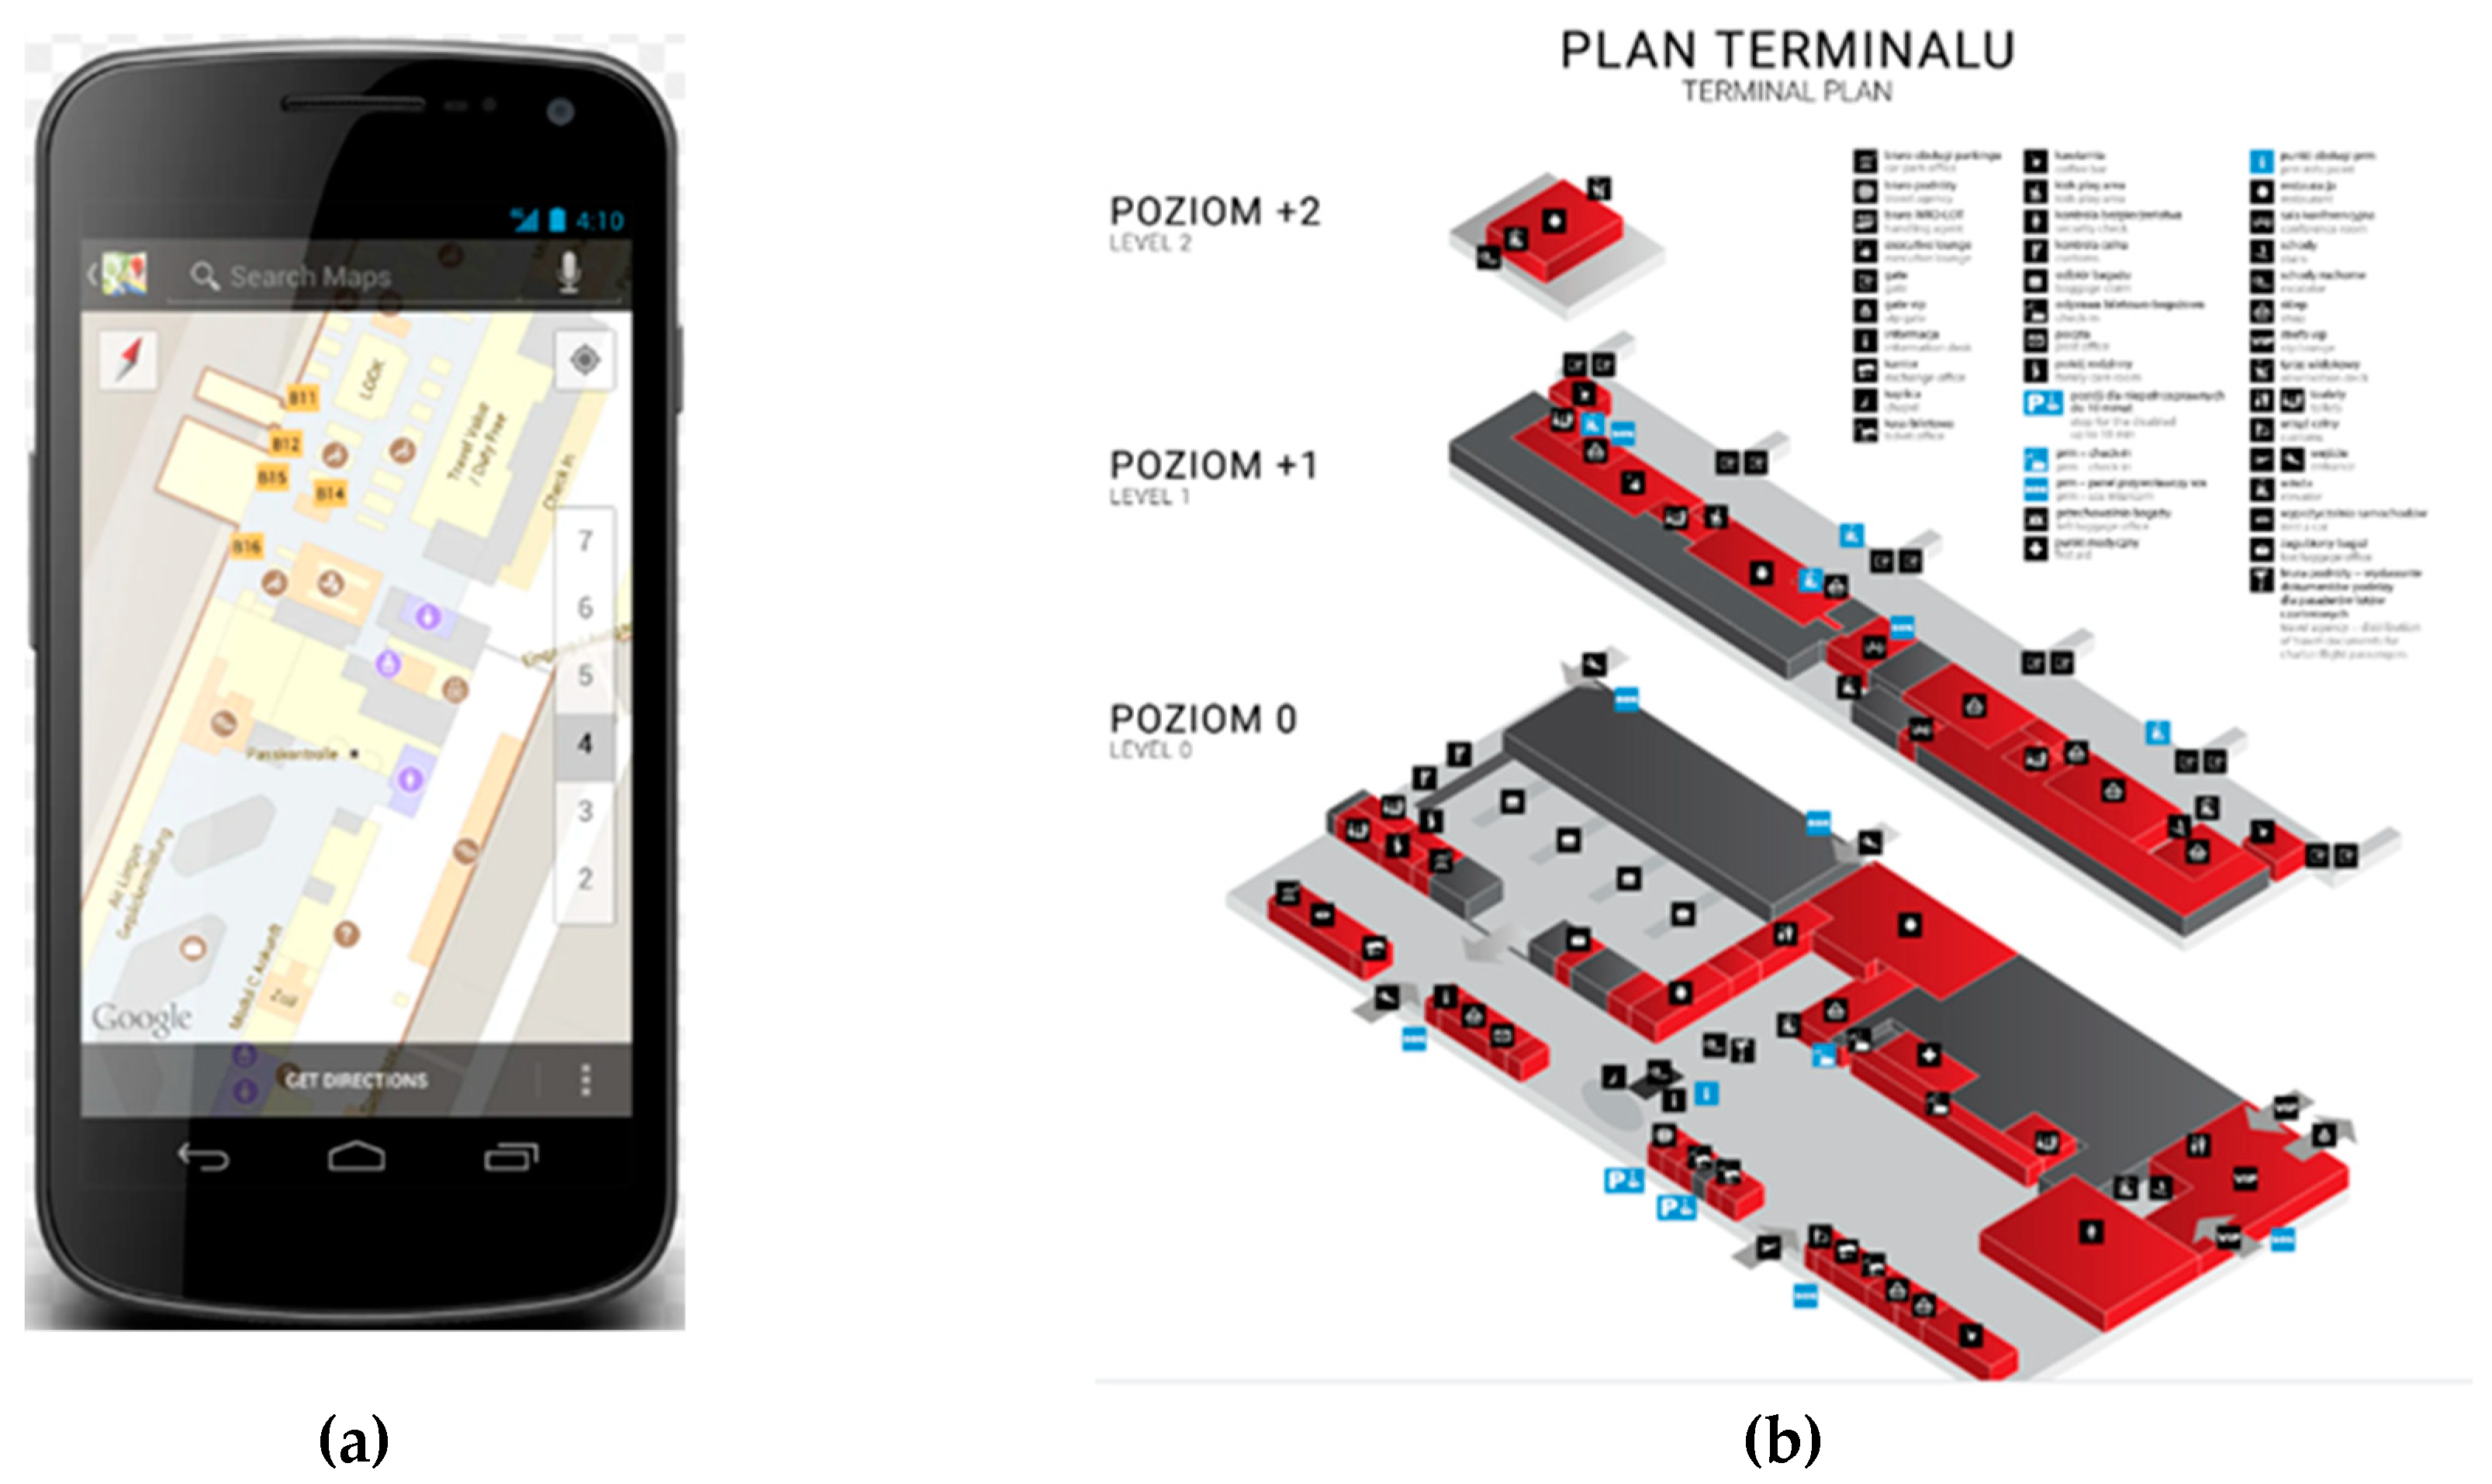
The challenge is not only new applications, but also the methodology of using new spatial data sources. In the context of indoor cartography, Building Information Modelling (BIM), CAD and 3D geographic information systems (GIS) models become particularly important. Based on these models or the best available architectural and construction drawings, the creators of navigation and GIS applications, most often create 2D models, losing information about third dimensions or showing it in a very simplified way. This is because not all applications can use 3D models, or there is no concept of making full use of the data available in classic construction drawings. An example can be indoor visualisations available e.g., in Google Maps or at airport information kiosks (
Figure 1a,b).
Makochon and Donatis show in the article [
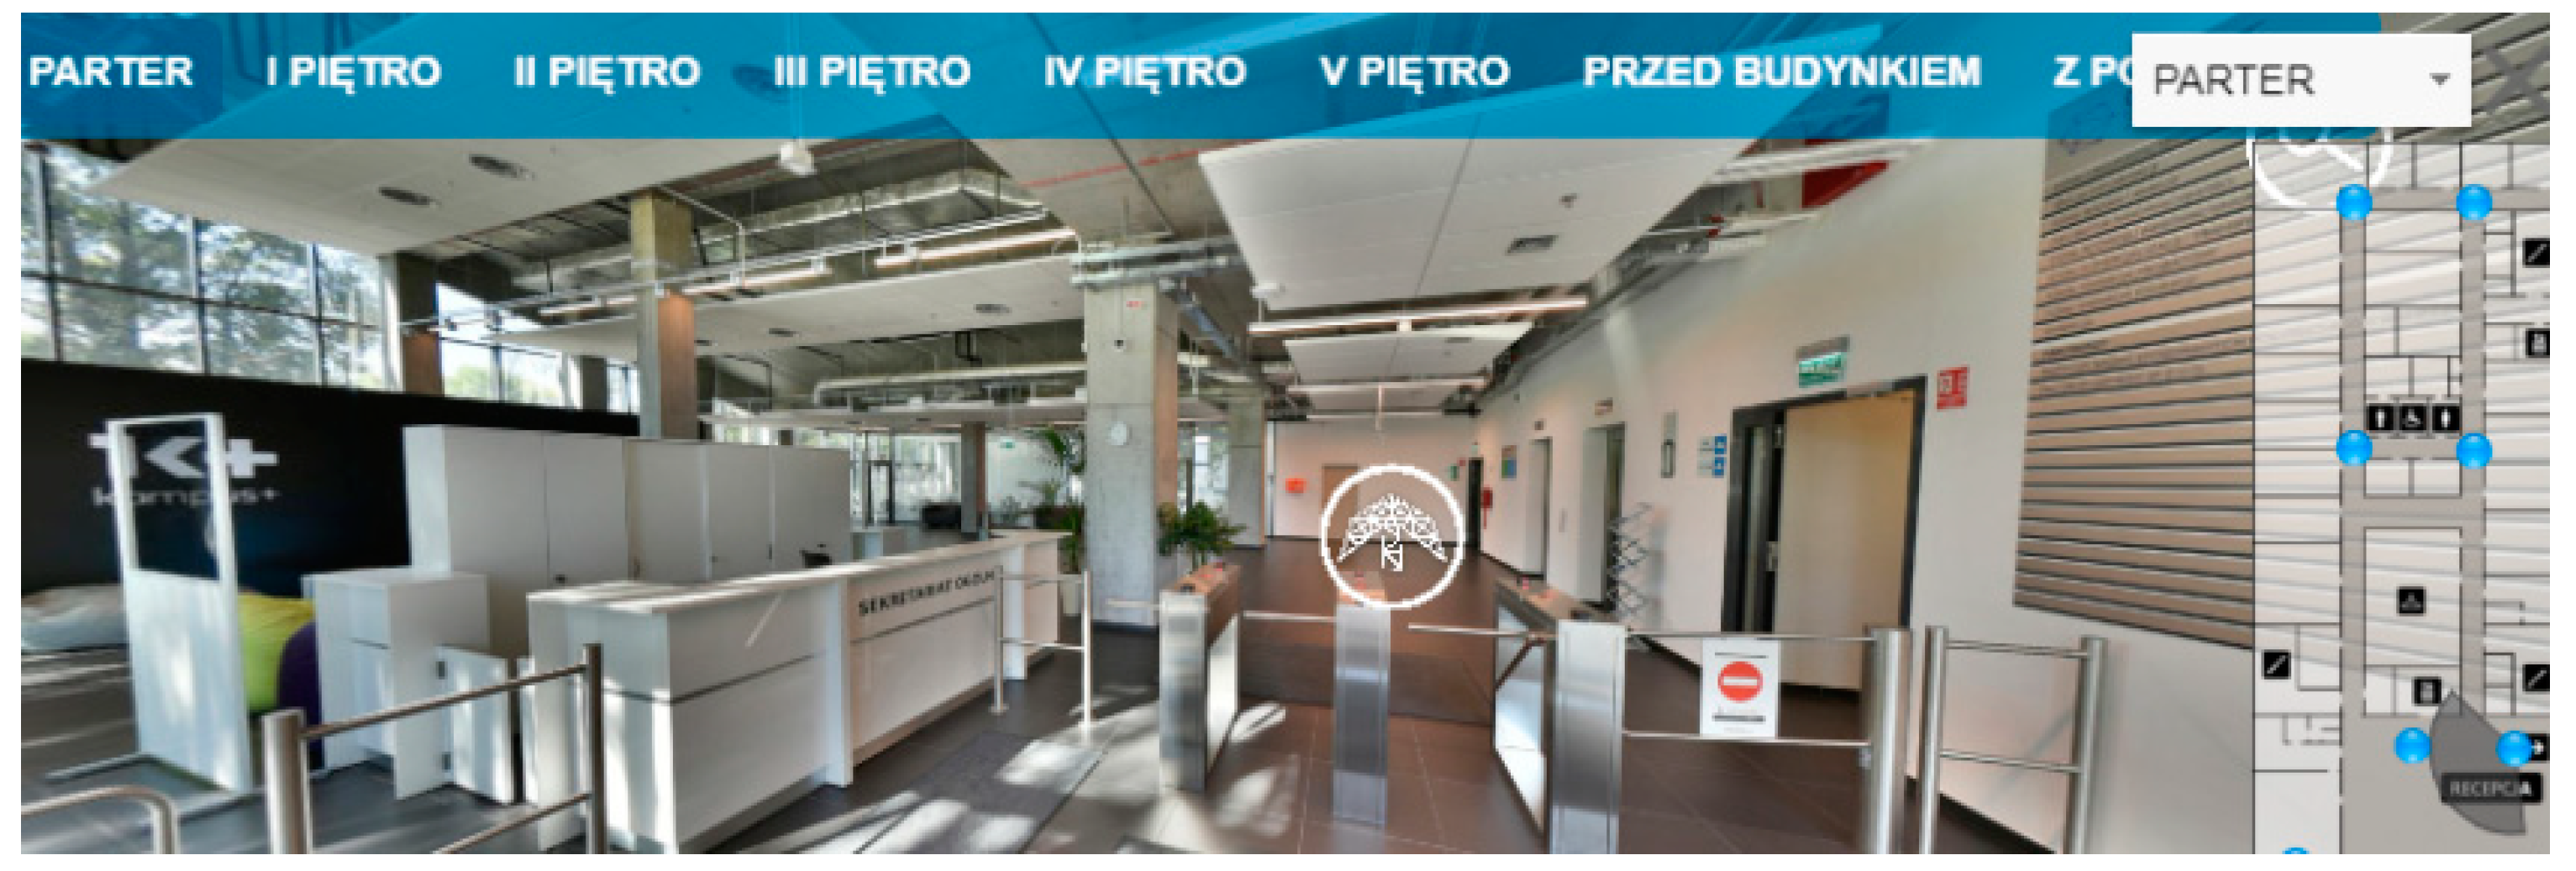
7], that existing technological solutions for creating indoor building models for navigation applications, such as Indoor Atlas, only allow for obtaining data for each floor separately. Building models are also used to manage real-world buildings or to play games. However, several restrictions can be seen, for example, in the virtual tour of the Centre for Innovation and Technology Transfer Management building located in Warsaw University of Technology campus (CZIiTT PW) (
Figure 2). In this case, 2D presentations for each floor are also visible separately.
The problem with the visualisation and storage of data for multi-story buildings is noticed by Gotlib and Karabin in their research on cadastre solutions presented in [
11] claiming that it is not possible to effectively visualise all storeys as a conventional, 2D cartographic visualisation (all projections in one plane).
Combining GIS, BIM, CAD and data obtained from traditional construction drawings, efficient use, and creation of cartographical visualisation on this basis is not an easy task. There is still not a large number of studies on this topic, and the methodology is currently limited and is still developing. Therefore, undertaking research related to the use of various indoor spatial data to find new methods of cartographic visualisation seems to be important for the development of the theory and practice of cartography. It is also worth noting that 3D cartographical presentation can be applied to different domains. Protsyuk et al., in their article [
12] focus on the 3D molecular cartography. Similarly, the theory and practice of cartography will have an increasing significance for indoor building modelling.
The proposed solutions have not been suggested by any previous authors so far. The presented proposals show the possibility of combining the world of BIM, GIS, and cartography. We believe that the presented results of one of the stages of these scientific studies would be in line with the indicated research trends and would contribute to the development of methods/techniques of geovisualisation; and might be found to be useful by other researchers in the map design process.
2. Related Works
For many years, the subject of modelling buildings has been the domain of architects and construction engineers. As it was expressed by Stoter et al. in their article [
13], recently the need for such models has been growing rapidly among other groups of users: from GIS analysts, through emergency management and services, to users of navigation systems or computer games. Pinos et al., in [
14], among others, present interesting review of the issue of data import to game engines where the authors’ focus is on research on providing tools “that will help bridge the gap between the game and the GIS domain”.
Indoor navigation is one of the new applications. Models that would prove useful in determining an indoor route to a destination have already received much attention in the literature [
15,
16,
17]. There are several standards of describing the interior topography of buildings, e.g., Industry Foundation Classes [IFC] derived from the BIM methodology [
18], or a CityGML adopted for this purpose [
19]. There are known ways of creating these models based on existing architectural and construction documentation made with CAD technology [
20,
21], or BIM methodology [
22]. Research has placed much less emphasis on another aspect of the operation of navigation applications, i.e., the correct visualisation of a building’s interior. Cartographers have only recently become more interested in modelling the interior of buildings [
23,
24] and the “indoor cartography” research area is becoming distinct [
1,
9,
25].
A method of visualising a building’s interior should take into account the purpose of the presentation and the type of its recipients. Architects and construction specialists use the well-known and standardised visualisation method whose interpretation, however, is in many cases difficult for the non-specialists. Wang et al., in their article [
26] argue that current navigation systems usually draw too much of users’ attention to the mobile devices, which lead to users’ lacking real interaction with the environment. Users of navigation applications need much more straightforward methods that enable a much more accessible interpretation of the presented content. What proves helpful in this regard is the cartographic methodology, with its many principles developed for the effective transfer of information about space to an unskilled user. The methodology includes, among other things, the principles of cartographic generalisation, multi-scale data presentation, the use of known graphic conventions, or the proper use of visual variables.
Chen and Clarke in [
27] argue that the analysis of models and data formats used in location and navigation applications, in which the interiors of buildings are visualised, shows that there are either full 3D models and presentations or 2D models and presentations.
The visually attractive 3D-view presentation methods used, for example, in games, require a detailed data model. Still, despite the growing demand and many efforts in this area, such data are available for a small number of buildings. One of the interesting research directions for creating 3D indoor models is texture mapping of indoor environments based on camera scenes proposed by Cheng et al., in [
28]. Although data acquisition methods are continually refining, the costs and technical difficulties mean that this situation will not change for a long time [
15,
19]. In addition, only 2D models or technical architectural drawings are and will remain available, which, in addition to 2D views, show selected sections of a building. Another problem is the visualisation of the user’s position and route in the 3D navigation application—it is difficult to show it in the context of the whole environment. Effective methods have not yet been developed in this respect. In this case, it may be useful to apply the process of spatial generalisation, which is the basis of the cartographic methodology. For this reason, in the authors’ opinion, there is a need to develop a coherent method of data presentation, one as independent of the type and complexity of the building’s source model of data as possible, which will be useful in geoinformation applications, and particularly, in navigation applications. The conducted research and the technological experiments described later in this article made it possible to propose an intermediate solution between 2D and 3D visualisation—to use existing data resources fully while standardising the method of visualisation of heterogeneous data sets as part of a joint application.
3. Materials and Methods
The following research methodology was adopted in this paper: initial identification of the problem during various research and technological works in the field of indoor navigation, analysis of scientific literature to find a solution to the problem encountered, development of own concept during repeated meetings of the research team and then an attempt to check the technical feasibility of the chosen solution. In the first stage of work, it was decided to make a prototype of the solution using GIS technology, which was only to act as a simulator of the proposed functionality. The work included preparation of relevant simulation data (the models of buildings), development of the algorithm, and coding. It was assumed that after the positive resolution of selected problems (e.g., data storage in one database, conversion of coordinates, and verification of visualisation quality), it will be possible to proceed to the next stages of research: implementation of the prototype in the mobile device environment and user perception study (focused interview analysis). This second stage is still ongoing and is not described in this article. The prototype was built using the iterative method and the results obtained were discussed in the research team. Then, corrections were made until the assumed effects were achieved, i.e., the combined use of the building’s horizontal and vertical projections from various data sources. Some issues regarding the process of identifying a scientific problem (motivation for scientific research), applied technologies and selection of test fields are explained in more detail below.
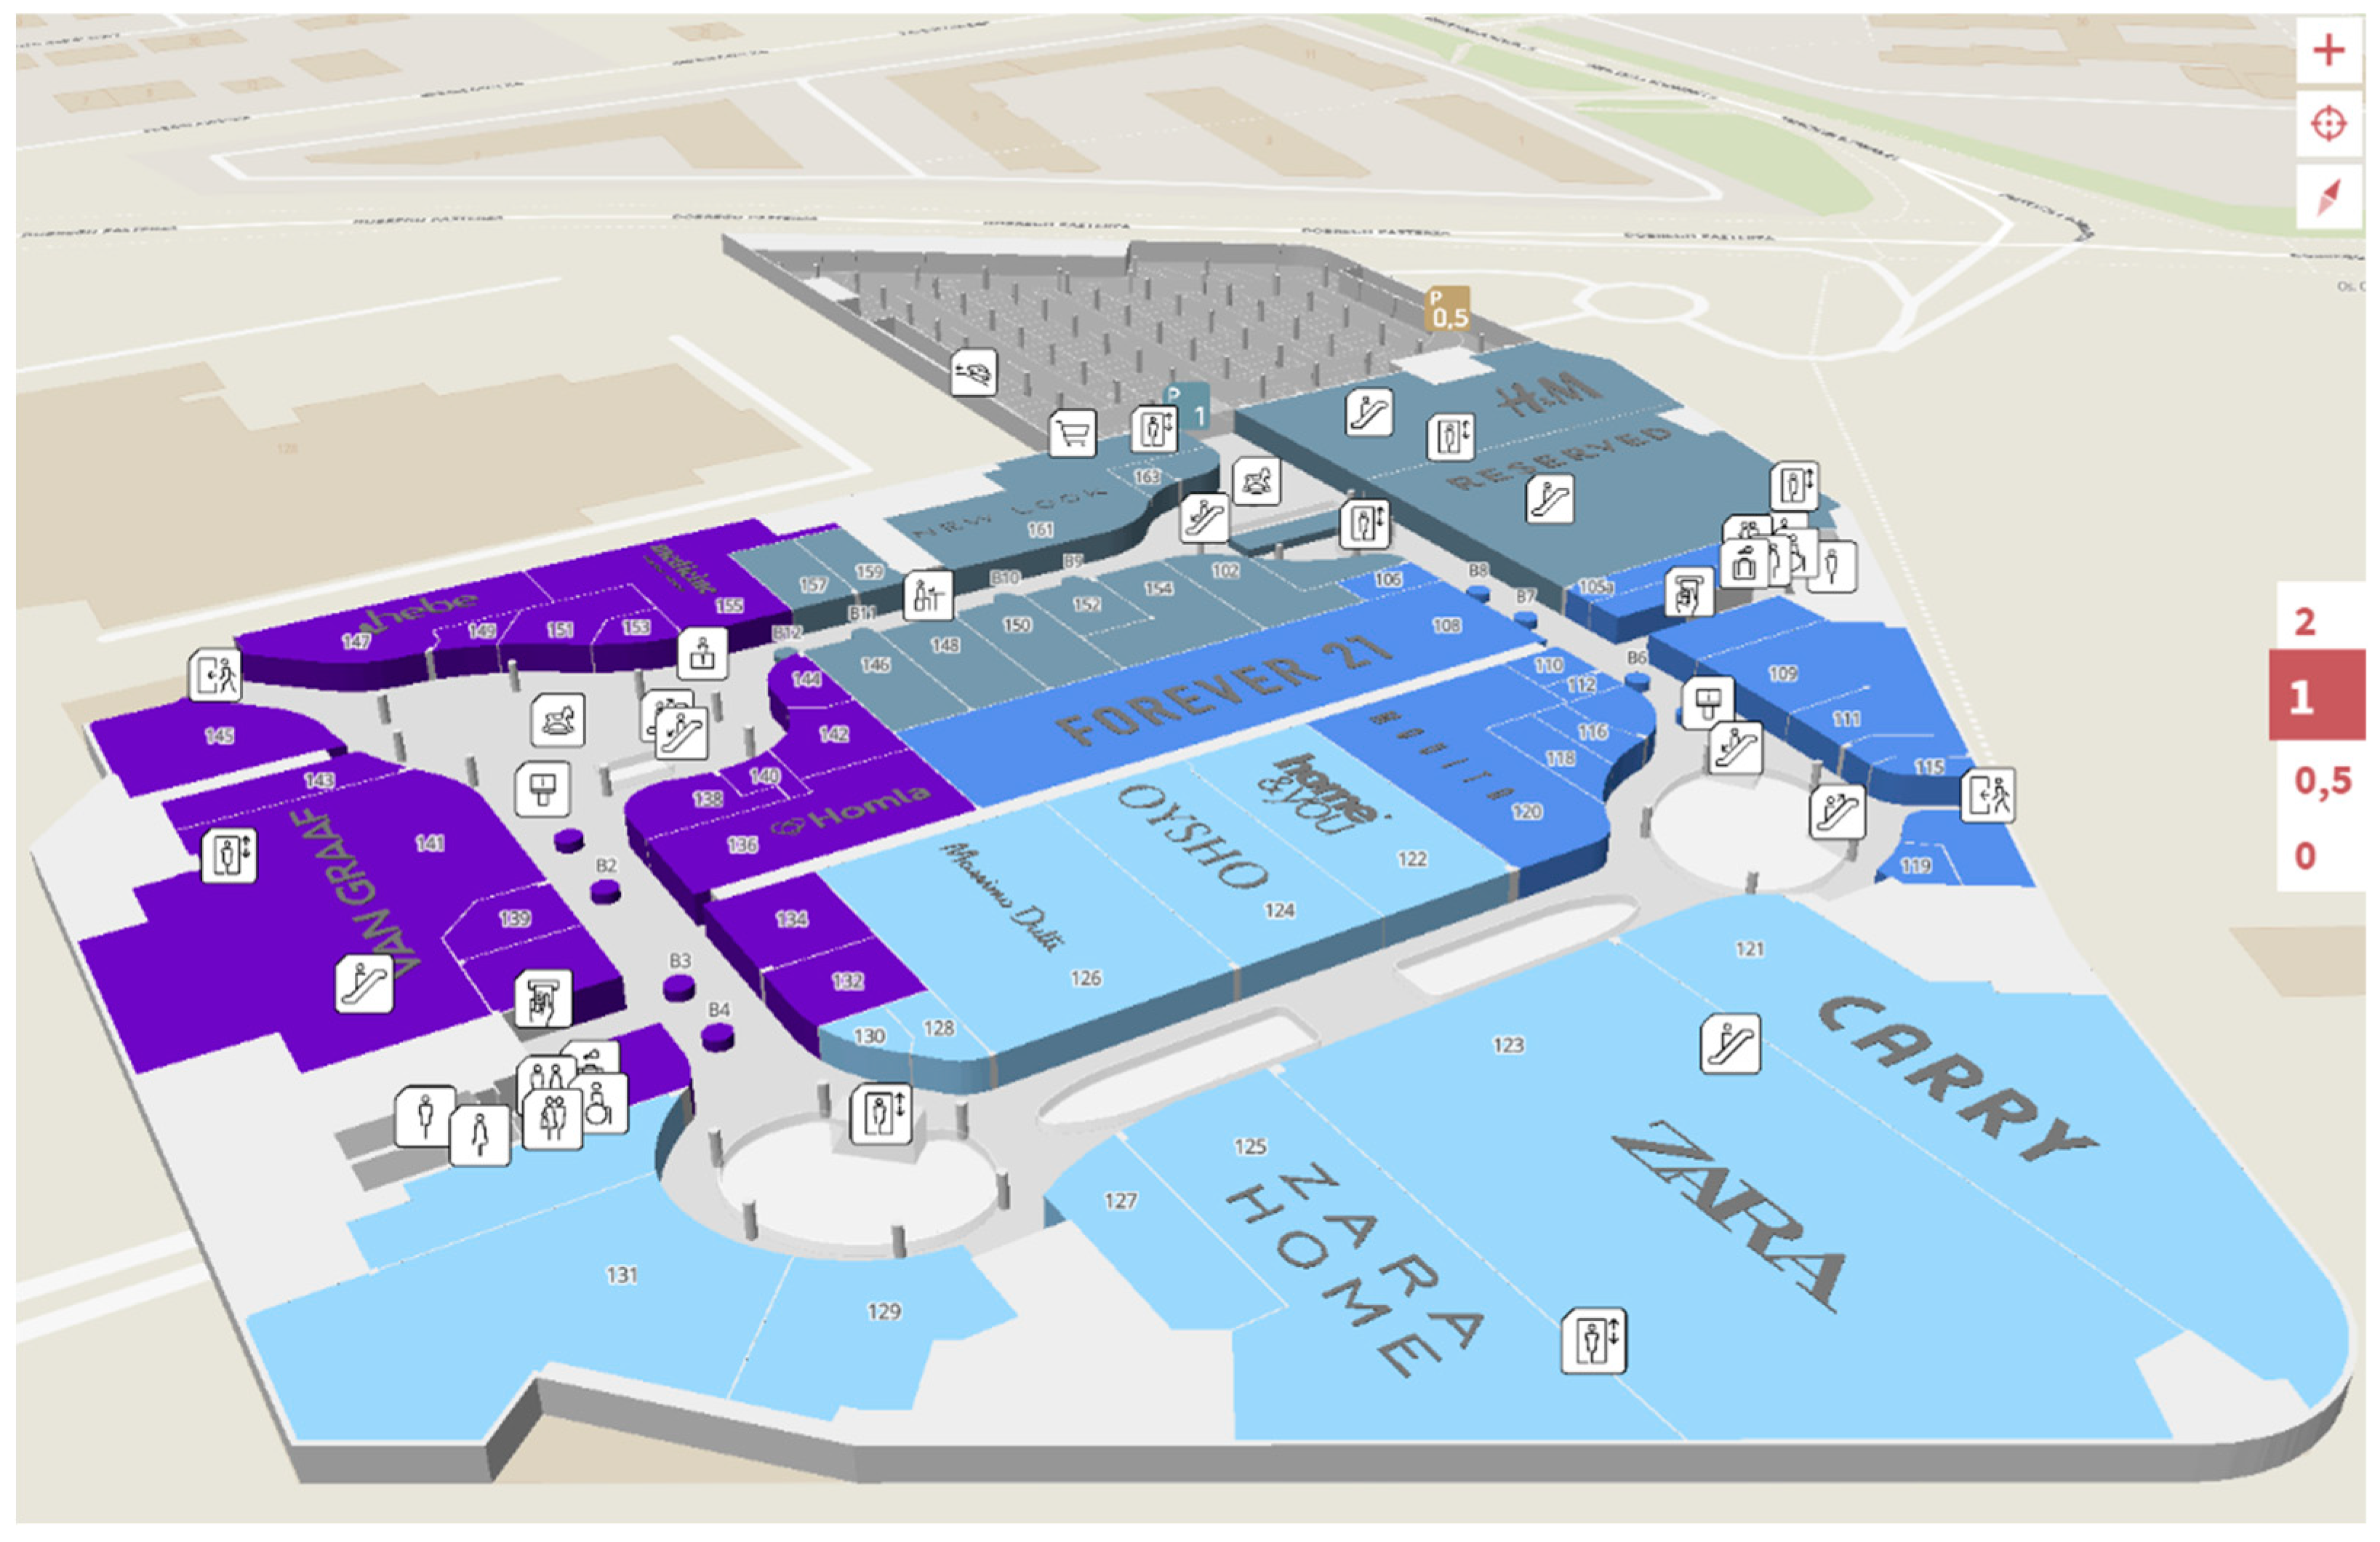
The idea of developing alternative visualisation methods for the interior of buildings emerged after the authors had carried out several research and development projects in the field of indoor navigation and facility management systems. In the process, the authors had noted deficiencies in the methodology of visualising a building’s data for geoinformation applications in situations where architectural and construction drawings constituted the only source of data. Most often, such cases involve making 2D presentations of separate floors, which is not effective when creating information transfer, e.g., for a navigation application. Architectural and construction drawings, on the other hand, contain data that also show a building’s third dimension. They are used, among others, to create an axonometric view of a building (
Figure 3). It is a method frequently used to display the interior of a shopping centre for shoppers. Usually, it is just a static presentation that shows a building from one observation point, which is insufficient for geoinformation applications by which users dynamically change their position, and in which it is necessary to analyse data and perform calculations (e.g., dynamically generating routes). Moreover, such a visualisation (an axonometric view) does not fully utilise the data available and is quite challenging to use in navigation applications.
Identifying this problem has provided the impetus for finding a new solution that maintains the simplicity of 2D visualisation and also enables the transfer of relevant information about the building in the third dimension. The authors researched the use of vertical cross-sections of buildings, available in every architectural and construction drawing, to obtain the effect, which was called 2D+. It is an intermediate solution between 2D and 3D visualisation. It may be used when complete 3D data are unavailable or when there are application limitations. Performed iterative experimental tasks included, among others, an attempt to store floor plans and cross-sections in one coordinate system in a spatial database and link the floor plans and sections using identifiers. There were further attempts at visualisation using the cartographic methodology. After developing the initial concept, the authors decided to develop a prototype to test the concept thoroughly. The prototype was implemented in the GIS environment.
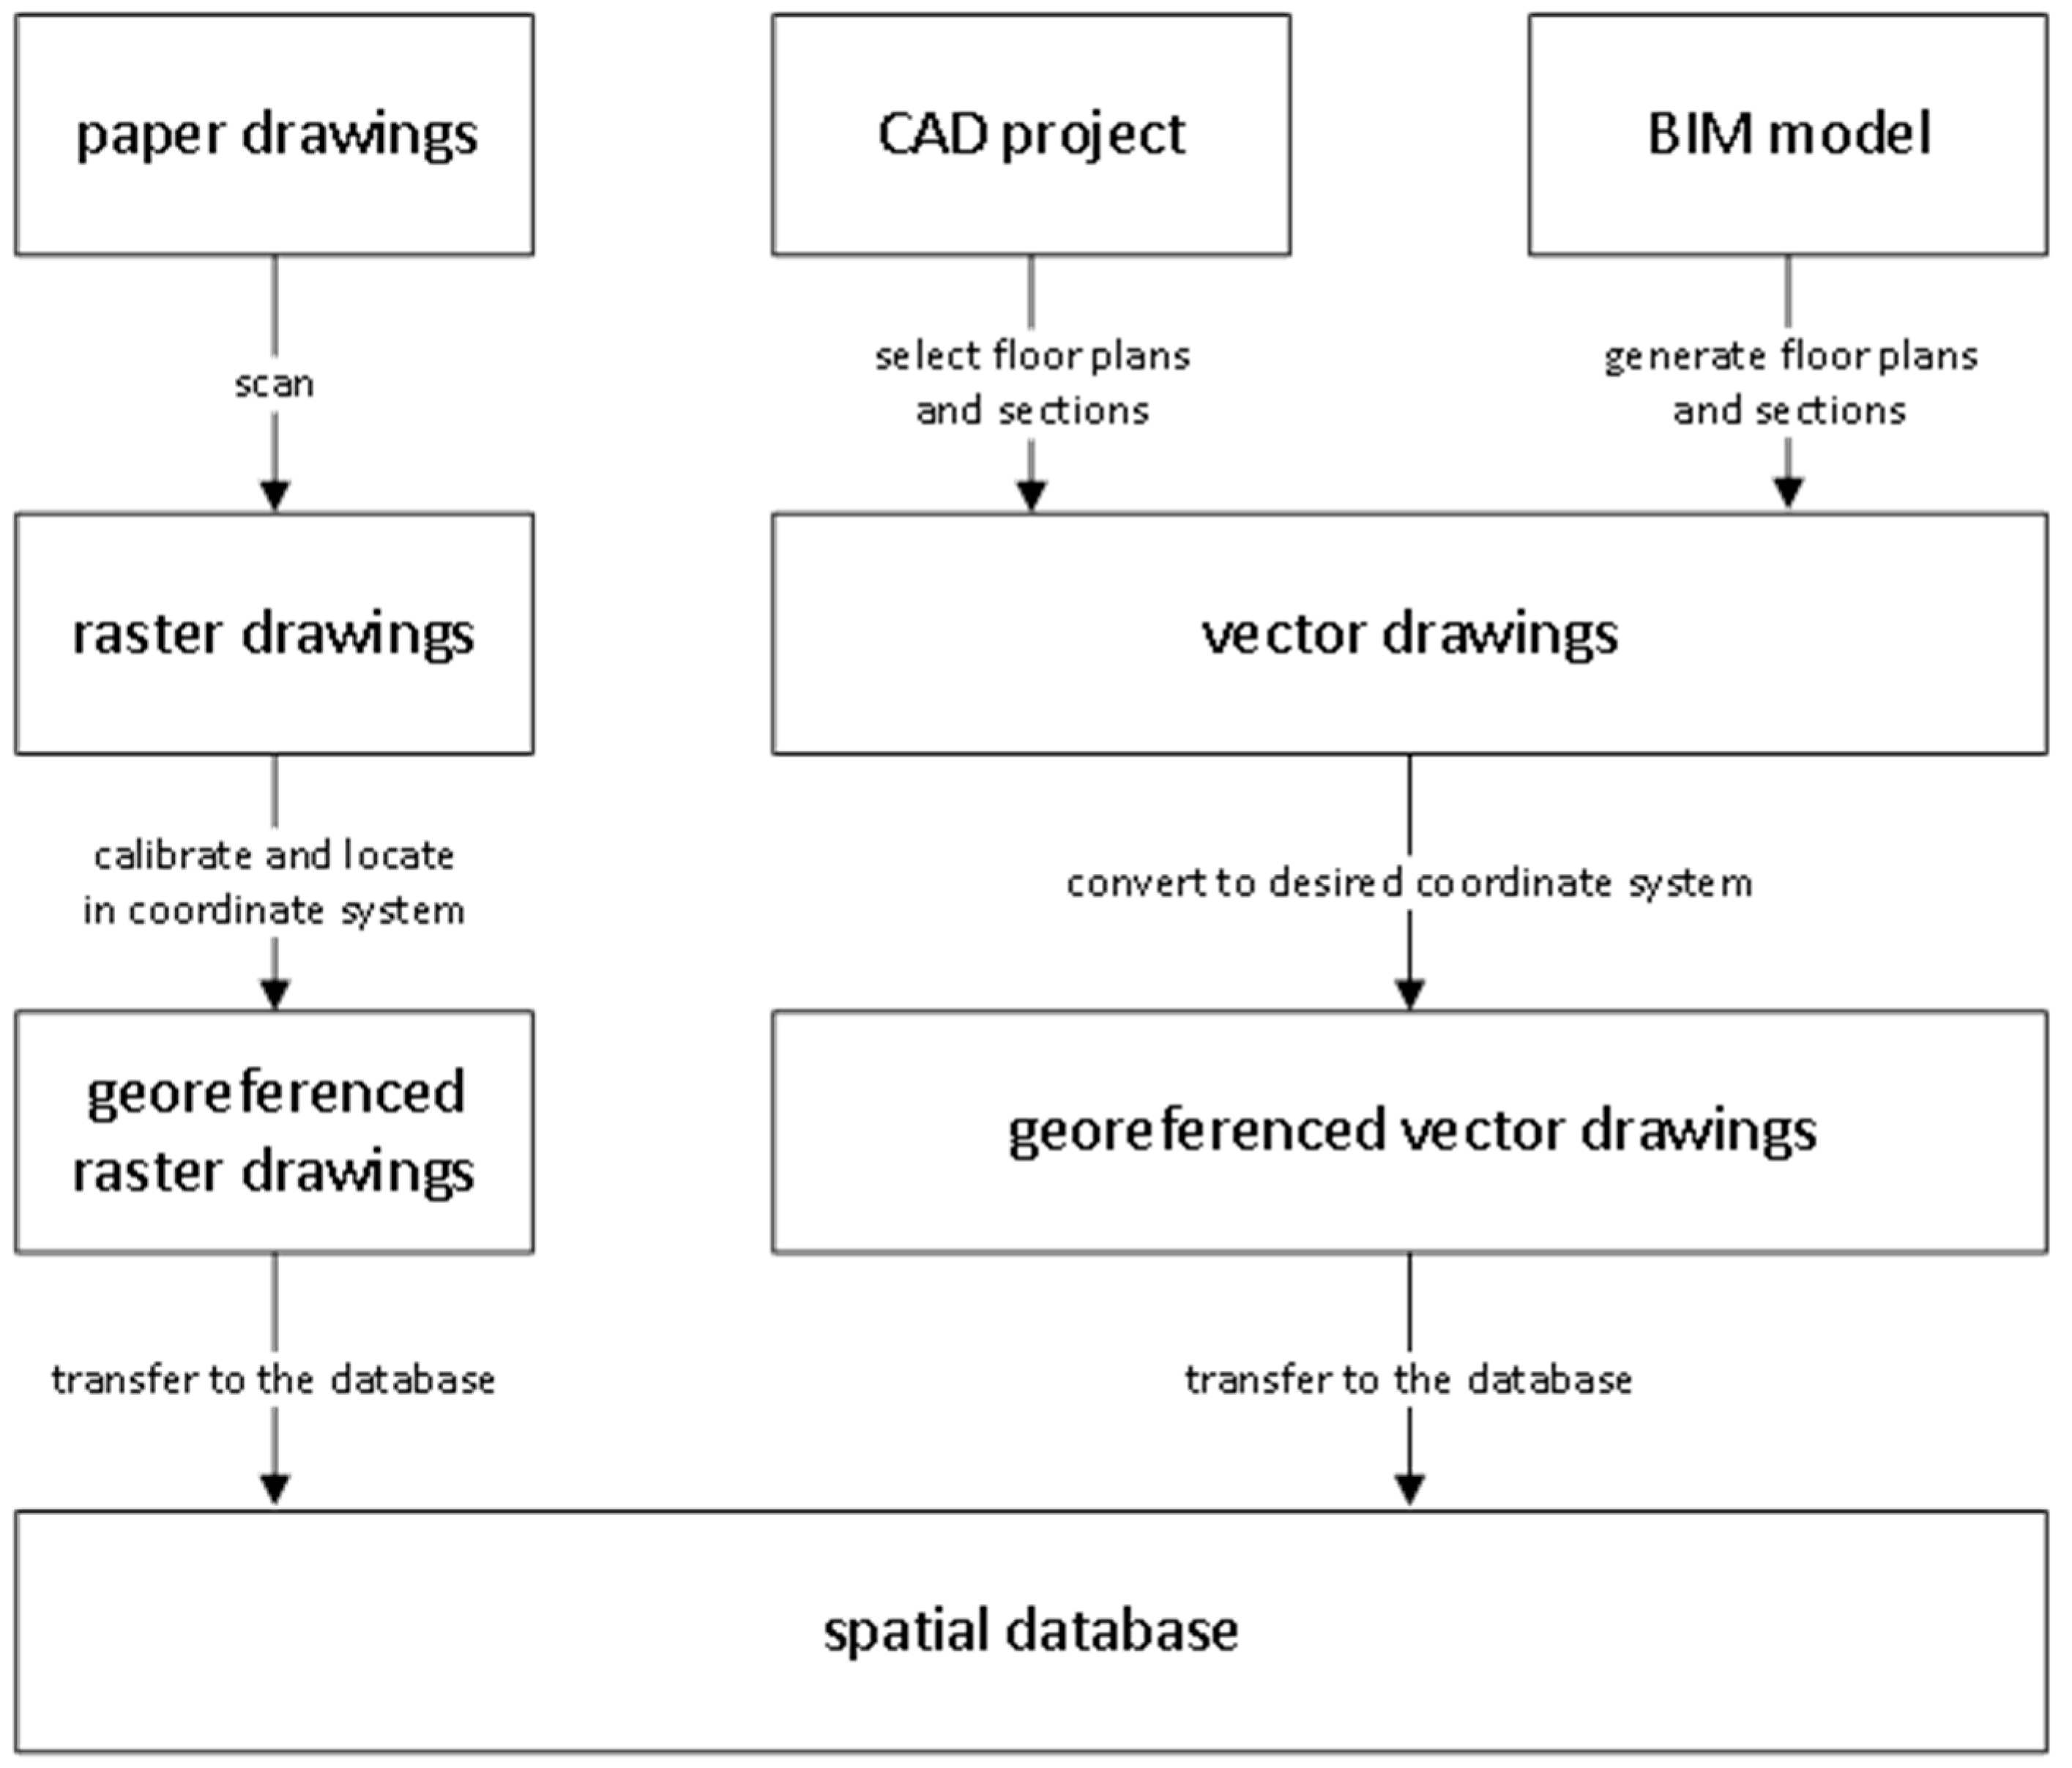
The research used diversified data for several buildings. For the Main Building of the Warsaw University of Technology (an early 20th-century structure), analogue building plans and sections were used. They were scanned, parameterised, and calibrated to make them cartometric.
Figure 4 shows a diagram of processing the data for the experiments.
The second test building was the Centre for Innovation and Technology Transfer Management of the Warsaw University of Technology. This case used vector technical documentation from CAD software. An office building’s floor plans and sections generated directly from the BIM and CAD models were used as the third test set (made available online by the Institute for Automation and Applied Informatics (IAI) of the Karlsruhe Institute of Technology (KIT)).
The prototype application was developed in Python. Test data, in the form of floor plans and sections, were developed using the Autodesk Revit application and stored in the PostgreSQL database using the PostGIS extension. Thanks to the proposed database model, it was possible to store data on floor plans and vertical cross-sections. Moreover, the database was expanded with a set of “stored procedures” to enable searching and retrieving relevant floor plans and cross-sections, depending on the location and the orientation of the device. Based on this kind of information obtained using the mobile device emulator, the prototype application enables the display of the appropriate floor plan or the nearest cross-section. No positioning system was used in the tests—the position is indicated manually. The source of the position entry does not affect the way the building is visualised. In the target application solutions, the user’s position can be obtained from Wi-Fi, beacons, RFID, UWB or other sensors.
4. Results
The efforts resulted in the new method of visualisation and the prototype of a system that enables testing proposed methods of presentation of buildings’ interiors coming from heterogeneous data sources. This method was proposed for the first time. It can be used in many ways: in navigation, building management systems, applications for creating panoramas of building interiors, and even in computer games. The proposed solution is an additional one that can be used next to the full 3D visualisation method. The advantage of the proposed solution is particularly visible in the absence of full 3D building data access, or in the case of software restrictions (deficiencies in the 3D processing environment). The solution allows the use of data contained in classic building documentation by designers of geoinformation systems in a wider scope than before (use of vertical cross-sections).
As a consequence of the performed experiments, it was possible to draw up guidelines and conclusions for further research and the development of the target solution. Below are the results of the tests.
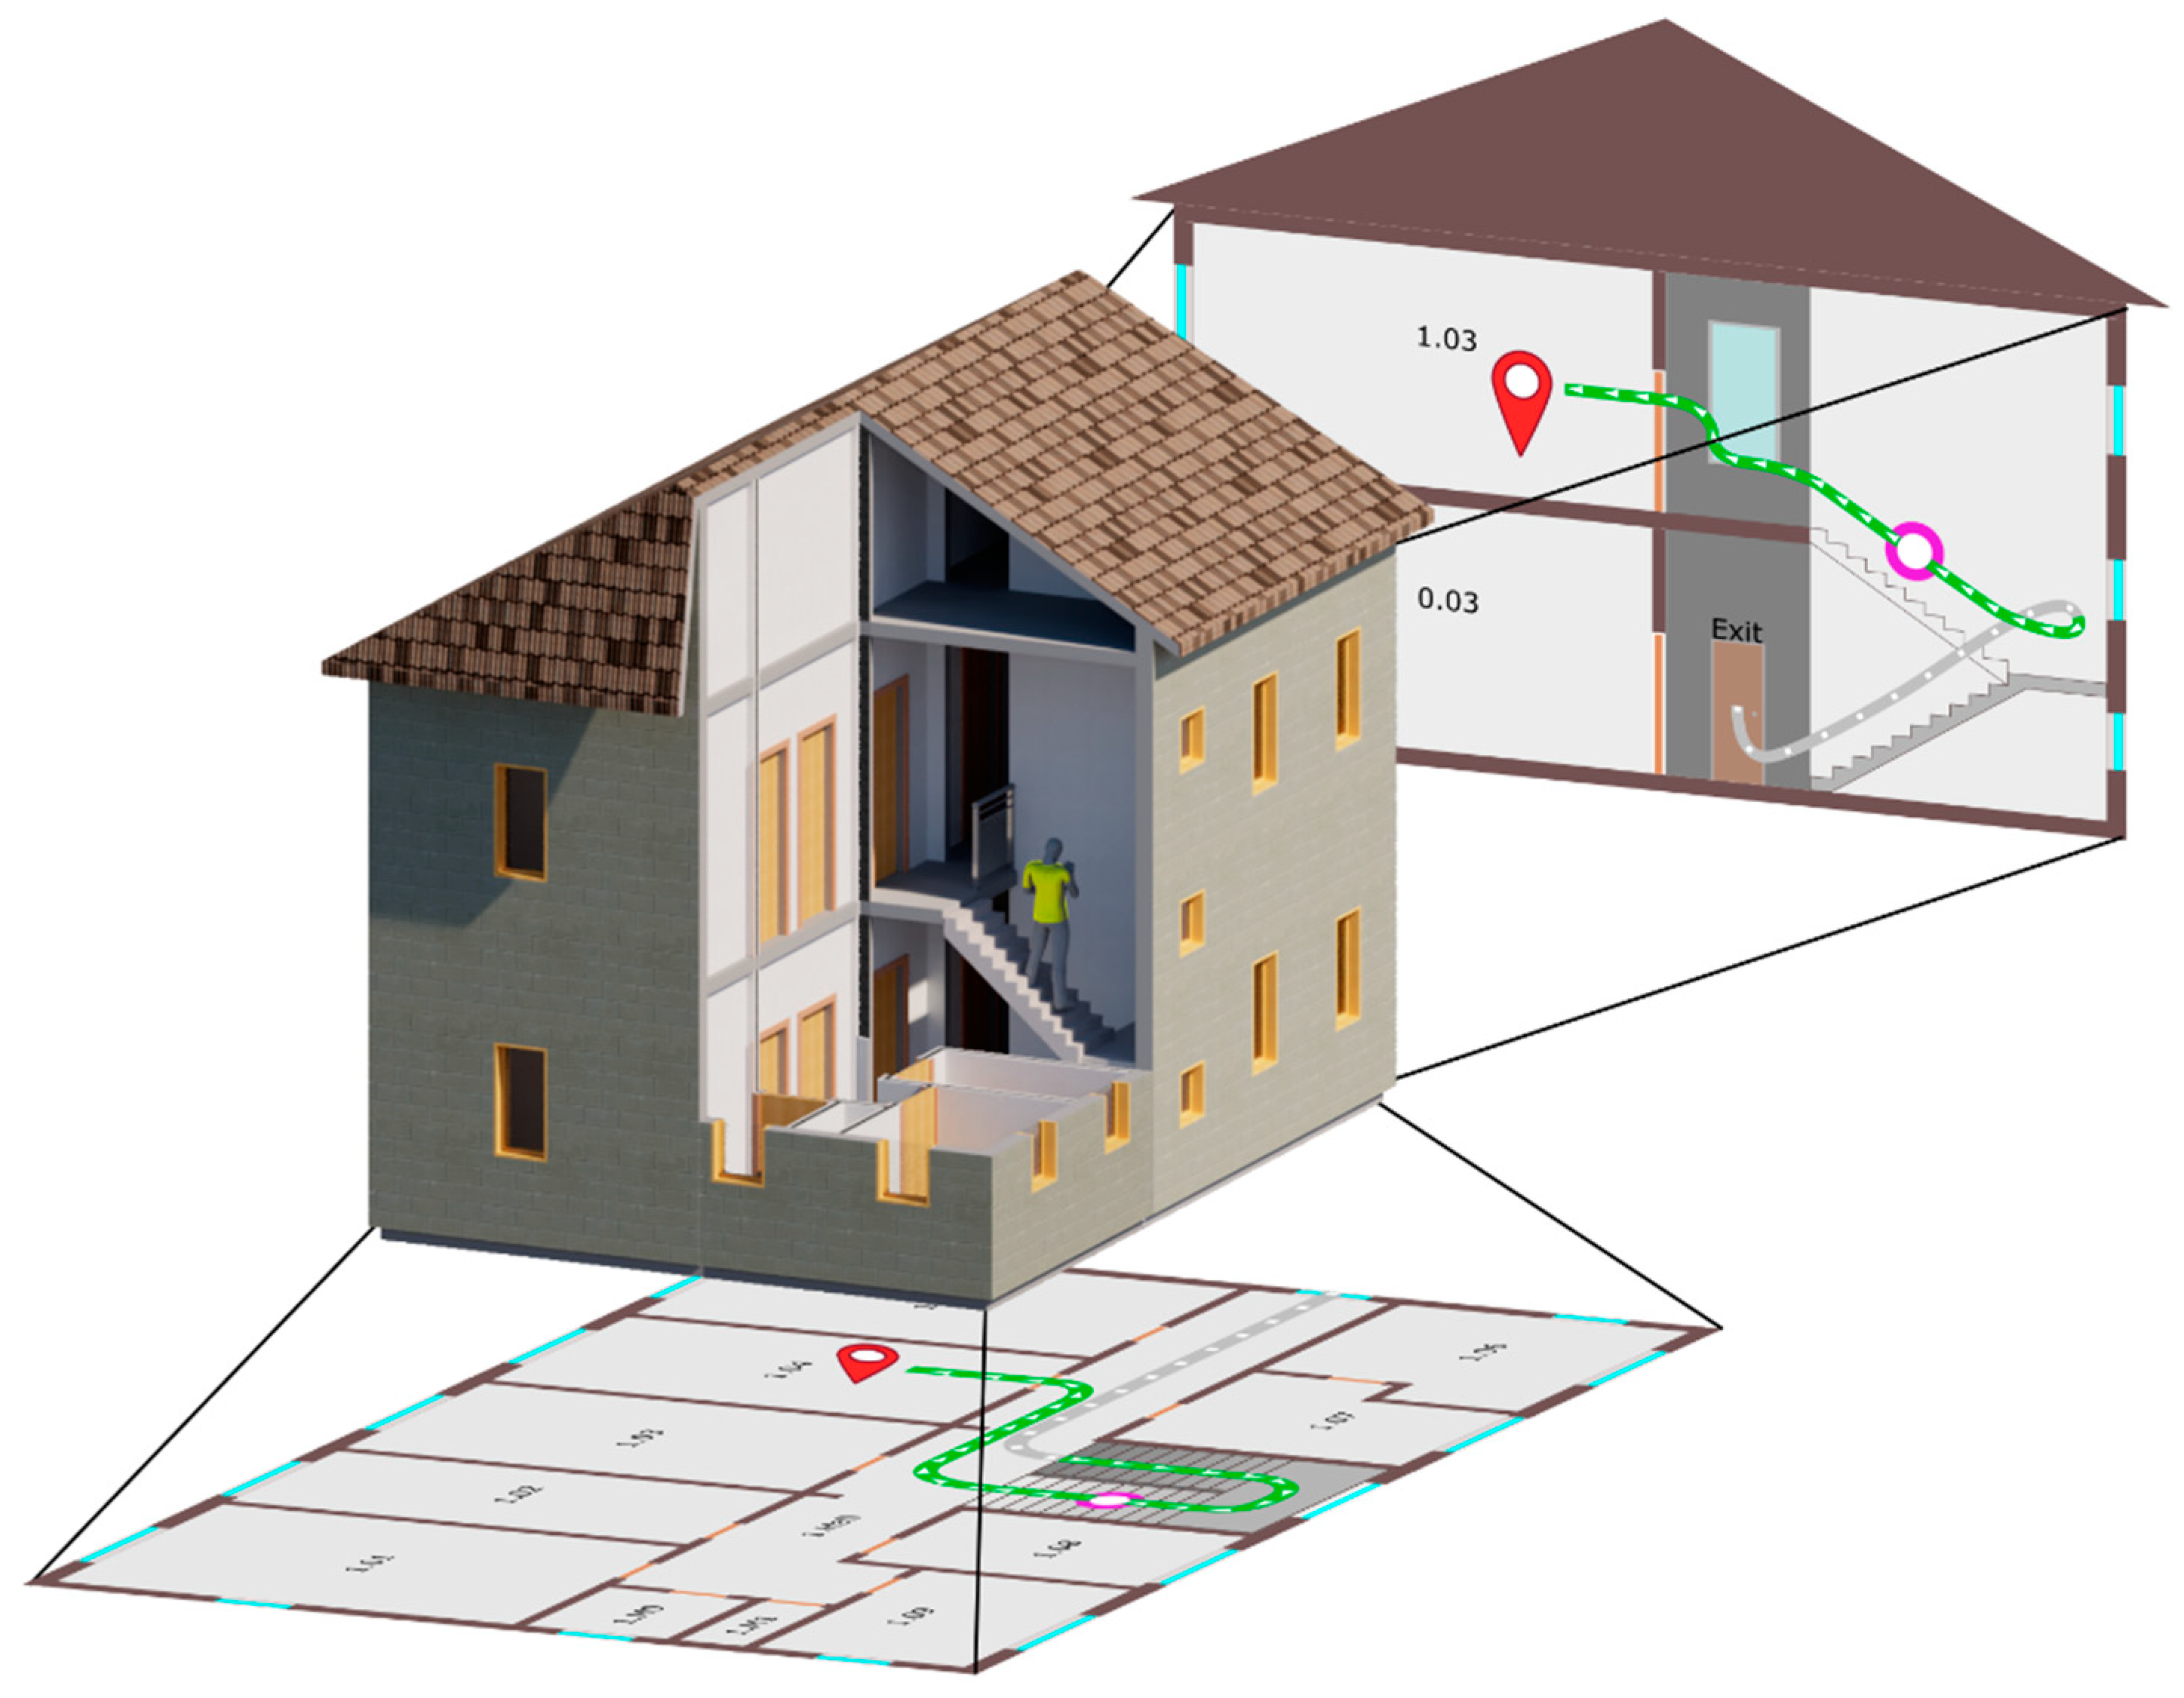
4.1. The Concept of 2D+ Visualisation
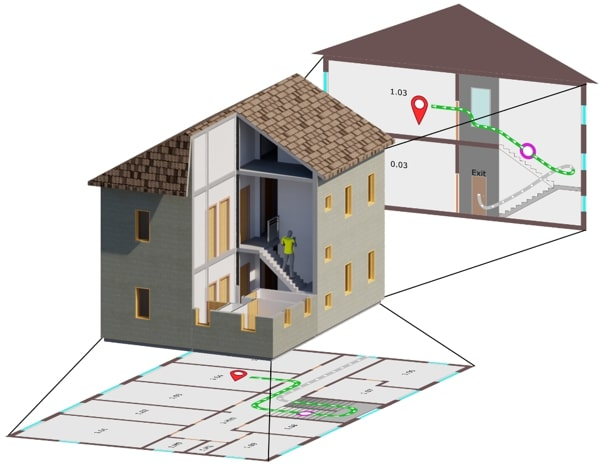
The proposed simplified way of “2D+” cartographic visualisation consists of enabling the geoinformation applications to display not only floor plans (a floor map) but also vertical cross-sections without using 3D methods or technology. Consequently, a user can get simplified access to 3D data in systems that only support 2D data. The advantages of this solution are particularly evident in a navigation application when a user wants to view and analyse their route within the entire building. This type of route often passes through many floors; thus, its 2D presentation against the background of just one floor significantly restricts the user.
Figure 5 depicts a diagram illustrating this idea.
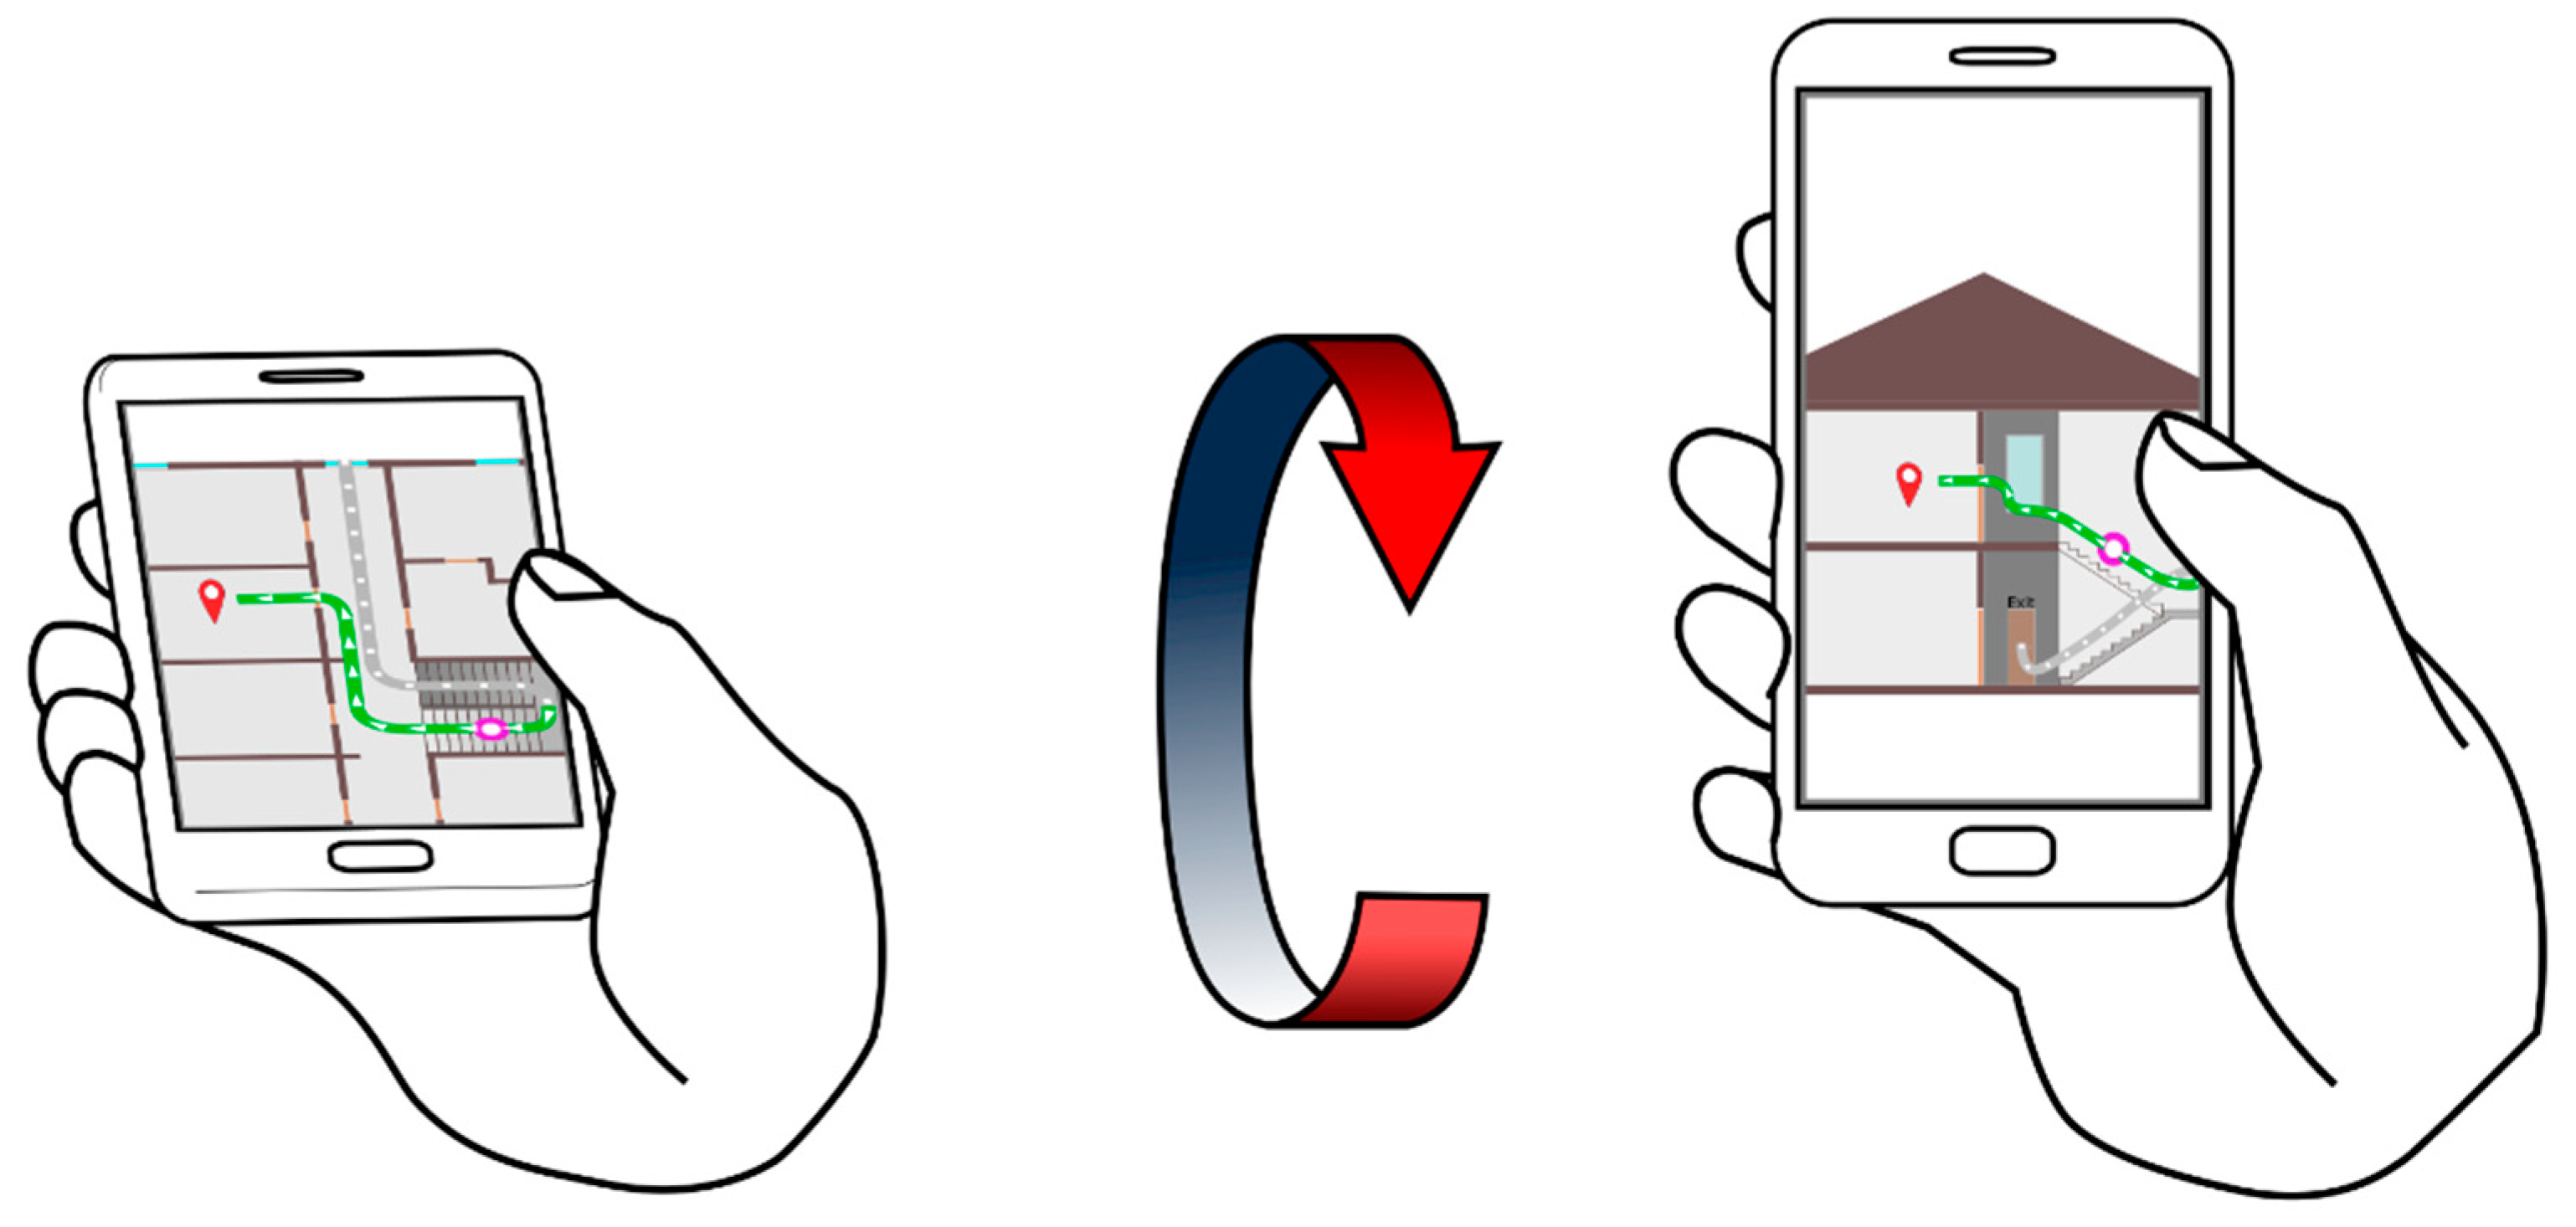
It is possible to switch between the view of a user’s position in the horizontal projection and the view in the vertical projection (against the background of the building’s section) by selecting this function in the application or, automatically, by horizontally or vertically (information from the sensors) changing the positioning of the mobile device. Horizontal positioning of the device will result in displaying the horizontal floor plan; vertical positioning of the device will result in displaying the appropriate vertical section of the building, which is also a new and practically unprecedented solution.
Figure 6 illustrates this schematically.
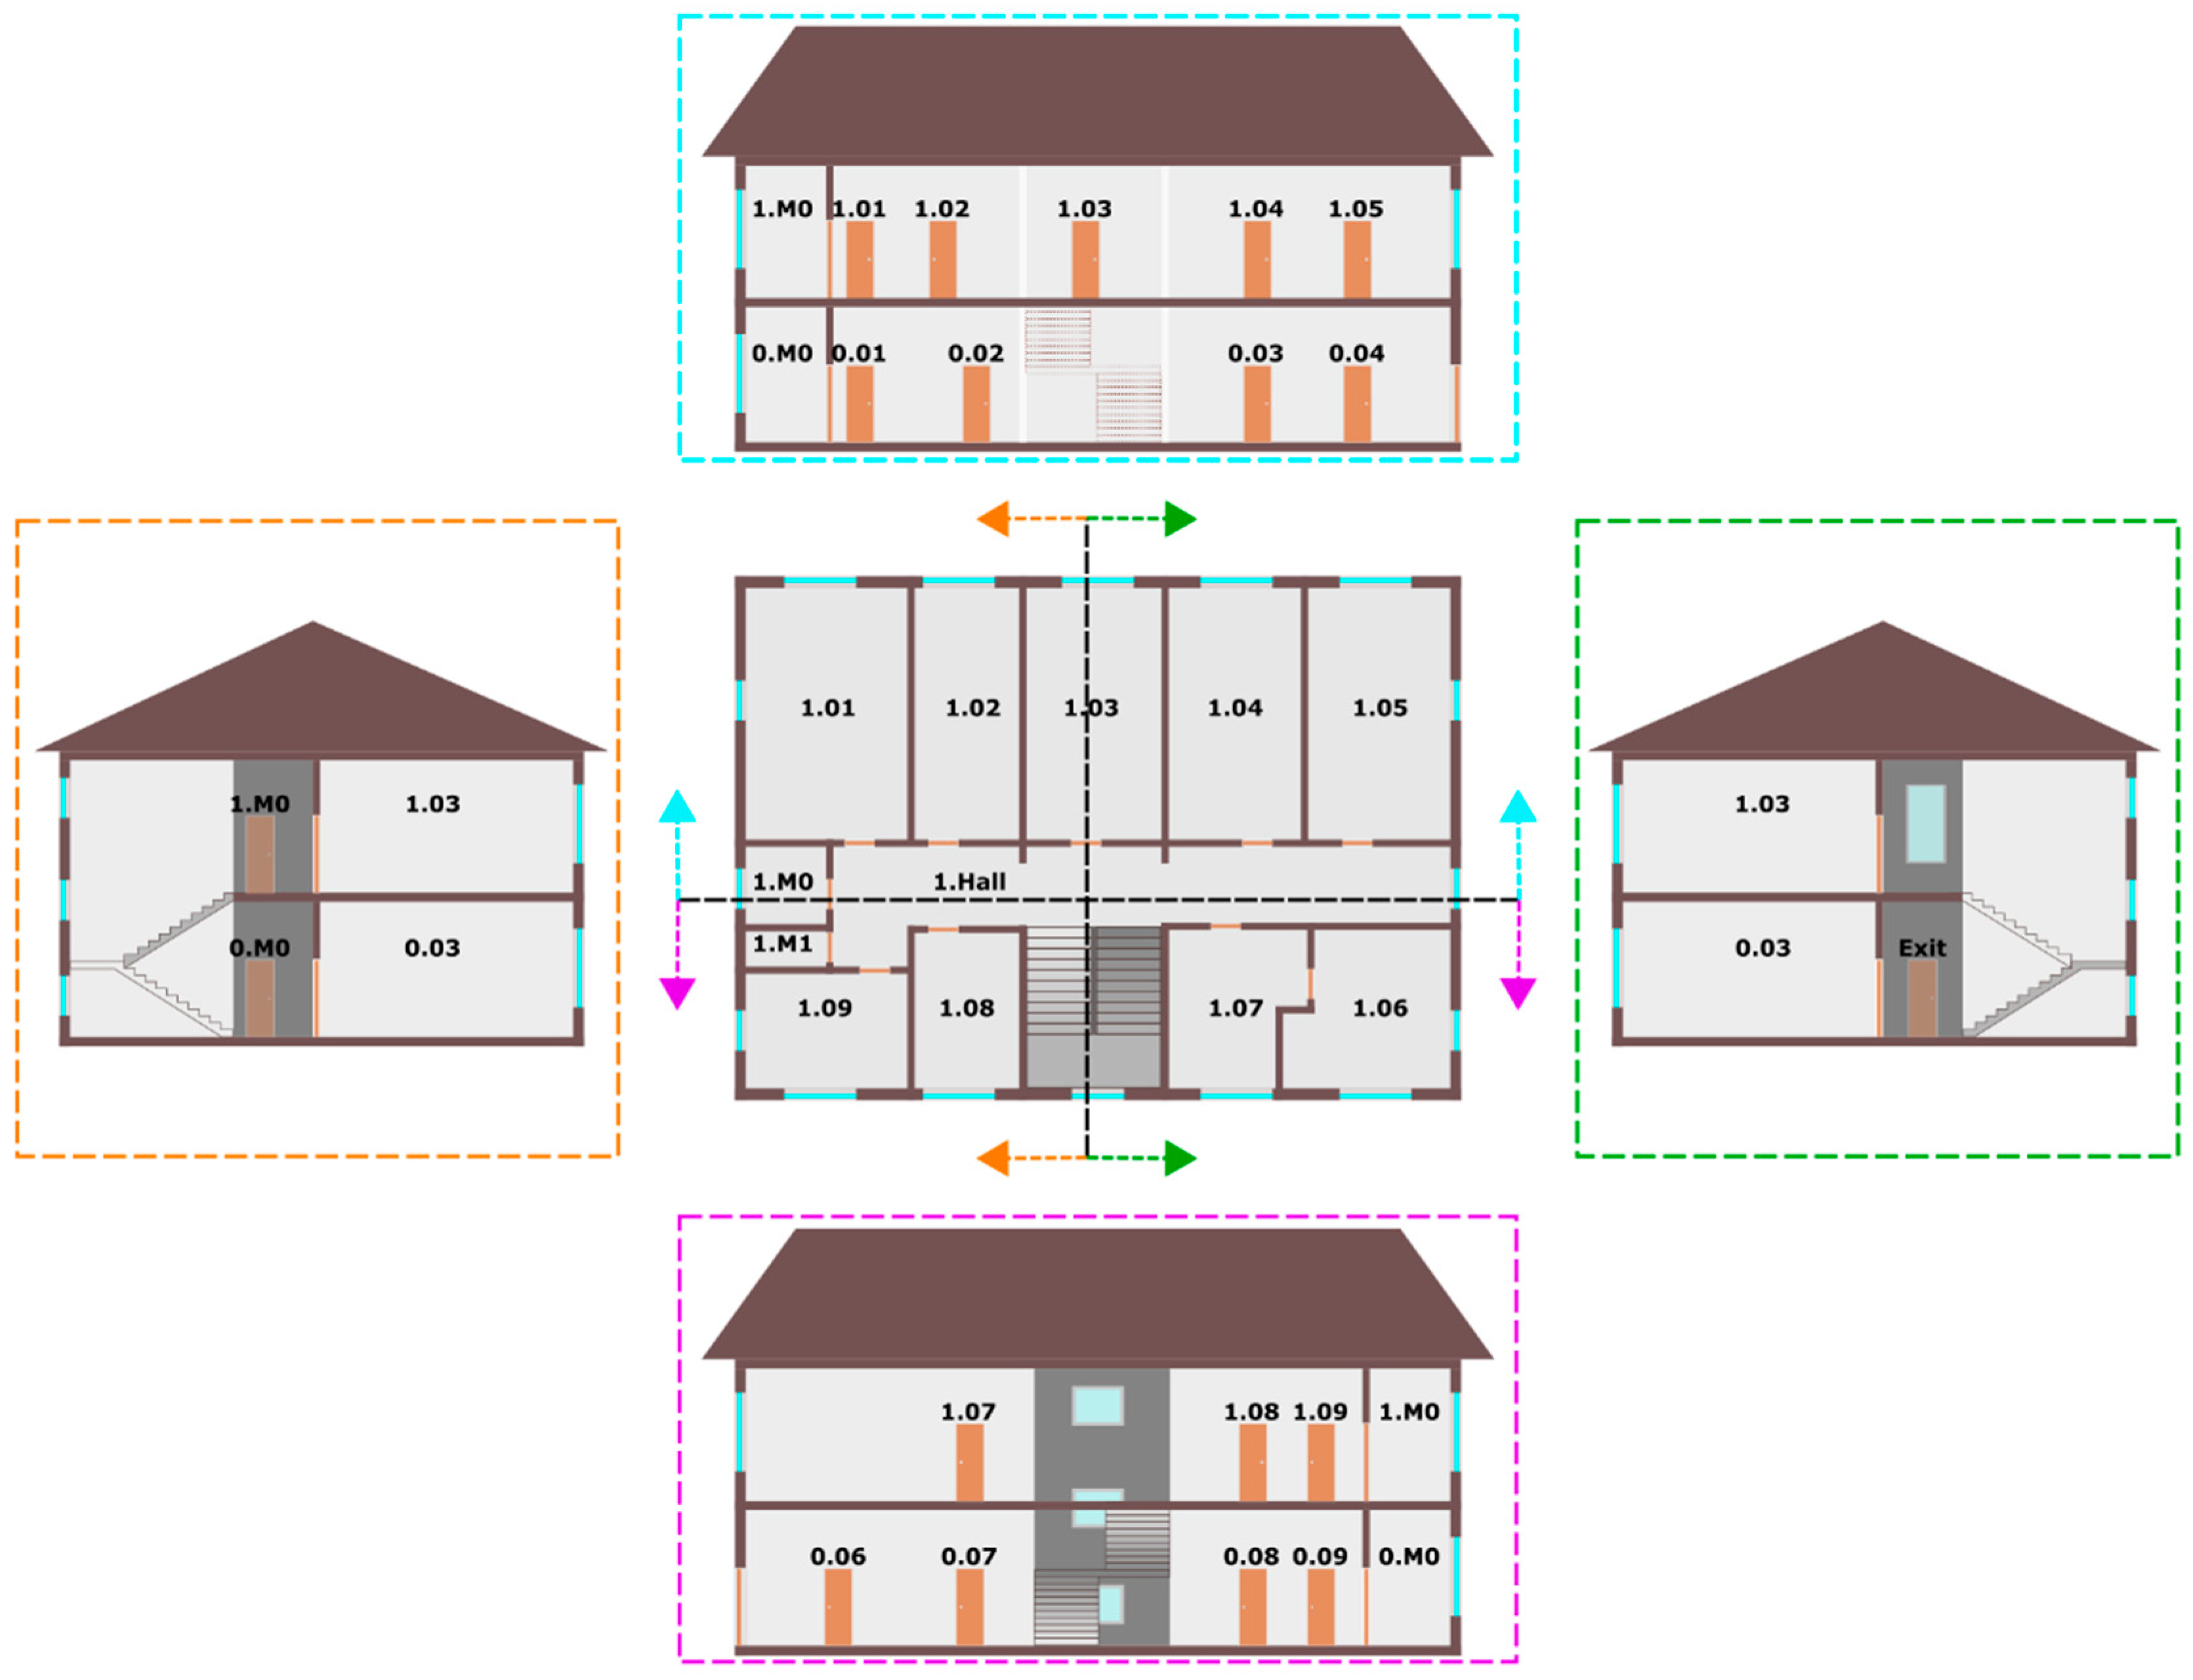
The development of an algorithm for an automatic selection of the appropriate section of the building is an important task.
Figure 7 illustrates the idea. Selecting the correct section occurs after the analysis of the user’s position and the direction of the user’s gaze; this is established based on data from the compass and the gyroscope with which the mobile device is equipped. The algorithm for selecting sections may use the typical algorithms for spatial analyses, commonly attributed to GIS technology.
Another essential element of the proposed solution is the manner of visualising the user’s route. The algorithm is used, based on several appropriately linked database representations of routes generated separately for the floor plan and the vertical cross-section.
4.2. A Uniform Reference System for Floor Plans and Cross-Sections
In CAD or BIM datasets, the coordinates are stored in orthogonal reference systems, which are local systems created separately for every building. Unlike most cartographic products, an object is not usually located in the global geodetic coordinate system. This paper does not discuss the problem of transforming coordinates from a local to a geodetic coordinate system. The usual way of defining the reference systems for architectural and construction drawings is ensuring that the axes of the building’s main walls on the floor plans are parallel to the x and y axes of the coordinate system. Cross-sections are not directly connected to the building’s local coordinate system; they have their local coordinate system. A connection with the floor plan is implemented by a user seeking common structural elements based on relevant knowledge and experience. This situation is different for BIM models, where a base is a consistent and standardised model of data and cross-sections can be generated on-demand from the model according to the user-defined criteria. The present study assumes that in most cases the source data for application will be architectural and construction drawings; thus, it is necessary to develop a method for connecting data from floor plans and data from cross-sections.
When working towards the optimal solution to this problem, the authors considered the following: the technology and model for recording data, the technology for delivering data to the navigation application, and the method for its presentation. The authors decided to analyse the vertical cross-sections of the building saved both in vector and raster forms. Therefore, the prototype application developed by the authors enables the manipulation of plans and sections in raster and vector forms by downloading them directly from the database.
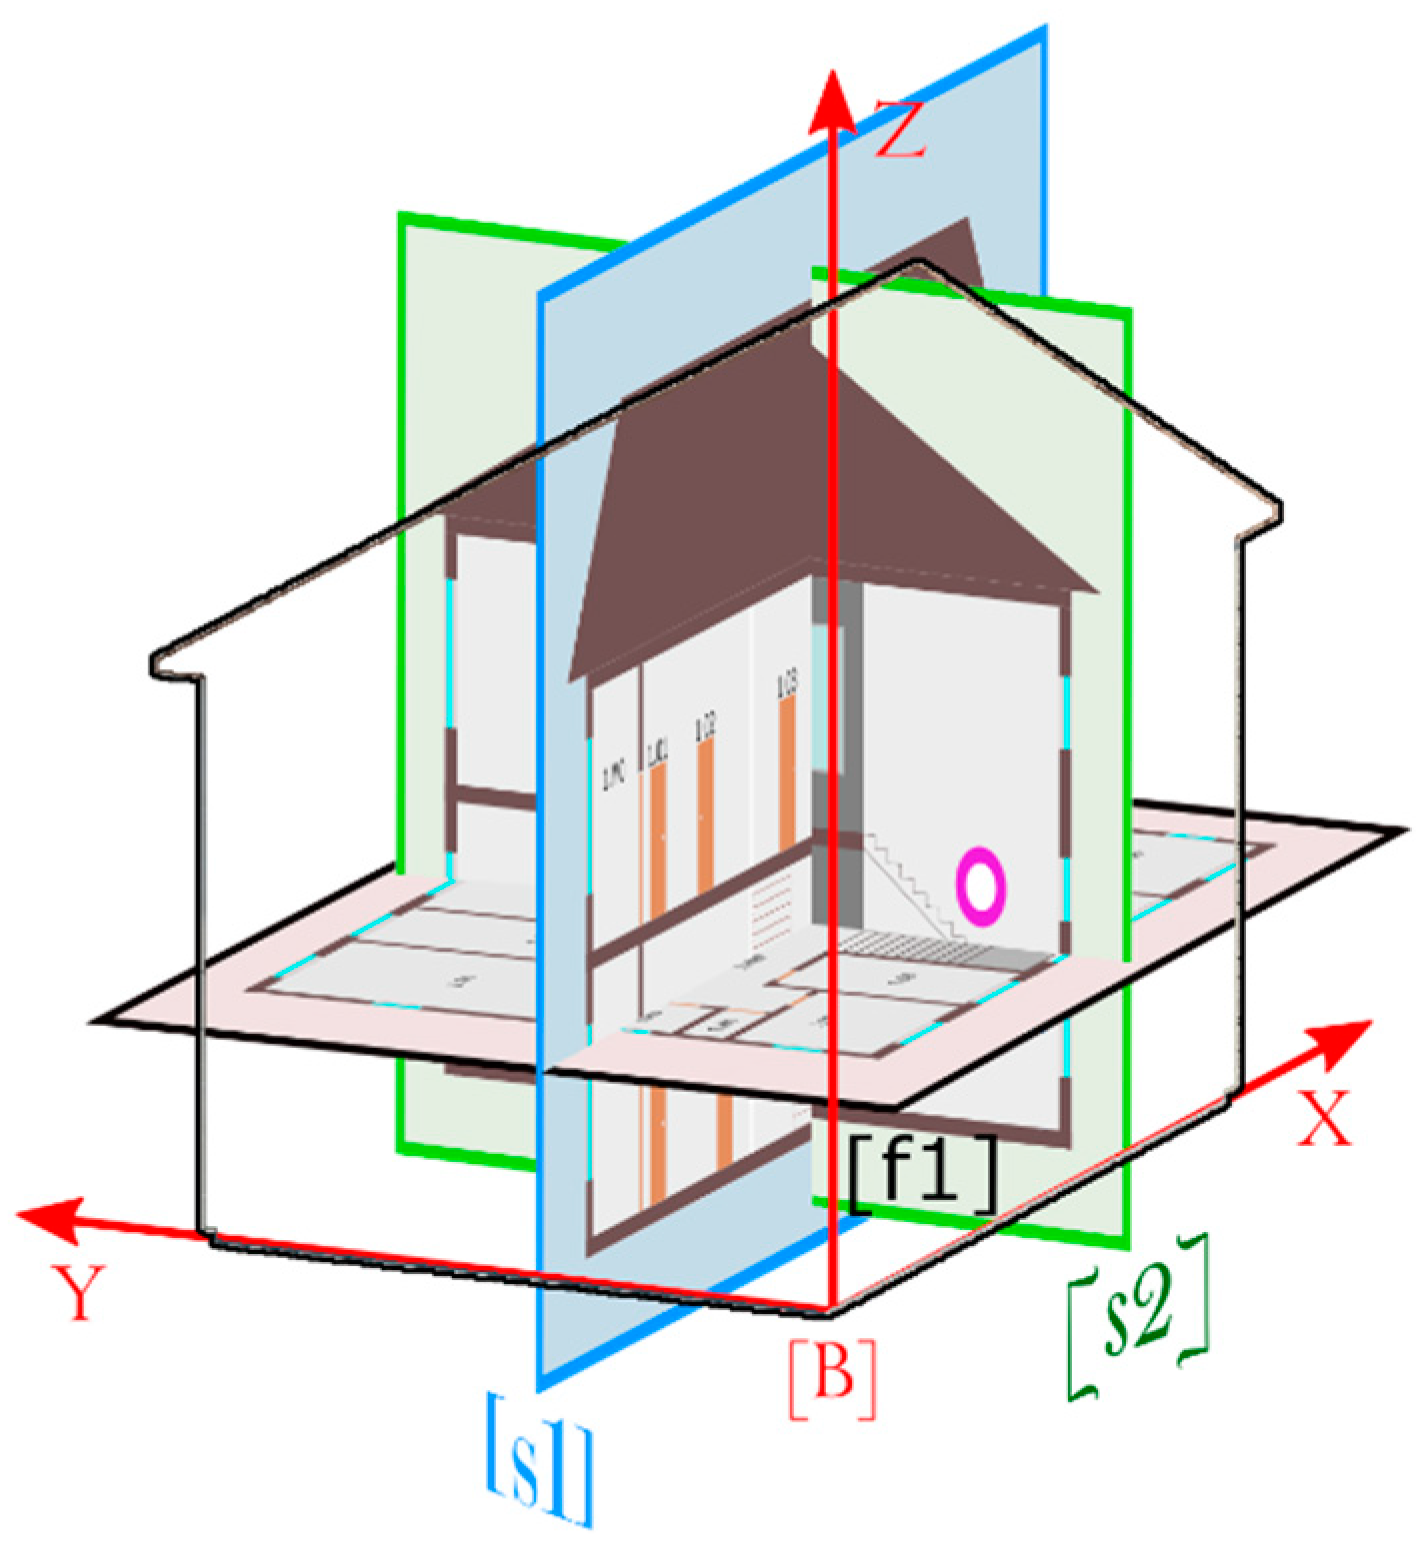
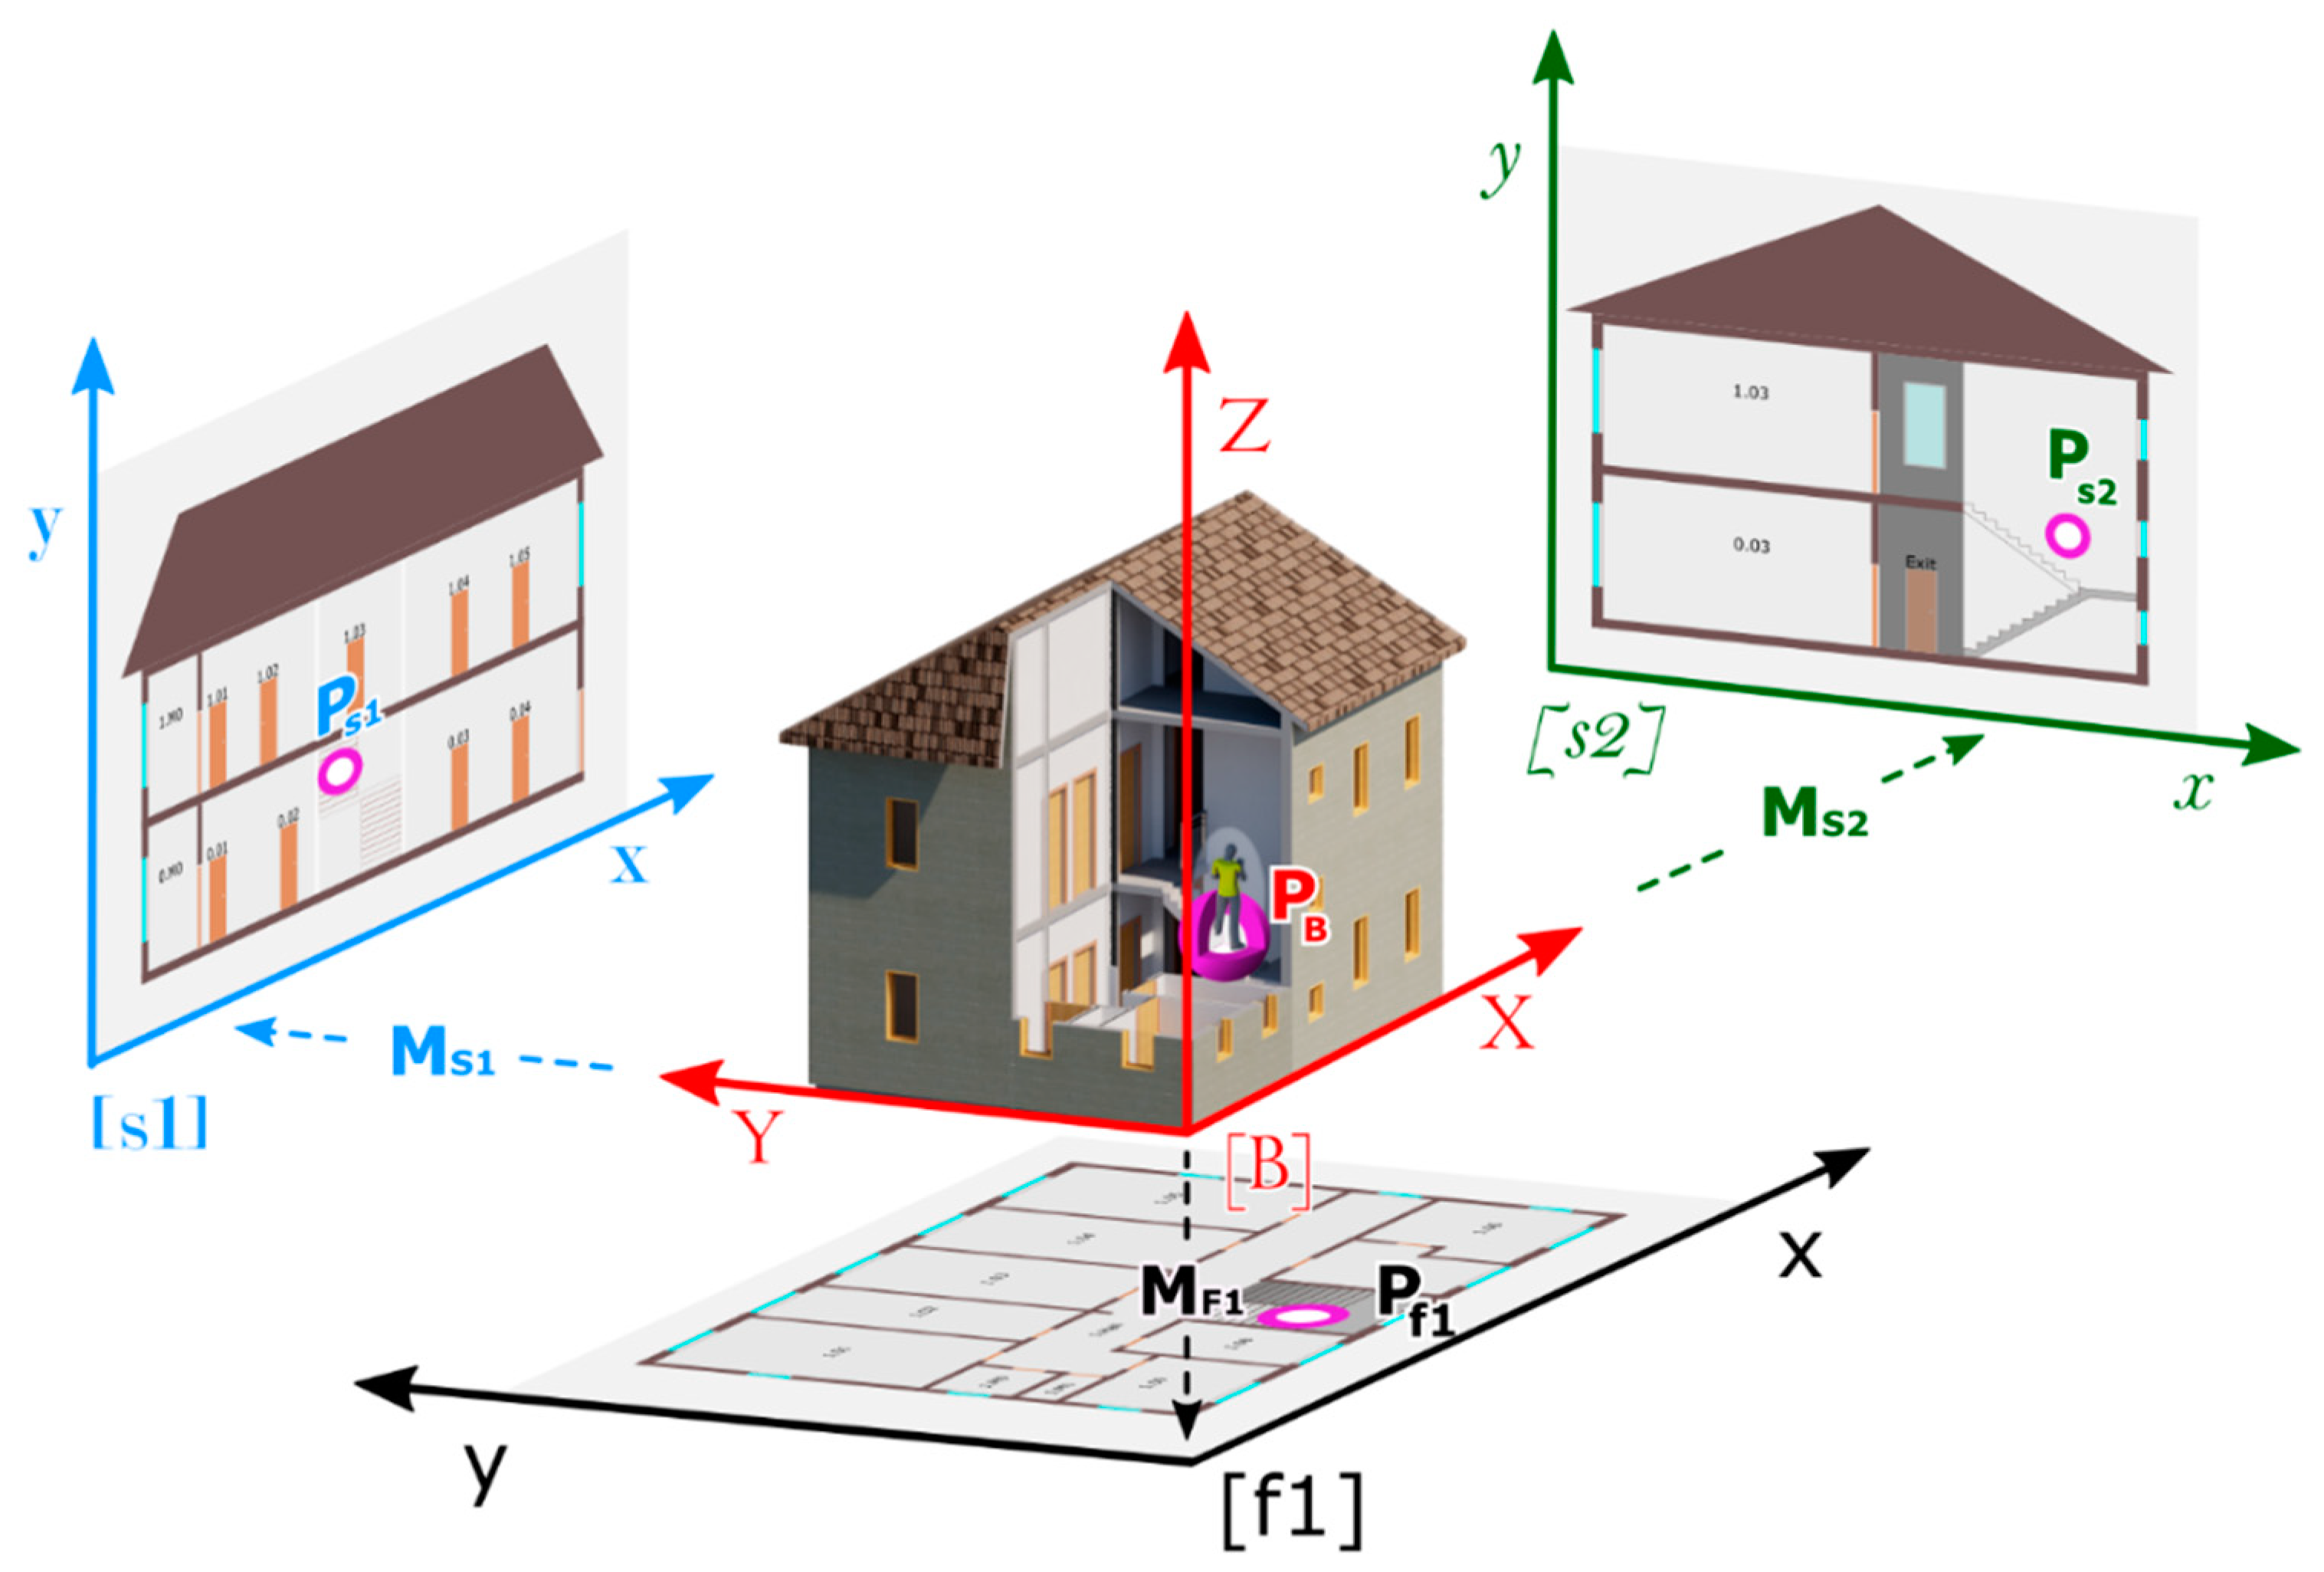
Another examined matter was the method of recording coordinates of a building’s cross-sections. One of the main variants analysed was embedding each projection and cross-section of a building in separate local reference systems and developing transformation matrices for one common reference system for the entire building (
Figure 8). The data are stored in 2D raster or vector forms in the GIS database. Below is the description of the procedure for this case. The symbols used in the description are summarised in
Table 1.
Displaying the user’s position (in the navigation application) requires the transformation of the P
B in the building’s 3D coordinate system into the P
f1 in the floor plan’s local coordinate system [f1], which can be written in the matrix calculus as follows: P
f1 = M
f1 * P
B. After searching for the correct section (chapter 3.4 presents detailed suggestions for the selection of sections), there is a transformation of the coordinates with a transformation matrix that enables the conversion of the coordinates from the floor plan’s or cross-section’s local coordinate system to the building’s local coordinate system. Taking into account the classifications in
Figure 8, if the section [s2] was chosen, then: P
s2 = M
s2 * P
B.
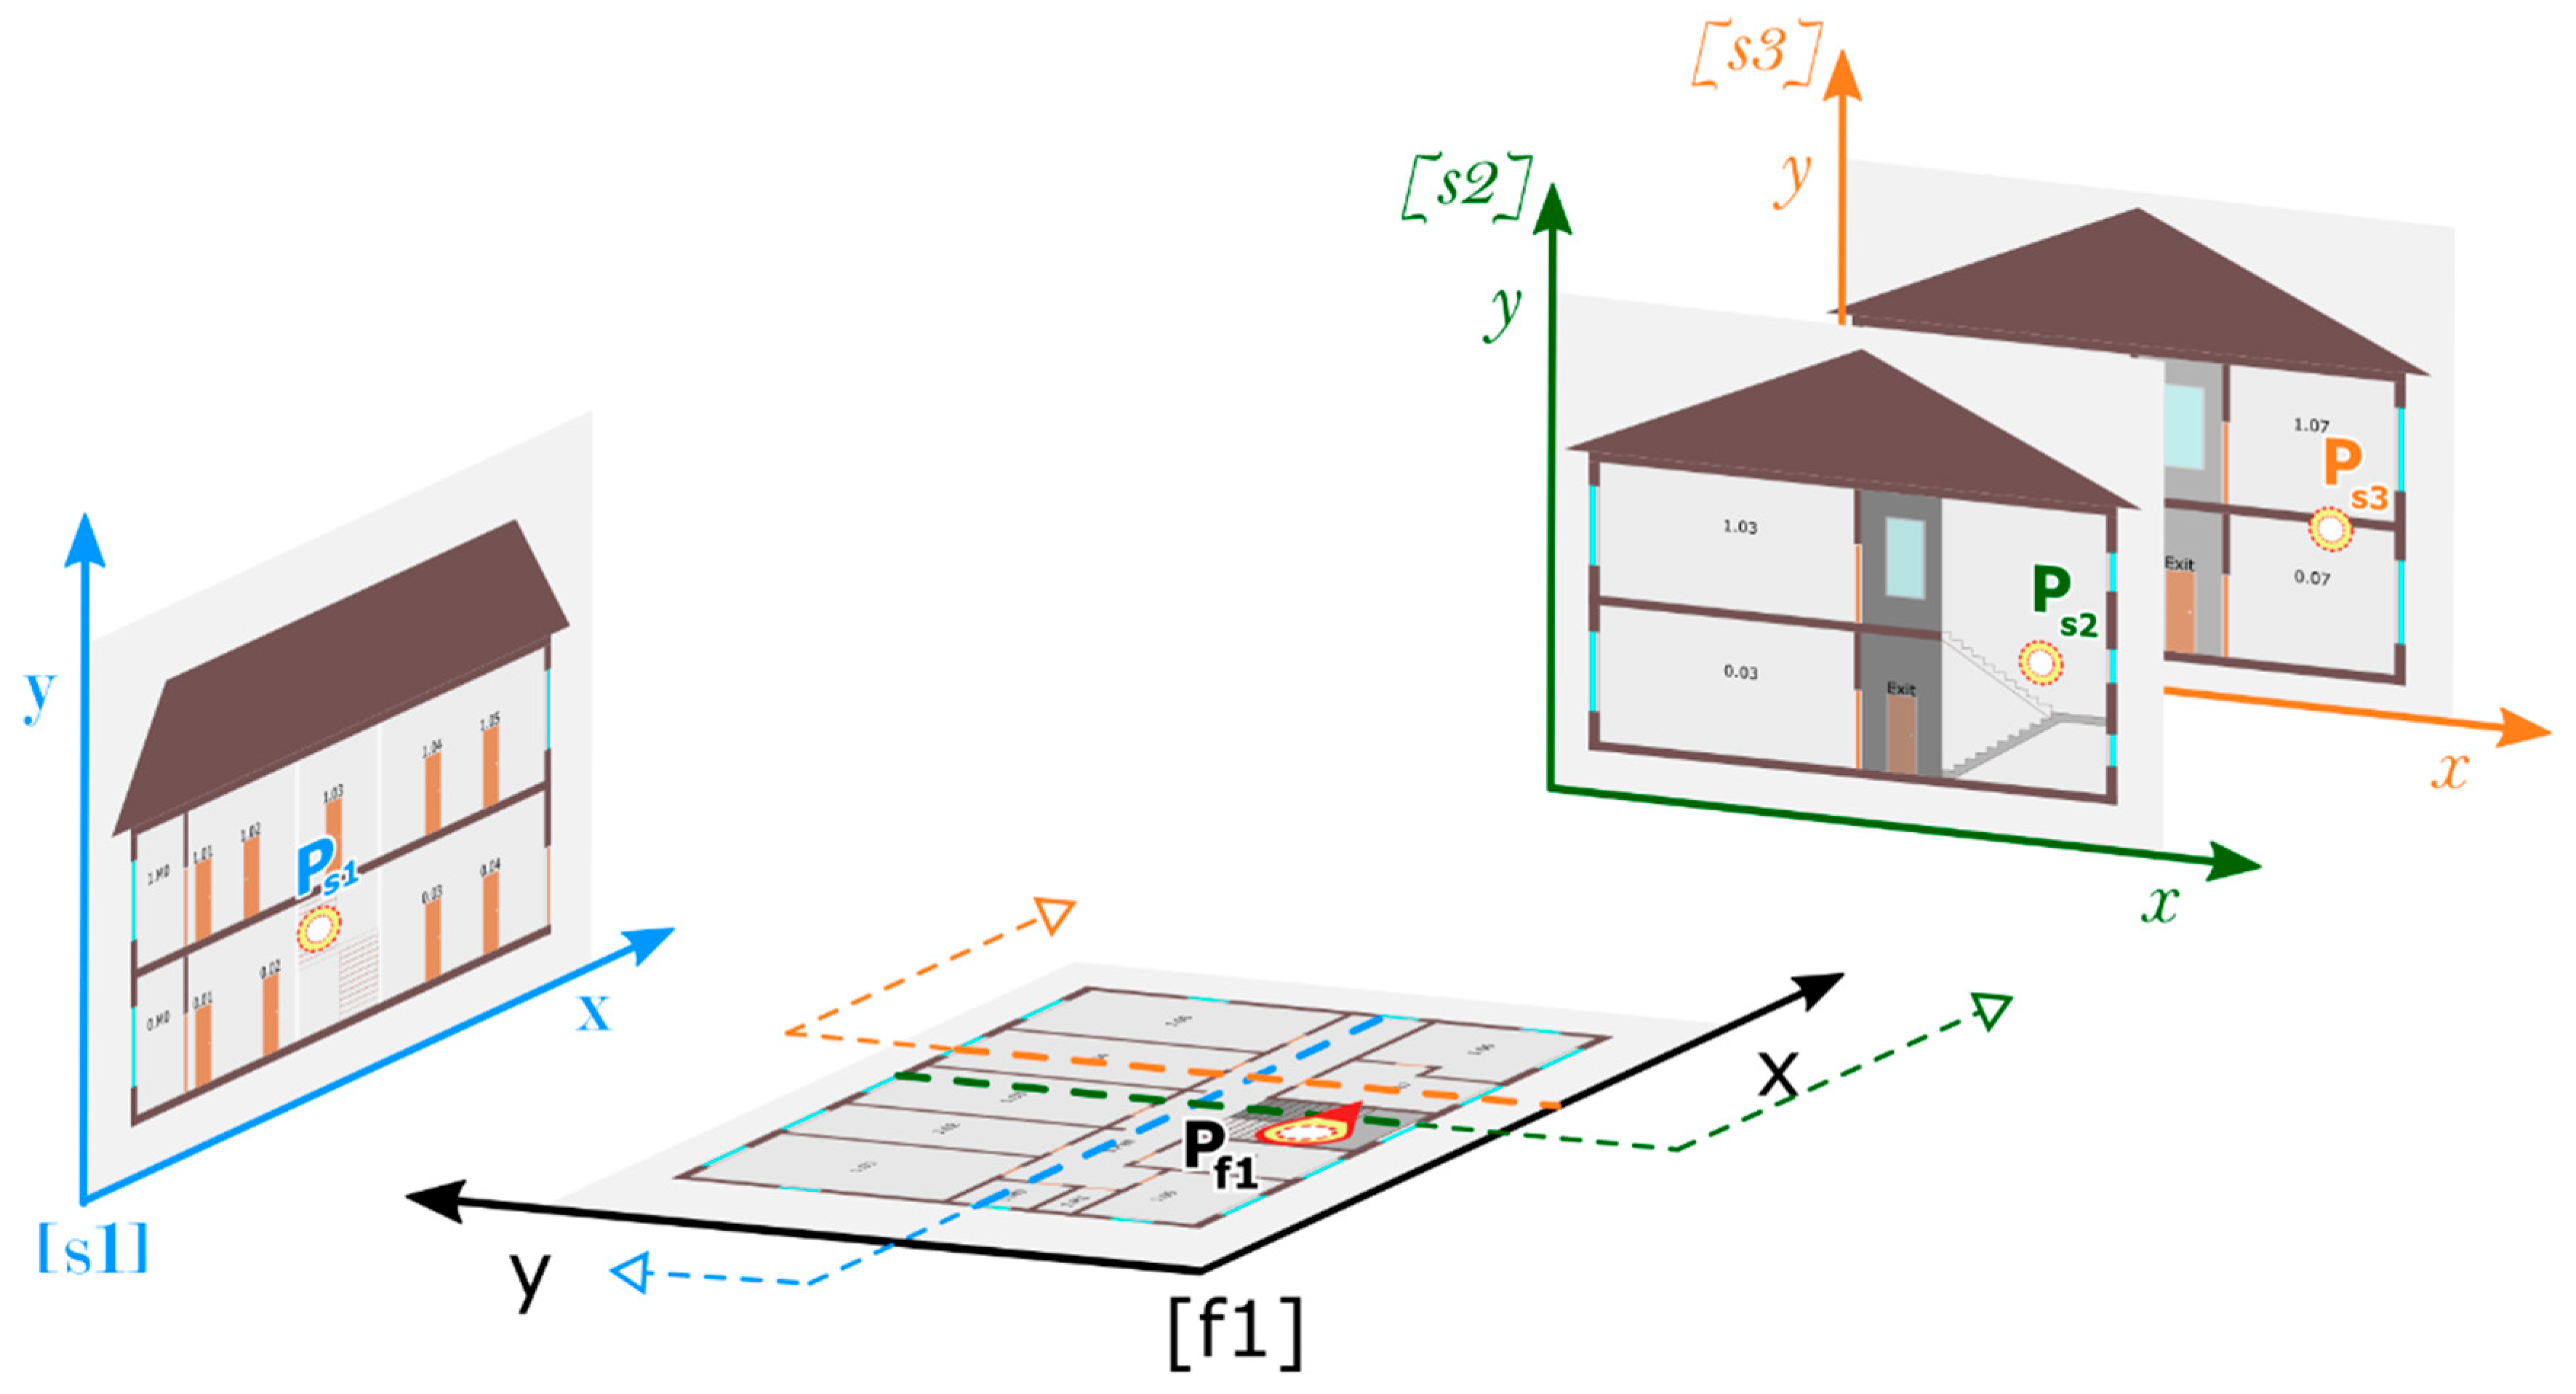
In the second analysed variant, all the data about the building, both floor plans, and sections are embedded in one common XYZ system (
Figure 9).
This approach, like the previous one, assumes that the data are stored in raster or vector forms as two-dimensional drawings in the database. In this case, the Mf1 (a matrix defining the method of transforming coordinates from the coordinate system of the building’s model [B] to the coordinate system of the floor plan [f1]) and Ms1 (a matrix determining the method of transforming coordinates from the coordinate system of the building’s model [B] to the coordinate system of the building’s cross-section [s1]) matrices are identity matrices.
4.3. The Methodology of Cartographic Visualisation
The proposed solution also requires developing a visualisation methodology. Because of the anticipated applications, the authors propose using the cartographic methodology both for the methods of presenting technical drawings (floor plans and vertical cross-sections) and for the presentation of navigational instructions. Among others, Gotlib and Wyszomirski in article [
30] discuss the issues of cartographic presentation of technical documentation of buildings, including floor plans and sections. However, Wang et al., in their article [
26] argue that the literature on the principles of cartographic visualisation for the navigational instructions in a building is highly limited. Subsequent versions of
Figure 8 emphasise some possible solutions for this type of visualisation.
It is possible to infer some elements of the proposed concept of cartographic visualisation from
Figure 5,
Figure 7, and
Figure 8.
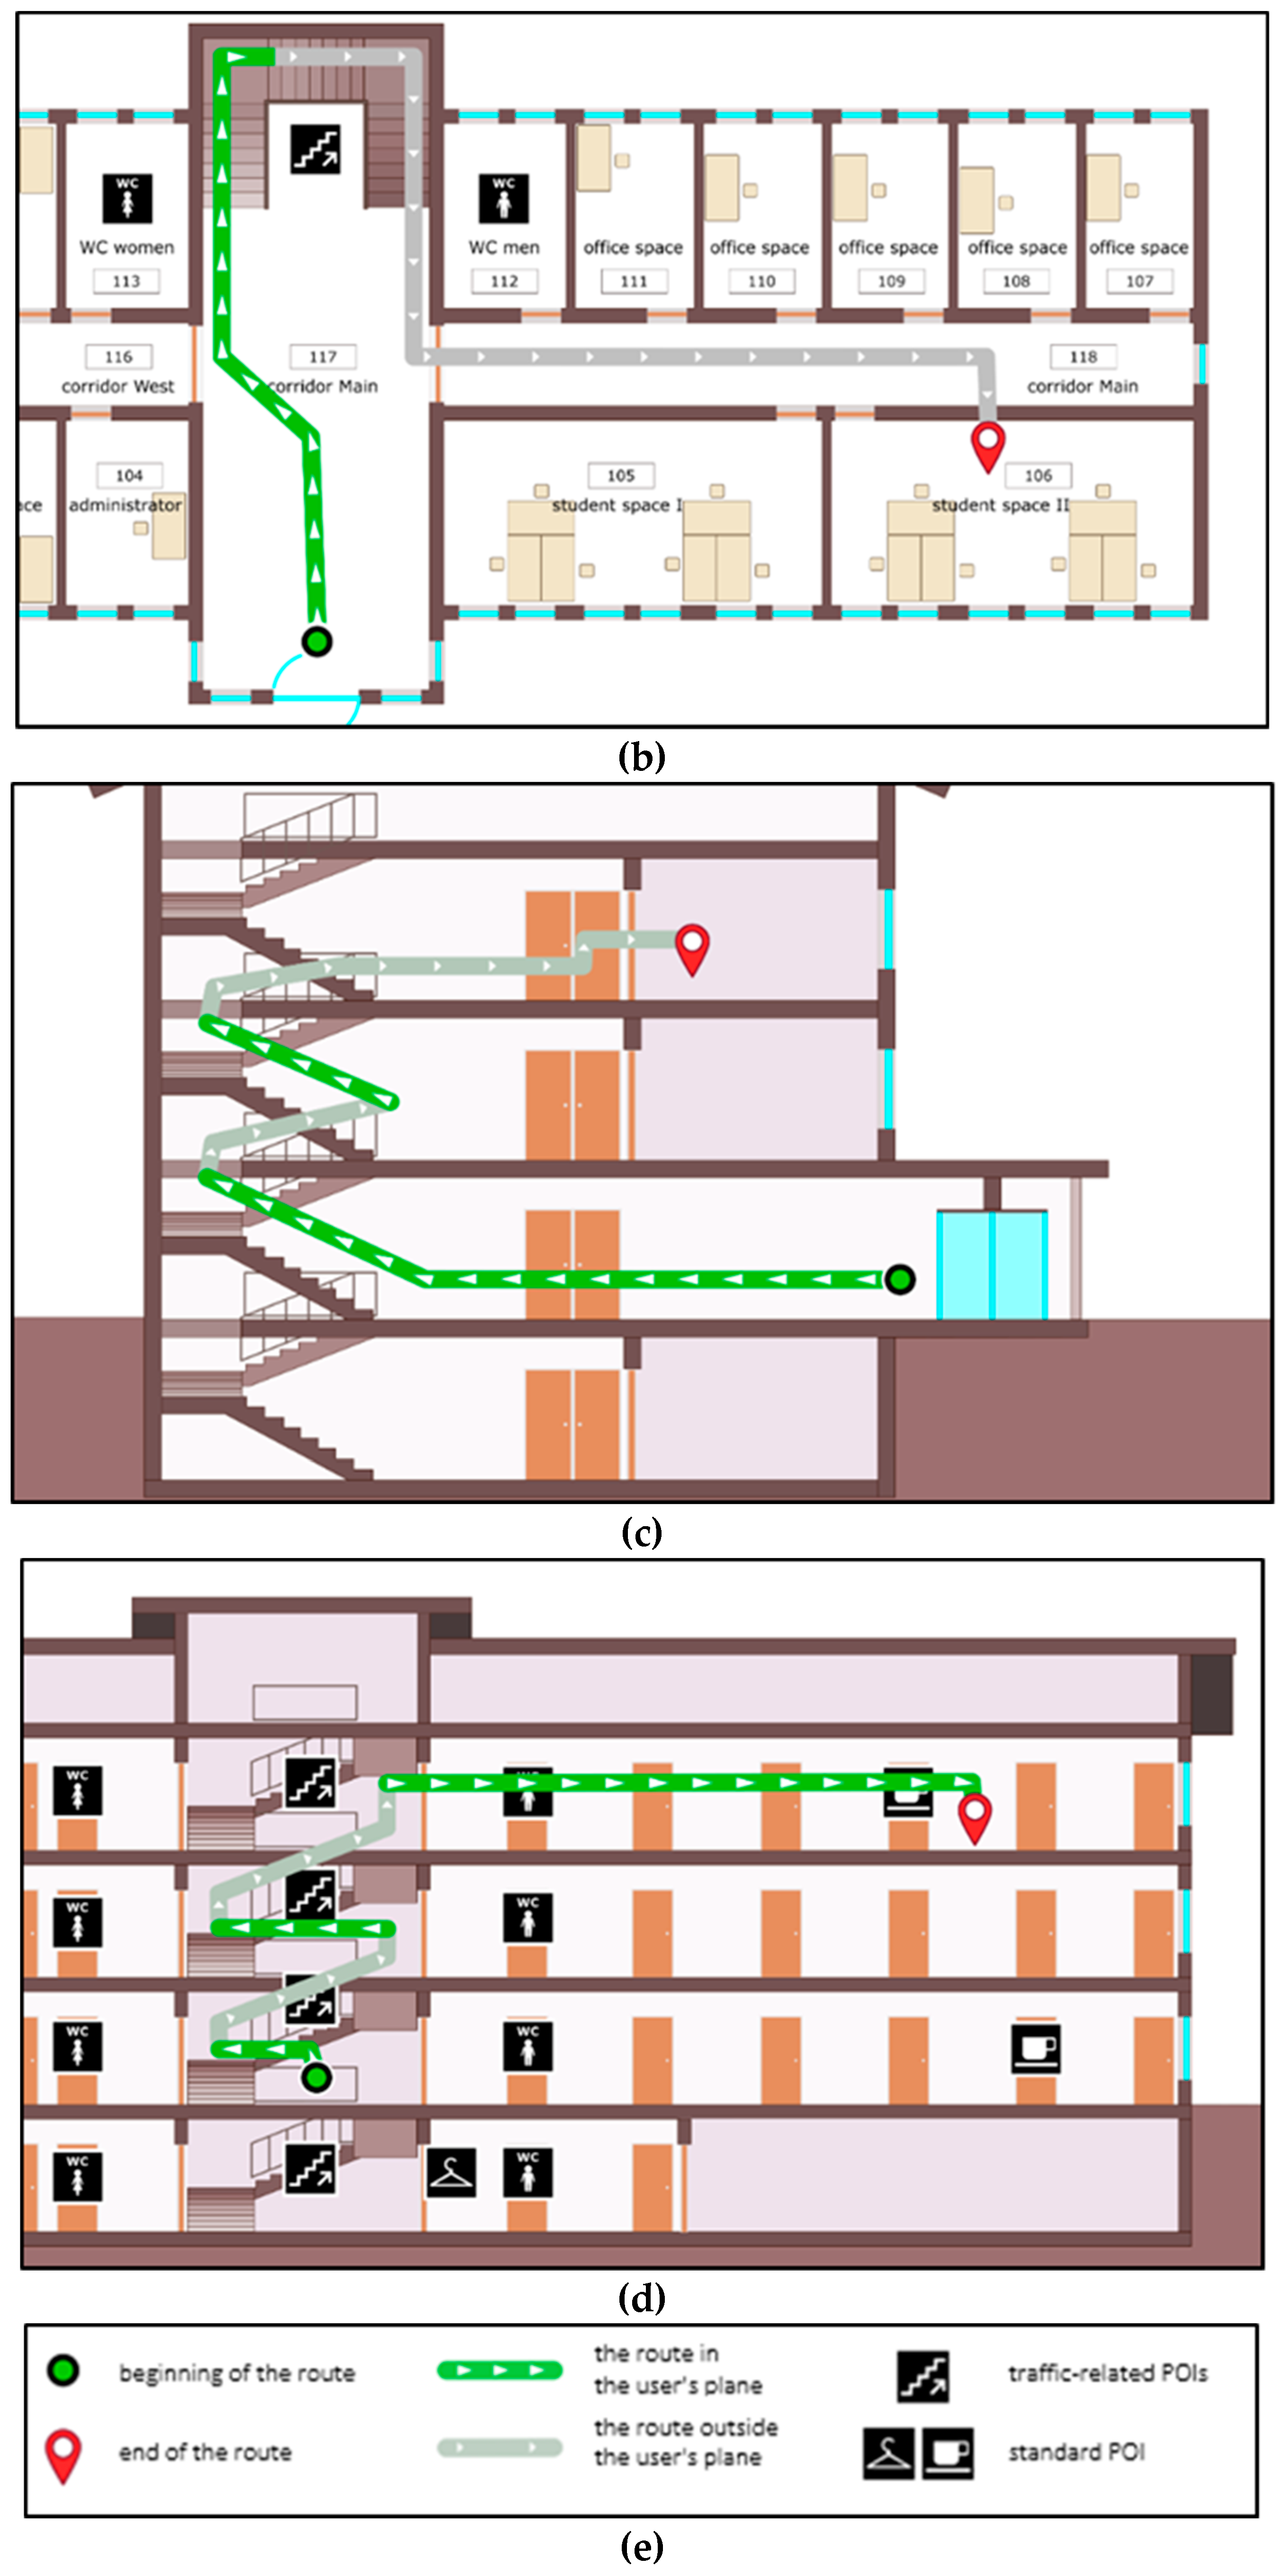
Figure 10 shows the method for visualising a route in a building: the part coming further or nearer in relation to the observer is drawn by an artificial “elevation of the route above the floor level.” The markings on the line with the arrowheads pointing down show the route approaching the observer; upwards to zooming out. The vertical cross-sections show the room numbers. It is suggested to create the distance between rooms and a given section by changing the label size (a room number) or by saturating the colour of the objects [
31]. As the distance of the room from the section increases, the label size and the saturation of the room’s walls decrease. The authors abstained from using the graphic variable “saturation,” considering that this way of presenting information may prove unreadable to a mobile application user (a small screen, movement, et cetera). This approach is in accordance with the general principles of the mobile cartographic presentation presented in [
32]. The correct use of graphic variables is shown in
Figure 10b-–d, while reading difficulties may occur in the case shown in
Figure 10a.
4.4. Selection of Vertical Cross-Sections
In the most straightforward approach, the navigation application can only use the main cross-sections of the building that correspond to their façades. Well-prepared architectural and construction documentation either contains or enables generating more sections, depending on the nature and complexity of the building. These cross-sections can be used in more advanced applications. In the most complex case, one may assume the use of cross-sections coinciding with the planes of most of the main walls of the building. The cross-section selection process can be aided by visibility analysis based on a visibility graph. Grasso et al., discussed this comprehensive topic in [
33]. Another important direction of consideration is the use of automatic cross-section generation. In this solution, an approach analogous to the methods of automatic schematic map generation can be used [
34]. There is a separate issue of determining which of the cross-sections available at a given moment of the navigation process is more useful to the user: whether it is the closest one or, for example, the cross-section showing the building’s façade.
Figure 11 depicts the situation of selecting the closest section, based on the user’s position and the direction of their gaze.
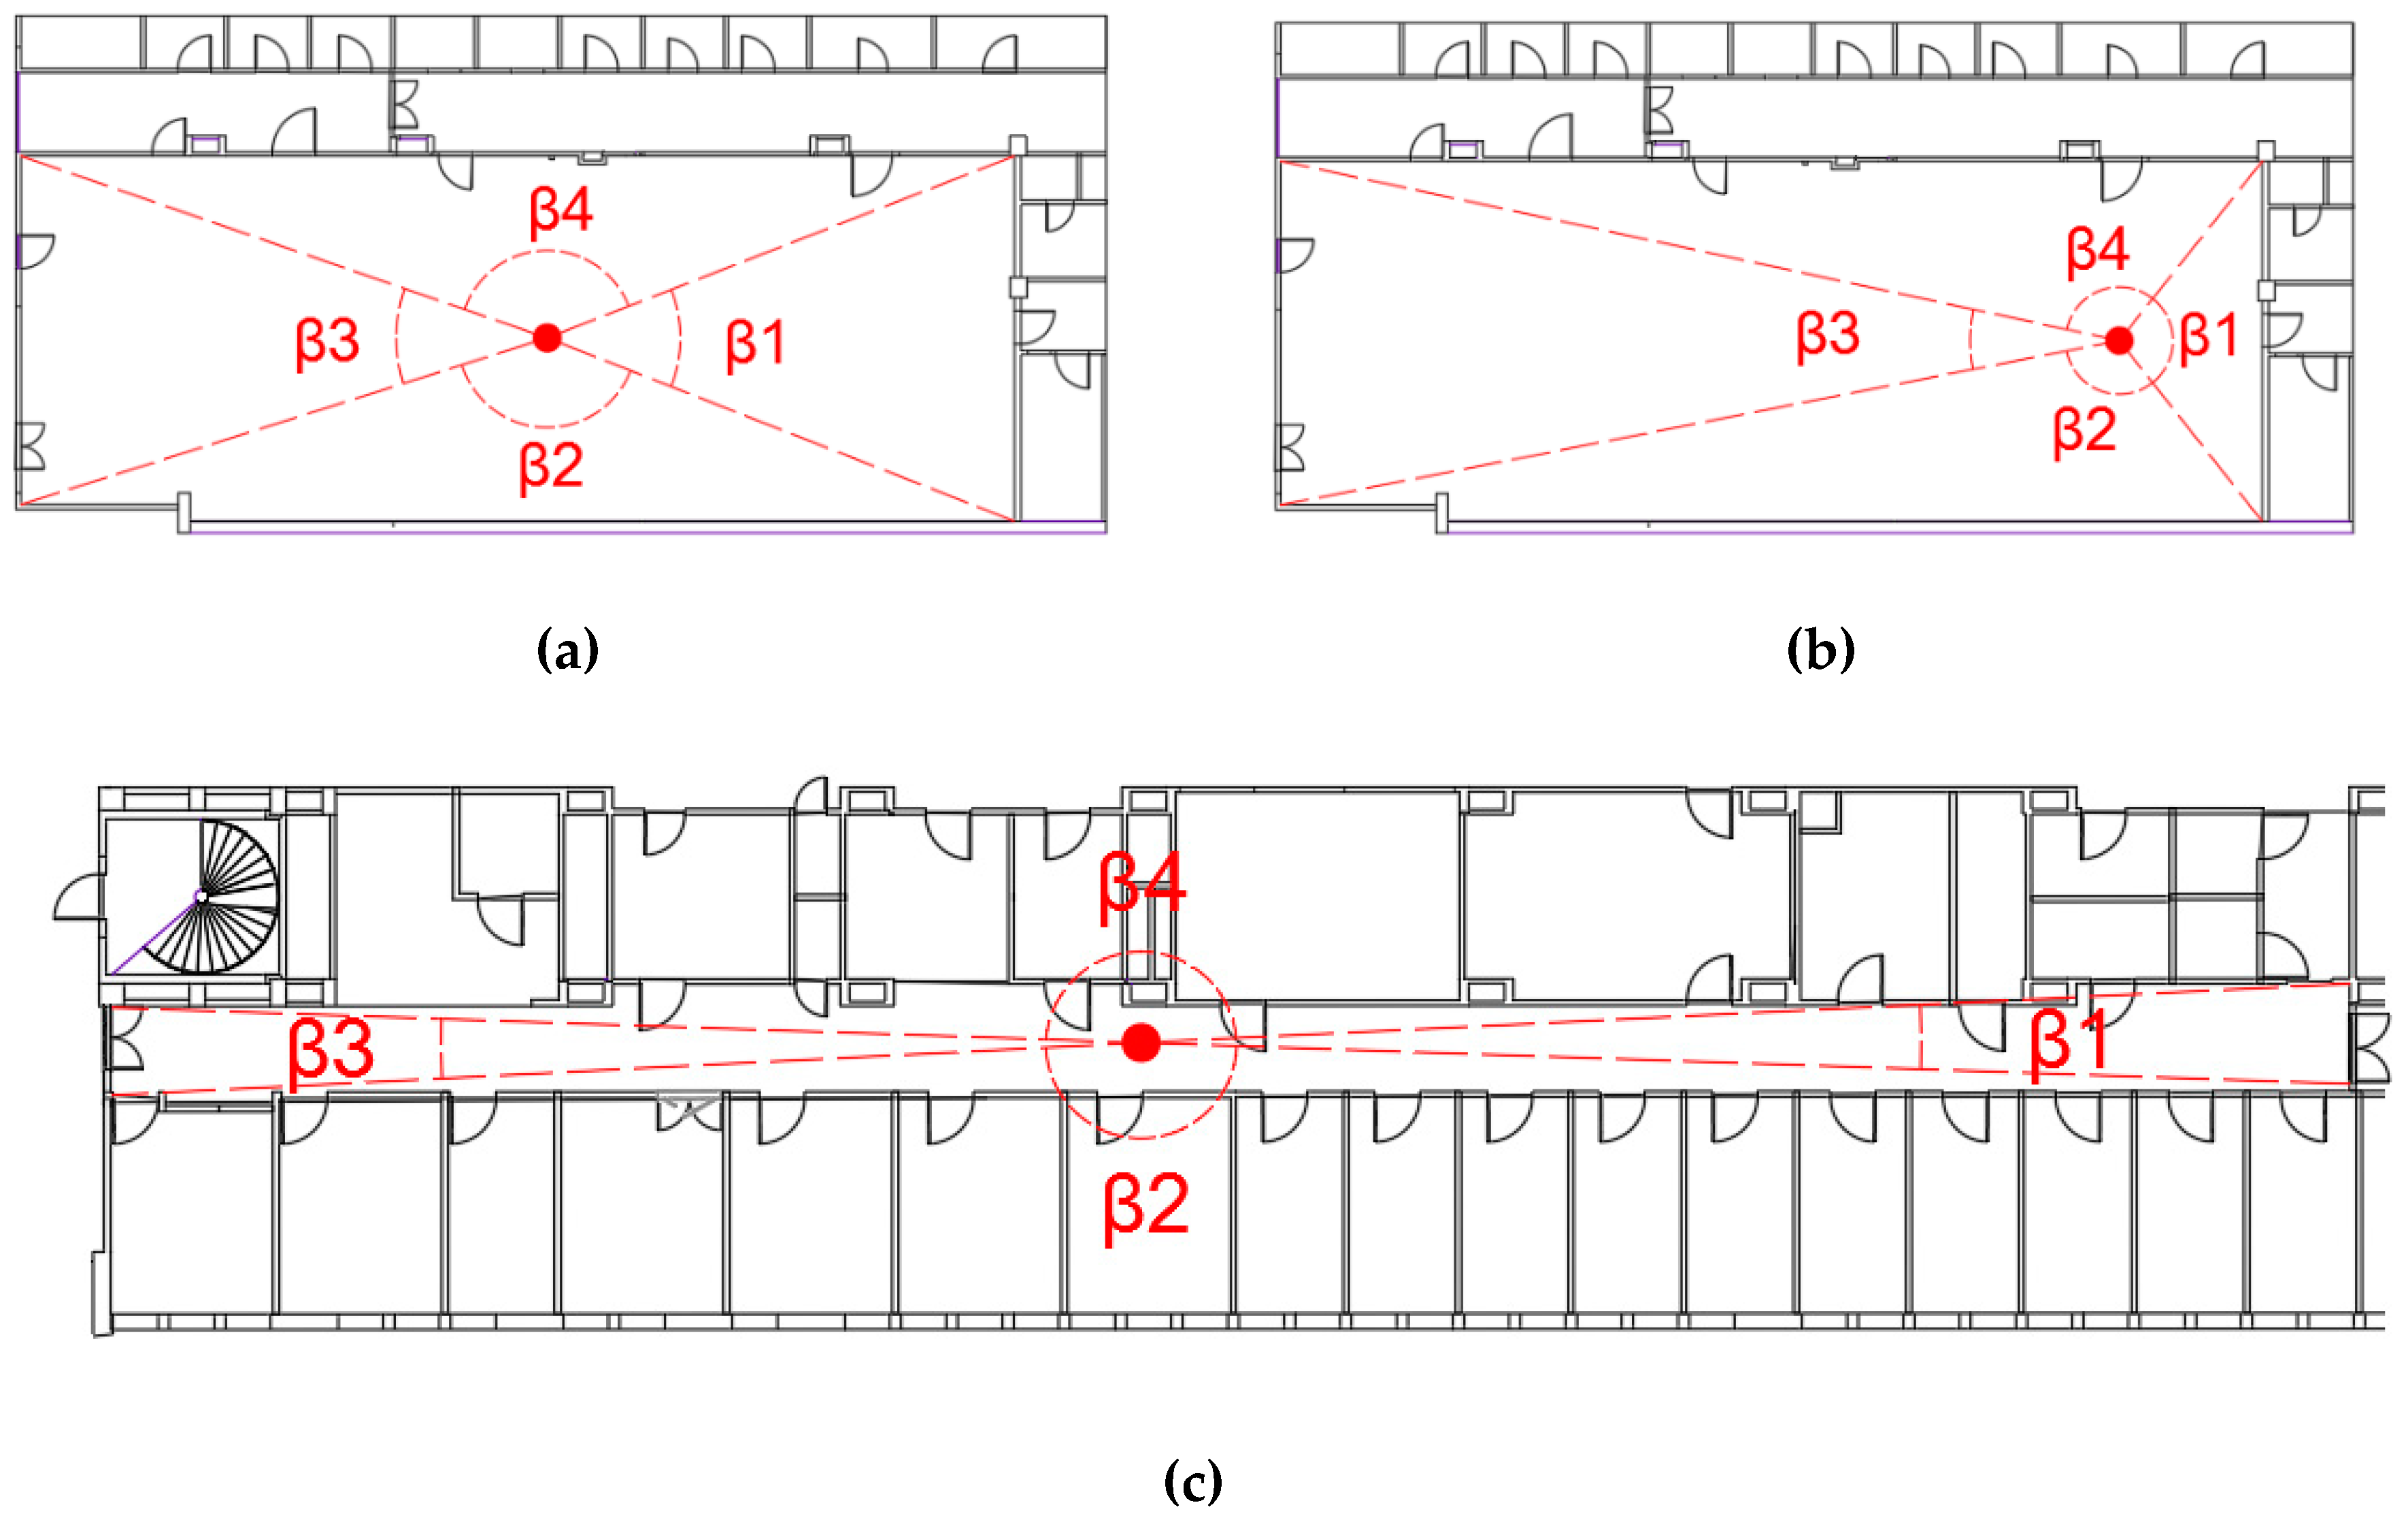
When adopting a somewhat more complex approach, the selection of the correct vertical cross-sections depends not only on the user’s position and the direction of their gaze but also on the shape of the room itself. One may consider the simplest situation when the user is near the centre of a room, in which the proportions of the length of the walls are close to 1:1 and certainly do not exceed 1:2 (
Figure 12a). In this case, the angles between the directions of the user’s position to both corners of one wall marked as β1 ... β4 are not significantly different. When the user “gazes” perpendicularly to the wall or the direction of their gaze is tilted from the perpendicular direction by an angle not exceeding +/−45 degrees, it is best to show the section located in front of the user. The value of the critical angle should be smaller for rooms with more corners, which can be expressed by the formula:
where:
O—the maximum deviation from the perpendicular direction at which the section should be displayed,
L—the number of corners in the room.
If the user approaches one of the walls, the method for selecting the cross-sections described above may not yield satisfactory results. The angle β1 is now much greater than in the previous example, whereas the angle β3 is much smaller (
Figure 12b). Using the same algorithm may result in a situation where the user is still facing the west wall, and the system is already displaying a cross-section showing the north wall. It is even more evident in the example of a corridor with a significantly elongated shape (
Figure 12c). However, when using the alternative algorithm that considers the length of particular walls and chooses the values of the maximum angles of deviation on this basis, some walls, e.g., shorter walls in the corridor in
Figure 12c, may never be shown. Bearing this in mind and having conducted the experiments, the authors decided to adhere to one method of determining the maximum values of the angles of deviation from the perpendicular direction for all the cases.
4.5. Developing a Prototype
The development of the prototype required proposing a structure for the database, methods for obtaining data on the interior of buildings, and an algorithm for the operation of the navigation application, including an algorithm for selecting the vertical cross-sections to display by the user’s location and the room shape. For this purpose, the authors proposed utilizing a spatial database using PostgreSQL with the PostGIS extension. Floor plans were stored in the geodetic coordinate system, while raster and vector vertical cross-sections were stored in the local coordinate systems.
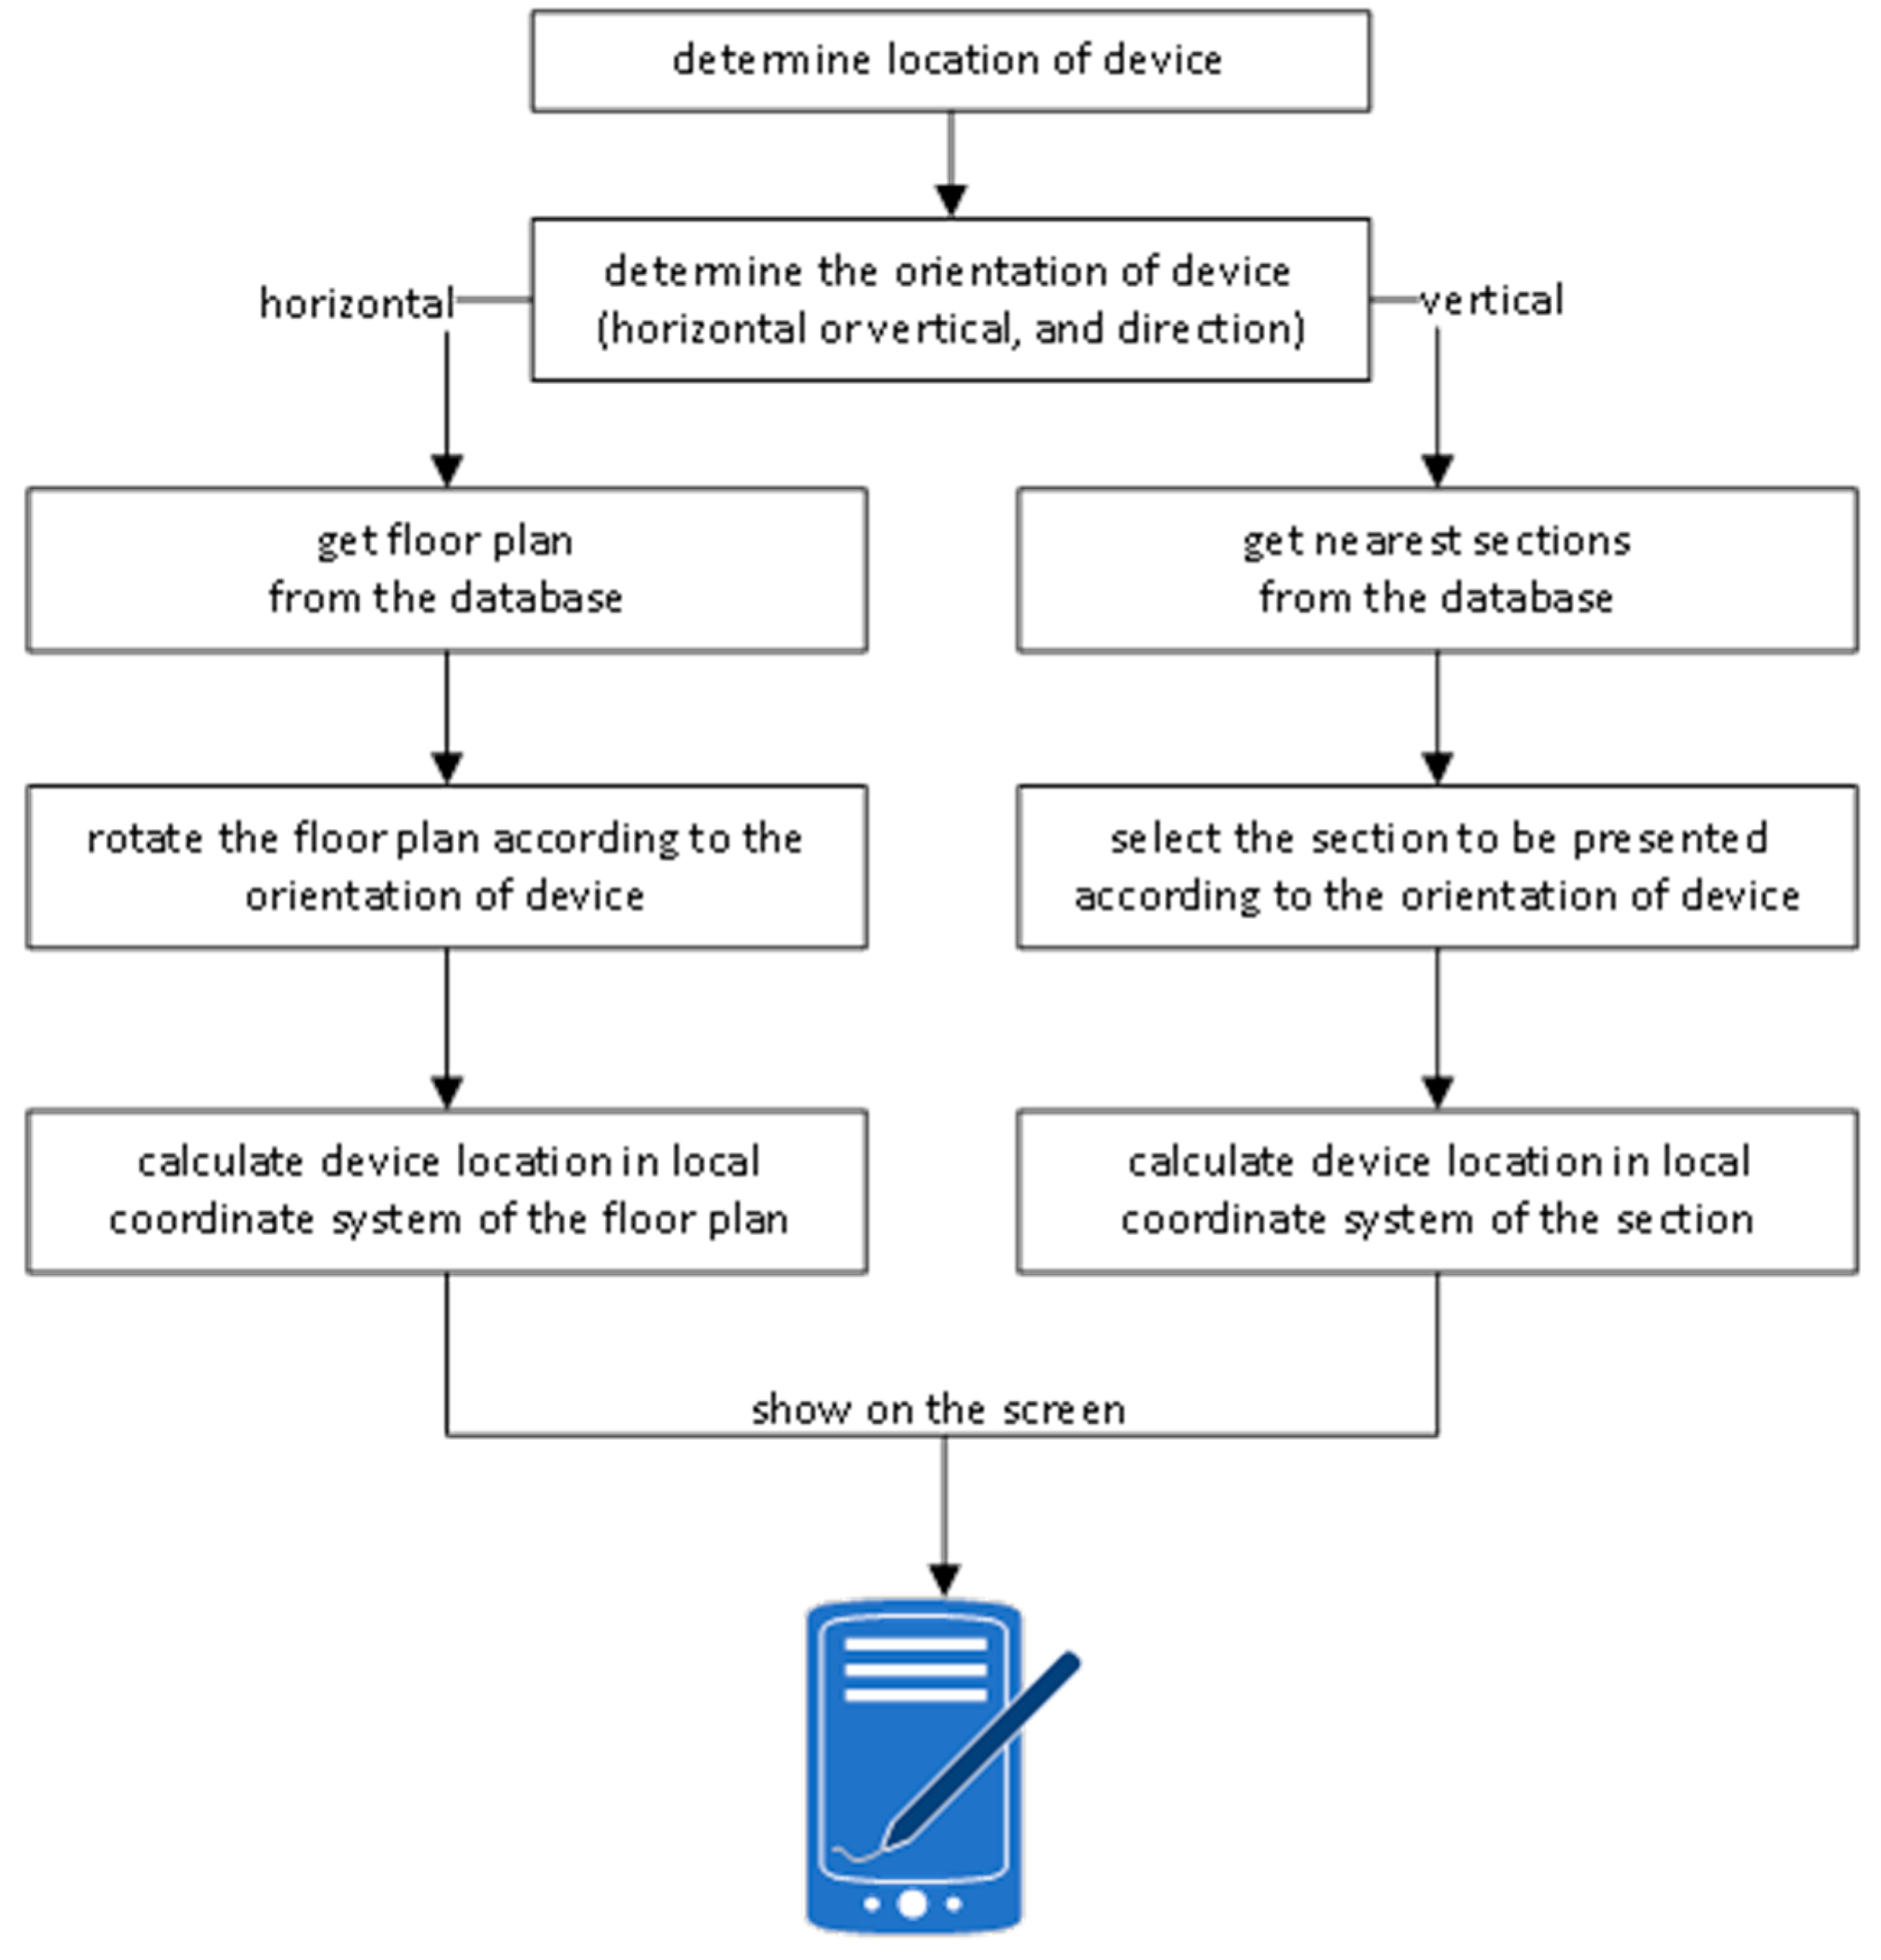
Figure 13 shows the general algorithm for the 2D+ visualisation function in the prototype solution.
The only purpose of the prototype application is to simulate the 2D+ visualisation process. All input data are fictitious: information regarding the user’s location in the local coordinate system of the building, the direction of the device (in other words, the direction in which the user is moving), and the device’s orientation (vertical or horizontal, see
Figure 6). Based on the data, the right floor plan (horizontal orientation of the device) or the corresponding vertical cross-section (vertical orientation of the device) is loaded.
The relevant floor plan is selected based on the user’s current location, as defined in the XYZ coordinate system. The Z coordinate determines the floor on which the user is positioned, so as to display the appropriate floor drawing. Then, based on the user’s simulated direction of movement, the floor drawing is rotated to adjust the plan to the direction. Afterward, the user’s current position in the local coordinate system is calculated, and a vector drawing in SVG format (Scalable Vector Graphics) is generated, showing the user’s position on the floor plan.
When the device’s orientation changes to vertical, based on the user’s current location specified in the XYZ coordinate system and the direction of movement, the correct section of the building is selected from the database and, together with the user’s position, is presented in the vector form.
5. Discussion
The proposed visualisation method may complement the current presentations typically used in 2D indoor navigation applications or 3D applications that do not have a complete set of 3D models.
Table 2 presents a comparison of the functional features of the proposed solution compared to those currently used.
The proposed approach may provide significant simplification for software designers and developers; it may also simplify the data acquisition system (while maintaining the application’s high performance). What is characteristic of the proposed solution is that applications that use it can be scalable, i.e., only using floor plans, or using floor plans and vertical cross-sections presented on typical architectural and construction drawings or using floor plans and any number of vertical cross-sections (depending on their availability). There is no need to introduce changes in the application to obtain increasingly complex or useful visualisations; it is enough to have access to new and more extensive versions of the database. This is an advantage of the proposed solution.
Some simplifications have been adopted at the current stage of research—for example, using only cross-sections perpendicular to the walls of the building. For buildings where the walls do not intersect at 90 degrees, using oblique cross-sections may be possible or even necessary. What is more, the authors did not address the problem of choosing vertical cross-sections when taking into account the user’s preferences, e.g., nearer or further from the user’s current position. It is not always the case that the closest section is the best at showing the user’s location in the building. Sometimes displaying the user’s position and the planned route against the background of the building façade (i.e., the section furthest from the user) provides a better spatial context. There will be further research into this area.
Another critical issue that goes beyond the scope of this article is the method of automated cross-section generation when a full 3D model of a building, e.g., a BIM or a GIS model, is available. In such a case, the process of selecting cross-sections may prove much more adaptable than when using classic architectural and construction drawings. The authors assume that, in this case, the implementation of the task will be more straightforward, although new research threads will appear.
A separate, although no less important issue just alluded to above, is the detailed cartographic methodology for interior visualisation. There are currently no guidelines in this regard.
It is also worth adding that 2D visualisation and the proposed 2D+ may also be helpful in applications that use full 3D models. Users of navigation applications need large-scale and dynamic information, adapted to their perception of the environment; it is advisable to use different visualisation methods, depending on the context. Sometimes a more straightforward and generalised image may be easier to read and understand. Fully-detailed 3D models of buildings do not always support visualisation in a way that a mobile application should provide (including a fast reading of information on a small screen). Perhaps the proposed concept can also be used by computer game developers.
6. Conclusions
Thanks to the conducted research, it is possible to propose the basis for a new concept for the visualisation of the interior of buildings that enables the effective use of architectural and construction drawings. At the same time, it is possible to use this method when accessing advanced 3D data, e.g., BIM and GIS. Unlike other solutions, the authors proposed using vertical cross-sections of buildings. These can be sections created by an architect at the design stage, but they can also be sections generated automatically, provided there is access to modern CAD, BIM, or GIS models.
The presented research results relate to the first stage of developing a new data visualisation method and will be continued. The conducted experiments confirmed the possibility for implementing the concept; however, it is necessary to undertake further research and to implement more advanced applications. In further planned research, the authors intend to improve the method of cartographic visualisation and perform tests of the several variants of data generalisation. The authors plan on the further development of a solution in a multilayer architecture. It is also imperative to conduct perception studies on users and to field-test the solutions. Focus and questionnaire surveys are planned. For this purpose, further development of the developed prototype is necessary. The industry is considering using a VR environment based among others on a VR treadmill.
The 2D+ conception has not been proposed by any authors so far. The presented proposals show the possibility of combining the world of BIM, GIS, and cartography. We believe that the presented results will contribute to the development of methods/techniques of geovisualisation and may be used by other researchers in the map design process.


