Earthquake Risk Assessment for Tehran, Iran

1
College of Engineering, University of Tehran, Tehran 1417466191, Iran
2
International Institute of Earthquake Engineering and Seismology, Tehran 1953714453, Iran
*
Author to whom correspondence should be addressed.
ISPRS Int. J. Geo-Inf. 2020, 9(7), 430; https://0-doi-org.brum.beds.ac.uk/10.3390/ijgi9070430
Submission received: 2 June 2020
/
Revised: 30 June 2020
/
Accepted: 7 July 2020
/
Published: 9 July 2020
Abstract
:The megacity of Tehran, the capital of Iran, is subjected to a high earthquake risk. Located at the central part of the Alpine–Himalayan seismic belt, Tehran is surrounded by several active faults that show some M7+ historical earthquake records. The high seismic hazard in combination with a dense population distribution and several vulnerability factors mean Tehran is one of the top 20 worldwide megacities at a high earthquake risk. This article aims to prepare an assessment of the present-day earthquake risk in Tehran. First, the earthquake risk components including hazard, exposure, and vulnerability are evaluated based on some accessible GIS-based datasets (e.g., seismicity, geology, active faults, population distribution, land use, urban fabric, buildings’ height and occupancy, structure types, and ages, as well as the vicinity to some critical infrastructures). Then, earthquake hazard maps in terms of PGA are prepared using a probabilistic approach as well as a surface rupture width map. Exposure and vulnerability maps are also provided deterministically in terms of population density and hybrid physical vulnerability, respectively. Finally, all these components are combined in a spatial framework and an earthquake risk map is provided for Tehran.
1. Introduction
Earthquakes are one of the most powerful natural phenomena that can impose substantial human and economic losses on societies. Since 1980, earthquakes have accounted for 12.2% of all catastrophic natural hazards worldwide, contributing to 56.2% of all casualties and 25.2% of financial losses in total [1]. More than 800,000 fatalities, 1.4 million injuries, 30 million made homeless, as well as approximately USD 950 billion in economic losses are consequences of destructive earthquakes during the same period [2]. The top five countries that have been most frequently affected by damaging earthquakes are China, Indonesia, Iran, Turkey, and Japan, with 16%, 10%, 8%, 4.5%, and 4% of all damaging earthquakes, respectively [3,4].
Over the last decades, population growth along with unplanned rapid urbanization and poor land management have been underlying disaster risk drivers, so that leading to the accumulation of life and property assets in potentially earthquake-prone areas and thus resulting in an increase in earthquake risk [5,6,7]. According to the latest global seismic risk map [8,9,10], there are currently 17 megacities around the world with a population of more than 10 million that are placed at the highest risk level, including Tokyo, Jakarta, Delhi, Beijing, Manila, Mexico City, Osaka, Los Angeles, Dhaka, Chengdu, Karachi, Tehran, Istanbul, Lahore, Nagoya, Bogota, and Lima.
One of the best efforts to address the impact of earthquakes on a region, especially in densely populated urban areas, is to conduct earthquake risk assessments. In this regard, a common practice to conceptually formulate earthquake risk is a simple convolution of three components [11,12,13,14,15,16], as below:
in which ‘Hazard’ is defined as the potential of a natural phenomenon to cause damaging impacts [5,17] and is characterized by its intensity or magnitude, location, frequency, and probability of occurrence [11,12]. The term ‘Exposure’, also known as ‘Elements at risk’, indicates the number of people or amount of assets which are exposed to hazards [11,12,17], and ‘Vulnerability’ is the susceptibility of a community, assets, or systems to damaging effects of a hazard.
Risk = Hazard × Exposure × Vulnerability,
In recent years, there has been a growing amount of literature on earthquake risk assessment. On the global scale, one of the most relevant recent efforts has been performed in the framework of the Global Earthquake Model (GEM) project during 2009–2018 [8,9,10], which aimed to provide a homogeneous global earthquake hazard and risk model by developing and combining several national and regional models and use of the state-of-the-art data and methodology. The Global Assessment Report (GAR) [13] as the flagship report developed by the United Nations office for Disaster Risk Reduction (UNDRR) is another notable effort at the global scale, which aims to reduce multiple disaster risks including earthquakes. Some studies at national/regional scale include earthquake risk assessments for Europe [18,19,20], Italy [21], Portugal [22], Switzerland [23], Germany [24], Perth of Australia [16], Barcelona of Spain [25], Tabriz of Iran [26], Delhi of India [27], Bucharest of Romania [28], Cairo of Egypt [29], Manizales of Colombia [30], Aigion of Greece [31], Muscat of Oman [32], Guyuan of China [33], Sichuan Province of China [34], Aceh province of Indonesia [35], and Santiago of Chile [36]. In terms of methodology, different studies apply different approaches to assess earthquake risk. In general, these approaches can be categorized into scenario-based e.g., [28,33], GIS-based e.g., [26,37], deterministic approach e.g., [31], probabilistic approach e.g., [25,30], real-time approach e.g., [14], seismicity–dependent e.g., [38,39,40], neural network and analytic hierarchy process e.g., [35], and holistic e.g., [41]. In addition, several software platforms and codes have been developed to be used for modeling earthquake risk from local to global scales, such as OpenQuake [42], HAZUS–MH [43], CAPRA [44], INFORM–GRI [45], ER2-Earthquake [46], EQRM [47], etc.
It is worth mentioning that any earthquake risk assessment may inevitably be associated with modeling complexities and a number of limitations and challenges in developing accurate evaluations. The challenges mostly include data inaccessibility, how to integrate several spatial parameters having different resolutions, how to combine types of data layers with different concepts (e.g., the combination of social and physical vulnerabilities), as well as considering the domino effects of secondary indirect hazards (e.g., tsunamis, fire following earthquakes, earthquake-induced landslides, soil liquefaction, land subsidence, etc.). One typical example of such a domino effect concerns the 2011 Mw9.1 Tohoku earthquake in Japan, which then triggered a 24–m-high tsunami, followed by an explosion with a major release of radioactive contamination at the Fukushima Daiichi nuclear power plant [48].
The megacity of Tehran, the economic and political capital of Iran, is exposed to a high hazard of large-magnitude earthquakes originating from several surrounding active faults. With a night-time residential population of over 9 million and a day-time floating population of about 4 million people, Tehran is one of the largest urban centers of the world with a high seismic risk. In this paper, we attempt to address the quantification of the present-day earthquake risk in Tehran. In this context, we first evaluate earthquake hazard using a probabilistic approach to map out the potential ground shaking. By application of accessible spatial databases on an urban scale, we then assess the status of exposure and vulnerability in Tehran based on a deterministic approach. We eventually combine these elements trough the concept of a GIS–based 3D risk matrix in order to depict the geographical distribution of the current earthquake risk in Tehran.
2. Region of Study
2.1. Tectonic Setting
The megacity of Tehran is situated on the southern foothills of the Alborz Mountains. Formed by Gondwana–Eurasia collision in the Late Triassic [49], Alborz is an east–west trending mountain range with a 600 km length and 100 km width along the Alpine–Himalayan seismic belt. Tectonically, Alborz is an active zone, where is under huge tectonic stresses due to the northward convergence of central Iran toward Eurasia. At the longitude of Tehran, Alborz accommodates 6–10 mm of shortening per year [50,51,52].
2.2. Active Faulting
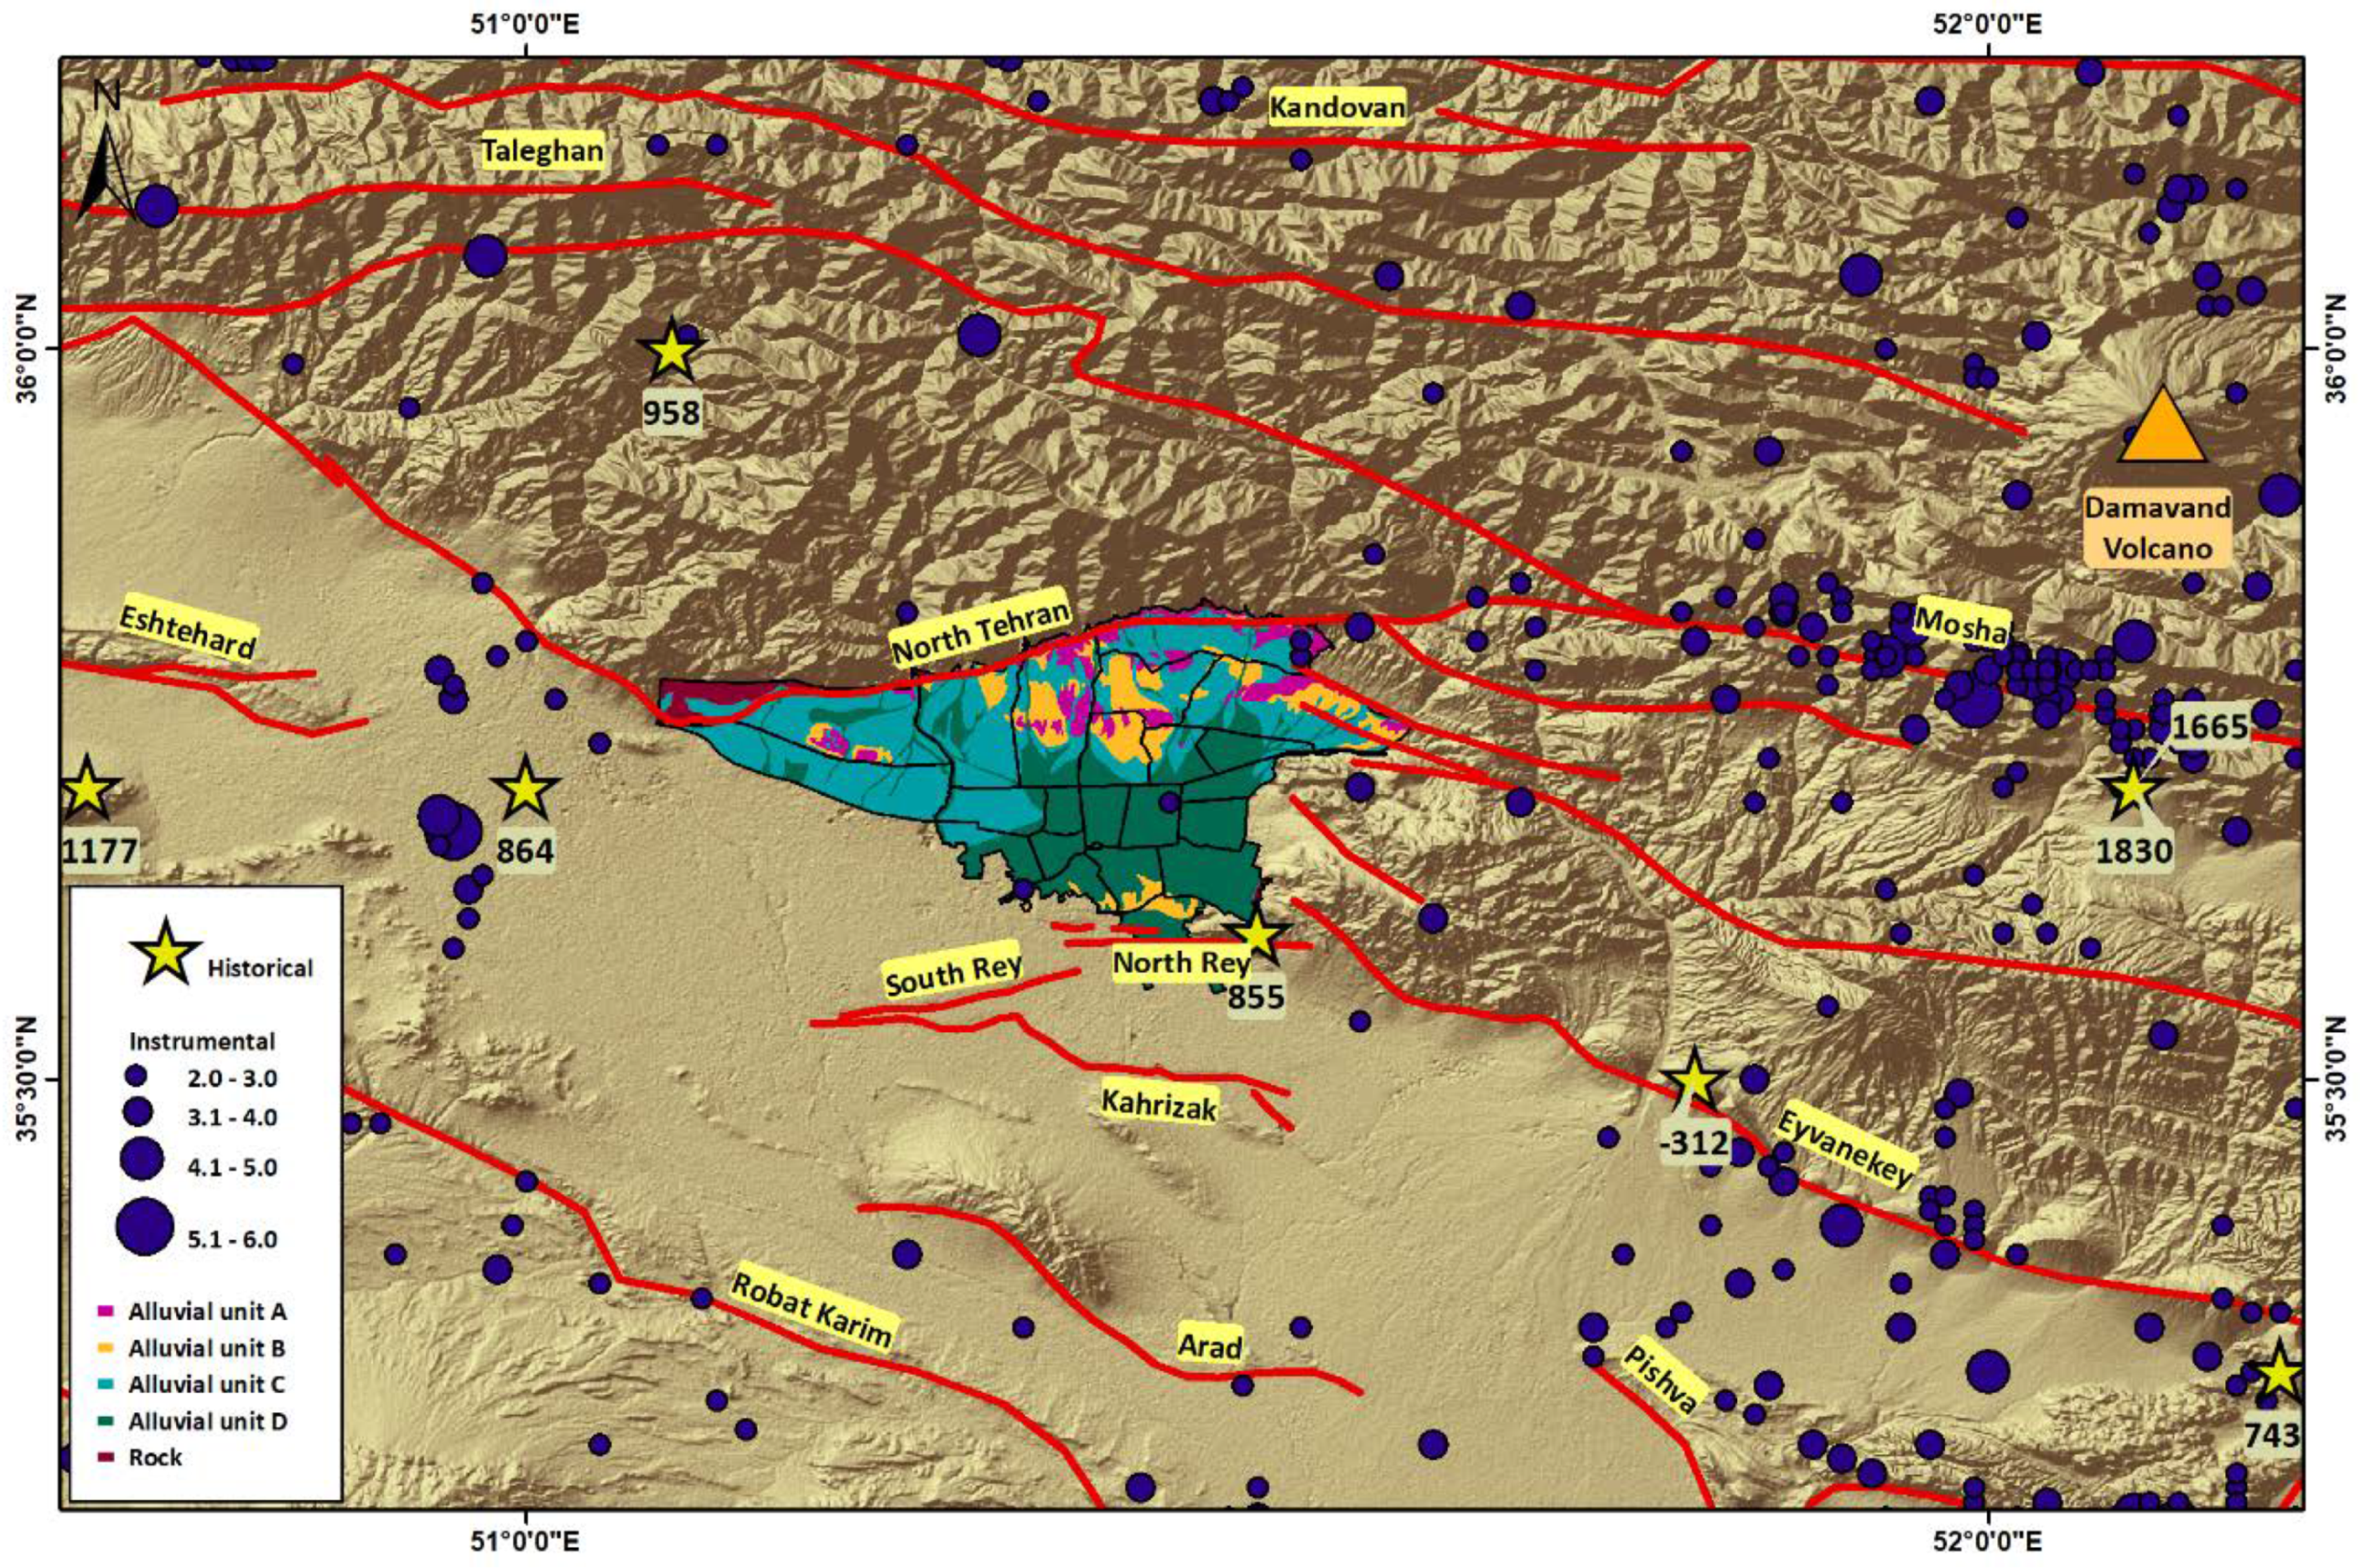
As a result of such active tectonics, Tehran is surrounded by several major faults, also embracing some inner–city active faults (Figure 1). These faults mainly show both reverse and strike–slip mechanisms. Here is a brief description of some the most important active faults inside or in the vicinity of Tehran along with their main specific features [53,54]:
- North Tehran: The most prominent active tectonic structure in Tehran; E–W strike; north-dipping fault surface; length of 175 km with a predominant thrust mechanism along its 110–km western segment, and a predominant left-lateral strike–slip mechanism along its 65-km eastern segment; average slip rate of ~0.3 mm yr−1.
- Mosha: Located at 16–km distance to the north of Tehran; N100° E trending; north-dipping fault surface; a 220–km long, left-lateral oblique reverse fault with dips varying from 35° to 70°; average slip rate of ~0.2 mm yr−1.
- Kahrizak–South Rey–North Rey: A zone located south of Tehran, E–W trending, consisting of Kahrizak, South Rey, and North Rey faults with lengths of 35, 18.5, and 16.5 km, respectively.
- Parchin: Also known as the Eyvanekey fault; situated at the southeast of Tehran; 70 km long; NW–SE strike; has clear ruptures in Quaternary alluvial deposits.
- Pishva: Located southeast of Tehran; ~55 km long; NW-SE (N130° E) trending; reverse mechanism with a lateral component; northeast-dipping fault surface.
- Garmsar: Located southeast of Tehran, bifurcated from the southern section of the Pishva fault; 70-km long; E–W trending; reverse mechanism.
- Taleghan: Located northwest of Tehran; 80-km length; E–W trending; left-lateral strike–slip mechanism with a normal component (occurrence of a kinematical change along the fault from reverse to left-lateral + normal ~1 Ma); minimum horizontal and vertical slip rates of 0.6–1.6 mm yr−1 and ~0.5 mm yr−1, respectively.
- Pardisan: Located in central Tehran; ~12 km long; E-W trending; thrust mechanism; north dipping; minimum uplift and slip-rates of at least 1 mm yr−1.
2.3. Seismicity
Active faults are responsible for several large-magnitude historical (pre–1900) earthquakes as well as the current seismicity in and around Tehran, imposing a high seismic hazard on this megacity. Important recorded historical earthquakes in Tehran include 312–280 BC, Ms7.6, I~X, Rey; 743 AD, Ms7.2, I~VIII+, Garmsar; 855 AD, Ms7.1, I~IX, Rey; 958 AD, Ms7.7, I~X, Taleghan; 1177 AD, Ms7.2, I~VIII+, Karaj; 1608 AD, Ms7.6, I~X, Taleghan; 1665 AD, Ms6.5, I~VIII, Damavand; 1830 AD, Ms7.1, I~VIII+, Damavand events [55,56] (Figure 1).
Besides historical documents, several paleoseismological trench investigations have been carried on Tehran’s adjacent faults in order to decode possible ancient earthquakes. Trench analysis and dating of fault-related sediments have revealed several important large-magnitude earthquakes around Tehran, including events related to the North Tehran [57], Mosha [58,59], Taleghan [60], Kahrizak-Rey [61], and Pishva [62] faults. For instance, the paleoseismological study on the North Tehran fault [57] has revealed seven surface-rupturing events with magnitudes between 6.1 and 7.2 and a mean recurrence interval of about 3800 years.
In the modern era of seismology (since 1900), there have been also several records of large-magnitude instrumental earthquakes around Tehran, including the 1930 Ah-Mobarakabad (Mw 5.2), 1962 Buin Zahra (Mw 7.1), 1990 Manjil–Rudbar (Mw 7.4), and 2004 Baladeh (Mw 6.3) earthquakes. Recently, two Mw5.2 and Mw5.1 events have occurred in Malard (40km west of Tehran) in 2017, and in Damavand (60 km northeast of Tehran) in 2020, respectively. Based on the historical/instrumental seismicity records in Alborz seismotectonic zone, where Tehran belongs to, the beginning years for completeness of earthquake magnitudes include 850, 1440, 1680, 1800, and 1955 for the magnitude ranges of 5.5 < Mw, 5.0 < Mw ≤ 5.5, 4.5 < Mw ≤ 5.0, 4.0 < Mw ≤ 4.5, and Mw ≤ 4.0, respectively [63]. The trend of historical and instrumental seismicity along with limited paleoseismic data and the regional fault map suggest that the megacity of Tehran is currently located on a seismic gap in the south of Alborz [64]. It is worth mentioning that the state-of-the-art studies e.g., [65,66] imply the importance of time-dependent models which incorporate the most basic physics of the earthquake cycles and gaps in order to calculate time-dependent conditional probabilities. Therefore, the observed seismic gap beneath Tehran will have a considerable contribution to future time-dependent seismic hazard and risk models in this region.
2.4. Geological Structure
In terms of geology, Tehran lays on the Quaternary alluvial deposits, which have the potential of seismic wave amplification and increase of shaking during an earthquake. These sediments are usually classified into four stratigraphic units named from A to D, as below [67] (Figure 1):
- Unit A: Also known as the ‘Hezardarreh’ formation, this unit is the oldest deposit in Tehran with a thickness of ~1200 m, forming a long anticline throughout the northeast-east of Tehran. Having a light gray in color and an almost vertical bedding (dip ~90°), this unit is mainly made of conglomerates with a well-developed lime carbonate cementation and is considered to be of the Pliocene–Pleistocene age.
- Unit B: This unit, also known as the ‘Kahrizak’ formation, unconformably overlies on the eroded surfaces of unit A. The thickness of unit B varies from 10 to 60 m, and its bedding is generally horizontal with a maximum dip of 15°. This deposit has a heterogeneous mechanical resistance and changeable porosity and its age is estimated to be ~700,000 years.
- Unit C: Since a considerable part of Tehran has been built on this unit, it is also called as the ‘Tehran’ formation, and includes conglomeratic young alluvial fan deposits. The maximum thickness of this formation is about 60 m, and its age is estimated to be ~50,000 years. Its bedding indicates an almost horizontal slope. Unit C has higher cementation than its underlying and overlying stratigraphic units (B and D formations, respectively).
- Unit D: Known as the ‘Recent’ alluvium, this unit is the youngest stratigraphic unit within the Tehran region and its formation dates back to the Holocene epoch (11,500 years). The thickness of this unit is less than 10 m and its color is gray to dark gray. This unit has an alluvial and fluvial origin, and it composes of poorly consolidated to unconsolidated cementation.
3. Methodology
As mentioned in the introduction, earthquake risk can be quantified as the convolution of three elements including hazard, exposure, and vulnerability. A brief overview of the methodology we have adopted in this study and its key components are summarized by the flowchart in Figure 2. The process of risk quantification in this study starts with a time-independent probabilistic seismic hazard assessment (PSHA) for Tehran, the output of which is a Peak Ground Acceleration (PGA), accompanied by a surface rupture width map of the faults in Tehran. Then, exposure is presented as a population density map derived from the accurate population distribution in Tehran. To model vulnerability, we consider a mixture of several sub-layers and combine them in a classification framework. Both exposure and vulnerability components are evaluated using a deterministic approach. Finally, based on the concept of a GIS–based 3D matrix—the elements of which constitute the same risk elements (hazard, exposure, and vulnerability)—we will combine the classified values of the components and derive the final risk value. The details about the computational steps of this methodology are described in the following sections.
4. Hazard
Earthquake hazard in a region is usually defined as the level of ground shaking with a certain chance of being exceeded over a given period of time (typically, 475-year return period, which is associated with a probability exceeding 10% in 50 years). In this study, we prepare two maps as the hazard component to feed the risk calculations: (1) surface PGA map which provides the level of ground motion considering the local site response in Tehran, and (2) surface rupture width map which indicates the potential rupture areas around active faults in Tehran.
4.1. Surface PGA
To develop a seismic hazard map for the megacity of Tehran, we use the time-independent probabilistic seismic hazard analysis (PSHA). PSHA is one of the most widely used approaches that quantifies the rate or probability of exceeding various ground motion levels given all possible earthquakes. This method explicitly considers uncertainties in earthquake size, location, and time of occurrence [68,69].
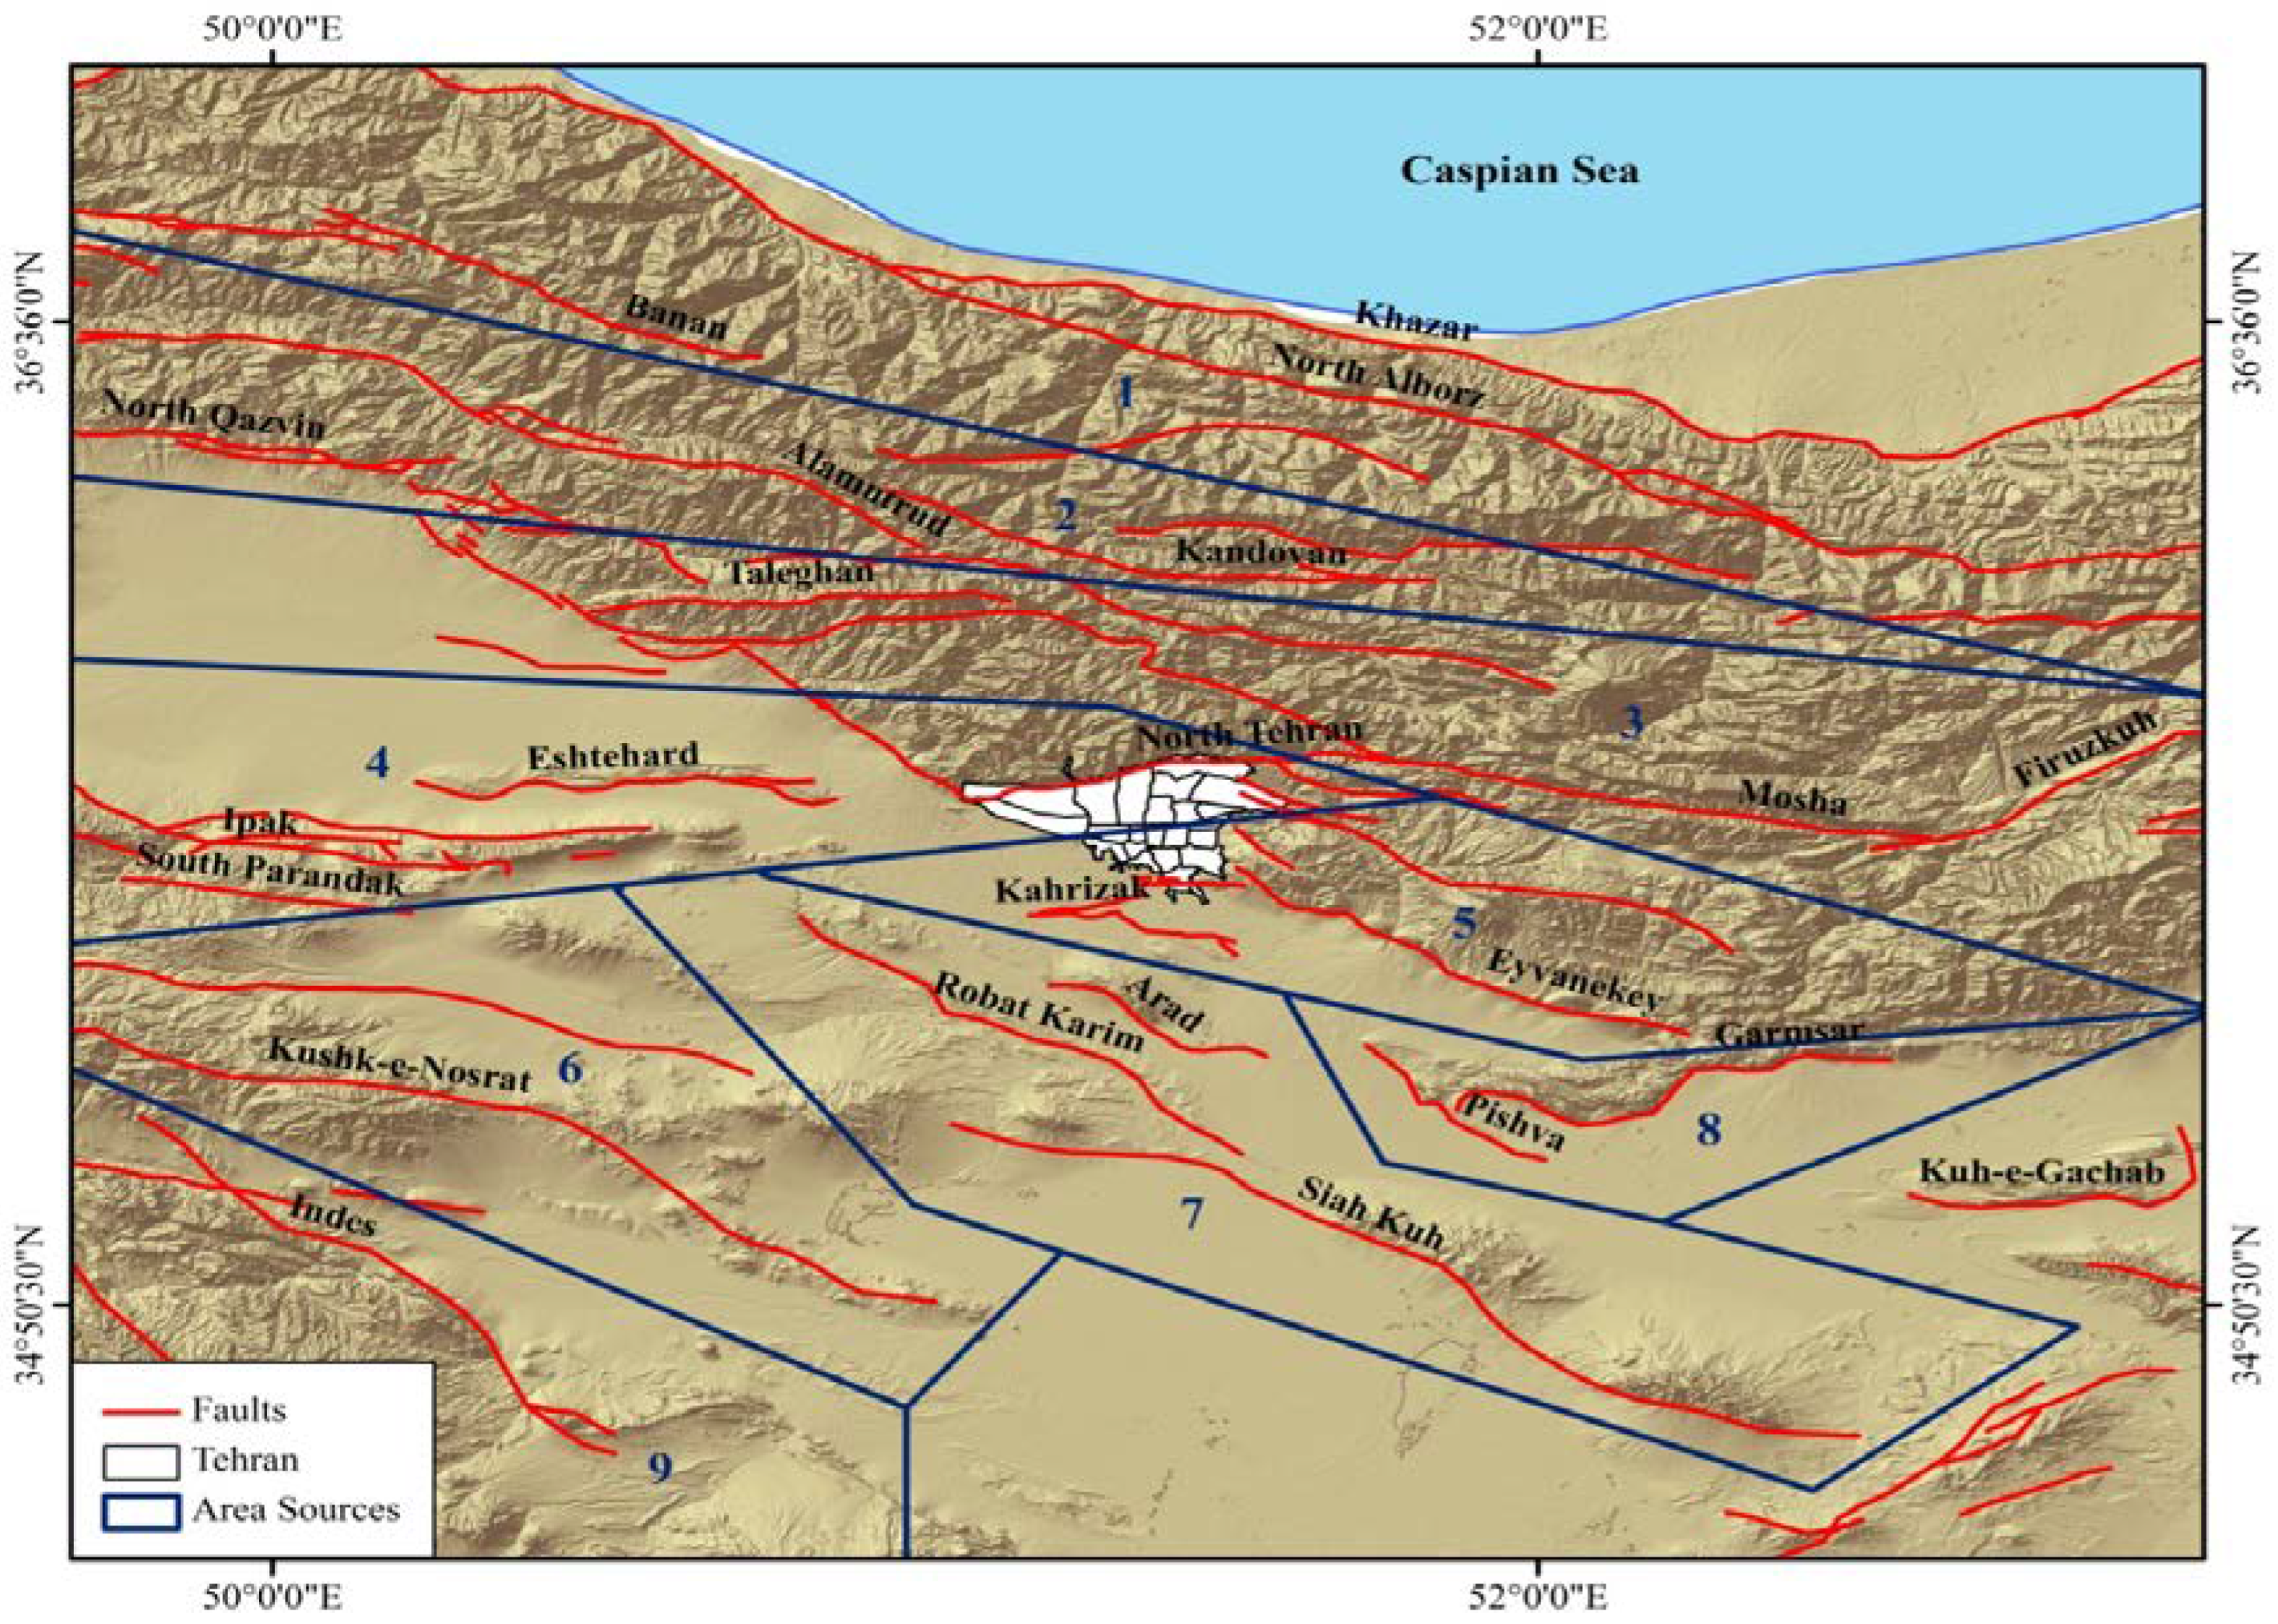
As the first step of the PSHA study, it is necessary to determine seismogenic sources which impose seismic hazard to a region. In general, a seismogenic source model within an area consists of several individual seismic sources, which have experienced, or expected to potentially have, seismic activities. Each source has its own specific characteristics in terms of geometry, seismicity behavior, and geological features. This model can be prepared based on area sources, linear sources (faults), or a mixture of them. To determine seismic sources, we have considered area sources within a region with a 150–km radius from the center of the megacity of Tehran. Our primary data consists of the faults [53,54] and an updated version of the historical and instrumental earthquake catalog (400 B.C.–2020) [63]. On the basis of the standard criteria mentioned in the EMME project [70], area source boundaries are delineated around Tehran (Figure 3).
Then, the characteristics of these seismic sources are modeled using recurrence relationships. By application of the algorithms mentioned in [71,72,73], seismicity parameters including the b–value of the Gutenberg–Richter relation [74], annual mean occurrence rate (λ), and maximum possible magnitude, (Mmax) are evaluated for each area source (Table 1). It should be noted that the Mmax is estimated based on the maximum observed historical/instrumental earthquake and the assessment of maximum probable earthquake for a seismic source using empirical relationships between the magnitude and fault length. In this study, two empirical relationships were used to calculate the probable Mmax of each area source as follows [75,76]:
where LR is the rupture length and equals to 37% of the fault length (LF) based on the records of the Iranian fault ruptures [75].
Mw = 0.91 ln LR + 3.66
Mw = 5.08 + 1.16 log LR
The next step of a PSHA approach is the selection of suitable Ground Motion Prediction Equations (GMPEs). GMPEs are proper models to predict the level of ground shaking at a site, which is correlated with other parameters such as magnitude, site-to-source distance, fault mechanism, local site conditions, etc. It is a common practice to use several ranked GMPEs—which are appropriate to regional geology of an area—in order to reduce the level of uncertainty associated with the parameters of PSHA. In this respect, we select three GMPEs [77,78,79] which are consistent with the geological conditions of the study area.
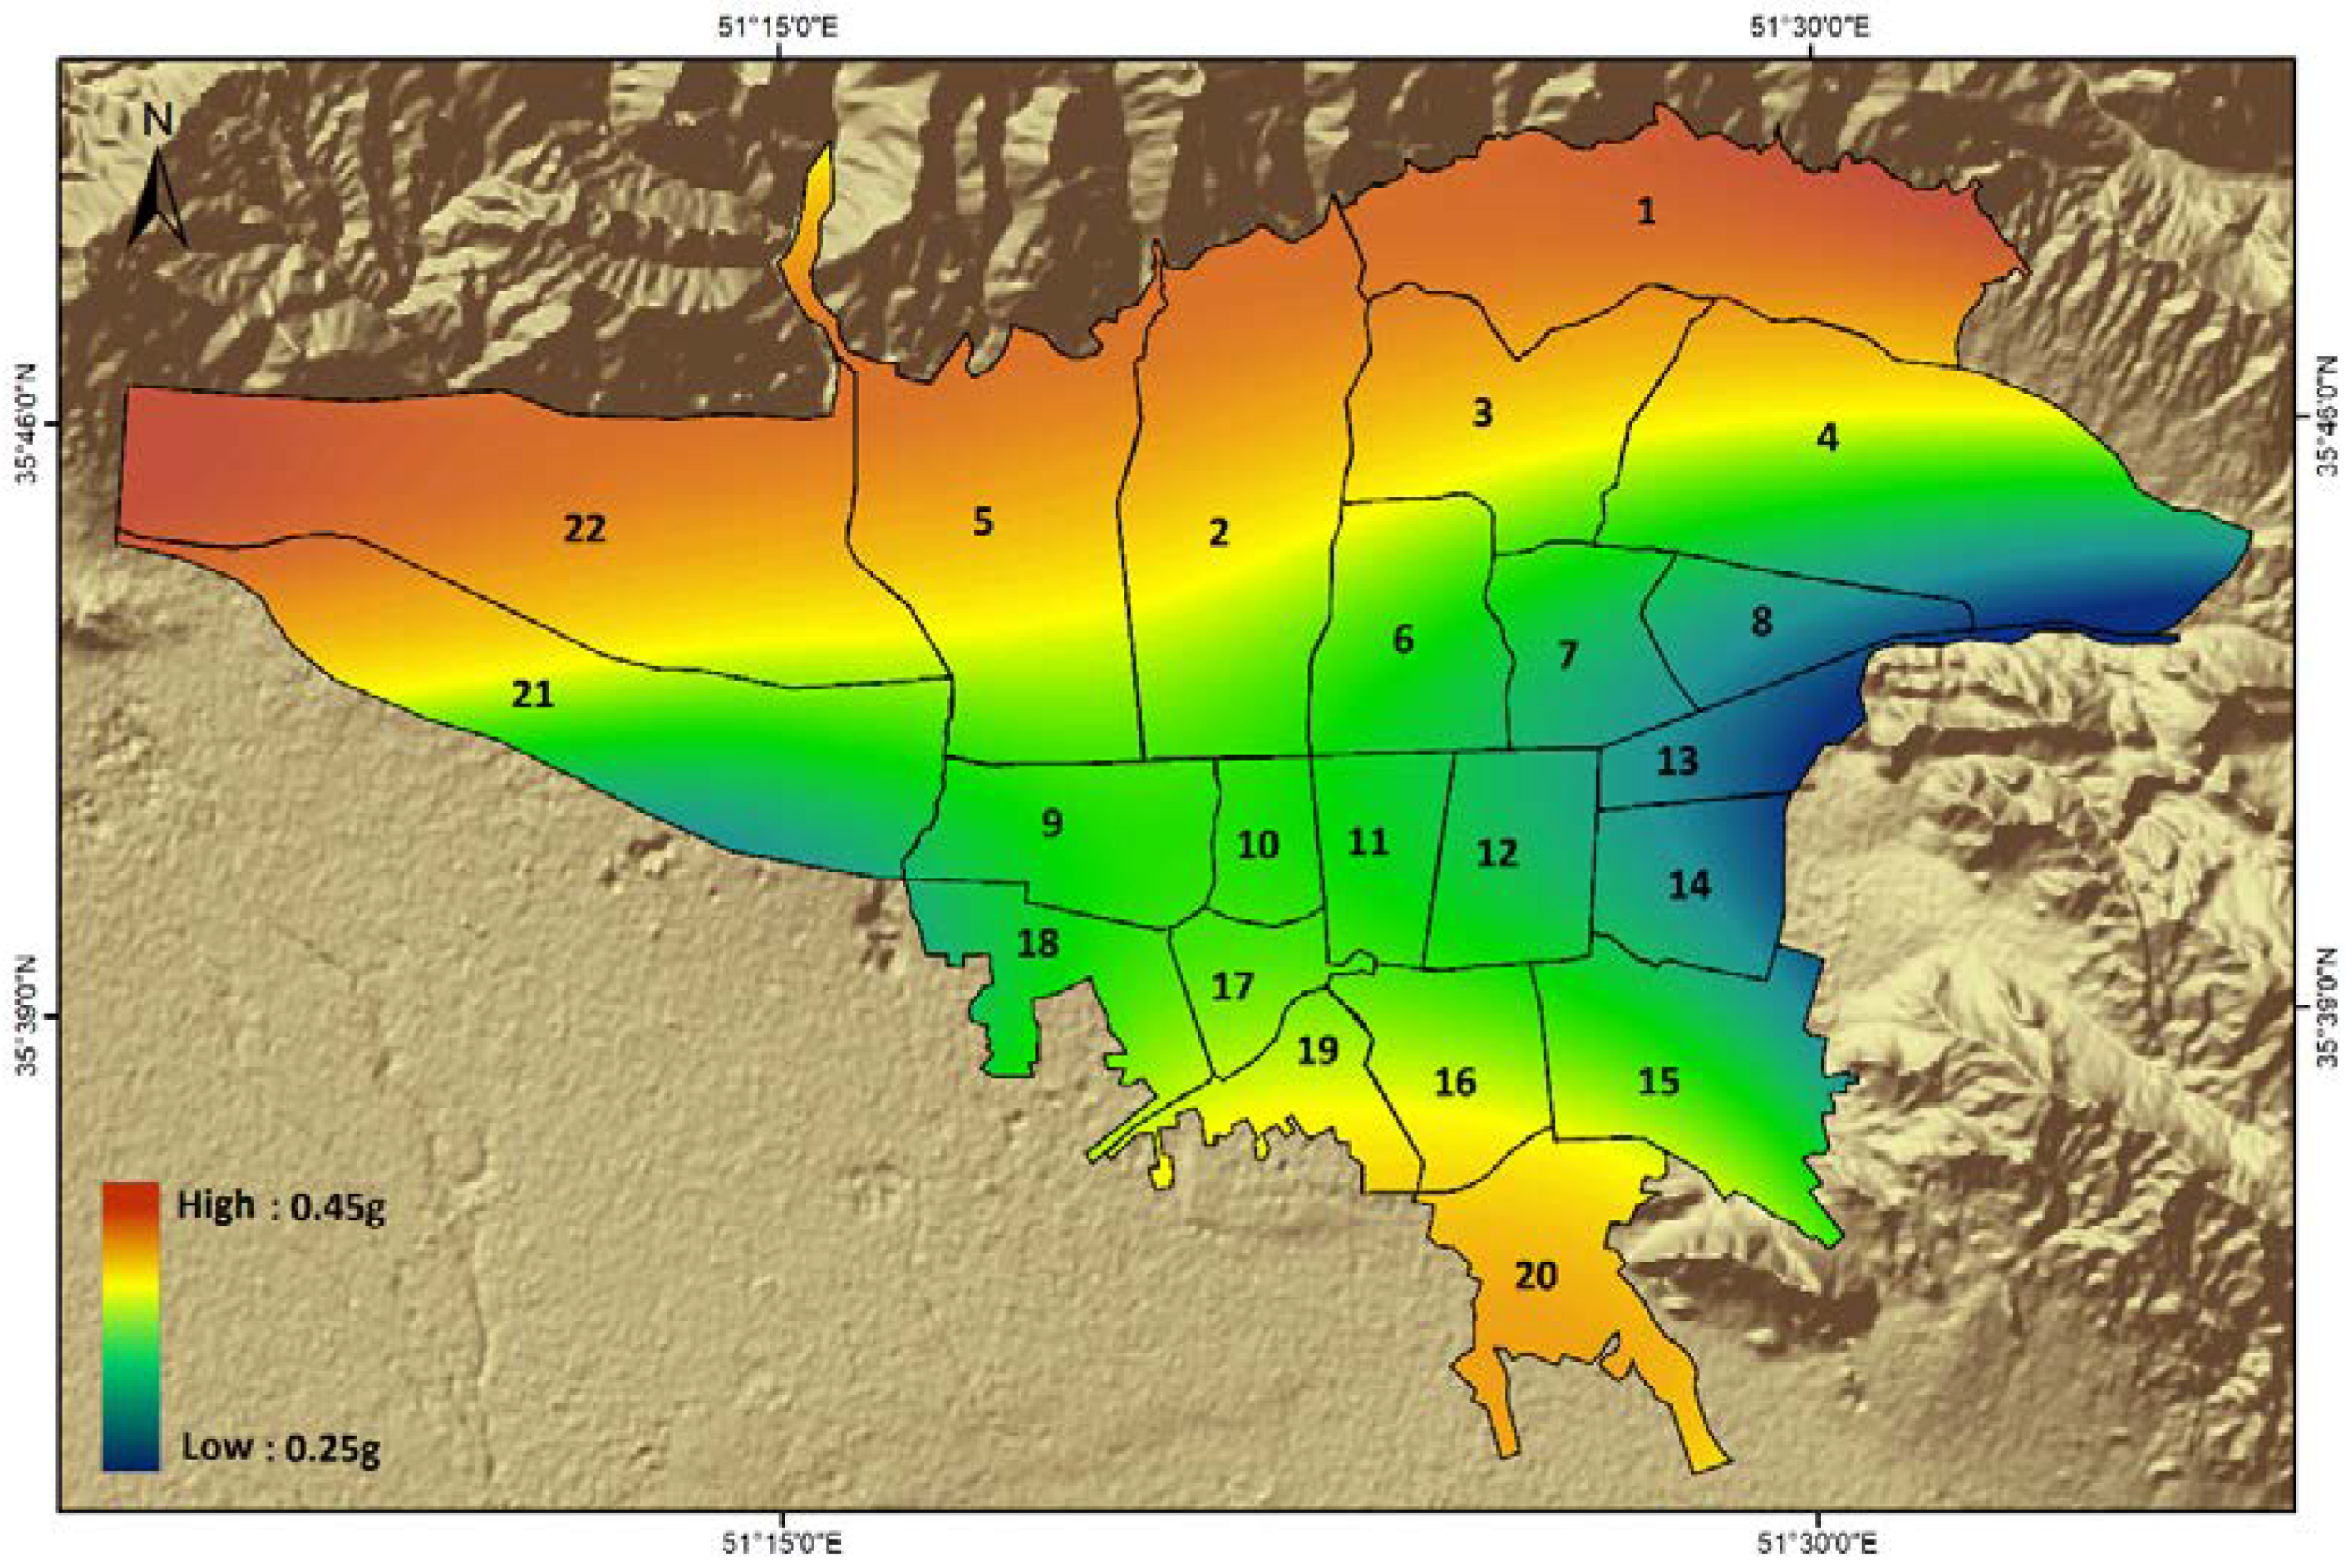
Once the two previous steps have been carried out, they are combined in a probability framework to quantify the earthquake hazard in terms of a ground motion parameter—usually peak ground acceleration (PGA) or spectral accelerations (Sa)—for a specified time period. Here, we avoid mentioning the computational approach of PSHA analysis as it can be found in detail in the main references [68,69]. Subsequently, the hazard model in terms of PGA is produced on the bedrock level considering a 475-year return period (Figure 4). This map shows a maximum PGA of 0.45–0.5 g in the northern and southern parts of Tehran where are in the vicinity of Mosha, North Tehran and Rey-Kahrizak faults.
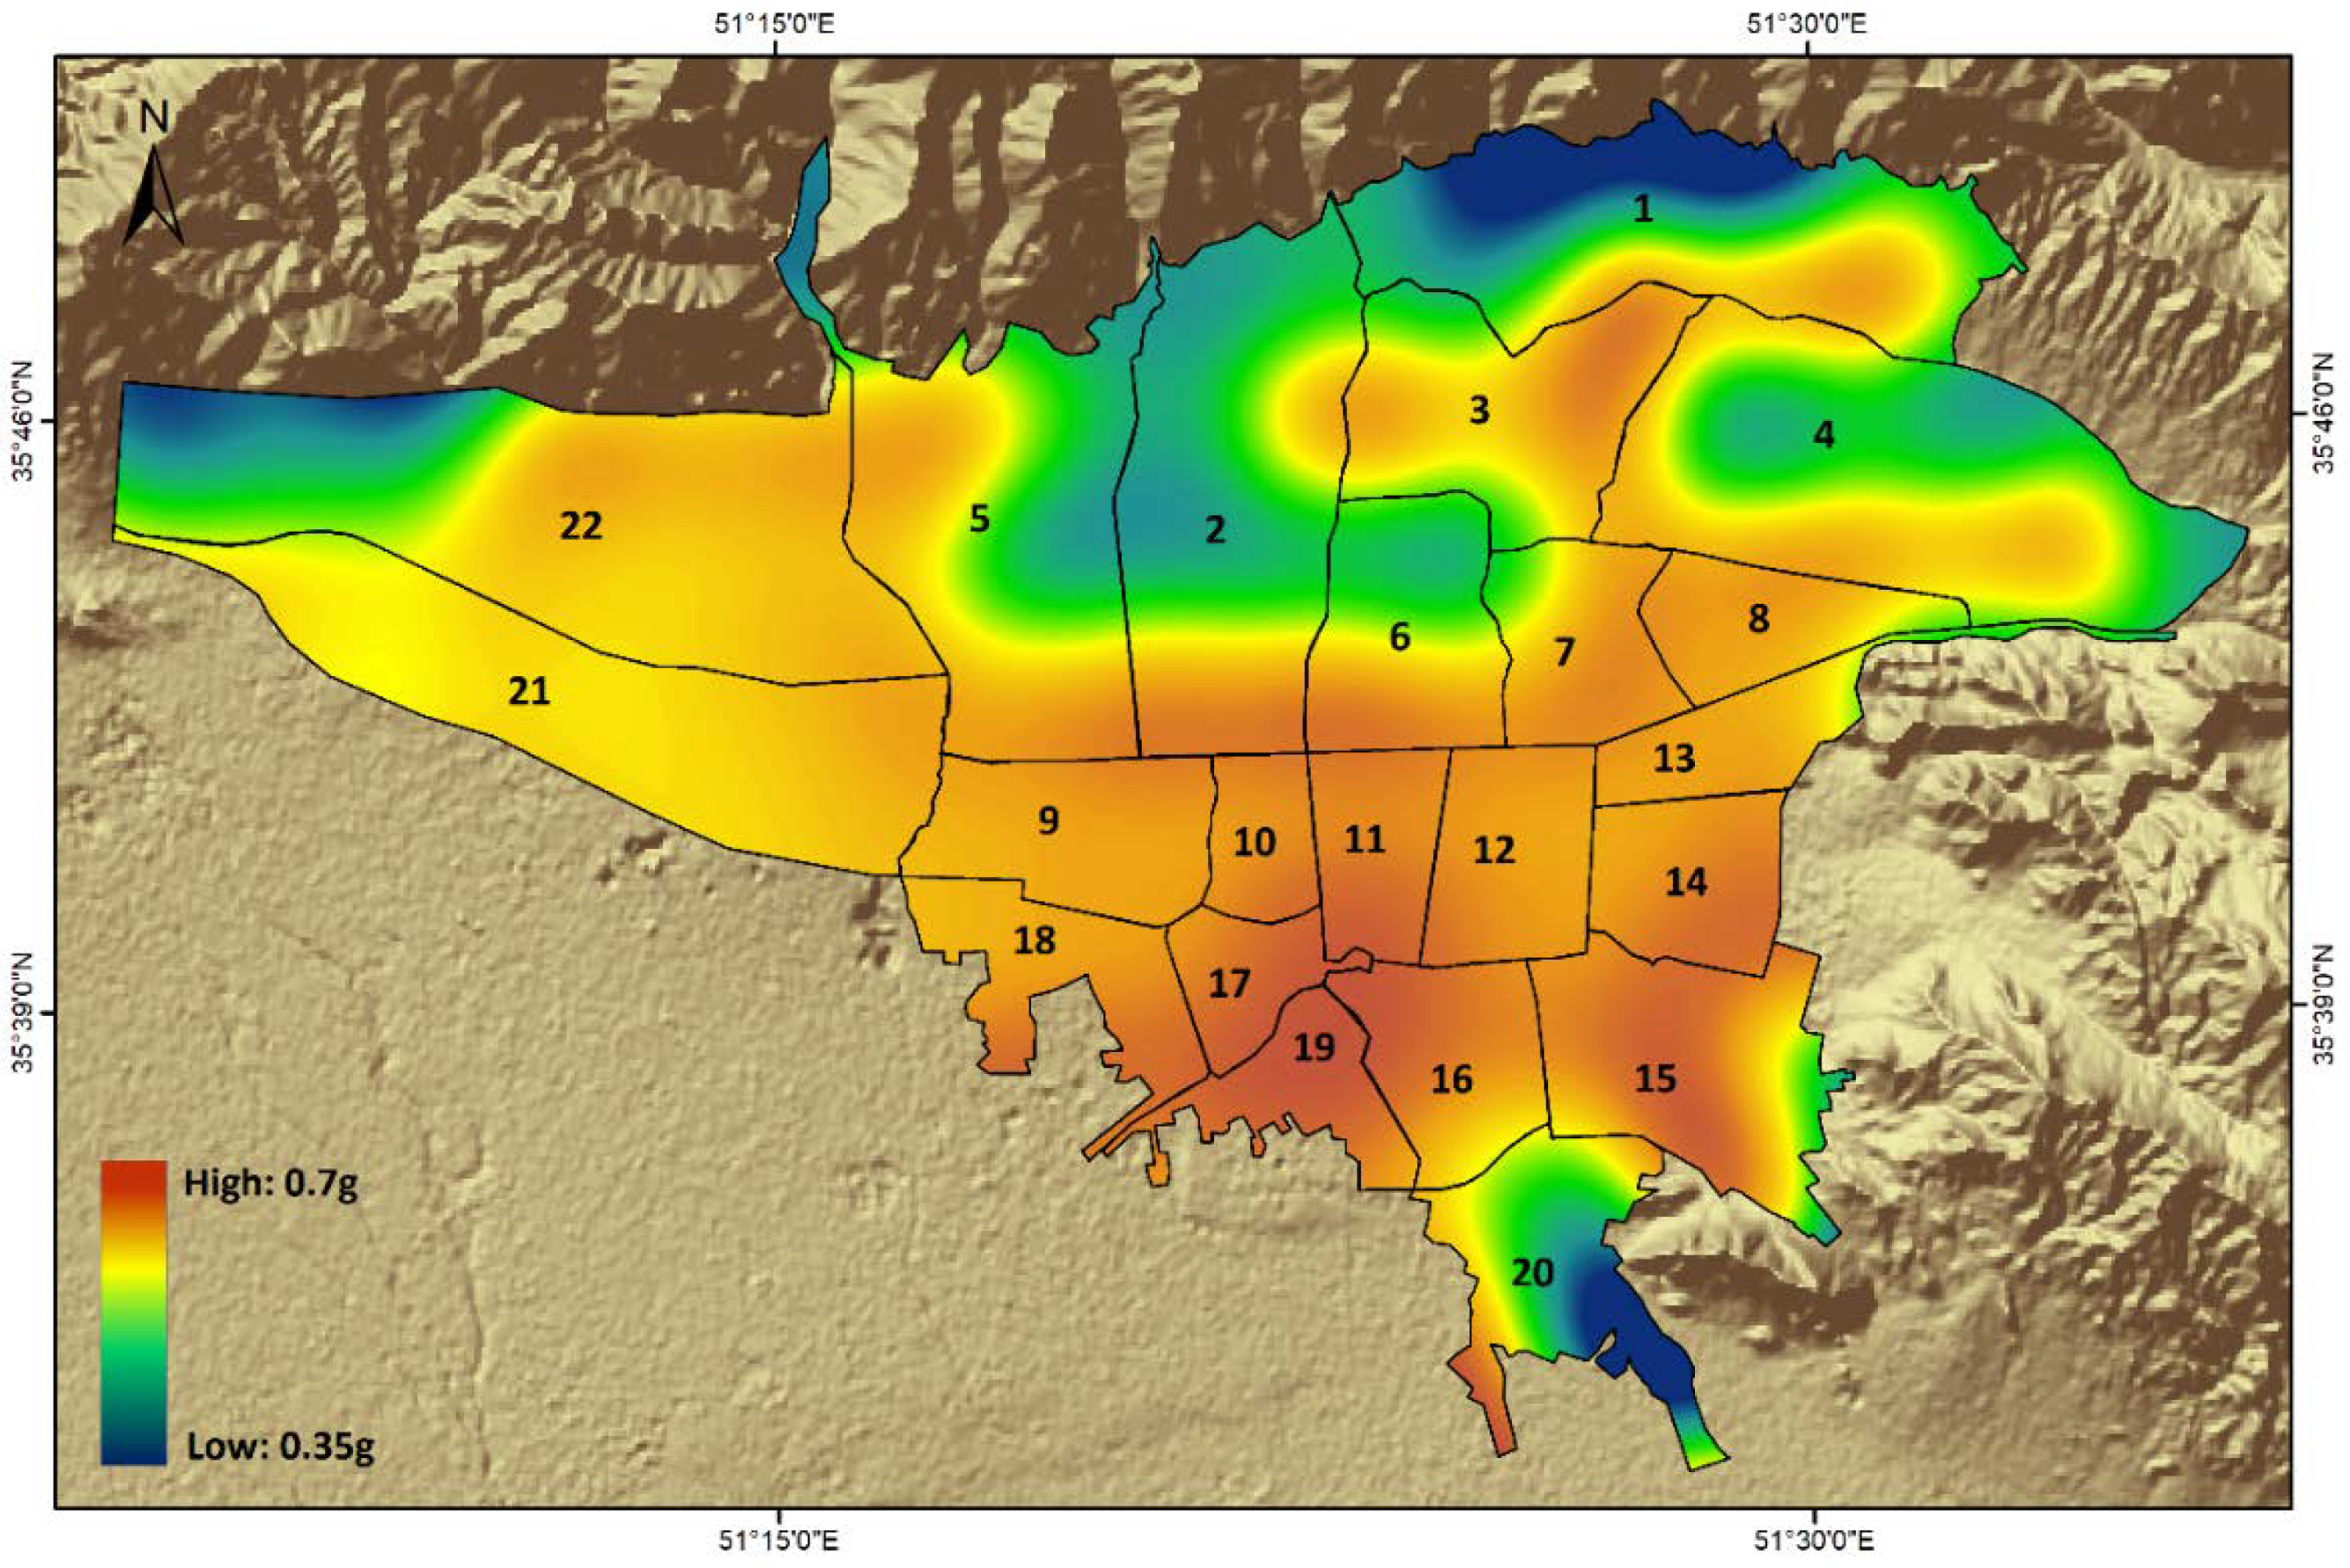
On the ground surface level, the PGA might be different, as local soil deposits in an area may amplify the seismic wave field, and considerably change its characteristics. Therefore, to calculate the surface PGA, local soil effects should be taken into account. To do so, we used the classification of VS30 (shear wave velocity in the upper 30 m depth) in Tehran [80], and prepared the hazard model in terms of surface PGA for 475–year return period. The surface hazard map (Figure 5) shows a maximum PGA of about 0.7 g in the southwest of Tehran. Comparing the two hazard maps on bedrock and surface confirms that the thick soil deposits in different parts of Tehran are able to amplify ground motions during an earthquake. Therefore, central and southern areas of the city are assigned as the highest hazardous zones which are exposed to amplified strong ground motions due to large earthquakes.
4.2. Surface Rupture Width
Besides the estimation of ground shaking acceleration, it is necessary to consider that some earthquakes may significantly produce near-field effects on the ground which can be permanent or temporary. For instance, forward/backward directivity, fling step, fault scarps, large ruptures, and cracks may occur within active fault zones, leading to large ground–surface displacements and extensive damages to structures.
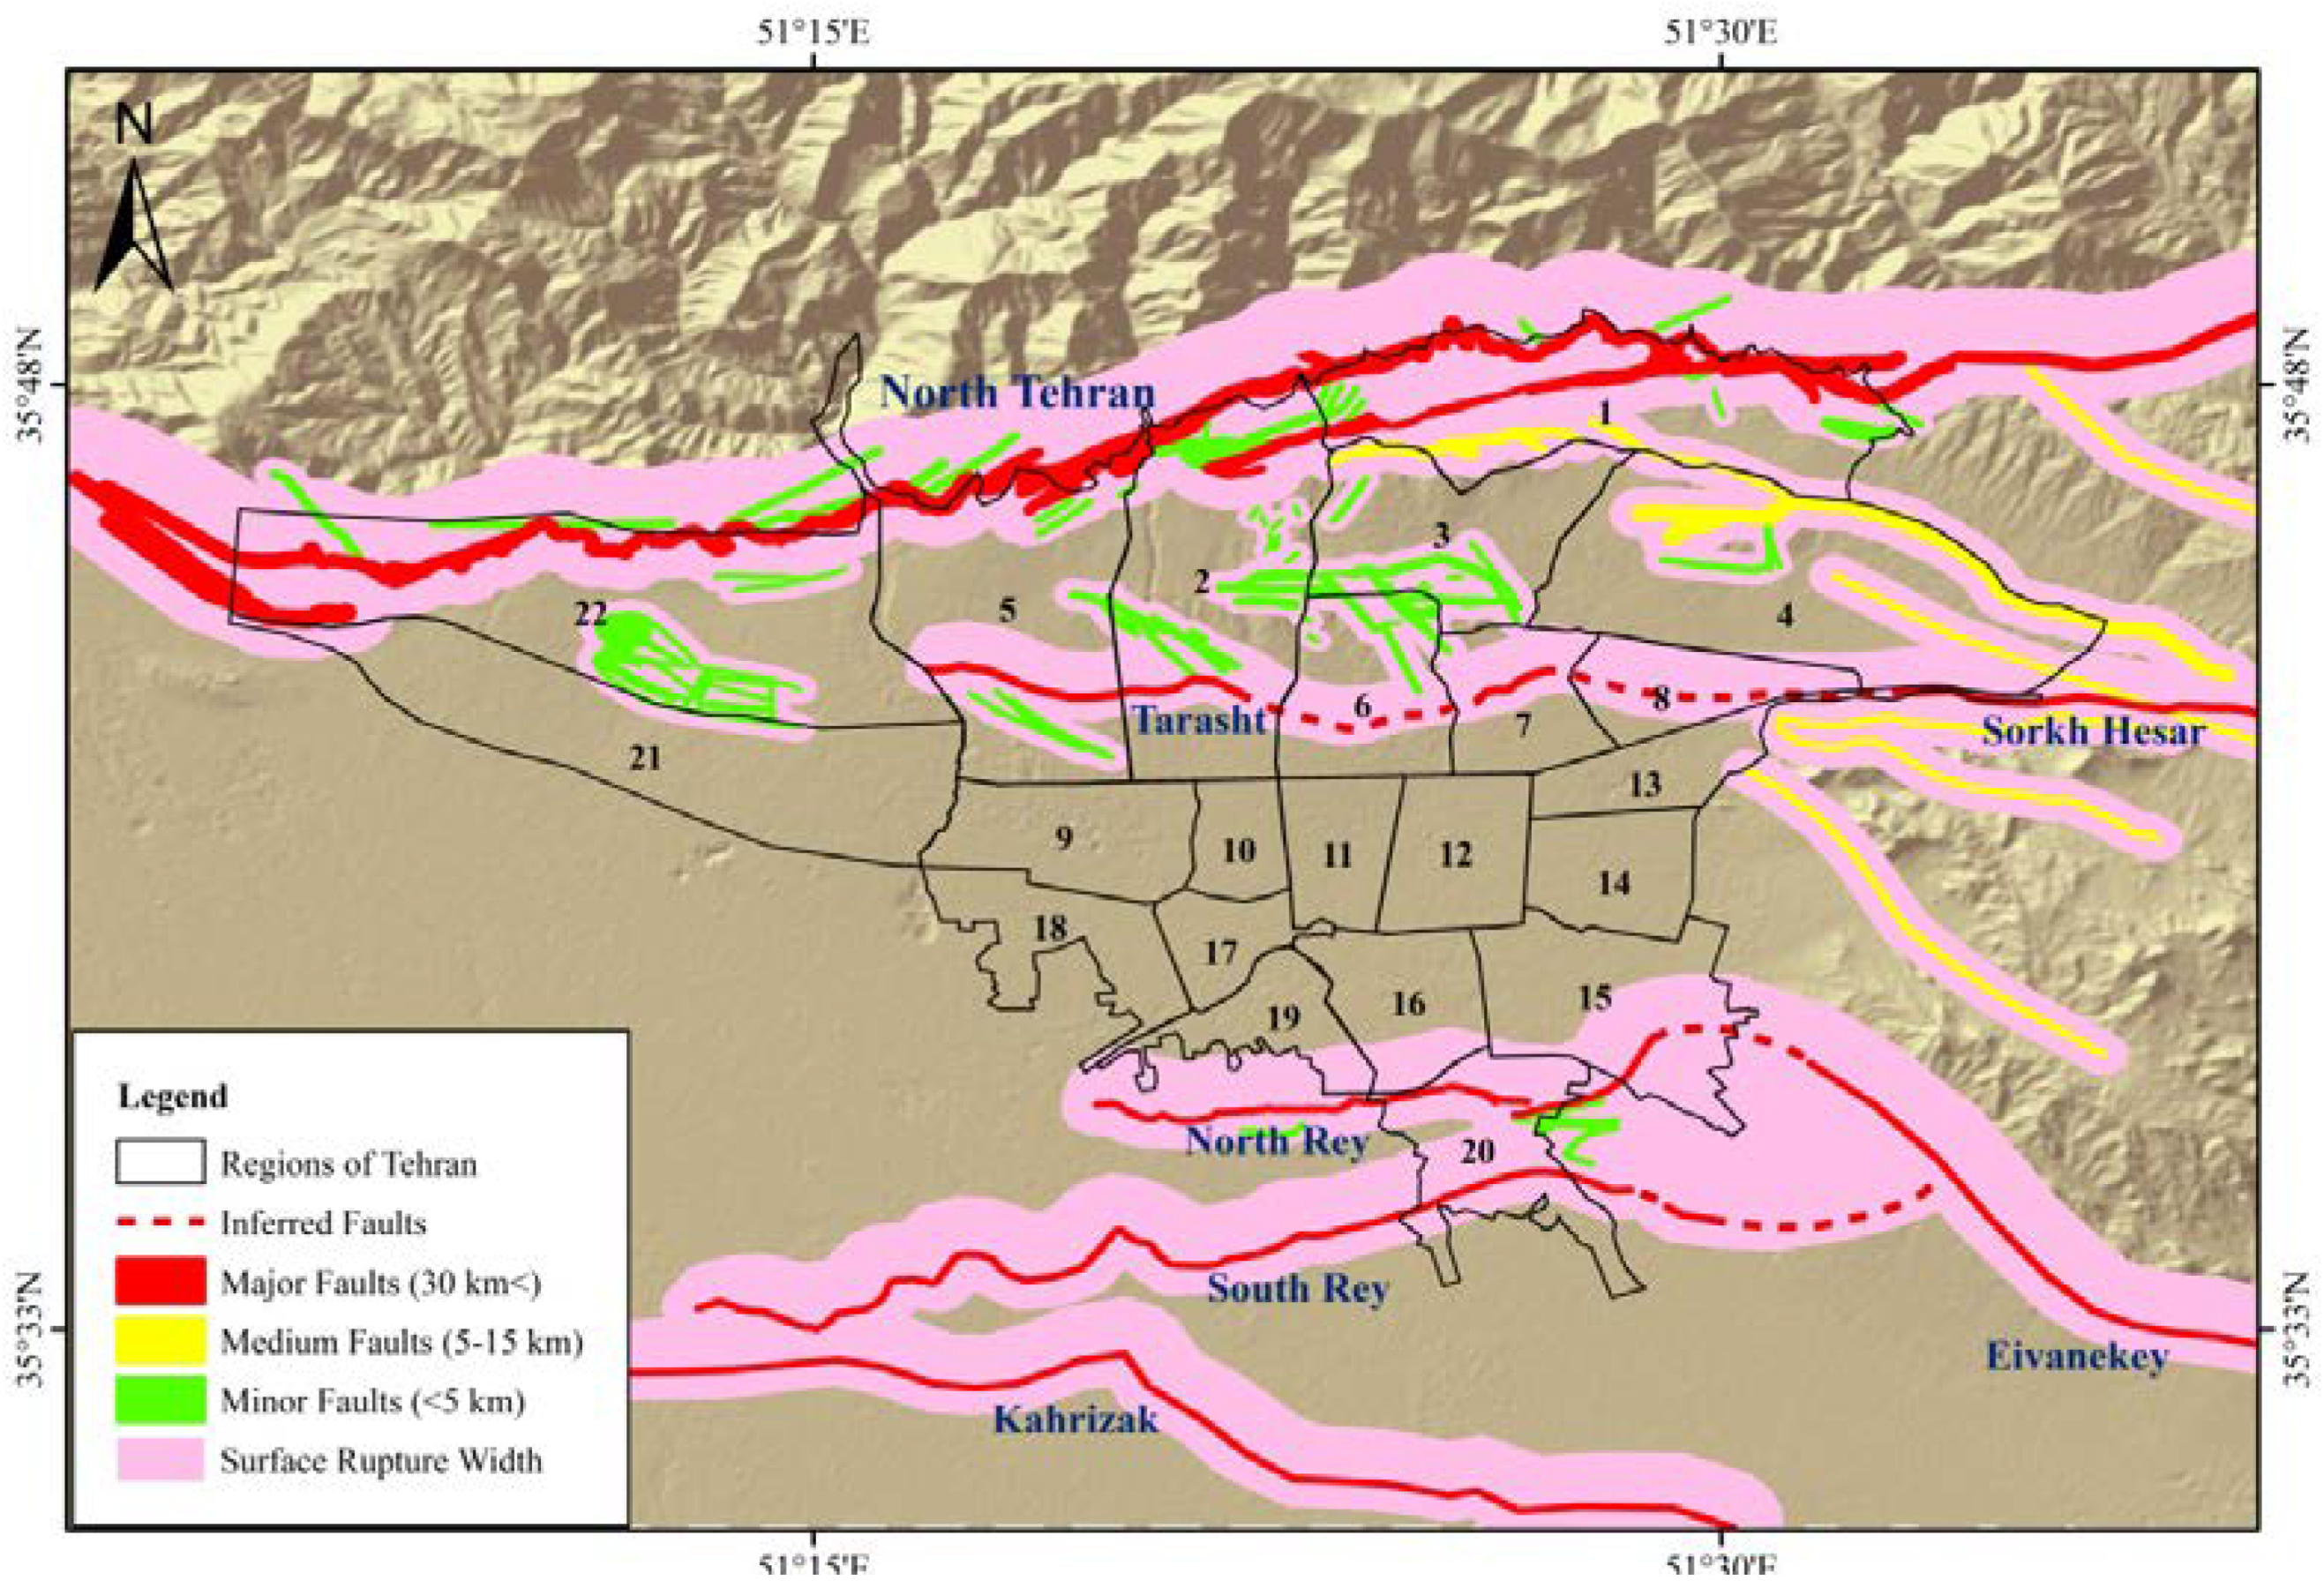
In this regard, we decided to consider potential areas prone to near-field effects and surface ruptures within fault zones as another aspect of earthquake hazard in Tehran. For this purpose, the main active faults in Tehran (Figure 6) are classified into three groups, including ‘major’, ‘medium’, and ‘minor’ faults, with a length of more than 15 km, 5–15 km, and less than 5 km, respectively. According to the records of seismic faults of the Iranian Plateau, surface rupture width best fits with the rupture length as the following empirical regression [81]:
where LR is the rupture length and is calcualted as 37% of the total fault length [75]. The coefficient a = −0.45, b = 0.48 with standard deviation of σ = 0.7. Therefore, the surface rupture width of each group is estimated according to the above formula (Table 2).
It should be noted that the sizes of up- and down-dip rupture widths are constrained by type of faulting, fault geology and geometry, stress distribution, soil thickness above bedrock, etc. [82,83]. In general, a down-dip rupture width on a fault occupies a larger area than an up-dip rupture width. For example, width of the rupture zone on the hanging wall (HW) is almost twice that of the footwall (FW), presenting a HW/ FW ratio of about 2 for simple thrust faults [84]. Therefore, in this study, two-thirds of the calculated rupture width on each fault is allocated to the hanging walls, and one-third is assigned to the footwalls of the faults. The rupture widths are shown in pink in Figure 6. It is also noteworthy to mention that detailed geological/neotectonic mapping might better determine the fault rupture width zones. This is because there are sometimes some splays highly localized, or fault-propagating folds which can be ignored under the current computational methodology. These structures are sometimes rather complex in terms of geology and geometry.
5. Exposure
Exposure is simply defined as the number of people or amounts of assets (e.g., physical, economic, social, environmental, historical, cultural, etc.) exposed to a hazard. Exposure can be evaluated based on observed (census) or estimated data. There are some exposure databases at a global scale such as GPW [85], GRUMP [86], and LandScan [87]. In case of lack of observed records, exposure databases can be generated using techniques such as high-resolution satellite imagery, LidAR data and building footprint maps e.g., ([88]).
Over the past 65 years, the population of Tehran province has increased from about 1.5 million to 15 million people (approximately 10 times). It should be considered that exposure is in fact a dynamic concept in urban areas, as it may vary during day and night times. This is the case for large cities such as the Tehran megacity, where there is a floating population of about 4 million people between the night (permanent residents) and the day time (permanent residents and people who come to Tehran from the surrounding cities for daily work).
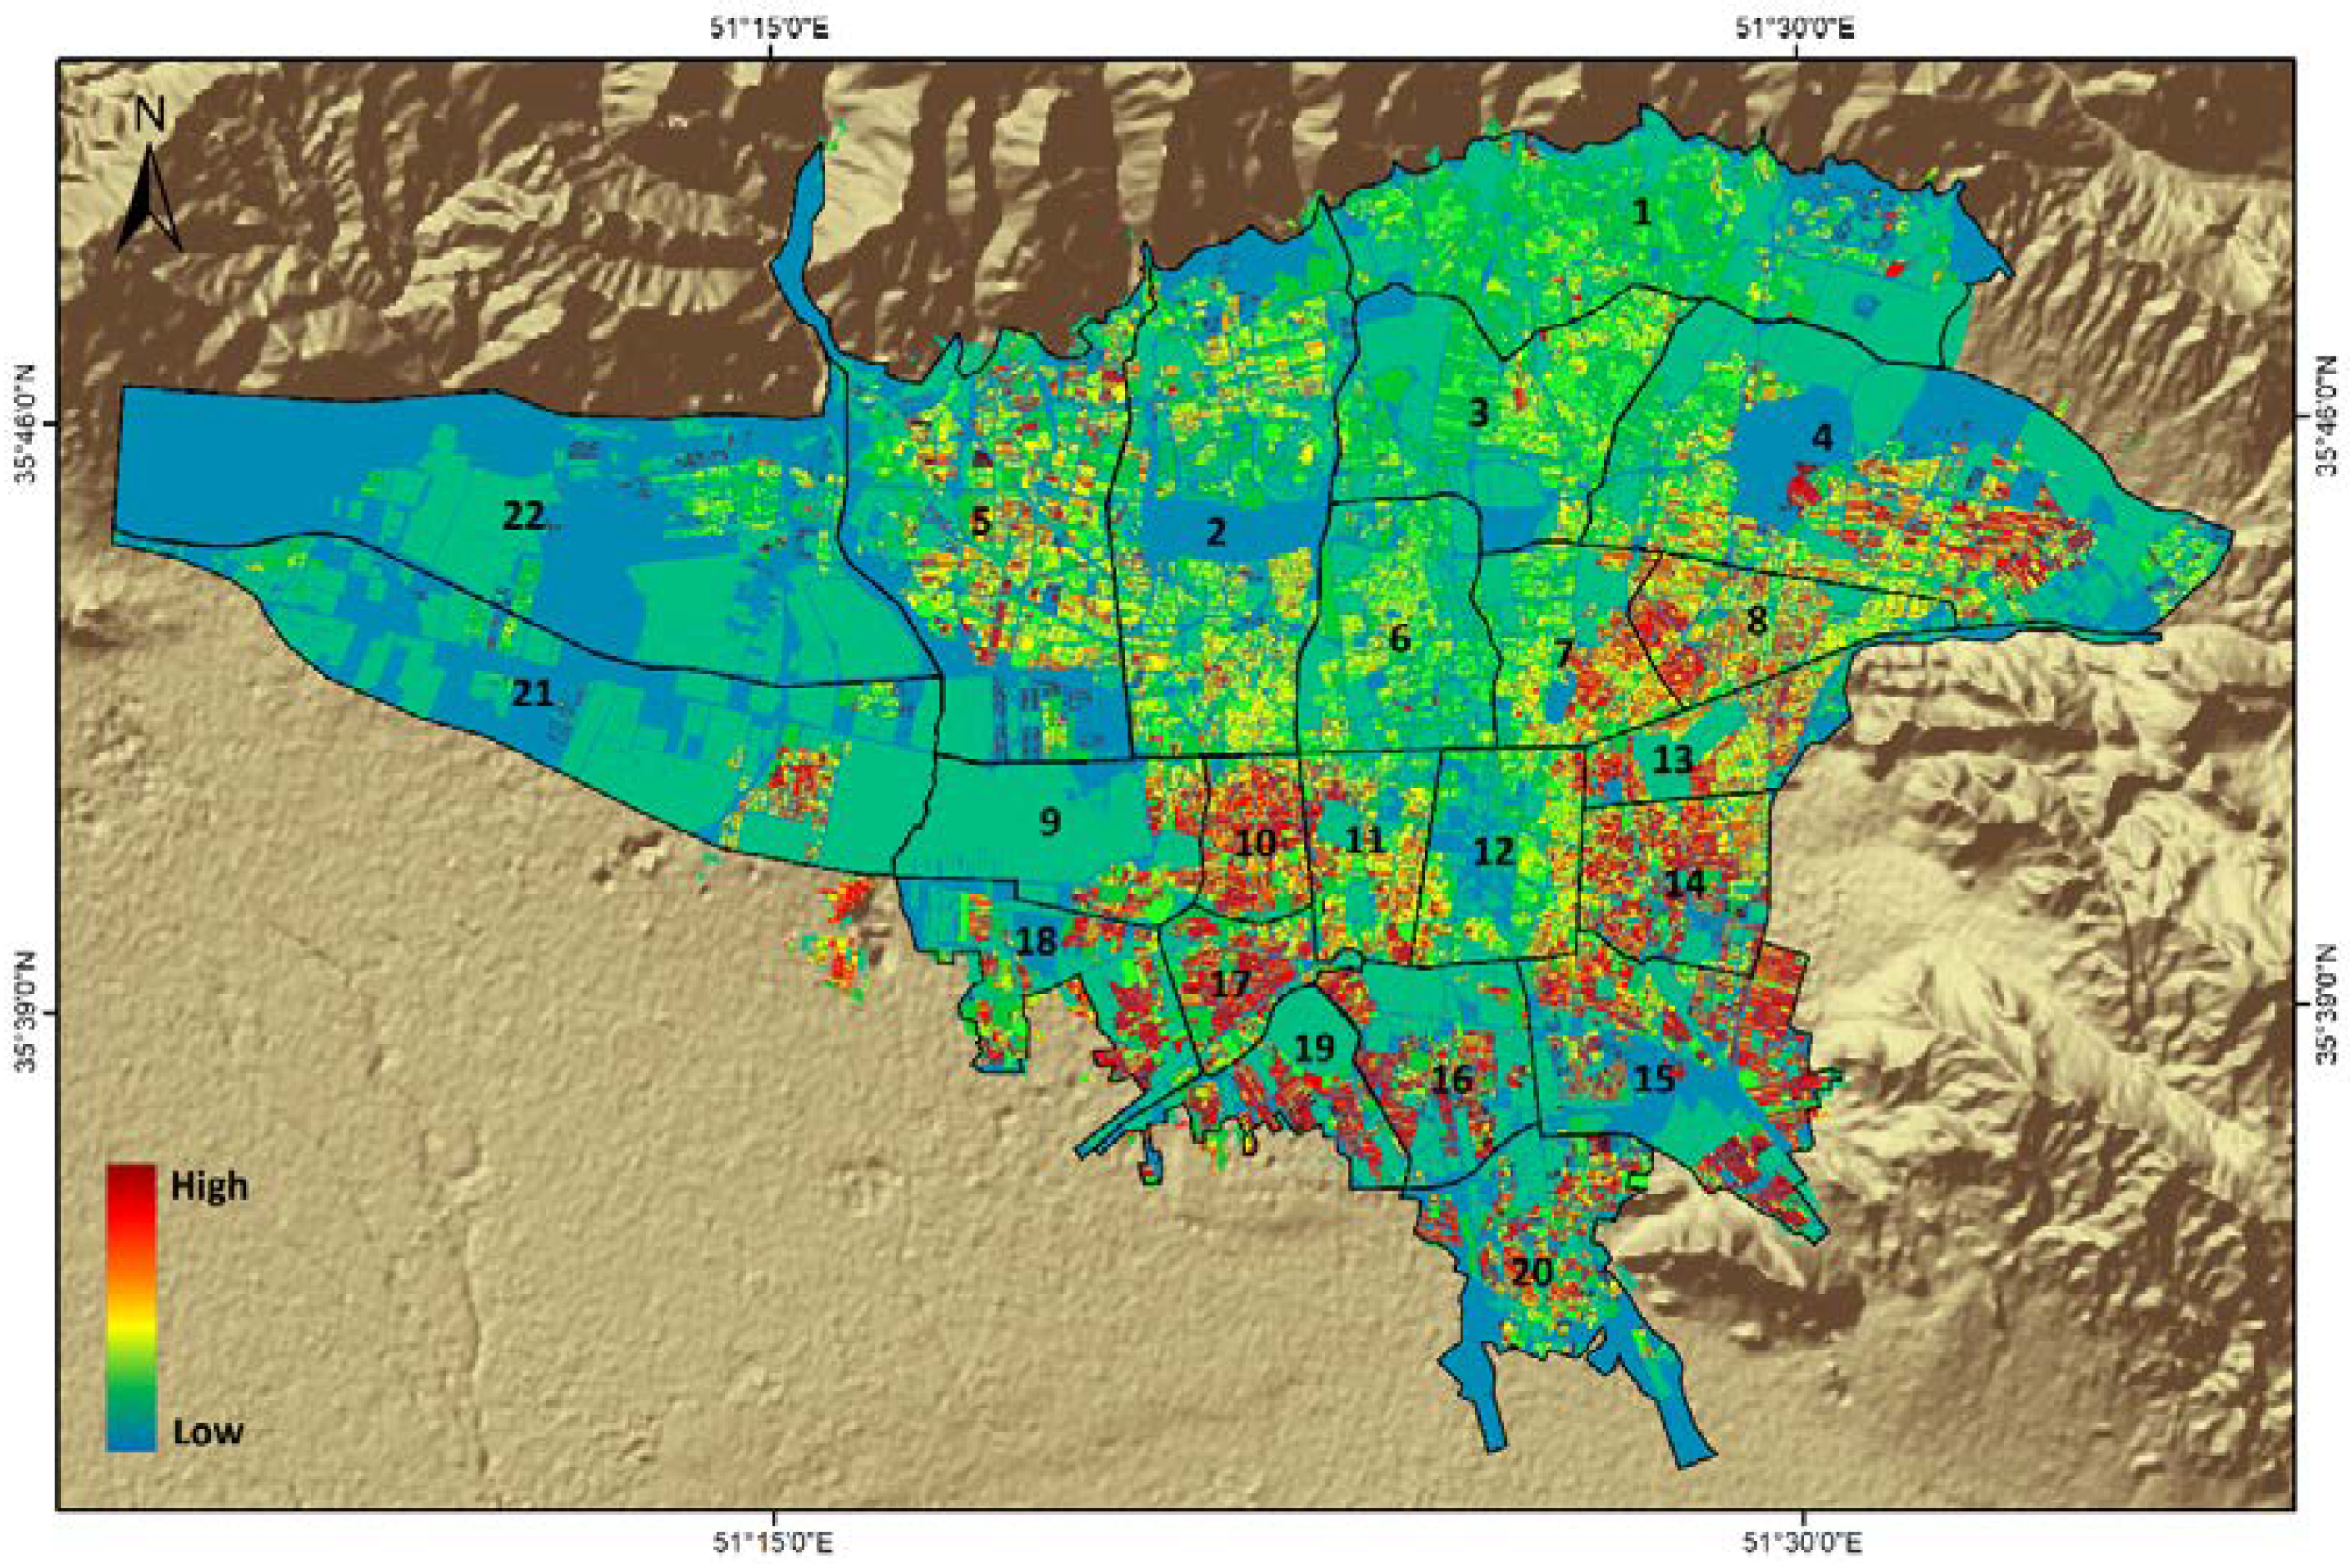
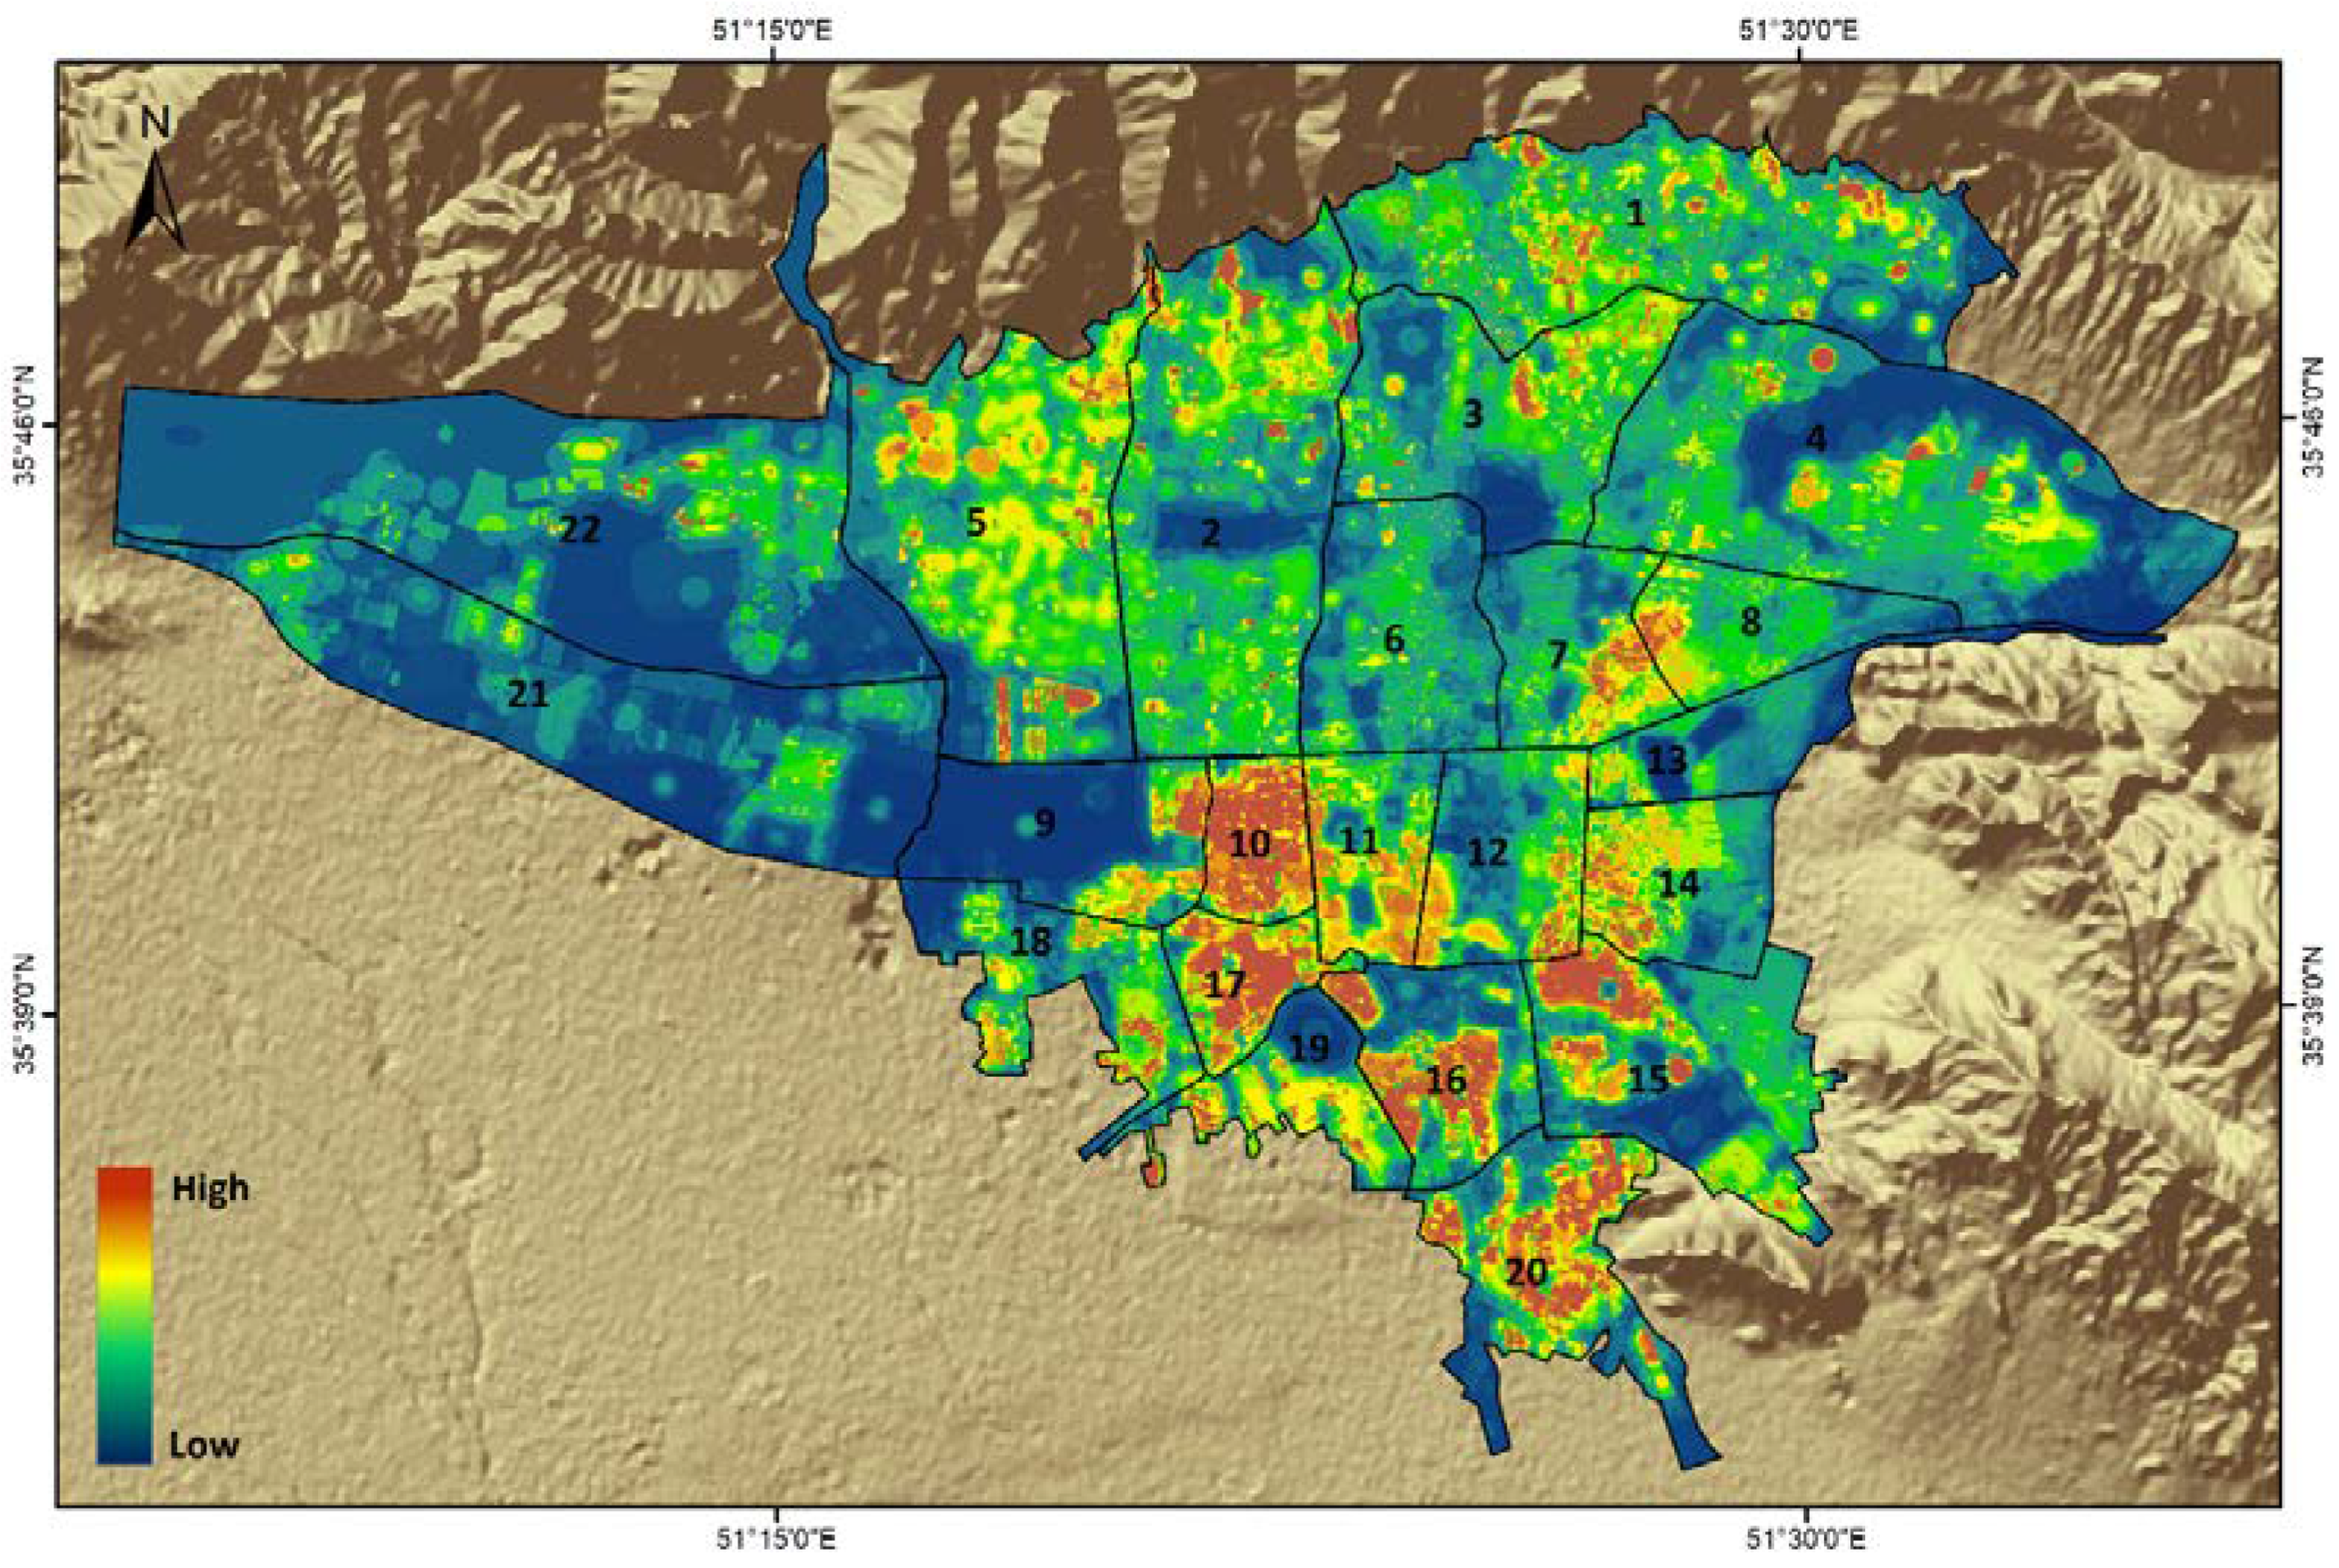
To investigate exposure in Tehran, we used the 2016 population distribution based on the formal census data [89]. Our dataset includes GIS-based urban building parcels along with the accurate number of inhabitants in each parcel. For the purposes of the study, we first normalized the population distribution by area of parcels and prepared a density map (number of inhabitants per square kilometers). The GIS layer of the population density in Figure 7 clearly indicates that, of 22 municipality districts of Tehran, districts No. 4, 7, 8, 10, 13, 14, 17 and 19 are the most densely populated regions.
6. Vulnerability
Seismic risk depends not only on the severity of an earthquake (hazard) or the number of people exposed (exposure), but also on the susceptibility of those people to suffer damages and losses (vulnerability). In this respect, vulnerability analysis plays an important, challenging role as the third part of the risk assessment procedure.
Vulnerability is a complex multi-dimensional concept that can cover a wide range of different components (e.g., physical, economic, social, psychological, environmental, cultural, institutional, political, etc.). In reality, given that the protection of human lives is the top priority in disaster risk assessments, physical vulnerability (vulnerability of the built environment) is usually considered as the main key factor among others.
Over the past few decades, population growth in Tehran has not only led to rapid urban development, but also simultaneously to various levels of vulnerability. To assess the seismic risk for Tehran, we selected seven spatial datasets which we had access to as the components of urban physical vulnerability. These GIS-based datasets include “land use”, “urban fabric”, “building height”, “occupancy”, “structure type”, “construction age’, and “vicinity to critical infrastructures”.
Taking into account the scale of our study, we had limited access to some datasets in terms of homogeneity. For example, for the two factors “structure type” and “construction age”, we had only access to data from the high-rise buildings (with more than 10 storeys), not all the buildings of the Tehran megacity. However, these high-rise buildings still constitute an important part of the urban area in terms of the built-environment vulnerability.
After the preparation of datasets, each of the seven spatial data layers is divided into three classes depending on its own characteristics. Each class (sublayer) is then assigned a weight. To avoid any complication, the weights are simply selected as 1, 2, and 3 which correspond to low, medium, and high vulnerability, respectively (Table 3).
It is worth mentioning that in order to classify the “urban fabric” factor, we have used the classification criteria of urban areas defined by Iran’s Council of Urban Planning and Architecture [90]. Accordingly, to identify the weariness of urban fabric, three criteria must be considered: (1) Instability: At least 50% of the buildings within a defined urban block are unstable and lack appropriate structural systems, (2) Micro-residency: At least 50% of the buildings within a defined urban block possess an area of less than 200 m2, and (3) Inscrutability: At least 50% of the passing routes within a defined urban block are narrow and less than six meters wide. Now, if the urban fabric in a region lacks the above criteria, it would be marked as “normal”. But in case it meets one of the above criteria, or all the three above criteria, it would be characterized as the “unstable” and “worn-out”, respectively.
Eventually, to assess the overall vulnerability in Tehran, all the classified layers should be overlapped and aggregated in a spatial framework. To do so, we adopted a simple strategy in which the raster maps of the seven vulnerability sublayers are first provided. All the raster maps consist of pixels (cells) of the same size (10 × 10 m). The coordinates at the center of pixels are considered as (xi, yi), where i refers to the number of the row and column of the grid. Each pixel of the grid obviously contains seven attribute values that represent the weights (W) of the vulnerability sublayers at the center of that pixel. The value of total vulnerability (Z) at each pixel is then calculated based on the sum of the weights of vulnerability sublayers (W) at the center of that pixel as follows:
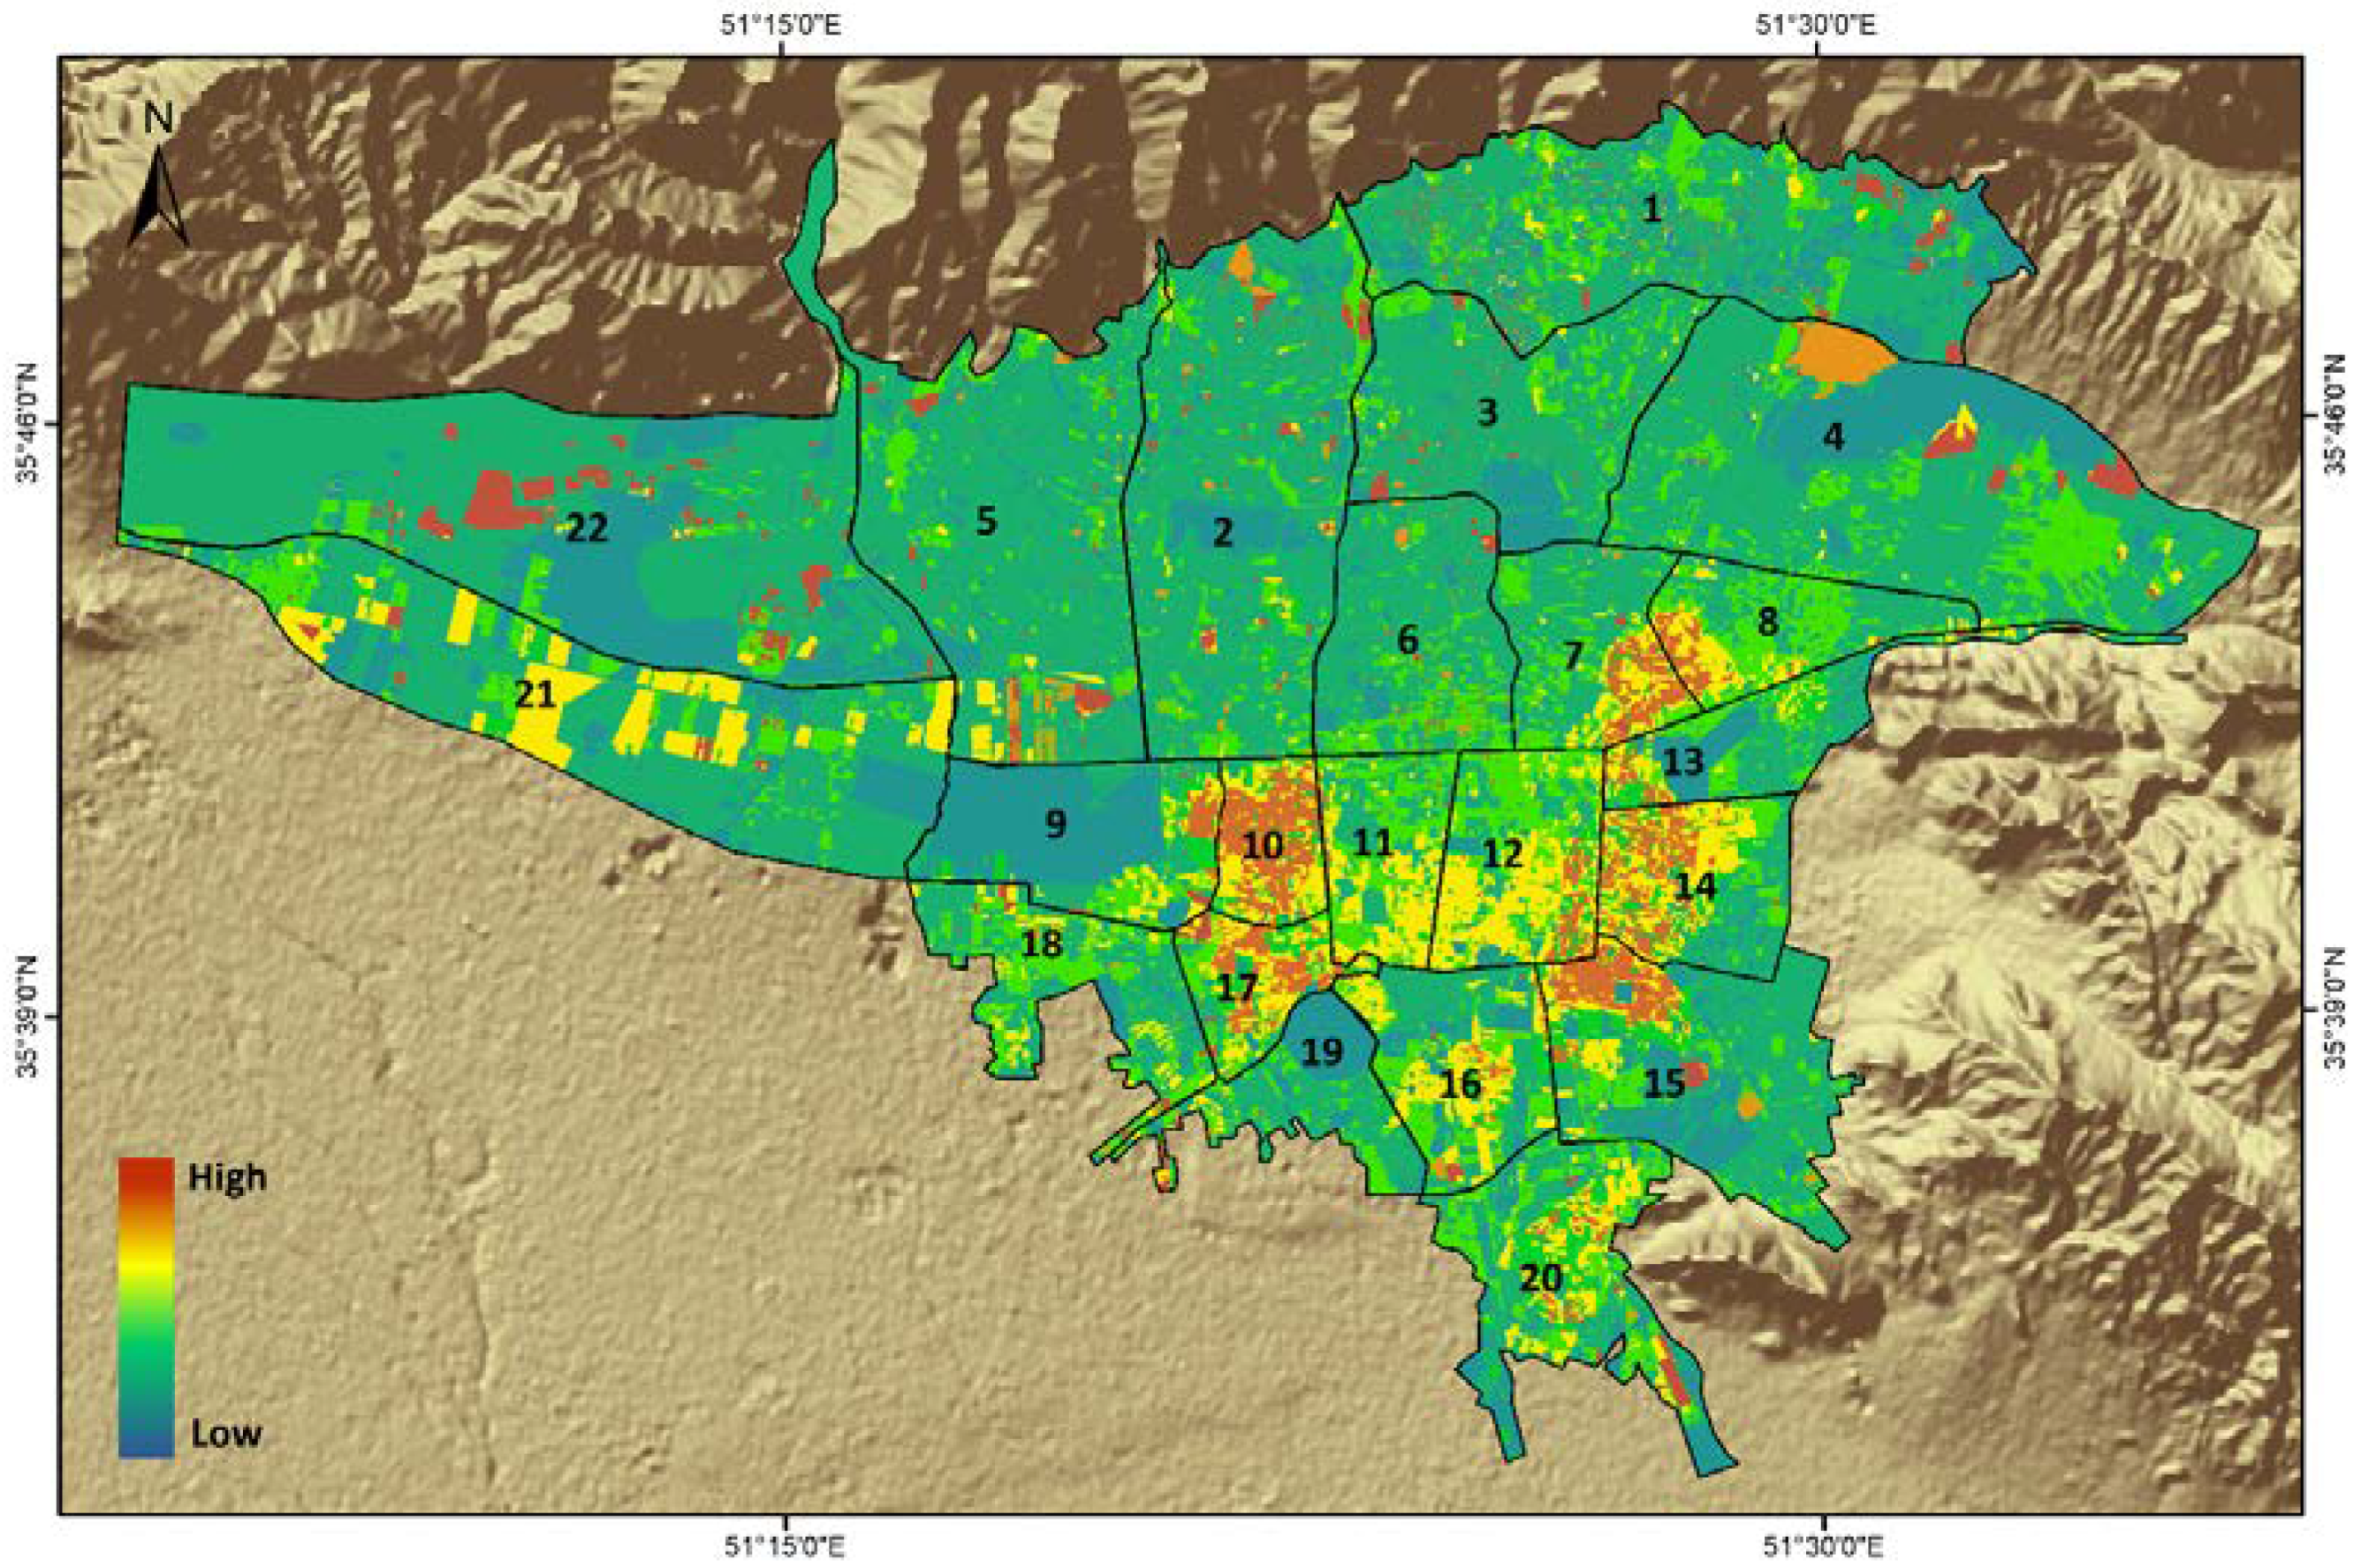
For example, a pixel that constitutes of a new, commercial, reinforced concrete tower that locates in a high urban density with normal fabric, and medium access to critical infrastructures, receives sublayer scores of 1, 2, 1, 3, 3, 1, and 2 for its age, occupancy, structure type, height, land use, urban fabric, and vicinity to infrastructures, respectively, the total vulnerability values of which equals 13. The result of the aggregation of the vulnerability sublayers for all the pixels has led to Figure 8 as the total vulnerability in Tehran. This figure shows that 10 out of 22 districts in the megacity of Tehran including districts no. 7, 8, 10, 11, 12, 14, 15, 16, 17, and 20 embrace a higher vulnerability than other districts. The expansion of vulnerability is almost consistent with the evolution of urban development in Tehran, as the old Tehran mainly included the central and southern parts of the present-day Tehran. Therefore, the southern half of the current city actually consists of older structures and more vulnerable factors than the northern half which is a newer built environment.
7. Risk
After the preparation of the maps of all the risk components, including hazard, exposure, and vulnerability, we need to classify these maps based on their values, and then combine them in order to derive the final earthquake risk map.
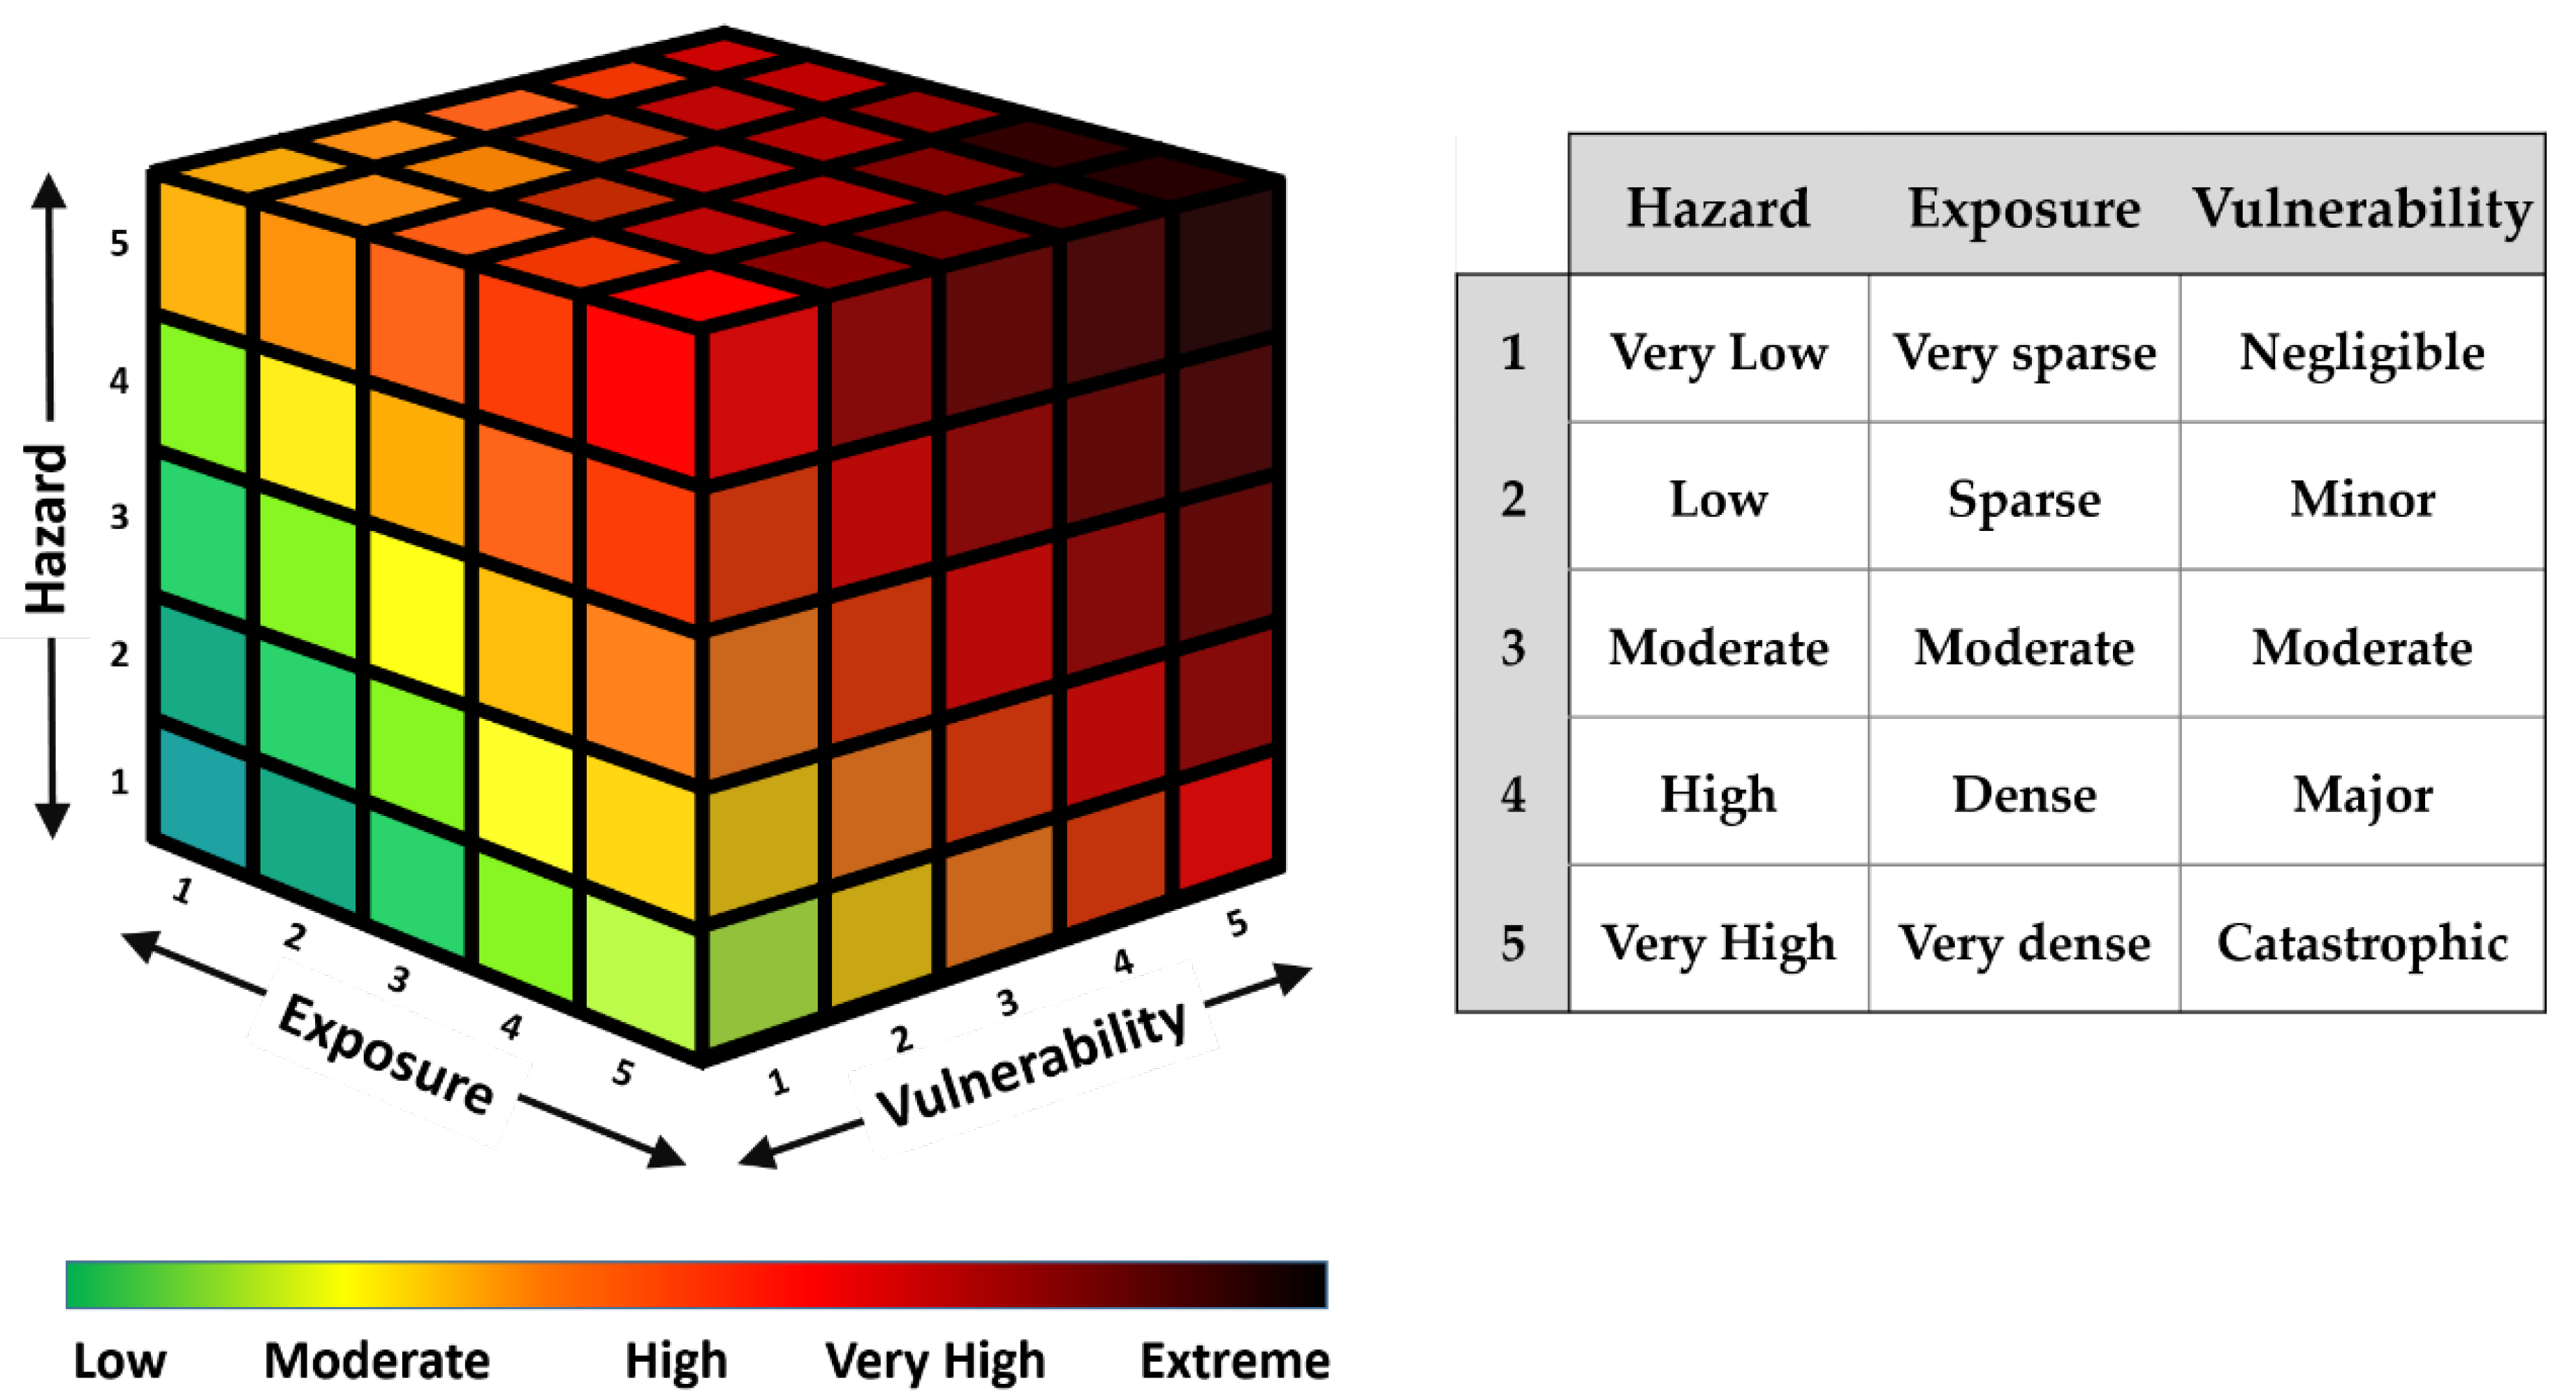
As we have mentioned before, we have considered two maps for the hazard component: surface PGA (Figure 5) and surface rupture width (Figure 6). The surface rupture width map clearly includes two zones inside and outside of the rupture area, having the weights of 1 and 0, respectively. The surface PGA values are also classified into five equal classes of 0.35–0.42, 0.42–0.49, 0.49–0.56, 0.56–0.63, and 0.63–0.7 g. The value ranges are then reclassified into five classes having new values of 1, 2, 3, 4, and 5 proportional to very low, low, medium, high, and very high hazard, respectively. Then, the two classified maps are aggregated in order to prepare a unified hazard map which consists of both ground shaking (PGA) and surface rupture width. Similarly to that applied to the surface PGA map, the exposure (Figure 7) and total vulnerability (Figure 8) maps are also reclassified into five classes of 1, 2, 3, 4, and 5, proportional to very low, low, medium, high, and very high exposure/vulnerability.
The combination of the above risk components can be conceptually represented using a 3D computation matrix (Figure 9). The elements of this matrix correspond to the five classes of each risk component. For example, a combination of the hazard class 5, exposure class 5 and vulnerability class 5 leads to the maximum risk value in the matrix. As we have modeled the hazard, exposure, and vulnerability components in a spatial framework, we combine them pixel by pixel using GIS, and eventually produce the final map which presents the current status of the earthquake risk in Tehran (Figure 10).
The final risk map indicates that the southern half of the megacity of Tehran is mostly at higher risk than the northern half. Looking at individual maps of the surface PGA, population density and vulnerability distribution, and comparison of them with the final risk map reveals that the nature of high-risk areas in central and southern parts of the city originates from the high hazard, high exposure, and high vulnerability that all together are surprisingly focused in these areas. This has important implications for future urban development plans and risk reduction efforts in order to make a more resilient Tehran.
8. Discussion and Conclusions
In this study, an earthquake risk assessment for Tehran is performed in order to provide an insight into the status of relative risk between different districts in Tehran and the possibility of relative comparison between them. At the first step, we used the most recent datasets (e.g., historical and instrumental catalog, active fault map, geology, etc.) and the best practices of the PSHA approach in order to assess the earthquake hazard in Tehran. The hazard is represented in terms of PGA maps for a 475–year return period, as well as a fault rupture width map. Exposure is then evaluated based on the distribution of population density. Besides the analysis of hazard and exposure, vulnerability to the built environment is also evaluated using seven GIS–based vulnerability datasets (land use, urban fabric, buildings’ height, occupancy, structure types and ages, as well as the vicinity to some critical infrastructures). Consequently, the seismic risk is computed by spatial combination of the three above factors in a 3D matrix, and a seismic risk map is derived for Tehran. The main findings of this study can be summarized as follows:
- Based on the hazard maps, northern and southern parts of Tehran are subjected to a high PGA of about 0.5 g on a bedrock level; however, regarding the local site response, the soft, thick soil layers in southern parts of Tehran have the potential of amplifying seismic waves up to twice of the calculated values on the rock. For example, this amount is estimated to be 0.7 g for the southwestern parts of Tehran.
- Experiences of previous earthquakes indicate that some specific phenomena related to near-field earthquakes may also result in large damages especially in urban areas. Such phenomena can occur in the form of surface fault rupture, large cracks, and directivity effects, fling step, fault scarps, etc. With respect to the fact that the northern and southern parts of Tehran embrace several active faults, these regions should be taken into account as high–potential areas for hosting the mentioned phenomena. Therefore, a surface rupture widths map was also prepared for the surrounding and inner-city faults of Tehran using the faults’ geometry. Results indicate that we should expect surface rupture widths of about 2–3, 1.5, and 1 km for the major, medium, and minor faults in Tehran, respectively.
- As mentioned in Section 2 and Section 3, Tehran currently lays on a seismic gap. Regarding that we have applied a time-independent hazard assessment in this study, the duration since the last event is not considered here, so this seismic gap observation in Tehran is not taken into account in our model. Therefore, a future perspective for this study would be an assessment of time-dependent hazard, which considers possible seismic gaps in order to calculate time-dependent conditional probabilities. This would be helpful to arrive at a better understanding of the potential hazard associated with this seismic gap in order to adopt appropriate strategies for earthquake risk reduction.
- The population density map (Figure 7) clearly indicates that, of 22 municipality districts of Tehran, eight districts are the most densely populated areas in Tehran. A comparison of this human exposure with the overall physical vulnerability map (Figure 8) reveals that, in some areas, the population is exactly focused at the highest vulnerable places, which should be considered as an urgent issue in future urban development efforts.
- According to the overall physical vulnerability map (Figure 8), 10 out of 22 districts in the megacity of Tehran including districts no. 7, 8, 10, 11, 12, 14, 15, 16, 17, and 20 show a higher vulnerability than other districts. These results are in a good general agreement with some previous studies on the vulnerability of urban fabrics and building loss models in Tehran [91,92,93].
- The overall risk map, which is depicted as a result of the combination of hazard, exposure and vulnerability maps, represents an estimate of risk distribution in Tehran. It generally indicates that the southern half of the city has a higher risk than the northern half. Yet the amount of risk should not be underestimated in other areas, especially the northwest parts (such as district no. 5 and 22) where are home to the North Tehran fault and also under rapid urban expansion and development. A comparison between our study with a previous physical-socioeconomic risk assessment study in Tehran [94] indicates that the previous study [94] ranks districts no. 15, 20, 12, 16, 18, and 11 of Tehran as the top regions in terms of physical risk, while our results suggest that districts no. 10, 17, 20, 16, 15, and 11 contain the highest risk. In general, the results show some similarities, and the discrepancies originate from the difference in input data and the adopted methodologies. For example, in the previous study [94], a scenario-based seismic hazard only corresponding to earthquake occurrence on the Ray fault in south Tehran is considered, while in this study, we have adopted a PSHA analysis considering all surrounding major faults, site response considerations, as well as rupture width zones. Consequently, the results of our study provide a useful basis not only for understanding earthquake risk in Tehran, but also for prioritizing seismic risk reduction measures and increasing resilience in this megacity.
Author Contributions
Conceptualization was conducted by Farnaz Kamranzad, Hossein Memarian and Mehdi Zare; Data analysis, model building, visualization and manuscript writing was performed by Farnaz Kamranzad; Hossein Memarian and Mehdi Zare revised the manuscript and provided useful advice; All authors have read and agreed to the published version of the manuscript
Funding
This research received no external funding.
Acknowledgments
The authors highly appreciate Tehran’s Disaster Mitigation and Management Organization (TDMMO) for providing us with the GIS datasets of population and vulnerability. Thanks to the three anonymous reviewers and the editor for their valuable comments and feedback on the manuscript.
Conflicts of Interest
The authors declare no conflict of interest.
References
- Munich Reinsurance Company MunichRe, NatCatSERVICE Analysis Tool, Natural Loss Events 1980–2018. Available online: https://natcatservice.munichre.com/ (accessed on 1 April 2020).
- Swiss Reinsurance Company. SwissRe, Sigma Research. Natural Catastrophes 1990–2018. Available online: https://sigma-explorer.com/ (accessed on 1 April 2020).
- Centre for Research on the Epidemiology of Disasters (CRED). EM-DAT. The International Disaster Database. Available online: https://www.emdat.be/ (accessed on 1 April 2020).
- OECD. Financial Management of Earthquake Risk; Organisation for Economic Co-operation and Development (OECD): Paris, France, 2018. [Google Scholar]
- UNDRR. Sendai Framework for Disaster Risk Reduction 2015–2030; United Nations Office for Disaster Risk Reduction (UNDRR): Geneva, Switzerland, 2015. [Google Scholar]
- UN. Transforming Our World: The 2030 Agenda for Sustainable Development; United Nations (UN): Geneva, Switzerland, 2015. [Google Scholar]
- CRED; UNISDR. Economic Losses, Poverty and Disasters 1998–2017; The Centre for Research on the Epidemiology of Disasters (CRED): Brussels, Belgium, 2018. [Google Scholar]
- Silva, V.; Amo-Oduro, D.; Calderon, A.; Costa, C.; Dabbeek, J.; Despotaki, V.; Martins, L.; Pagani, M.; Rao, A.; Simionato, M.; et al. Development of a global seismic risk model. Earthq. Spectra 2020. [Google Scholar] [CrossRef]
- Silva, V.; Pagani, M.; Schneider, J.; Henshaw, P. Assessing Seismic Hazard and Risk Globally for an Earthquake Resilient World–Contributing Paper to GAR 2019; Global Earthquake Model Foundation: Pavia, Italy, 2019. [Google Scholar]
- Silva, V.; AmoOduro, D.; Calderon, A.; Dabbeek, J.; Despotaki, V.; Martins, L.; Rao, A.; Simionato, M.; Vigano, D.; Yepes, C.; et al. Global Earthquake Model (GEM) Risk Map; Global Earthquake Model Foundation: Pavia, Italy, 2018. [Google Scholar]
- UNDRR. Proposed Updated Terminology on Disaster Risk Reduction: A Technical Review; The United Nations Office for Disaster Risk Reduction (UNDRR): Geneva, Switzerland, 2015. [Google Scholar]
- UN. Open-Ended Intergovernmental Expert Working Group on Indicators and Terminology Relating to Disaster Risk Reduction (OIEWG); United Nations General Assembly: New York, NY, USA, 2016. [Google Scholar]
- UNDRR. Global Assessment Report on Disaster Risk Reduction (GAR) 2019; United Nations Office for Disaster Risk Reduction (UNDRR): Geneva, Switzerland, 2019. [Google Scholar]
- Faravelli, M.; Borzi, B.; Wenzel, H.; Herrmann, M.; Zechar, J. Guidelines for Implementing Real-Time Risk Assessment during Earthquake Emergencies; Network of European Research Infrastructures for Earthquake Risk Assessment and Mitigation (NERA): Zurich, Switzerland, 2014. [Google Scholar]
- PreventionWeb. Available online: https://www.preventionweb.net/risk/disaster-risk (accessed on 1 May 2020).
- Sinadinovski, C.; Edwards, M.; Corby, N.; Milne, M.; Dale, K.; Dhu, T.; Jones, A.; McPherson, A.; Jones, T.; Gray, D.; et al. Earthquake risk. In Natural Hazard Risk in Perth; WA Geoscience Australia: Canberra, Australia, 2005; pp. 143–207. [Google Scholar]
- UNISDR. 2009 UNISDR Terminology on Disaster Risk Reduction; United Nations Office on Disaster Risk Reduction: Geneva, Switzerland, 2009. [Google Scholar]
- Silva, V.; Crowley, H.; Bazzurro, P. Exploring risk-targeted hazard maps for Europe. Earthq. Spectra 2016, 32, 1165–1186. [Google Scholar] [CrossRef]
- Crowley, H.; Rodrigues, D.; Silva, V.; Despotaki, V.; Romao, X.; Castro, M.; Akkar, S.; Hancilar, U.; Pitilakis, K.; Pitilakis, D. Towards a uniform earthquake risk model for Europe. In Proceedings of the 16th European Conference on Earthquake Engineering, Thessaloniki, Greece, 18–21 June 2018. [Google Scholar]
- Crowley, H.; Rodrigues, D.; Silva, V.; Despotaki, V.; Martins, L.; Romão, X.; Castro, J.; Pereira, N.; Pomonis, A.; Lemoine, A.; et al. The European seismic risk model 2020 (ESRM 2020). In Proceedings of the 2nd International Conference on Natural Hazards & Infrastructure, Chania, Crete Island, Greece, 23–26 June 2019. [Google Scholar]
- Crowley, H.; Colombi, M.; Borzi, B.; Faravelli, M.; Onida, M.; Lopez, M.; Polli, D.; Meroni, F.; Pinho, R. A comparison of seismic risk maps for Italy. Bull. Earthq. Eng. 2009, 7, 149–180. [Google Scholar] [CrossRef] [Green Version]
- Silva, V.; Crowley, H.; Varum, H.; Pinho, R. Seismic risk assessment for mainland Portugal. Bull. Earthq. Eng. 2015, 13, 429–457. [Google Scholar] [CrossRef]
- Swiss Seismological Service. Available online: http://www.seismo.ethz.ch/static/webrisktool2016/risktool_EN.html (accessed on 1 April 2020).
- Tyagunov, S.; Stempniewski, L.; Grünthal, G.; Wahlström, R.; Zschau, J. Vulnerability and risk assessment for earthquake prone cities. In Proceedings of the 13th World Conference on Earthquake Engineering (13 WCEE), Vancouver, BC, Canada, 1–6 August 2004. [Google Scholar]
- Marulanda, M.C.; Carreno, M.L.; Cardona, O.D.; Ordaz, M.G.; Barbat, A.H. Probabilistic earthquake risk assessment using CAPRA: Application to the city of Barcelona, Spain. Nat. Hazards 2013, 69, 59–84. [Google Scholar] [CrossRef]
- Karimzadeh, S.; Miyajima, M.; Hassanzadeh, R.; Amiraslanzadeh, R.; Kamel, B. A GIS-based seismic hazard, building vulnerability and human loss assessment for the earthquake scenario in Tabriz. Soil Dyn. Earthq. Eng. 2014, 66, 263–280. [Google Scholar] [CrossRef]
- Sinha, N.; Priyanka, N.; Joshi, P. Using spatial multi-criteria analysis and ranking tool (SMART) in earthquake risk assessment: A case study of Delhi region, India. Geomat. Nat. Hazards Risk 2014, 7, 680–701. [Google Scholar] [CrossRef] [Green Version]
- Pavel, F.; Vacareanu, R. Scenario-based earthquake risk assessment for Bucharest, Romania. Int. J. Disaster Risk Reduct. 2016, 20, 138–144. [Google Scholar] [CrossRef]
- Badawy, A.; Korrat, I.; El-Hadidy, M.; Gaber, H. Update earthquake risk assessment in Cairo, Egypt. J. Seismol. 2017, 21, 571–589. [Google Scholar] [CrossRef]
- Salgado-Gálvez, M.A.; Bernal, G.A.; Zuloaga, D.; Marulanda, M.C.; Cardona, O.-D.; Henao, S. Probabilistic seismic risk assessment in Manizales, Colombia: Quantifying losses for insurance purposes. Int. J. Disaster Risk Sci. 2017, 8, 296–307. [Google Scholar] [CrossRef] [Green Version]
- Giannaraki, G.; Kassaras, I.; Roumelioti, Z.; Kazantzidou-Firtinidou, D.; Ganas, A. Deterministic seismic risk assessment in the city of Aigion (W. Corinth Gulf, Greece) and juxtaposition with real damage due to the 1995 Mw6. 4 earthquake. Bull. Earthq. Eng. 2018, 17, 603–634. [Google Scholar] [CrossRef]
- Hancilar, U.; El-Hussain, I.; Sesetyan, K.; Deif, A.; Cakti, E.; Al-Rawas, G.; Safak, E.; Al-Jabri, K. Earthquake risk assessment for the building inventory of Muscat, Sultanate of Oman. Nat. Hazards 2018, 93, 1419–1434. [Google Scholar] [CrossRef]
- Zhuang, J.; Peng, J.; Zhu, X.; Huang, W. Scenario-based risk assessment of earthquake disaster using slope displacement, PGA, and population density in the guyuan region, China. ISPRS Int. J. Geo-Inf. 2019, 8, 85. [Google Scholar] [CrossRef] [Green Version]
- Shi, Y.; Seeland, K. Using RISKPLAN for Earthquake risk assessment in Sichuan Province, China. Sustainability 2019, 11, 1812. [Google Scholar] [CrossRef] [Green Version]
- Jena, R.; Pradhan, B.; Beydoun, G.; Sofyan, H.; Affan, M. Integrated model for earthquake risk assessment using neural network and analytic hierarchy process: Aceh province, Indonesia. Geosci. Front. 2019. [Google Scholar] [CrossRef]
- Hussain, E.; Elliott, J.R.; Silva, V.; Vilar-Vega, M.; Kane, D. Contrasting seismic risk for Santiago, Chile, from near-field and distant earthquake sources. Nat. Hazards Earth Syst. Sci. 2019. [Google Scholar] [CrossRef]
- Tadjer, K.; Bensaibi, M. Earthquake risk assessment of Blida (Algeria) using GIS. Energy Procedia 2017, 139, 645–650. [Google Scholar] [CrossRef]
- Herrmann, M.; Zechar, J.D.; Wiemer, S. Communicating time-varying seismic risk during an earthquake sequence. Seismol. Res. Lett. 2016, 87, 301–312. [Google Scholar] [CrossRef]
- Gulia, L.; Tormann, T.; Wiemer, S.; Herrmann, M.; Seif, S. Short-term probabilistic earthquake risk assessment considering time-dependent b values. Geophys. Res. Lett. 2016, 43, 1100–1108. [Google Scholar] [CrossRef] [Green Version]
- Zechar, J.D.; Herrmann, M.; van Stiphout, T.; Wiemer, S. Forecasting seismic risk as an earthquake sequence happens. In Earthquake Hazard, Risk and Disasters; Elsevier: Amsterdam, The Netherlands, 2014. [Google Scholar]
- Mili, R.R.; Hosseini, K.A.; Izadkhah, Y.O. Developing a holistic model for earthquake risk assessment and disaster management interventions in urban fabrics. Int. J. Disaster Risk Reduct. 2018, 27, 355–365. [Google Scholar] [CrossRef]
- OpenQuake. Global Earthquake Model (GEM) Foundation. Available online: https://www.globalquakemodel.org/openquake (accessed on 1 April 2020).
- HAZUS-MH. United States Federal Emergency Management Agency (FEMA). Available online: https://www.fema.gov/hazus (accessed on 1 April 2020).
- CAPRA. Comprehensive Approach to Probabilistic Risk Assessment. UNISDR and World Bank. Available online: https://ecapra.org/ (accessed on 1 April 2020).
- INFORM-GRI. Inter-Agency Standing Committee (IASC) and the European Commission. Available online: https://drmkc.jrc.ec.europa.eu/inform-index (accessed on 1 April 2020).
- El Ezz, A.A.; Smirnoff, A.; Nastev, M.; Nollet, M.-J.; McGrath, H. ER2-earthquake: Interactive web-application for urban seismic risk assessment. Int. J. Disaster Risk Reduct. 2019, 34, 326–336. [Google Scholar] [CrossRef]
- EQRM. Earthquake Risk Model; Geoscience Australia: Canberra, Australia, 2005. [Google Scholar]
- Norio, O.; Ye, T.; Kajitani, Y.; Shi, P.; Tatano, H. The 2011 eastern Japan great earthquake disaster: Overview and comments. Int. J. Disaster Risk Sci. 2011, 2, 34–42. [Google Scholar] [CrossRef] [Green Version]
- Şengör, A.; Altiner, D.; Cin, A.; Ustaomer, T.; Hsu, K. Origin and assembly of the Tethyside orogenic collage at the expense of Gondwana Land. Geol. Soc. 1988, 31, 119–181. [Google Scholar] [CrossRef]
- Vernant, P.; Nilforoushan, F.; Hatzfeld, D.; Abbassi, M.; Vigny, C.; Masson, F.; Nankali, H.; Martinod, J.; Ashtiani, A.; Bayer, R.; et al. Present-day crustal deformation and plate kinematics in the Middle East constrained by GPS measurements in Iran and northern Oman. Geophys. J. Int. 2004, 157, 381–398. [Google Scholar] [CrossRef] [Green Version]
- Masson, F.; Lehujeur, M.; Ziegler, Y.; Doubre, C. Strain rate tensor in Iran from a new GPS velocity field. Geophys. J. Int. 2014, 197, 10–21. [Google Scholar] [CrossRef] [Green Version]
- Khorrami, F.; Vernant, P.; Masson, F.; Nilfouroushan, F.; Mousavi, Z.; Nankali, H.; Saadat, S.A.; Walpersdorf, A.; Hosseini, S.; Tavakoli, P.; et al. An up-to-date crustal deformation map of Iran using integrated campaign-mode and permanent GPS velocities. Geophys. J. Int. 2019, 217, 832–843. [Google Scholar] [CrossRef]
- Talebian, M.; Copley, A.; Fattahi, M.; Ghorashi, M.; Jackson, J.; Nazari, H.; Sloan, R.; Walker, R. Active faulting within a megacity: The geometry and slip rate of the Pardisan thrust in central Tehran, Iran. Geophys. J. Int. 2016, 207, 1688–1699. [Google Scholar] [CrossRef] [Green Version]
- Hessami, K.; Jamali, F. Explanatory notes to the map of major active faults of Iran. J. Seismol. Earthq. Eng. 2006, 8, 1–11. [Google Scholar]
- Ambraseys, N.N.; Melville, C.P. A History of Persian Earthquakes; Cambridge University Press: Cambridge, UK, 1982. [Google Scholar]
- Berberian, M.; Yeats, R.S. Patterns of historical earthquake rupture in the Iranian Plateau. Bull. Seismol. Soc. Am. 1999, 89, 120–139. [Google Scholar]
- Ritz, J.F.; Nazari, H.; Balescu, S.; Lamothe, M.; Salamati, R.; Ghassemi, A.; Shafei, A.; Ghorashi, M.; Saidi, A. Paleoearthquakes of the past 30,000 years along the North Tehran Fault (Iran). J. Geophys. Res. Solid Earth 2012, 117. [Google Scholar] [CrossRef] [Green Version]
- Azad, S.S.; Ritz, J.-F.; Abbassi, M.R. Left-lateral active deformation along the Mosha–North Tehran fault system (Iran): Morphotectonics and paleoseismological investigations. Tectonophysics 2011, 497, 1–14. [Google Scholar] [CrossRef]
- Ghassemi, M.R.; Fattahi, M.; Landgraf, A.; Ahmadi, M.; Ballato, P.; Tabatabaei, S.H. Kinematic links between the Eastern Mosha Fault and the North Tehran Fault, Alborz range, northern Iran. Tectonophysics 2014, 622, 81–95. [Google Scholar] [CrossRef]
- Nazari, H.; Ritz, J.-F.; Salamati, R.; Shafei, A.; Ghassemi, A.; Michelot, J.-L.; Massault, M.; Ghorashi, M. Morphological and palaeoseismological analysis along the Taleghan fault (Central Alborz, Iran). Geophys. J. Int. 2009, 178, 1028–1041. [Google Scholar] [CrossRef] [Green Version]
- Nazari, H.; Ritz, J.F.; Salamati, R.; Shahidi, A.; Habibi, H.; Ghorashi, M.; Bavandpur, A.K. Distinguishing between fault scarps and shorelines: The question of the nature of the Kahrizak, North Rey and South Rey features in the Tehran plain (Iran). Terra Nova 2010, 22, 227–237. [Google Scholar] [CrossRef]
- Niri, T.M.; Nazari, H.; Qarashi, M.; Talebian, M. Paleoseimology study on Pishva fault (South Tehran), Iran. In EGU General Assembly Conference Abstracts; European Geosciences Union (EGU): Munich, Germany, 2010; p. 1511. [Google Scholar]
- Zare, M.; Amini, H.; Yazdi, P.; Sesetyan, K.; Demircioglu, M.B.; Kalafat, D.; Erdik, M.; Giardini, D.; Khan, M.A.; Tsereteli, N. Recent developments of the Middle East catalog. J. Seismol. 2014, 18, 749–772. [Google Scholar] [CrossRef]
- Berberian, M.; Yeats, R.S. Tehran: An earthquake time bomb. In Tectonic Evolution, Collision, and Seismicity of Southwest Asia: In Honor of Manuel Berberian’s Forty-Five Years of Research Contributions; The Geological Society of America: Boulder, CO, USA, 2017. [Google Scholar]
- Field, E.H.; Jordan, T.H. Time-dependent renewal-model probabilities when date of last earthquake is unknown. Bull. Seismol. Soc. Am. 2015, 105, 459–463. [Google Scholar] [CrossRef] [Green Version]
- Papanikolaοu, I.D.; Roberts, G.P.; Deligiannakis, G.; Sakellariou, A.; Vassilakis, E. The Sparta Fault, Southern Greece: From segmentation and tectonic geomorphology to seismic hazard mapping and time dependent probabilities. Tectonophysics 2013, 597, 85–105. [Google Scholar] [CrossRef]
- Rieben, H. The geology of the Teheran plain. Am. J. Sci. 1955, 253, 617–639. [Google Scholar] [CrossRef]
- Cornell, C.A. Engineering seismic risk analysis. Bull. Seismol. Soc. Am. 1968, 58, 1583–1606. [Google Scholar]
- McGuire, R.K. Probabilistic seismic hazard analysis and design earthquakes: Closing the loop. Bull. Seismol. Soc. Am. 1995, 85, 1275–1284. [Google Scholar]
- Danciu, L.; Şeşetyan, K.; Demircioglu, M.; Gülen, L.; Zare, M.; Basili, R.; Elias, A.; Adamia, S.; Tsereteli, N.; Yalçın, H.; et al. The 2014 earthquake model of the Middle East: Seismogenic sources. Bull. Earthq. Eng. 2018, 16, 3465–3496. [Google Scholar] [CrossRef]
- Kijko, A.; Sellevoll, M.A. Estimation of earthquake hazard parameters from incomplete data files. Part II. Incorporation of magnitude heterogeneity. Bull. Seismol. Soc. Am. 1992, 82, 120–134. [Google Scholar]
- Kijko, A.; Sellevoll, M.A. Estimation of earthquake hazard parameters for incomplete and uncertain data files. Nat. Hazards 1990, 3, 1–13. [Google Scholar] [CrossRef]
- Kijko, A.; Smit, A.; Sellevoll, M.A. Estimation of earthquake hazard parameters from incomplete data files. Part III. Incorporation of uncertainty of earthquake-occurrence model. Bull. Seismol. Soc. Am. 2016, 106, 1210–1222. [Google Scholar] [CrossRef] [Green Version]
- Gutenberg, B.; Richter, C.F. Frequency of earthquakes in California. Bull. Seismol. Soc. Am. 1944, 34, 185–188. [Google Scholar]
- Zare, M. Contribution À L’étude Des Mouvements Forts En Iran: Du Catalogue Aux Lois D’atténuation. Ph.D. Thesis, Joseph Fourier University, Grenoble, Rhône-Alpes, France, 1999. [Google Scholar]
- Wells, D.L.; Coppersmith, K.J. New empirical relationships among magnitude, rupture length, rupture width, rupture area, and surface displacement. Bull. Seismol. Soc. Am. 1994, 84, 974–1002. [Google Scholar]
- Ambraseys, N.; Douglas, J.; Sarma, S.; Smit, P. Equations for the estimation of strong ground motions from shallow crustal earthquakes using data from Europe and the Middle East: Horizontal peak ground acceleration and spectral acceleration. Bull. Earthq. Eng. 2005, 3, 1–53. [Google Scholar] [CrossRef] [Green Version]
- Boore, D.M.; Atkinson, G.M. Ground-motion prediction equations for the average horizontal component of PGA, PGV, and 5%-damped PSA at spectral periods between 0.01 s and 10.0 s. Earthq. Spectra 2008, 24, 99–138. [Google Scholar] [CrossRef] [Green Version]
- Akkar, S.; Bommer, J.J. Empirical equations for the prediction of PGA, PGV, and spectral accelerations in Europe, the Mediterranean region, and the Middle East. Seismol. Res. Lett. 2010, 81, 195–206. [Google Scholar] [CrossRef] [Green Version]
- Gholipour, Y.; Bozorgnia, Y.; Rahnama, M.; Berberian, M.; Shojataheri, J. Probabilistic seismic hazard analysis, phase I–greater Tehran regions. In Final Report; Faculty of Engineering, University of Tehran: Tehran, Iran, 2008. [Google Scholar]
- Zare, M. Construction and Earthquake hazard in North Tabriz Fault and earthquake fault width in Iran. J. Seismol. Earthq. Eng. 2001, 2, 46–57. [Google Scholar]
- Teran, O.J.; Fletcher, J.M.; Oskin, M.E.; Rockwell, T.K.; Hudnut, K.W.; Spelz, R.M.; Akciz, S.O.; Hernandez-Flores, A.P.; Morelan, A.E. Geologic and structural controls on rupture zone fabric: A field-based study of the 2010 Mw 7.2 El Mayor–Cucapah earthquake surface rupture. Geosphere 2015, 11, 899–920. [Google Scholar] [CrossRef] [Green Version]
- Sibson, R.H. Thickness of the seismic slip zone. Bull. Seismol. Soc. Am. 2003, 93, 1169–1178. [Google Scholar] [CrossRef]
- Boncio, P.; Liberi, F.; Caldarella, M.; Nurminen, F.-C. Width of surface rupture zone for thrust earthquakes: Implications for earthquake fault zoning. Nat. Hazards Earth Syst. Sci. 2018, 18. [Google Scholar] [CrossRef] [Green Version]
- Center for International Earth Science Information Network (CIESIN). Gridded Population of the World, Version 4 (GPWv4): Population Count, Revision 11; NASA Socioeconomic Data and Applications Center: Palisades, NY, USA, 2018; Available online: https://0-doi-org.brum.beds.ac.uk/10.7927/H4JW8BX5 (accessed on 1 April 2020).
- Center for International Earth Science Information Network (CIESIN). Global Rural-Urban Mapping Project, Version 1 (GRUMPv1): Urban Extents Grid; Columbia University: New York, NY, USA, 2011. [Google Scholar]
- Bright, E.A.; Rose, A.N.; Urban, M.L.; McKee, J. LandScan 2017 High-Resolution Global Population Data Set; Oak Ridge National Lab. (ORNL): Oak Ridge, TN, USA, 2018. [Google Scholar]
- Lwin, K.; Murayama, Y. A GIS approach to estimation of building population for micro-spatial analysis. Trans. GIS 2009, 13, 401–414. [Google Scholar] [CrossRef]
- SCI. National Population and Housing Census; Statistical Center of Iran: Tehran, Iran, 2016. [Google Scholar]
- Rules and Regulations of the City; Supreme Council of Planning and Architecture Secretariat, Ministry of Roads and Urban Development: Tehran, Iran, 2006.
- Amini, K.; Hosseini, M.; Jafari, M.K.; Hosseinioun, S. Recognition of vulnerable urban fabrics in earthquake zones: A case study of the Tehran metropolitan area. J. Seismol. Earthq. Eng. 2009, 10, 175–187. [Google Scholar]
- Mansouri, B.; Ghafory-Ashtiany, M.; Amini-Hosseini, K.; Nourjou, R.; Mousavi, M. Building seismic loss model for Tehran. Earthq. Spectra 2010, 26, 153–168. [Google Scholar] [CrossRef]
- Firuzi, E.; Ansari, A.; Hosseini, K.A.; Rashidabadi, M. Probabilistic earthquake loss model for residential buildings in Tehran, Iran to quantify annualized earthquake loss. Bull. Earthq. Eng. 2019, 17, 2383–2406. [Google Scholar] [CrossRef]
- Hajibabaee, M.; Amini-Hosseini, K.; Ghayamghamian, M. Earthquake risk assessment in urban fabrics based on physical, socioeconomic and response capacity parameters (a case study: Tehran city). Nat. Hazards 2014, 74, 2229–2250. [Google Scholar] [CrossRef]
Figure 1.
Active faults, historical and instrumental seismicity and alluvial deposits in and around Tehran.
Figure 1.
Active faults, historical and instrumental seismicity and alluvial deposits in and around Tehran.

Figure 2.
Flowchart representing the process of earthquake risk assessment as applied to Tehran.

Figure 3.
Seismogenic sources of our PSHA analysis for Tehran.

Figure 4.
PGA on bedrock for 475-year return period.

Figure 5.
PGA on surface for 475-year return period.

Figure 6.
Surface rupture widths in the city of Tehran.

Figure 7.
Human exposure (population density) map of Tehran.

Figure 8.
Overall physical vulnerability map of Tehran.

Figure 9.
A schematic concept of the combination of risk components through a 3D risk matrix.

Figure 10.
Earthquake risk map of Tehran.


Table 1.
Seismicity parameters for the selected seismic area sources.
| Zone | LF (km) | LR (km) | Mmin * | Mmax Obs [75,76] | Selected Mmax | β | λMmin | ||
|---|---|---|---|---|---|---|---|---|---|
| 1 | >150 | 55.5 | 4.5 | 7.4 | 7.3 | 7.1 | 7.4 | 2.06 | 0.22 |
| 2 | 120 | 44.4 | 4.5 | 7.6 | 7.1 | 7.0 | 7.6 | 2.07 | 0.07 |
| 3 | 200 | 74 | 4.5 | 7.7 | 7.6 | 7.2 | 7.7 | 2.15 | 0.12 |
| 4 | 110 | 40.7 | 4.5 | 7.2 | 7.0 | 6.9 | 7.2 | 2.12 | 0.19 |
| 5 | 80 | 29.6 | 4.5 | 7.5 | 6.7 | 6.8 | 7.5 | 2.14 | 0.11 |
| 6 | 165 | 61.05 | 4.5 | 5.4 | 7.4 | 7.2 | 7.4 | 2.22 | 0.14 |
| 7 | 90 | 33.3 | 4.5 | 6.4 | 6.9 | 6.8 | 6.9 | 2.33 | 0.11 |
| 8 | 72 | 26.64 | 4.5 | 7.1 | 6.6 | 6.7 | 7.1 | 2.22 | 0.14 |
| 9 | 113 | 41.81 | 4.5 | 6.2 | 7.1 | 7.0 | 7.1 | 2.32 | 0.14 |
* Mmin = minimum magnitude; β = 2.303 × b (b value in Gutenberg-Richter relation [74]).
Table 2.
Surface rupture width of faults within Tehran.
| Fault Zones | Fault Length (km) | Surface Rupture Length (Km) | Surface Rupture Width (km) | |
|---|---|---|---|---|
| Major Faults | North Tehran | 130 | 48.1 | 3.0 |
| Sorkhe Hesar-Tarasht | 50 | 18.5 | 2.1 | |
| Eyvanekey-Rey | 100 | 37.0 | 2.7 | |
| Kahrizak-Pishva | 75 | 27.7 | 2.5 | |
| Medium Faults | 5–15 | 3.70 | 1.4 | |
| Minor Faults | <5 | 0.92 | 1.0 | |
Table 3.
Classification of physical vulnerability components in this study.
| GIS Layers | Classes | Vulnerability Weight * |
|---|---|---|
| Land Use | Vegetation or open areas Low urban density High urban density | 1 2 3 |
| Urban Fabric | Normal Unstable Worn–out | 1 2 3 |
| Building Height | <10 floors 10–20 floors 20 floors < | 1 2 3 |
| Occupancy | Residential Commercial Industrial | 1 2 3 |
| Structure Type (for 10–storey < buildings) | Reinforced concrete Steel or Concrete Semi-steel and masonry | 1 2 3 |
| Construction Age (for 10–storey < buildings) | <20 years 20–40 years 40 years < | 1 2 3 |
| Vicinity to Critical Infrastructures (hospitals and medical centers, highways, and fire stations) | Near (<1 km) Medium (1–2 km) Far (2 km <) | 1 2 3 |
* weights 1, 2 and 3 correspond to low, medium and high, respectively.
© 2020 by the authors. Licensee MDPI, Basel, Switzerland. This article is an open access article distributed under the terms and conditions of the Creative Commons Attribution (CC BY) license (http://creativecommons.org/licenses/by/4.0/).
Share and Cite
MDPI and ACS Style
Kamranzad, F.; Memarian, H.; Zare, M. Earthquake Risk Assessment for Tehran, Iran. ISPRS Int. J. Geo-Inf. 2020, 9, 430. https://0-doi-org.brum.beds.ac.uk/10.3390/ijgi9070430
AMA Style
Kamranzad F, Memarian H, Zare M. Earthquake Risk Assessment for Tehran, Iran. ISPRS International Journal of Geo-Information. 2020; 9(7):430. https://0-doi-org.brum.beds.ac.uk/10.3390/ijgi9070430
Chicago/Turabian StyleKamranzad, Farnaz, Hossein Memarian, and Mehdi Zare. 2020. "Earthquake Risk Assessment for Tehran, Iran" ISPRS International Journal of Geo-Information 9, no. 7: 430. https://0-doi-org.brum.beds.ac.uk/10.3390/ijgi9070430
Note that from the first issue of 2016, this journal uses article numbers instead of page numbers. See further details here.