Using Social Networks to Analyze the Spatiotemporal Patterns of the Rolling Stock Manufacturing Industry for Countries in the Belt and Road Initiative

Abstract
:1. Introduction
1.1. Background
1.2. Literature Review
1.3. Aim and Objects
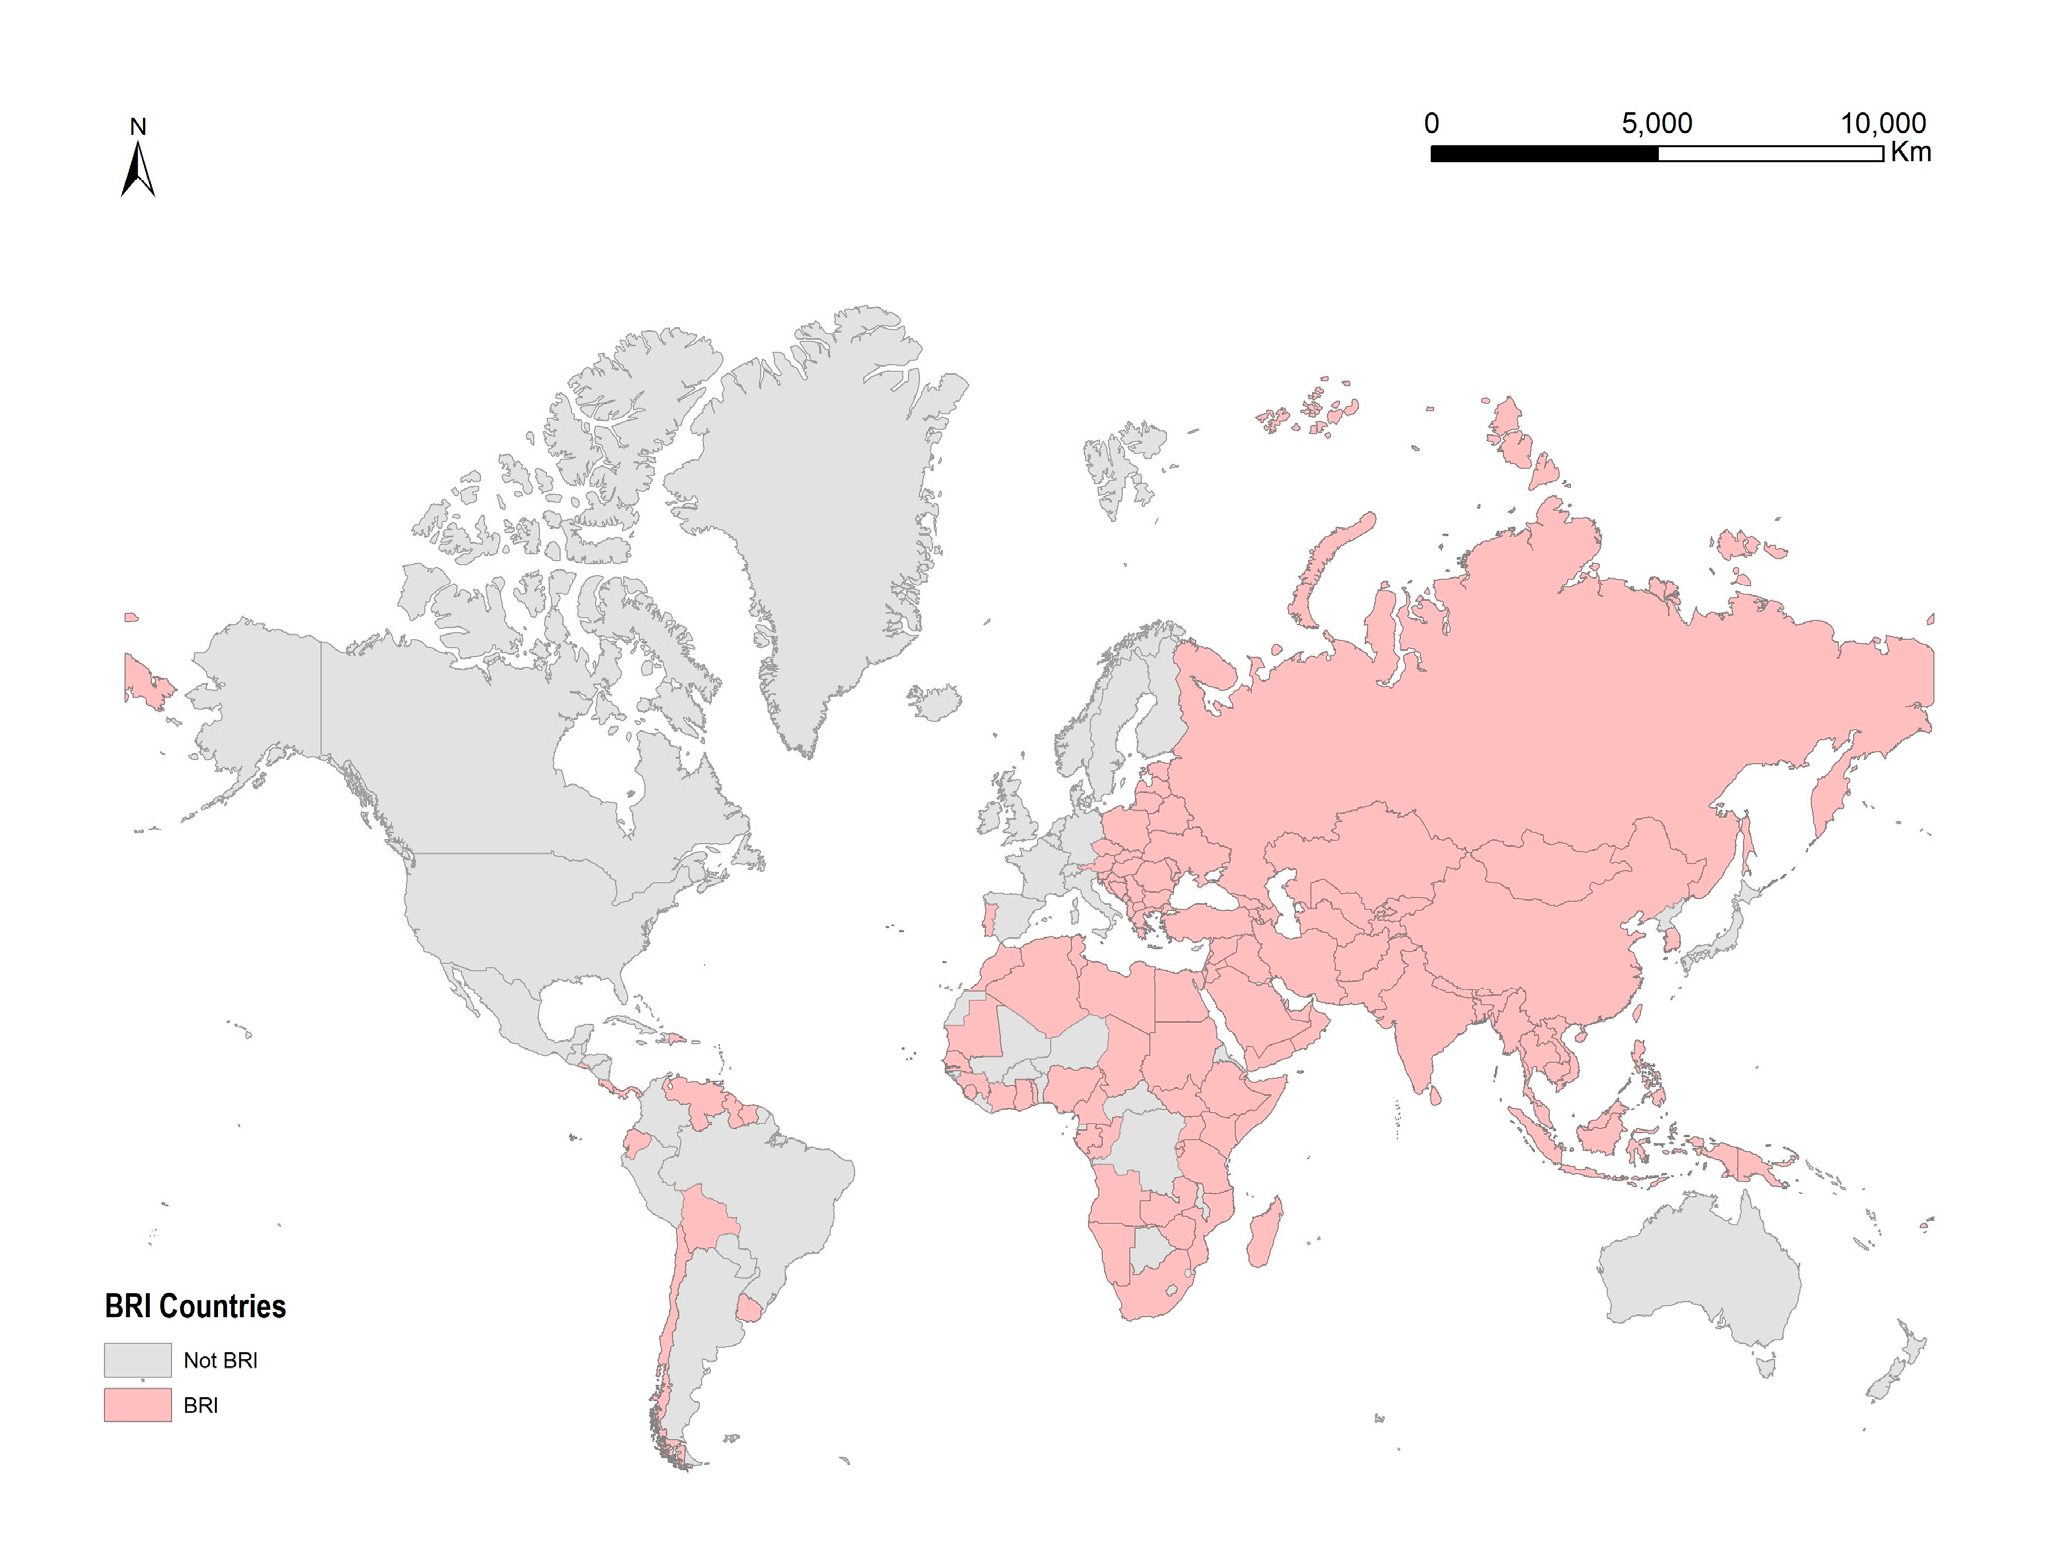
2. Study Area
3. Methodology
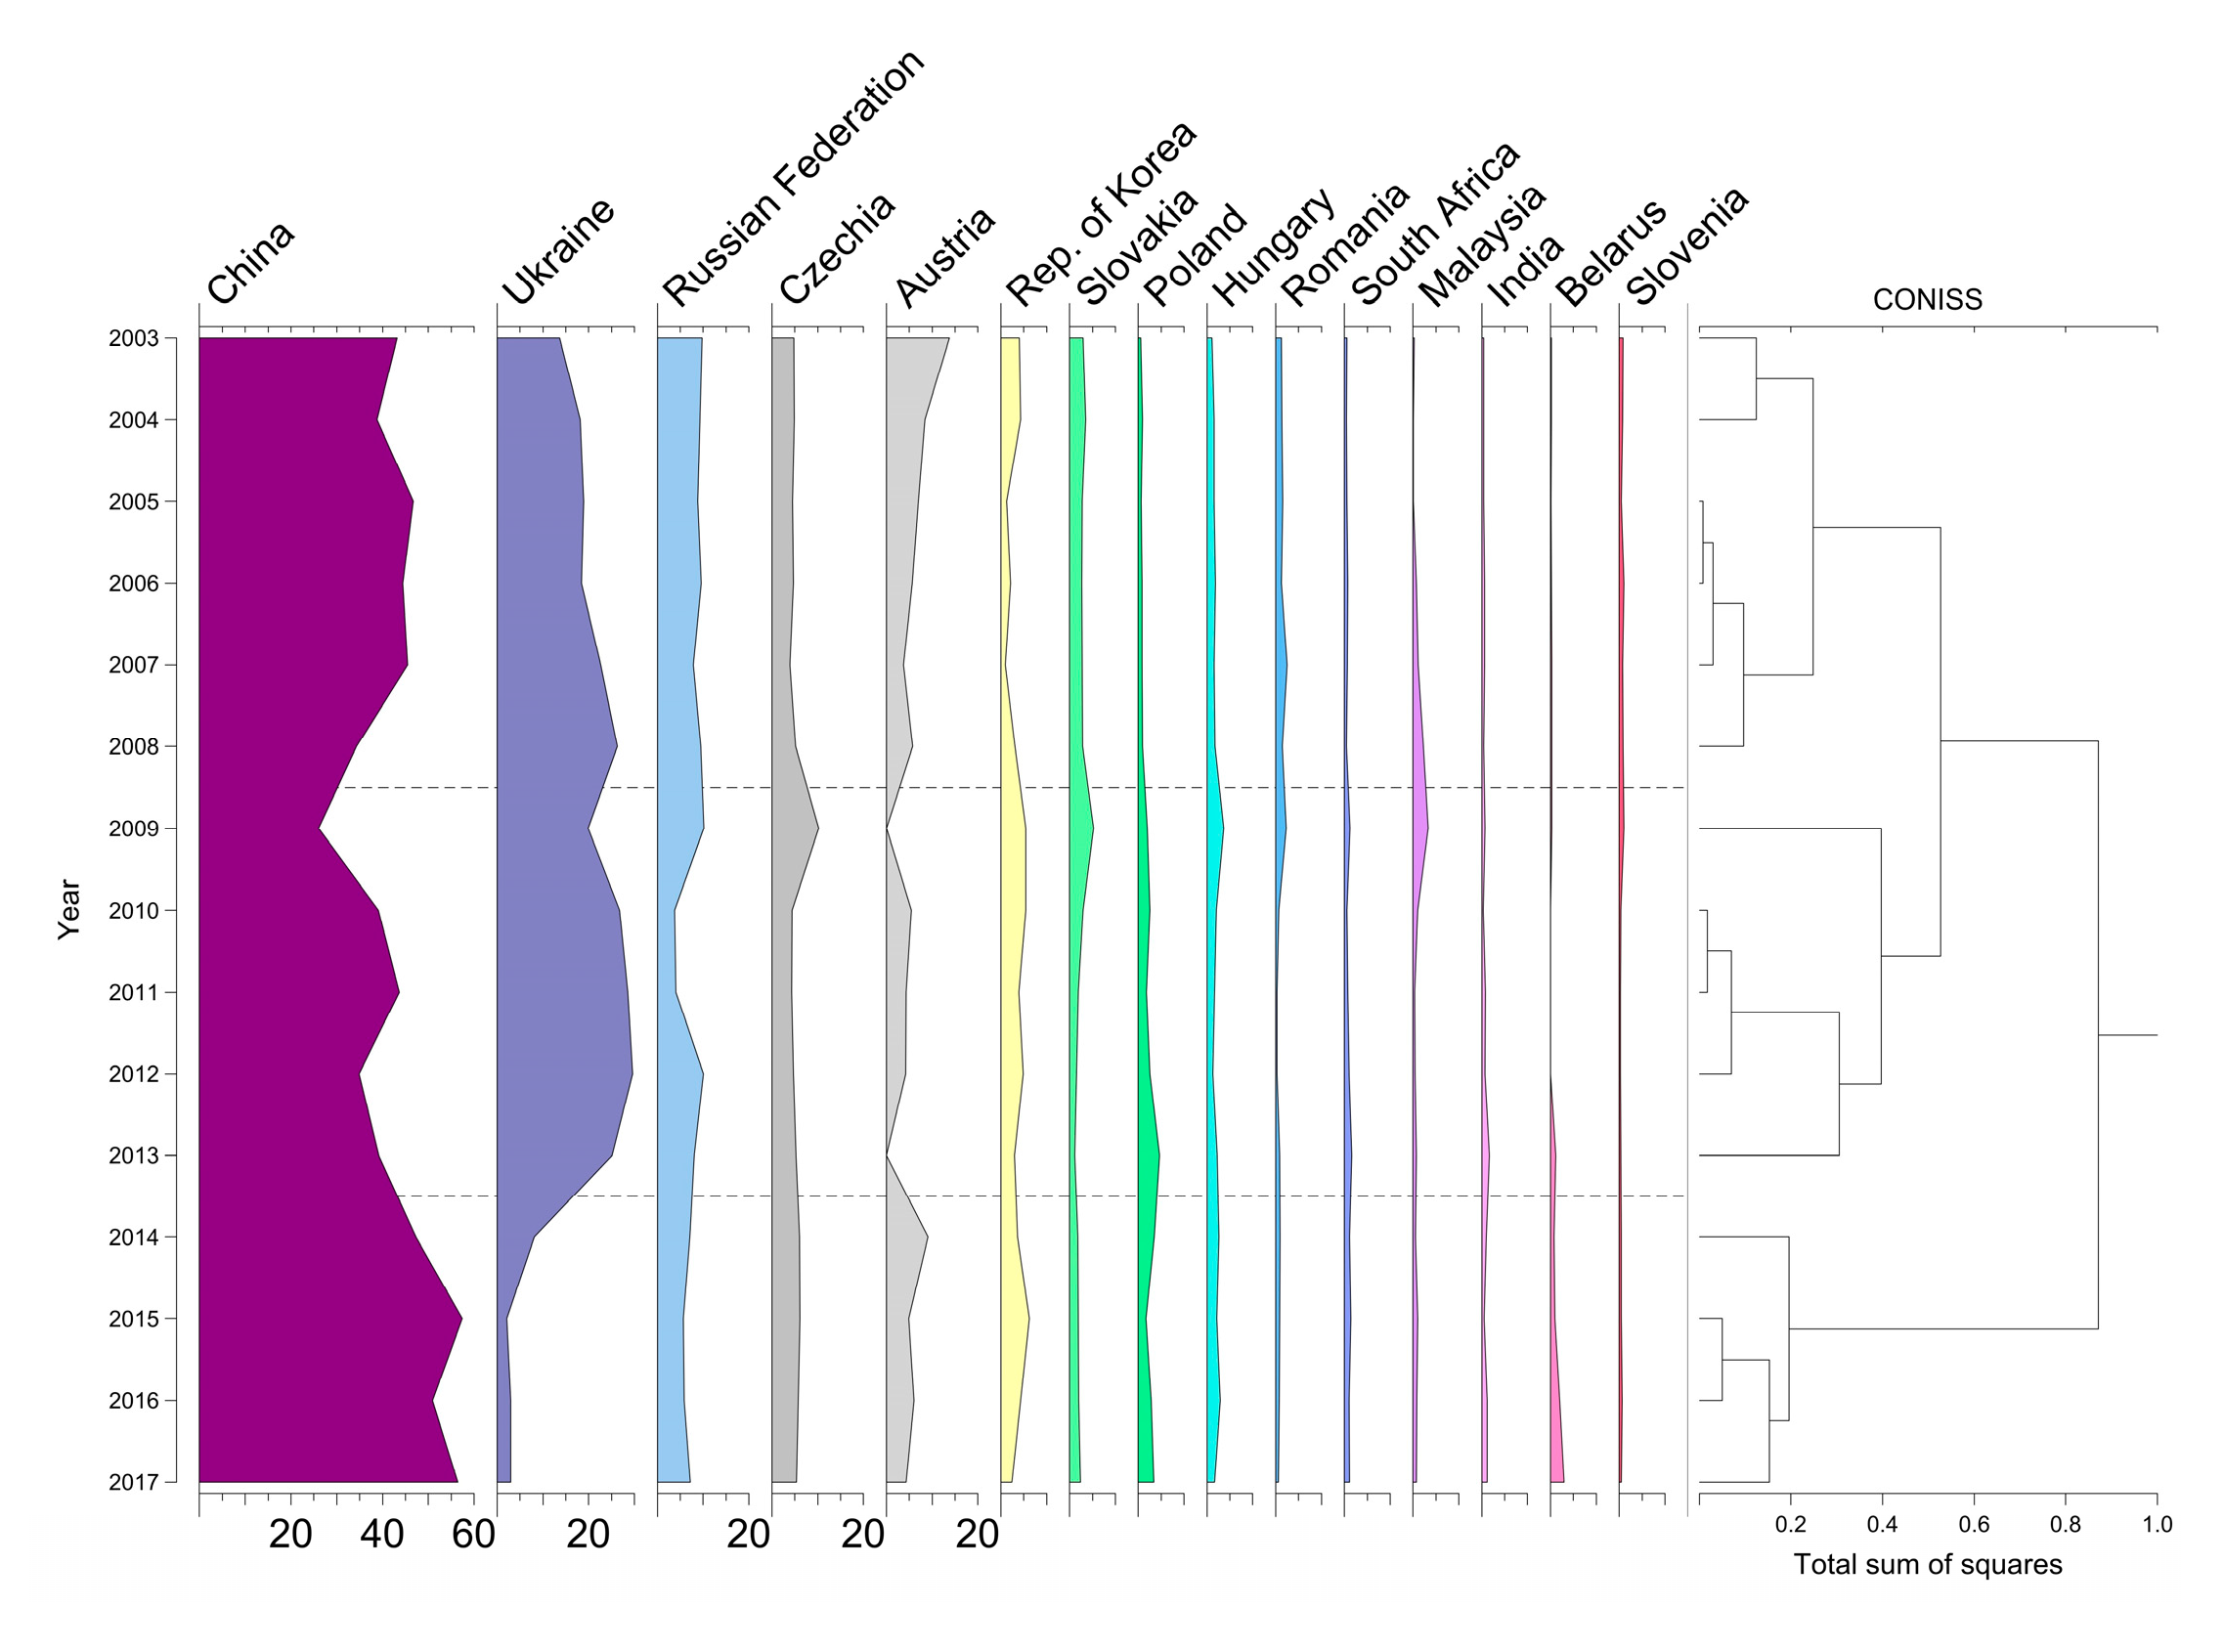
3.1. Phase Division with Sequential Clustering Method
3.2. Construction of Trade Networks
3.3. Analysis of Trade Networks
3.3.1. Analysis of Network and Node Characteristics
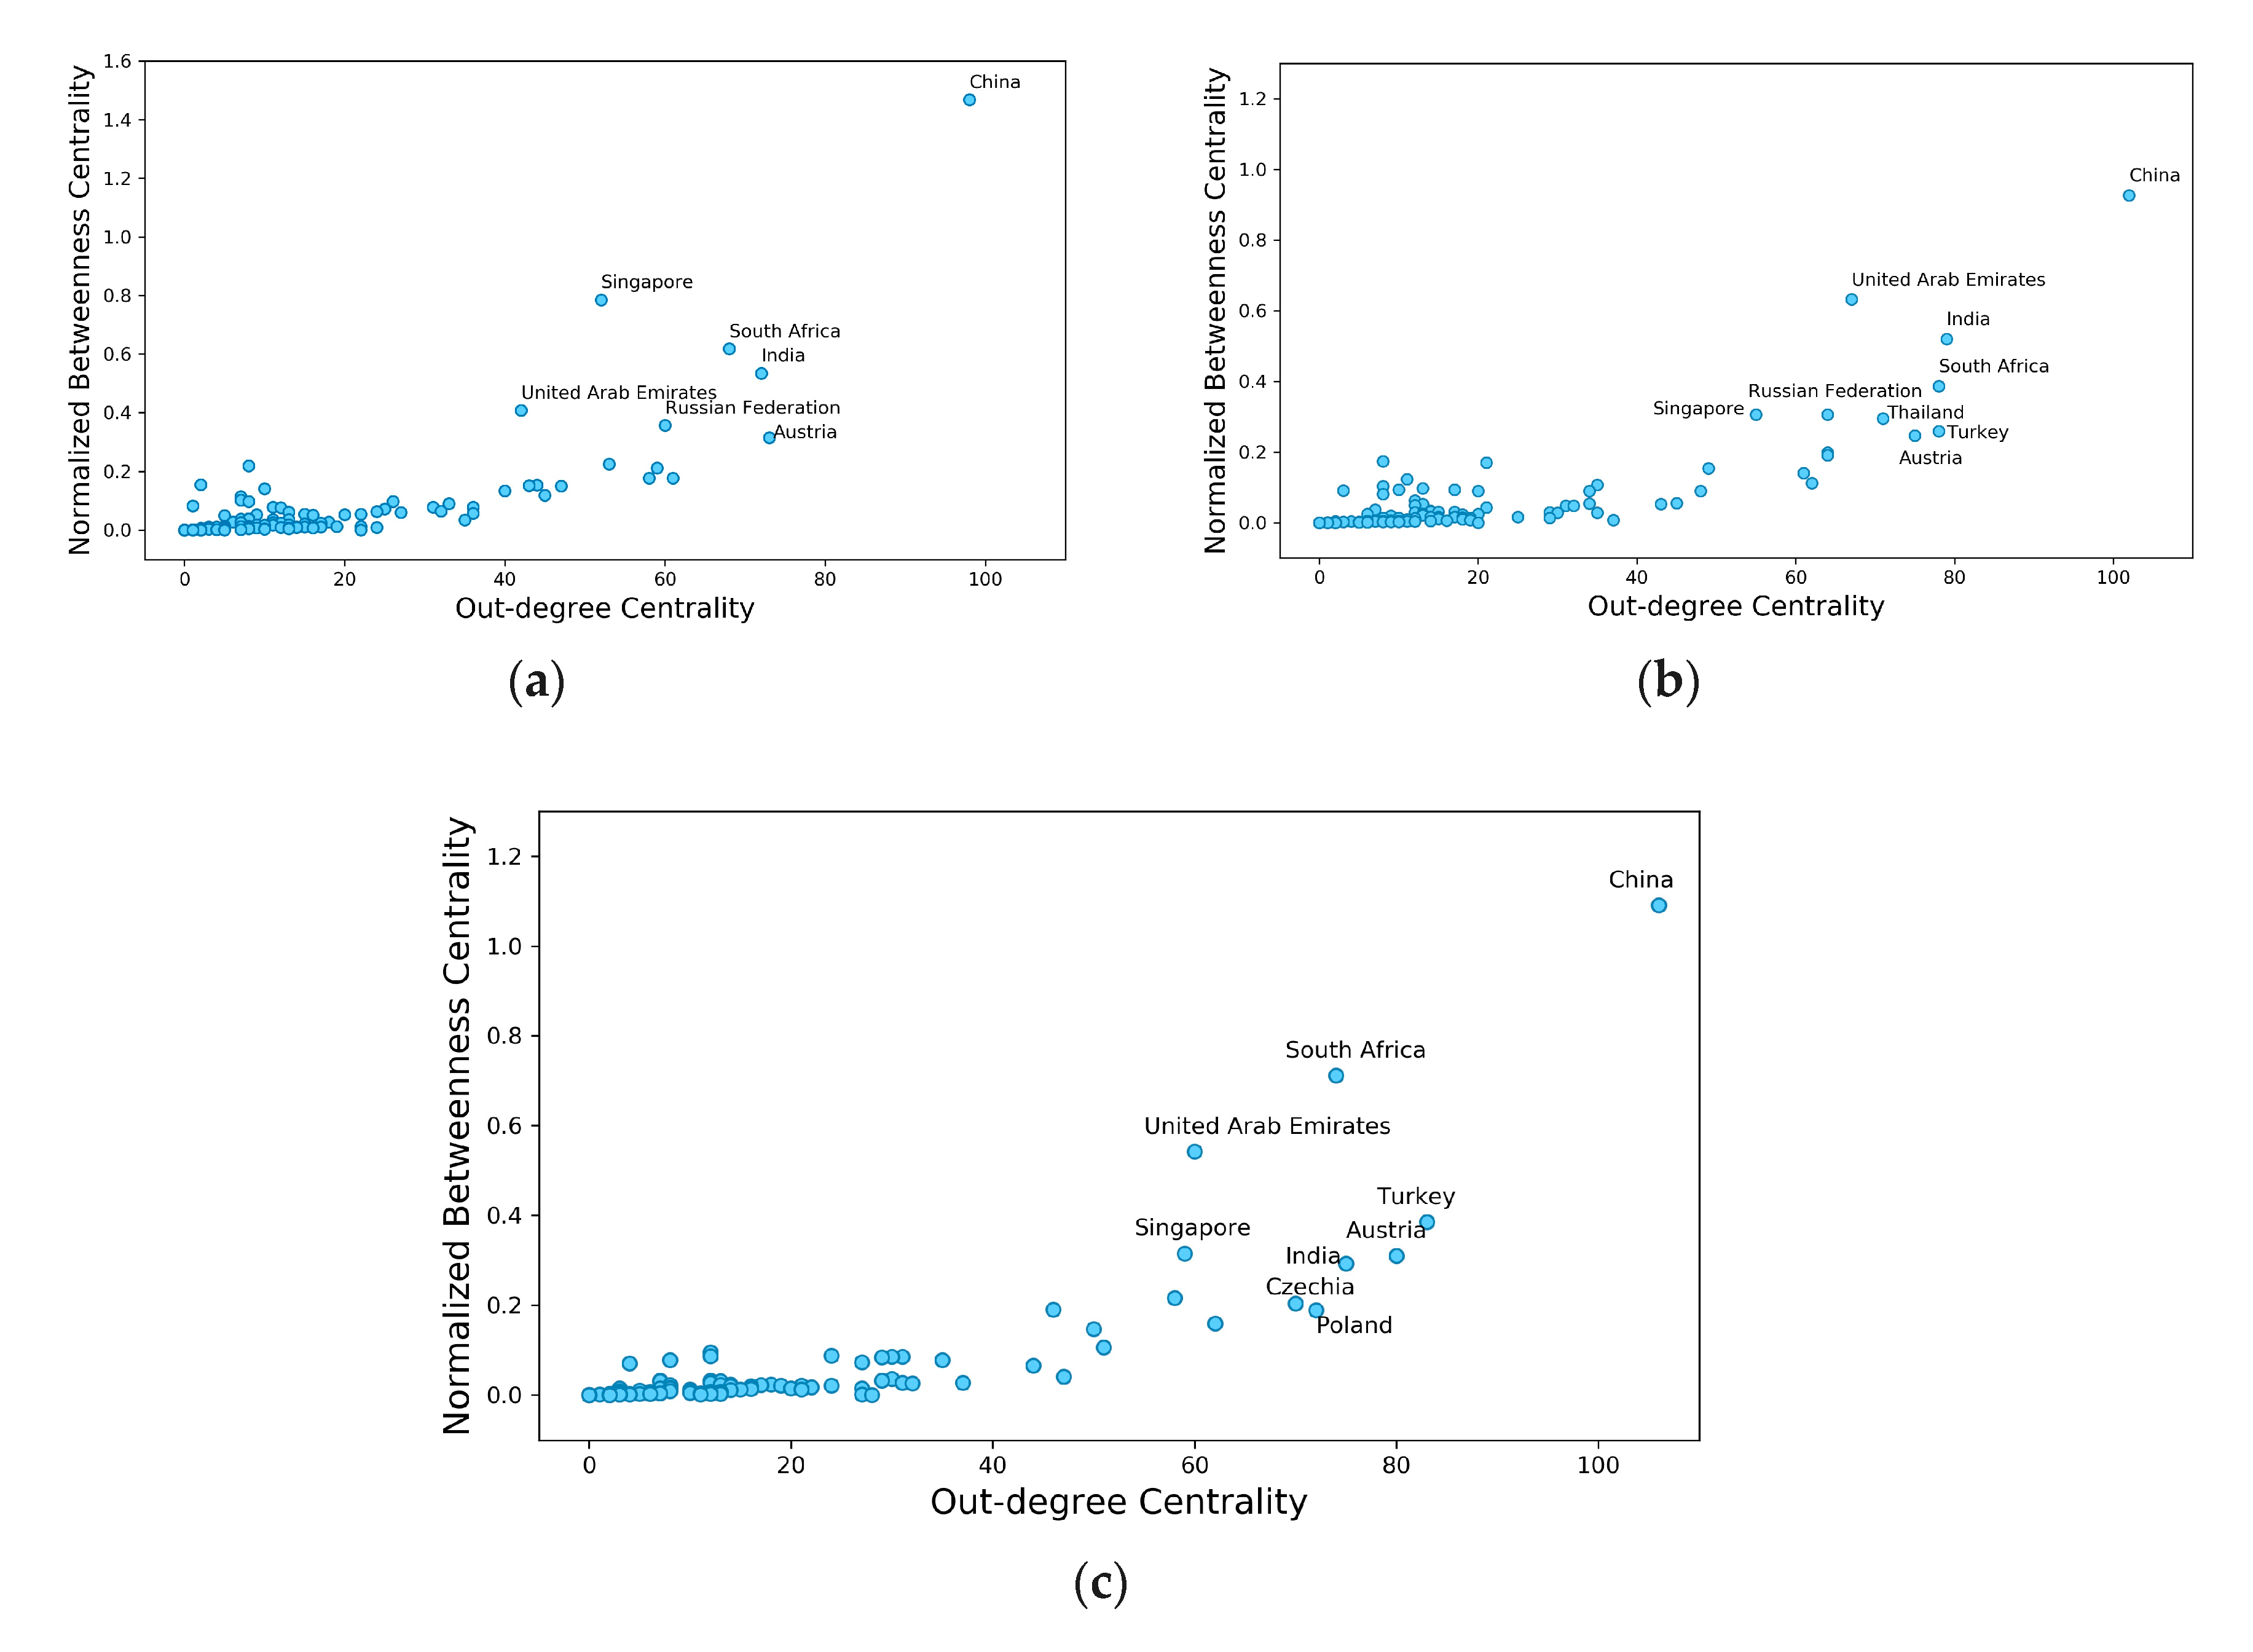
Node Characteristics
Characteristics of Networks
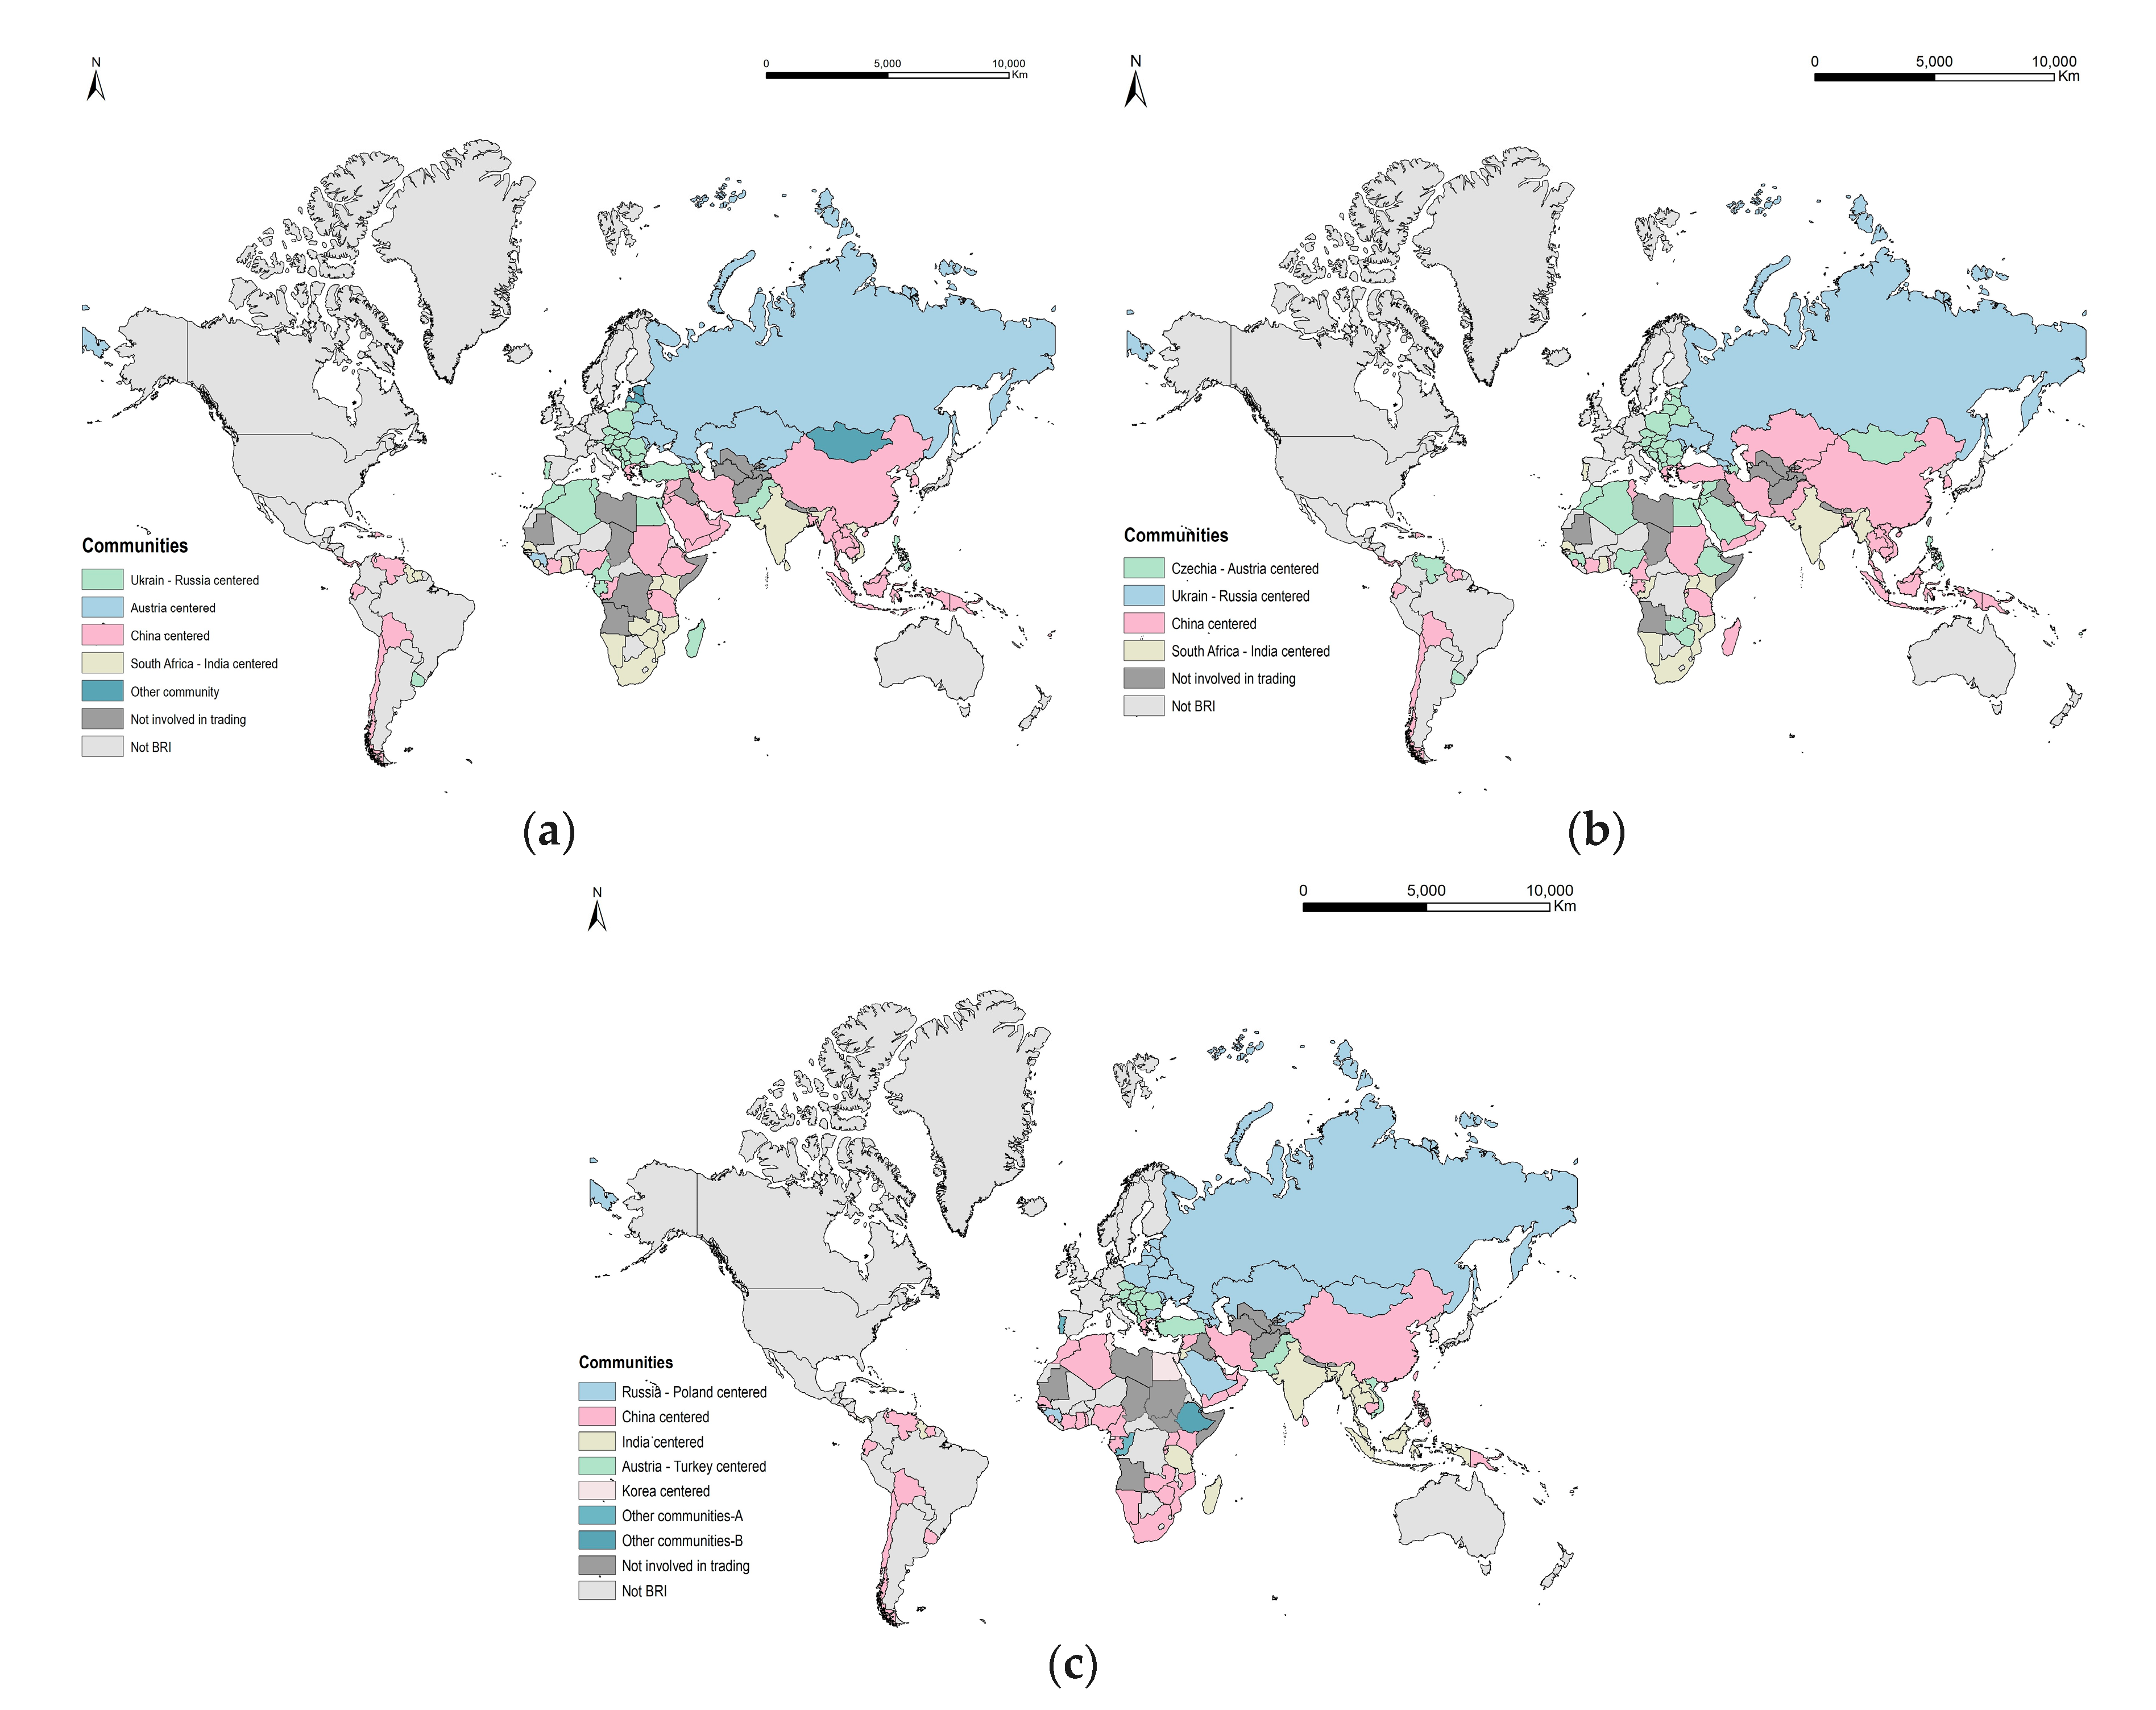
3.3.2. Community Detection Analysis
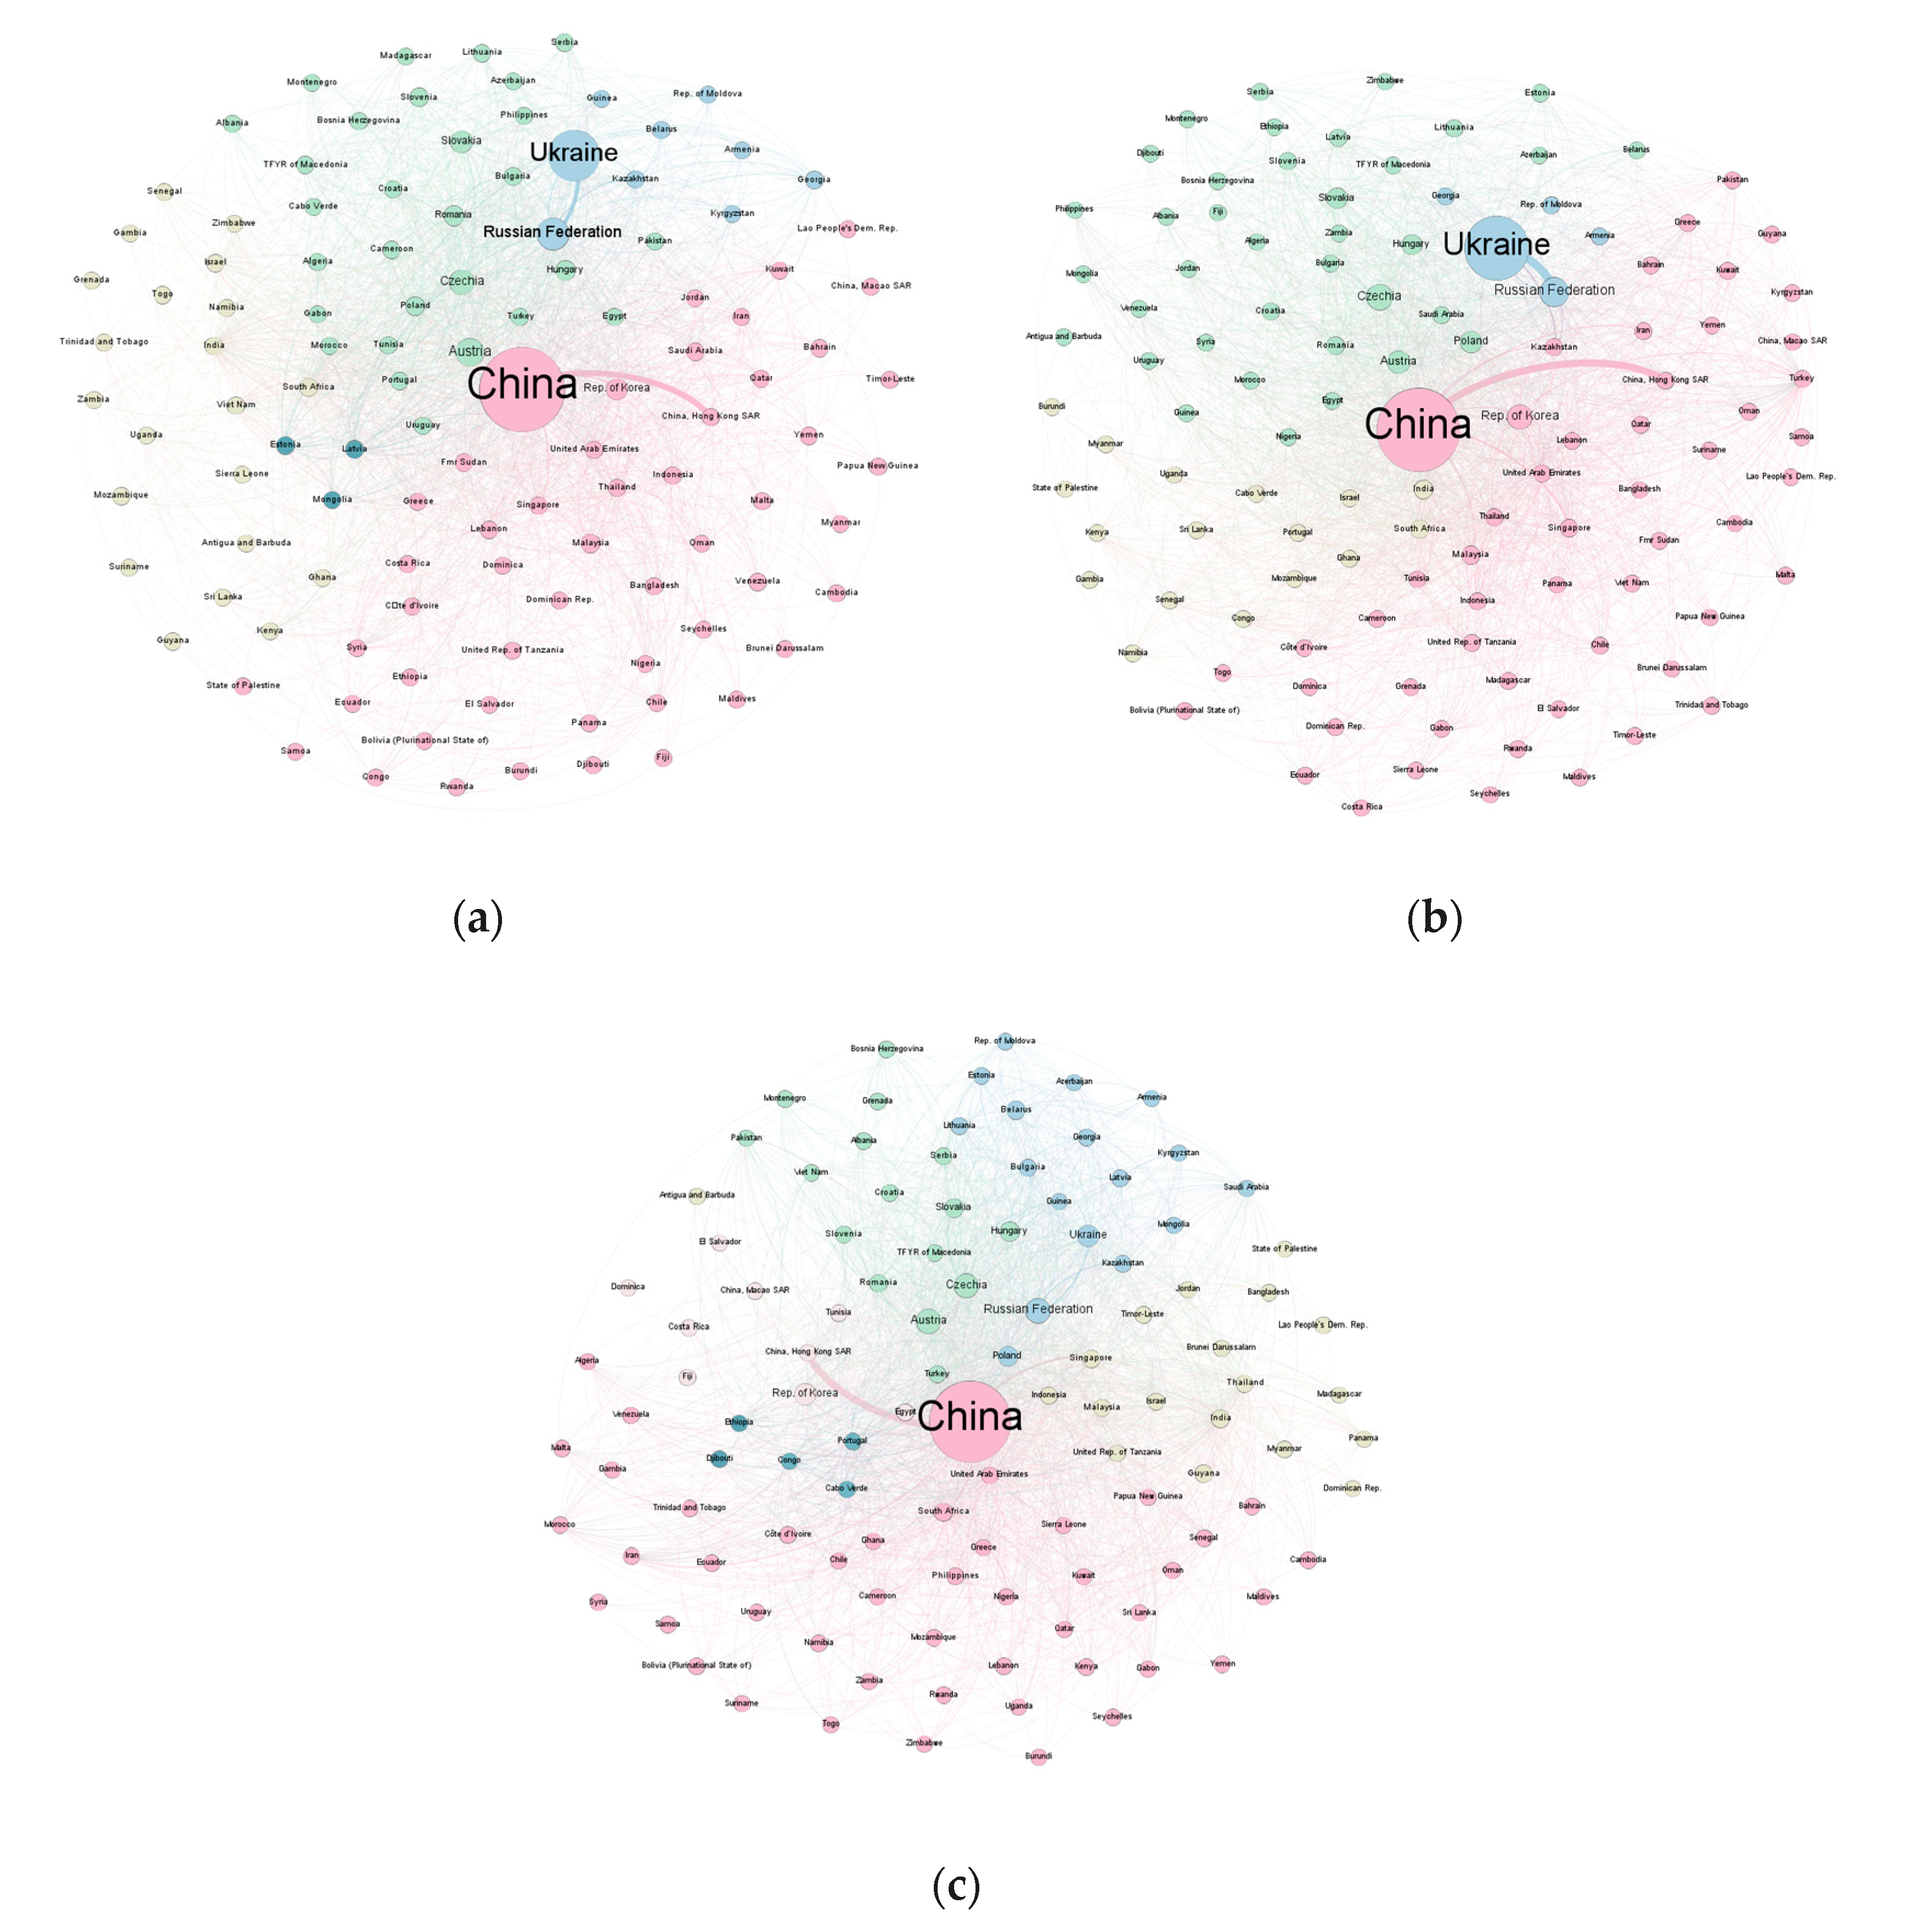
3.3.3. Visualization of Trade Networks
4. Three Phases of the Trade Pattern of Rolling Stock Products in BRI
5. Result
5.1. The Overall Trade Pattern of Rolling Stock Products in BRI
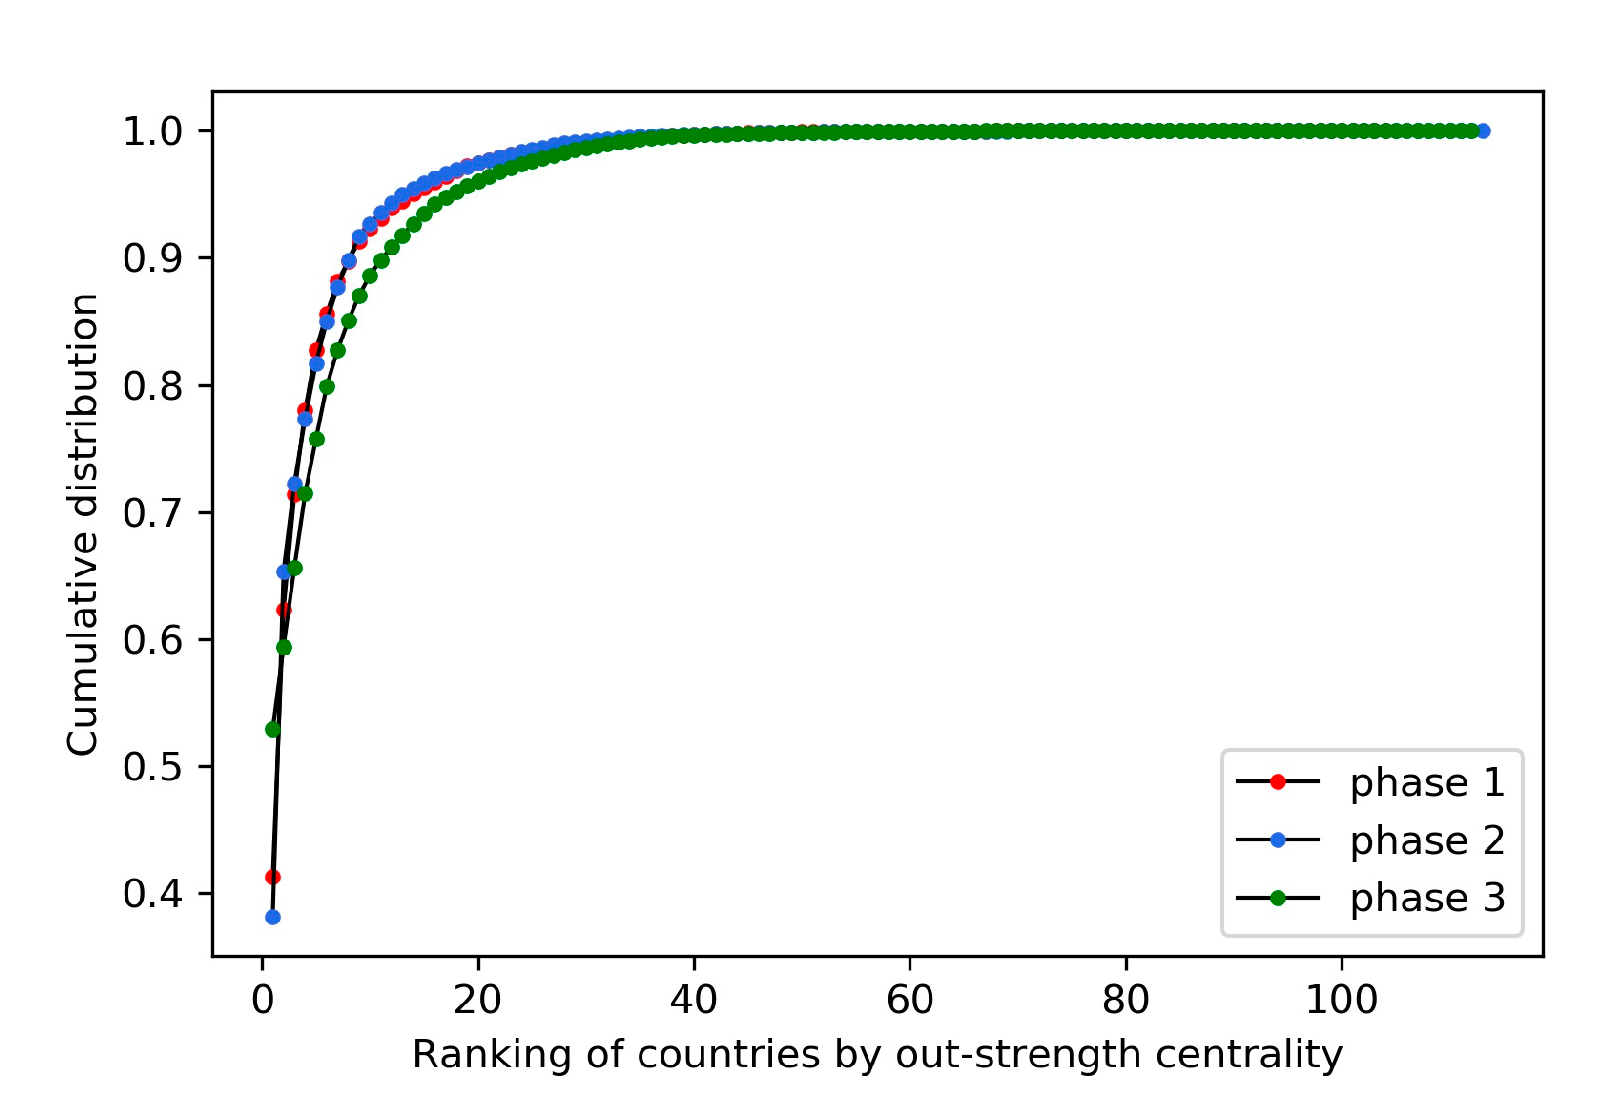
5.1.1. Overall Situation and Evolution
Overall Export Situation
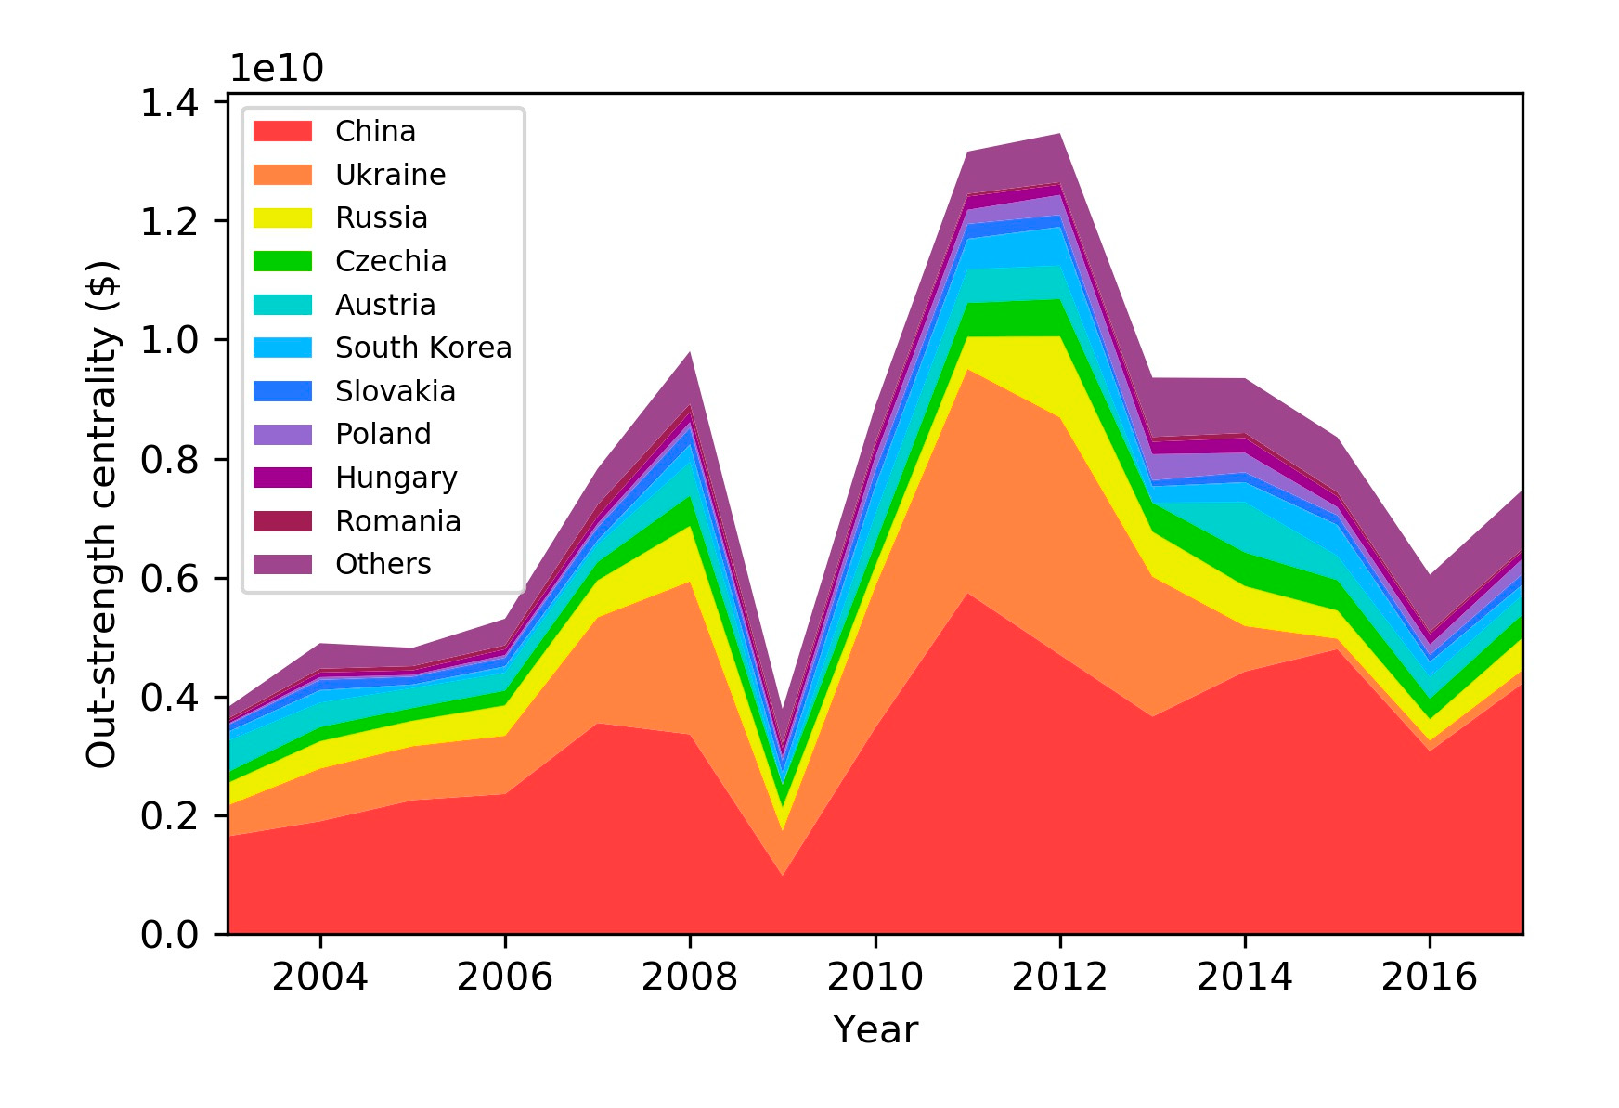
Evolution of the Export Situation
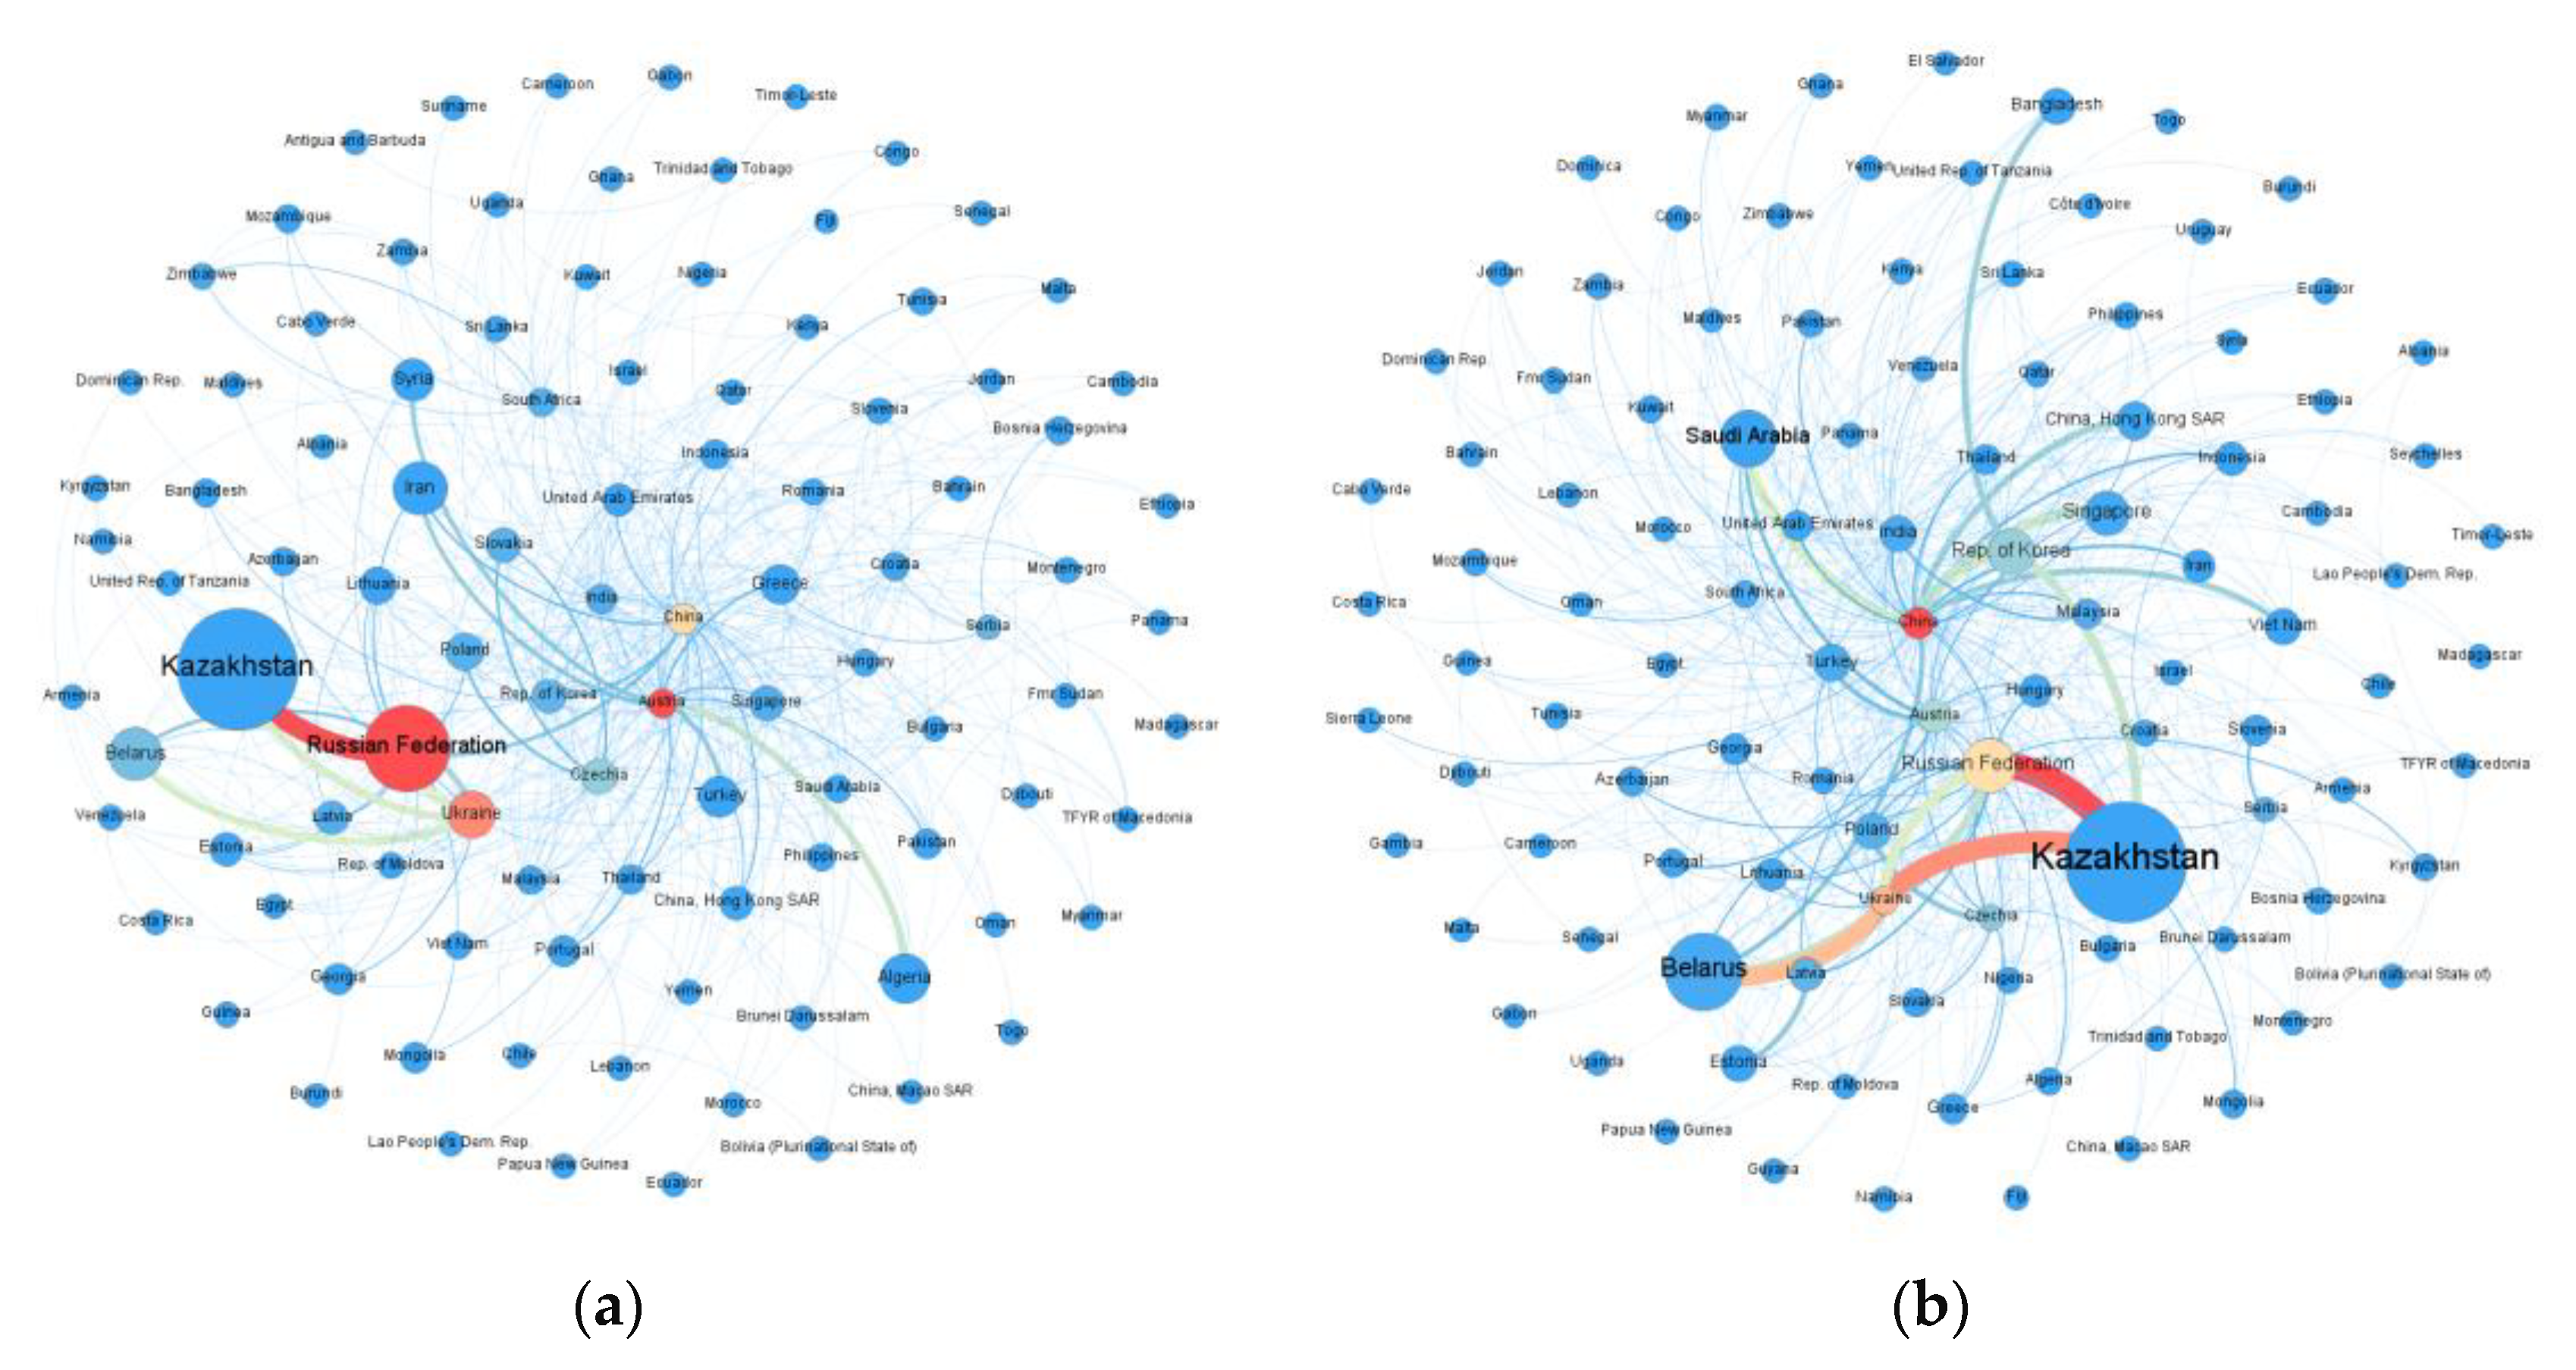
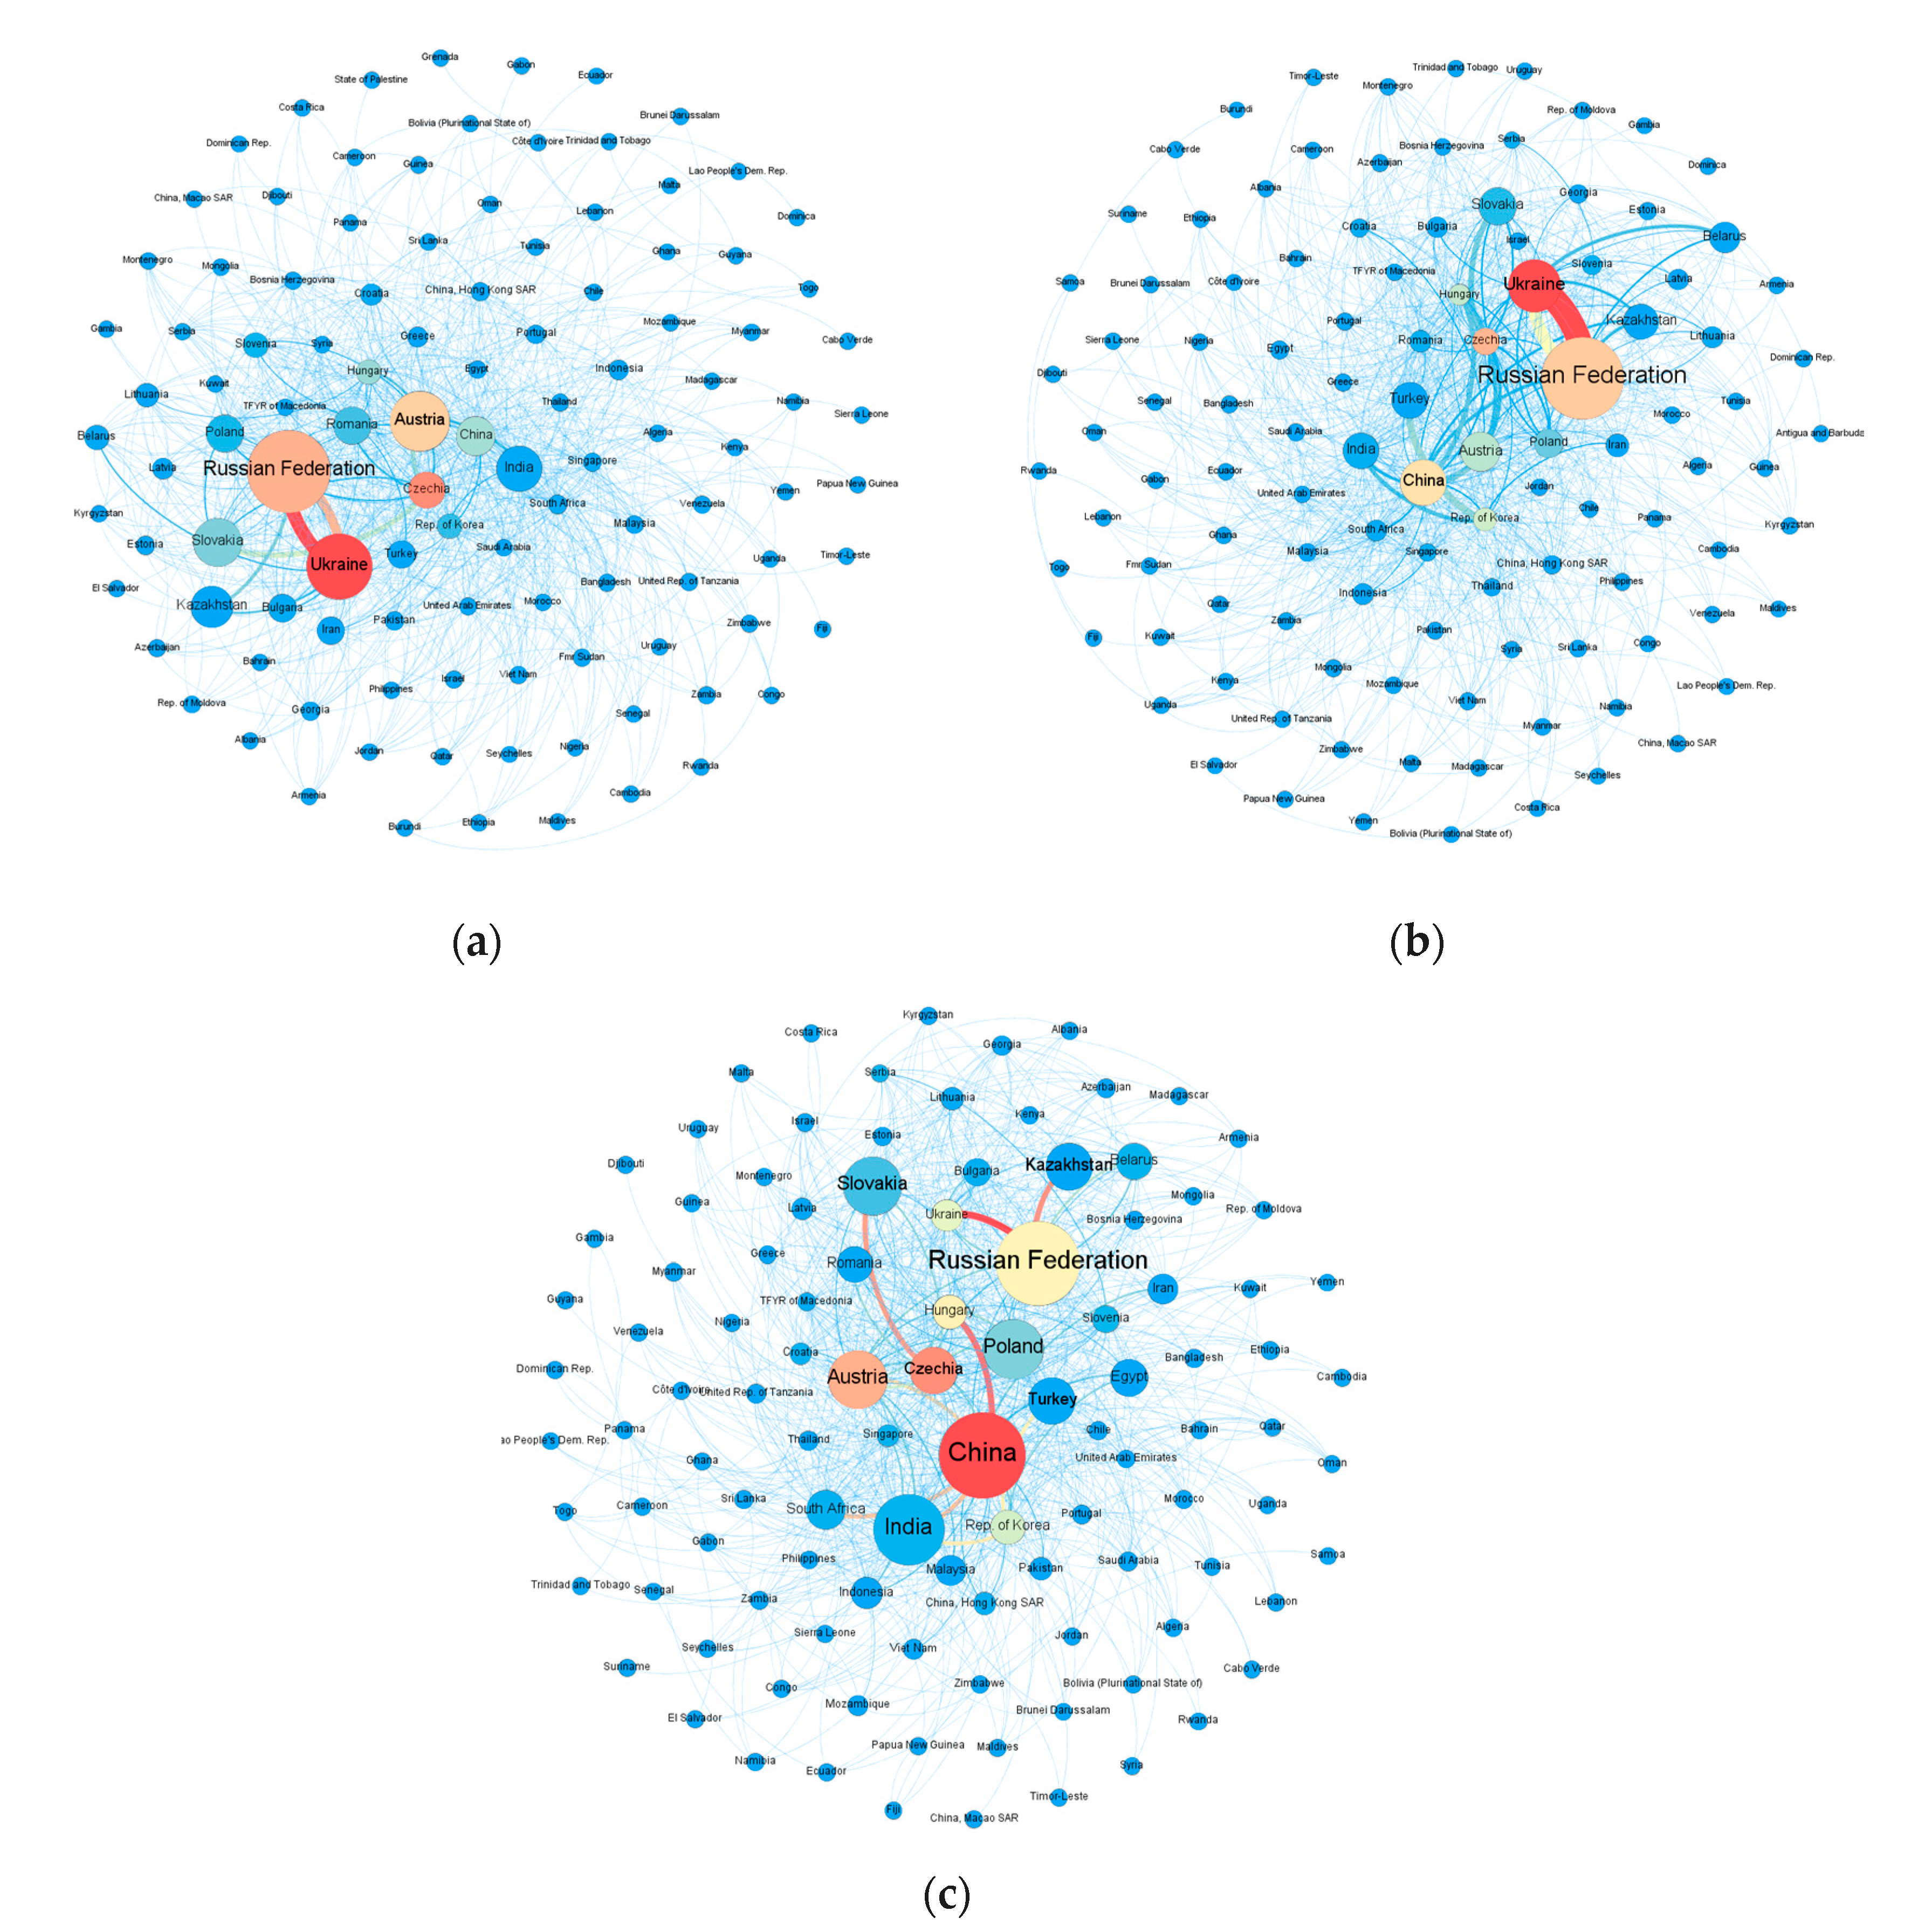
5.1.2. Community Structure and Evolution
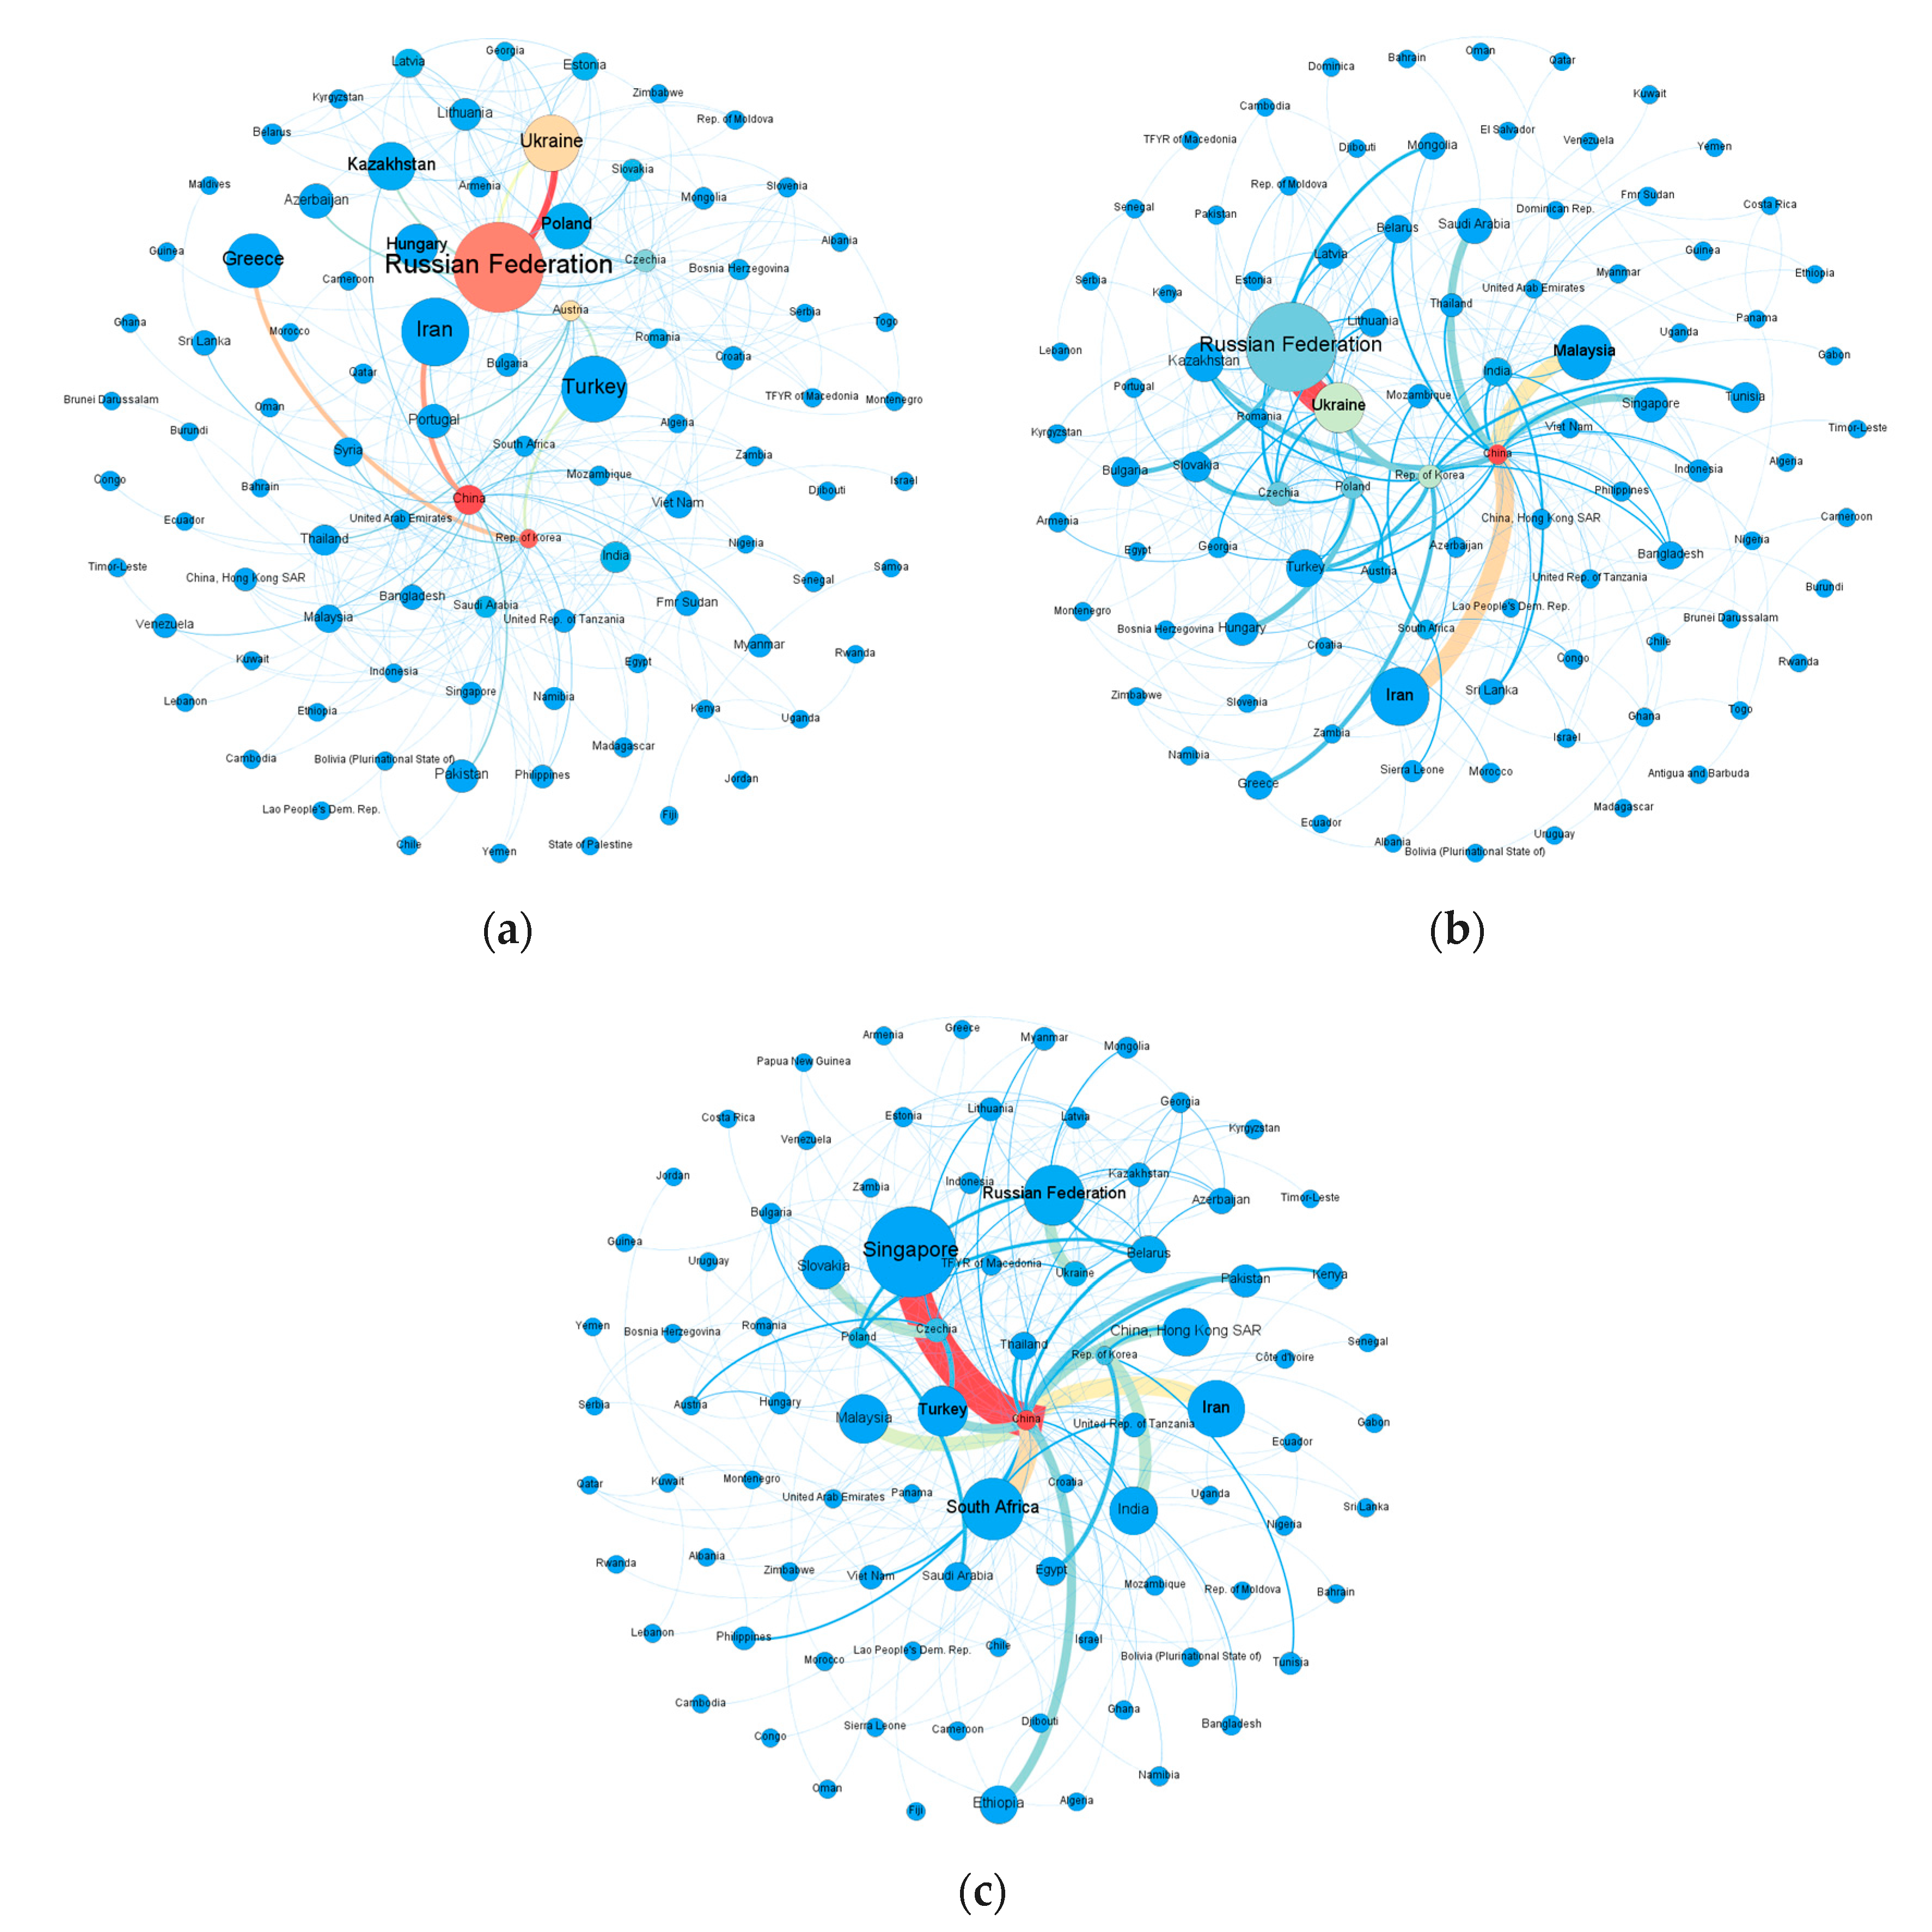
5.2. Trade Patterns of Some Typical Categories of Rolling Stock Products in BRI
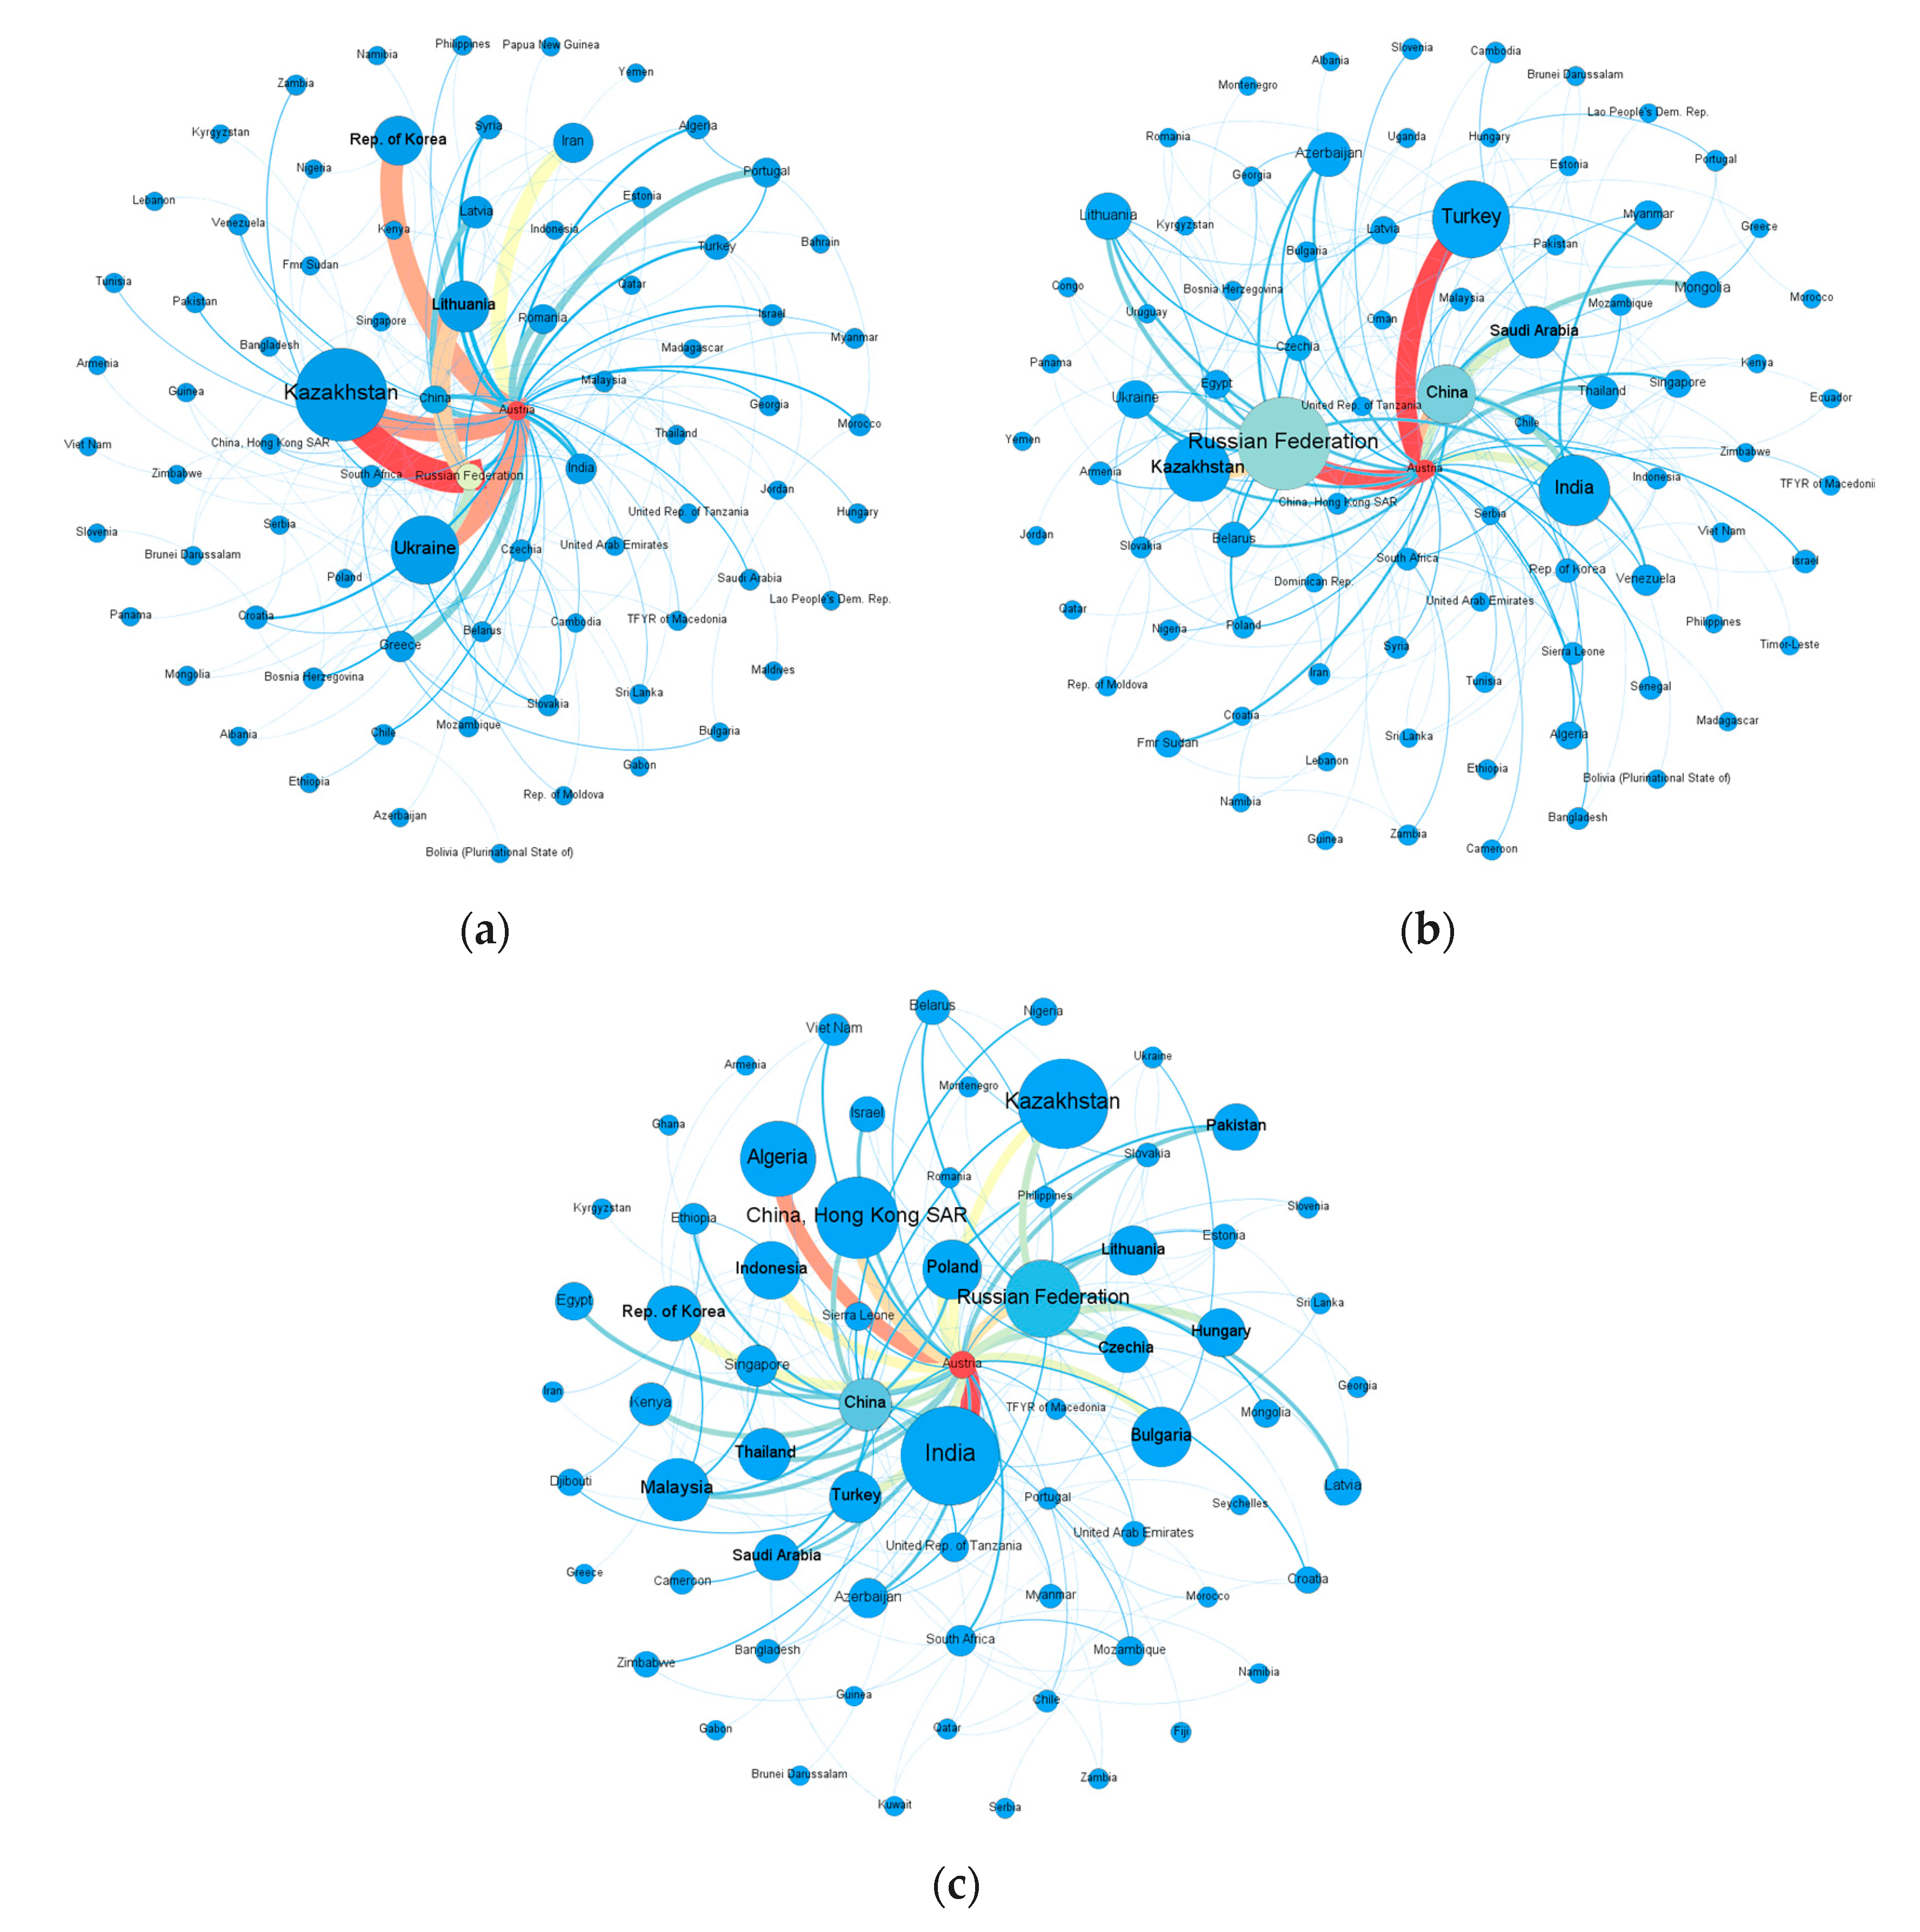
5.2.1. Rail Locomotives and Self-propelled Coaches and Vans
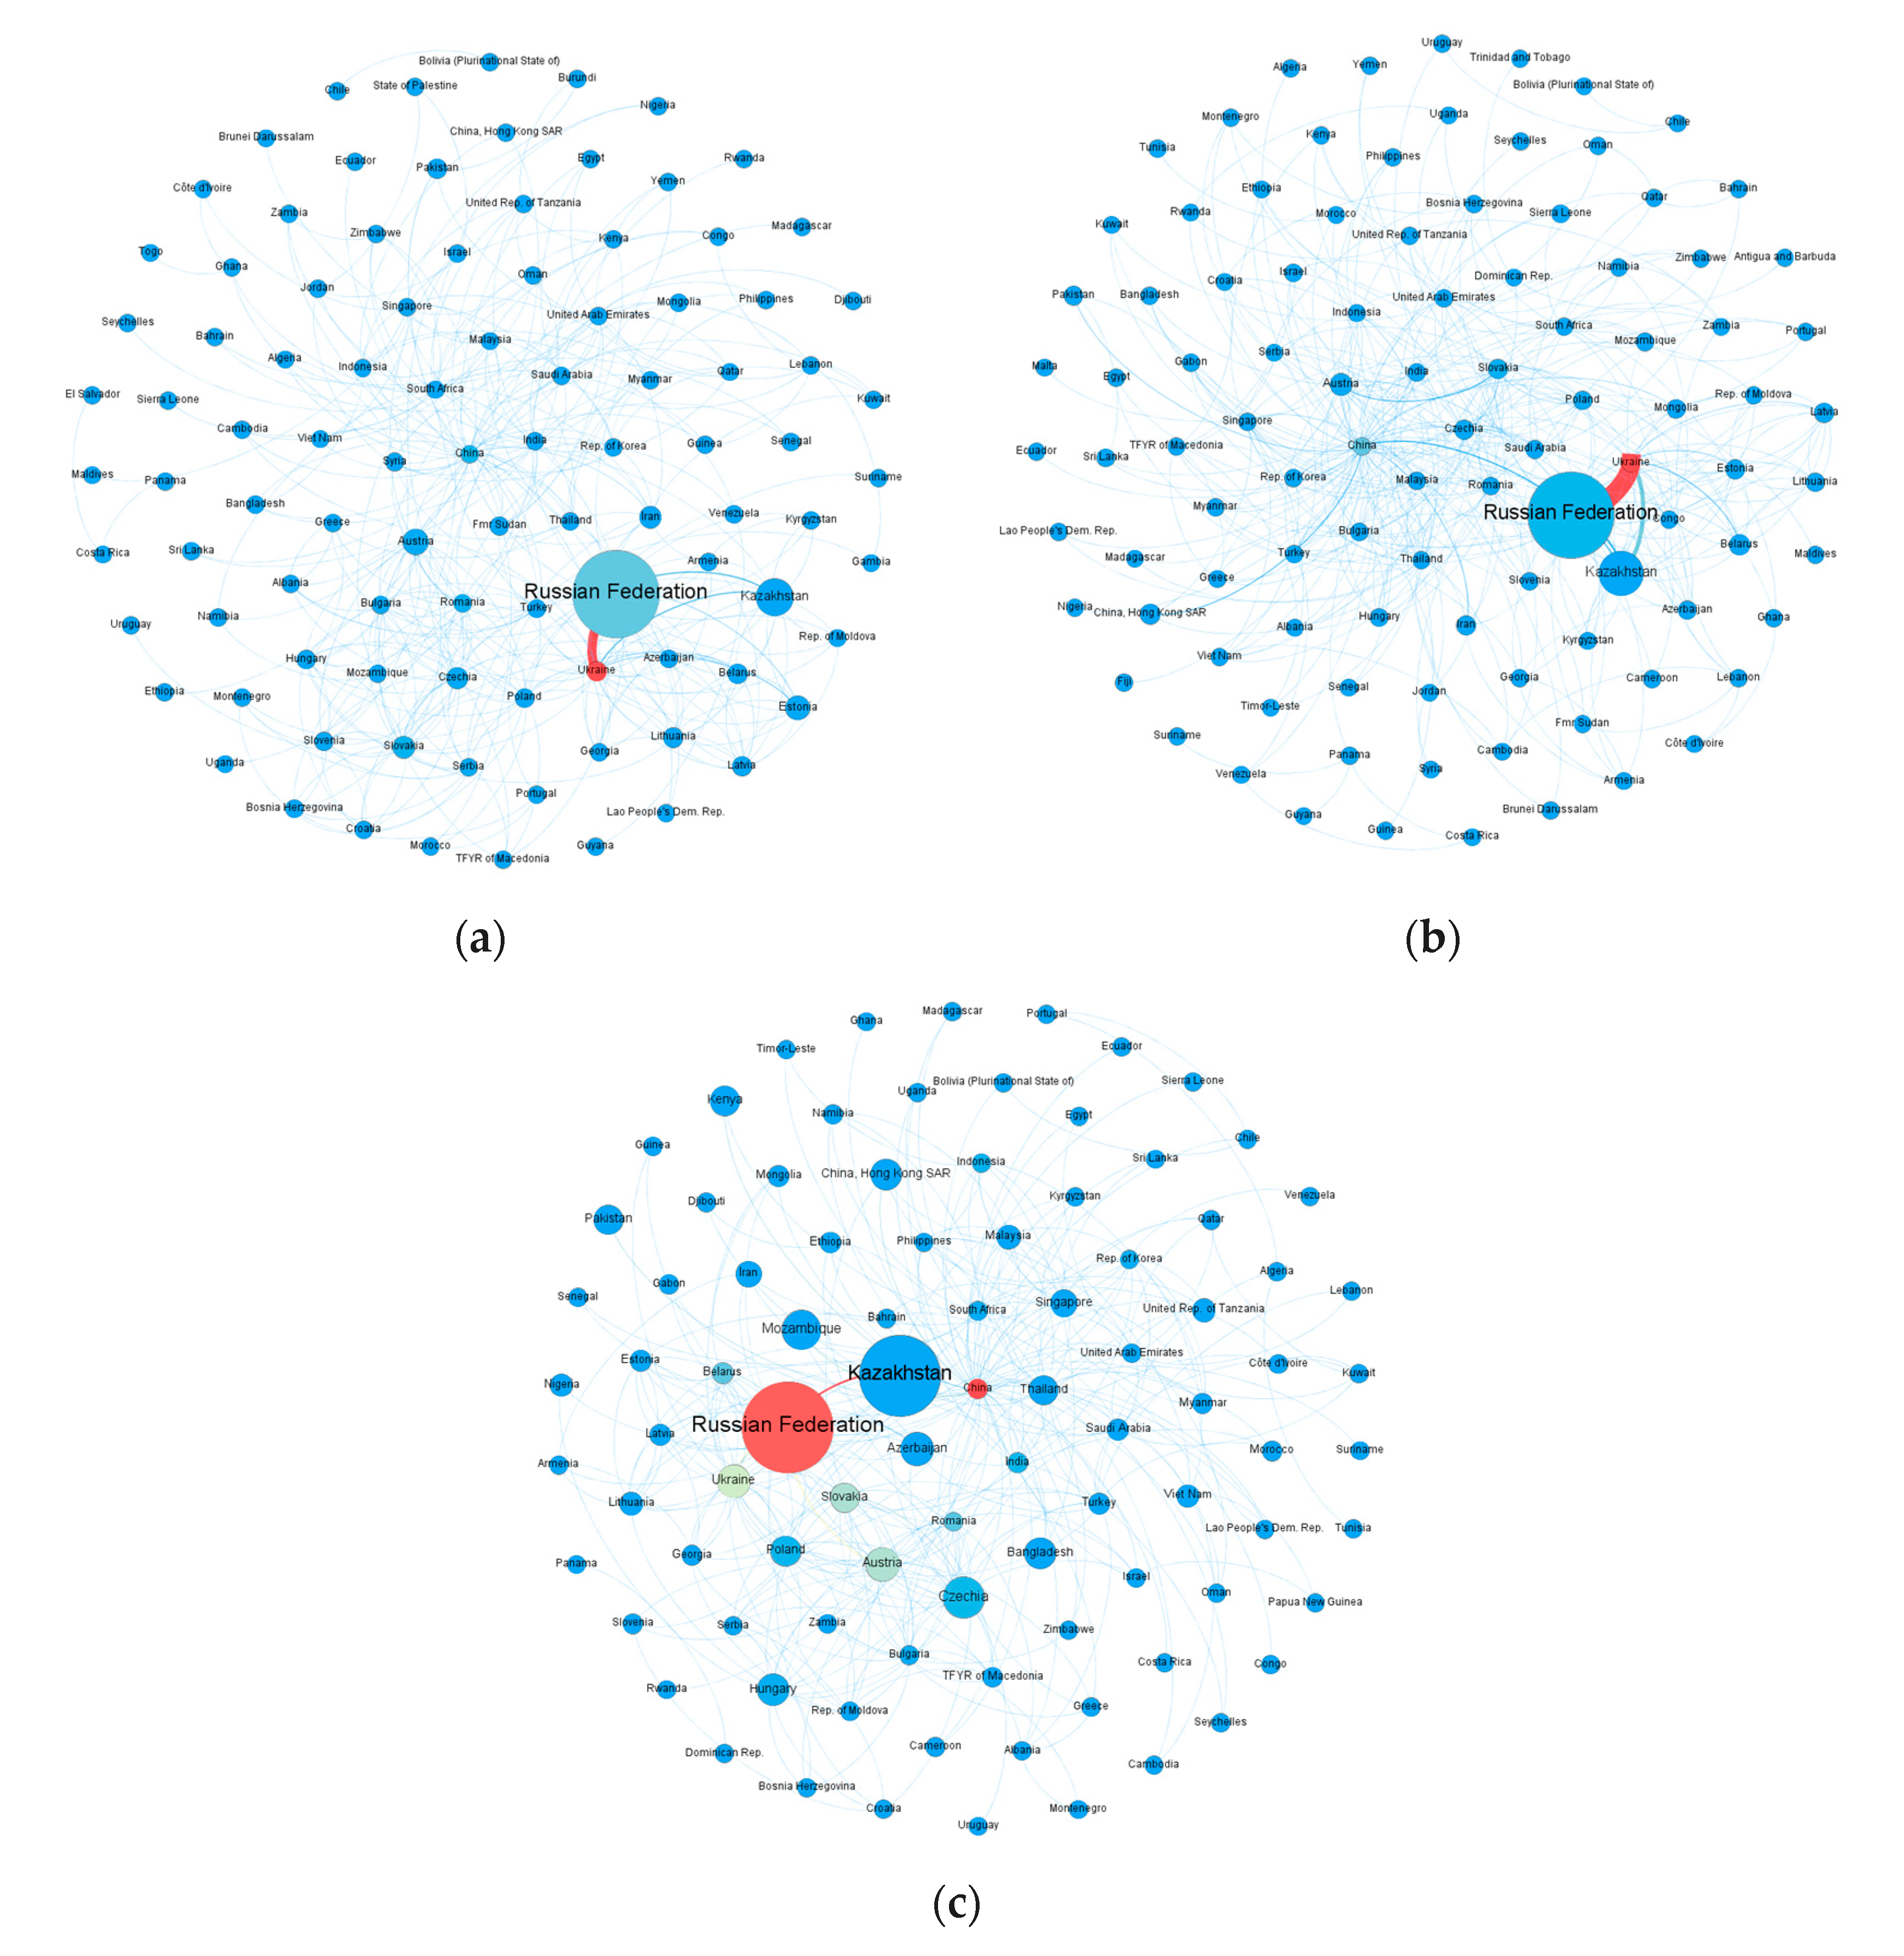
5.2.2. Parts
6. Discussion
6.1. Evolution of Trade Links and Community Structure
6.2. Intraregional Export Competitiveness of BRI Countries and the Evolutions
6.3. Vulnerability of Rolling Stocks Trade Networks
6.4. Implications of This Study
7. Conclusions
Author Contributions
Funding
Acknowledgments
Conflicts of Interest
Appendix A


References
- Givoni, M.; Brand, C.; Watkiss, P. Are Railways Climate Friendly? Built Environ. 2009, 35, 70–86. [Google Scholar] [CrossRef]
- Lin, B.; Du, Z. Can urban rail transit curb automobile energy consumption? Energy Policy 2017, 105, 120–127. [Google Scholar] [CrossRef]
- Aydin, G.; Dzhaleva-Chonkova, A. Discussions on rail in urban areas and rail history. Res. Transp. Econ. 2013, 41, 84–88. [Google Scholar] [CrossRef]
- Perl, A.D.; Goetz, A.R. Corridors, hybrids and networks: Three global development strategies for high speed rail. J. Transp. Geogr. 2015, 42, 134–144. [Google Scholar] [CrossRef]
- Kahn, M.E. Gentrification Trends in New Transit-Oriented Communities: Evidence from 14 Cities That Expanded and Built Rail Transit Systems. Real Estate Econ. 2007, 35, 155–182. [Google Scholar] [CrossRef]
- Pulido, D.; Darido, G.; Munoz-Raskin, R.; Moody, J. The Urban Rail Development Handbook; The World Bank: Washington, DC, USA, 2018; pp. 12–15. [Google Scholar]
- Ascensão, F.; Fahrig, L.; Clevenger, A.; Corlett, R.; Jaeger, J.; Laurance, W.; Pereira, H. Environmental challenges for the Belt and Road Initiative. Nat. Sustain. 2018, 1, 206–209. [Google Scholar] [CrossRef]
- Thacker, S.; Adshead, D.; Fay, M.; Hallegatte, S.; Harvey, M.; Meller, H.; O’Regan, N.; Rozenberg, J.; Watkins, G.; Hall, J.W. Infrastructure for sustainable development. Nat. Sustain. 2019, 2, 324–331. [Google Scholar] [CrossRef]
- Renner, M.; Gardner, G.; Alliance, A. Global Competitiveness in the Rail and Transit Industry; Worldwatch Institute Washington: Boston, MA, USA, 2010; p. 8. [Google Scholar]
- Bougheas, S.; Demetriades, P.O.; Morgenroth, E.L. Infrastructure, transport costs and trade. J. Int. Econ. 1999, 47, 169–189. [Google Scholar] [CrossRef]
- Sun, Z. Technology innovation and entrepreneurial state: The development of China’s high-speed rail industry. Technol. Anal. Strateg. Manag. 2015, 27, 646–659. [Google Scholar] [CrossRef]
- Chan, L.; Aldhaban, F. Technology transfer to China: With case studies in the high-speed rail industry. In Proceedings of the Portland International Conference on Management of Engineering and Technology, Portland, OR, USA, 2–6 August 2009; pp. 2858–2867. [Google Scholar]
- Liu, Z.; Wang, T.; Sonn, J.W.; Chen, W. The structure and evolution of trade relations between countries along the Belt and Road. J. Geogr. Sci. 2018, 28, 1233–1248. [Google Scholar] [CrossRef] [Green Version]
- Du, M.M. China’s “One Belt, One Road” initiative: Context, focus, institutions, and implications. Chin. J. Glob. Gov. 2016, 2, 30–43. [Google Scholar] [CrossRef] [Green Version]
- Cheng, L.K. Three questions on China’s “Belt and Road Initiative”. China Econ. Rev. 2016, 40, 309–313. [Google Scholar] [CrossRef]
- Yu, H. Motivation behind China’s ‘One Belt, One Road’ Initiatives and Establishment of the Asian Infrastructure Investment Bank. J. Contemp. China 2016, 26, 1–16. [Google Scholar] [CrossRef]
- Herrero, A.G.; Xu, J. China’s Belt and Road Initiative: Can Europe Expect Trade Gains? China World Econ. 2017, 25, 84–99. [Google Scholar] [CrossRef] [Green Version]
- Shichor, Y. Gains and Losses: Historical Lessons of China’s Middle East Policy for Its OBOR Initiative. Asian J. Middle East. Islamic Stud. 2018, 12, 127–141. [Google Scholar] [CrossRef]
- Swaine, M.D. Chinese views and commentary on the ‘One Belt, One Road’initiative. China Leadersh. Monit. 2015, 47, 3. [Google Scholar]
- Haggai, K. One Belt One Road strategy in China and economic development in the concerning countries. World J. Soc. Sci. Humanit. 2016, 2, 10–14. [Google Scholar]
- Lee, C.H.; Zhao, J.L.; Hassna, G. Government-incentivized crowdfunding for one-belt, one-road enterprises: Design and research issues. Financ. Innov. 2016, 2, 2. [Google Scholar] [CrossRef] [Green Version]
- van der Kley, D. Chinese Companies’ Localization in Kyrgyzstan and Tajikistan. Probl. Post-Communism 2020, 67, 241–250. [Google Scholar] [CrossRef]
- Lowe, M.; Tokuoka, S.; Dubay, K.; Gereffi, G. US Manufacture of Rail Vehicles for Intercity Passenger Rail and Urban Transit; Center on Globalization, Governance & Competitiveness; Duke University: Durham, NC, USA, 2010; pp. 13–26. [Google Scholar]
- Sato, Y. Global market of rolling stock manufacturing: Present situation and future potential. Jpn. Railw. Transp. Rev. 2005, 41, 4–13. [Google Scholar]
- Tsutsumi, I. Change to Domestic Production of Railway Rolling Stock in Japan. Jpn. Railw. Transp. Rev. 2010, 56, 36–46. [Google Scholar]
- Mizoguchi, M. The rolling stock manufacturing industry in Japan. Jpn. Railw. Transp. Rev. 2005, 41, 14–23. [Google Scholar]
- Lawrence, B.M.; Bullock, G.R.; Liu, Z. China’s High-Speed Rail Development; 137512; World Bank: Washington, DC, USA, 2019; pp. 5–20. [Google Scholar]
- Tan, P.; Ma, J.-E.; Zhou, J.; Fang, Y.-T. Sustainability development strategy of China’s high speed rail. J. Zhejiang Univ. -Sci. A 2016, 17, 923–932. [Google Scholar] [CrossRef] [Green Version]
- Kantarci, M. Local Content Rules as a Tool of Technology Transfer in the Turkish Rolling Stock Manufacturing Industry: Tulomsas Experience. In Designing Public Procurement Policy in Developing Countries; Yülek, M.A., Taylor, T.K., Eds.; Springer New York: New York, NY, USA, 2012; pp. 217–233. [Google Scholar]
- Feng, L.; Yu, X. A Study on the Integration Innovation Mode of China Railway High-Speed (CRH) Technology. In Proceedings of the Portland International Conference on Management of Engineering and Technology, Honolulu, HI, USA, 19–23 August 2018; pp. 1–5. [Google Scholar]
- Andersen, P.A. Rolling Stock: Locomotives and Rail Cars; United States International Trade Commission: Washington, DC, USA, 2011; pp. 30–51.
- Newman, M.E.J. The structure of scientific collaboration networks. Proc. Natl. Acad. Sci. USA 2001, 98, 404–409. [Google Scholar] [CrossRef]
- Newman, M.E.J. Scientific collaboration networks. I. Network construction and fundamental results. Phys. Rev. E 2001, 64, 016131–026138. [Google Scholar] [CrossRef] [PubMed] [Green Version]
- Scott, J. Social Network Analysis, 4th ed.; SAGE: London, UK, 2017; pp. 2–3. [Google Scholar]
- Ricardo, L.; Rêgo, L.C. The use of nodes attributes in social network analysis with an application to an international trade network. Phys. A: Stat. Mech. Its Appl. 2018, 491, 249–270. [Google Scholar]
- Emirbayer, M.; Goodwin, J. Network analysis, culture, and the problem of agency. Am. J. Sociol. 1994, 99, 1411–1454. [Google Scholar] [CrossRef]
- Blondel, V.D.; Guillaume, J.-L.; Lambiotte, R.; Lefebvre, E. Fast unfolding of communities in large networks. J. Stat. Mech. Theory Exp. 2008, 2008, 10008–10019. [Google Scholar] [CrossRef] [Green Version]
- Newman, M.E.J. Modularity and community structure in networks. Proc. Natl. Acad. Sci. USA 2006, 103, 8577–8582. [Google Scholar] [CrossRef] [Green Version]
- Newman, M.E.J.; Girvan, M. Finding and evaluating community structure in networks. Phys. Rev. E 2004, 69, 26113–26127. [Google Scholar] [CrossRef] [Green Version]
- Saramäki, J.; Kivelä, M.; Onnela, J.-P.; Kaski, K.; Kertész, J. Generalizations of the clustering coefficient to weighted complex networks. Phys. Rev. E 2007, 75, 27105–27109. [Google Scholar] [CrossRef] [PubMed] [Green Version]
- Stanley Wasserman, K.F. Social Network Analysis Methods and Applications; Cambridge University Press: New York, NY, USA, 1994; pp. 52–54. [Google Scholar]
- Butts, C.T. Social network analysis: A methodological introduction. Asian J. Soc. Psychol. 2008, 11, 13–41. [Google Scholar] [CrossRef] [Green Version]
- Jinhu, L.; Guanrong, C.; Ogorzalek, M.J.; Trajkovic, L. Theory and applications of complex networks: Advances and challenges. In Proceedings of the International Symposium on Circuits and Systems, Beijing, China, 19–23 May 2013; pp. 2291–2294. [Google Scholar]
- Kim, J.; Wilhelm, T. What is a complex graph? Phys. A Stat. Mech. Its Appl. 2008, 387, 2637–2652. [Google Scholar] [CrossRef]
- Taylor, A.; Suzana, D. Representing Complex Evolving Spatial Networks: Geographic Network Automata. Int. J. Geo-Inf. 2020, 9, 270. [Google Scholar]
- Holme, P.; Kim, B.J.; Yoon, C.N.; Han, S.K. Attack vulnerability of complex networks. Phys. Rev. E 2002, 65, 056109. [Google Scholar] [CrossRef] [Green Version]
- Albert, R.; Albert, I.; Nakarado, G.L. Structural vulnerability of the North American power grid. Phys. Rev. E 2004, 69, 025103. [Google Scholar] [CrossRef] [Green Version]
- Mishkovski, I.; Biey, M.; Kocarev, L. Vulnerability of complex networks. Commun. Nonlinear Sci. Numer. Simul. 2011, 16, 341–349. [Google Scholar] [CrossRef] [Green Version]
- Bhattacharya, K.; Mukherjee, G.; Saramäki, J.; Kaski, K.; Manna, S.S. The international trade network: Weighted network analysis and modelling. J. Stat. Mech. Theory Exp. 2008, 2008, 2002–2011. [Google Scholar] [CrossRef]
- De Benedictis, L.; Tajoli, L.J.T. The world trade network. World Econ. 2011, 34, 1417–1454. [Google Scholar] [CrossRef]
- Fagiolo, G.J. The international-trade network: Gravity equations and topological properties. J. Econ. Interact. Coord. 2010, 5, 1–25. [Google Scholar] [CrossRef] [Green Version]
- Garlaschelli, D.; Loffredo, M.I. Structure and evolution of the world trade network. Phys. A Stat. Mech. Its Appl. 2005, 355, 138–144. [Google Scholar] [CrossRef] [Green Version]
- Gao, C.; Sun, M.; Shen, B. Features and evolution of international fossil energy trade relationships: A weighted multilayer network analysis. Appl. Energy 2015, 156, 542–554. [Google Scholar] [CrossRef]
- Geng, J.-B.; Ji, Q.; Fan, Y. A dynamic analysis on global natural gas trade network. Appl. Energy 2014, 132, 23–33. [Google Scholar] [CrossRef]
- Zhong, W.; An, H.; Gao, X.; Sun, X. The evolution of communities in the international oil trade network. Phys. A-Stat. Mech. Its Appl. 2014, 413, 42–52. [Google Scholar] [CrossRef]
- Shutters, S.T.; Muneepeerakul, R. Agricultural Trade Networks and Patterns of Economic Development. PLoS ONE 2012, 7, e39756. [Google Scholar] [CrossRef] [PubMed]
- Dalin, C.; Konar, M.; Hanasaki, N.; Rinaldo, A.; Rodriguez-Iturbe, I. Evolution of the global virtual water trade network. PNAS 2012, 109, 5989–5994. [Google Scholar] [CrossRef] [Green Version]
- Gong, P.; Song, Z.; Liu, W. The commodity pattern of trade between China and “Belt and Road” countries. Prog. Geogr. 2015, 34, 571–580. [Google Scholar]
- Chong, Z.; Qin, C.; Pan, S. The Evolution of the Belt and Road Trade Network and Its Determinant Factors. Emerg. Mark. Financ. Trade 2019, 55, 3166–3177. [Google Scholar] [CrossRef]
- Song, Z.; Che, S.; Yang, Y. The trade network of the Belt and Road Initiative and its topological relationship to the global trade network. J. Geogr. Sci. 2018, 28, 1249–1262. [Google Scholar] [CrossRef] [Green Version]
- Zhang, C.; Fu, J.; Pu, Z. A study of the petroleum trade network of countries along “The Belt and Road Initiative”. J. Clean. Prod. 2019, 222, 593–605. [Google Scholar] [CrossRef]
- Zhang, J. Oil and gas trade between China and countries and regions along the ‘Belt and Road’: A panoramic perspective. Energy Policy 2019, 129, 1111–1120. [Google Scholar] [CrossRef]
- Liu, C.; Xu, J.; Zhang, H. Competitiveness or Complementarity? A Dynamic Network Analysis of International Agri-Trade along the Belt and Road. Appl. Spat. Anal. Policy 2019, 13, 349–374. [Google Scholar] [CrossRef]
- Zhang, Y.; Zhang, J.-H.; Tian, Q.; Liu, Z.-H.; Zhang, H.-L. Virtual water trade of agricultural products: A new perspective to explore the Belt and Road. Sci. Total Environ. 2018, 622, 988–996. [Google Scholar] [CrossRef] [PubMed]
- UN Comtrade Database. Available online: https://comtrade.un.org/ (accessed on 5 November 2018).
- Belt and Road Portal. Available online: https://www.yidaiyilu.gov.cn/ (accessed on 30 September 2018).
- Grimm, E.C. Coniss: A Fortran 77 Program for Stratigraphically Constrained Cluster Analysis by the Method of Incremental Sum of Squares. Comput. Geosci. 1987, 13, 13–35. [Google Scholar] [CrossRef]
- Freeman, L.C. A Set of Measures of Centrality Based on Betweenness. Sociometry 1977, 40, 35–41. [Google Scholar] [CrossRef]
- Seaquist, J.; Johansson, E.; Nicholas, K.A.J. Architecture of the global land acquisition system: Applying the tools of network science to identify key vulnerabilities. Environ. Res. Lett. 2014, 9, 114006. [Google Scholar] [CrossRef]
- Watts, D.J.; Strogatz, S.H. Collective dynamics of ‘small-world’ networks. Nature 1998, 393, 440–442. [Google Scholar] [CrossRef] [PubMed]
- Fruchterman, T.M.J.; Reingold, E.M. Graph drawing by force-directed placement. Softw. Pract. Exp. 1991, 21, 1129–1164. [Google Scholar] [CrossRef]
- Peter, H. Economic Consequences of the Ukraine Conflict; The Vienna Institute for International Economic Studies (wiiw): Vienna, Austria, 2014; pp. 6–22. [Google Scholar]
- Petreska, I.; Tomovski, I.; Gutierrez, E.; Kocarev, L.; Bono, F.; Poljansek, K. Application of modal analysis in assessing attack vulnerability of complex networks. Commun. Nonlinear Sci. Numer. Simul. 2010, 15, 1008–1018. [Google Scholar] [CrossRef]
- Gao, P.; Zhang, H.; Wu, Z.; Wang, J. Visualising the expansion and spread of coronavirus disease 2019 by cartograms. Environ. Plan. A Econ. Space 2020, 52, 698–701. [Google Scholar] [CrossRef] [Green Version]
- Zhang, T.; Cheng, C.; Gao, P. Permutation Entropy-Based Analysis of Temperature Complexity Spatial-Temporal Variation and Its Driving Factors in China. Entropy 2019, 21, 1001. [Google Scholar] [CrossRef] [Green Version]


| Category Number | Category Name | Products Included (HS Code) |
|---|---|---|
| 1 | Rail locomotives and self-propelled coaches and vans | 8601, 8602, 8603 |
| 2 | Maintenance or service vehicles | 8604 |
| 3 | Not self-propelled coaches and vans | 8605, 8606 |
| 4 | Parts | 8607 |
| 5 | Track fitting, signaling, and auxiliary traffic control equipment | 8608 |
| Years | Length | |
|---|---|---|
| Phase 1 | 2003–2008 | six years |
| Phase 2 | 2009–2013 | five years |
| Phase 3 | 2014–2017 | four years |
| Phase 1 (2003–2008) | Phase 2 (2009–2013) | Phase 3 (2014–2017) | |||||||
|---|---|---|---|---|---|---|---|---|---|
| Rank | Country | Outdegree | Out-strength ($) | Country | Outdegree | Out-strength ($) | Country | Outdegree | Out-strength ($) |
| 1 | China | 98 | 2.5 × 10⁹ | China | 102 | 3.7 × 10⁹ | China | 106 | 4.1 × 10⁹ |
| 2 | Ukraine | 40 | 1.3 × 10⁹ | Ukraine | 48 | 2.7 × 10⁹ | Russian | 50 | 5.1 × 10⁸ |
| 3 | Russian | 60 | 5.5 × 10⁸ | Russian | 64 | 6.7 × 10⁸ | Austria | 80 | 4.8 × 10⁸ |
| 4 | Austria | 73 | 4.0 × 10⁸ | Czechia | 62 | 4.9 × 10⁸ | Czechia | 70 | 4.6 × 10⁸ |
| 5 | Czechia | 61 | 2.9 × 10⁸ | Rep. of Korea | 64 | 4.3 × 10⁸ | Ukraine | 47 | 3.4 × 10⁸ |
| 6 | Slovakia | 35 | 1.8 × 10⁸ | Austria | 75 | 3.2 × 10⁸ | South Korea | 62 | 3.3 × 10⁸ |
| 7 | South Korea | 47 | 1.5 × 10⁸ | Poland | 64 | 2.6 × 10⁸ | Poland | 72 | 2.2 × 10⁸ |
| 8 | Romania | 43 | 9.8 × 10⁷ | Slovakia | 35 | 2.0 × 10⁸ | Hungary | 44 | 1.8 × 10⁸ |
| 9 | Hungary | 45 | 9.7 × 10⁷ | Hungary | 45 | 1.8 × 10⁸ | Slovakia | 31 | 1.6 × 10⁸ |
| 10 | Malaysia | 36 | 6.0 × 10⁷ | South Africa | 78 | 9.7 × 10⁷ | Belarus | 22 | 1.2 × 10⁸ |
| Items | Phase 1 (2003–2008) | Phase 2 (2009–2013) | Phase 3 (2014–2017) |
|---|---|---|---|
| Nodes | 109.0 | 110.4 | 109.8 |
| Edges | 962.7 | 1189.2 | 1269.3 |
| Export Countries | 84.8 | 91.0 | 80.8 |
| Total Intraregional Export ($) | 6.1 × 10⁹ | 9.7 × 10⁹ | 7.8 × 10⁹ |
| Total Export Share of the Top Ten Exporters | 93.2% | 92.6% | 88.9% |
| Network Density | 0.0815 | 0.0986 | 0.1063 |
| Modularity Degree | 0.5427 | 0.4698 | 0.5305 |
| Clustering Coefficient | 0.4390 | 0.4604 | 0.5010 |
| Average Path Length | 2.4625 | 2.3362 | 2.1643 |
| Products | Nodes | Edges | Network Density | Modularity Degree | Clustering Coefficient | Average Path Length |
|---|---|---|---|---|---|---|
| Rail Locomotives and Self-propelled Coaches and Vans | 92.33 | 331.33 | 0.04 | 0.57 | 0.28 | 2.95 |
| Maintenance or Service Vehicles | 77.67 | 201.00 | 0.03 | 0.24 | 0.21 | 3.58 |
| Not Self-propelled Coaches and Vans | 97.00 | 377.00 | 0.04 | 0.46 | 0.30 | 3.01 |
| Parts | 109.00 | 1061.33 | 0.09 | 0.41 | 0.53 | 2.27 |
| Track Fittings, Signaling, and Traffic Control Auxiliary Equipment | 104.67 | 619.00 | 0.06 | 0.48 | 0.50 | 2.38 |
© 2020 by the authors. Licensee MDPI, Basel, Switzerland. This article is an open access article distributed under the terms and conditions of the Creative Commons Attribution (CC BY) license (http://creativecommons.org/licenses/by/4.0/).
Share and Cite
Wang, Y.; Song, C.; Sigley, G.; Chen, X.; Yuan, L. Using Social Networks to Analyze the Spatiotemporal Patterns of the Rolling Stock Manufacturing Industry for Countries in the Belt and Road Initiative. ISPRS Int. J. Geo-Inf. 2020, 9, 431. https://0-doi-org.brum.beds.ac.uk/10.3390/ijgi9070431
Wang Y, Song C, Sigley G, Chen X, Yuan L. Using Social Networks to Analyze the Spatiotemporal Patterns of the Rolling Stock Manufacturing Industry for Countries in the Belt and Road Initiative. ISPRS International Journal of Geo-Information. 2020; 9(7):431. https://0-doi-org.brum.beds.ac.uk/10.3390/ijgi9070431
Chicago/Turabian StyleWang, Yuanhui, Changqing Song, Gary Sigley, Xiaoqiang Chen, and Lihua Yuan. 2020. "Using Social Networks to Analyze the Spatiotemporal Patterns of the Rolling Stock Manufacturing Industry for Countries in the Belt and Road Initiative" ISPRS International Journal of Geo-Information 9, no. 7: 431. https://0-doi-org.brum.beds.ac.uk/10.3390/ijgi9070431