1. Introduction
Topographic maps include the general geographic information, which determines their huge informational potential as far as the comprehensive study of changes in the environment and spatial structures is concerned [
1]. The symbols standing for major roads were included in the legends of such maps, the editions from both the 19th and 20th centuries, at the very beginning. Major roads constitute a constructional basis for the diversely used land, marking its structure. Moreover, the road system, with its density or differences in quality, reflect the stage of development of a given area. Successive map editions demonstrate the evolution of road networks and typical changes in land use forms. The information included in historic maps constitutes a valuable source of information helpful in reconstructing historic states of space both in terms of individual objects and phenomena and entire areas defined as integrated settlement structures, thoroughfares, and land use forms [
2].
The analysis of cartographic materials presenting the spatial development of Gliwice proves that this area has played an important part in the road system of the region, country and even part of Europe since 19th century [
3]. Obtaining and visualizing spatial data concerning major roads and how they crossed over a span of nearly two hundred years is significant in order to be able to demonstrate changes in space use. The roads, mainly the ‘Gliwice Sośnica’ freeway junction connecting international east–west and north–south corridors, significantly increased the importance of the area (A1 and A4 highway).
Modern cartographic forms, such as multimedia cartography, offer a wide range of opportunities to present and compile spatial data, i.e., AR (Augmented Reality) and VR (Virtual Reality) [
4,
5,
6], data from the low flight level [
7] or interactive web maps [
8,
9,
10]. The aim of the research described in this article was to verify the hypothesis of whether or not it is possible to demonstrate changes occurring in space and to reconstruct historic states of space, using modern multimedia technologies and cartographic sources that present the network of the most relevant roads of the region from the mid-19th century to the present day.
2. Methodology
2.1. Study Area
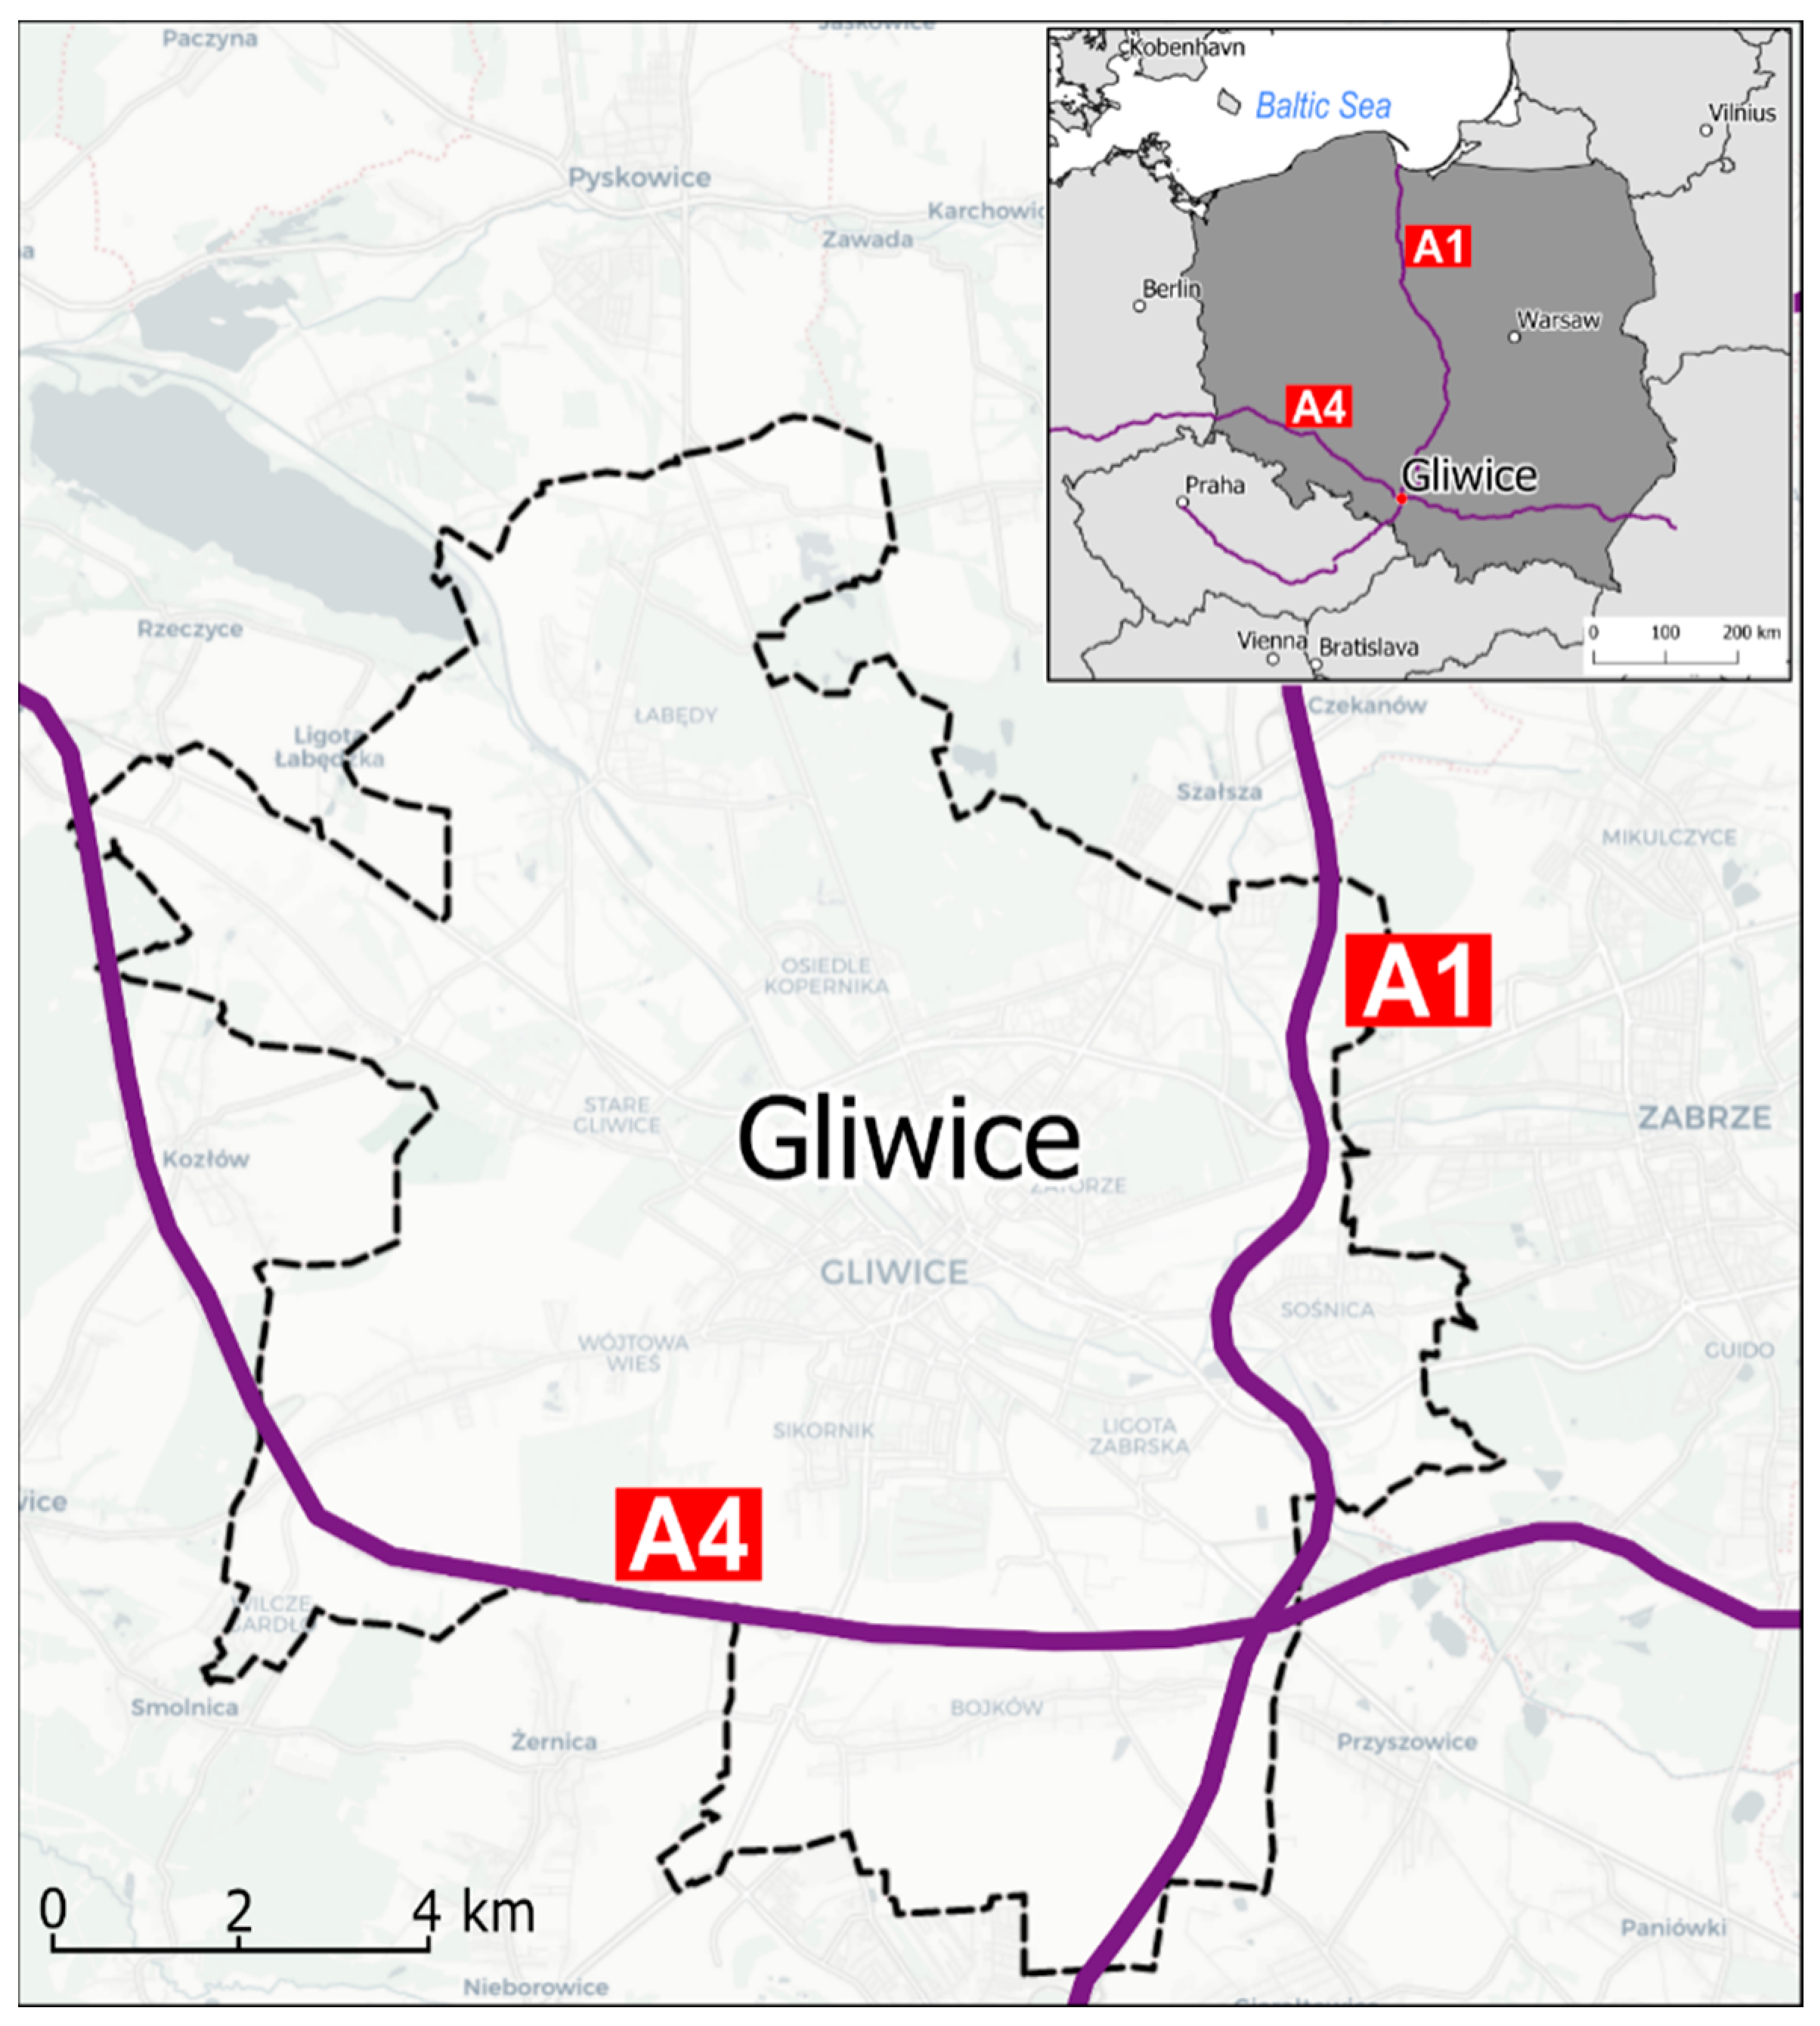
The study concerns the county of Gliwice located in southern Poland (
Figure 1) which has constituted an important industrial center based on coal and ore mining and processing for over 150 years. Spatial development of the region was strictly linked with the processes of industrialization and urbanization that were constantly progressing since the mid-19th century, manifesting themselves mainly through buildings (houses, housing estates, mines, plants and factories) and road networks (roads, railroads, river/inland transport). The fact that the old city was located upon a river that played a significant part in transport was an important advantage of the city, increasing its role in the region [
11,
12]. Currently, despite economic transformations and the decrease in the role of the industry in the late ‘80s, the region has retained its character and form of development shaped by previous decades. At the same time, one can observe some changes in land use resulting from current urbanization processes.
The development of road networks is one of the current symptoms of the interference in spatial structures of Gliwice. Two international corridors, the A1 and A4 highways, have become particularly relevant. The A4 has been visibly moved away from the center of Gliwice to the south, to the territory not so highly developed (including rural areas). The course of A1 is more complex, as the highway meanders between highly developed areas (
Figure 1), which are connected with the specificity of the region, where, since the mid-19th century, the borders between neighboring towns and formerly independent settlements have been blurred as a result of the significant development of industry and settlements [
12,
13].
Apart from the city area, an extra buffer zone of 1 km exists, resulting from the location of the freeway junction near the border with Gierałtowice, meaning that certain freeway exits are situated fragmentarily out of the borders of Gliwice. Moreover, on the stretch of several kilometers, the A4 highway runs in the axis of the area border. The buffer adopted allowed one to present and analyze the studied phenomenon in a complex way.
2.2. Source Materials
When collecting source material for the research, two main criteria were taken into consideration: the scale of the map and the period that the map presented. In terms of accuracy, the scale of 1:25,000 was adopted, as it allowed one to distinguish between several categories of roads, at the same time presenting the state of space. In 19th century Gliwice was under Prussian partition, hence, it was necessary to run a search query of the cartographic resources from Polish and German archives and libraries. Then, it was possible to collect maps of the selected area in the adopted scale.
The period represented on the map constituted the second criteria adopted in the process of collecting materials. Particular states are separated by time intervals of 30–50 years. It occurred for a few collections that some specific sections, which were parts of the current city area, differed by several years, according to the dates on sheets. The maps from late ‘20s constituted the greatest problem, as not all sheets depicting the current area of Gliwice were prepared in accordance with land borders of that time. In such cases the Prussian topographic map of 1:25,000, published at that time, was used.
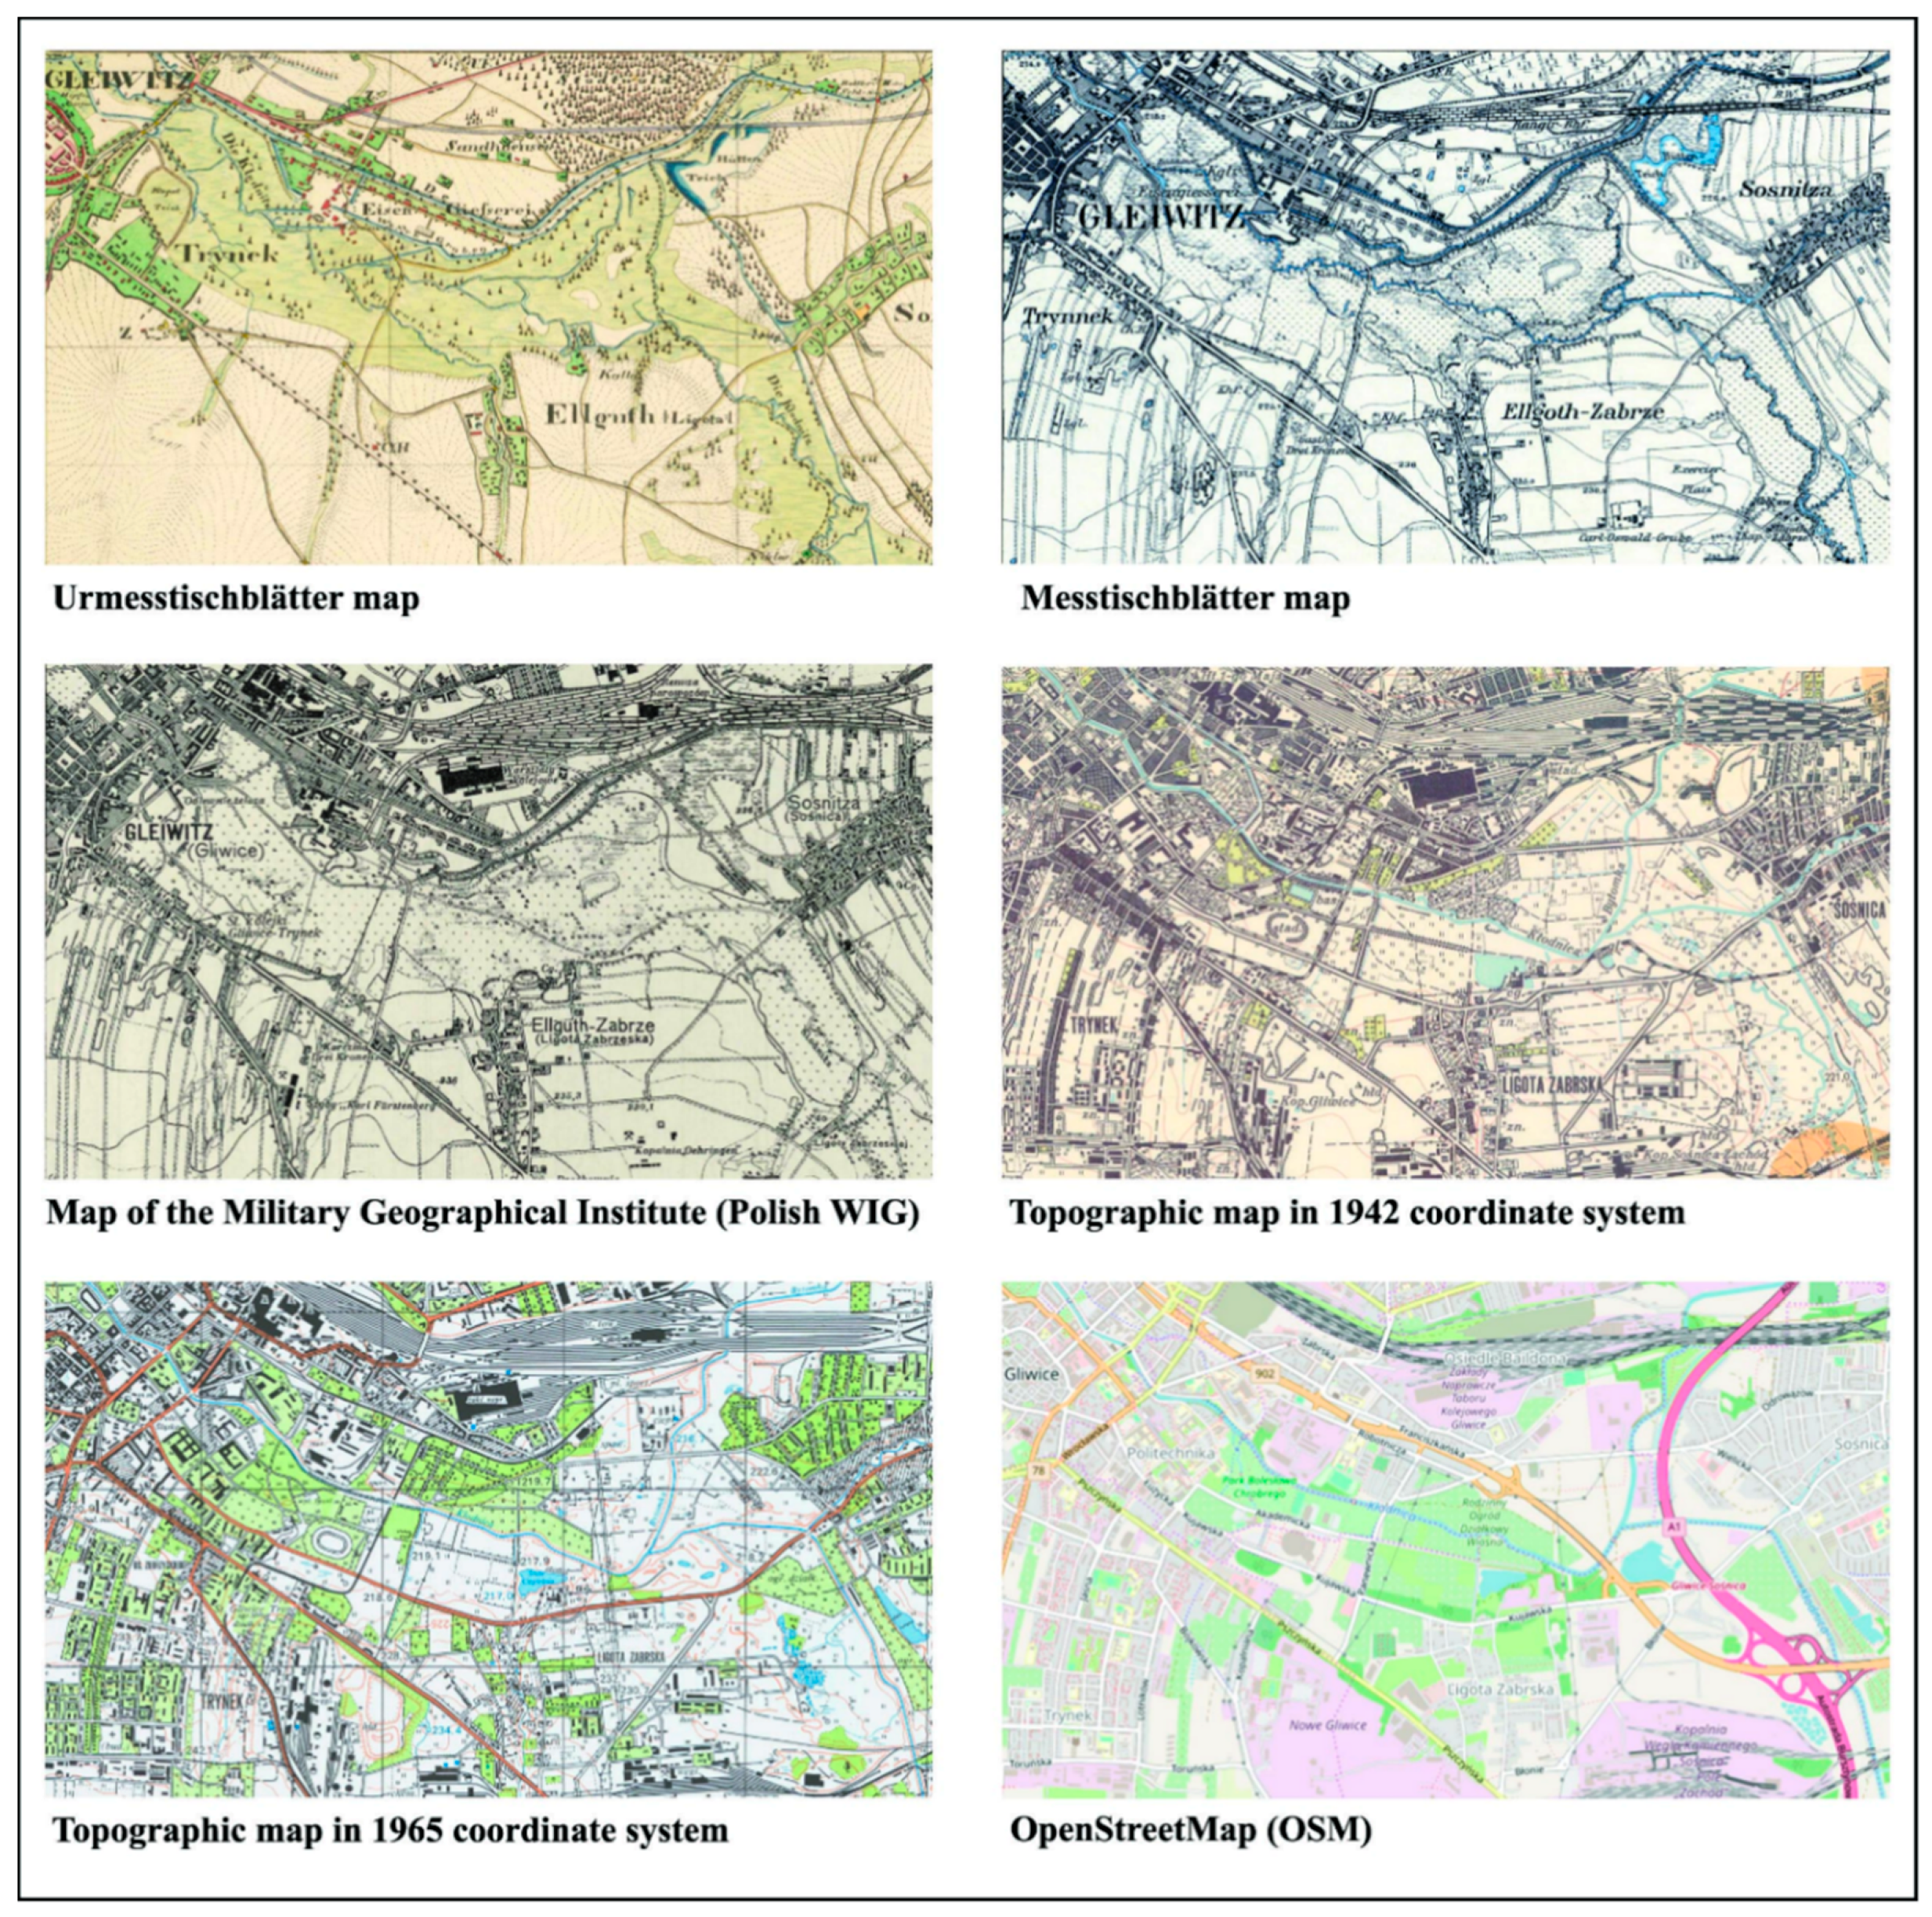
Furthermore, all the maps collected were included in the publishing series that covered the entire country (
Figure 2). Having made the aforementioned assumption, one could select 6 map collections, starting from the second decade of 19th century, as the maps from that period constituted a significant step in making cartometric maps (based on constantly developed geodetic surveys and improved surveying instruments).
2.2.1. Urmesstischblätter Map
The
Urmesstischblätter map, prepared at the scale of 1:25,000, depicts the state of space since the 1820s. It was created as a result of the demand for a unified and accurate map of the entire Prussia after the decisions of the Congress of Vienna that introduced a new division of the European countries. To meet the demand, the network of triangulation stations was created. One could connect with the stations during field work by means of plane table surveying. Individual sheets were prepared according to instructions by units of soldiers and commanding officers, whose names were included at the bottom of each sheet [
1]. In the 19th century, the area of Gliwice was under Prussian rule and such a situation continued till 1918. At that time, the Prussian topographic maps
Urmesstischblätter and
Messtischblätter were created. As Germany was united in the second half of the 19th century, the aforementioned maps presently constitute the heritage of the Federal Republic of Germany.
The map was prepared in Müffling polyhedric projection (
Preussische Polyederprojektion). For each sheet geographic coordinates in relation to Ferro Meridian were determined, adopting the sheet size of 10′ (longitude) and 6′ (latitude) [
14,
15]. The popular 19th century method of hachuring that allowed one to provide slope angles was applied to present the landform.
It is a manuscript map whose entire collection is a part of the Berlin State Library collection [
16]. The sections for the area analyzed come from 1827 and 1828. The area in question consisted of 4 sheets with the following numbers: 3307, 3308, 3351 and 3352. There was no legend on the sheets, however, the legend was published separately in 1818 with detailed clarifications of multicolored symbols indicating a high informational potential of the map [
17].
2.2.2. Messtischblätter Map
The 19th century progress in surveying methods and instruments was used by Prussian authorities in 1876 to prepare another topographic map.
Messtischblätter maps, as a continuation of the previous map series, were also made at the scale of 1:25,000. A new series of surveys and adopted technical solutions allowed one to work out cartometric maps [
10,
18]. According to the name of the collection translated from German (messen—to measure/survey, Tisch—table), plane table surveying was still the basic method in use, however, more accurate instruments, such as a drawing board mounted on a tripod with a stadia, were also applied.
Maps were published by the method of printing (lithography), but in comparison with
Urmesstischblätter the use of color was limited at that time. Monochromatic or dichromatic sheets were produced, with the blue color for marking surface water [
19]. Maps were published until the ‘30 s and were updated a few times at that time. A reference to the Prime Meridian in Greenwich occurred in the description of coordinates on the sheet.
Messtischblätter maps retained the same sheet size and division into sections as the first series of maps from the early 19th century. Hence, the area of Gliwice occupied the same four sheets, however, the new numeration was introduced: 5677, 5678, 5777, 5778. The sheets presenting the state from the 1880s were mainly used in the research. What is more, the later Messtischblätter editions were used to complete lacking Polish maps from the late ‘20s. Some of the sheets have basic legends located beyond the frame and in some cases the sheets covering the area of Poland have descriptions in two languages (German and Polish).
Two collections of the Prussian topographic maps used in the research share some common features, but also differ in some aspects. These are: the time of production, as Urmesstischblätter maps present the state from the first half of the 19th century, whereas Messtischblätter maps emerged in 1876. Both map types were based on geodetic surveys (on previously measured triangulation networks), however, inaccurate methods were still used on older maps. Thus, Messtischblätter maps showed higher measurement precision. The change in presenting the landform, apart from changes in the printing method and the use of colors, was also important. At the beginning, slopes of the land were presented through the method of hachuring, as contour lines were introduced in the second half of the 19th century. However, one should focus on the elements common to both types of maps, namely the same scale and invariable division into sheets. Maps were also characterized by a particular way of coding space used in Prussian topography. Separate legends for both series were produced and published in several editions.
2.2.3. Map of the Military Geographical Institute (Polish Wojskowy Instytut Geograficzny = WIG)
The late 1920s was another time period studied by the researchers. At that time, the Military Geographical Institute (English for:
Wojskowy Instytut Geograficzny = WIG) was the institution responsible for the production and publication of maps. The institution was established after Poland had regained independence in 1918. Initially, its role was to collect maps produced at the time of partitions and copy them for the army. Then, the realization of triangulation work and the preparation of the new concept of topographic maps, used later as a basis for detailed maps made at the scale of 1:25,000, began. Maps were intended for the army, but they were also of great importance to economic and social needs [
20].
The map was distinguished by the new system of topographic symbols (188 separations and 70 literal abbreviations). The map shared some common features with the Prussian
Messtischblätter map in terms of the way of coding. The “Borowa Góra” coordinate system, along with a quasi-stereographic
WIG projection, was adopted for the scale discussed. Those were monochromatic maps that sometimes used the brown color for the land form. The map produced by means of lithographic printing covered approximately 50% of the country’s area [
20].
According to indices, the modern area of Gliwice constitutes four sections of the map. Only two sheets covering the south-eastern and south-western part, made, respectively, in 1926 and 1933, were prepared. The remaining part of the area was a part of Germany at that time, therefore, two sheets presenting the state from 1928 and 1929 were completed with the
Messtischblätter map. The WIG map had the basic legend with separations for roads, railroads and forests beyond the frame at the bottom of the sheet (
Figure 3).
2.2.4. The Topographic Map in the 1942 Coordinate System
After WW2, when Poland became a zone under the strong influence of the Soviet Union, cartography was divided into the civil and the military. Furthermore, maps were censored and access to them was strictly limited. In 1952, the Conference of Geodetic Service of USSR and People’s Republic Countries was held. At the conference, the guidelines on map production, such as the 1942 coordinate system based on the Krasowski ellipsoid, and the division into sheets according to the International Map of the World 1:1,000,000, were adopted. States that participated in the conference, including Poland, were obliged to prepare a basic topographic map at the scale of 1:25,000 [
21].
Maps used in the research, made according to the Gauss–Krüger coordinate system, come from the ‘60 s (EPSG 3330). They were published to meet economic needs and lacked coordinates. Their content, compared to military editions, was also limited and, in terms of topographic objects and land form, masked by some tricks (the information about confidentiality of the data was placed on the map’s frame). Only after 1990 were confidentiality regulations lifted, and civil maps were finally published in this coordinate system [
20].
The area researched encompasses two sheets (number 3 and 5) of the former Gliwice county. The maps lacked the information about the system of the symbols used (the legend), however, as the content was limited, and one could distinguish the quality and order of the material presented [
22].
2.2.5. The Topographic Map in the 1965 Coordinate System
The system adopted in 1968 was a result of the fact that the use of the 1942 system had been limited in civil cartography. Observing the global situation, i.e., the development of satellite programs, and running operations during the Cold War, the authorities in Moscow ordered the Eastern Bloc countries to prepare an independent system for producing economic maps. The above circumstances resulted in the preparation and publication of topographic maps at the scale of 1:25,000 and 1:50,000 since the late 1970 [
21].
The Krasowski ellipsoid was the basic point of reference, but the system was not uniform for the entire country, as zones 1–4 were distinguished (prepared in the quasi-stereographic projection), and zone 5 was distinguished as well (made in the Gauss–Krüger coordinate system). The sheets had a different cut and division into sections in relation to the 1942 system. Moreover, maps in the 1965 system did not have the cartographic grid, so the topographic grid became the basis for the division into sections [
20,
21].
The current area of Gliwice is depicted on two map sheets in the 1965 system with 531.11 and 521.34 emblems in zone 5 (EPSG 2175), demonstrating the state of space from 1986. Furthermore, the limited content of the map was still censored and, in terms of graphic parameters, it was similar to military maps. An extended legend was placed on each sheet.
2.2.6. OpenStreetMap (OSM)
Originally a project of the Internet community aimed at creating a free map of the entire globe since 2004, it was adopted as the updated version to be used [
23] (EPSG 3857). The OSM base map, as a topographic map, was used to create this article because it was up-to-date and compatible with the web technology used in the web programming stage. The service provides many opportunities, such as visible legend (the “i” button on the website). Downloadable OSM data are saved in a PostgreSQL relational database, without spatial extensions, in the WGS84 coordinate system. Roads constitute 28% of the data [
24]. It is possible to display data in the 21-level zoom. The largest available scale: 1:500 (zoom 20), the smallest: 1:500,000,000 (zoom 0).
2.3. Selection of Objects from the Legend
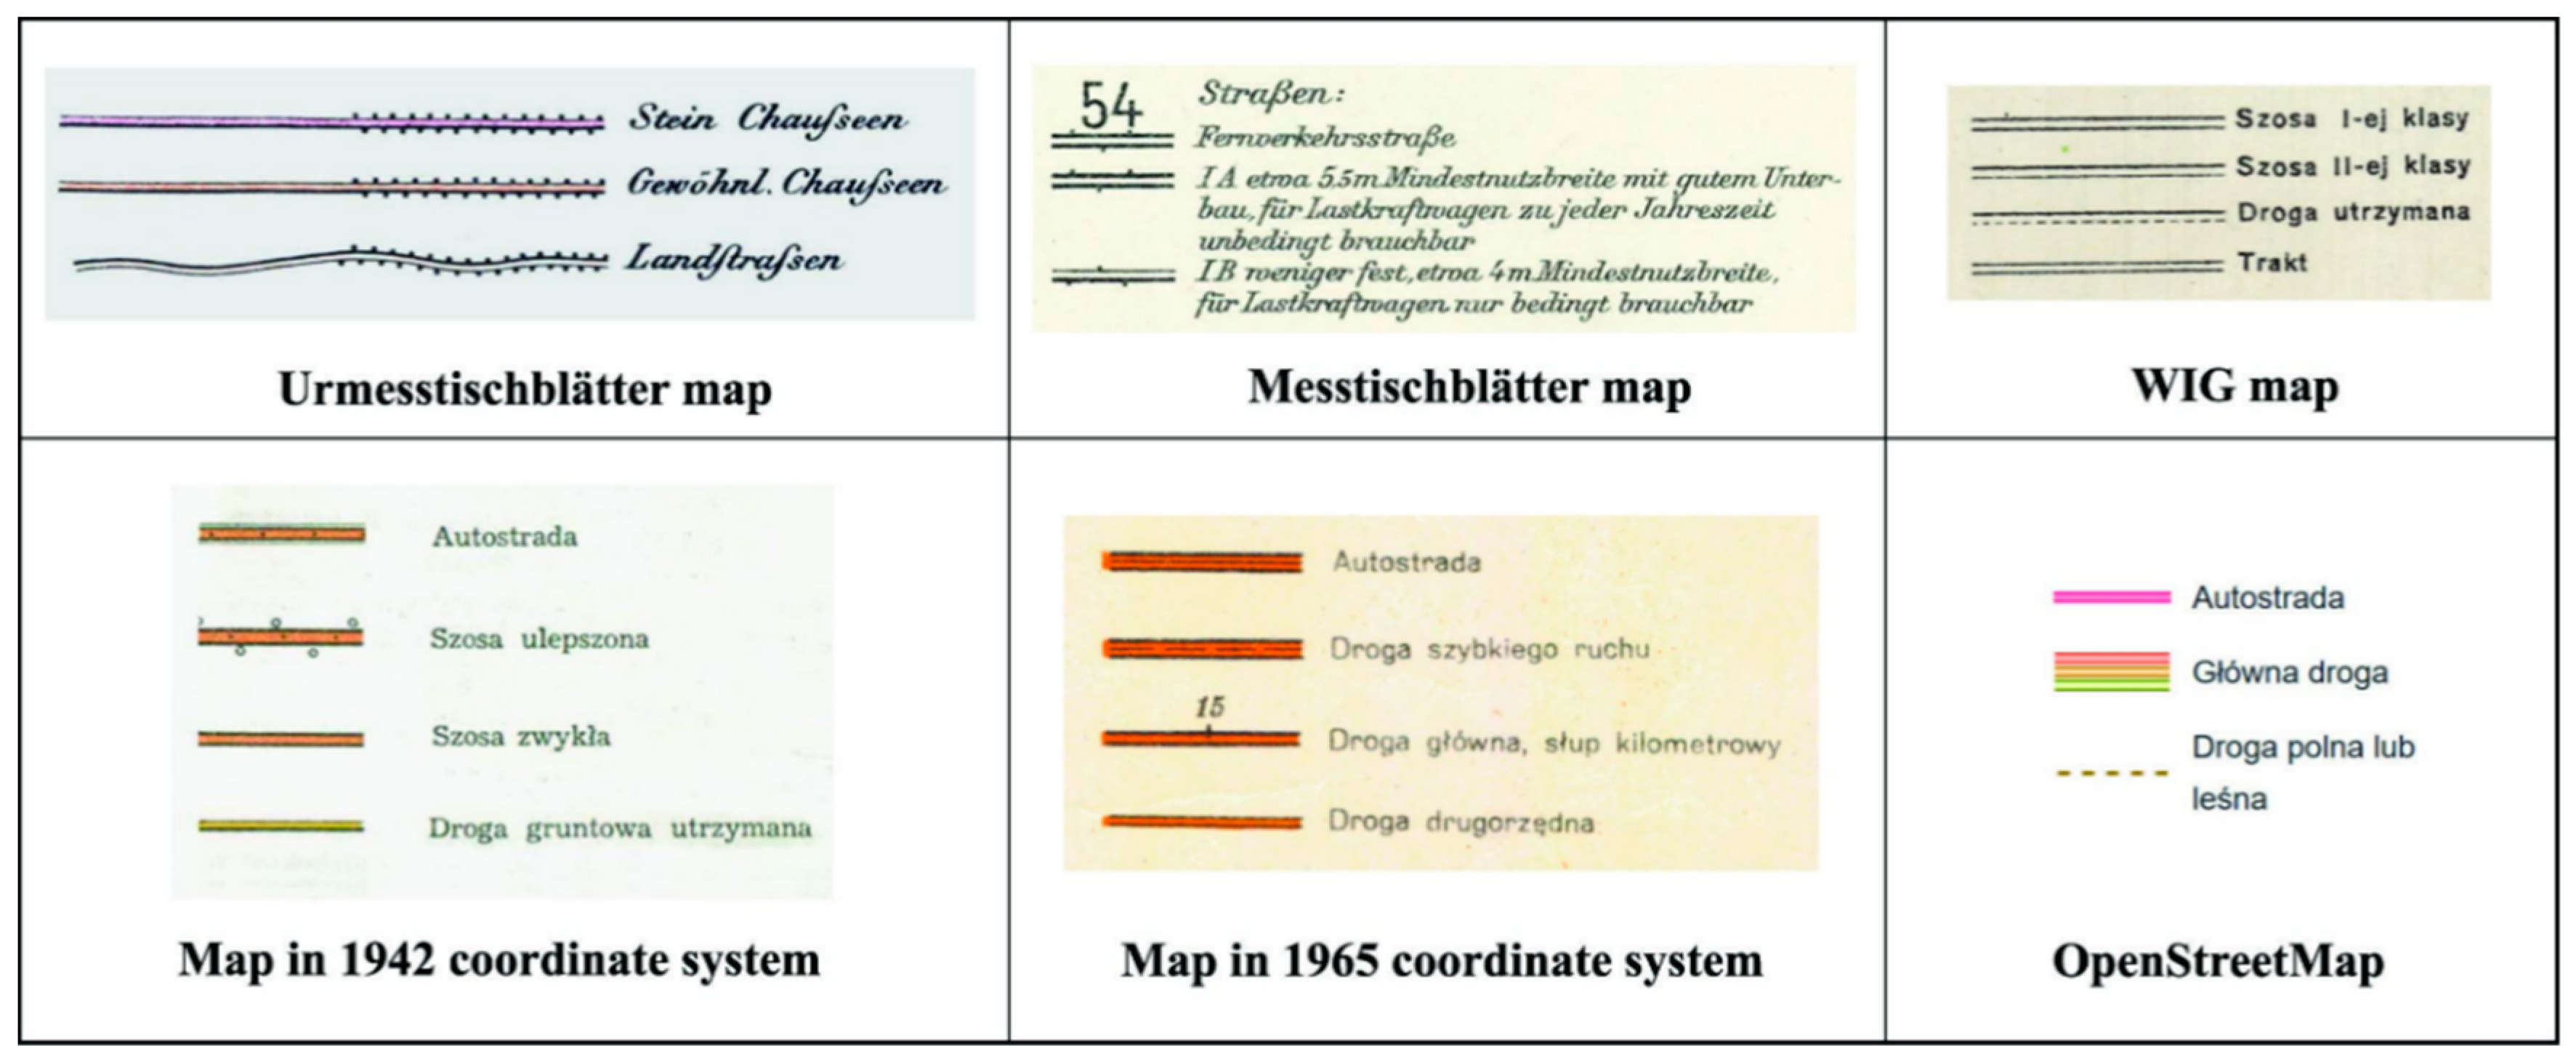
Given that map series have several editions with symbol explanations, the query of maps and their legends in terms of the aspects studied (major roads) made the authors adopt basic legend editions (
Figure 3). The authors adopted the explanations of symbols from map marginalia (if they occurred, e.g., WIG maps, the 1965 system) or, for
Urmesstischblätter maps, the first edition of the legend, as it was adequate for the content of the sheets collected. Furthermore, the later, usually more comprehensive editions of legends did not demonstrate any changes in the way major road categories were distinguished.
Messtischblätter maps’ legends included highways in later editions.
In the research, legends constituted a starting point and a point of reference that allowed the authors to identify given road categories on maps. However, it was the analysis of every single sheet that provided the information about the category of roads that occurred there. On the maps analyzed, the category of the same road stretches would frequently change, depending on the time period the map came from. It could result from different rules of categorization or technical guidelines used for making maps, as well as from road rebuilding/expansion. Using legends, the authors followed the changes in the evolution of major road corridors in Gliwice.
Figure 3 presents some fragments of legends that show the ways of presenting roads of the highest category for the six maps analyzed. All of the legends depict roads, starting from the highest category. One can observe a similar way of coding these objects in the editions researched, namely the use of bold black contour on both sides of the line. Additionally, in full-color editions, the extra filling color was added (e.g.,
Urmesstischblätter,
OSM). Explanations of symbols for the topographic map in the 1942 coordinate system constituted an exception among the materials collected. They came from the edition that was published many years after the map, as earlier legends, reserved for military map publications, had not been available.
2.4. Gathering and Processing Data
After six time periods demonstrating spatial structures with the road network of the city had been selected for further processing, the authors applied the scheme they had developed in previous studies [
10]. In this stage of research, the Qgis 3.12 program was used. Maps were registered to the current WGS-84 coordinate system (EPSG 4326). The registration was made by means of affine transformation based on 4 ground control points [
3]. Due to incomplete cartometricity, the georeferencing of the oldest map required particular care. In order to achieve optimum results (low RMSE with the appropriate proportion of a sheet), the larger number of ground control points was adopted. Selected fragments of
Urmesstischblätter sheets that were located in Gliwice or nearby were also registered. The registration of
Urmesstischblätter maps was the subject of the previous research [
17,
25].
Then, according to the scheme adopted, stretches of roads of the highest category, occurring on given sheets, were vectorized. On the OSM map, suitable fragments of linear objects were selected. Vectorization of roads according to the trace was carried out, starting from more recent to older maps and highlighting objects previously selected on the basis of legends. Roads from each period were saved in separate layers in the .shp format and finally six levels presenting the system of major roads in given time periods were gained [
10].
2.5. Web Map Programming
Roads representing the evolution of European road corridors (the A1 and A4 highways) for the six maps analyzed, prepared in the process of vectorization, constituted a basis for the web map. In the process of programming the interactive web map, the Leaflet library was used. As a JavaScript library, Leaflet is efficient, useful and open-source [
9,
10,
26]. It was also widely used in similar map versions. Leaflet supports the following extensions: GeoJSON, TopoJSON and KML, therefore, vectors of roads saved as .shp extension files (and other, i.e., .dbf, .shx, .cpg, .prj) had to be converted to GeoJSON files [
27]. According to Horbiński and Lorek [
10], it is recommended to use this extension for files of small size and representing a relatively small area. Furthermore, GeoJSON is a frequently adopted standard in preparing layers of interactive web maps [
28]. Necessary conversion, like in previous stages, was done in QGIS 3.12.
Having converted layers, researchers had to create the interactive web map on the basis of the previous assumptions [
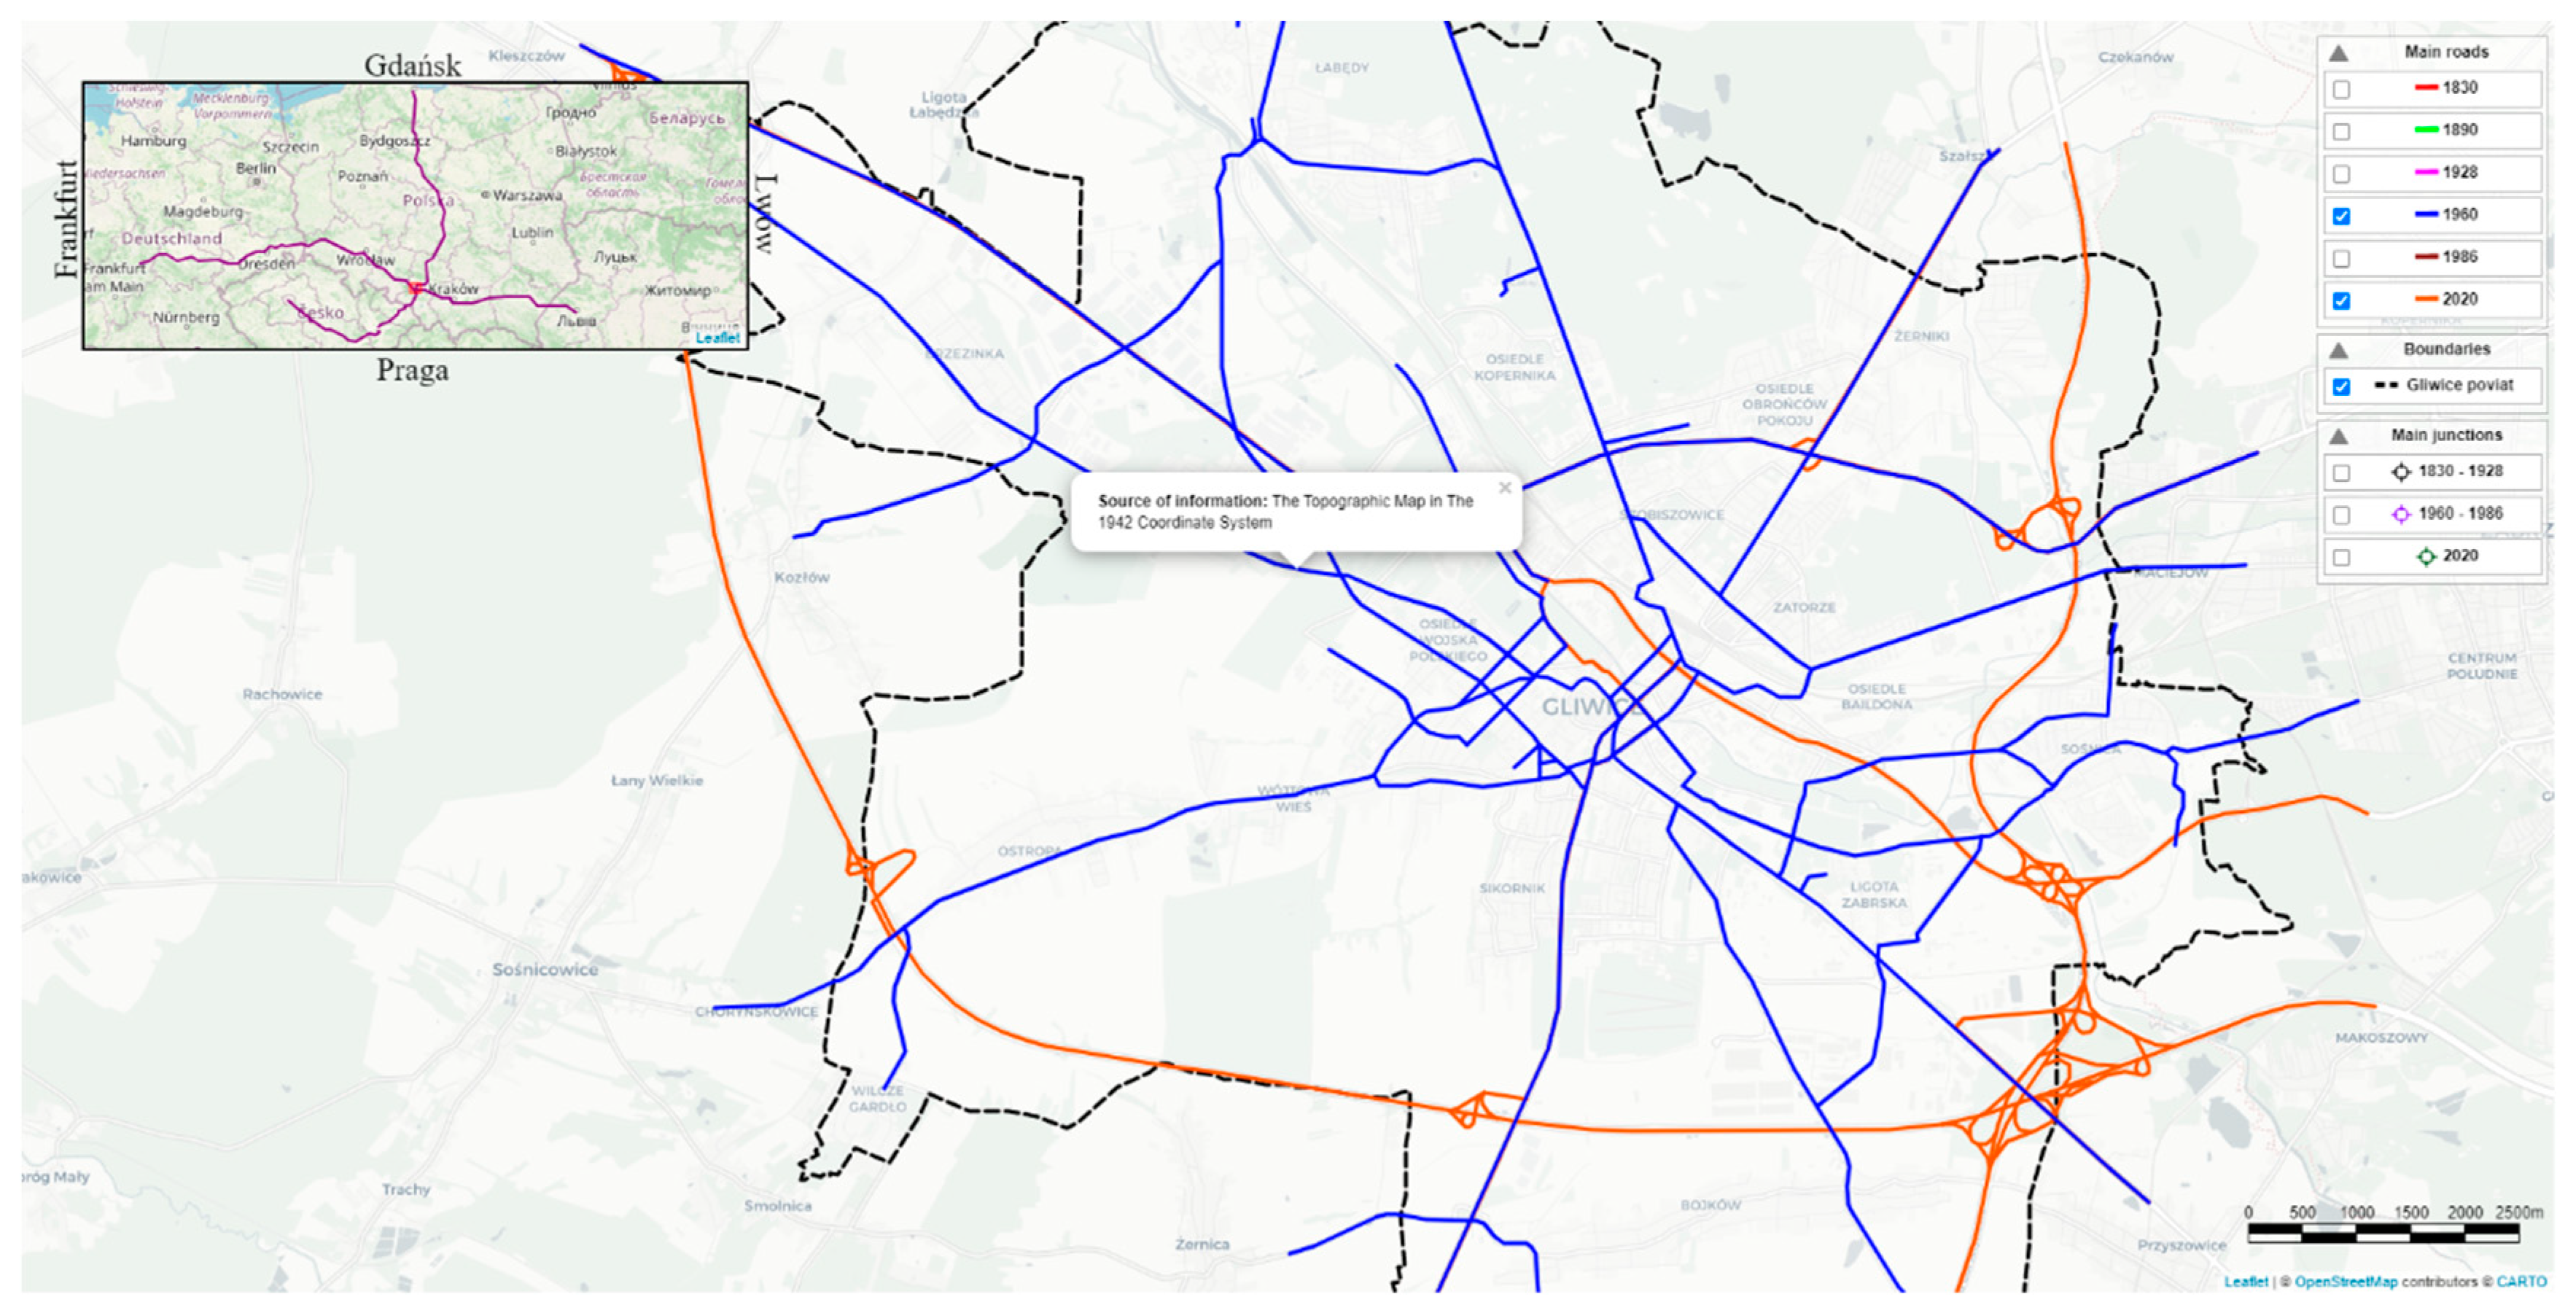
29]. According to the assumptions, the interactive web map presenting the evolution of major roads in Gliwice and construction of the junction of the European corridors (the A1 and A4 highways) is going to consist of the main map, overview map, layers and scale (
Figure 4). In addition to the layers presenting the state of the highest class roads, the authors added layers of the boundaries of the Gliwice poviat and layers with the most important road intersections in a specific period of time.
To design the interactive web map (main map), the basic functions of Leaflet and two plugins were used (Leaflet Panel Layers [
30] and leaflet-graphicscale [
31]). The first one allowed the user to switch road layers on and off in the six stages analyzed. The other one represented map scales graphically. The overview map is an additional element. The overview map is an interactive map presenting the entire course of the roads. Created as a separate object, it does not have any links with the main map. The interactive web map (
Figure 4) is available here:
http://kartografia.amu.edu.pl/Motorway/index.html, on the server of Adam Mickiewicz University in Poznań.
3. Results and Discussion
Over a span of nearly two centuries, one can observe changes in the way major roads run. On the interactive web map, the occurrence of the junctions of these roads in given time periods were marked with the sight, starting with the situation when they connected in the center of Gliwice (the state from 1828). According to Antrop [
32], it was one of the models typical of the settlement network of that time. The situation changed on the maps published nearly 100 years later. A crossing of major roads occurred in areas moved northwards from the city center. The change was linked with the urbanization and suburbanization process and intensified traffic that forced the construction of bypasses and moving the traffic away from the center [
12]. A construction of the freeway on the outskirts of the city and moving the main road junction to the south-east was the next stage.
The level of industrialization and urbanization of the city and its neighborhood in given time periods determined the expansion of road network, including thoroughfares of the highest category [
33]. The current state of the road network shows that mechanisms pushing the development were not only of the bottom-up character and were not resulting only from local needs in terms of economic development [
34]. Considering this part of Europe, it becomes clearly visible that the city of Gliwice is located on the crossing of two corridors that were developing gradually in European states to finally make a network of the most significant roads on the continent [
35]. Currently, both freeways are a part of the Trans-European Transport Network that makes a coherent transport network on the entire continent. The idea of the network emerged and was adopted in the 1990s as a result of international conferences (decisions of the European Parliament and the Council of the European Union) [
36].
The A4 freeway is an extension of the east–west freeway running through Germany (
Autobahn 4). Such roads were built there in the 1930s as a reply to a visible increase in the number of cars [
37]. A short stretch of freeway was also constructed in Poland at that time. The A1 freeway (“Amber Highway”) was constructed in the 1960s as a part of the project whose aim was to connect the north with the south of Europe. The name and course of the freeway refer to the historical Amber Road connecting the Baltic with the Mediterranean Sea. On the border with the Czech Republic, it connects with the D1 freeway (
dálnice D1), dating back to the 1930s [
38].
The “Gliwice Sośnica” junction was constructed between 2008 and 2010 and connected three thoroughfares on three separate levels. The A4 highway runs the lowest, the route 44 runs above and the A4 highway is the highest. Building was planned in a place where the Route 44 and the A4 highway crossed in 2005. Building one of the largest European freeway junctions in Gliwice ended in late 2009 and since September 2011 all sidings have functioned [
39]. In the junction, two trans-European transport corridors were linked. The A4 constitutes a part of the international E40 road, leading from Ostend to Kiev, crossing the Polish–German border in Jędrzychowice and the Polish–Ukrainian border in Korczowa in eastern Poland. The M10 freeway leading to Lviv is supposed to be a continuation of the corridor on the Ukrainian side. The A1 highway constitutes a part of the international E75 north–south road. This corridor connects Norway with Greece and in Poland, when finished, is going to run from Gdańsk through Katowice to the border with the Czech Republic [
40].
Table 1 contains information about the changes in the total length of major roads. The results come from calculating vector data presented on the maps from particular time periods, considering also the margin of 1 km around Gliwice. When comparing the data from the table, one needs to note that they result from the way particular stretches of roads were classified on different maps, which means that some of the roads may have been classified differently on particular maps, their rebuilding or modernization being actually not considered. Nevertheless, the above data juxtaposed with the interactive map present the gist of the changes occurring.
Among the six time periods researched, the greatest increase in major roads took place in the 19th century, reflecting changes occurring as a result of the industrial revolution (and also other factors). Out of all the periods studied, this was the longest one (1828–1880). At that time, the number of major roads increased more than twice. The processes initiated then continued for the following decades, as demonstrated on the map from 1928. A significant change on the Messtischblätter map was that the roads connecting north-west and south-west with south-east became officially recognized as major roads.
Another major change occurred between 1928 and 1960. The maps depicted the state before and after WW2. Generally, the road network became more dense and the increase in length of major roads (by approximately 40%) was connected with rebuilding the area after the war. Moreover, some projects are already being carried out to create new connections, such as constructing a bypass in the northern part to avoid passing through the city center.
The slightest changes are demonstrated on the map from 1960 and 1986. That was the shortest period of all. The web map shows that there was a balance between the number of roads that were constructed and those that disappeared. When calculating the total length of major roads for both map series, it is necessary to consider the issue of censorship and changes in the way particular road stretches were classified.
A highly significant change, the greatest one since the transformation of the 19th century, took place between the last two periods. The construction of freeways significantly impacted the road landscape of the region. New long corridors that run through Gliwice, connecting west with east and north with south, are the most relevant roads. Furthermore, they are completed by the northern bypass constructed in the previous decades, along with several road stretches marked as major, connected with freeways by means of junctions.
In order to collect data on changes occurring in space, historical maps are used and compiled with modern cartographic sources by means of new technologies [
41,
42,
43]. Reconstructing the structure of historical road networks and the interactive way of presenting data help the authors develop the methodologies for retrospective studies [
44,
45,
46]. The use of maps from many periods makes it possible to follow the course of changes taking place [
47] in terms of the road network and the location of main junctions.
The approach adopted in the research develops previous studies by adding the new way of data presentation. Thematic visualizations in the form of web maps increase the availability of the information about the historical states of spaces. The web map may constitute a research material concerning historical cartography for all intranet users, including non-experts. Users receive the finished product from properly selected (in terms of scale and time periods), obtained and processed archival cartographic sources.
Each stage, from selecting the archival map to converting its content to the interactive form, is connected with work on the methodology of using historical maps in the research [
17,
48,
49] or proper registration [
25,
50,
51]. The access to historical maps (particularly to the editions from the early 19th century) is frequently difficult and the opportunity to publish archival materials is often limited. It is also important to collect data on the circumstances in which individual archival maps were published. Adopting a uniform scale for all the cartographic materials obtained allows one to compare data with similar accuracy, considering the specificity of each series (e.g., the subjectivity of topographers making maps in the first half of the 19th century [
1] or censorship of the maps from the second half of the 20th century) [
20].
According to the cartography cube theory [
52], adding interactivity to spatial data obtained from the scans of archival maps boosts the potential of these maps for retrospective studies (obtaining new knowledge about the structure of the environment in the past). Such actions raise the status of paper maps in the cube from the level of data presentation to the level of research.
4. Conclusions
In comparison with other sources of information about space, such as descriptions, photos, drafts or projects, the map demonstrates a given area in a comprehensive way, along with its elements (objects), spatial layout, and the relations between them. Individual states of the evolving space were presented on the topographic maps used. The juxtaposition between selected objects in the form of vector layers of major roads from the periods following shows that the current area of Gliwice is characterized by the transformation of postindustrial areas’ infrastructure and the change in space use in terms of the construction of thoroughfares and international freeway junctions [
25,
32,
53].
Summing up the way of demonstrating changes that occurred in space in the example of the European freeway A1/A4 junction, the authors corroborate the hypothesis from this article’s introduction. The interactive map that was designed proves that there are opportunities to reconstruct historical states of space, by means of modern multimedia technologies and cartographic sources. Creating interactive thematic web maps that show transformations of selected objects or spatial relations is possible thanks to the use of the approach presented. In addition, there is a wide range of opportunities provided by multimedia cartography in terms of presenting the data collected. The road layers placed on the interactive web map can be extended by adding other available multimedia, such as photos or even videos [
25]. According to the authors, the use of the interactive web map is the most comprehensive method of all technologies used by modern cartography. Thanks to the interactive web map, the user has all the data collected in one place. Transparency in the reception of information is also guaranteed, as layers can be turned on and off. The interactive web map presented by the authors creates no information overflow effect [
54,
55], which may result in its better use [
23]. Spatial data collected from different cartographic publications (from the first half of the 19th century till the present) consider the most significant aspects of changes in the road network of the area analyzed in a detailed and user-friendly way.
The authors considered the use of other archival cartographic publications that could make the research more accurate (by providing shorter time periods and more detailed maps), however, the adopted scale of 1:25,000 and time spans of 30–50 years, resulting from the previously executed query, provided the optimal juxtaposition of sources that allowed the authors to present spatial changes in the network of the most significant roads.
Moreover, the authors note the opportunity to increase the interactivity of the map created by introducing additional information with a mouse over or a click on the layers. In their interactive web map, as an example of placing information in a pop-up, they included information about the source map for each of the road layers. Opportunities to add new functions, linked with the development of the library that was used in creating the interactive web map or resulting from technological advancement (i.e., improvement of the software, updated search engines, implementation of the new W3C standards) were also considered [
10]. Choosing layers independently and comparing them with one another would also be an interesting option. The layer selection order sets the display order, which allows the user to compare older layers to more recent layers and vice versa.
The above method of data presentation optimizes the possibility of interpreting selected thematic issues, among others in the field of transformation of thoroughfares. The aspect of evolution of the main thoroughfares and the interactive way of presenting it may be used for researching other significant places in Europe, e.g., to compare the level of land transformation resulting from the expansion of freeway junctions.


