Article

Population Trends and Urbanization: Simulating Density Effects Using a Local Regression Approach

1
Department of Economic and Social Science, Polytechnic University of Marche, Piazza Martelli 8, I-60121 Ancona, Italy
2
Council for Agricultural Research and Economics (CREA), Viale Santa Margherita 80, I-52100 Arezzo, Italy
3
Department of Economics and Law, University of Macerata, Via Armaroli 43, I-62100 Macerata, Italy
4
Department of Sociology, University of the Aegean, EL-81100 Mytilene, Greece
5
Physical Geography, Trier University, 54286 Trier, Germany
6
Soil Erosion and Degradation Research Group, Department of Geography, University of Valencia, 46010 Valencia, Spain
7
Italian National Institute of Statistics (ISTAT), Piazza G. Marconi 44, I-00144 Rome, Italy
*
Author to whom correspondence should be addressed.
ISPRS Int. J. Geo-Inf. 2020, 9(7), 454; https://0-doi-org.brum.beds.ac.uk/10.3390/ijgi9070454
Submission received: 23 June 2020 / Revised: 15 July 2020 / Accepted: 17 July 2020 / Published: 18 July 2020

Abstract

:
Density-dependent population growth regulates long-term urban expansion and shapes distinctive socioeconomic trends. Despite a marked heterogeneity in the spatial distribution of the resident population, Mediterranean European countries are considered more homogeneous than countries in other European regions as far as settlement structure and processes of metropolitan growth are concerned. However, rising socioeconomic inequalities among Southern European regions reflect latent demographic and territorial transformations that require further investigation. An integrated assessment of the spatio-temporal distribution of resident populations in more than 1000 municipalities (1961–2011) was carried out in this study to characterize density-dependent processes of metropolitan growth in Greece. Using geographically weighted regressions, the results of our study identified distinctive local relationships between population density and growth rates over time. Our results demonstrate that demographic growth rates were non-linearly correlated with other variables, such as population density, with positive and negative impacts during the first (1961–1971) and the last (2001–2011) observation decade, respectively. These findings outline a progressive shift over time from density-dependent processes of population growth, reflecting a rapid development of large metropolitan regions (Athens, Thessaloniki) in the 1960s, to density-dependent processes more evident in medium-sized cities and accessible rural regions in the 2000s. Density-independent processes of population growth have been detected in the intermediate study period (1971–2001). This work finally discusses how a long-term analysis of demographic growth, testing for density-dependent mechanisms, may clarify the intrinsic role of population concentration and dispersion in different phases of the metropolitan cycle in Mediterranean Europe.

1. Introduction

Socioeconomic transformations and demographic transitions stimulate (or slow down) urbanization, leveraging differential mechanisms of metropolitan growth and rural development [1,2,3,4]. In this perspective, population density is a pivotal dimension shaping the demographic growth (or decline) of small to large areas [5,6,7,8,9,10,11]. Being intimately associated, a comprehensive understanding of local development and demographic dynamics requires long-term investigations that may clarify the role of changing socioeconomic contexts [12,13,14,15,16]. Population concentration is one of the most powerful factors of demographic growth, summarizing the impact of different forces that modify economic structures and promote social change [17,18,19]. Human population dynamics are associated with density-independent or density-dependent mechanisms [20]. While the former models hypothesize that population growth rates are dependent on the environment—with density independence being a time-invariant property of a given socioeconomic system—the latter models represent quite common processes in specific local contexts. Such mechanisms are usually analyzed considering changes in density over time and population growth rates together [21,22,23]. Assuming growth rate as a (linear or non-linear) density function, density-dependent mechanisms of population growth show differences considering the impacts, causes, reactions, dynamics and severity of change [24]. On the one hand, positive density dependence delineates a context where demographic expansion is accelerated in contexts with high population density [25]. On the other hand, negative density dependence processes depict a local context where population concentration limits demographic growth [26].
Density-dependent processes regulating population growth are considered as factors at the base of regional development and economic dynamics. When extensively studied in non-human populations [27], density-dependent mechanisms of population increase (or decrease) show complex regulatory processes at the local scale [28,29,30]. Earlier studies demonstrated that the density-dependent regulation of demographic dynamics is a particularly complex process because of the inherent variability and diversity and the multiple impacts of socioeconomic forces and territorial (or normative) constraints affecting settlement density, economic development, social change and demographic dynamics [31,32,33,34].
The aim of this research, considering population growth rate as a density-dependent variable, is to assess the intrinsic linkage between population growth and demographic density. Assuming the complex spatial association between demographic density and population growth [26,35,36] as an intrinsic property of local communities, non-linear mechanisms of population regulation reflect feedback impacts on socioeconomic contexts at large [3,37,38]. For instance, population growth was demonstrated to intensify with urban concentration up to a specific density amount [39], declining at higher levels of population concentration (e.g., displaying the negative externalities of over-crowding). This assumption may reinforce models simulating urban expansion with agglomeration benefits or negative impacts of metropolitan congestion (e.g., [1,7,40]). Focusing on the identification of density-dependent processes of population growth, this study represents a quantitative approach with some novelties in comparison with earlier research. The main difference is in the adoption of a local regression model when analyzing density-dependent (or density-independent) mechanisms of population growth at a sufficiently disaggregated spatial scale. Local regressions provide a unique opportunity to reliably estimate the local-scale relationships of density dependence in demographic dynamics. Thanks to geo-information approaches, passing from global to local spatial approaches may advance regional economics and spatial demography.

Density-Dependent Mechanisms of Population Growth in Europe

In recent decades, population increase and metropolitan expansion became progressively more heterogeneous and less predictable over space, with depopulation being a common trend in advanced economies. This is especially relevant in long-established rural territories. At the same time, detecting the most evident demographic dynamics in specific socioeconomic contexts at low and very low population densities [41,42,43,44], Alados and coworkers [45] compared the empirical evidence from density-independent and density-dependent models in advanced economies of Europe. They found that some areas showed density-dependent (positive) feedback from 1960 to 2010. The interplay between agricultural activities and population size was demonstrated to be at the base of such long-term trends. In the coming future, this may result in a strong modification of population structures and demographic dynamics driven by (i) a latent shrinkage of rural communities and (ii) intense mobility to peri-urban districts, suggesting how population collapses are associated with abrupt territorial transformations [46,47]. As a result, complex socio-ecological systems are molded by strong feedback mechanisms (e.g., [48]) and non-linear interactions among the constituting elements [37], fixing, or even perturbing, their intrinsic regulation [49]. In this regard, the negative impact of population concentration has been widely investigated [50,51,52,53,54]. This impact may lead to settlement dispersion [55], determining (i) population shrinkage (which hardly reverts to demographic stability) or (ii) irreversible processes of extinction in a certain location [55]. Conversely, positive density-dependent effects were regarded as explosive, and therefore unstable and less predictable [41,54]. To date, studies of density-dependent mechanisms in human populations have mainly been carried out over a broad geographical coverage, using low- or intermediate-resolution elementary analysis spatial units (e.g., regions within the same country or continent). Some authors compared local-scale population changes under similar (or specific) socioeconomic contexts and their results depicted key forces delineating latent mechanisms at the base of population growth [56,57,58,59,60]. While being informative at aggregated spatial scales, the local assessment and empirical testing of demographic dynamics along urban–rural gradients are fragmented and partial in many European countries [40,51,57,61]. If we consider urban and rural demographic trends during sufficiently long time windows, these results may illustrate latent socioeconomic transformations better than other indicators [13,62,63,64].
Multiple key drivers were recognized as influencing the spatial distribution of European resident populations from low to high density [65,66,67,68,69]. Metropolitan development has been associated with increasing population densities [70,71,72,73]. At the same time, dispersed urbanization took place in mixed, peri-urban locations [74,75,76,77]. Subsequently, some authors argued that suburbanization has been extensively molded by metropolitan structures and socioeconomic functions at large, leveraging population decreases in large cities and unexpected growth in peripheral areas [6,37,65,78,79,80,81]. Given the pervasiveness of recent metropolitan transformations [57,74,82], density-dependent population growth has been less investigated in Southern Europe than in other European regions, considering urban–rural demographic dynamics in only a few cases [15]. At the same time, the Mediterranean belt is well recognized as a paradigmatic region displaying quite homogeneous demographic trends and compact–dense urban structures [83]. In this regard, the spatial analysis of demographic dynamics may clarify the role of agglomeration factors in settlement consolidation, especially in countries (or regions) experiencing “urbanization without industrialization”, such as Greece, Southern Italy, rural Spain and some parts of Portugal. Despite regional differentiation, these territories showed similar demographic dynamics after World War II [84,85]. In such contexts, new studies developing a spatially explicit analysis of population distribution may better delineate factors affecting local-scale demographic expansion along specific density gradients.
A comparative assessment of five time steps encompassing a range of 50 years could enhance the detection of intrinsic drivers, leveraging a given settlement model and the potential factors that affect territorial imbalances at the same time (e.g., [86,87]). Based on spatially explicit local regressions, the results of the empirical analysis identified districts with positive (or negative) density-dependent mechanisms of population growth. These results contribute to the inference of density levels that could evidence a turnaround from a positive to a negative (or vice versa) influence in areas with high (or low) settlement concentrations [54,86,87]. The spatially explicit approach implemented in this study—based on geographically weighted regression models—evaluates the impact of both urban concentration and rural depopulation in Greece, a country that had differentiated population trends in the decades immediately following World War II [88,89,90]. With homogeneous databases and statistical data at a sufficiently disaggregated spatial scale being scarce or partial, and often needing standardization, validation and control checks [64,67,91], a within-region test for density-dependent population growth in Southern European countries would significantly benefit from classifications referring to the Nomenclature of Territorial Statistical Units system (EUROSTAT). More specifically, from official data collected at the spatial level of municipalities, EUROSTAT published long-term, stabilized demographic data derived from national censuses of populations and households (1961–2011). This allows a comparative analysis of demographic dynamics to investigate the latent effect of density-dependent mechanisms of population expansion (or decline). We consider that local-scale population growth rates are associated with some intrinsic properties of local systems that include urban concentration or rural depopulation. In our study, intensity and spatial trends in both urban concentration and rural depopulation will be considered as a result of local-scale population trends, whose knowledge would help to inform strategies of regional management in adapting to multifaceted local contexts [8,66,92,93,94,95].

2. Methodology

2.1. Study Area

Greece extends across 131,957 km2 in Southeastern Europe, with 13 administrative regions, nearly 50 prefectures (Figure 1) and more than 1000 municipalities.
Long-term population growth in this country has been particularly heterogeneous over time (Figure 2), rising slowly between 1821 and 1907, and increasing more rapidly between 1907 and 1951, mostly because of refugee immigration from Asia Minor and high fertility. Since 1951, the resident population grew in a rather linear fashion, passing from 8 million inhabitants in 1951 to nearly 11 million inhabitants in 2001, and declining slowly in the subsequent two decades. Based on this evidence, the present study evaluates demographic trends in Greece during a period characterized by continuous and mostly linear population growth. Despite some regional differences, post-war population trends were exemplifications of demographic dynamics typical of Southern Europe. While displaying heterogeneous demographic trends at the regional and local scales, overall population density in Greece was rather low (less than 100 inhabitants/km2), with the highest value observed in 2000.
The population is concentrated in a few urban areas (Table 1). Considering a time window between 1955 and 2019, positive population growth rates were observed continuously over the period 1955–2000. The urban population amounted to 54% of the total population in 1955, growing to up to 84% in 2019. Similar to other Mediterranean countries, population aging was likely the most relevant characteristic of the post-war demographic transition in Greece: the median age of the population increased from 27 to 44 years between 1955 and 2019. Conversely, the total fertility rate has halved over less than 50 years (1955–2000), recovering slightly in 2010 (1.42) and decreasing to 1.34 in 2019.
Greek urban settlements are mostly polarized and divided, with an intrinsically dense metropolitan system centered on the capital city region (Athens, Attica), hosting more than 30% of the total population residing in the country. Municipal boundaries and the spatial location of settlements are illustrated in Figure 3, outlining an asymmetric distribution of the population in 1961. A slightly more balanced settlement structure was observed in 2011. Maps of the annual rate of population increase (%) for selected, representative decades illustrate three diverging settlement models: (i) a centralized population increase concentrated in Athens (Attica) and Thessaloniki (Central Macedonia) between 1961 and 1971, (ii) a more diffused population growth over the whole country, especially in highly dynamic rural areas between 1981 and 1991 and (iii) a decentralized growth of medium-sized cities, coastal districts and more accessible rural districts.

2.2. Data Sources and Demographic Variables

This study adopted local administrative units (LAUs) as the elementary spatial domain of the Nomenclature of Territorial Statistical Units (NUTS). They are mostly homogeneous local communities from the socioeconomic and territorial perspective. Being administered by homogeneous local authorities, LAUs play a role in official statistics thanks to the extensive availability of census data with a regular acquisition/publication schedule (10 years) and relevance for both positive approaches and normative analysis/implementation. In this line of thinking, EUROSTAT, the Statistical Office of the European Commission, provided a homogeneous set of spatial units and boundaries for the country, and a comprehensive sample of demographic data obtained from census sources for every LAU-1 unit (1961, 1971, 1981, 1991, 2001 and 2011). The present study made extensive use of such a data source for Greece, following the specific indications provided by EUROSTAT (https://ec.europa.eu/eurostat/web/nuts/local-administrative-units#:~:text=The%20spatial%20level%20of%20detail,Turkey%20have%20LAU%2D1%20coverage).
Based on earlier research [3,9,10,24,45], the present study was grounded in a spatially explicit analysis of two variables (demographic density and the annual rate of population growth) at the spatial level mentioned above. Population density (resident population per municipal area in inhabitants/km2) and per cent annual rate of population growth at five different intervals (1961–1971, 1971–1981, 1981–1991, 1991–2001, 2001–2011) were estimated for each spatial unit. Data were processed and analyzed with spreadsheets and mapped in ArcMap release 10.5 (ESRI, Redlands, CA, USA) using a shapefile of Greek municipalities. Spatial autocorrelation analyses of spatial dependence and heterogeneity, based on global and local Moran’s coefficients and a local regression approach (geographically weighted regression) controlling for spatial structures separately for each time point, were adopted in this study and are described extensively in the following section.

2.3. Statistical Analysis

Considering the above-mentioned municipal-level data, (global and local), Moran’s spatial autocorrelation coefficients (z-scores of the Moran’s I) were calculated for population density at the beginning (1961) and the end (2011) of the study period. Global Moran’s spatial autocorrelation coefficients of population growth rates were tested for significance at p < 0.001 separately for five time intervals (1961–1971, 1971–1981, 1981–1991, 1991–2001, 2001–2011). A significant global Moran’s coefficient at a given bandwidth indicated spatial dependence at the country scale [96]. A comprehensive analysis of variations in the global Moran’s coefficients for five bandwidths (10, 25, 50, 100 and 150 km) quantified spatial interactions in the studied variable across a broad scale range, from local (10 km) to regional (150 km).
To study spatial structures of population distribution (e.g., clustering or random location), Moran’s local coefficients of spatial autocorrelation were also computed for the same time schedule for each elementary analysis unit (municipalities) and were tested for significance at p < 0.001. Significant coefficients indicate spatial clustering of the studied variable [80]. Four spatial autocorrelation regimes were classified for each time point based on significant Moran’s z-scores: clusters of municipalities with homogeneous population dynamics and (i) positive spatial auto-correlations (High–High clusters, “HH”) or (ii) negative spatial auto-correlations (Low–Low clusters, “LL”), and clusters of municipalities with heterogeneous population dynamics forming transitional spatial gradients from (iii) high to low rates of population growth (High–Low clusters, “HL”) and (iv) from low to high rates of population growth (Low–High clusters, “LH”).
The local-scale relationship between population density at time t (dependent variable) and population growth rate between t and t+x time points (independent variable) was analyzed separately for five time windows using (i) three correlation coefficients that separately explore a linear linkage (Pearson moment-product) and non-linear associations (Spearman rank and Kendall co-graduation) and (ii) three global, aspatial regression models testing (a) a linear structure reflecting the effect of population density on demographic trends along the urban gradient, (b) a quadratic shape considering a divergent (positive or negative) effect of urban concentration on growth rates depending on a given density threshold and (c) a cubic equation considering a divergent impact of settlement concentration on growth rates depending on two thresholds. These forms were evaluated as the best-fit estimation of equations (a–c) adopting empirical data with an adjusted R2. Regressions were then separately applied for each study period. The population density was log-transformed before analysis.
The results of the aspatial models were refined, adopting a geographically weighted regression (GWR) strategy controlling for population distribution over space. According to Fotheringham et al. [96], GWR identifies local-scale variability in population dynamics, assessing the contribution of demographic density to total population growth at a municipal scale [96]. By implementing a kernel filter to estimate local regression coefficients, the GWR model can be modeled, as follows, at each point s = 1, …, n:
Y(s) = X(s)B(s) + e(s)
where Y(s) represents the dependent variable at each location s (population growth rate) and X(s) indicates the independent variables at location s (population density). B(s) is the column vector of regression coefficients at each location s. Finally, e(s) identifies the model residual at each location s. Regression coefficients work as a function of s, covering the whole study area [e.g., 50].
Global adjusted R2 values were used to compare the GWR performances with those of aspatial models. Local adjusted R2 (municipal level) values were used to estimate stability over time, internal coherence and the reliability of the GWR model [97]. While it is an appropriate methodology for controlling for spatial dependence and heterogeneity [98], the limits of the use of GWR are intrinsically linked with the difficult interpretation of extreme regression coefficients, and how to draw conclusions based on restricted sample sizes. The extensive sample size in our case justifies the use of such a methodology, which remains one of the most widely adopted in social science. The results of the GWR provide, for each municipality, an estimation of the local connections between the dependent variable and the predictor, evidencing (i) a local impact of density on population growth (local regression slope and intercept), (ii) the model’s local uncertainty (regression residual) and (iii) the model’s fit (local adjusted R2). The results of the GWR are illustrated through maps representing the spatial distribution of regression coefficients (i–iii).

3. Results

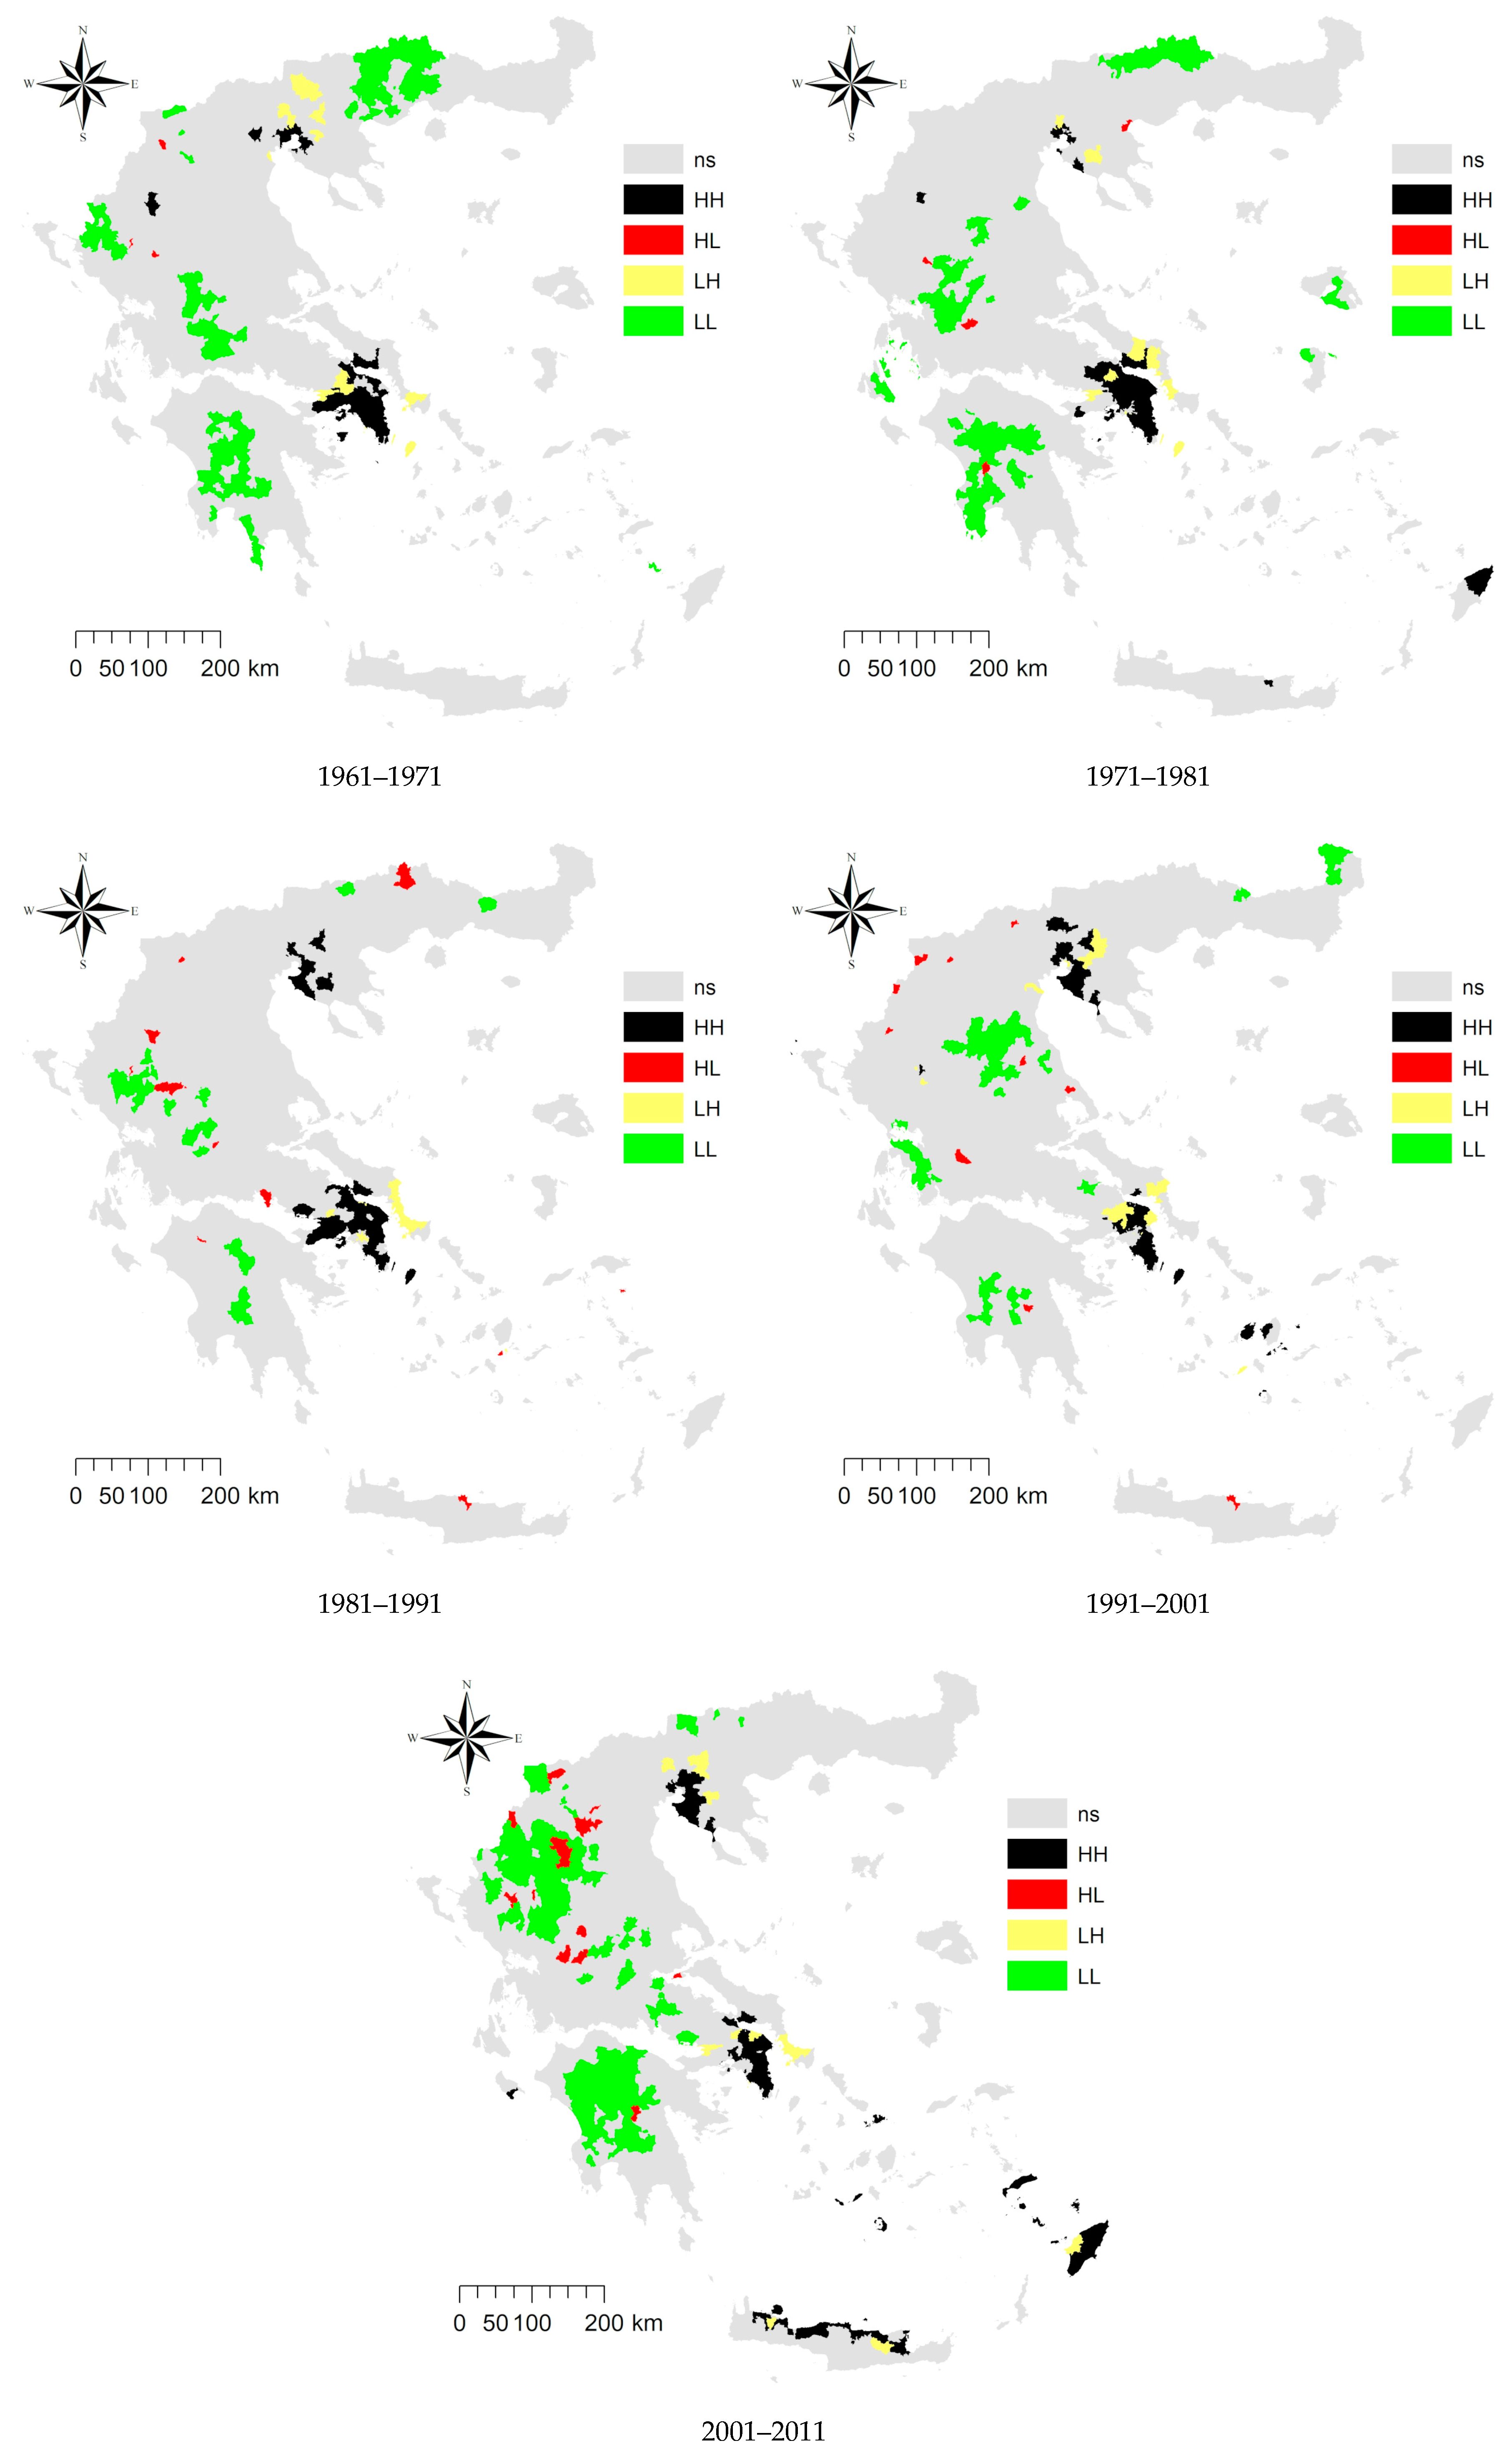
3.1. Analysis of Spatial Auto-Correlation Regimes of Population Growth

Moran’s global coefficients of spatial autocorrelations provide an overview of the territorial structure of population growth in the study area (Table 2). The empirical results at multiple bandwidths outline spatial interactions ranging from the local scale (10 km) to the regional scale (150 km) and indicate how Moran’s coefficients are particularly high and statistically significant for population density (Figure 4). This indicates the persistence of a spatial structure with intense (local and regional) interactions that reflect the urban–rural gradient in Greece, with polarization in high-density areas (Athens and Thessaloniki) and low-density rural districts. The global autocorrelation coefficients reach the highest value for intermediate bandwidths (50 km). At a local scale (10 km bandwidth), the global spatial autocorrelation coefficients were found to be particularly high in 1961 and 2011, while a completely different pattern was observed at broader geographical scales.
Population growth rates were also asymmetrically distributed over the country. The highest global Moran’s coefficients were observed in the initial decade (1961–1971), decreasing progressively over time, and reaching the minimum values in the last two decades (1991–2001 and 2001–2011). These results indicate that the spatial structure of the investigated variable was more clustered in a context of accelerated population growth (1961–1971) and more fragmented and heterogeneous—without significant spatial patterns—when the population was stable or declining slightly (2001–2011). Except for the last investigated decade, the highest global Moran’s coefficients were observed at an intermediate geographical scale (50 km bandwidth).
The spatial distribution of the local Moran’s coefficients of spatial autocorrelation in population growth rates (Figure 5) confirms the importance of the urban–rural gradient in Greece, with modest changes in both intensity and spatial direction between 1961 and 2011. The demographic consolidation of the two HH clusters (Athens and Thessaloniki) and the population expansion of some intermediate areas characteristic of peri-urban belts (LH cluster) surrounding both cities were observed during the same time interval. A low-density rural area classified as an LL cluster expanded during the study period to include the internal districts of Northern Greece (on the border with Bulgaria), Central Greece and Peloponnese. Intermediate areas (HL clusters) also expanded in Central Greece and Peloponnese, encompassing fast-growing, small-sized cities in the last decades. Our analysis highlights a highly polarized and dynamic demographic context in Greece. In general, urban–rural disparities were evident in all decades, with the inherent divide in large cities and marginal rural regions. The HH cluster (high population density in urban areas) encompassed a greater number of peri-urban municipalities in the last decades, involving economically dynamic rural districts outside Attica and Central Macedonia, which include coastal areas and (big and small) islands, such as Crete, Cyclades and Dodecanese. This implies that the spatial patterns of demographic densification became progressively more complex, becoming less dependent on population density and increasingly influenced by other socioeconomic forces characteristic of diversified local contexts. Conversely, the LL cluster (low population density in rural areas)—initially associated with the internal areas of central Greece and Peloponnese—decreased in size, moving towards mountainous areas characterized by intense emigration and violent depopulation.

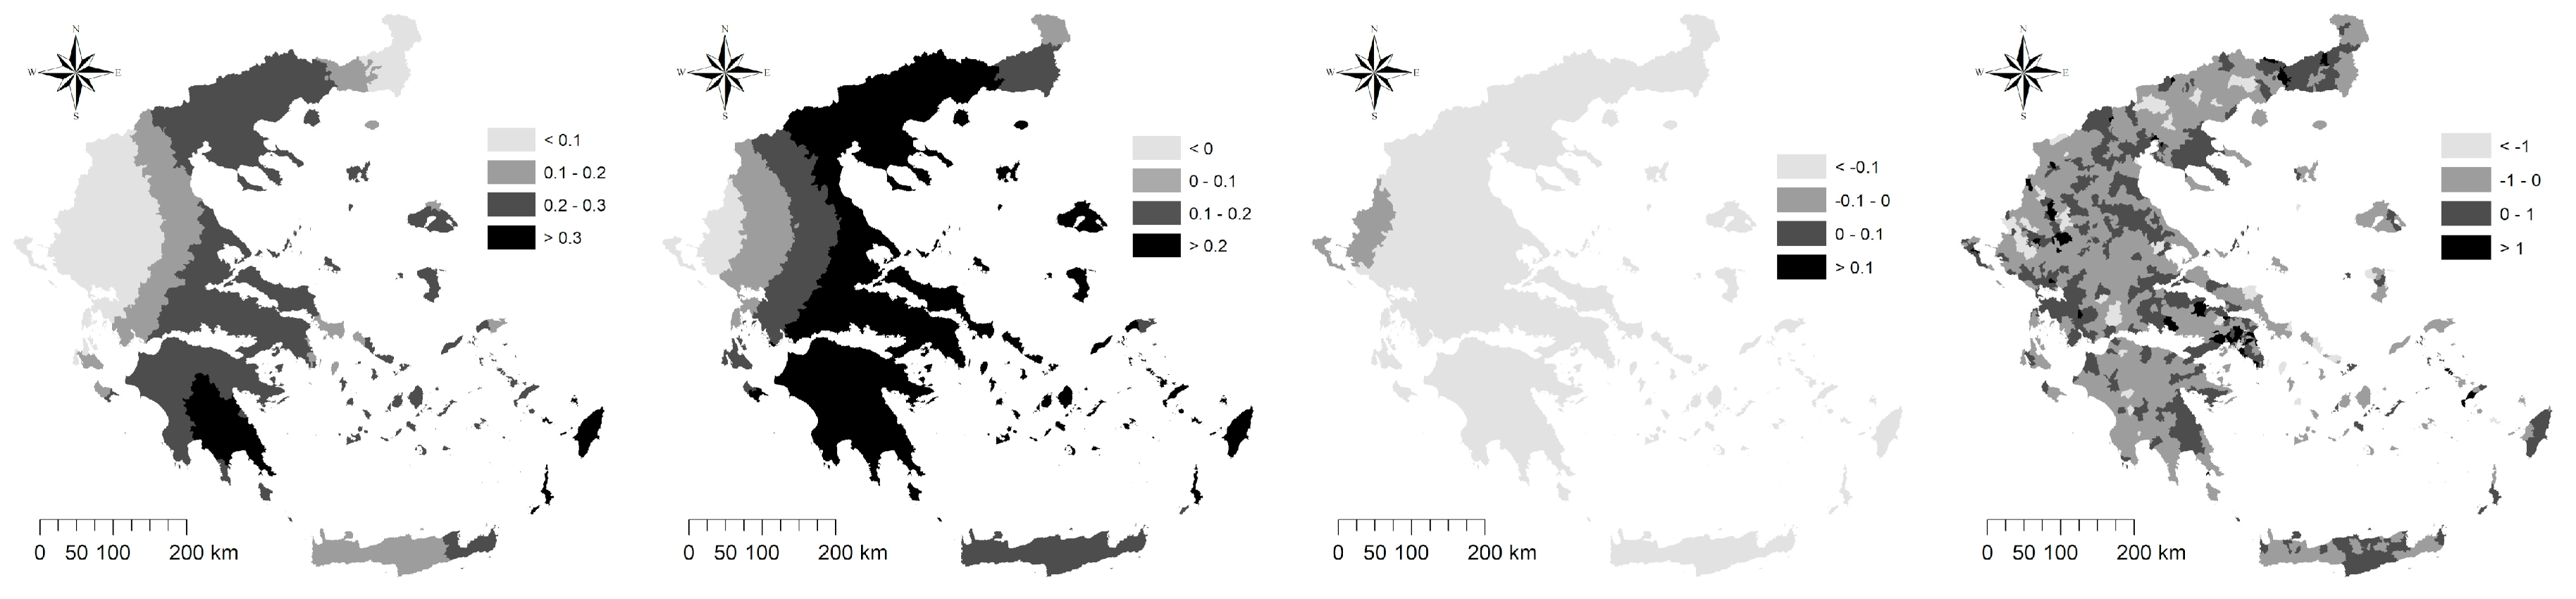
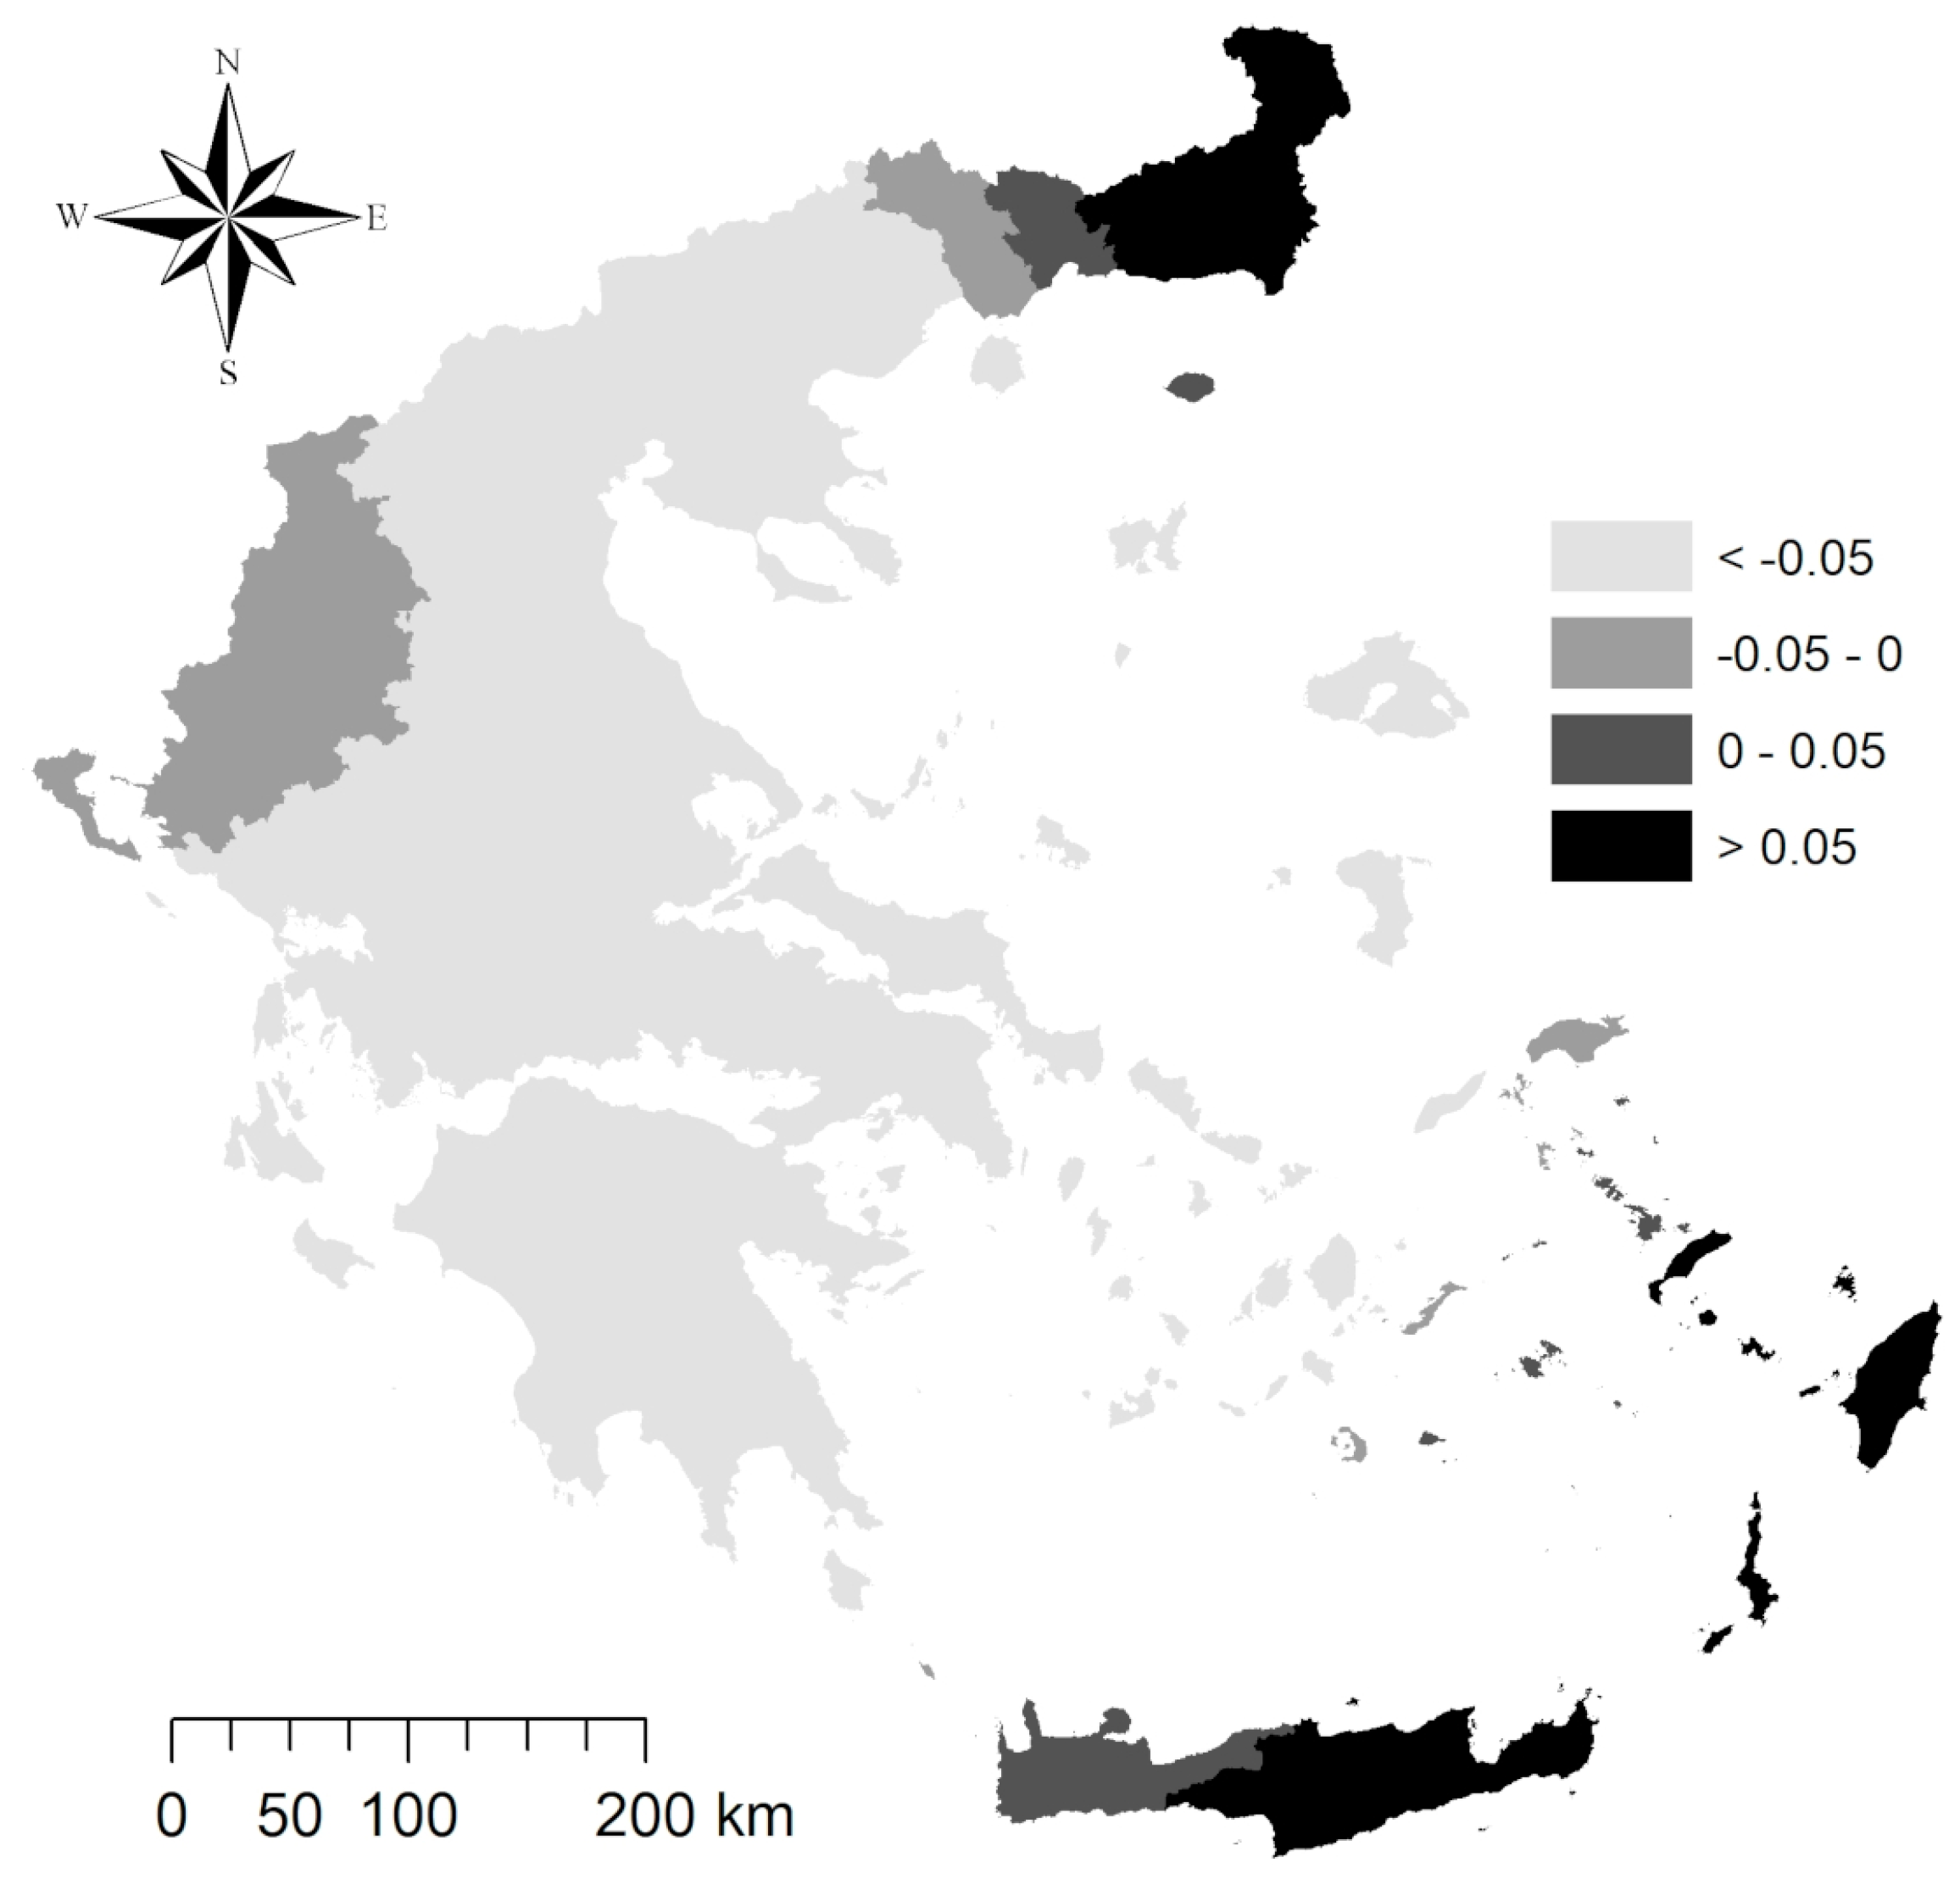
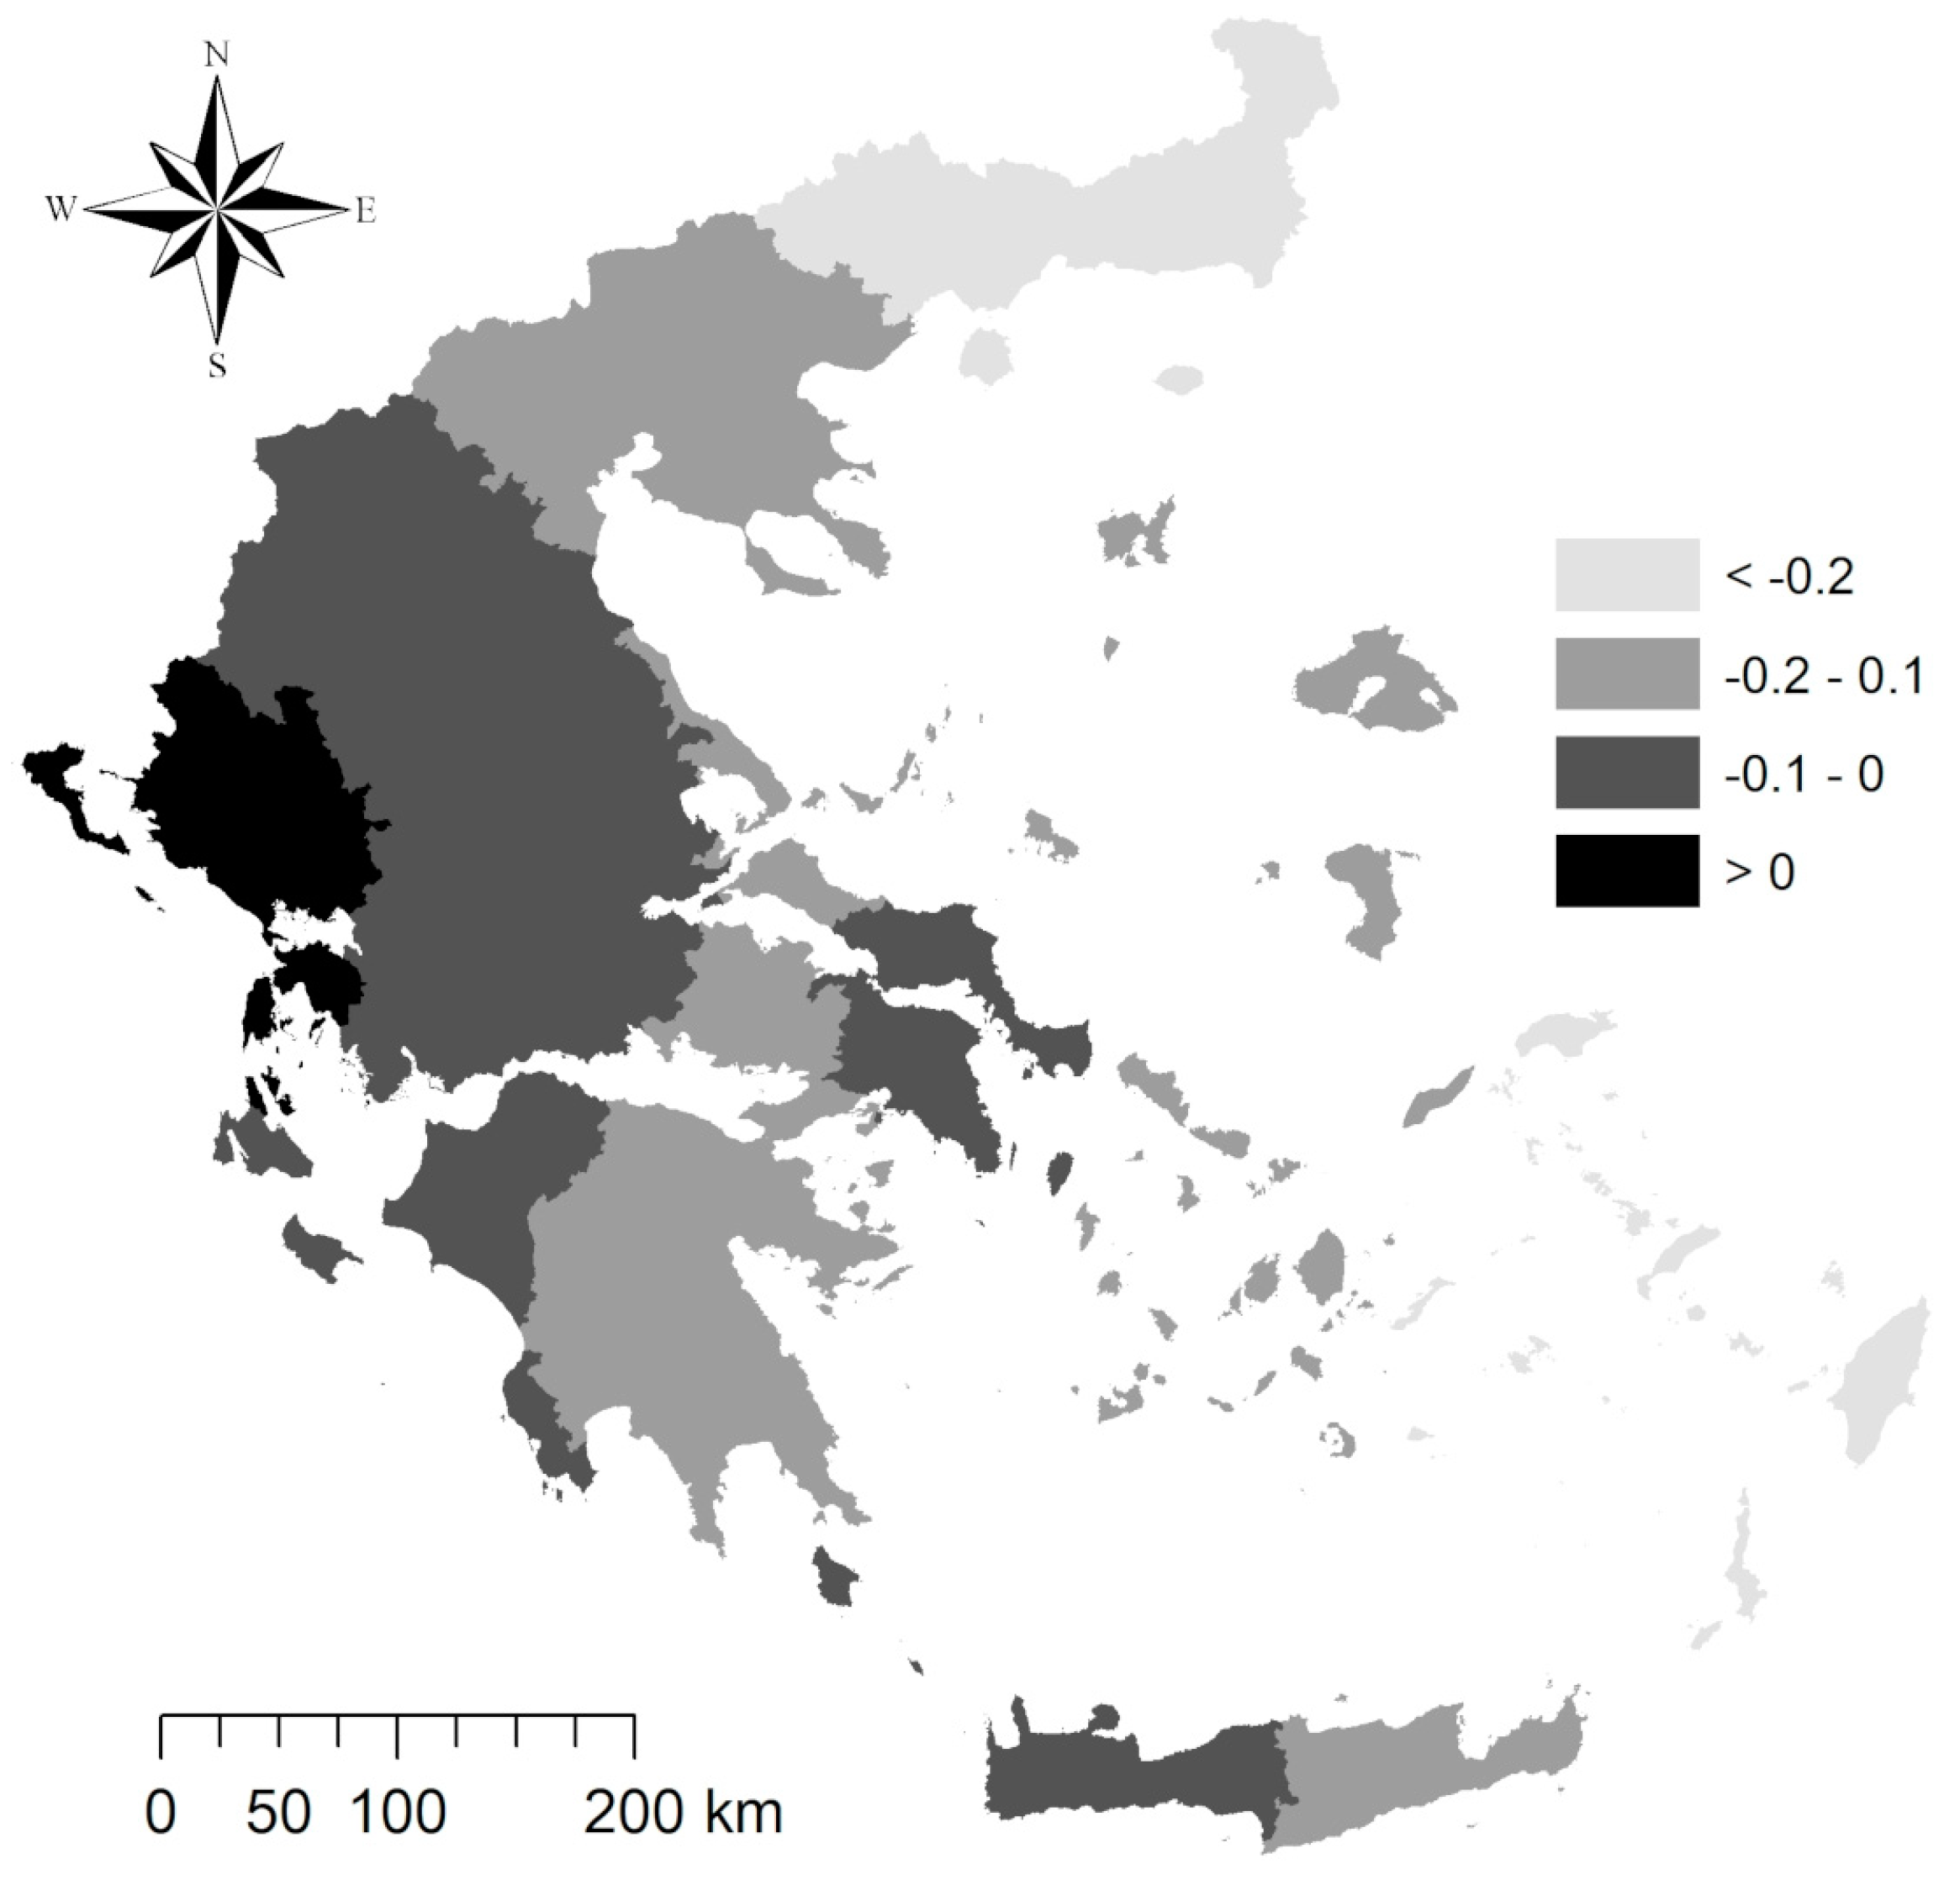
3.2. Local Regression Analysis

The results of both the correlation analysis and regression models (Table 3) are supportive of density-dependent population growth in Greece, especially in the earlier and later decades of the investigation. The model’s goodness of fit reflects the consolidation of non-linear and more complex spatial relationships over time. The Pearson linear correlation coefficients were higher in the initial decades of the study and decreased in the following time period. The Spearman correlation coefficients followed the reverse pattern, with the highest values observed in the most recent decade. This suggests the importance of non-linear relationships in the study area and outlines how settlement concentration below (or above) specific density thresholds impacts the spatial distribution of population growth rates in a highly variable fashion. The results of the aspatial regression models seem to confirm this assumption. The highest adjusted R2 coefficients were observed for cubic models in the initial and final decades of the investigation (1961–1971 and 2001–2011). GWR models displayed adjusted R2 coefficients systematically higher than all the other analyses run in this study, confirming the appropriateness of a spatially explicit analysis considering the geographical structure of the dependent variable and the predictor together. These results justify the use of local regression techniques in the analysis of demographic processes at disaggregated spatial scales.
The results of the GWR models diverged over time (Figure 6). For the first decade of the study (1961–1971), the best performances of the local regression model were observed along the Aegean side of Greece; the reverse pattern was found along the Ionian side. The east–west gradient also impacted the regression coefficient of the density variable, being systematically higher on the Aegean side (this includes the Thessaloniki–Athens axis and many other medium-sized cities, e.g., Iraklio, Volos, Larissa, Kavala). The intercept of the model was negative almost everywhere in Greece. The standardized residuals of the local regression model were quite heterogeneous over space, with values higher than the average in municipalities surrounding the Greater Athens area.
For the second decade of the study (1971–1981), GWR estimated a more intense density–growth relationship in Northern Greece and the Aegean coastal region, from Macedonia to Peloponnese, with the exclusion of Attica, the administrative region of Athens. Local regression coefficients were found to be high and positive in the most marginal regions of Northeastern Greece, but also in the Dodecanese archipelago and in the eastern part of Crete. The values of the intercept coefficient were found to be almost negative. Moderately positive values were observed in Northwestern Greece and in a small part of Attica. Standardized residuals were distributed heterogeneously across the country area, with systematically positive values in the peri-urban area of Athens, in Western Greece and Thrace.
The GWR model for the decade 1981–1991 provided very low local R2 coefficients across the whole of Greece. Consequently, local regression coefficients showed values close to 0 (both for the model’s slope and intercept); standardized residuals were distributed almost randomly. The GWR model for the 1991–2001 decade displayed moderately low local R2 coefficients across the whole country, except for Northeastern Greece. Consequently, local regression coefficients showed values systematically close to 0 for both coefficients. Slopes >0.1 were observed in Attica and Northwestern Greece. In the last decade of the study (2001–2011), the GWR model showed a greater goodness of fit (local adjusted R2) in Northern Greece and the Peloponnese region and a lesser fit in Attica, Thessaloniki, the islands of Cyclades and Dodecanese and Central Greece. The highest slope coefficients were observed in Northern Greece. Intercept coefficients were negative all over the country. As expected, the model’s residuals were distributed heterogeneously over space.
By comparing the value of the slope coefficient in each municipality of Greece over sequential decades throughout the study period (Figure 7), a generalized increase in local regression slopes—which reflects a greater impact of density on population growth—was observed between 1961 and 1981 in Northeastern Greece (Trace) and the Aegean islands (mainly Dodecanese and Eastern Crete).
Considering the subsequent time interval, increasing local regression slopes were observed exclusively in the Ionian side of Central–Western Greece, in both coastal and internal contexts characterized by low population density and modest accessibility to Athens (Figure 8).
The highest growth in local regression slopes was observed in Northeastern Greece (Thrace and Eastern Macedonia) in the time interval between 1981 and 2001, the lowest being along the Ionian side of Western Greece (Figure 9).
Finally, in the last two decades, the largest slope increase at the local scale was observed in Central and Western Greece, as well as the eastern area of Crete and the Dodecanese archipelago (Figure 10). For each decade of study, correlations between population density in the first year of each decade and the respective local GWR slope coefficient for each municipality of Greece were investigated pairwise using Pearson moment-product coefficients. The analysis indicates that local slope coefficients of the respective regression models increased with population density in 1961–1971 (r = 0.162, p < 0.05) and decreased in 2001–2011 (r = −0.295, p < 0.05), but were statistically uncorrelated in the case of the three intermediate decades.

4. Discussion

Demographic dynamics were hypothesized to leverage spatial divides in socioeconomic local systems with distinctive patterns of change over time [53,91,99,100]. By considering mechanisms underlying population concentration and shrinkage together, our study gives new insights that may clarify the role demographic trends play in both urban and rural contexts. Confirming empirical evidence from earlier studies [24], the empirical results of this study illustrate local mechanisms of population increase based on density [24]. In this way, our study illustrates the importance of a comprehensive investigation of sequential urban phases integrated with a refined analysis of population dynamics in rural districts. Results of this analysis suggest how convergence in population growth and urban density may lead to more cohesive settlements. At the same time, divergences in population growth and density are demonstrated to consolidate economic polarization and territorial divides between (morphologically dense) dynamic areas and (peripheral) depopulated districts.
Considering data at the municipal scale, a local regression analysis of long-term demographic trends was appropriate to delineate density-dependent and density-independent mechanisms of population growth [37,38,87]. In earlier studies [3,40,99,100], urban concentration was taken as the main factor lowering population increase [1,7,101,102,103]. However, a lack of information on the positive (or negative) regulation of population growth persists at low densities [41]. In this regard, very low densities and continuous population decline at the local scale are symptoms of land abandonment, depopulation and the demographic shrinkage of rural districts [42,43,85]. In Europe, demographic changes in recent decades have consolidated socio-spatial disparities and demographic divides [11,72,97,98,102]. Taken as a paradigmatic region with mixed population dynamics at larger scales and peculiar metropolitan systems at local scales, heterogeneous geographies of population growth in Southern Europe may reveal characteristic demographic patterns. These patterns basically reflect radio-centric settlement expansion and population concentration in economically dynamic and more accessible locations. As a result, metropolitan regions in Mediterranean Europe have experienced sequential cycles of urbanization–suburbanization, enhanced by a transition toward low fertility, aging, migratory movements and the accelerated (mostly negative) impacts of economic downturns [49,60,77].
By introducing a spatially explicit assessment of population dynamics over a sufficiently long time period, our study implements a geographically weighted regression to investigate (and model) population distribution and demographic dynamics in Greece. The methodology provides a local estimation of the importance of density-dependent processes of population increase for each municipality along a gradient spanning from compact–dense cities to low-density rural districts. By investigating local-scale settlement patterns in Greek municipalities, the spatial autocorrelation analysis delineated the progressive consolidation of a metropolitan hierarchy grounded in large cities such as Athens and Thessaloniki. Something similar was noted in other Mediterranean countries such as Spain or Italy [84]. Although covering a shorter time interval (1991–2011), a previous study in Spain [104] successfully adopted a GWR to identify spatially differentiated population growth factors in a context of increasing spatial heterogeneity. In this regard, Gutiérrez-Posada et al. [104] stated that (p. 211) “essential factors in urban and regional economics such as size (initial population) or distance (either to the big cities or to the coast) can have different effects on population growth across both space and time, corresponding to the global estimated effects for some areas but diverging from these in others. Using GWR estimation procedures, we can identify changes in the sign or the intensity of a factor’s effect across space, such that some factors could enhance population growth in one place but reduce it in another”.
Based on these premises, GWR models seem to be particularly appropriate to test for density-dependent or density-independent processes of population growth. To our knowledge, the present study adopts GWR for the first time in the literature to ascertain density-dependent mechanisms of population growth (and discriminate them from density-independent processes). For Greece, the results of the local regression models run in the present study indicate that density-dependent mechanisms of population growth were most frequently observed in the 1960s and 2000s; density-independent processes regulated population dynamics in the intermediate decades (1971–2001). Density-dependent processes of population growth in those decades have been associated with high (or increasing) fertility levels, as observed in 1961–1971 and 2001–2011, respectively. The reverse pattern was observed in the three intermediate decades, with density-independent processes of population growth associated with declining fertility rates, reaching the lowest low (total fertility rate = 1.2) at the beginning of the 1990s. Positive local density–growth relationships have been observed in urban locations between 1961 and 1971, and rural locations between 2001 and 2011. The processes of growth observed in hyper-compact and dense cities were recorded in the last decades of the study (2001–2011), especially in Greater Athens and Thessaloniki.
Our results finally document spatial and temporal peculiarities in density-dependent mechanisms of population increase in some Greek regions and local districts. The results of the GWR distinguished consolidated urban contexts (Athens, Piraeus or Thessaloniki) from dynamic, rural municipalities growing under the deep pressure of suburbanization, and characterized by a residual potential for building. Stability over time was verified using a locally adjusted R2, an index of the model’s fit to empirical data. Analysis of this metric outlined (i) a phase of intense population concentration in central locations driven by internal migration from rural areas, high fertility and relatively low mortality (1961–1971) and (ii) the demographic recovery of medium-sized cities and more accessible, dynamic rural areas (2001–2011). The latter process was recorded in a context of the slow decline of central cities because of decreasing international migration and negative vital balances [105,106]. Based on these premises, we conclude that the positive relationship between population growth rates and density at intermediate concentration levels confirms the positive contribution of agglomeration forces to metropolitan trends [98,107,108,109]. Agglomeration effects on population increase were rather weak in rural districts, with zero (1971–2001) or even negative (1961–1971; 2001–2011) rates. This suggests how rural shrinkage frequently underlies more volatile demographic dynamics and indicates the urgent need for more effective developmental policies against depopulation in hyper-rural districts.

5. Conclusions

While delineating peculiar spatial regimes at the local scale, our study focuses on similarities in long-term spatio-temporal interactions between population concentration and demographic growth. Being observed primarily in metropolitan contexts, social transformations are a key driver of demographic change and economic restructuring. More specifically, we found that (i) consecutive waves of growth and shrinkage of central cities, (ii) suburban expansion and (iii) the progressive depopulation of marginal rural areas have characterized long-term local development in Greece. These sequential phases consolidated non-linear density-dependent mechanisms of population growth. Future research should integrate the results of global and local statistical approaches to delineate more sophisticated approaches to spatial demography. High-resolution, geo-referenced databases collecting up-to-date information over long time windows represent a prerequisite of this kind of analysis. The methodology illustrated in our study provides an improved knowledge of density-dependent structures of population increase (or decrease), committed to rethinking territorial strategies and social policies adapting to increasingly heterogeneous local dynamics.

Author Contributions

Conceptualization, Jesús Rodrigo-Comino and Federico Benassi; methodology, Rosario Turco and Gloria Polinesi; software, Gloria Polinesi and Maria Cristina Recchioni; validation, Cristina Recchioni and Kostas Rontos; formal analysis, Gloria Polinesi and Maria Cristina Recchioni; investigation, Maria Cristina Recchioni and Kostas Rontos; resources, Jesús Rodrigo-Comino and Federico Benassi; data curation, Gloria Polinesi and Federico Benassi; writing—original draft preparation, Luca Salvati and Federico Benassi; writing—review and editing, Maria Cristina Recchioni and Kostas Rontos; visualization, Rosario Turco and Jesús Rodrigo-Comino; supervision, Kostas Rontos and Jesús Rodrigo-Comino; project administration, Federico Benassi; funding acquisition, Maria Cristina Recchioni and Rosario Turco. All authors have read and agreed to the published version of the manuscript.

Funding

This research received no external funding.

Conflicts of Interest

The authors declare no conflict of interest.

References

  1. Combes, P.P.; Duranton, G.; Overman, H.G. Agglomeration and the adjustment of the spatial economy. Pap. Reg. Sci. 2005, 84, 311–349. [Google Scholar] [CrossRef]
  2. Gardiner, B.; Martin, R.; Tyler, P. Does spatial agglomeration increase national growth? Some evidence from Europe. J. Econ. Geogr. 2011, 11, 979–1006. [Google Scholar] [CrossRef] [Green Version]
  3. Haase, A.; Bernt, M.; Großmann, K.; Mykhnenko, V.; Rink, D. Varieties of shrinkage in European cities. Eur. Urban Reg. Stud. 2016, 23, 86–102. [Google Scholar] [CrossRef]
  4. Tóth, G.; Nagy, Z. The world’s economic centre of gravity. Reg. Stat. 2016, 6, 177–180. [Google Scholar]
  5. Petrakos, G.C. Urban Concentration and Agglomeration Economies: Re-examining the Relationship. Urban Stud. 1992. [Google Scholar] [CrossRef]
  6. Turok, I. Cities, Regions and Competitiveness. Reg. Stud. 2004, 38, 1069–1083. [Google Scholar] [CrossRef]
  7. Combes, P.-P.; Duranton, G.; Gobillon, L. The identification of agglomeration economies. J. Econ. Geogr. 2011, 11, 253–266. [Google Scholar] [CrossRef] [Green Version]
  8. Munafò, M.; Salvati, L.; Zitti, M. Estimating soil sealing rate at national level—Italy as a case study. Ecol. Indic. 2013, 26, 137–140. [Google Scholar] [CrossRef]
  9. Gavalas, V.S.; Rontos, K.; Salvati, L. Who Becomes an Unwed Mother in Greece? Sociodemographic and Geographical Aspects of an Emerging Phenomenon. Popul. Space Place 2014, 20, 250–263. [Google Scholar] [CrossRef]
  10. Morelli, V.G.; Rontos, K.; Salvati, L. Between suburbanisation and re-urbanisation: Revisiting the urban life cycle in a Mediterranean compact city. Urban Res. Pract. 2014, 7, 74–88. [Google Scholar] [CrossRef]
  11. Russo, A.P.; Giné, D.S.; Albert, M.Y.P.; Brandajs, F. Identifying and Classifying Small and Medium Sized Towns in Europe. Tijdschr. Econ. Soc. Geogr. 2017, 108, 380–402. [Google Scholar] [CrossRef]
  12. Melo, P.C.; Graham, D.J.; Noland, R.B. A meta-analysis of estimates of urban agglomeration economies. Reg. Sci. Urban Econ. 2009, 39, 332–342. [Google Scholar] [CrossRef] [Green Version]
  13. Solon, J. Spatial context of urbanization: Landscape pattern and changes between 1950 and 1990 in the Warsaw metropolitan area, Poland. Landsc. Urban Plan. 2009, 93, 250–261. [Google Scholar] [CrossRef] [Green Version]
  14. Salvati, L. Agro-forest landscape and the ‘fringe’ city: A multivariate assessment of land-use changes in a sprawling region and implications for planning. Sci. Total Environ. 2014, 490, 715–723. [Google Scholar] [CrossRef]
  15. Serra, P.; Vera, A.; Tulla, A.F.; Salvati, L. Beyond urban–rural dichotomy: Exploring socioeconomic and land-use processes of change in Spain (1991–2011). Appl. Geogr. 2014, 55, 71–81. [Google Scholar] [CrossRef]
  16. Weilenmann, B.; Seidl, I.; Schulz, T. The socio-economic determinants of urban sprawl between 1980 and 2010 in Switzerland. Landsc. Urban Plan. 2017, 157, 468–482. [Google Scholar] [CrossRef]
  17. Relethford, J.H. Density-dependent migration and human population structure in historical Massachusetts. Am. J. Phys. Anthropol. 1986, 69, 377–388. [Google Scholar] [CrossRef]
  18. Delacroix, J.; Swaminathan, A.; Solt, M.E. Density Dependence Versus Population Dynamics: An Ecological Study of Failings in the California Wine Industry. Am. Sociol. Rev. 1989, 54, 245. [Google Scholar] [CrossRef]
  19. Bauch, C.T. Wealth as a source of density dependence in human population growth. Oikos 2008, 117, 1824–1832. [Google Scholar] [CrossRef] [Green Version]
  20. Lee, R.D. Population dynamics of humans and other animals. Demography 1987, 24, 443–465. [Google Scholar] [CrossRef]
  21. Fowler, C.W. Density Dependence as Related to Life History Strategy. Ecology 1981, 62, 602–610. [Google Scholar] [CrossRef]
  22. Turchin, P. Rarity of density dependence or population regulation with lags? Nature 1990, 344, 660–663. [Google Scholar] [CrossRef]
  23. Hopfenberg, R. Human Carrying Capacity Is Determined by Food Availability. Popul. Environ. 2003, 25, 109–117. [Google Scholar] [CrossRef]
  24. Berryman, A.A. Principles of Population Dynamics and Their Application; Stanley Thornes: Cheltenham, UK, 1999; ISBN 978-0-7487-4015-4. [Google Scholar]
  25. Cohen, J.E. Human population: The next half century. Science 2003, 302, 1172–1175. [Google Scholar] [CrossRef]
  26. Lima, M.; Berryman, A.A. Positive and negative feedbacks in human population dynamics: Future equilibrium or collapse? Oikos 2011, 120, 1301–1310. [Google Scholar] [CrossRef]
  27. Ostffeld, R.S.; Canham, C.D.; Pugh, S.R. Intrinsic density-dependent regulation of vole populations. Nature 1993, 366, 259–261. [Google Scholar] [CrossRef] [PubMed]
  28. Mueller, L.D.; Guo, P.Z.; Ayala, F.J. Density-dependent natural selection and trade-offs in life history traits. Science 1991, 253, 433–435. [Google Scholar] [CrossRef] [PubMed] [Green Version]
  29. Åström, M.; Lundberg, P.; Lundberg, S. Population Dynamics with Sequential Density-Dependencies. Oikos 1996, 75, 174–181. [Google Scholar] [CrossRef]
  30. Waters, J.M.; Fraser, C.I.; Hewitt, G.M. Founder takes all: Density-dependent processes structure biodiversity. Trends Ecol. Evol. 2013, 28, 78–85. [Google Scholar] [CrossRef]
  31. Berry, B.J.L. City Size Distributions and Economic Development. Econ. Dev. Cult. Chang. 1961, 9, 573–588. [Google Scholar]
  32. Sibly, R.M.; Hone, J.; Clutton-Brock, T.H. Population growth rate: Determining factors and role in population regulation. Introduction. Philos. Trans. R. Soc. Lond. B Biol. Sci. 2002, 357, 1149–1151. [Google Scholar] [CrossRef] [Green Version]
  33. Metcalf, C.J.E.; Pavard, S. Why evolutionary biologists should be demographers. Trends Ecol. Evol. 2007, 22, 205–212. [Google Scholar] [CrossRef] [PubMed]
  34. Baker, J.; Ruan, X.; Alcantara, A.; Jones, T.; Watkins, K.; McDaniel, M.; Frey, M.; Crouse, N.; Rajbhandari, R.; Morehouse, J.; et al. Density-dependence in urban housing unit growth: An evaluation of the Pearl-Reed model for predicting housing unit stock at the census tract level. J. Econ. Soc. Meas. 2008, 33, 155–163. [Google Scholar] [CrossRef]
  35. Sibly, R.M.; Hone, J. Population growth rate and its determinants: An overview. Philos. Trans. R. Soc. Lond. B 2002, 357, 1153–1170. [Google Scholar] [CrossRef]
  36. Herrando-Pérez, S.; Delean, S.; Brook, B.W.; Bradshaw, C.J.A. Density dependence: An ecological Tower of Babel. Oecologia 2012, 170, 585–603. [Google Scholar] [CrossRef] [PubMed]
  37. Beeson, P.E.; DeJong, D.N.; Troesken, W. Population growth in U.S. counties, 1840–1990. Reg. Sci. Urban Econ. 2001, 31, 669–699. [Google Scholar] [CrossRef] [Green Version]
  38. Berliant, M.; Wang, P. Dynamic Urban Models: Agglomeration and Growth. In Contributions to Economic Analysis; Elsevier: Amsterdam, The Netherlands, 2004; Volume 266, pp. 531–581. ISBN 978-0-444-51481-3. [Google Scholar]
  39. Parvinen, K.; Dieckmann, U.; Gyllenberg, M.; Metz, J.A.J. Evolution of dispersal in metapopulations with local density dependence and demographic stochasticity. J. Evol. Biol. 2003, 16, 143–153. [Google Scholar] [CrossRef] [Green Version]
  40. Kincses, Á.; Nagy, Z.; Tóth, G. Modelling the spatial structure of Europe. Reg. Stat. 2014, 4, 40–54. [Google Scholar] [CrossRef]
  41. Beale, C.L. Rural depopulation in the united states: Some demographic consequences of agricultural adjustments. Demography 1964, 1, 264–272. [Google Scholar] [CrossRef]
  42. André, M.F. Depopulation, Land-use Change and Landscape Transformation in the French Massif Central. AMBIO 1998, 27, 351–353. [Google Scholar]
  43. Hoggart, K.; Paniagua, A. The restructuring of rural Spain? J. Rural Stud. 2001, 17, 63–80. [Google Scholar] [CrossRef]
  44. van Wissen, L. A Spatial Interpretation of the Density Dependence Model in Industrial Demography. Small Bus. Econ. 2004, 22, 253–264. [Google Scholar] [CrossRef]
  45. Alados, C.L.; Errea, P.; Gartzia, M.; Saiz, H.; Escós, J. Positive and Negative Feedbacks and Free-Scale Pattern Distribution in Rural-Population Dynamics. PLoS ONE 2014, 9, e114561. [Google Scholar] [CrossRef] [PubMed] [Green Version]
  46. Sale, P.F.; Tolimieri, N. Density dependence at some time and place? Oecologia 2000, 124, 166–171. [Google Scholar] [CrossRef]
  47. Hamilton, M.J.; Burger, O.; DeLong, J.P.; Walker, R.S.; Moses, M.E.; Brown, J.H. Population stability, cooperation, and the invasibility of the human species. Proc. Natl. Acad. Sci. USA 2009, 106, 12255–12260. [Google Scholar] [CrossRef] [Green Version]
  48. Caswell, H. Perturbation analysis of nonlinear matrix population models. Demogr. Res. 2008, 18, 59–116. [Google Scholar] [CrossRef] [Green Version]
  49. Salvati, L.; Serra, P. Estimating Rapidity of Change in Complex Urban Systems: A Multidimensional, Local-Scale Approach. Geogr. Anal. 2016, 48, 132–156. [Google Scholar] [CrossRef]
  50. Galor, O.; Weil, D.N. From Malthusian Stagnation to Modern Growth. Am. Econ. Rev. 1999, 89, 150–154. [Google Scholar] [CrossRef] [Green Version]
  51. Bosker, M. Growth, Agglomeration and Convergence: A Space-time Analysis for European Regions. Spat. Econ. Anal. 2007, 2, 91–100. [Google Scholar] [CrossRef]
  52. Baldini, R. The Importance of Population Growth and Regulation in Human Life History Evolution. PLoS ONE 2015, 10, e0119789. [Google Scholar] [CrossRef]
  53. Lemelin, A.; Rubiera-Morollón, F.; Gómez-Loscos, A. Measuring Urban Agglomeration: A Refoundation of the Mean City-Population Size Index. Soc. Indic. Res. 2016, 125, 589–612. [Google Scholar] [CrossRef]
  54. Cohen, J.E. Population growth and earth’s human carrying capacity. Science 1995, 269, 341–346. [Google Scholar] [CrossRef] [PubMed] [Green Version]
  55. Strulik, H. Learning-by-doing, population pressure, and the theory of demographic transition. J. Popul. Econ. 1997, 10, 285–298. [Google Scholar] [CrossRef]
  56. Rodríguez-Pose, A.; Fratesi, U. Between Development and Social Policies: The Impact of European Structural Funds in Objective 1 Regions. Reg. Stud. 2004, 38, 97–113. [Google Scholar] [CrossRef]
  57. Salvati, L.; Carlucci, M. The economic and environmental performances of rural districts in Italy: Are competitiveness and sustainability compatible targets? Ecol. Econ. 2011, 70, 2446–2453. [Google Scholar] [CrossRef]
  58. Zitti, M.; Ferrara, C.; Perini, L.; Carlucci, M.; Salvati, L. Long-Term Urban Growth and Land Use Efficiency in Southern Europe: Implications for Sustainable Land Management. Sustainability 2015, 7, 3359–3385. [Google Scholar] [CrossRef] [Green Version]
  59. Varga, L.; Tóth, G.; Néda, Z. An improved radiation model and its applicability for understanding commuting patterns in Hungary. Reg. Stat. 2016, 6, 27–38. [Google Scholar] [CrossRef] [Green Version]
  60. Zambon, I.; Serra, P.; Sauri, D.; Carlucci, M.; Salvati, L. Beyond the ‘Mediterranean city’: Socioeconomic disparities and urban sprawl in three Southern European cities. Geogr. Ann. Ser. B Hum. Geogr. 2017, 99, 319–337. [Google Scholar] [CrossRef]
  61. Oueslati, W.; Alvanides, S.; Garrod, G. Determinants of urban sprawl in European cities. Urban Stud. 2015. [Google Scholar] [CrossRef] [Green Version]
  62. Partridge, M.D.; Rickman, D.S.; Ali, K.; Olfert, M.R. Do New Economic Geography agglomeration shadows underlie current population dynamics across the urban hierarchy? Pap. Reg. Sci. 2009, 88, 445–466. [Google Scholar] [CrossRef]
  63. Portnov, B.A.; Schwartz, M. Urban Clusters as Growth Foci. J. Reg. Sci. 2009, 49, 287–310. [Google Scholar] [CrossRef]
  64. Salvati, L.; Gemmiti, R.; Perini, L. Land degradation in Mediterranean urban areas: An unexplored link with planning? Area 2012, 44, 317–325. [Google Scholar] [CrossRef]
  65. Kabisch, N.; Haase, D. Diversifying European agglomerations: Evidence of urban population trends for the 21st century. Popul. Space Place 2011, 17, 236–253. [Google Scholar] [CrossRef]
  66. Crescenzi, R.; Luca, D.; Milio, S. The geography of the economic crisis in Europe: National macroeconomic conditions, regional structural factors and short-term economic performance. Camb. J Reg. Econ. Soc. 2016, 9, 13–32. [Google Scholar] [CrossRef]
  67. Lauf, S.; Haase, D.; Kleinschmit, B. The effects of growth, shrinkage, population aging and preference shifts on urban development—A spatial scenario analysis of Berlin, Germany. Land Use Policy 2016, 52, 240–254. [Google Scholar] [CrossRef]
  68. Duvernoy, I.; Zambon, I.; Sateriano, A.; Salvati, L. Pictures from the other side of the fringe: Urban growth and peri-urban agriculture in a post-industrial city (Toulouse, France). J. Rural Stud. 2018, 57, 25–35. [Google Scholar] [CrossRef]
  69. Tapia, F.J.B.; Díez-Minguela, A.; Martinez-Galarraga, J. Tracing the Evolution of Agglomeration Economies: Spain, 1860–1991. J. Econ. Hist. 2018, 78, 81–117. [Google Scholar] [CrossRef] [Green Version]
  70. Kiochos, P.; Rontos, K. Urbanization and Large Cities in the Mediterranean Countries. Arch. Econ. Hist. 1999, 10, 1–2. [Google Scholar]
  71. Mykhnenko, V.; Turok, I. East European Cities—Patterns of Growth and Decline, 1960–2005. Int. Plan. Stud. 2008, 13, 311–342. [Google Scholar] [CrossRef]
  72. Paulsen, K. Geography, policy or market? New evidence on the measurement and causes of sprawl (and infill) in US metropolitan regions. Urban Stud. 2014, 51, 2629–2645. [Google Scholar] [CrossRef]
  73. Rickman, D.S.; Wang, H. US regional population growth 2000–2010: Natural amenities or urban agglomeration? Pap. Reg. Sci. 2017, 96, S69–S90. [Google Scholar] [CrossRef] [Green Version]
  74. Petrakos, G.; Rodríguez-Pose, A.; Rovolis, A. Growth, Integration, and Regional Disparities in the European Union. Environ. Plan. A 2016. [Google Scholar] [CrossRef]
  75. Di Feliciantonio, C.; Salvati, L. ‘Southern’ Alternatives of Urban Diffusion: Investigating Settlement Characteristics and Socio-Economic Patterns in Three Mediterranean Regions. Tijdschr. Econ. Soc. Geogr. 2015, 106, 453–470. [Google Scholar] [CrossRef]
  76. De Rosa, S.; Salvati, L. Beyond a ‘side street story’?Naples from spontaneous centrality to entropic polycentricism, towards a ‘crisis city’. Cities 2016, 51, 74–83. [Google Scholar] [CrossRef]
  77. Cuadrado-Ciuraneta, S.; Durà-Guimerà, A.; Salvati, L. Not only tourism: Unravelling suburbanization, second-home expansion and “rural” sprawl in Catalonia, Spain. Urban Geogr. 2017, 38, 66–89. [Google Scholar] [CrossRef]
  78. Kasanko, M.; Barredo, J.I.; Lavalle, C.; McCormick, N.; Demicheli, L.; Sagris, V.; Brezger, A. Are European cities becoming dispersed? A comparative analysis of 15 European urban areas. Landsc. Urban Plan. 2006, 77, 111–130. [Google Scholar] [CrossRef]
  79. Grekousis, G.; Manetos, P.; Photis, Y.N. Modeling urban evolution using neural networks, fuzzy logic and GIS: The case of the Athens metropolitan area. Cities 2013, 30, 193–203. [Google Scholar] [CrossRef]
  80. Colantoni, A.; Grigoriadis, E.; Sateriano, A.; Venanzoni, G.; Salvati, L. Cities as selective land predators? A lesson on urban growth, deregulated planning and sprawl containment. Sci. Total Environ. 2016, 545–546, 329–339. [Google Scholar] [CrossRef]
  81. Cecchini, M.; Zambon, I.; Pontrandolfi, A.; Turco, R.; Colantoni, A.; Mavrakis, A.; Salvati, L. Urban sprawl and the ‘olive’ landscape: Sustainable land management for ‘crisis’ cities. GeoJournal 2019, 84, 237–255. [Google Scholar] [CrossRef]
  82. Pili, S.; Grigoriadis, E.; Carlucci, M.; Clemente, M.; Salvati, L. Towards sustainable growth? A multi-criteria assessment of (changing) urban forms. Ecol. Indic. 2017, 76, 71–80. [Google Scholar] [CrossRef]
  83. Schneider, A.; Woodcock, C.E. Compact, Dispersed, Fragmented, Extensive? A Comparison of Urban Growth in Twenty-five Global Cities using Remotely Sensed Data, Pattern Metrics and Census Information. Urban Stud. 2008. [Google Scholar] [CrossRef]
  84. Carlucci, M.; Grigoriadis, E.; Rontos, K.; Salvati, L. Revisiting a Hegemonic Concept: Long-term ‘Mediterranean Urbanization’ in Between City Re-polarization and Metropolitan Decline. Appl. Spat. Anal. 2017, 10, 347–362. [Google Scholar] [CrossRef]
  85. Price, D. Carrying Capacity Reconsidered. Popul. Environ. 1999, 21, 5–26. [Google Scholar] [CrossRef]
  86. Lutz, W.; Sanderson, W.; Scherbov, S. The end of world population growth. Nature 2001, 412, 543–545. [Google Scholar] [CrossRef] [Green Version]
  87. Lutz, W.; Qiang, R. Determinants of human population growth. Philos. Trans. R. Soc. Lond. B Biol. Sci. 2002, 357, 1197–1210. [Google Scholar] [CrossRef] [PubMed]
  88. Sato, Y.; Yamamoto, K. Population concentration, urbanization, and demographic transition. J. Urban Econ. 2005, 58, 45–61. [Google Scholar] [CrossRef]
  89. Klasen, S.; Nestmann, T. Population, population density and technological change. J. Popul. Econ. 2006, 19, 611–626. [Google Scholar] [CrossRef] [Green Version]
  90. Frick, S.A.; Rodríguez-Pose, A. Change in urban concentration and economic growth. World Dev. 2018, 105, 156–170. [Google Scholar] [CrossRef]
  91. Ceccarelli, T.; Bajocco, S.; Luigi Perini, L.; Luca Salvati, L. Urbanisation and Land Take of High Quality Agricultural Soils—Exploring Long-term Land Use Changes and Land Capability in Northern Italy. Int. J. Environ. Res. 2014, 8, 181–192. [Google Scholar] [CrossRef]
  92. Giannakourou, G. Transforming spatial planning policy in Mediterranean countries: Europeanization and domestic change. Eur. Plan. Stud. 2005, 13, 319–331. [Google Scholar] [CrossRef]
  93. Halbac-Cotoara-Zamfir, R.; Egidi, G.; Mosconi, E.M.; Poponi, S.; Alhuseen, A.; Salvati, L. Uncovering Demographic Trends and Recent Urban Expansion in Metropolitan Regions: A Paradigmatic Case Study. Sustainability 2020, 12, 3937. [Google Scholar] [CrossRef]
  94. Ciommi, M.; Egidi, G.; Salvia, R.; Cividino, S.; Rontos, K.; Salvati, L. Population Dynamics and Agglomeration Factors: A Non-Linear Threshold Estimation of Density Effects. Sustainability 2020, 12, 2257. [Google Scholar] [CrossRef] [Green Version]
  95. Zambon, I.; Rontos, K.; Serra, P.; Colantoni, A.; Salvati, L. Population Dynamics in Southern Europe: A Local-Scale Analysis, 1961–2011. Sustainability 2019, 11, 109. [Google Scholar] [CrossRef] [Green Version]
  96. Salvati, L.; Sateriano, A.; Grigoriadis, E. Crisis and the city: Profiling urban growth under economic expansion and stagnation. Lett. Spat. Resour. Sci. 2016, 9, 329–342. [Google Scholar] [CrossRef]
  97. Ali, K.; Partridge, M.D.; Olfert, M.R. Can Geographically Weighted Regressions Improve Regional Analysis and Policy Making? Int. Reg. Sci. Rev. 2016. [Google Scholar] [CrossRef]
  98. Rontos, K.; Grigoriadis, E.; Sateriano, A.; Syrmali, M.; Vavouras, I.; Salvati, L. Lost in protest, found in segregation: Divided cities in the light of the 2015 “Oχι” referendum in Greece. City Cult. Soc. 2016, 7, 139–148. [Google Scholar] [CrossRef]
  99. Biasi, R.; Colantoni, A.; Ferrara, C.; Ranalli, F.; Salvati, L. In-between sprawl and fires: Long-term forest expansion and settlement dynamics at the wildland–urban interface in Rome, Italy. Int. J. Sustain. Dev. World Ecol. 2015, 22, 467–475. [Google Scholar] [CrossRef]
  100. Kazemzadeh-Zow, A.; Shahraki, S.Z.; Salvati, L.; Samani, N.N. A spatial zoning approach to calibrate and validate urban growth models. Int. J. Geogr. Inf. Sci. 2017, 31, 763–782. [Google Scholar] [CrossRef]
  101. Grafeneder-Weissteiner, T.; Prettner, K. Agglomeration and demographic change. J. Urban Econ. 2013, 74, 1–11. [Google Scholar] [CrossRef]
  102. Beenstock, M.; Felsenstein, D. Marshallian theory of regional agglomeration. Pap. Reg. Sci. 2010, 89, 155–172. [Google Scholar] [CrossRef]
  103. Boserup, E. Population and Technological Change: A Study of Long-Term Trends; University of Chicago Press: Chicago, IL, USA, 1981; Volume 3. [Google Scholar]
  104. Gutiérrez-Posada, D.; Rubiera-Morollon, F.; Viñuela, A. Heterogeneity in the determinants of population growth at the local level: Analysis of the Spanish case with a GWR approach. Int. Reg. Sci. Rev. 2017, 40, 211–240. [Google Scholar] [CrossRef]
  105. Di Feliciantonio, C.; Salvati, L.; Sarantakou, E.; Rontos, K. Class diversification, economic growth and urban sprawl: Evidences from a pre-crisis European city. Qual. Quant. 2018, 52, 1501–1522. [Google Scholar] [CrossRef]
  106. Salvati, L.; Ciommi, M.T.; Serra, P.; Chelli, F.M. Exploring the spatial structure of housing prices under economic expansion and stagnation: The role of socio-demographic factors in metropolitan Rome, Italy. Land Use Policy 2019, 81, 143–152. [Google Scholar] [CrossRef]
  107. Lamonica, G.R.; Chelli, F.M. The performance of non-survey techniques for constructing sub-territorial input-output tables. Pap. Reg. Sci. 2018, 97, 1169–1202. [Google Scholar] [CrossRef]
  108. Rosti, L.; Chelli, F. Self-employment among Italian female graduates. Educ. Train. 2009, 51, 526–540. [Google Scholar] [CrossRef] [Green Version]
  109. Chelli, F.; Rosti, L. Age and gender differences in Italian workers’ mobility. Int. J. Manpow. 2002, 23, 313–325. [Google Scholar] [CrossRef]
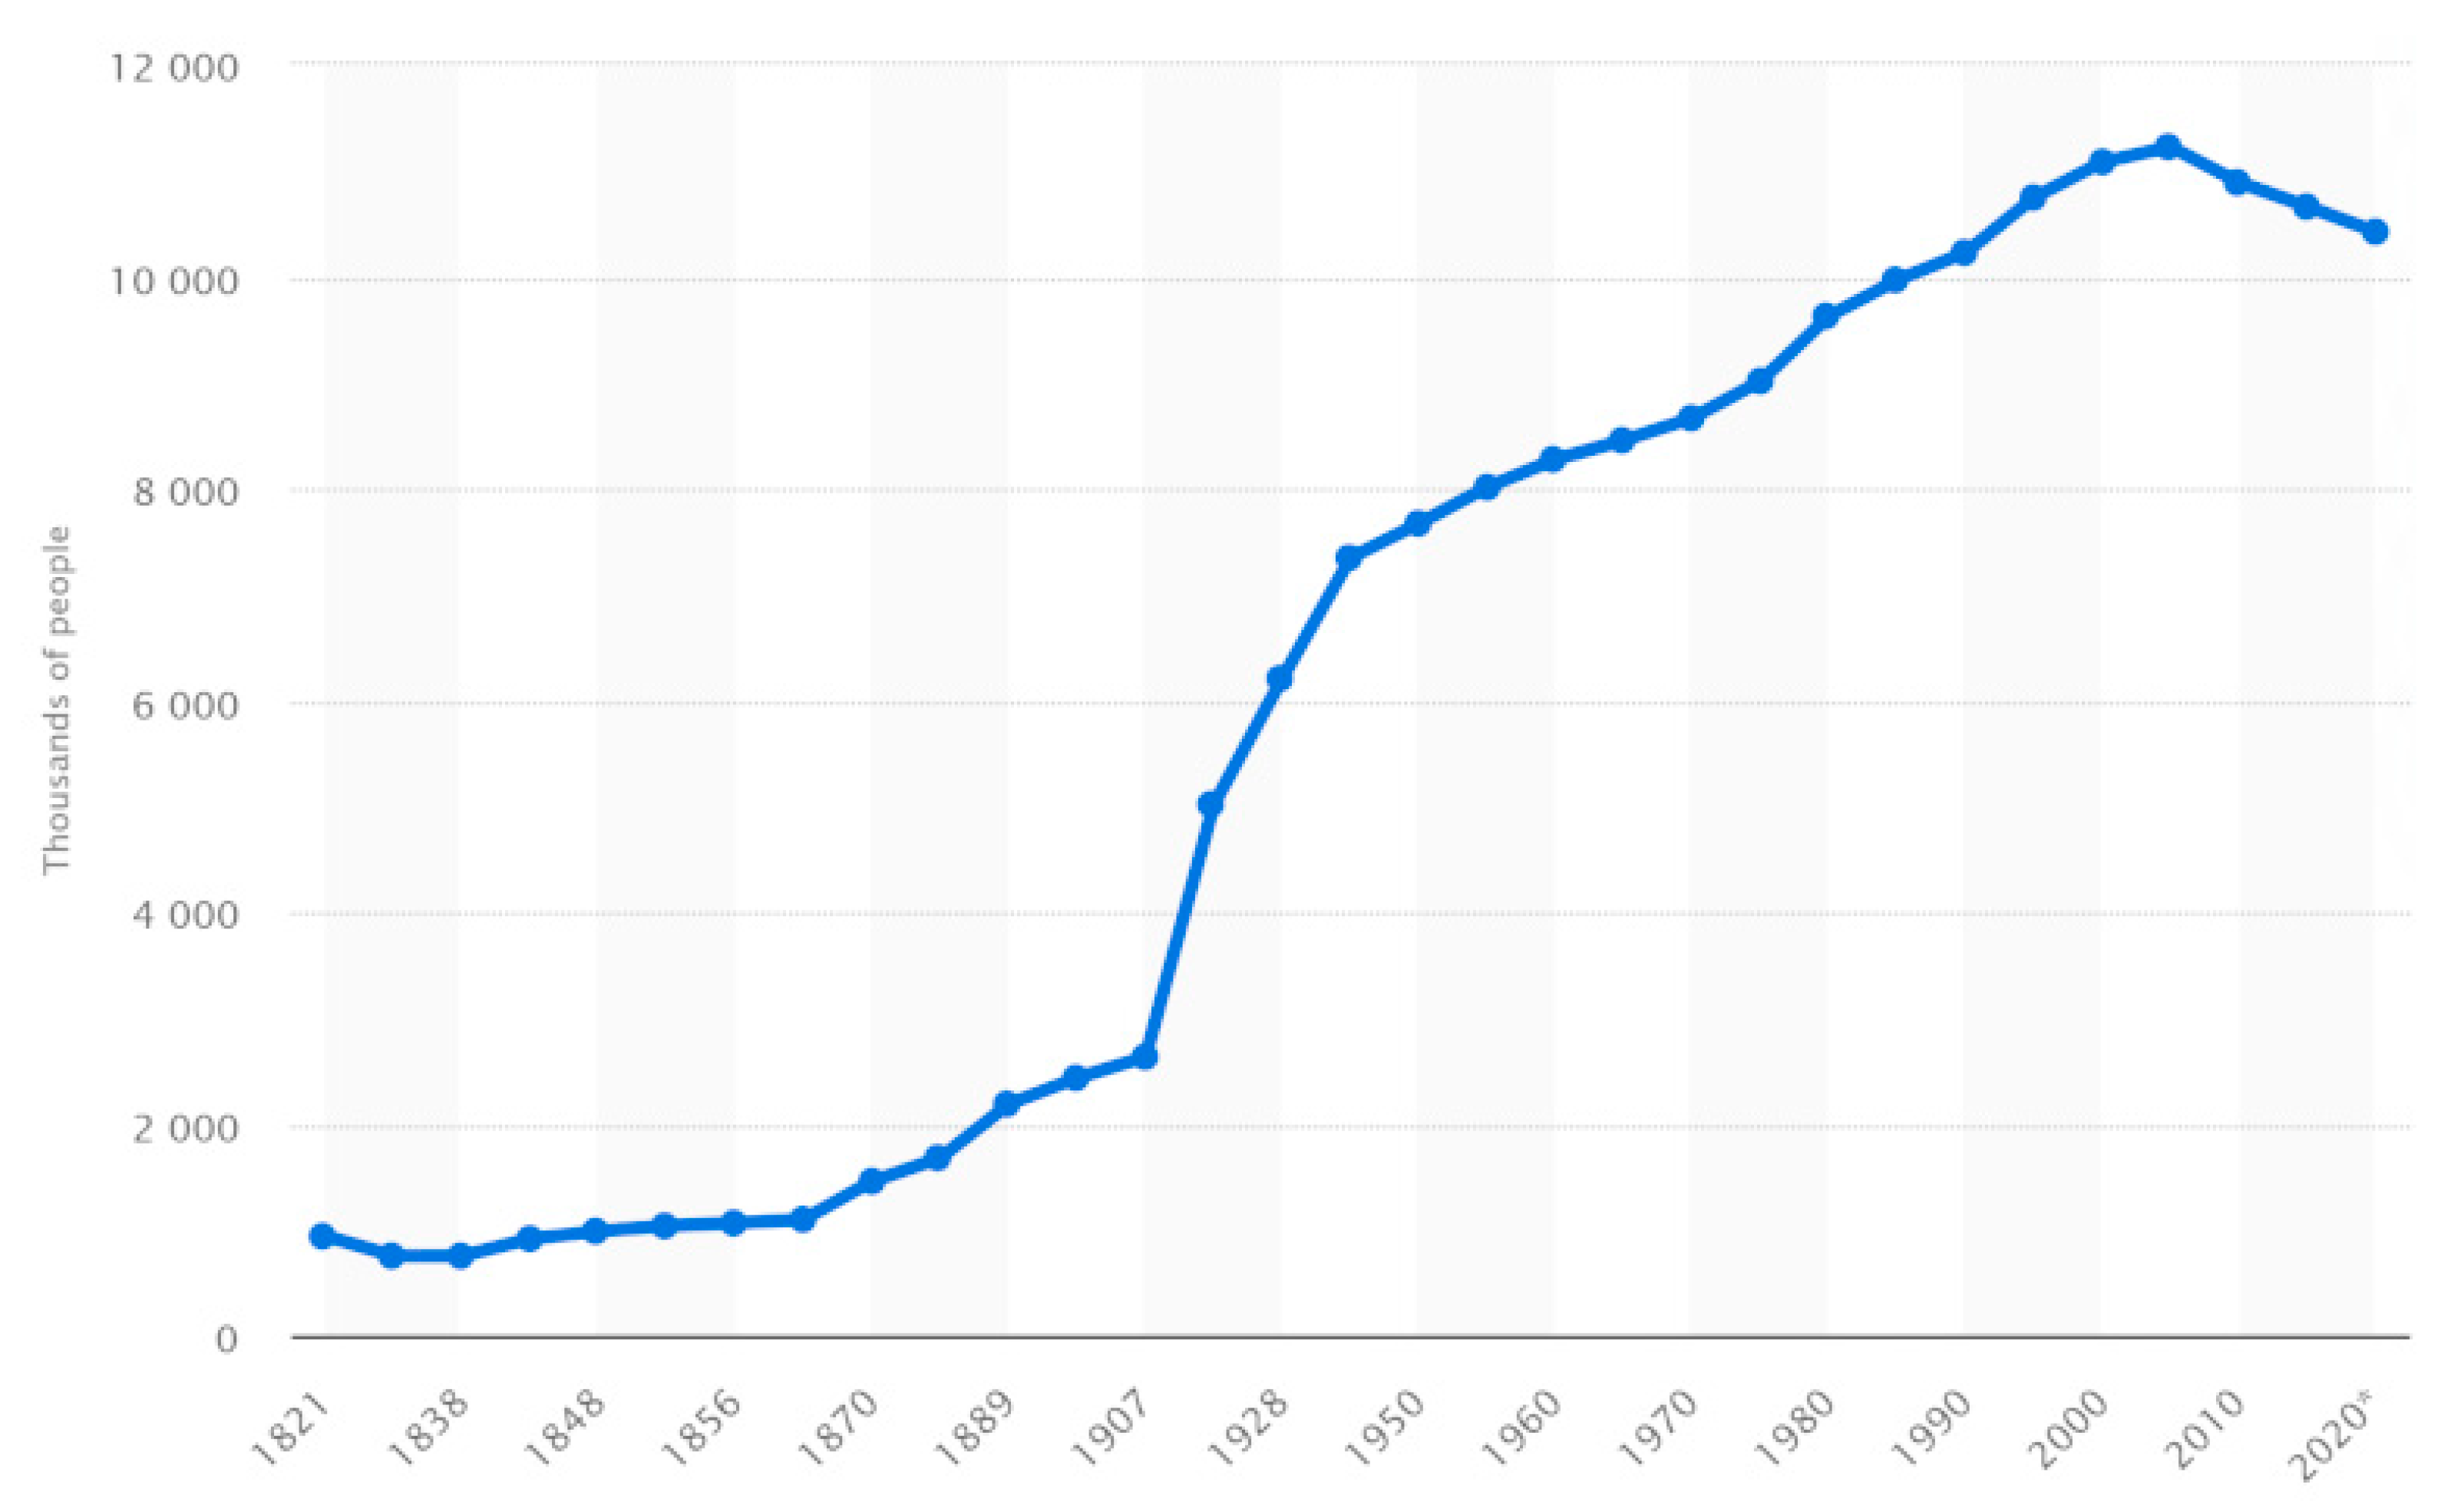
Figure 1. An administrative map illustrating regions and prefectures of Greece.
Ijgi 09 00454 g001
Figure 2. Total population growth since the unification of the Greek state (* 2020 estimate).
Ijgi 09 00454 g002
Figure 3. Maps illustrating Greek municipalities (upper left), population density (inhabitants/km2) for 1961 and 2011 (upper middle and upper right) and population growth rate (%) over three decades (1961–1971: lower left; 1981–1991: lower middle; 2001–2011: lower right).
Ijgi 09 00454 g003
Figure 4. Maps illustrating spatial clustering of population density in Greece (left: 1961; right 2011; HH: High–High hotspots, HL: High–Low coldspots, LH: Low–High coldspots, LL: Low–Low hotspots, ns: non-significant).
Ijgi 09 00454 g004
Figure 5. Maps illustrating spatial clustering of population growth in Greece by decade (HH: High–High hotspots, HL: High–Low coldspots, LH: Low–High coldspots, LL: Low–Low hotspots, ns: non-significant).
Ijgi 09 00454 g005
Figure 6. Results of geographically weighted regression (GWR) models with population growth rate (%) as the dependent variable and population density as a predictor (from left to right: local R2, slope coefficient, model intercept and standardized residuals; from top to bottom: 1961–1971, 1971–1981, 1981–1991, 1991–2001, 2001–2011).
Ijgi 09 00454 g006aIjgi 09 00454 g006b
Figure 7. Absolute change in the GWR regression coefficient (local slope) during two consecutive decades in Greece, 1961–1981.
Ijgi 09 00454 g007
Figure 8. Absolute change in the GWR regression coefficient (local slope) during two consecutive decades in Greece, 1971–1991.
Ijgi 09 00454 g008
Figure 9. Absolute change in the GWR regression coefficient (local slope) during two consecutive decades in Greece, 1981–2001.
Ijgi 09 00454 g009
Figure 10. Absolute change in the GWR regression coefficient (local slope) during two consecutive decades in Greece, 1991–2011.
Ijgi 09 00454 g010
Table 1. The evolution of selected demographic indicators over time in Greece.
YearTotal Population (Inhabitants)Annual Rate of Change (%)Population Density (Inhabitants/km2)Urban
Population (%)
Median Age (Years)Total Fertility Rate
19558,011,1240.886254.126.92.48
19608,273,6290.656455.928.32.42
19708,663,5710.496764.232.22.55
19809,627,0021.327569.4332.42
199010,225,9920.517971.635.11.53
200011,082,1040.628673.1381.31
201010,887,637−0.618480.241.11.42
201510,659,750−0.428382.143.41.34
201910,473,455−0.468184.343.81.34
Table 2. Global Moran’s spatial autocorrelation coefficients for demographic density (1961 and 2011) and population growth rates in Greece (1961–2011); all coefficients are significant at p < 0.001.
Bandwidth (km)Population DensityAnnual Population Growth Rate (%)
196120111961–19711971–19811981–19911991–20012001–2011
10185.1174.6120.368.139.725.118.4
25214.6229.2166.0103.455.232.431.5
50205.7232.9172.0119.262.335.836.1
100201.2230.0170.9120.662.335.239.4
150198.7227.3170.0119.661.734.040.3
Table 3. Analysis of the linkage between population increase (%) and density using different correlation coefficients, linear and non-linear (square, cubic) aspatial regressions (adjusted R2) and a Geographically weighted regression (global adjusted R2) for municipalities in Greece (* significance tested at p < 0.001, n = 1033).
DecadeCorrelation CoefficientsOrdinary Least Square RegressionGeographically
Weighted Regression
PearsonSpearmanKendallLinearSquareCubic
1961–19710.47 *0.44 *0.31 *0.15 *0.18 *0.25 *0.36 *
1971–19810.34 *0.36 *0.25 *0.040.050.100.28 *
1981–19910.110.200.140.010.010.080.11 *
1991–20010.120.240.170.020.020.110.09 *
2001–20110.36 *0.52 *0.37 *0.12 *0.17 *0.21 *0.28 *

