Article

Assessing the Spatial Pattern of Irrigation Demand under Climate Change in Arid Area

1
College of Water Conservancy, Yunnan Agricultural University, Kunming 650201, China
2
State Key Laboratory of Hydrology-Water Resources and Hydraulic Engineering, Hohai University, Nanjing 210098, China
3
College of Agricultural Engineering, Hohai University, Nanjing 210098, China
*
Author to whom correspondence should be addressed.
ISPRS Int. J. Geo-Inf. 2020, 9(9), 506; https://0-doi-org.brum.beds.ac.uk/10.3390/ijgi9090506
Submission received: 21 July 2020 / Revised: 16 August 2020 / Accepted: 19 August 2020 / Published: 23 August 2020

Abstract

:
Studying the pattern of agricultural water demand under climate change has great significance for the regional water resources management, especially in arid areas. In this study, the future pattern of the irrigation demand in Hotan Oasis in Xinjiang Uygur Autonomous Region in Northwest China, including Hotan City, Hotan County, Moyu County and Luopu County, was assessed based on the general circulation models (GCMs) and the Surface Energy Balance System model (SEBS). Six different scenarios were used based on the GCMs of BCC_CSM1.1, HadGEM2-ES and MIROC-ESM-CHEM under the Representative Concentration Pathway (RCP) 4.5 and RCP 8.5. The results showed that the method integrating the GCMs and SEBS to predict the spatial pattern was useful. The irrigation demand of Hotan Oasis will increase in 2021–2040. The annual irrigation demand of Hotan City is higher, with 923.2 and 936.2 mm/a in 2021–2030 and 2031–2040, respectively. The other three regions (Hotan County, Moyu County and Luopu County) are lower in the six scenarios. The annual irrigation demand showed a spatial pattern of high in the middle, low in the northwest and southeast under the six scenarios in 2021–2040. The study can provide useful suggestions on the water resources allocation in different regions to protect water resources security in arid areas.

1. Introduction

Climate change has become one of the most important global environmental challenges in the 21st century. The negative impact of climate change on the water resource system has happened in almost all regions of the world [1,2]. Currently, there are many studies about the impact of climate change on hydrology and water resources in many areas [3,4,5,6,7]. Some previous studies showed that climate change was the main driver of the runoff change, especially in areas with less human activities [8,9,10]. For arid desert areas, agricultural water demand mainly came from the runoff of the river, which was supplied by the snowmelt of glacier. Therefore, studying the pattern of agricultural water demand under climate change is of great significance for water resources management.
At present, there are many studies on the spatial pattern of agricultural water resources. The data of those studies’ sources were mainly collected through the Water Resources Bulletin from the government. In addition, the used analytical methods were mainly spatial analysis, which combined mathematical statistics with Geographic Information Systems (GIS) [11]. The spatial analysis of the water resources could not be carried out in the area, where there was no Water Resources Bulletin. In addition, the smaller areas, such as sub-basins (i.e., computation units), of water resource pattern can be analyzed by constructing a distributed or semi-distributed hydrological model based on GIS, such as the SWAT (Soil & Water Assessment Tool) model. However, the arid desert is a typical water dissipation zone; the distributed hydrological model generally cannot be used in that area. Besides, due to the low groundwater level and strong evaporation in the region, water evapotranspiration consumption is the main form of water movement in the region [12]. Therefore, analysis of the spatial pattern of agricultural water resources can be attempted by the evapotranspiration pattern, and the inversion calculation of evapotranspiration can be used by remote sensing [13].
The methods of the estimation of regional scale evapotranspiration can be approximately divided into three categories: statistical empirical method, energy balance method and numerical mode. At present, the energy balance methods are used increasingly with the development of regional evapotranspiration theory and remote sensing technology. The land surface evapotranspiration models derived from this method mainly include the single-layer model and the double-layer model. The soil evaporation and plant transpiration were divided into two parts in the two-layer model. However, due to the cumbersome calculation process and the fact that various parameters calculated are usually based on experience, the two-layer model has obvious limitations, Meanwhile, compared to that, the relative error of the single-layer model is smaller when used by MODIS (Moderate Resolution Imaging Spectroradiometer) data [14], so the application of the single-layer model is more convenient and extensive. The Surface Energy Balance Algorithms for Land (SEBAL) and Surface Energy Balance System (SEBS) proposed by Bastiaanssen et al. [15,16] and Su [17], respectively, are the two most widely used single-layer models based on the principle of surface energy balance. Compared with SEBAL, SEBS has a clearer physical concept, higher flux estimation accuracy and more practicability, so it has been widely used in recent years [18,19,20]. In China, many research results have been gained, in which the SEBS model was used to study the spatial distribution of evapotranspiration [21,22,23,24,25,26]. In addition, there has been many research findings with the SEBS model applied in other parts of the world [27,28,29]. Hence, we can use the SEBS model to analyze the evapotranspiration pattern in the arid desert.
Water resources in arid desert are limited. In order to prevent the spread of desertification, maintain the security of water resources among regions, and maintain the balanced and coordinated development of all regions, it is necessary to strictly prohibit disorderly desertification, control the irrigation area and reasonably allocate the water resources in different regions, to promote regional economic and social stability, health and sustainable development. Therefore, the study of spatial pattern of irrigation demand in future is very important. Hotan Oasis, located in Taklimakan Desert in China, was selected as an example in this study.
Overall, the objective of this study was to assess the spatial pattern of irrigation demand under climate change in Hotan oasis, based on the prediction of the climate change combing with the current spatial pattern of irrigation demand.

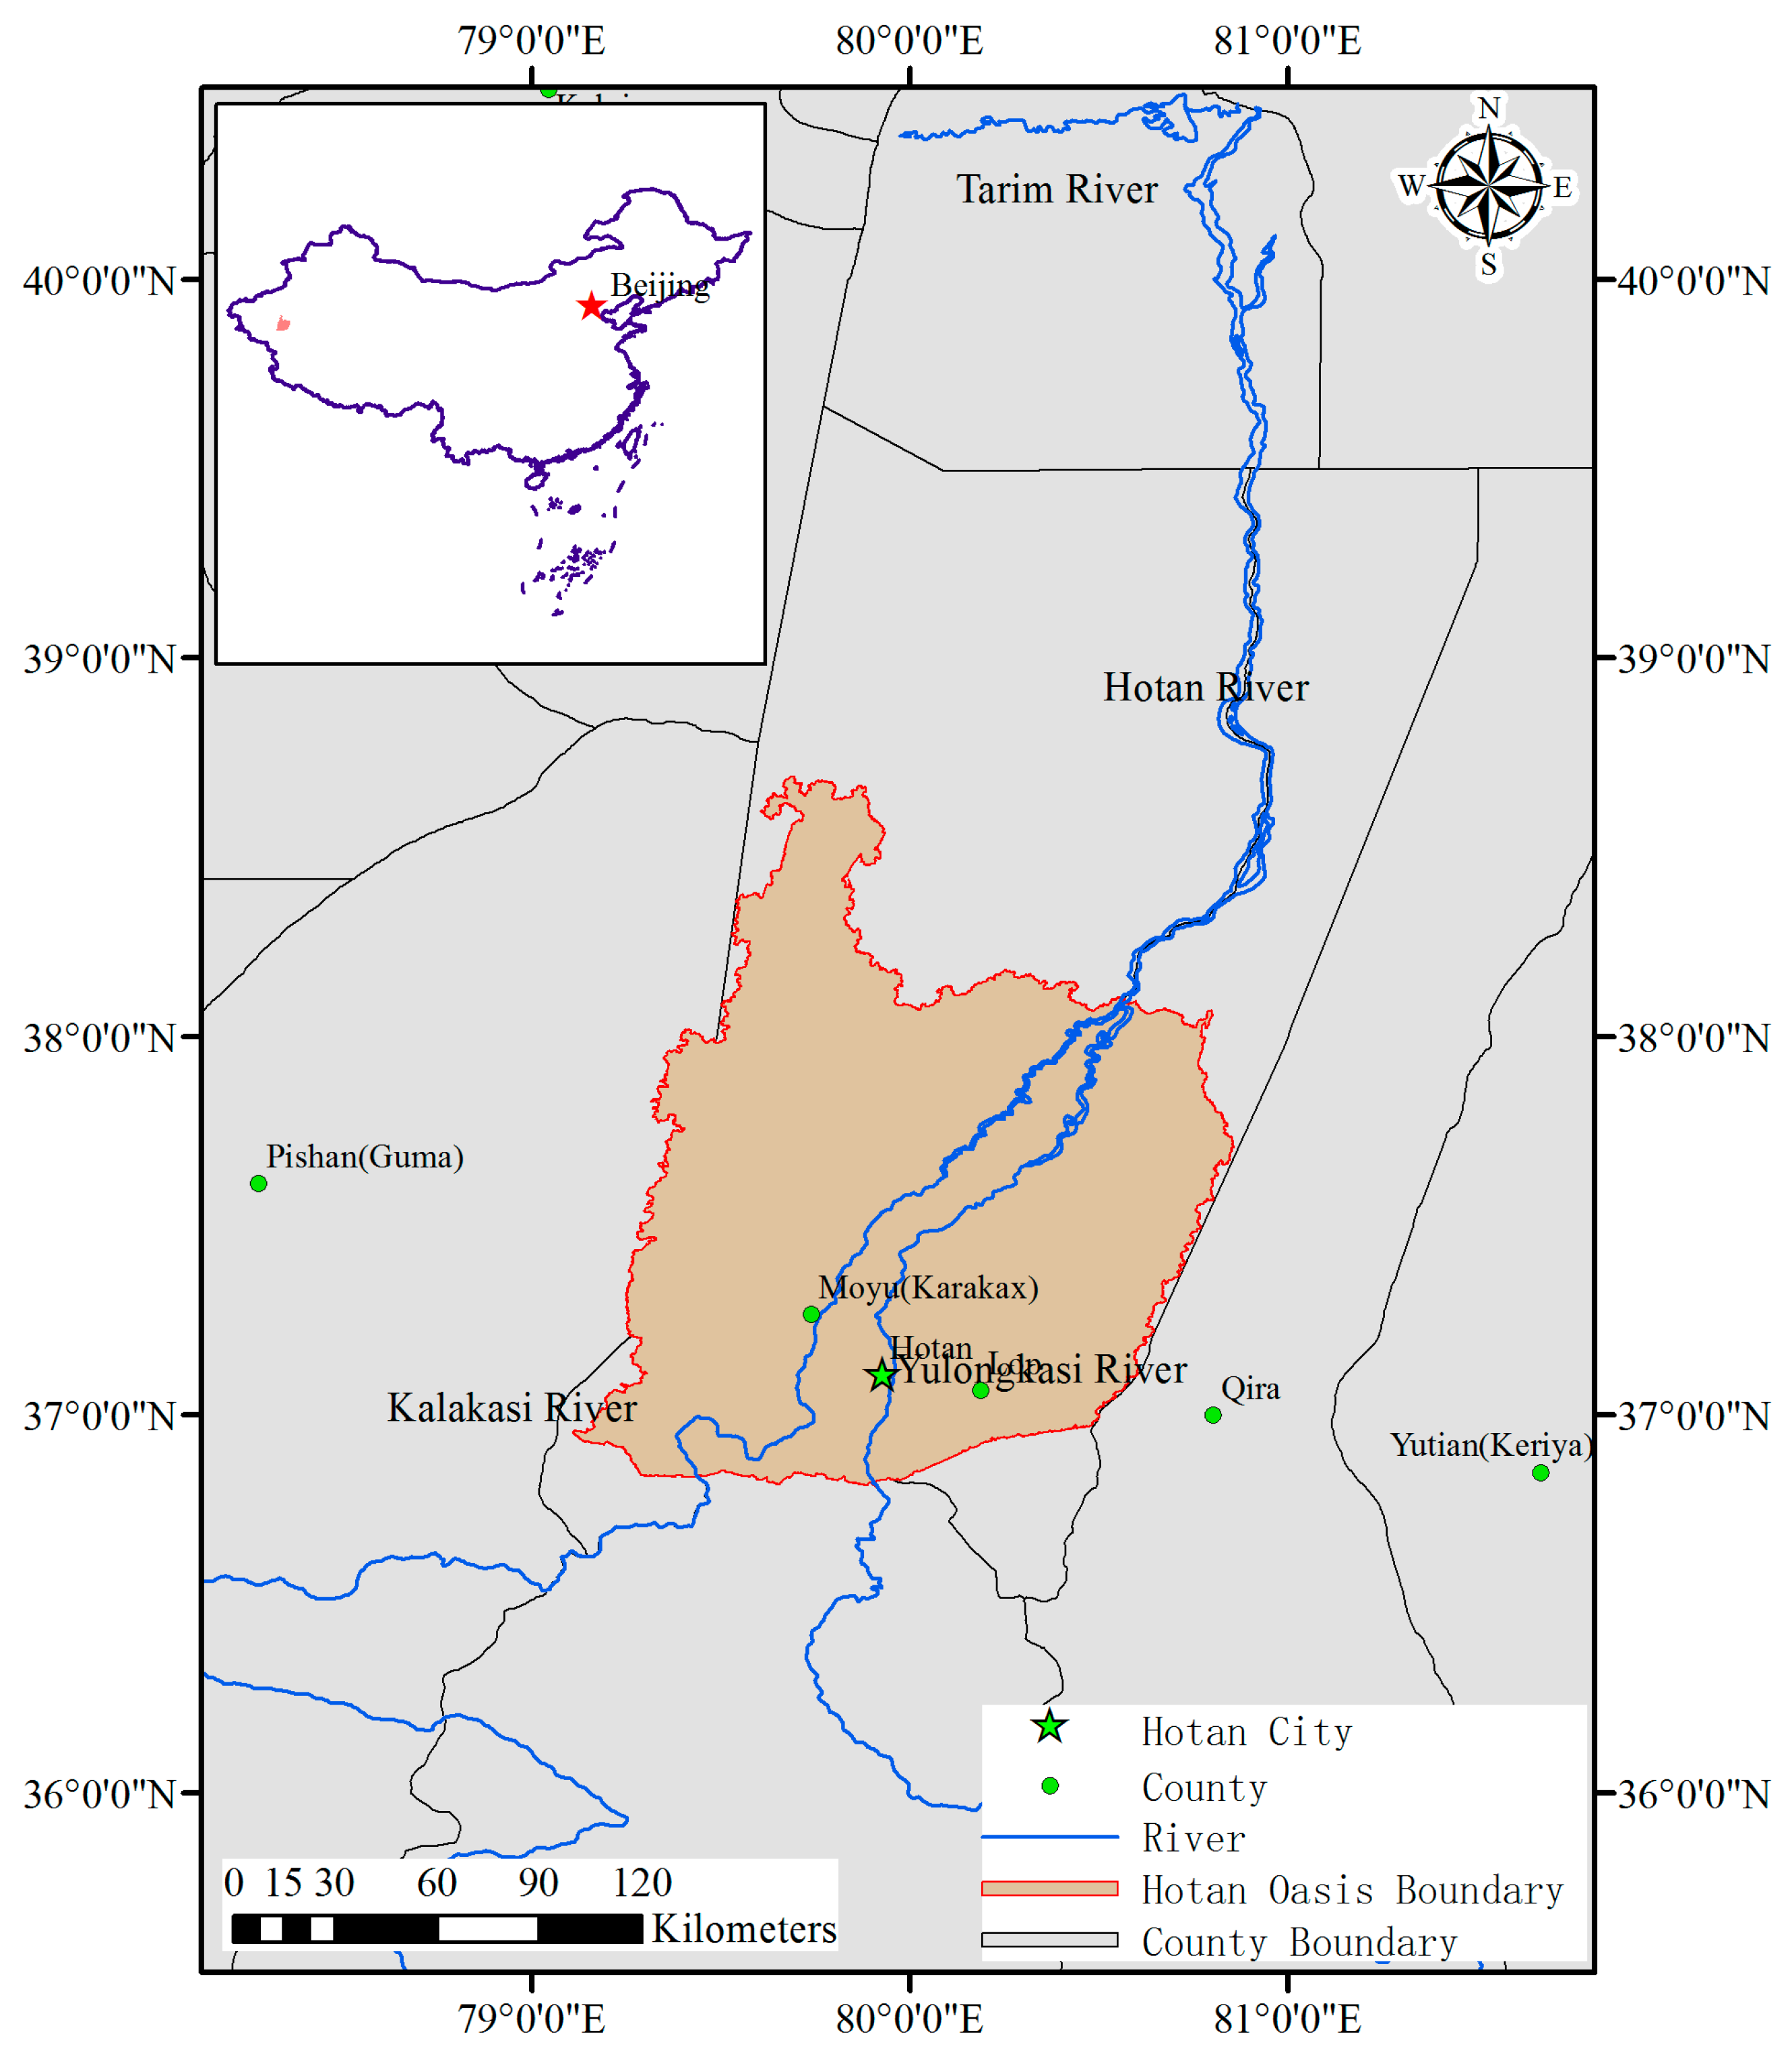
2. Study Area and Data

The Hotan Oasis, a part of the Hotan River Basin, located at the southwest of Tarim Basin in the south of Xinjiang Uygur Autonomous Region in China, was studied in the research (39°38′–41°45′ N, 85°42′–89°17′ E) (Figure 1). The Oasis includes the parts of Hotan City, Hotan County, Moyu County and Luopu County. The Hotan River flows for 1127 km with a mean annual water discharge of 4.478 × 10⁹ m3. The river passes through the Taklimakan Desert from south to north and then flows into the Tarim River. The river, which comes from the Yulongkasi River and the Kalakasi River, is the second biggest river on the northern slope of the Kunlun Mountains of southern Xinjiang.
The remote sensing data in the study are based on data products of moderate-resolution imaging spectroradiometer (MODIS) mounted on Terra satellite, which was launched on 18 December 1999. The data include that the 8-day, 500-m MODIS surface reflectance product (MOD09A1), the 16-day, 1000-m MODIS land surface temperature product (MOD11A2) and the 16-day, 500-m MODIS Normalized Difference Vegetation Index (NDVI) (MOD13A1). The serial number of the regional grid in this study area is h24v06 with the sinusoidal projection. Elevation data are from the National Aeronautics and Space Administration (NASA) with a spatial resolution of 30 m. In addition, the hourly observation data of air pressure, sea level pressure, temperature, wind speed, sunshine hours, humidity and horizontal visibility at Hotan Meteorological Station are customized from the Hourly Observation Data of China Surface Meteorological Station in National Meteorological Information Center.

3. Methodology

3.1. SEBS Model

The SEBS model includes two physical processes: surface radiation balance and surface energy balance. Its basic principle is energy balance:
λ E = R n G H
where λE is the turbulent latent heat flux (λ is the latent heat of vaporization and E is water vapour flux density), W/m2; Rn is net radiation, W/m2; G is the soil heat flux, W/m2; and H is the sensible heat flux, W/m2 [17].
The SEBS model program was used by the Integrated Land and Water Information System (ILWIS 3.8.5), which integrates remote sensing technology and geographic information systems developed by the Faculty of Geo-information Science and Earth Observation (ITC) in the Netherlands. It has been applied in many studies with good applicability [30]. ILWIS can provide data preprocessing, parameter extraction and model calculation for the SEBS model. Specifically: MODIS data products have been used to calculate the land surface physical parameters, such as land surface albedo, emissivity, NDVI, and land surface temperature, combined with the meteorological data, then put all the data into the model to calculate, and finally generate, the spatial distribution map of daily evapotranspiration.
In order to verify the reliability of the model, the Penman–Monteith model was used based on the previous studies of the verification method of the model [31,32], for that there was no eddy covariance observation systems in the studied area. Although the value of the evapotranspiration which is directly calculated by eddy covariance observation systems is more actual, the value of the water and heat fluxes between vegetation and atmosphere can be measured by the eddy covariance observation systems, and the evapotranspiration can be calculated according to the water balance then. The reference crop evapotranspiration (ET0) was calculated using the Penman–Monteith model recommended by FAO-56, then the actual crop evapotranspiration (ET) obtained by considering the local crop coefficient, which from a previous research [33], was to compare the results calculated using SEBS model.
Currently, there have been a few studies about the annual evapotranspiration pattern from the daily evapotranspiration pattern [34], while the previous research only studied the daily evapotranspiration pattern. In this study, the spatial distribution of annual evapotranspiration is obtained by interpolation and summation method, used the daily evapotranspiration data with 16 days interval. The formula is as follows:
E T = i = 1 n ( E T i + E T i + 1 ) Δ T 2
where ET is annual evapotranspiration, mm; ETi and ETi+1 are daily evapotranspiration on day i and day i + 1, respectively, mm; ΔT is the interval of days between two adjacent diurnal evapotranspiration (i.e., 16 days); i is the number of the daily evapotranspiration(1, 2, 3, …, n).

3.2. Prediction of the Future Climate

The fifth phase of the Coupled Model Intercomparison Project (CMIP5) is the most recent coordinated experiment of global climate modeling [35]. There are currently 65 general circulation models (GCMs) from 28 different research institutes, which are widely used in the field of climate change research [36,37]. CMIP5 has four greenhouse gas emission scenarios: Representative Concentration Pathway 2.6, RCP 4.5, RCP 6.0 and RCP 8.5. In this study, RCP 4.5 and RCP 8.5 and three GCMs (Table 1) that performed well in China were selected to study [38,39]. Therefore, six scenarios (BCC_4.5, BCC_8.5, HADG4.5, HADG8.5, MIROC_4.5 and MIROC_8.5) were studied in this research. This study includes data on meteorological factors for the 21st century (2006–2100) under the RCP4.5 and RCP8.5 scenarios.
The direct output results of climate models have large systematic deviations. Therefore, when using GCMs climate model data, downscaling is necessary. A statistical downscaling method can establish the statistical relationship between large-scale climatic factors and regional climatic factors by using multi-year observation data. In addition, this method can test the relationship based on independent observation data. Then, the relationship is applied to the output of large-scale climatic information from GCMs to predict future scenarios of regional climate change (e.g., temperature and precipitation). In this study, the equidistant quantile-based mapping method was used for the statistical downscaling method. This method is a new deviation correction method based on the quantile method proposed by Li [40]. Based on the former observed data, such as precipitation and temperature, at three meteorological stations (i.e., Hotan, Pishan and Yutian stations) in the Hotan River Basin, a statistical downscaling model was established by using an equidistant quantile-based mapping method. In the study area, the future meteorological data was generated from the output of the three GCMs by the downscaling model.

3.3. Prediction of Irrigation Demand

In this study, the grids of canal system were included in the farmland in the simulation results, for that the spatial resolution of evapotranspiration calculated by SEBS was 500 m. So, the canals were counted as the farmland and the results of evapotranspiration of the farmland included two aspects: the evapotranspiration of the canal system and the evapotranspiration of actual farmland. While, according to the water balance in Hotan Oasis: the water intake is equal to the sum of evapotranspiration, net percolation of the field and percolation of the canals, the formulas are as follows:
Q = E + q 1 + q 2
k = 1 q 1 + q 2 Q
Q = E k
where Q is the estimation of irrigation demand from the Hotan River; E is the calculation of evapotranspiration of farm land by SEBS, mm; q1 is the net percolation in the field (i.e., percolation deducting phreatic evaporation), mm; q2 is percolation in canal system, mm; k is the proportion coefficient of evapotranspiration to irrigation demand.
The irrigation demand under the scenarios in every region in the future can be calculated as follows:
Q f = k E k
where k is the proportion coefficient of evapotranspiration to irrigation demand; k′ is the variation ranges of the estimated evapotranspiration from present to future; E′ is the calculation of evapotranspiration of farm land in each region at present by SEBS, mm.

4. Results

4.1. Distribution of the Evapotranspiration

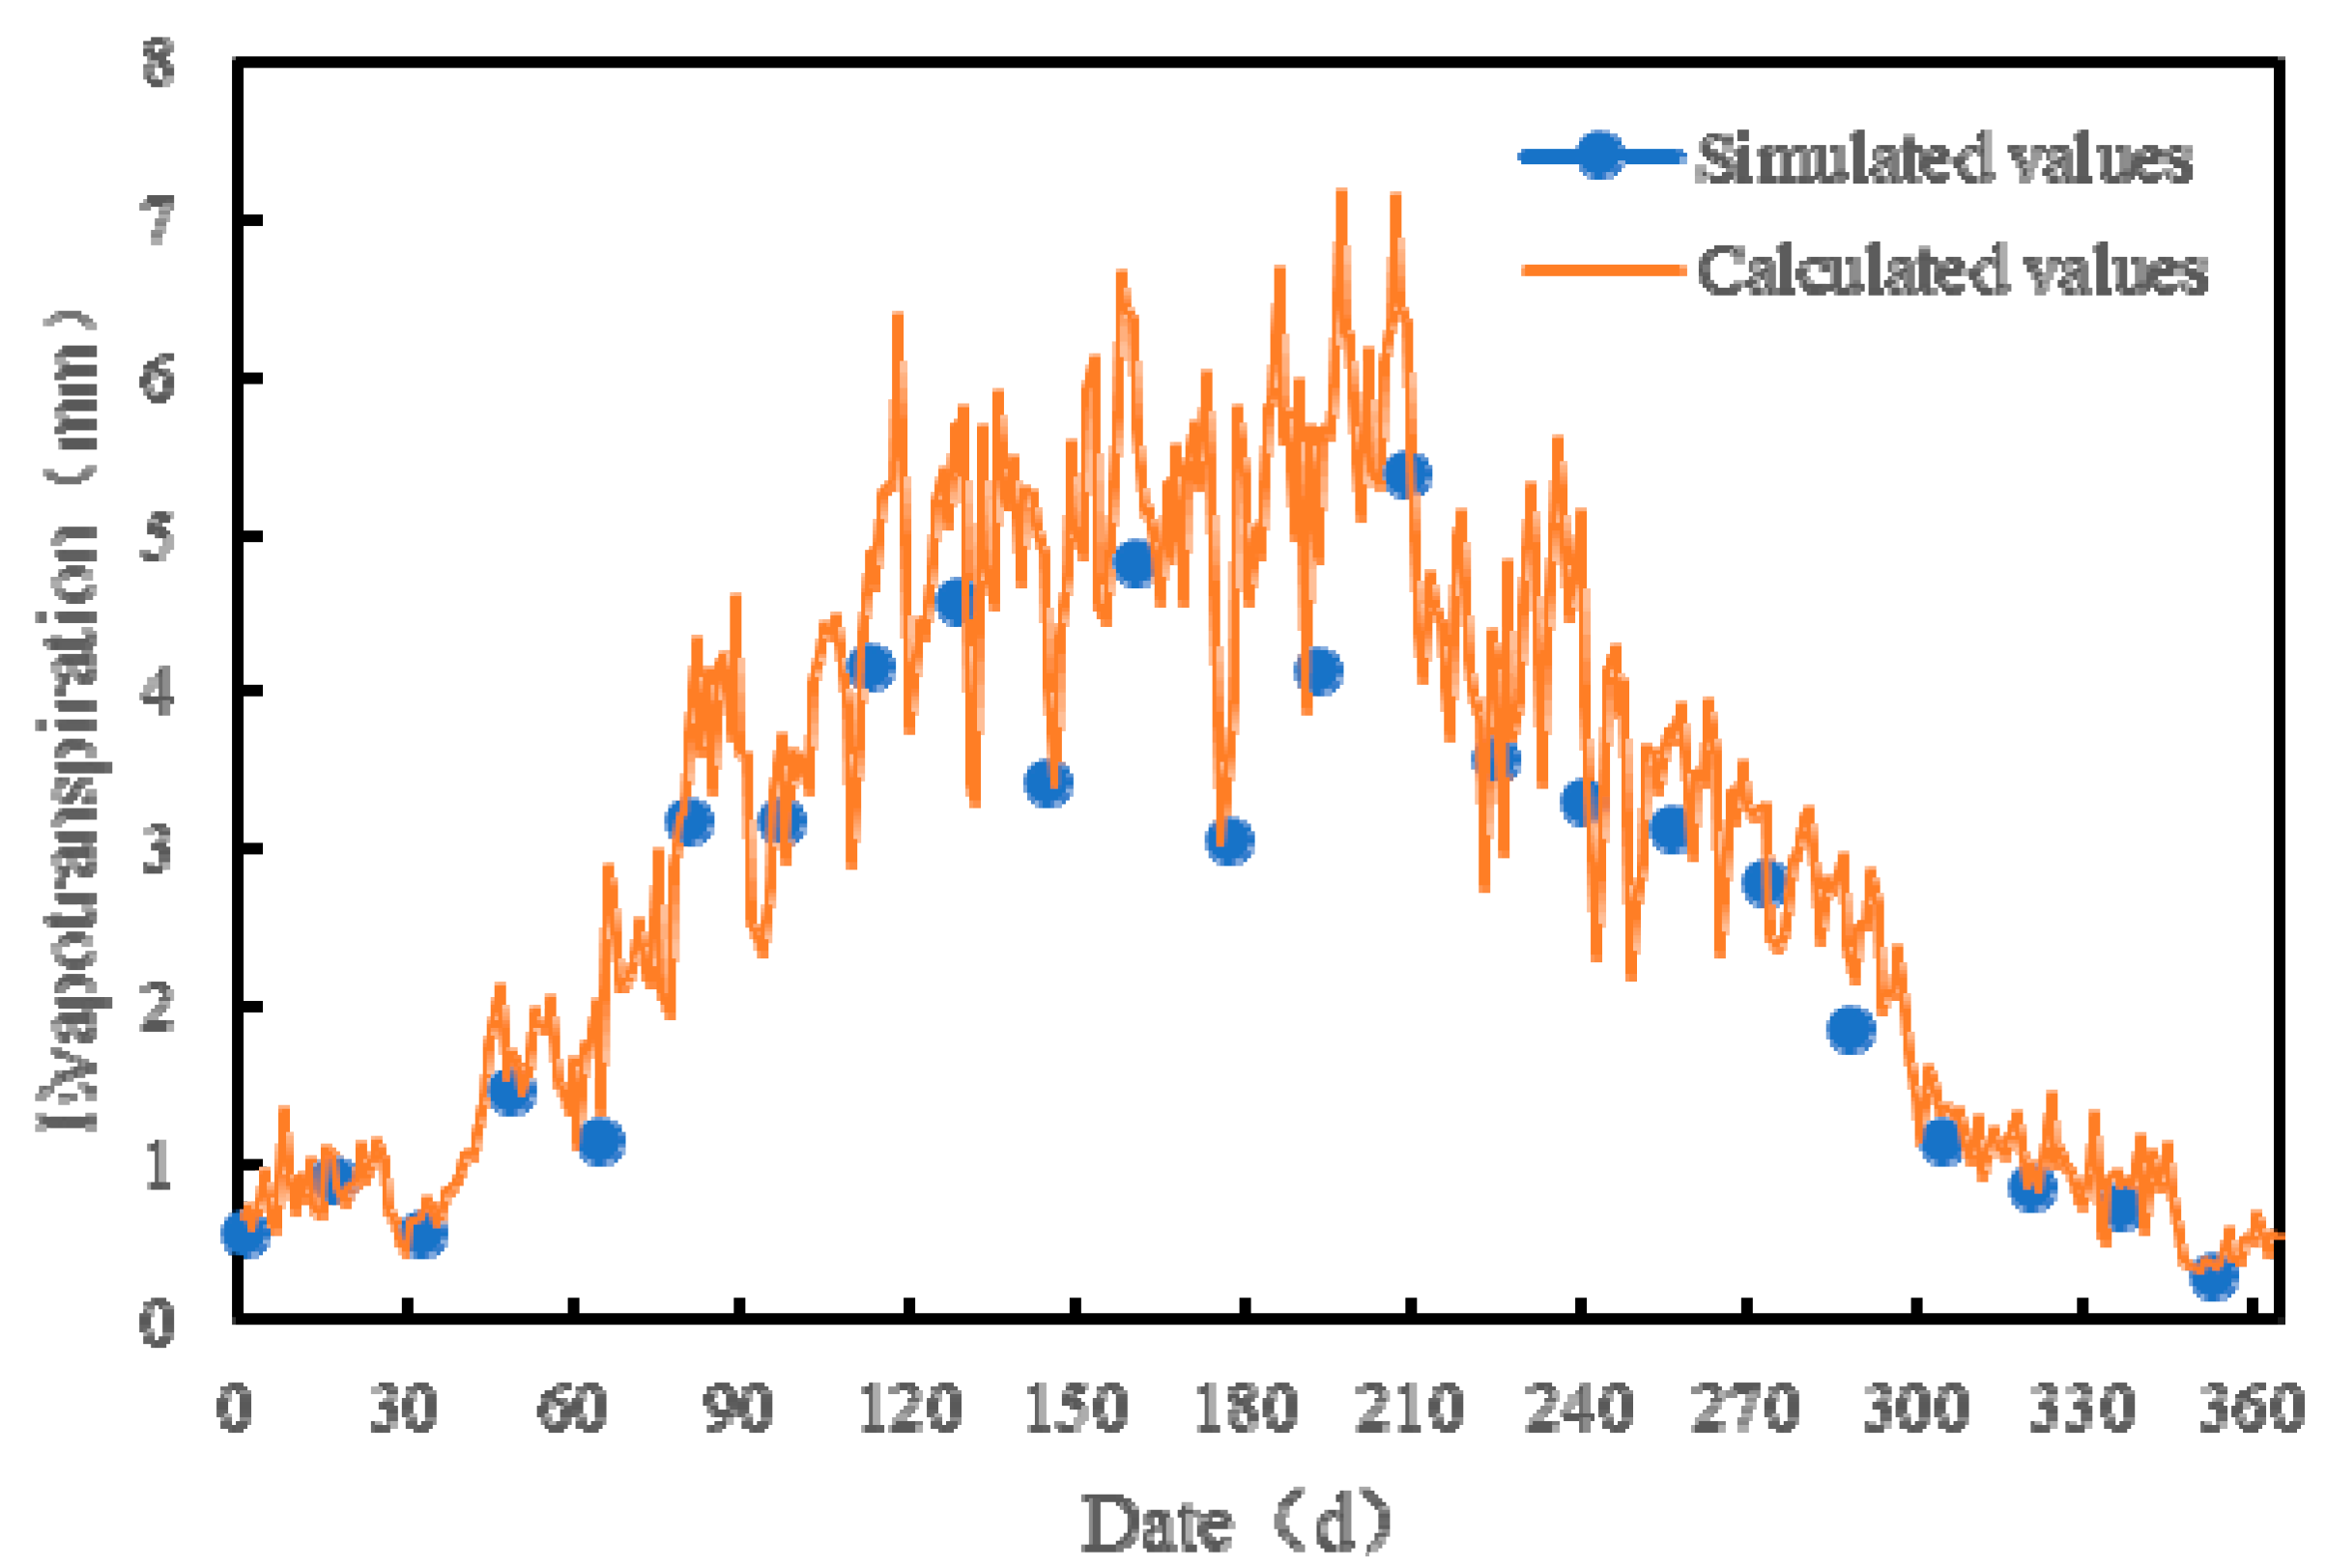
4.1.1. Model Validation

The daily evapotranspiration pixel values of the farmland simulated by SEBS in 2015, which was located at the meteorological station, were compared with those calculated by Penman–Monteith. Simulated and calculated daily evapotranspiration at Hotan station in 2015 were compared in the study, because the other two stations (Pishan and Yutian) were not located in Hotan Oasis. The results are shown in the Figure 2.
Figure 2 shows that the simulated values from SEBS are smaller than calculated values from Penman–Monteith on the same day. This is due to other land use types such as roads mixed in farm land pixels (The pixel size is 30 m × 30 m), which results in smaller evaporation values. Through statistical analysis of the simulated and calculated values on the same day, the error range of those values is between 5% and 20%. Therefore, the evapotranspiration estimated by SEBS is reasonable.

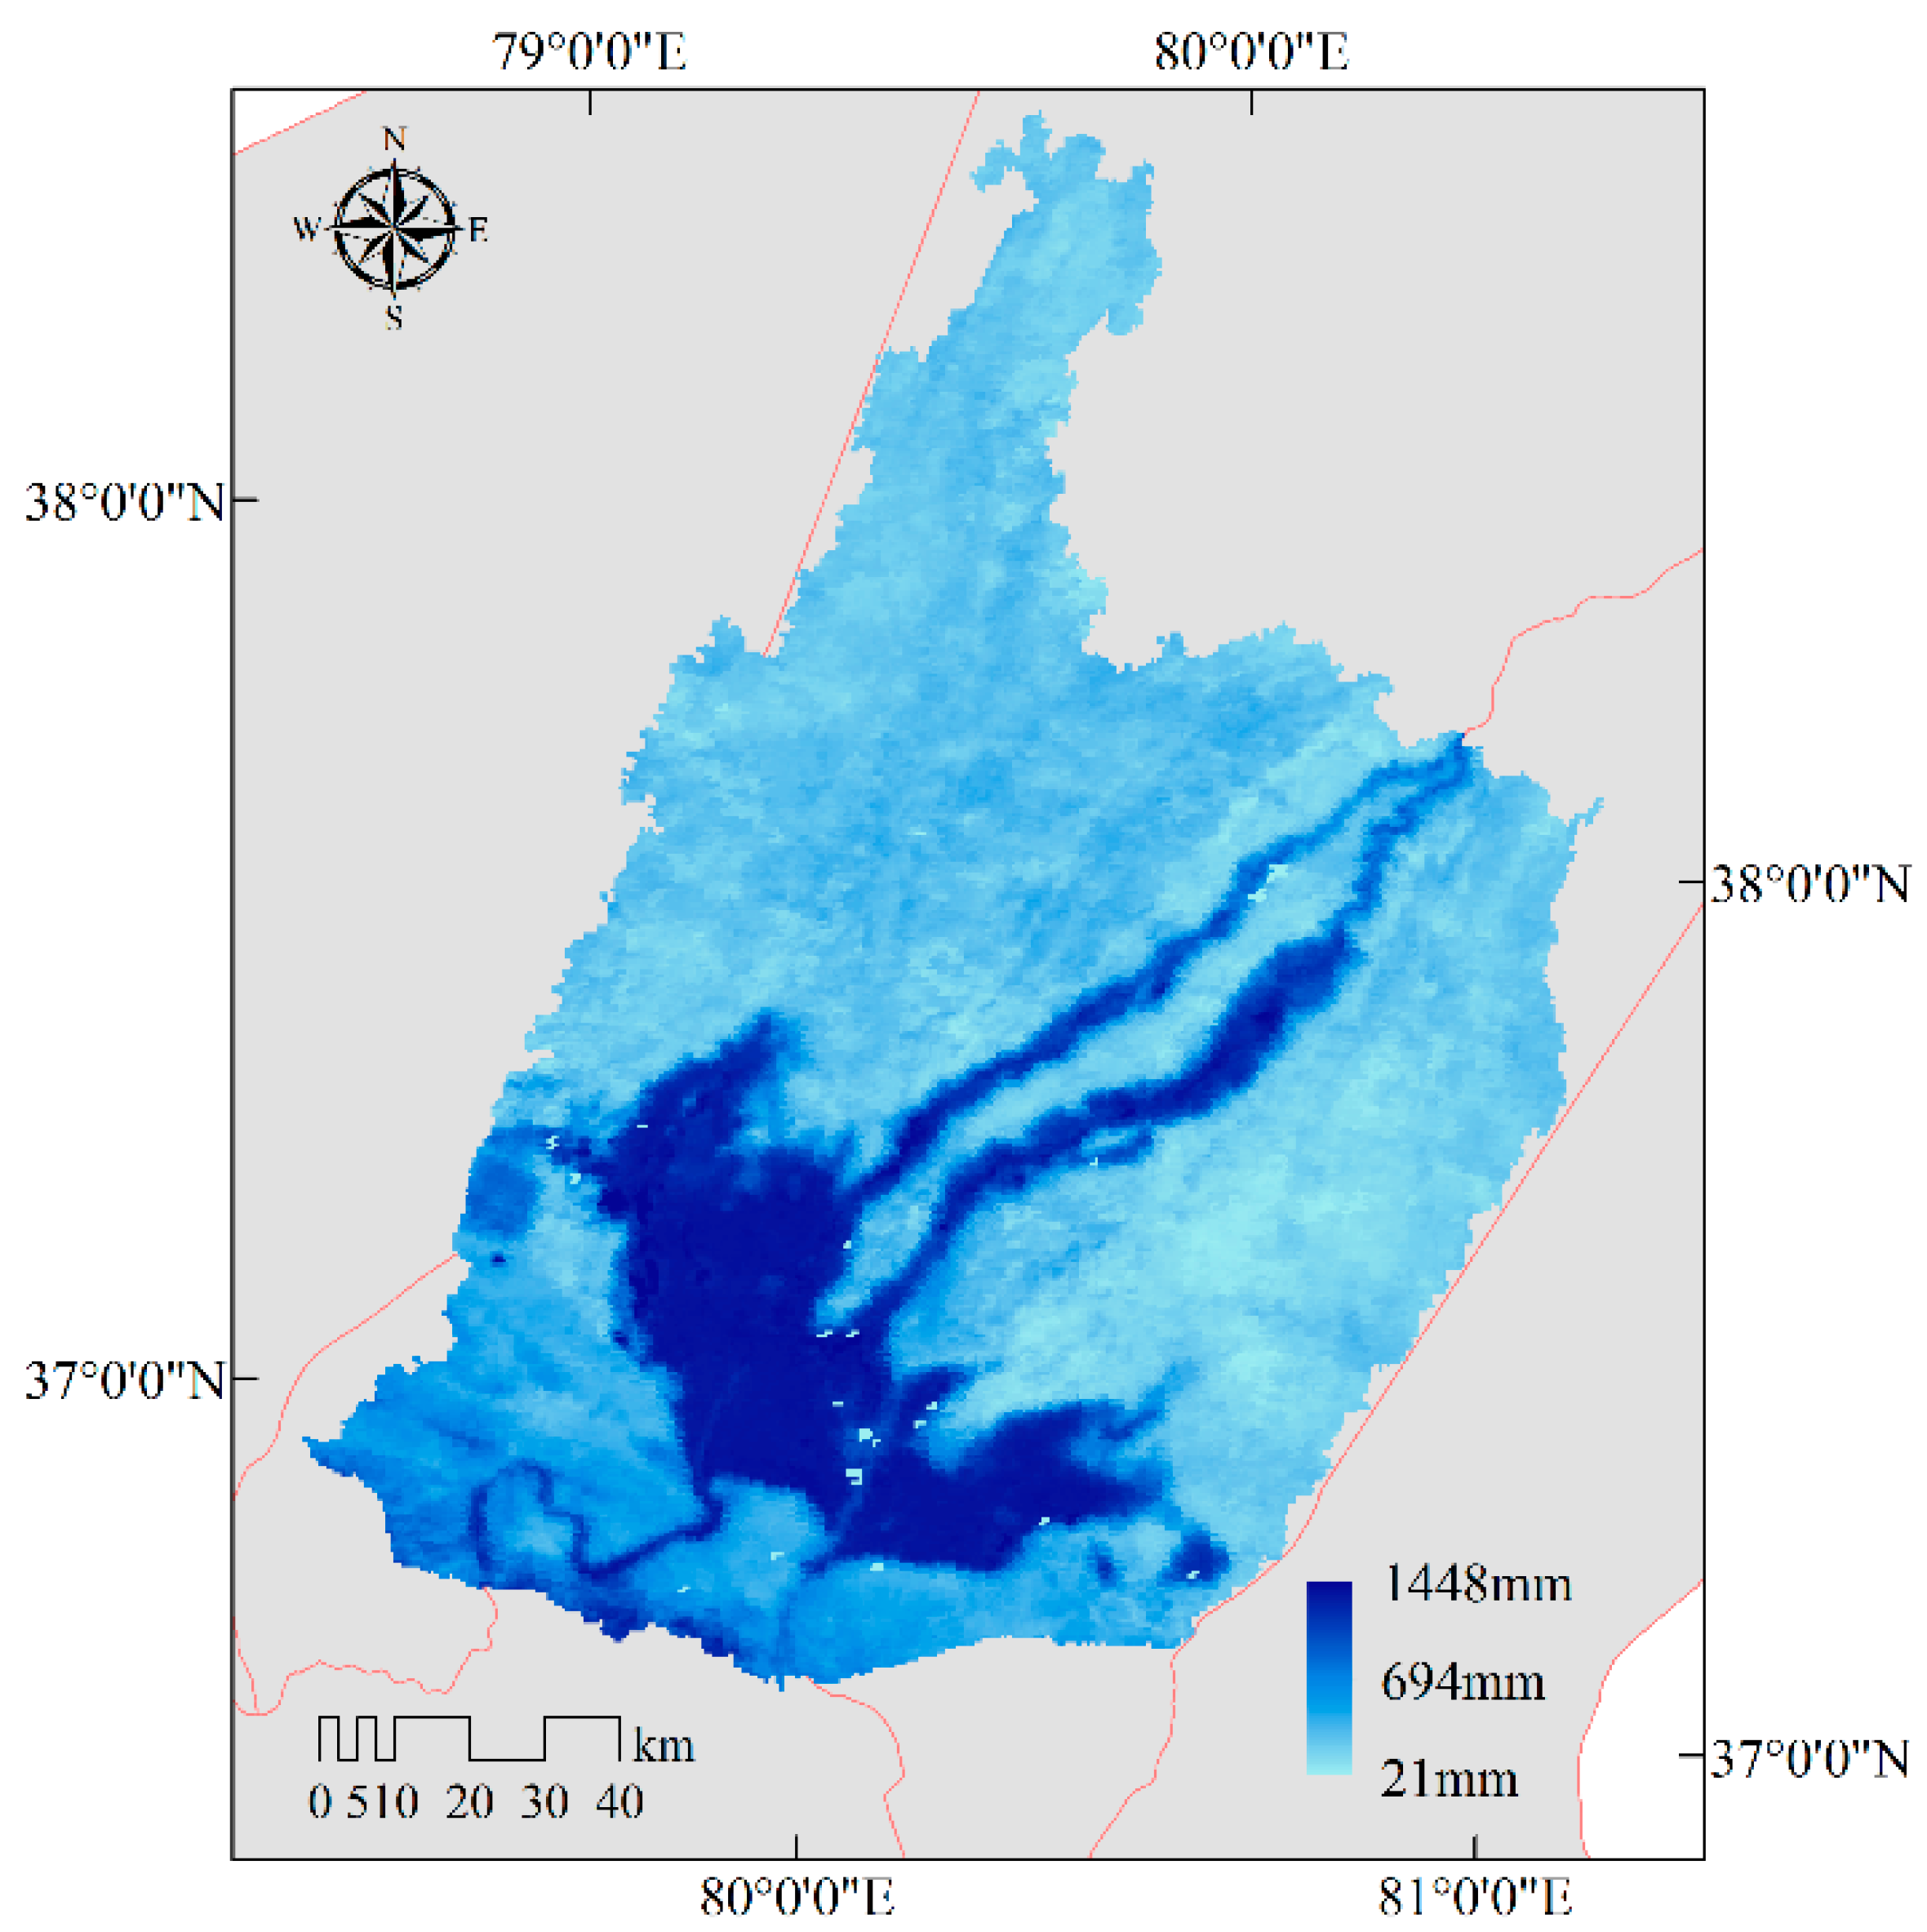
4.1.2. Spatial Distribution of the Evapotranspiration

The spatial distribution of evapotranspiration in Hotan Oasis in 2015 is shown in Figure 3. The individual white pixels are missing values. The evapotranspiration of Hotan city and Hotan County in the middle of the oasis is higher than that of Moyu County in the northwest and Luopu County in the southwest. Figure 3 shows a spatial pattern of high in the middle, low in the northwest and southeast. According to the type of land use analyzed by ArcGIS 10.2 (Figure 4), the proportion of unused land in Lop and Moyu counties is too large, and the unused land is mainly desert. The annual evapotranspiration of desert area is obviously smaller than that of other land types, which leads to this pattern. The highest evapotranspiration of the pixel is 1448 mm, and the lowest one is 21 mm. In addition, it can be seen from the Figure 3 that the annual evapotranspiration of farm land is high, and the spatial distribution of evapotranspiration in river area is consistent with the shape of rivers.

4.1.3. Spatial Pattern of the Evapotranspiration of Farm Land

The evapotranspiration of farm land in different regions in 2015 were calculated by Arcgis 10.2 (Table 2). In Hotan Oasis, the mean value of evapotranspiration in Hotan City was the highest (901.94 mm/a). This was due to the transpiration of the paddy crop rice planted in Hotan City, which increased the value. On the other hand, the irrigation infrastructure is the best one in all the regions in Hotan Oasis. While, the region is close to Hotan River and has high irrigation guarantee capability. There was little difference among the other three regions for the mean value. Hotan County is the smallest, mainly because the farm land is scattered in the region and there is a low irrigation guarantee capability.

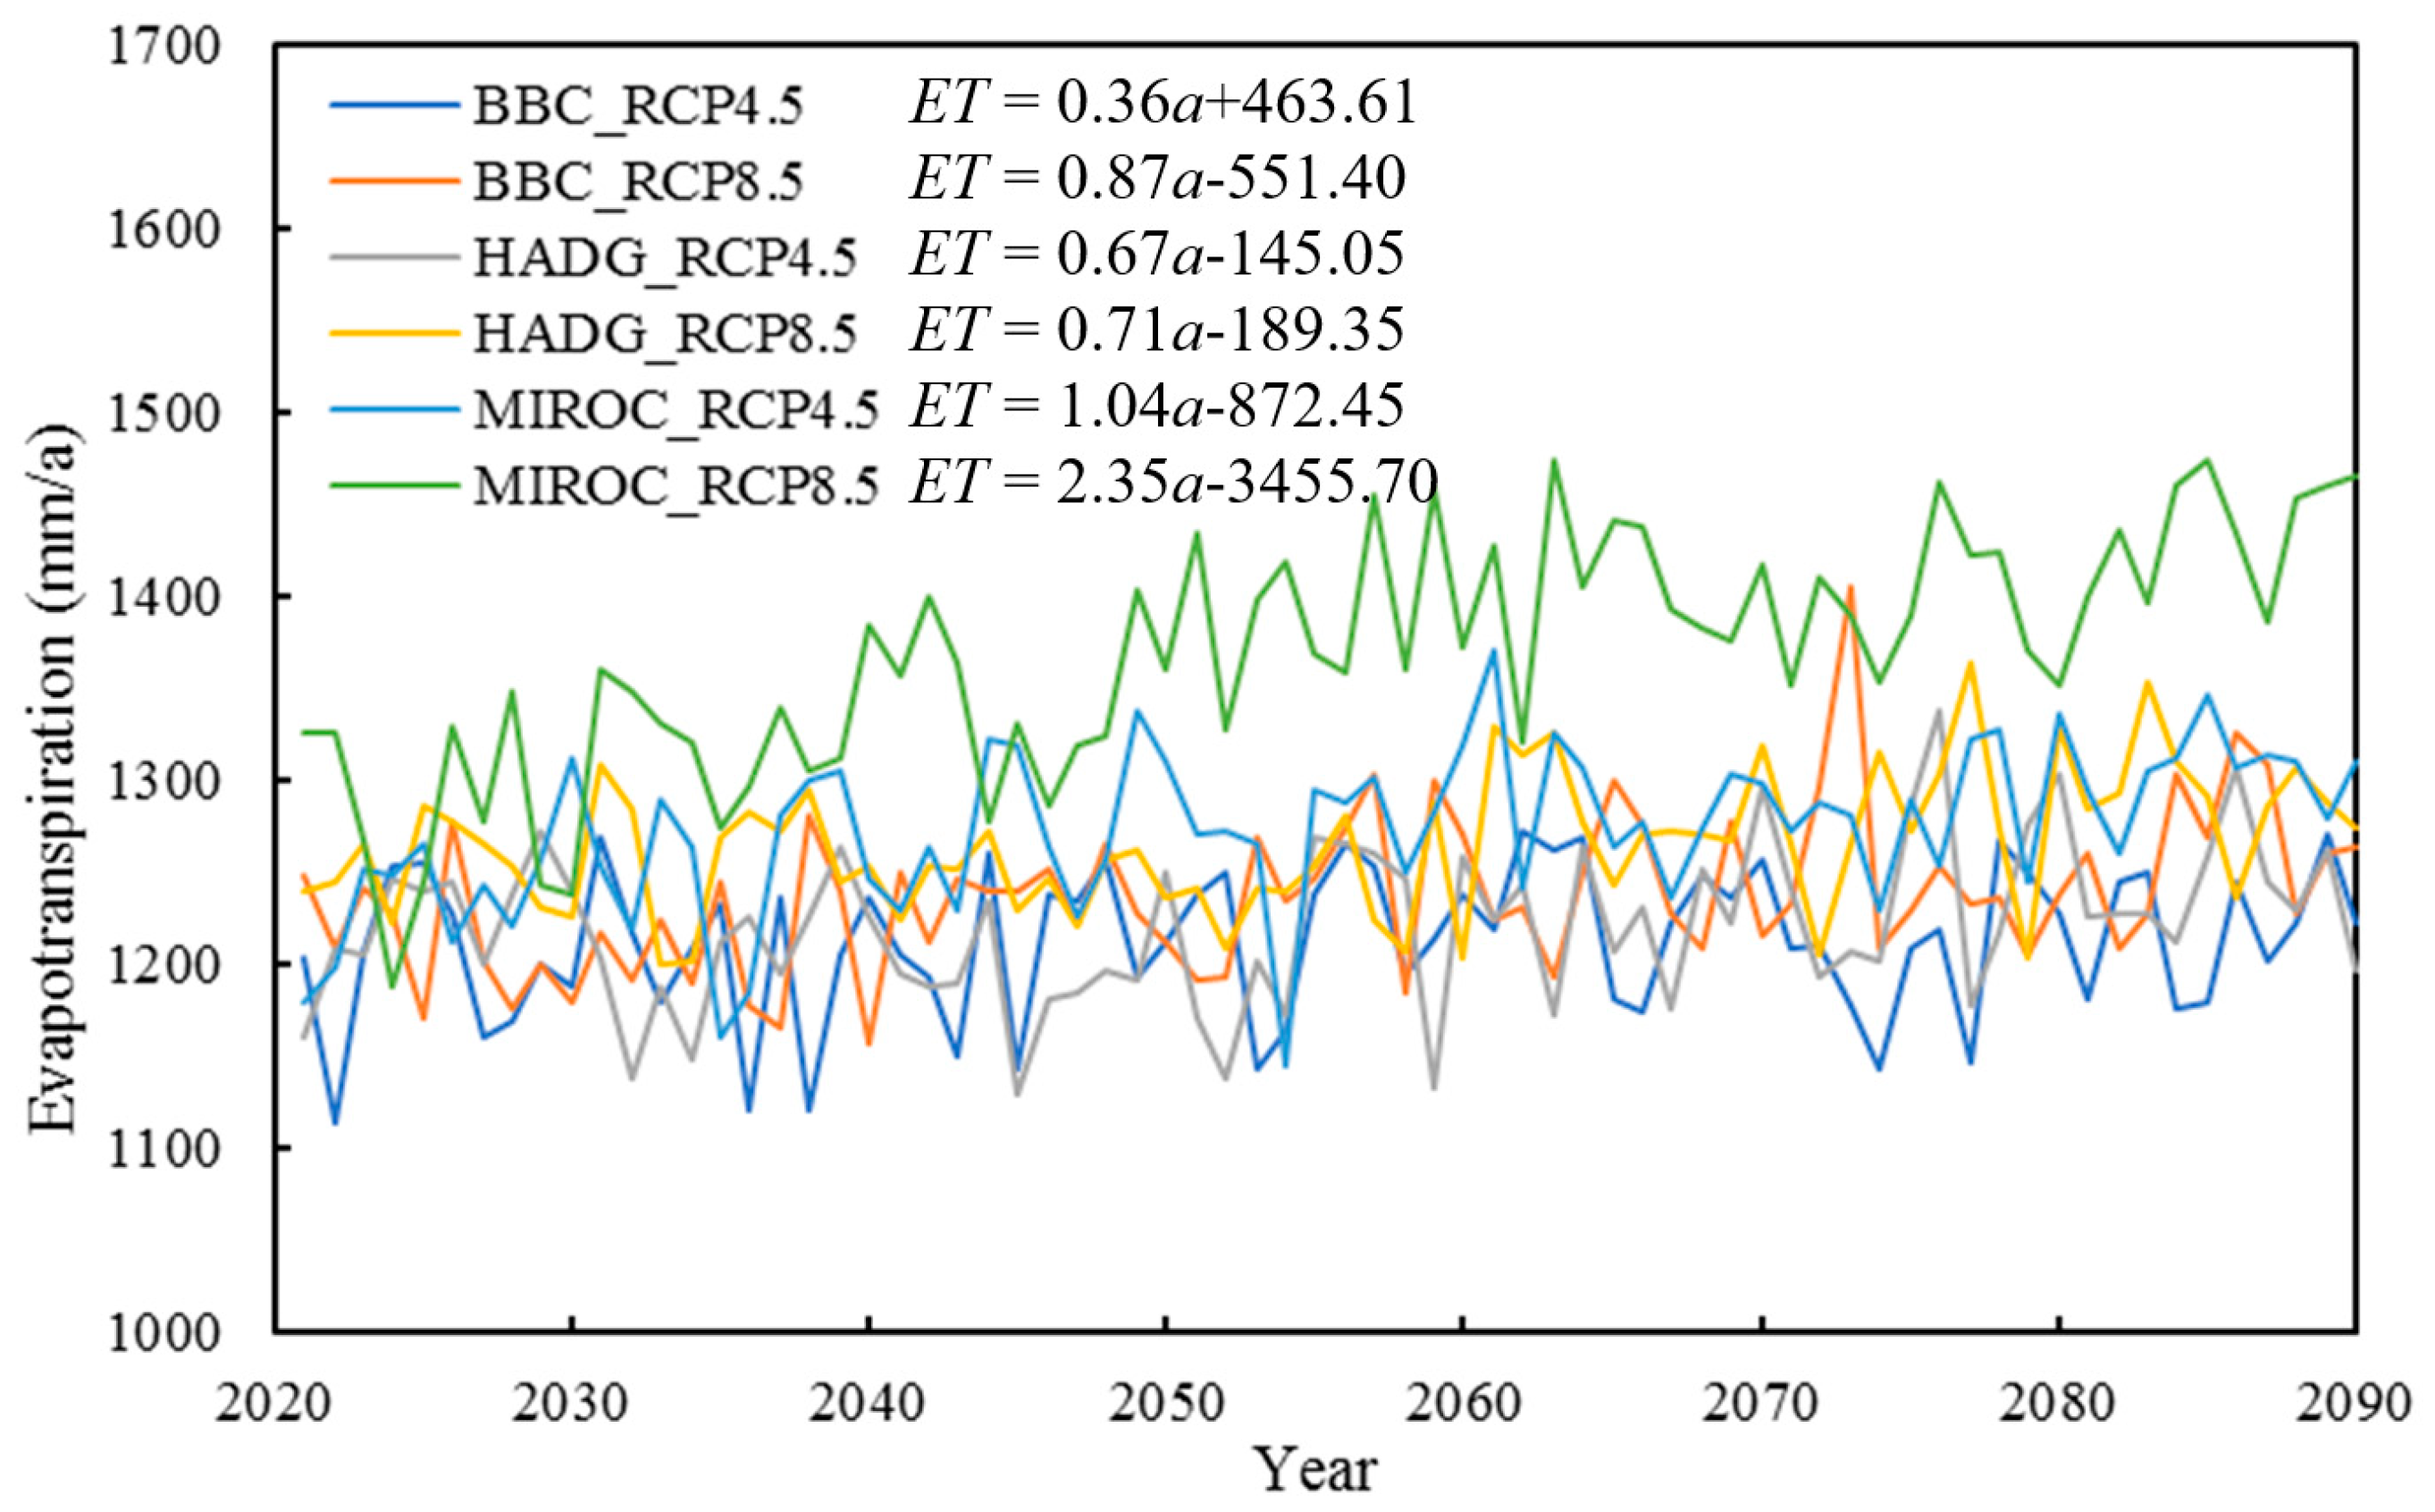
4.2. Prediction of Evapotranspiration

The trend of the evapotranspiration of Hotan Station under the six scenarios can be obtained using the Penman–Monteith model in 2020–2090 (Figure 5), according to the meteorological data of future climate prediction mentioned above. The results show that, in the future, the evapotranspiration will increase under the six scenarios. The increasing trend of MIROC_RCP8.5 is the strongest and the BBC_RCP4.5 is the slowest.
The variation ranges of the estimated evapotranspiration data in 2021–2030 and 2031–2040 are calculated, based on the estimated evapotranspiration data in the base period of 2011–2020 (Table 3). The evapotranspiration of all the scenarios increases in 2021–2030 compared that in 2011–2020 except BCC_RCP 4.5 in Hotan Oasis. While HADG_RCP 4.5 increases the most (2.36%). In addition, the values of all the scenarios increase in 2031–2040 compared with 2011–2020, except HADG_RCP 4.5, and the one with the highest increase is MIROC_RCP 8.5, at 3.80%.

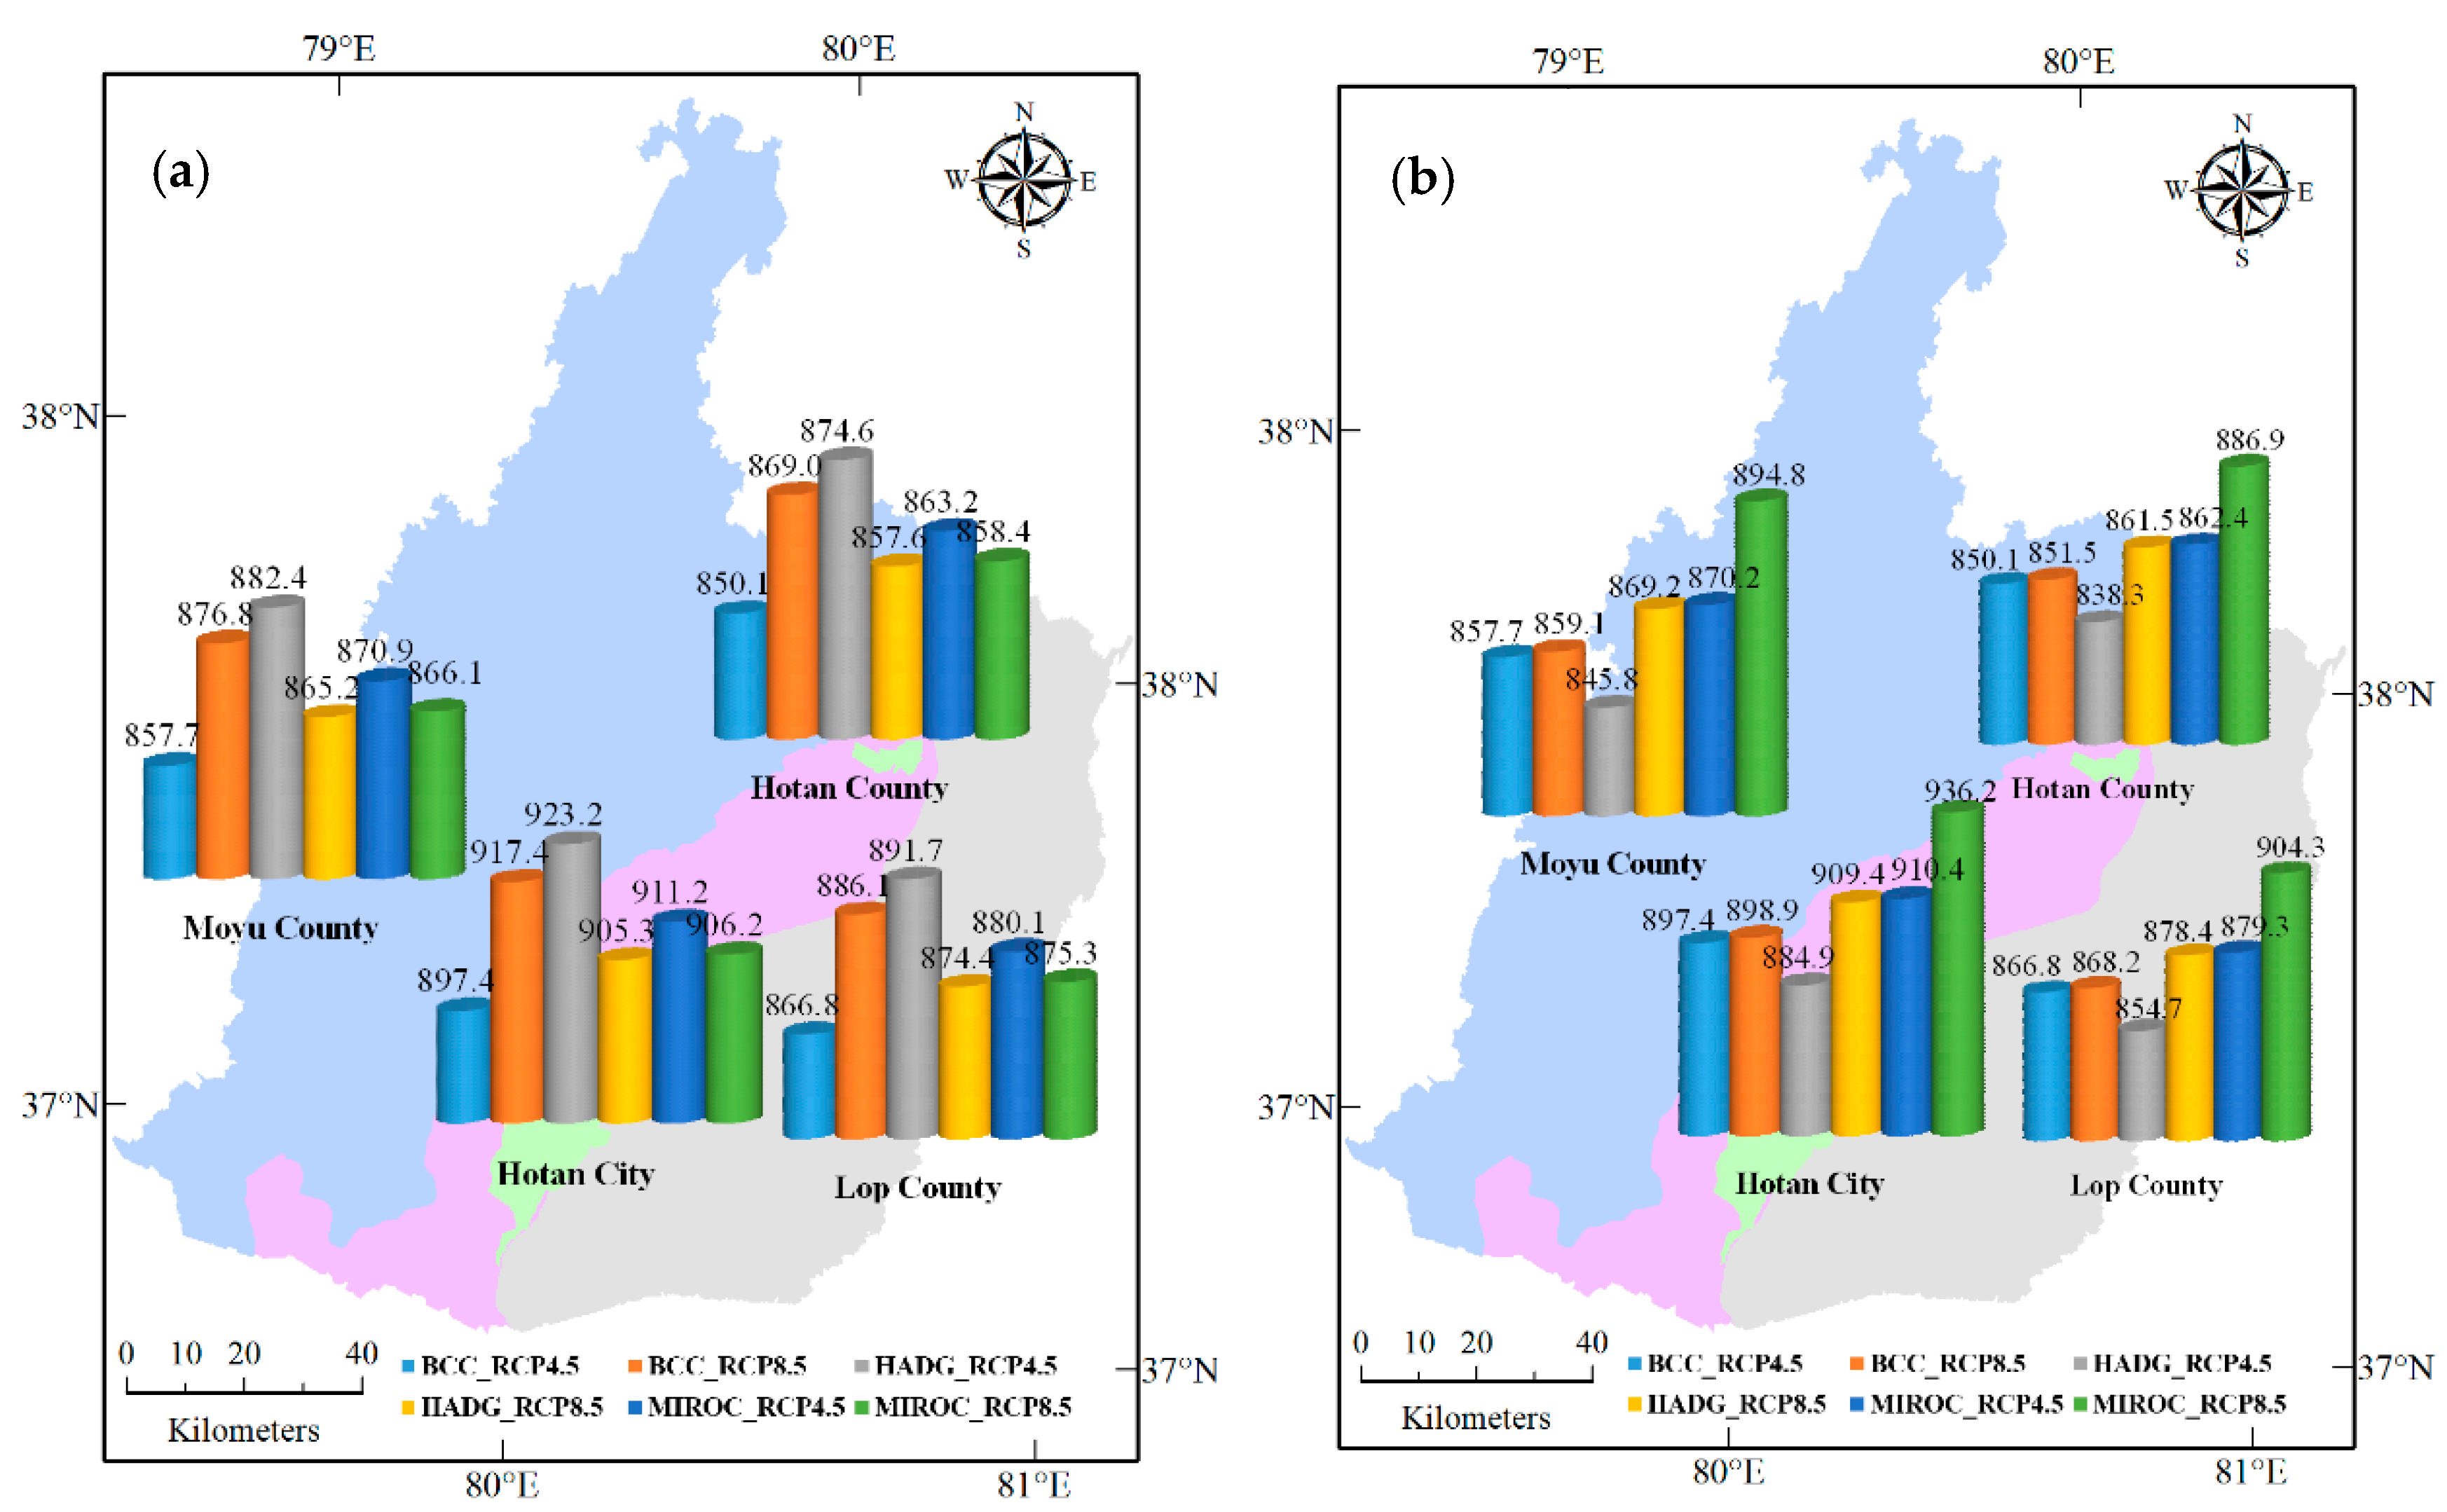
4.3. Spatial Pattern of Irrigation Demand

According to the previous studies [41,42], it can be concluded that q1 and q2 accounts for 34.67% of the irrigation demand in Hotan Oasis, so the proportion coefficient of evapotranspiration calculated by SEBS to irrigation demand is 65.32% (i.e., k = 65.32%). The dissipative hydrological model for Hotan Oasis [43] was used in previous studies, and every part of water consumption was calculated by the model. Hence, the average values of q1, q2 and Q were all calculated though the model based on the date of 2006–2009. According to the results in Section 4.1, the evapotranspiration of farm land in Hotan Oasis in 2015 was 866.75 mm. The irrigation demand of farm land in Hotan Oasis in 2015 was 1325.70 mm, according to Equation (3). The actual irrigation water demand of farmland in the Hotan area was 1302.85 mm in Xinjiang Water Resources Bulletin in 2015. The error between the two data can be calculated as 1.72%. Hence, the irrigation demand can be calculated from the regional evapotranspiration simulated by SEBS.
The spatial distribution of evapotranspiration in 2014 and 2016 was also simulated by SEBS in order to make the prediction more accurate. The average evapotranspiration of 2014–2016 in each region was used for predicating the irrigation demand. If the Irrigation Water Utilization Efficiency keeps constant, the annual spatial pattern irrigation demand in 2021–2030 and 2031–2040 can be estimated (Figure 6), according to the average evapotranspiration of 2014–2016 in each region in Hotan Oasis and the Equations (3)–(6). Figure 5 shows that the total annual irrigation demand in Hotan Oasis is the highest under the scenario of HADG_RCP 4.5 in 2021–2030, while that is MIROC_RCP 8.5 in 2031–2040. The annual irrigation demand of the Hotan City is higher, with 923.2, 936.2 mm/a in 2021–2030 and 2031–2040, respectively, while the other three regions (Hotan County, Moyu County and Luopu County) are lower under the six scenarios. Therefore, in Hotan Oasis, the annual spatial pattern irrigation demand was predicted to be high in the middle, low in the northwest and southeast under the six scenarios, in the future.

5. Discussion

A distributed hydrological model can be used to make the spatial pattern of agricultural water demand [44]. However, due to the special geographical environment in arid areas, the distributed hydrological model cannot be used. Hence, this study suggested a new method based on SEBS to address the previous problem. The annual evapotranspiration of the whole Hotan Oasis in 2015 was 866.04 mm calculated by SEBS model, which was close to that in another desert area [26]. The k coefficient was directly calculated, based on previous studies, in this study. The question of whether this coefficient can be obtained by statistical analysis of field experiments also needs further study. In addition, in this study, the county in Hotan Oasis is taken as the research object to study the pattern of irrigation demand. The pattern of irrigation demand in smaller regions such as towns can also be calculated using the suggested method.
The global climate change influence on Xinjiang has been obvious science the 1980s, where the temperature tread has been rising [45], while the trend of temperature was increased especially from the 21st Century in Hotan Oasis [46]. Therefore, the predictions of the evapotranspiration were very likely to happen, while some studies used the GCMs climate model data in Hotan Oasis [47].
In the past decades, the area of farm land in Hotan Oasis has always been increased [48], and the area of farm land will probably increase further with the enhancement of human activities, in the future. In addition, the irrigation demand will increase because of the increase in farm land area. At the same time, the future irrigation demand will also increase under the condition of climate change, according to this study. Therefore, the future agricultural water demand of the oasis will increase significantly. It is necessary for the government to formulate more stringent reclamation plans, as well as to construct more irrigation projects for improving Irrigation Water Utilization Efficiency.

6. Conclusions

The spatial pattern of irrigation demand in the six scenarios had been predicted using the SEBS model, based on the analysis of the spatial pattern of evapotranspiration in Hotan Oasis. The mean value of evapotranspiration in Hotan City was the highest, which was 901.94 mm/a, while the lowest was Hotan County with 854.41 mm/a in 2015. The evapotranspiration in Hotan Oasis showed an increasing trend in 2021–2040. The annual irrigation demand of the Hotan City is higher, with 923.2 and 936.2 mm/a in 2021–2030 and 2031–2040, respectively, while the irrigation demand in the other three regions is lower under the six scenarios. The annual irrigation demand showed a spatial pattern of high in the middle, low in the northwest and southeast under the six scenarios in 2021–2030 and 2031–2040. The results of this study can provide a suggestion of the water resources allocation in different regions for the government to protect water resources security in arid areas.

Author Contributions

Conceptualization, Shufang Wang and Liping Wang; Project administration, Shufang Wang and Xiyun Jiao; Software, Shufang Wang; Validation, Honghui Sang; Writing—original draft, Liping Wang and Shufang Wang; Writing—review and editing, Mohamed Khaled Salahou and Liudong Zhang. All authors have read and agreed to the published version of the manuscript.

Funding

This research was funded by Scientific Research Foundation of Yunnan Agr. Univ. (No. A2032002538), National Natural Science Foundation of China (No. 51669035) and National Key Research and Development Program of China (No. 2016YFC0400200).

Acknowledgments

The authors would like to express thanks for the support from our university.

Conflicts of Interest

The authors declare no conflict of interest.

References

  1. Uniyal, B.; Jha, M.K.; Verma, A.K. Assessing climate change impact on water balance components of a river basin using SWAT model. Water Resour. Manag. 2015, 29, 4767–4785. [Google Scholar] [CrossRef]
  2. Shrestha, N.K.; Du, X.; Wang, J. Assessing climate change impacts on fresh water resources of the Athabasca River Basin, Canada. Sci. Total Environ. 2017, 601, 425–440. [Google Scholar] [CrossRef] [PubMed]
  3. Lu, E.; Takle, E.S.; Manoj, J. The relationships between climatic and hydrological changes in the upper Mississippi River Basin: A SWAT and Multi-GCM study. J. Hydrometeorol. 2010, 11, 437–451. [Google Scholar] [CrossRef] [Green Version]
  4. Ficklin, D.L.; Barnhart, B.L. SWAT hydrologic model parameter uncertainty and its implications for hydroclimatic projections in snowmelt-dependent watersheds. J. Hydrol. 2014, 519, 2081–2090. [Google Scholar] [CrossRef] [Green Version]
  5. Zhang, X.; Xu, Y.; Fu, G. Uncertainties in SWAT extreme flow simulation under climate change. J. Hydrol. 2014, 515, 205–222. [Google Scholar] [CrossRef]
  6. Senent-Aparicio, J.; Perez-Sanchez, J.; Carrillo-Garcia, J.; Soto, J. Using SWAT and Fuzzy TOPSIS to assess the impact of climate change in the headwaters of the Segura River Basin (SE Spain). Water 2017, 9, 149. [Google Scholar] [CrossRef] [Green Version]
  7. Grusson, Y.; Anctil, F.; Sauvage, S.; Perez, J.M.S. Assessing the climatic and temporal transposability of the SWAT model across a large contrasted watershed. J. Hydrol. Eng. 2017, 22, 04017004. [Google Scholar] [CrossRef]
  8. Lopez-Carr, D.; Davis, J.; Jankowska, M.M.; Grant, L.; Lopez-Carr, A.C.; Clark, M. Space versus place in complex human-natural systems: Spatial and multi-level models of tropical land use and cover change (LUCC) in Guatemala. Ecol. Model. 2012, 229, 64–75. [Google Scholar] [CrossRef] [Green Version]
  9. Jiang, C.; Xiong, L.; Wang, D.; Liu, P.; Guo, S.; Xu, C. Separating the impacts of climate change and human activities on runoff using the Budyko-type equations with time-varying parameters. J. Hydrol. 2015, 522, 326–338. [Google Scholar] [CrossRef]
  10. Li, J.; Li, G.; Zhou, S.; Chen, F. Quantifying the effects of land surface change on annual runoff considering precipitation variability by SWAT. Water Resour. Manag. 2016, 30, 1071–1084. [Google Scholar] [CrossRef]
  11. Wang, Q.M.; Mei, X.R. Strategies for sustainable use of agricultural water resources in China. J. Agric. 2017, 7, 80–83. [Google Scholar]
  12. Yu, Y.; Huang, L.M.; Shen, B.; Maimaitiming, A.; Qin, S.Y.; Dai, Y.P. Current situation analysis of water consumption in Hotan River Basin. J. Water Resour. Water Engin. 2009, 20, 47–51. [Google Scholar]
  13. Liu, C.Y.; Zhao, J.; Liu, Y.Y.; Wei, W. Remote sensing estimation of evapotranspiration quantity and analysis of space-time structure over Shiyang River Basin. Remote Sens. Land Resour. 2011, 23, 117–122. [Google Scholar]
  14. Bahir, M.; Boulet, G.; Olioso, A.; Rivalland, V.; Gallego-Elvira, B.; Mira, M.; Rodriguez, J.; Jarlan, L.; Merlin, O. Evaluation and aggregation properties of thermal infra-red-based evapotranspiration algorithms from 100 m to the km scale over a semi-arid irrigated agricultural area. Remote Sens. 2017, 9, 1178. [Google Scholar] [CrossRef] [Green Version]
  15. Bastiaanssen, W.; Menenti, M.; Feddes, R.A.; Holtslag, A.A.M. A remote sensing surface energy balance algorithm for land (SEBAL)—1. Formulation. J. Hydrol. 1998, 212, 198–212. [Google Scholar] [CrossRef]
  16. Bastiaanssen, W.G.M.; Pelgrum, H.; Wang, J.; Ma, Y.; Moreno, J.F.; Roerink, G.J.; Val, T.V.D. A remote sensing surface energy balance algorithm for land (SEBAL)—2. Validation. J. Hydrol. 1998, 212, 213–229. [Google Scholar] [CrossRef]
  17. Su, Z. The Surface Energy Balance System (SEBS) for estimation of turbulent heat fluxes. Hydrol. Earth Syst. Sc. 2002, 6, 85–99. [Google Scholar] [CrossRef]
  18. Zhang, Y.; Zheng, J.H.; Liu, Z.H.; Yao, J.Q. Spatial and temporal distribution of evapotranspiration in the hutubi County based on Landsat8 data and SEBS model. Ecol. Sci. 2016, 35, 26–32. [Google Scholar]
  19. He, Y.B.; Wang, S.L. Regional evapotranspiration of different land covers based on remote sensing. Chin. J. Appl. Ecol. 2007, 18, 288–296. [Google Scholar]
  20. Losgedaragh, S.Z.; Rahimzadegan, M. Evaluation of SEBS, SEBAL, and METRIC models in estimation of the evaporation from the freshwater lakes (Case study: Amirkabir dam, Iran). J. Hydrol. 2018, 561, 523–531. [Google Scholar] [CrossRef]
  21. Liu, R.; Wen, J.; Wang, X.; Wang, Z. Validation of evapotranspiration and its long-term trends in the Yellow River source region. J. Water Clim. Chang. 2017, 8, 495–509. [Google Scholar] [CrossRef]
  22. Li, Y.; Huang, C.; Hou, J.; Gu, J.; Zhu, G.; Li, X. Mapping daily evapotranspiration based on spatiotemporal fusion of ASTER and MODIS images over irrigated agricultural areas in the Heihe River Basin, Northwest China. Agric. For. Meteorol. 2017, 244, 82–97. [Google Scholar] [CrossRef]
  23. Sun, G.; Hu, Z.; Sun, F.; Wang, J.; Xie, Z.; Lin, Y.; Huang, F. An analysis on the influence of spatial scales on sensible heat fluxes in the north Tibetan Plateau based on Eddy covariance and large aperture scintillometer data. Theor. Appl. Climatol. 2017, 129, 965–976. [Google Scholar] [CrossRef]
  24. Jin, X.; Guo, R.; Xia, W. Distribution of actual evapotranspiration over Qaidam Basin, an arid area in China. Remote Sens. 2013, 5, 6976–6996. [Google Scholar] [CrossRef] [Green Version]
  25. Chen, X.; Li, B.; Li, Q.; Li, J.; Abdulla, S. Spatio-temporal pattern and changes of evapotranspiration in arid Central Asia and Xinjiang of China. J. Arid Land 2012, 4, 105–112. [Google Scholar] [CrossRef] [Green Version]
  26. Yi, Z.Y.; Zhao, H.L.; Jiang, Y.Z.; Yan, H.W.; Cao, Y.; Huang, Y.Y.; Hao, Z. Daily evapotranspiration estimation at the field scale: Using the modified SEBS model and HJ-1 data in a Desert-Oasis Area, Northwestern China. Water 2018, 10, 640. [Google Scholar] [CrossRef] [Green Version]
  27. Muthuwatta, L.P.; Ahmad, M.; Bos, M.G.; Rientjes, T.H.M. Assessment of water availability and consumption in the Karkheh River Basin, Iran-Using remote sensing and Geo-statistics. Water Resour. Manag. 2010, 24, 459–484. [Google Scholar] [CrossRef] [Green Version]
  28. Alkhaier, F.; Su, Z.; Flerchinger, G.N. Reconnoitering the effect of shallow groundwater on land surface temperature and surface energy balance using MODIS and SEBS. Hydrol. Earth Syst. Sci. 2012, 16, 1833–1844. [Google Scholar] [CrossRef] [Green Version]
  29. Mahour, M.; Tolpekin, V.; Stein, A.; Sharifi, A. A comparison of two downscaling procedures to increase the spatial resolution of mapping actual evapotranspiration. ISPRS J. Photogramm. 2017, 126, 56–67. [Google Scholar] [CrossRef]
  30. Gibson, L.A.; Muench, Z.; Engelbrecht, J. Particular uncertainties encountered in using a pre-packaged SEBS model to derive evapotranspiration in a heterogeneous study area in South Africa. Hydrol. Earth Syst. Sci. 2011, 15, 295–310. [Google Scholar] [CrossRef] [Green Version]
  31. Li, B.F.; Chen, Y.N.; Li, W.H.; Chao, Z.C. Remote sensing and the SEBAL model for estimating evapotranspiration in the Tarim River. Acta Geogr. Sin. 2011, 66, 1230–1238. [Google Scholar]
  32. Zhuo, G.; La, B.; Pubu, C.; Luo, B. Study on daily surface evapotranspiration with SEBS in Tibet Autonomous Region. J. Geogr. Sci. 2014, 24, 113–128. [Google Scholar] [CrossRef]
  33. Chen, Y.M.; Guo, G.S.; Wang, G.X.; Kang, S.Z.; Luo, H.B.; Zhang, D.Z. Main Crop Water Requirement and Irrigation of China, 1st ed.; Water Resources and Electric Power Press: Beijing, China, 1995; pp. 103–375. [Google Scholar]
  34. Feng, X.X.; Qin, Z.D.; Zheng, X.Q.; Chen, J.F. Evapotranspiration estimation in the Liulin spring area based on SEBS model. J. Taiyuan Univ. Technol. 2014, 45, 259–264. [Google Scholar]
  35. Koutroulis, A.G.; Grillakis, M.G.; Tsanis, I.K.; Papadimitriou, L. Evaluation of precipitation and temperature simulation performance of the CMIP3 and CMIP5 historical experiments. Clim. Dynam. 2016, 47, 1881–1898. [Google Scholar] [CrossRef]
  36. Kharin, V.V.; Zwiers, F.W.; Zhang, X.; Wehner, M. Changes in temperature and precipitation extremes in the CMIP5 ensemble. Clim. Chang. 2013, 119, 345–357. [Google Scholar] [CrossRef]
  37. Palerme, C.; Genthon, C.; Claud, C.; Kay, J.E.; Wood, N.B.; L’Ecuyer, T. Evaluation of current and projected Antarctic precipitation in CMIP5 models. Clim. Dynam. 2017, 48, 225–239. [Google Scholar] [CrossRef] [Green Version]
  38. Lu, X.F.; Ren, C.Y.; Wang, Y.H.; Cui, F.Q.; Lu, X.T.; Gong, Z.J. Spatial difference characteristics on simulation capability of seasonal variation of air temperature simulated by three global climate models in China. Arid Land Geogr. 2018, 41, 972–983. [Google Scholar]
  39. Xu, C.; Xu, Y. Preliminary assessment of simulations of climate changes over china by CMIP5 Multi-Models. Atmos. Ocean. Sci. Lett. 2012, 5, 489–494. [Google Scholar]
  40. Li, H.; Sheffield, J.; Wood, E.F. Bias correction of monthly precipitation and temperature fields from Intergovernmental Panel on Climate Change AR4 models using equidistant quantile matching. J. Geophys. Res. Atmos. 2010, 115, D10101. [Google Scholar] [CrossRef]
  41. Zhao, C.S.; Huang, L.M.; Shen, B.; Lei, Z.D.; Hu, H.P.; Yang, S.X. The creation of the dissipative hydrological model for Hotan Oasis. J. Arid Land Resour. Environ. 2010, 24, 72–77. [Google Scholar]
  42. Bai, M. Improvement and Computer Realization of the Dissipative Hydrological Model for Hotan Oasis. Master’s Thesis, Xi’an University of Technology, Xi’an, China, 2011. [Google Scholar]
  43. Hu, H.P.; Tang, Q.H.; Lei, Z.D.; Yang, S.X. Runoff-evaporation hydrological model for arid platin oasis, 1, the model structure. Adv. Water Sci. 2004, 15, 140–145. [Google Scholar]
  44. Santhi, C.; Muttiah, R.S.; Arnold, J.G.; Srinivasan, R. A GIS-based regional planning tool for irrigation demand assessment and savings using SWAT. Trans. ASABE 2017, 48, 137–147. [Google Scholar] [CrossRef]
  45. Liu, W.; Xu, Y.P.; Huang, Y. Effects of global warming on precipitation and runoff volume in Xinjiang. Arid Land Geog. 2005, 28, 597–602. [Google Scholar]
  46. Wang, S.F.; Jiao, X.Y.; Wang, L.P.; Sang, H.H.; Salahou, M.K.; Maimaitiyiming, A. Assessing climate change impacts on water resources of the Hotan Oasis using SWAT Model, Northwest China. Fresen. Environ. Bull. 2019, 28, 1801–1810. [Google Scholar]
  47. Luo, M.; Meng, F.; Liu, T.; Duan, Y.; Frankl, A.; Kurban, A.; De Maeyer, P. Multi-model ensemble approaches to assessment of effects of local climate change on water resources of the Hotan River Basin in Xinjiang, China. Water 2017, 9, 548. [Google Scholar] [CrossRef]
  48. Chen, Z.S.; Chen, Y.N.; Li, H.W.; Zhao, R.F. Analysis on land use changes and their ecological effect in Hotan River Basin. J. Arid Land Resour. Environ. 2009, 23, 49–54. [Google Scholar]
Figure 1. The study area location.
Ijgi 09 00506 g001
Figure 2. Simulated and calculated daily evapotranspiration at Hotan station in 2015.
Ijgi 09 00506 g002
Figure 3. Spatial distribution of evapotranspiration in Hotan Oasis in 2015.
Ijgi 09 00506 g003
Figure 4. Spatial distribution of land use in Hotan Oasis in 2015.
Ijgi 09 00506 g004
Figure 5. The trend of the evapotranspiration of Hotan Station under the six scenarios.
Ijgi 09 00506 g005
Figure 6. The annual spatial pattern irrigation demand, in the future, (a) 2021–2030, (b) 2031–2040.
Ijgi 09 00506 g006
Table 1. Basic information on GCMs (General Circulation Models).
NumberGCMsSpatial ResolutionInstitution
1BCC_CSM1.12.7906° × 2.8125°National climate center (China)
2HadGEM2-ES1.875° × 1.24°Hadley Centre of the Met Office (UK)
3MIROC-ESM-CHEM2.7906° × 2.8125°Frontier Research Center for Global Change (Japan)
Table 2. The evapotranspiration of farm land in different regions in 2015.
NumberRegionArea (km2)Minimum Evapotranspiration (mm/a)Maximum Evapotranspiration (mm/a)Mean Value (mm/a)
1Hotan City237.55220.321250.65901.94
2Hotan County491.15150.581207.39854.41
3Lop County419.22132.101185.69871.16
4Moyu County881.94122.961186.36862.06
Table 3. The variation ranges of the estimated evapotranspiration data in 2021–2040.
Scenarios Base Period (mm/a)Variation Range (%)
2021–20302031–2040
BCC_RCP4.51203.95−0.50+0.41
BCC_RCP8.51192.38+1.71−0.34
HADG_RCP4.51197.16+2.36−1.89
HADG_RCP8.51246.09+0.37+0.83
MIROC_RCP4.51226.10+1.03+0.94
MIROC_RCP8.51272.70+0.47+3.80

