Mapping of Intrusive Complex on a Small Scale Using Multi-Source Remote Sensing Images


1
School of Earth Science, Zhejiang University, Hangzhou 310027, China
2
Zhejiang Provincial Key Laboratory of Urban Wetlands and Regional Change, Hangzhou Normal University, Hangzhou 311121, China
*
Author to whom correspondence should be addressed.
ISPRS Int. J. Geo-Inf. 2020, 9(9), 543; https://0-doi-org.brum.beds.ac.uk/10.3390/ijgi9090543
Submission received: 8 August 2020
/
Revised: 4 September 2020
/
Accepted: 9 September 2020
/
Published: 10 September 2020
Abstract
:Multi-stage intrusive complex mapping plays an important role in regional mineralization research. The similarity of lithology characteristics between different stages of intrusions necessitates the use of richer spectral bands, while higher spatial resolution is also essential in small-scale research. In this paper, a multi-source remote sensing data application method was proposed. This method includes a spectral synergy process based on statistical regression and a fusion process using Gram–Schmidt (GS) spectral sharpening. We applied the method with Gaofen-2 (GF2), Sentinel-2, and Advanced Spaceborne Thermal Emission and Reflection Radiometer (ASTER) data to the mapping of the Mountain Sanfeng intrusive complex in northwest China in which Carboniferous intrusions have been proven to be directly related to the formation of Au deposits in the area. The band ratio (BR) and relative absorption band depth (RBD) were employed to enhance the spectral differences between two stage intrusions, and the Red-Green-Blue (RGB) false colour of the BR and RBD enhancement images performed well in the west and centre. Excellent enhancement results were obtained by making full use of all bands of the synergistic image and using the Band Ratio Matrix (BRM)-Principal Component Analysis (PCA) method in the northeast part of the study area. A crucial improvement in enhancement performance by the GS fusion process and spectral synergy process was thus shown. An accurate mapping result was obtained at the Mountain Sanfeng intrusive complex. This method could support small-scale regional geological survey and mineralization research in this region.
1. Introduction
Multi-stage intrusive phases and hydrothermal fluid-related processes are important conditions for the formation of a variety of endogenetic deposits [1,2]. The spatial distribution characteristics of intrusions are usually closely related to regional endogenetic minerals, so successful mapping of different stage intrusions is useful for regional metallogenic research. Due to electronic and vibrational processes, rocks and minerals may express different spectral reflection characteristics in the 400–2500 nm wavelength region [3,4,5]; therefore, remote sensing has been extensively used for geological mapping [6,7,8].
Accurate interpretation of intermediate acid intrusive complexes has always been one of the difficulties in geological remote sensing. Satellite remote sensing is not considered to be readily applicable to the mapping of igneous sequences, because in such rocks, lithological contacts are less predictable and spectral features are less defined [9]. This task may require richer spectral bands in the visible/near infrared (VNIR) and short-wave infrared (SWIR) wavelength regions (Spaceborne thermal infrared sensors may lack of spatial resolution). The Advanced Spaceborne Thermal Emission and Reflection Radiometer (ASTER) has been frequently used in the geology community because of the suitable spectral setting [10,11,12,13,14], especially the bands in SWIR region, which are effective for the distinction of granitoids with very similar silica contents by secondary effects related to hydrothermal and surface alterations. Recently Sentinel-2′s potential for use in geological applications was proved [15,16], and its four narrow bands in the VNIR region were shown to bring effective spectral information to ferric and ferrous iron. However, the spatial resolution of these satellite remote sensed images is not satisfactory for small-scale applications. High spatial resolution datasets such as QuickBird [17], WorldView [18,19], Systeme Probatoire d’Observation de la Terre (SPOT) [20] and Chinese Gaofen (GF) [21] can be used to illustrate the boundaries of landmarks better, and their VNIR bands are sensitive to spectral characteristics related to electronic processes. However, such datasets mostly lack SWIR bands. Although WorldView-3 data are available and satisfactory, the cost is very high, especially in regions with no historical data records.
Image fusion has been a significant method to combine spatial and spectral information of panchromatic (PAN) and multispectral (MS) remote sensing data [22]. In the geological remote sensing community, image fusion methods are also widely used to produce an ideal dataset with high spatial resolution and the required spectral bands. Landsat series or ASTER MS data were pan sharpened with IRS to help geologists find the lithological boundary more easily [23,24]. ASTER MS data were fused with QuickBird PAN in order to obtain higher spatial resolution, which has been proven effective for extracting alteration information [2]. Due to the lower cost than commonly used high spatial resolution data (e.g., WorldView and QuickBird), the Gaofen (GF) series of China were also used in fusion with ASTER or Landsat in the geological community [21], especially among Chinese researchers (probably because they can request GF data for free). Since the GF-2, which has a spatial resolution of 1 m, started distributing its data, several researchers have focused on fusing GF-2 PAN with MS images. When fusing GF2 PAN with MS itself, Zhang et al. showed that Nearest Neighbor Diffusion (NNDiffuse) based pan sharpening performed the best in visible light bands, while the Gram–Schmidt method was better in the near-infrared band [25]. Studies on fusing GF2 PAN with other MS images (e.g., GF-5 in [26] and GF-4 and Landsat-8 Operational Land Imager (OLI) in [27]) have been published successively. As mentioned by Ghassemian [22], pixel-level fusion methods are usually divided into four categories: (1) component substitution (CS), (2) multiresolution analysis (MRS), (3) hybrid and (4) model based. The first and second methods are those more commonly used in the geological remote sensing community because they are fast and easy to implement.
Indeed, image fusion solves the contradiction between spatial and spectral resolution of a single sensor. However, different sensors may have spectral bands at different wavelength positions, and sometimes, they are useful for mapping an intrusive complex. These kinds of bands in different sensors may be inconsistent in terms of their spectral responses. This paper presents an effective method that can be used to obtain intrusive complex mapping results by using multi-source satellite remote sensing data. The Mountain Sanfeng Region, which lies in the key metallogenic belts in western China was taken as the study area. Alteration extracting and lithological mapping research in and near the study area were recently published by Sun et al. [28] and Ye et al. [29], both of which employed WorldView-3 data because of its SWIR bands and high spatial resolution [29]. Chinese GF-2, Sentinel-2 and ASTER data were used to evaluate the synergy of the multi-source remote sensing method proposed by this paper in enhancing spectral differences between different stage intrusions and mapping the intrusive complex.
2. Study Area and Geological Setting
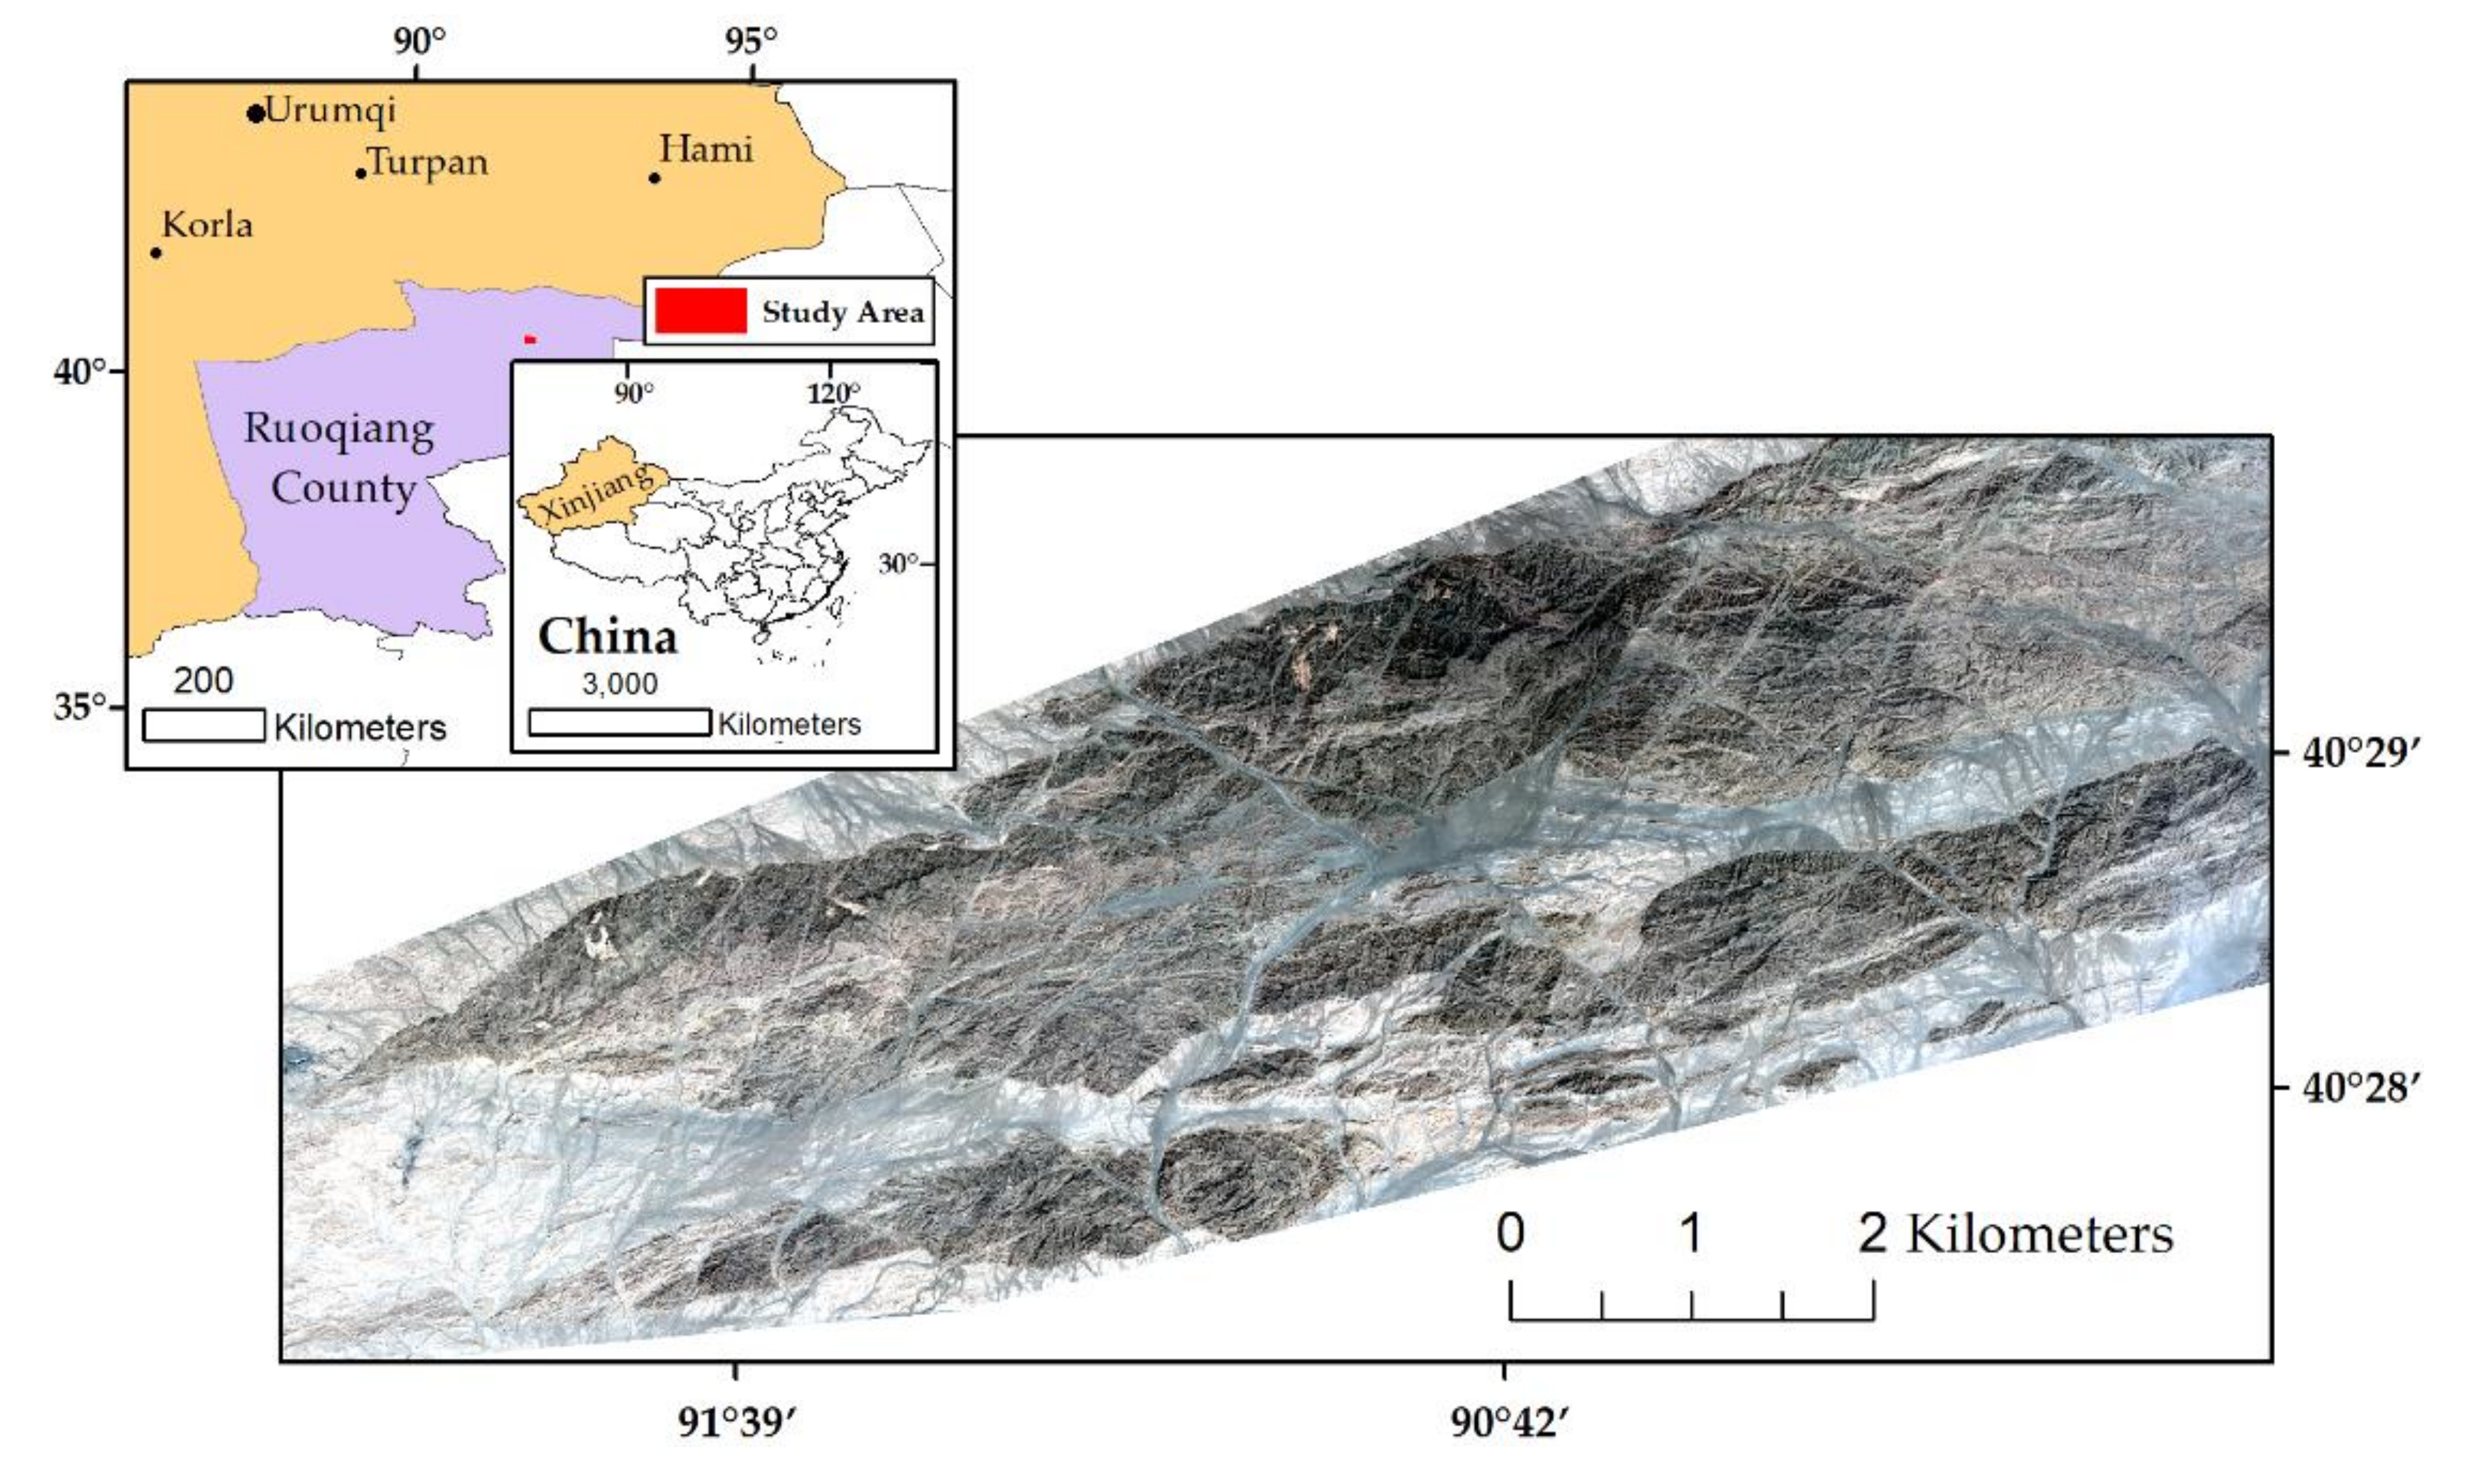
The Mountain Sanfeng intrusive complex is located southwest of the Beishan Mountains, SE of the Xinjiang Uygur Autonomous Region of China. It lies between 40°27′ and 40°30′ north latitude and 91°37′ and 91°45′ east longitude (Figure 1). The Beishan area is a metallogenic belt which lies in southern margin of Central Asia orogenic Belt and northeastern margin of Tarim Basin [30]. The landforms in the study area are mainly middle–low mountains and saline–alkali plains, with Kiziltag to the north and the Lop Nur depression to the south. The precipitation level is very low, and vegetation is scarce so the area is suitable for the application of satellite remote sensing images for geological research.
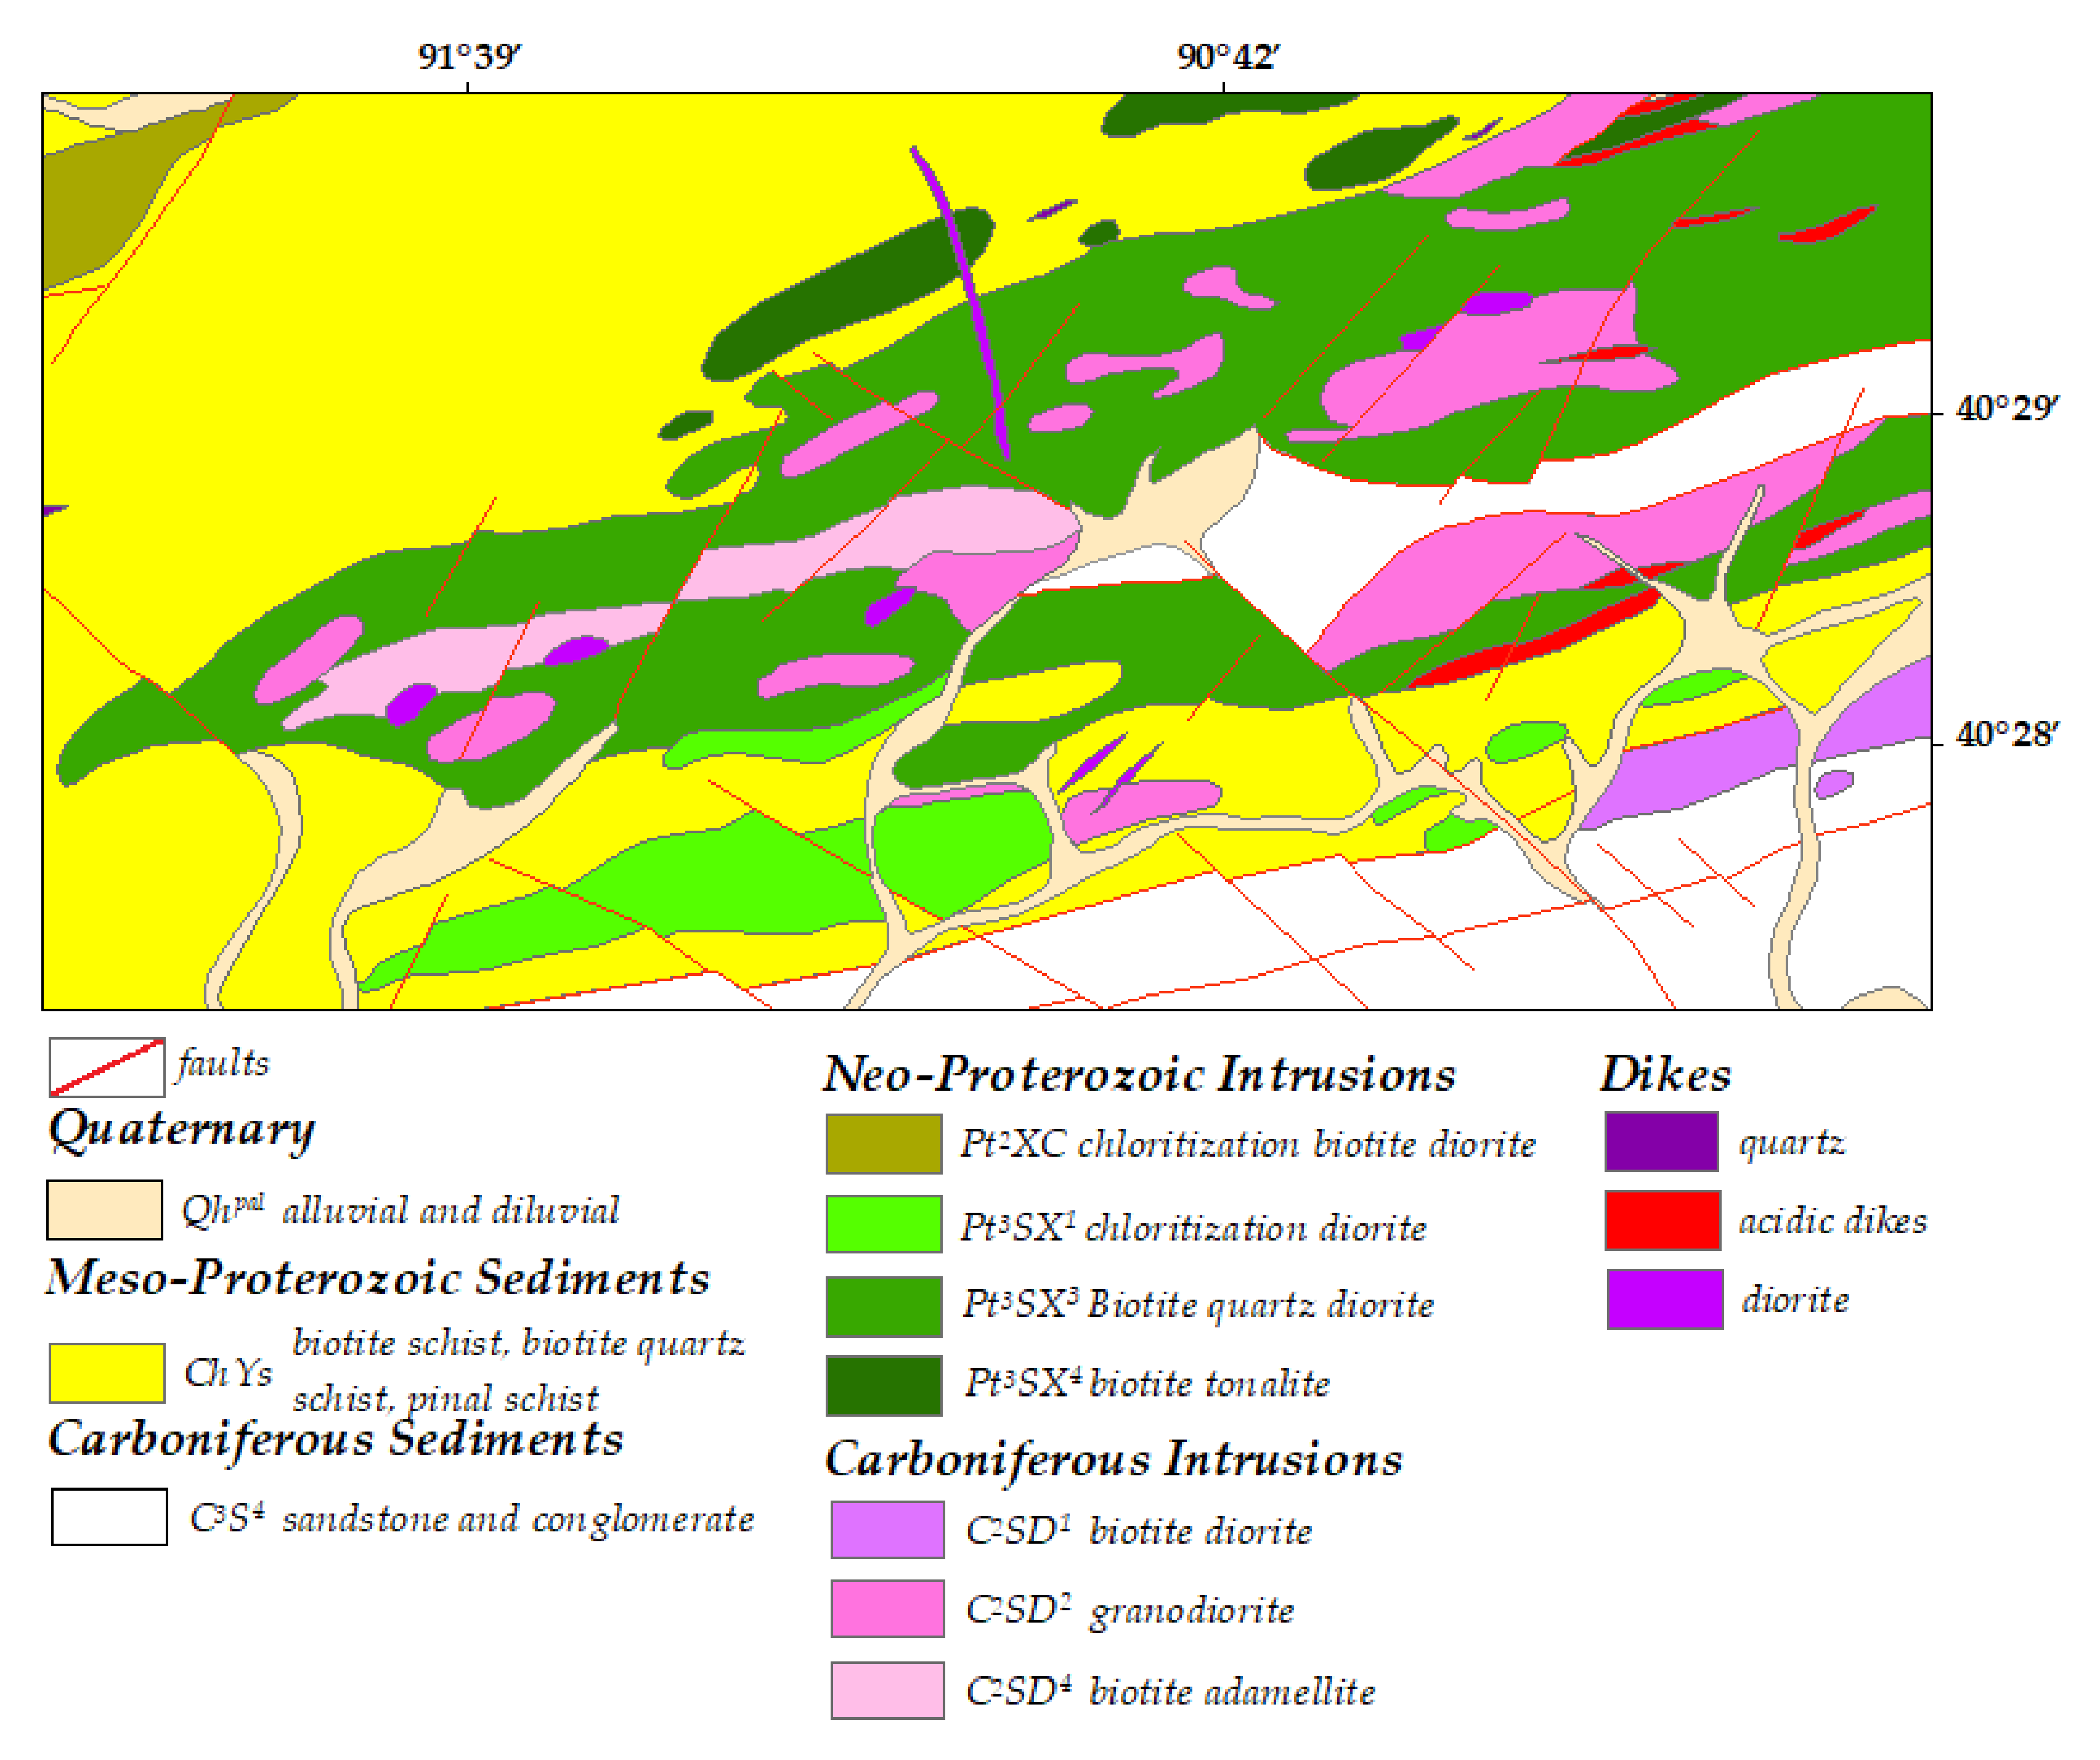
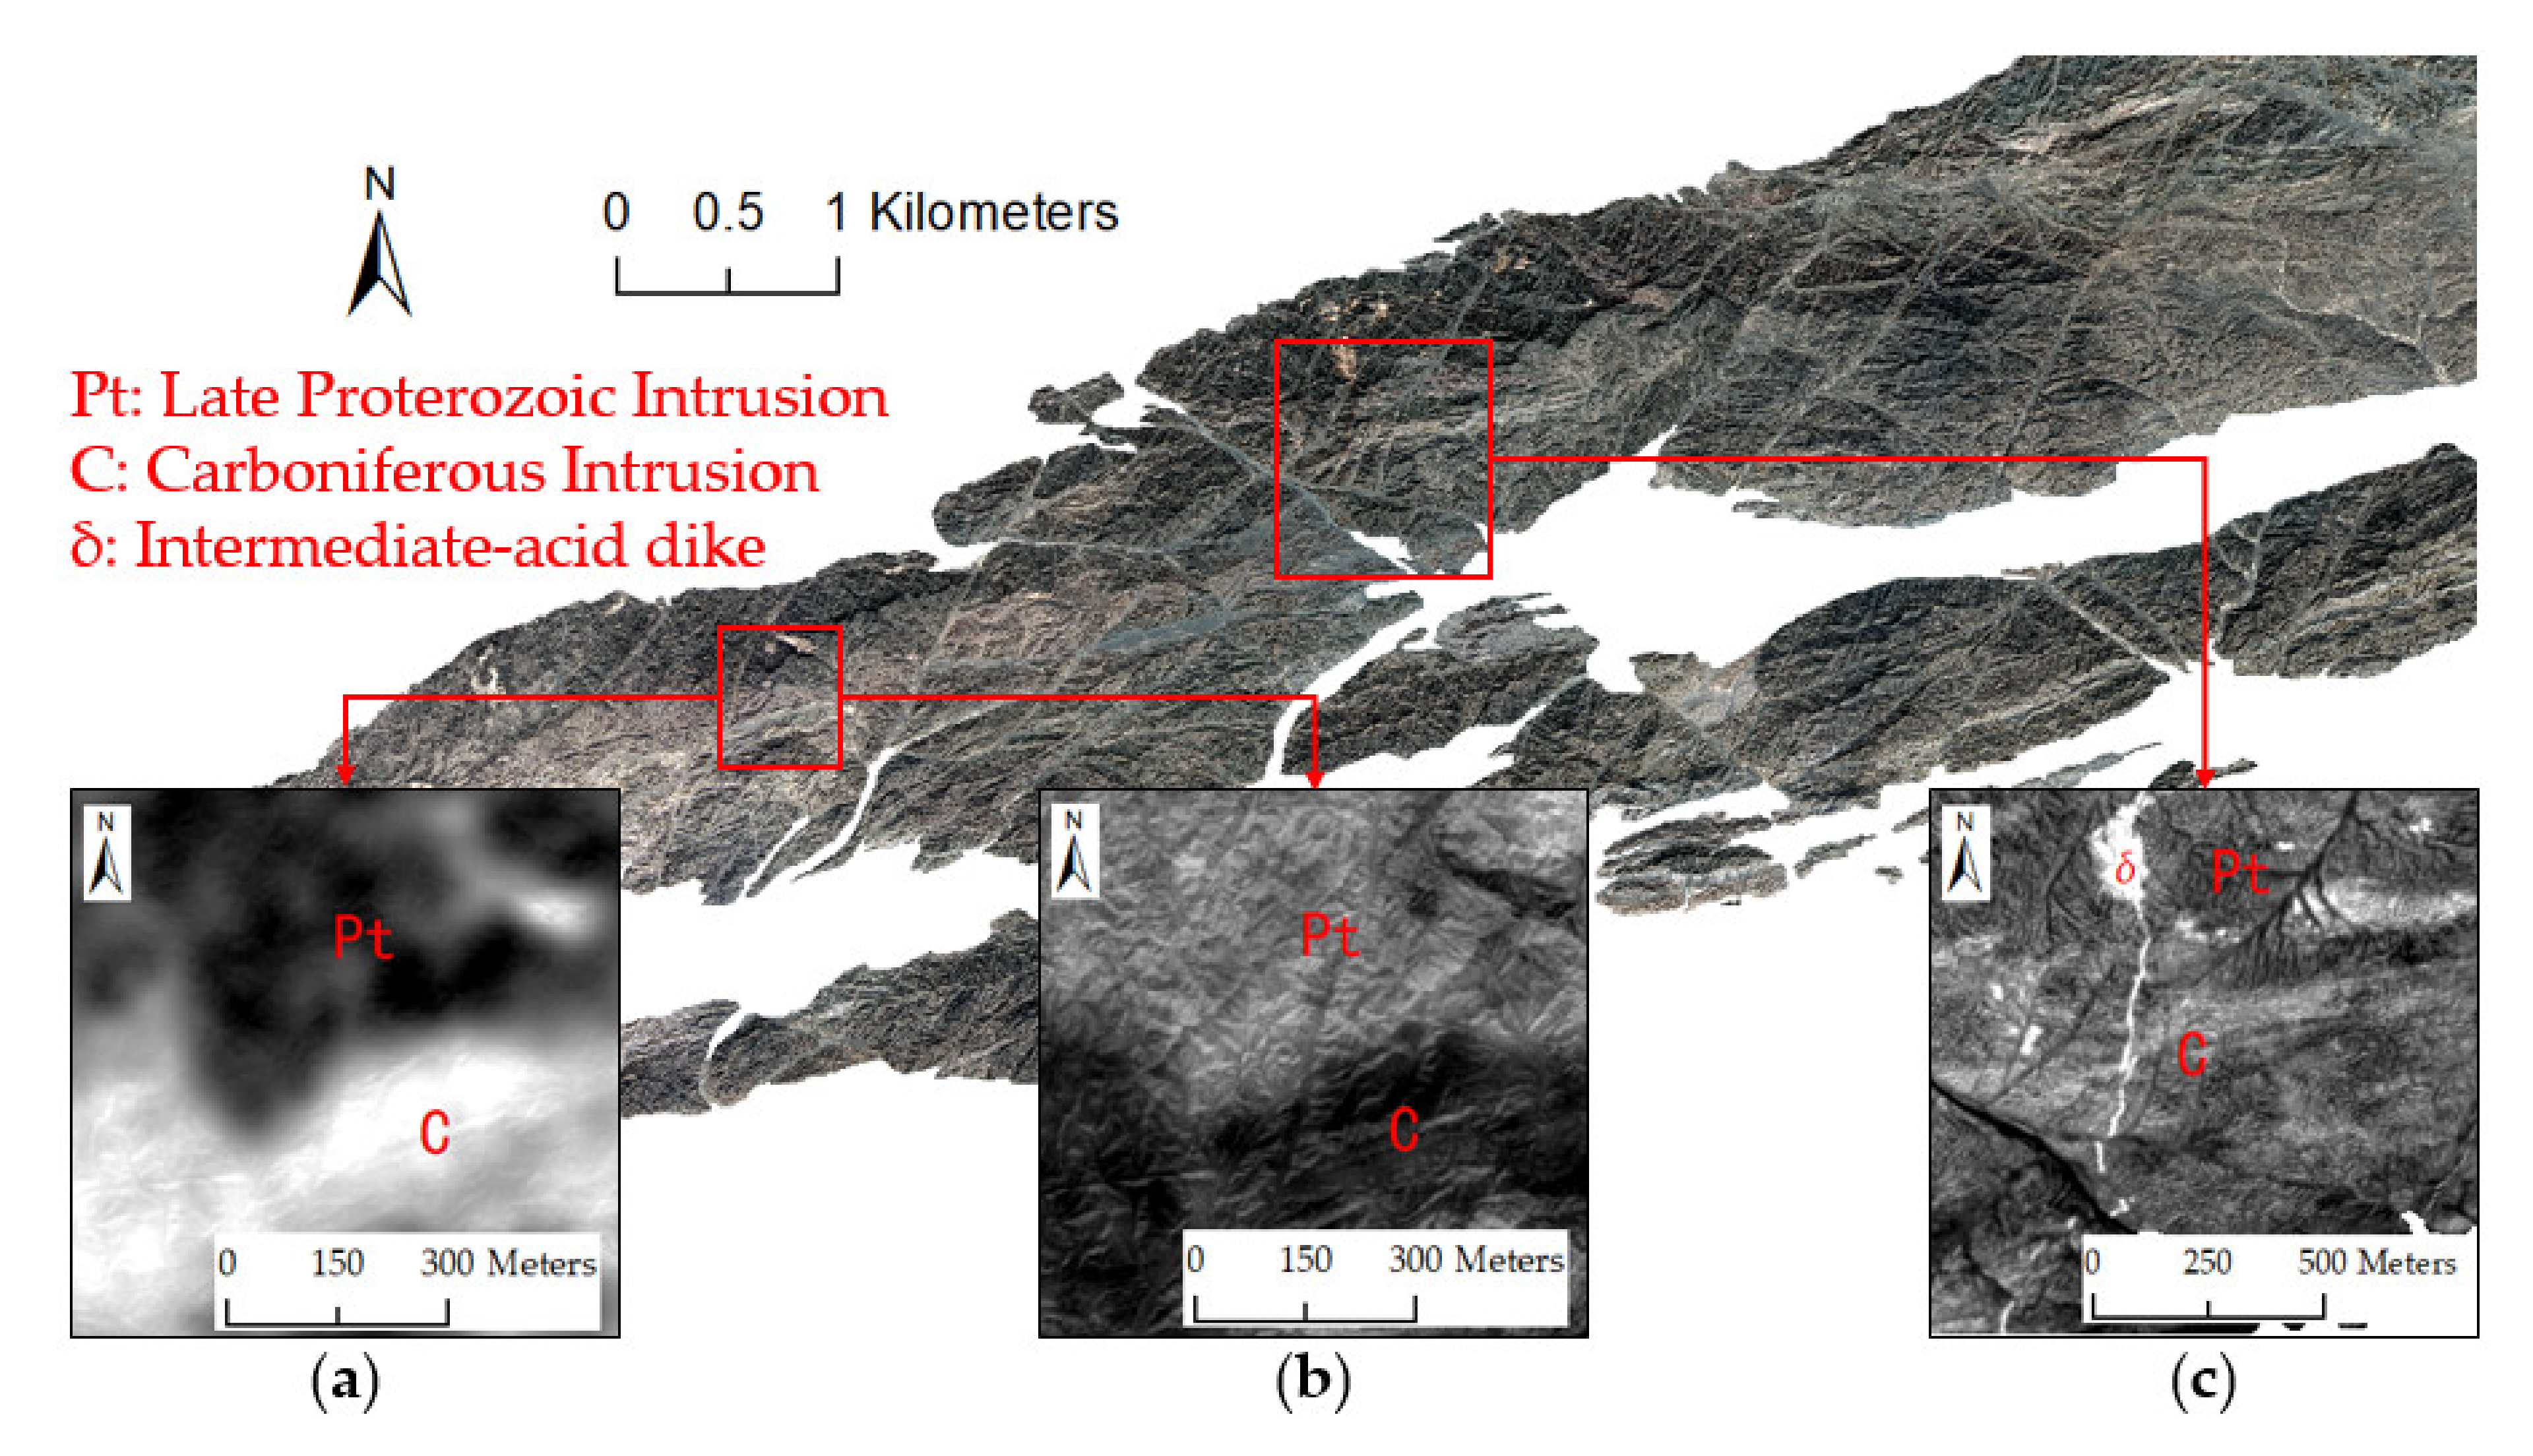
Figure 2 shows a geological map of study area. Intrusion is very active in this area. Multi-stage magmatic activities occurred in this region and controlled by the regional tectonics [28]. There are two main stages of magmatic intrusions in the intrusive complex, which are well exposed. The Late Proterozoic intrusive diorite forms the most widely exposed intrusive masses in the region, which are intruded by Carboniferous granite and granodiorite. The intrusive rocks in both stages are intermediate–acidic, and the Late Proterozoic intrusive rocks are more intermediate. Dikes of quartz, syenite, granite, and diorite occur locally. Feldspars in Carboniferous intrusive rocks have obvious sericite alterations, while the dark mineral content in Late Proterozoic intrusive rocks (such as biotite and amphibole) is relatively higher. Notably, the rock samples of the Carboniferous intrusion have been proven to show an Au anomaly [31], so the magmatic activity in this stage may be directly related to the formation of Au deposits in the area.
3. Materials and Method
3.1. Data
In order to find an effective and economical way to map the intrusive complex, we chose three types of satellite remote sensing data: Chinese GF-2, Sentinel-2 and ASTER.
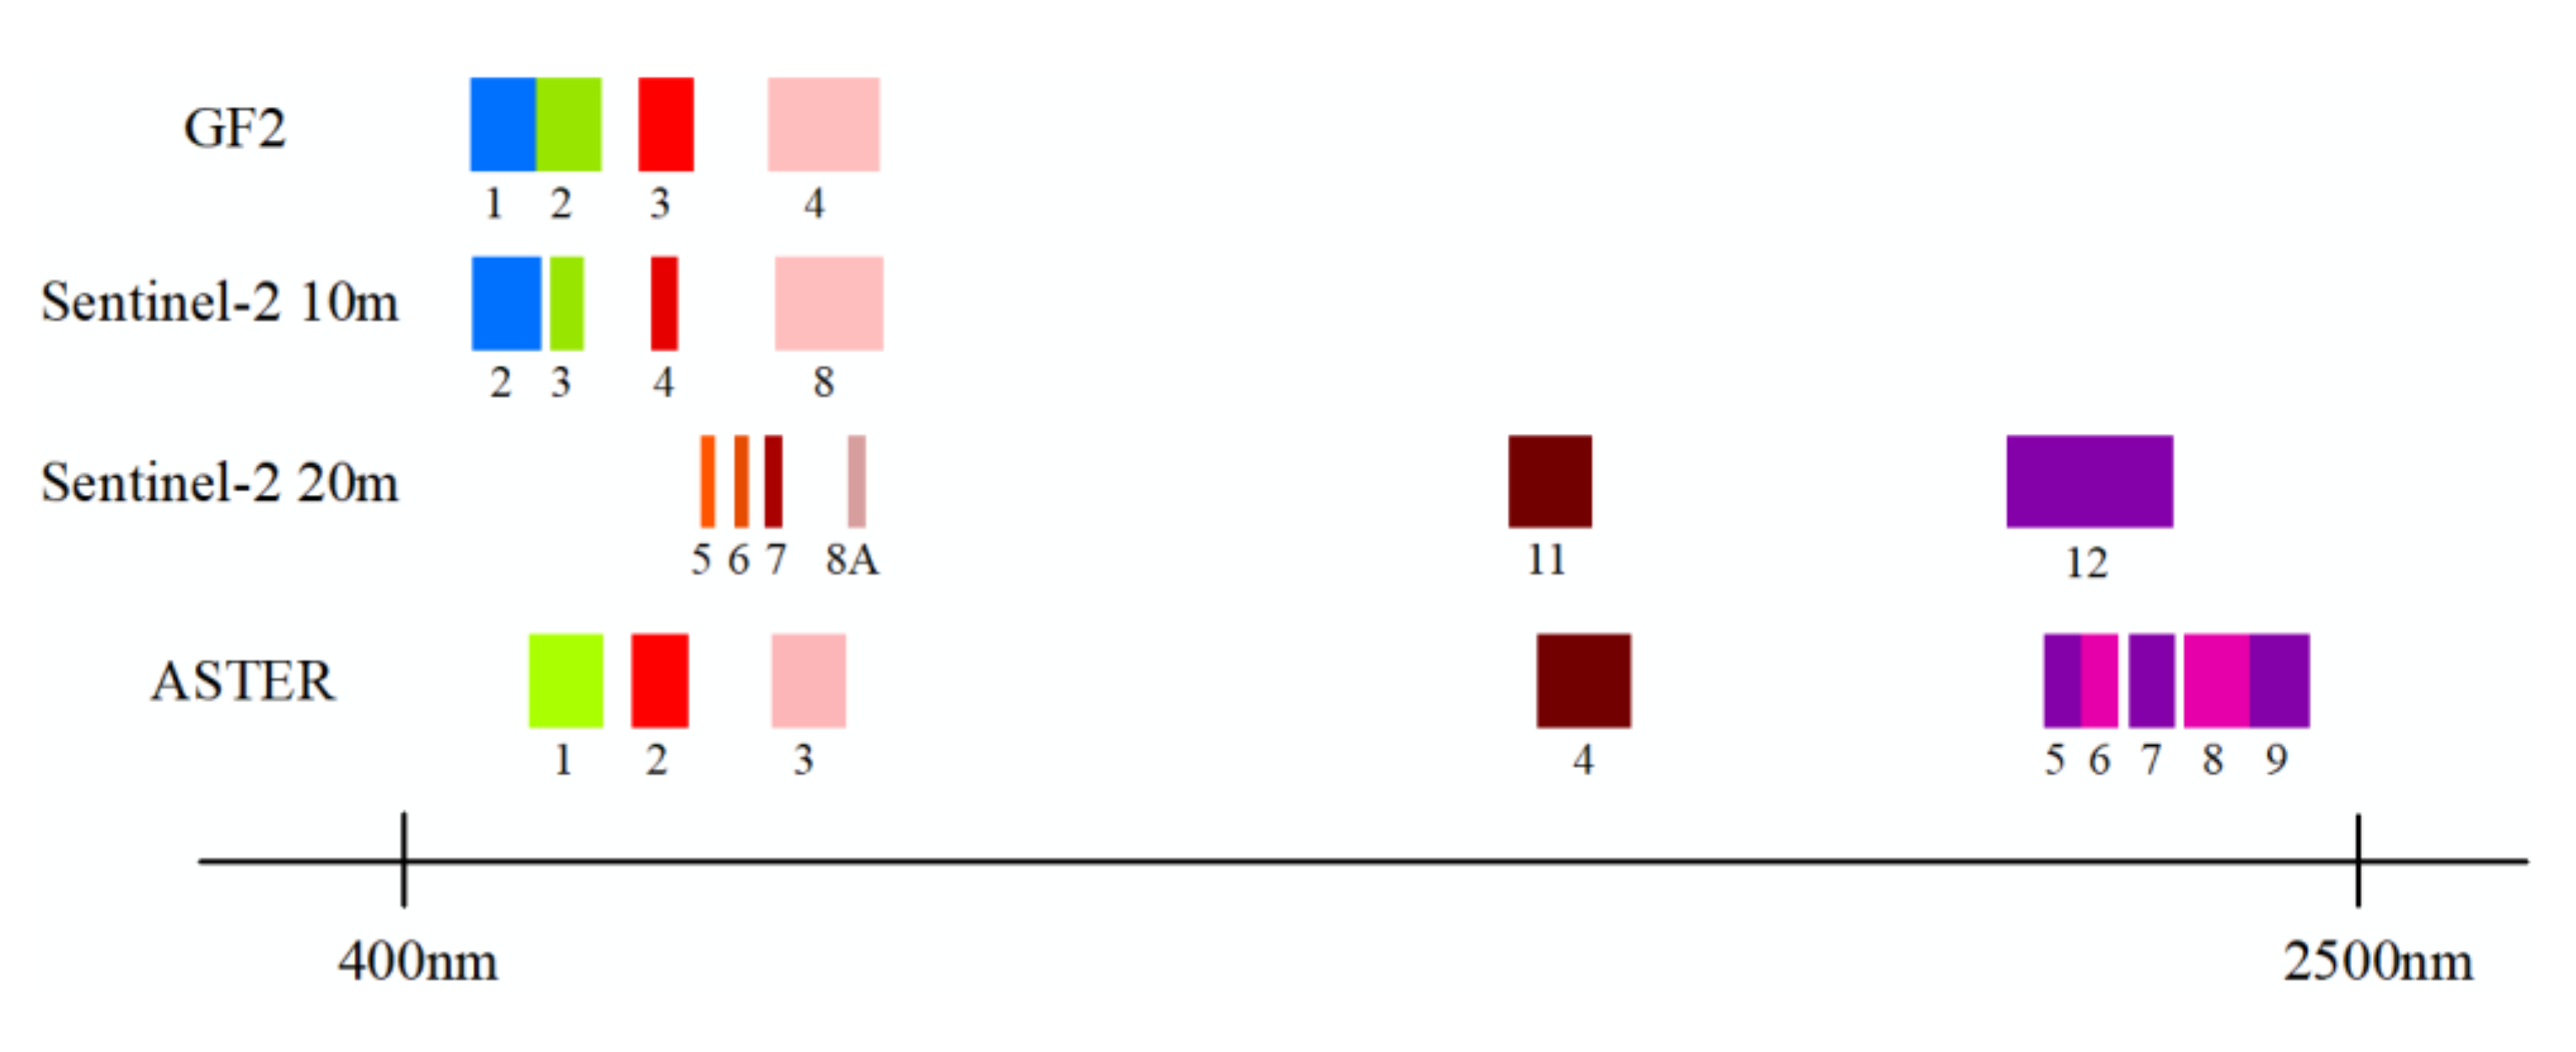
The Chinese GF-2 satellite, launched by the Chinese government in August 2014, was the first high resolution earth observation program to reach a spatial resolution of 1 m in China. It provides data with 4 multispectral (MS) bands in the VNIR at a spatial resolution of 4 m and a panchromatic (PAN) band of 1 m. ASTER, with MS bands in the VNIR, SWIR, and Thermal infrared (TIR) at spatial resolutions of 15, 30, and 90 m respectively, is a type of data that is widely used in geological remote sensing research. Its parameters have been discussed in detail in many previous studies such as that by Rowan and Mars (2003). The European Commission (EC) and the European Space Agency (ESA) established the European Earth Observation programme Copernicus, which launched a set of satellite missions: Sentinel 1 up to 5. Sentinel-2 provides data with a moderately large band set (13 spectral bands) with different levels of spatial resolution. A comparison of GF-2, Sentinel-2, and ASTER bands is shown in Figure 3.
Table 1 shows the characteristics of the three sensors applied in this paper, including the revisit time, spectral band settings and spatial resolution information. As the well-documented spectral absorption features of minerals [3,4,5], electronic spectral absorption caused by ferric and ferrous in iron- bearing minerals can be detected by the GF2 MS bands, and narrow bands in the VNIR of Sentinel-2 can be useful (e.g., Band 6 mentioned by de Lucia Lobo et al. [32] and Band 8a mentioned by Hu et al. [33]). The ASTER SWIR bands can resolve the Al-OH or Mg-OH molecular spectral absorption features associated with sericite, biotite, epidote and chlorite in hydrothermally altered granites [12,13,14]. Such minerals may be essential for mapping intrusive complexes with granitoids of similar silica content. A satisfactory dataset resulting from the synergy process discussed in the subsequent section of this paper would include the same spectral band setting as all of the GF2 bands, the Sentinel-2 bands 5/6/7/8A, and the ASTER SWIR bands.
GF-2 level 1A data in this study were acquired on 17 September 2015, while ASTER level 1B and Sentinel-2 level 1C data were acquired on 13 May 2002 and 15 May 2019, respectively. All data collected from the study area were georeferenced to UTM zone 46 North and rectified with WGS-84 datum. GF-2 and ASTER data underwent radiation calibration and orthorectification. Note that the crosstalk effect caused by signal leakage from ASTER Band 4 to other SWIR band detectors was corrected using crosstalk correction software [34]. Atmospheric correction was done by Fast Line-of-sight Atmospheric Analysis of Spectral Hypercubes module (FLAASH). The processing of GF-2 and ASTER was done with ENVI 5.3 software, while the pre-processing of Sentinel-2 data was done with the Sen2Cor module using Sentinel Application Platform (SNAP) software provided by ESA automatically. Because the study of this paper focused on a small scale and one single scene of each sensor could cover the whole study area, a mosaicking process was unnecessary. After pre-processing, relative geometric registration was done to ensure the consistency of the relative pixel positions of the three datasets.
3.2. Synergy of Multi-Source Remote Sensing Data
The synergy of the multi-source remote sensing data process method includes two steps: (1) spectral synergy based on statistical regression was done firstly in order to make the surface reflectance of different sensors have a consistent spectral response; (2) image fusion of the MS bands and PAN band was carried out next in order to improve the spatial resolution of each remote sensing data band.
3.2.1. Spectral Synergy Process
Different remote sensors may have spectral bands at similar wavelength positions (e.g., ASTER Band 1/2/3, GF2 Band 2/3/4 and Sentinel-2 Band 3/4/8, BSW), and bands at different wavelength positions (BDW) may exist (e.g., GF2 Band 1 and Sentinel-2 5/6/7/8a). Due to the diverse radiometric resolution (e.g., the ASTER dataset is 8 bit while the GF2 dataset is 16 bit) and inevitable calculation error during preprocessing, the surface reflectance of different types of sensor data may be inconsistent in the spectral response.
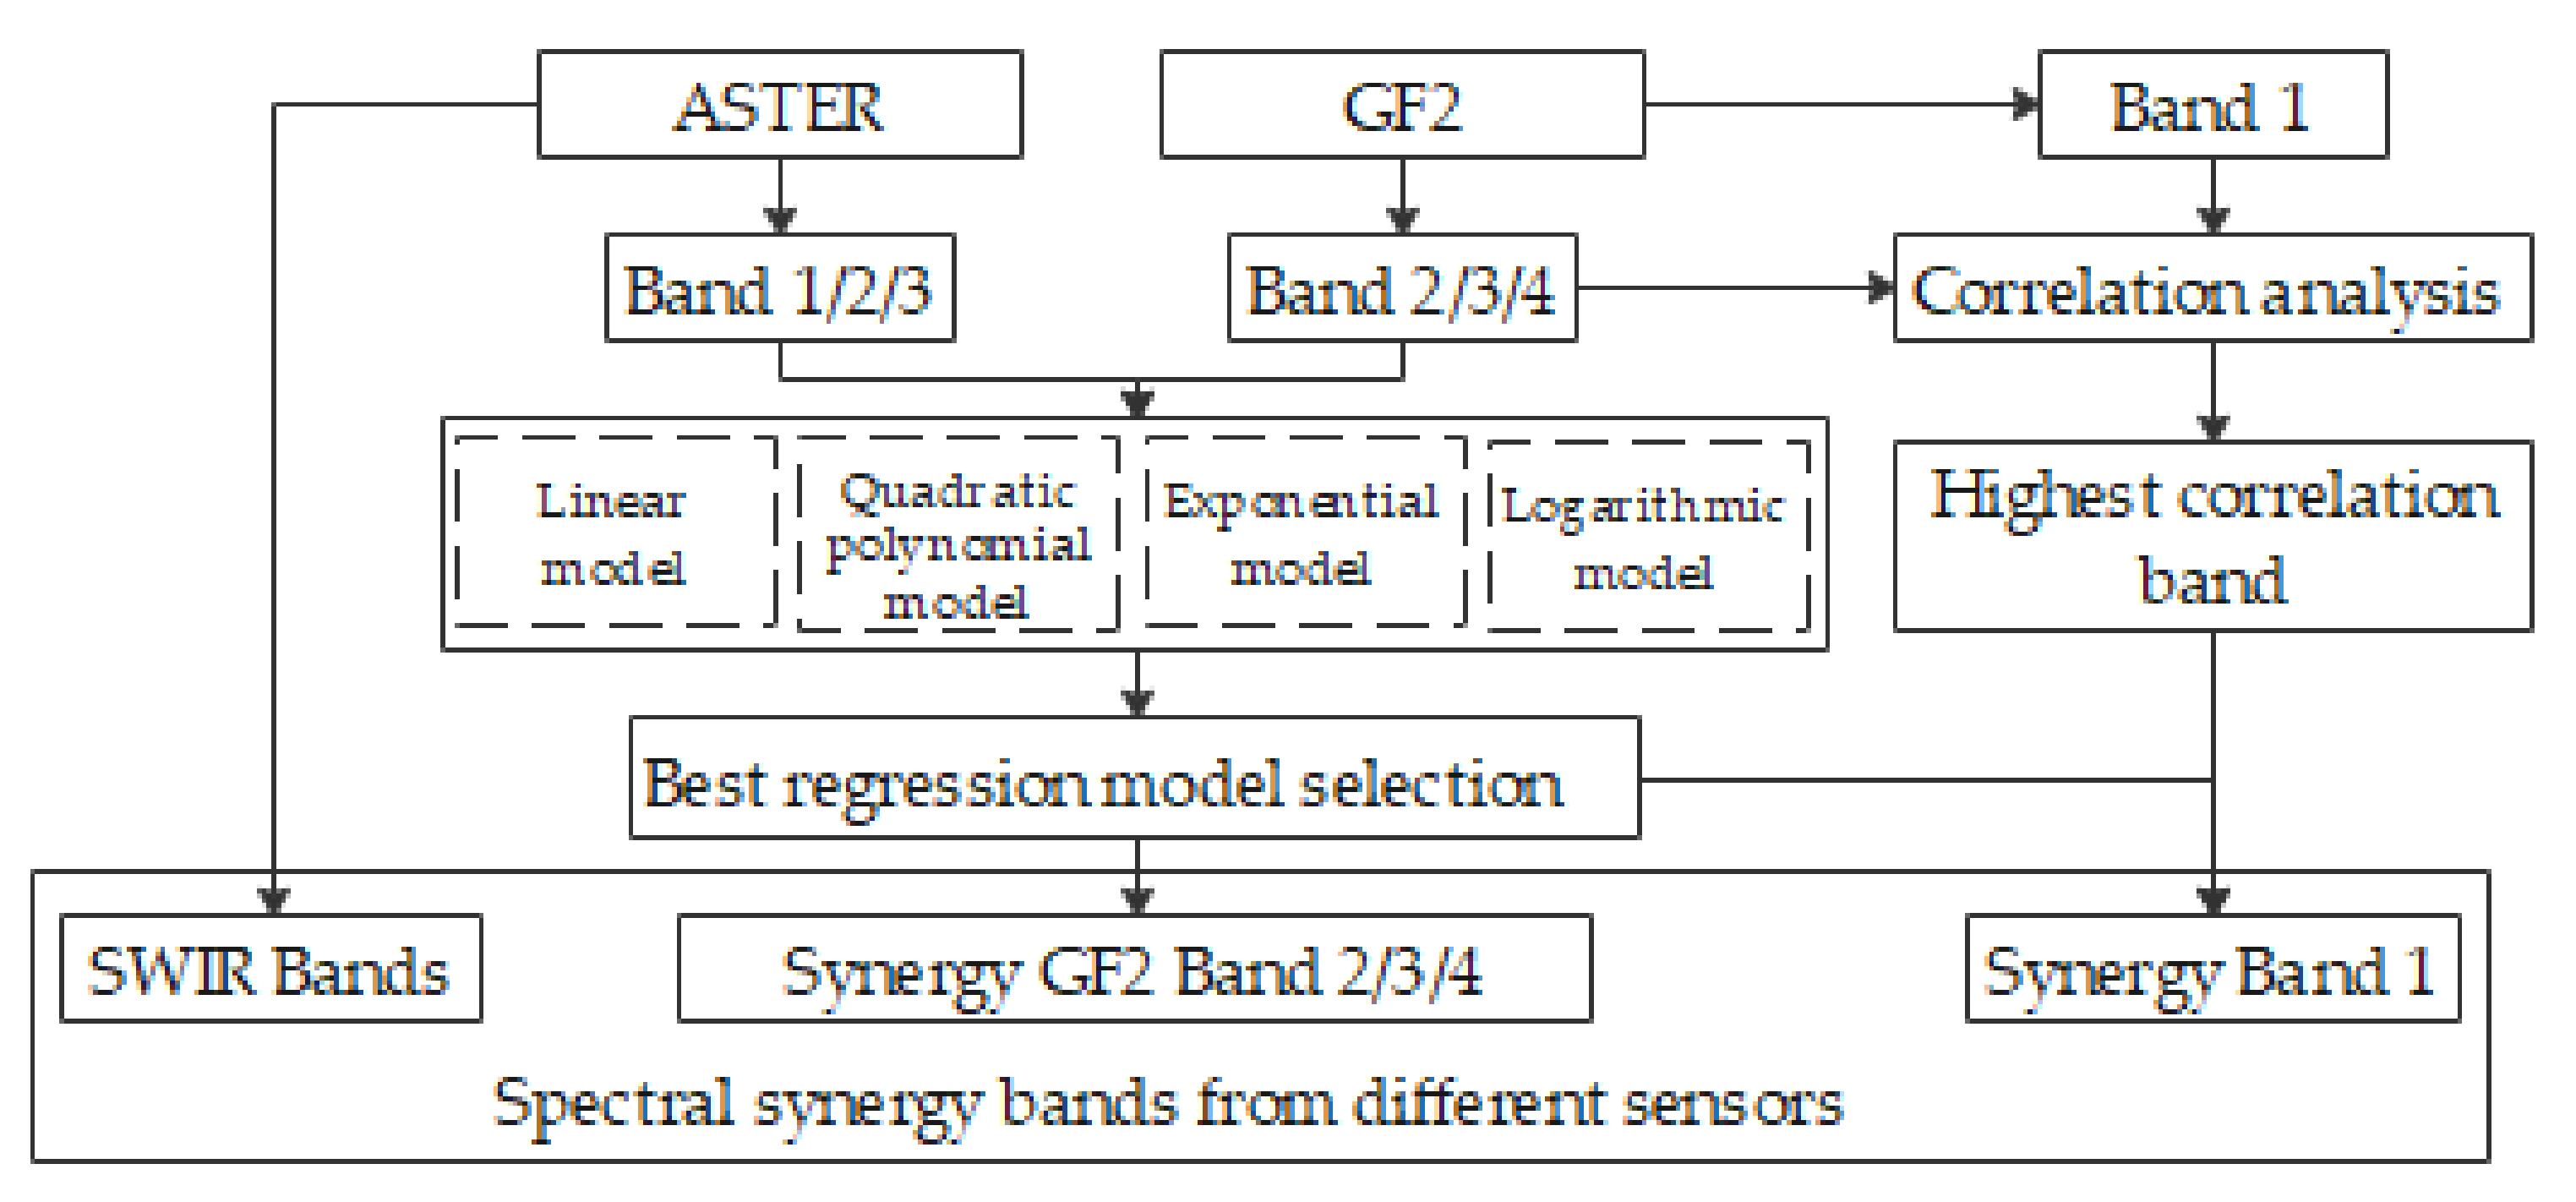
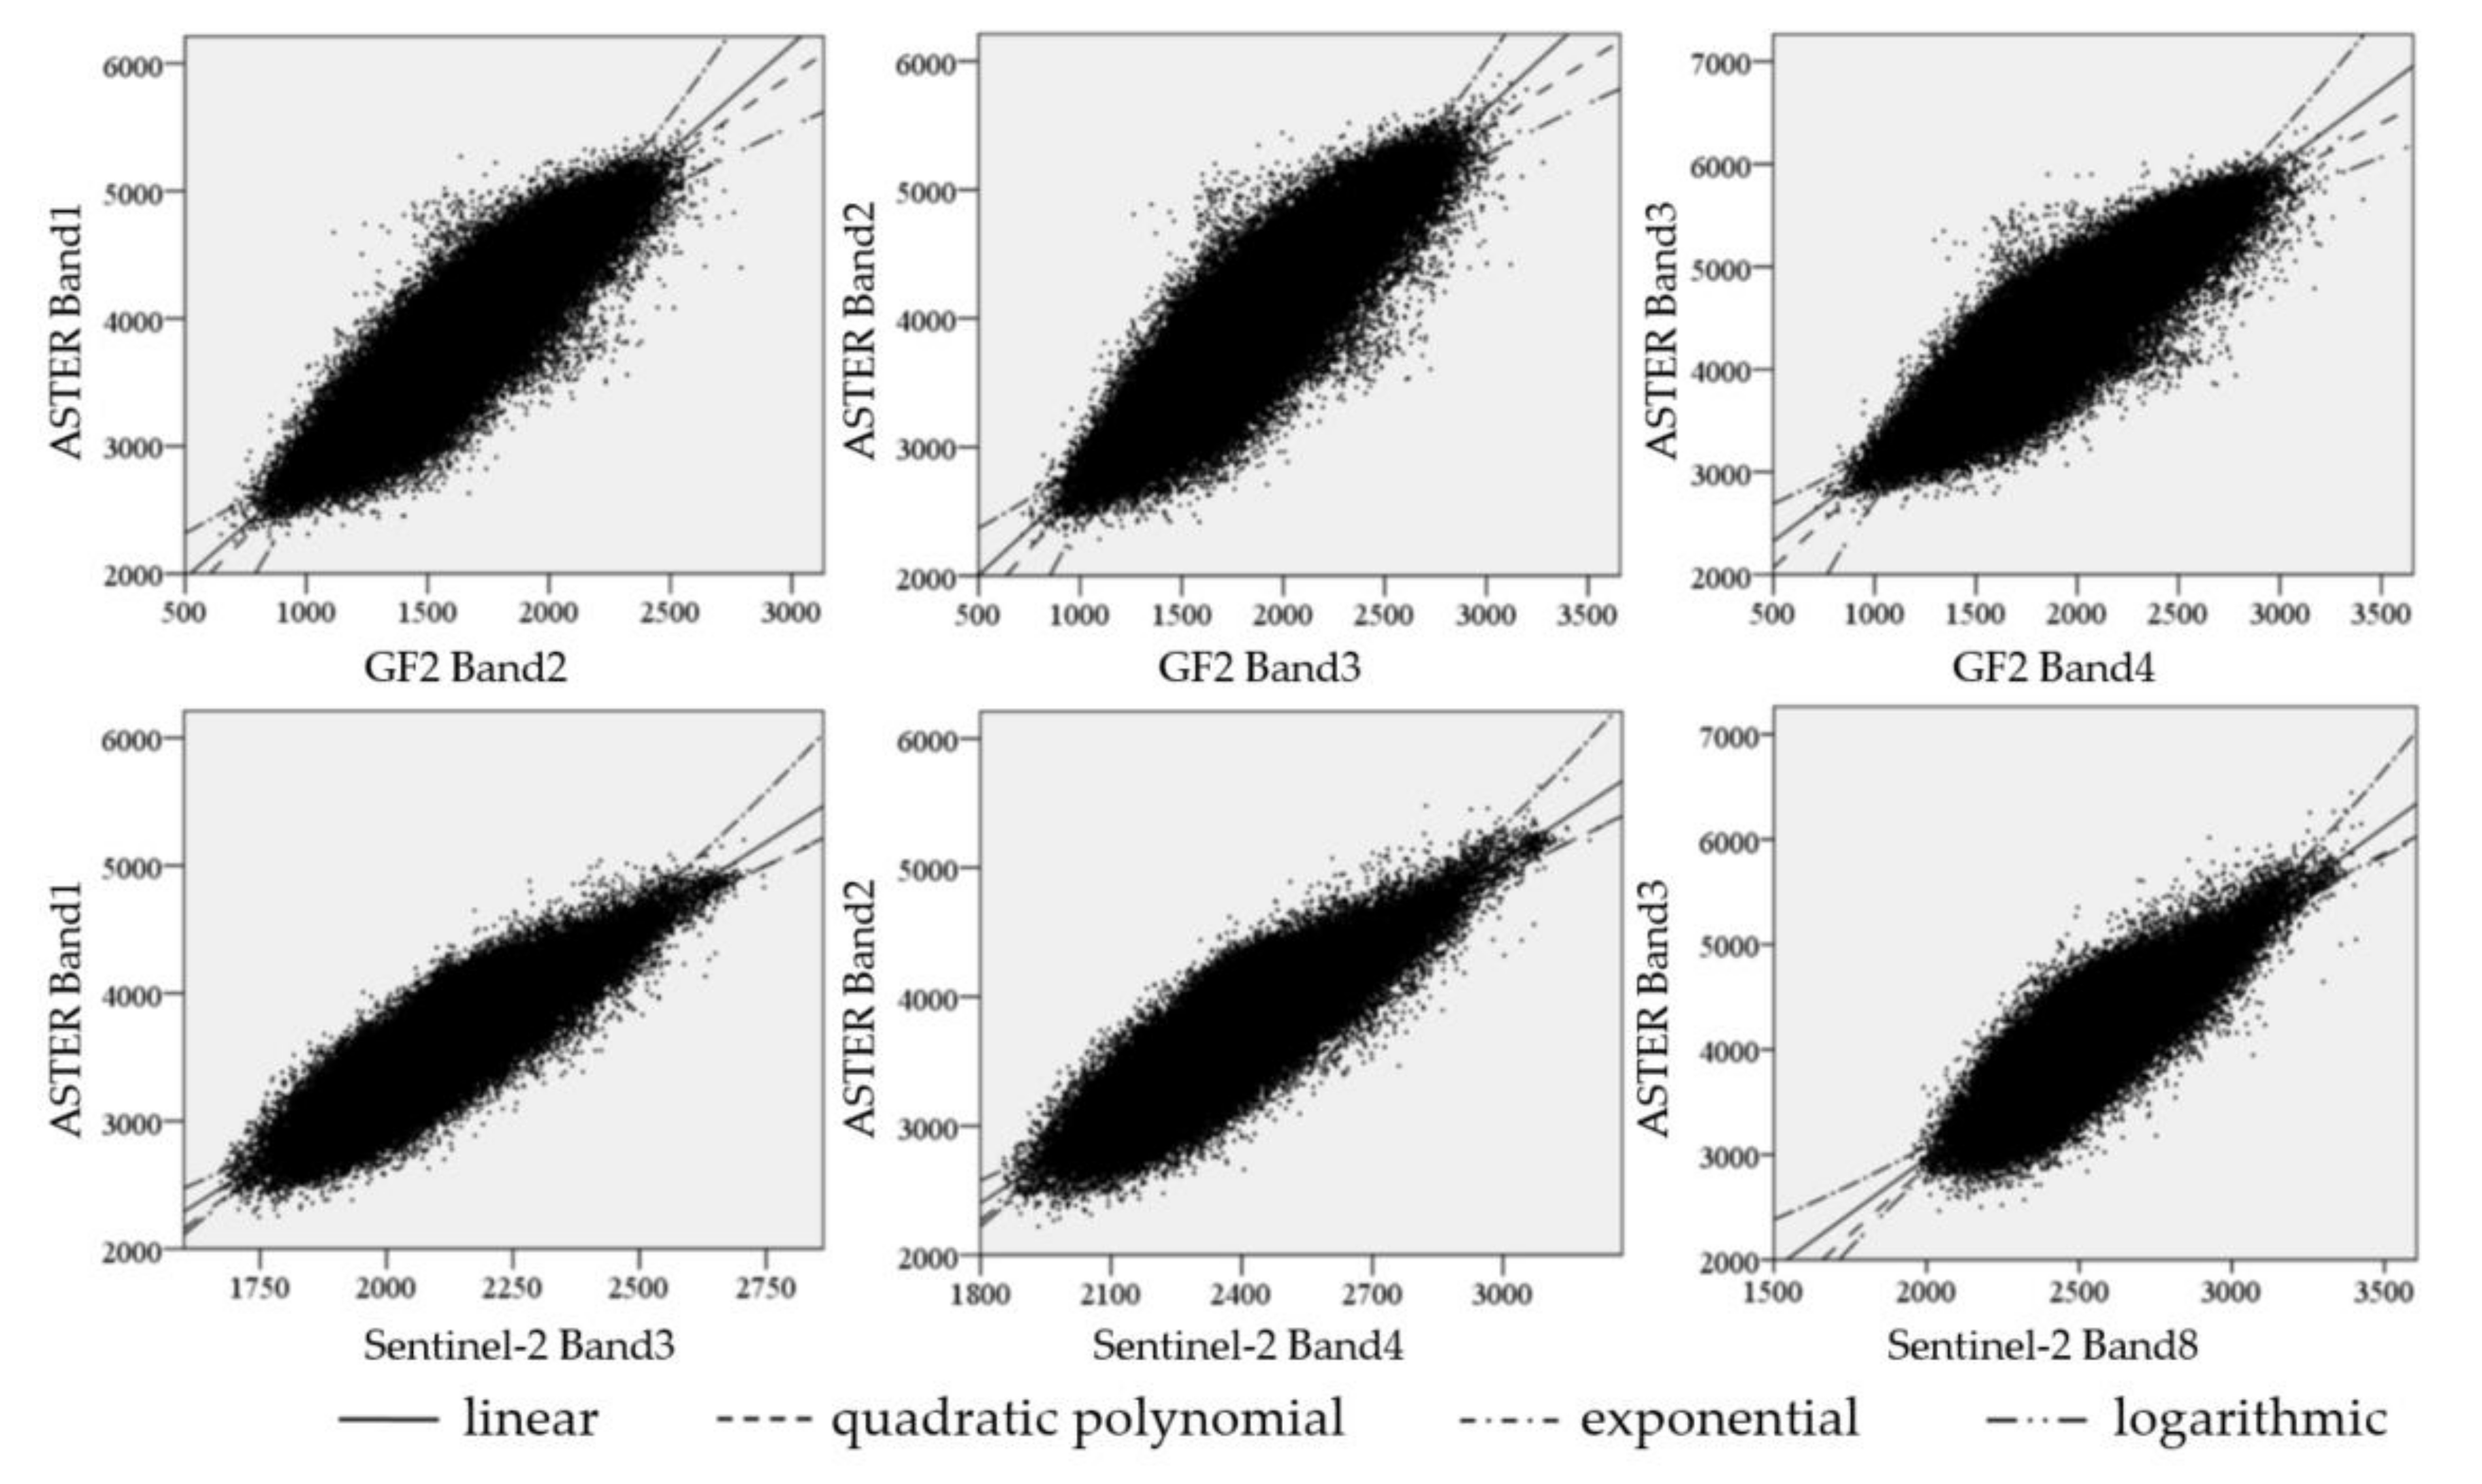
The spectral synergy detailed in Figure 4 (taking ASTER and GF2 as an example) includes two steps: (1) BSWs were firstly processed using statistical regression, through which four commonly used regression models were built, including a linear model, a quadratic polynomial model, an exponential model, and a logarithmic model. The determination coefficient (R2) was used to select the best regression model. (2) BDWs were then adjusted by reusing the regression coefficient and equations of BSWs. We calculated the correlation coefficient between each BDW and BSW, then chose the regression coefficient and regression equations with the highest correlation to process the BDWs.
Taking the spectral synergy process of ASTER and GF2 as an example, three pairs of BSWs can be found (i.e., ASTER Band 1 to GF2 Band 2, ASTER Band 2 to GF2 Band 3 and ASTER Band 3 to GF2 Band 4). Because only one BDW remained for GF2 (ASTER had more BDWs), the GF2 BSWs were considered as independent variables during the regression, so that all ASTER bands would remain unchanged during the spectral synergy process. The best regression models of BSWs were determined as that with the highest R2 of the four models. Through calculations using the coefficient and regression equations of each BSW, GF2 Band 2/3/4 were able to fit to the spectral response of the ASTER Band 1/2/3. The remaining BDW of GF2 Band 1 was firstly calculated the correlation coefficient with GF2 Band 2/3/4 to find the highest correlation, then the coefficient and regression equations of BSW (i.e., Band 2/3/4) with the highest correlation was employed to process the BDW of GF2 Band 1. The BSWs used in correlation calculating were those prior to the spectral synergy process (i.e., the original GF2 Band 2/3/4), because the BSWs and the BDWs of GF2 were all regarded as independent variables of the regression equation. Through the spectral synergy process, all of the spectral bands of GF2 were fitted to the spectral response of the ASTER sensor.
3.2.2. Image Fusion and Synergistic Dataset Construction
Image fusion was employed in order to improve the spatial resolution of each spectral band from different sensors. As mentioned before, CS and MRS are the most commonly used fusion methods because they are fast and easy to implement. Both CS and MRS have their strengths and weaknesses. CS methods may experience the problem of spectral distortions, while MRS may cause a higher spatial distortion [22]. MRS methods need accurate co-registration between PAN and MS images [35], which is a very challenging task [22] (more challenging when the spatial resolution ratio (SRR) is low as GF-2 PAN and ASTER SWIR MS), otherwise, they will experience serious spatial distortion. CS methods are not sensitive to the co-registration accuracy and SRR [36], thus a suitable fusion method was chosen among CS methods though they have weaknesses, as claimed by some researchers [37,38].
The Gram–Schmidt (GS) spectral sharpening method [39] was employed in this paper for the following reasons:
- (1)
- It outperforms most other CS pan-sharpening methods in both maximizing image sharpness and minimizing color distortion [40]. It has the least spectral distortion among the current CS fusion methods and is widely used in remote sensing geological community.
- (2)
- (3)
- As shown in the results of Ghimire et al.’s study, GS had the least impact on most vegetation indices’ (VI) quality when SSR reduced, and on the whole, it showed better performance among the fusion methods they used [27]. Since principle of mineral index is spectral band math similar to VI, it can be inferred that the application of GS in this study could also have stable results.
Using the GS spectral sharpening method, 6 ASTER SWIR bands, 4 Sentinel-2 VNIR narrow bands (Band 5/6/7/8A), and 4 GF2 MS bands were fused with the GF2 PAN image, which improved each spectral band to a resolution of 1 m. Three sets of fused bands were obtained with different spectral ranges and the same spatial resolution of 1 m. With a stacking process for every band, a synergistic dataset was constructed.
3.3. Image Enhancement and the Intrusive Complex Mapping Method
3.3.1. Image Enhancement by BR, RBD, and False-Color
The band ratio (BR) [42] can enhance spectral contrast of specific absorption features, while relative absorption-band depth (RBD) [43] is a useful three-point ratio for enhance the Al-OH and Mg-OH absorption in SWIR [12]. Both BR and RBD were widely used for mapping lithology and hydrothermal alteration [44,45,46,47,48]. In this study, the BR and RBD methods were both employed to enhance the spectral characteristics of different stage intrusions and dikes caused by characteristic minerals such as sericite, biotite, and amphibole. Spectra of rock samples of different stage intrusions were analyzed firstly to choose the diagnostic bands used by BR and RBD. Based on each difference in spectral characteristics caused by different mineral contents and through BR and RBD, multiple enhanced images were obtained. To produce enhanced images with maximum contrast in appearance and better visual effects, the RGB false-color combination was used to combine the former BR and RBD enhanced images, which produced a RGB colored image in order to separate Late Proterozoic and Carboniferous intrusive masses by color tone.
3.3.2. Image Enhancement by BRM and PCA
In the complex area of the intrusive complex where the difference in mineral content is not obvious, the enhancement performance of a specific mineral index is often not ideal, and the boundaries of different intrusive masses are not effectively enhanced. By making use of the advantages of synergistic images in terms of band richness, it may be possible to effectively enhance the spectral differences of different intrusive masses in complex areas.
Askari et al. [49] put forward the idea of the band ratio matrix (Band Ratio Matrix, BRM) in a study of lithologic unit mapping in sedimentary rocks, which can alleviate the problem of mineral similarity in sedimentary rocks. In this paper, the ideas of the BRM and principal components analysis (PCA) [50,51] methods were introduced to enhance the differences between late Proterozoic and Carboniferous intrusive masses in the complex area. BRM is the matrix constructed by non-repetitive Band Ratios (see Equation (1)).
The synergistic image has n spectral bands so that the above matrices contain band ratios. Using PCA, intercorrelated variables can be reduced to a few uncorrelated variables called principal components (see Equation (2)).
By testing the false-color combination of the first few principal components (PC) bands, the spectral difference between the Late Proterozoic and Carboniferous intrusive masses might be enhanced.
4. Results
4.1. Synergy of ASTER, GF-2, and Sentinel-2 Bands
To process the spectral synergy of three sets of remote sensing data, one reference dataset must be determined initially. All spectral bands of the reference dataset remain unchanged and the other two sets would fit to the reference data. In this case, ASTER was the reference because it had more BDWs. Moreover, the BDWs of ASTER were in the SWIR wavelength region, while the BSWs were in VNIR. Thus, all bands of ASTER remained unchanged and the GF2 and Sentinel-2 bands were subjected to the synergy process in order to fit ASTER.
Figure 5 shows the regression process of the BSWs. GF2 Band 2/3/4 and Sentinel-2 3/4/8 were fitted to ASTER Band 1/2/3. Table 2 shows the r2 of each model and the results show that the r2 value of the quadratic polynomial model was the highest in all bands. By using the best fitting regression function (i.e., quadratic polynomial), the reflectance of GF2 Band 2/3/4 and Sentinel-2 Band 3/4/8 was consistent with that of ASTER Band 1/2/3.
The correlations between GF2 Band 1 and Band 2/3/4 (Table 3) and between Sentinel-2 Band 5/6/7/8A and Band 3/4/8 were calculated (Table 4). In the GF2 bands, Band 1 has the highest correlation with Band 2, so coefficient and regression equations of Band 2 were used to process Band 1. On the other hand, for Sentinel-2 bands, the coefficient and regression equations of Band 4 were used to process band 5 and band 6, while the coefficient and regression equations of Band 8 were used to process band 7 and band 8A. Each BDW of GF2 and Sentinel-2 was processed by using the regression function of a BSW with the highest correlation.
The statistical results of the original bands and synergistic bands (i.e., GF2 and Sentinel-2 bands after spectral synergy) are shown in Table 5. It can be seen that there were great differences in the corresponding bands of the original ASTER, GF2, and Sentinel-2 data. For example, ASTER Band 1 had a mean of 3815.15 and a standard deviation of 577.35, while the means of GF2 Band 2 and Sentinel-2 Band 3 were 1606.74 and 2198.14, respectively. There was a big statistical gap in the means and standard deviations between these BSWs. After the spectral synergy process, the means of the synergistic bands of GF2 Band 2 (i.e., 3814.64) and Sentinel-2 Band 3 (i.e., 3780.25) were obviously closer to that of ASTER Band 1 (as well as the standard deviation). Through spectral synergy, the differences in the surface reflectance response of spectral bands in different sensors was significantly reduced.
After spectral synergy, four GF2 bands, four Sentinel-2 VNIR narrow bands (Band 5/6/7/8A), and six ASTER SWIR bands were fused to GF2 Pan using the GS spectral sharpening method. Through a stacking processing method, the synergistic image datasets of ASTER, GF-2, and Sentinel-2, which have 14 spectral bands and a spatial resolution of 1 m, were obtained. The spectral band information of the synergistic image dataset is shown in Table 6.
4.2. Band Ratio, Relative Absorption-Band Depth, and False-Color Enhancement Results
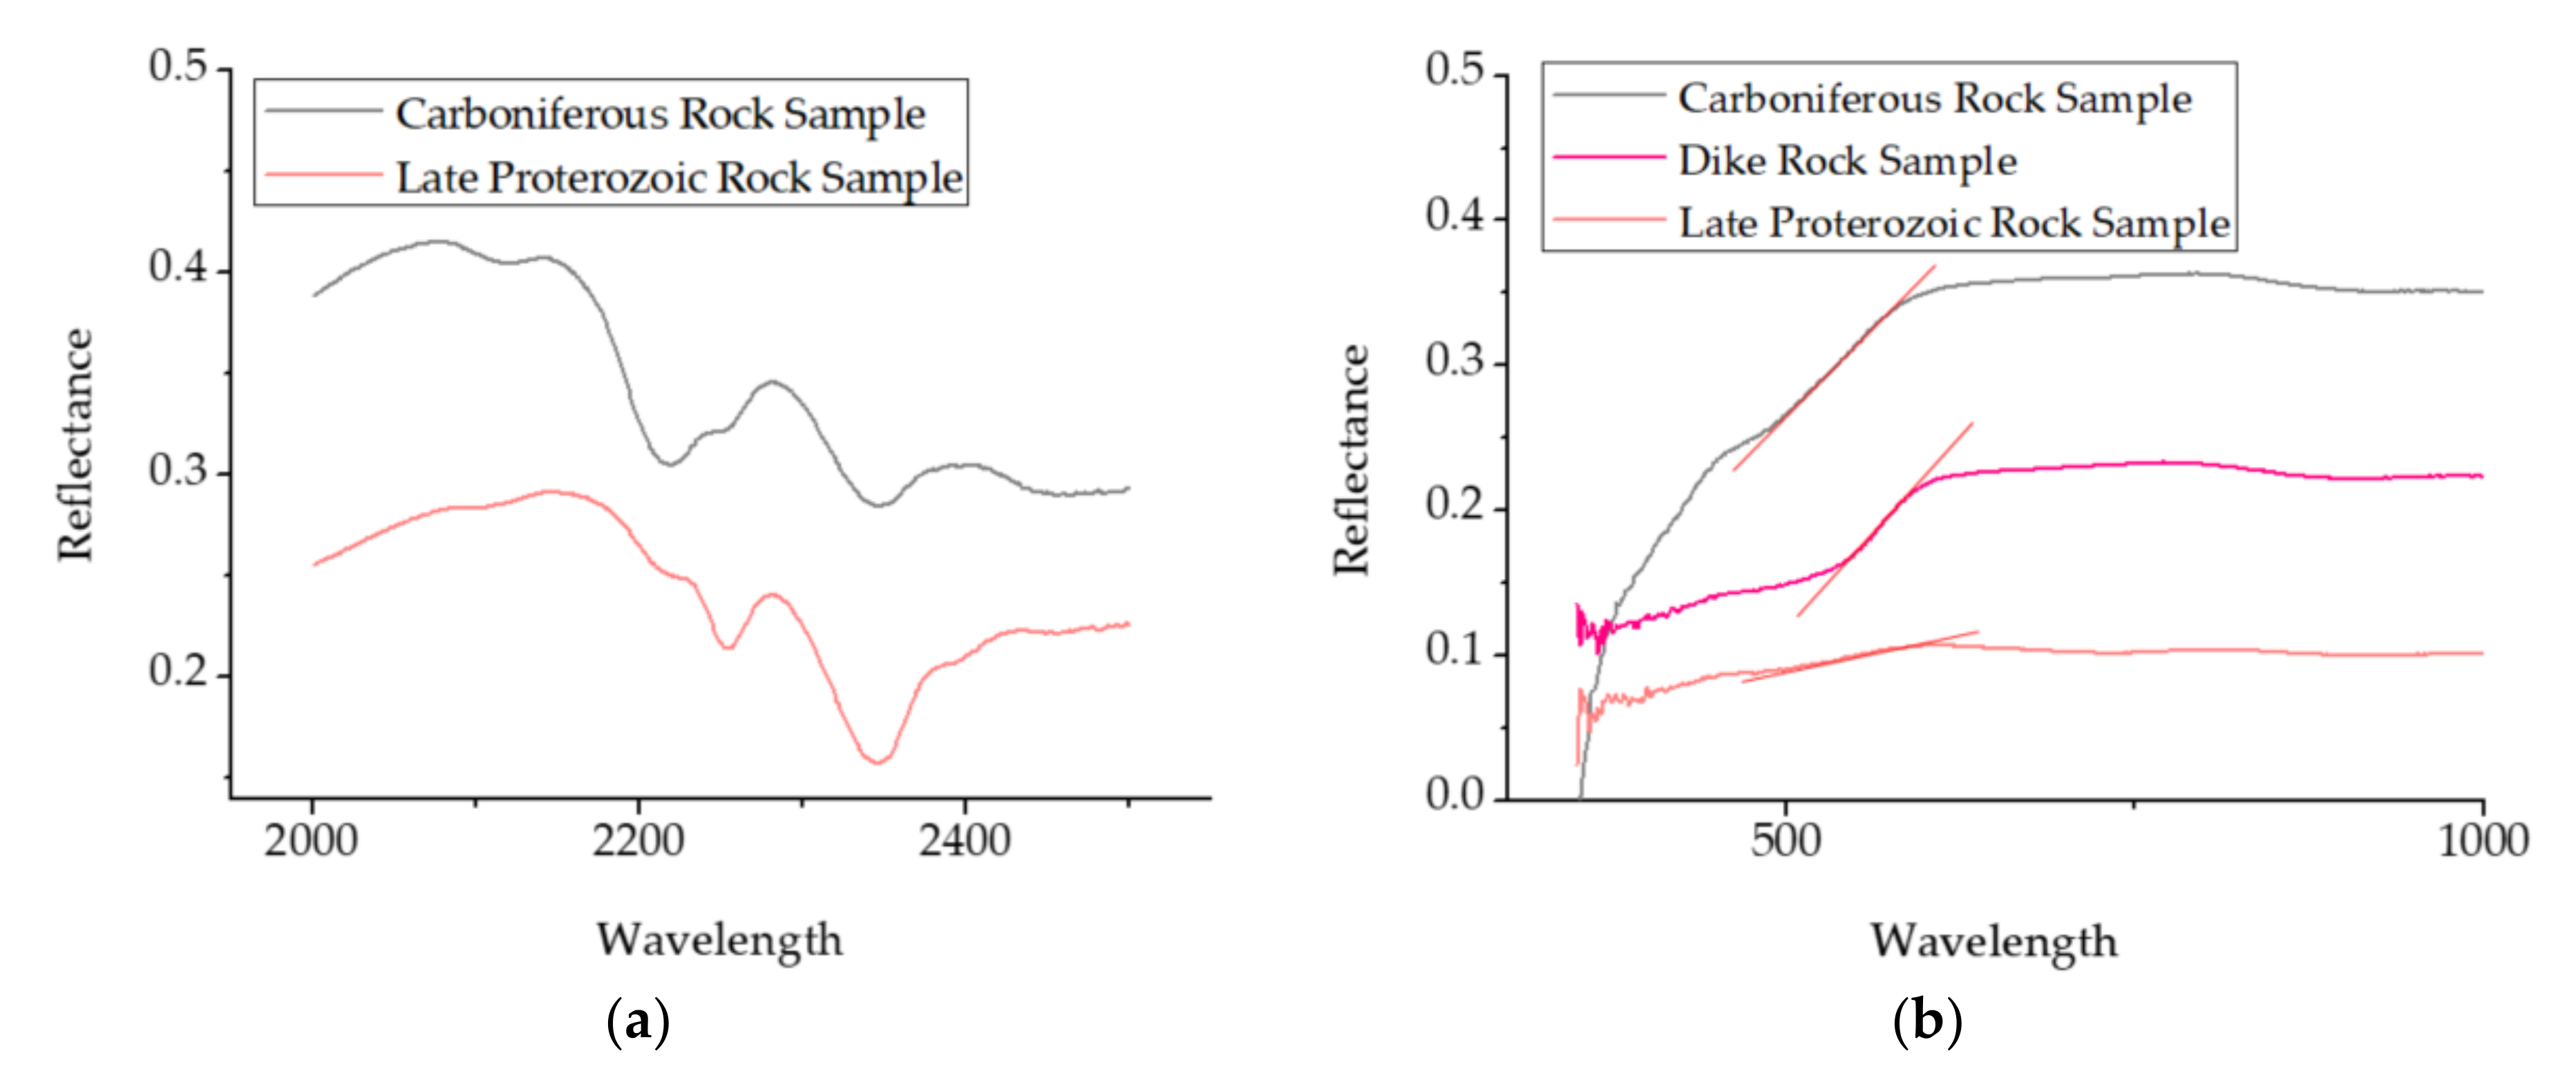
The spectra of the rock samples were measured by an Analytica Spectra Devices (ASD) Fieldspec 3 portable spectrometer in a laboratory setting. Samples’ spectral curves were analyzed to find the different feature of the two stages of intrusion, as well as dikes, which could be helpful to the image enhancement. The SWIR Spectrum (Figure 6a) of Carboniferous intrusive rocks showed an obvious absorption feature at 2200 nm caused by sericite, which is absent in Late Proterozoic intrusions. This feature was enhanced by the RBD of (Band 10+Band 12)/Band 11. The spectrum of Late Proterozoic intrusive rocks (Figure 6a) showed double absorption at 2300–2400 nm, which was caused by biotite or hornblende minerals. This feature was enhanced by the BR of Band 14/Band 13.
In addition, the spectrum of Carboniferous intrusive rocks was found to rise obviously in the 500–700 nm region. The slope of the curve was larger in this wavelength region (represented by a red line) and there was a weak reflection peak near 750n m (Figure 6b). Similar characteristics appeared in intermediate-acid dike samples. In contrast, the spectrum of Late Proterozoic intrusive rock samples did not rise obviously in this wavelength region. This feature was enhanced by the BR of Band 3/Band 2.
Figure 7 shows the enhancement results of BR and RBD. In the (Band 10+Band 12)/Band 11 RBD-enhanced grey-scale image (Figure 7a), Carboniferous intrusions of the west part of the intrusive complex were found to express brighter characteristics because of the low pixel values of Band 11 and the reflection shoulders of Band 10 and Band 12, which could be clearly separated from Late Proterozoic intrusions. Moreover, a big difference in pixel values between the two stage intrusions in Band 14/Band 13 BR-enhanced images was clearly observed in the west part (Figure 7b). In the Band 3/Band 2 BR-enhanced result (Figure 7c), two stage intrusions were distinguished as dark gray and bright gray. It is worth noting that dikes were enhanced excellently in the Band 3/Band 2 results with an obviously bright tone.
Figure 8 shows the comparison of (Band 10+Band 12)/Band 11, Band 14/Band 13 and the geological map, as well as field validation. It can be found that the enhanced two-stage intrusions are basically consistent with the geological map. The enhanced boundary in the results is also consistent with the boundary of the two-stage intrusions in the field investigation. Moreover, due to the relatively higher spatial resolution, mapping on a smaller scale than the geological map (1:50,000) could be done using the enhancement results in this study.
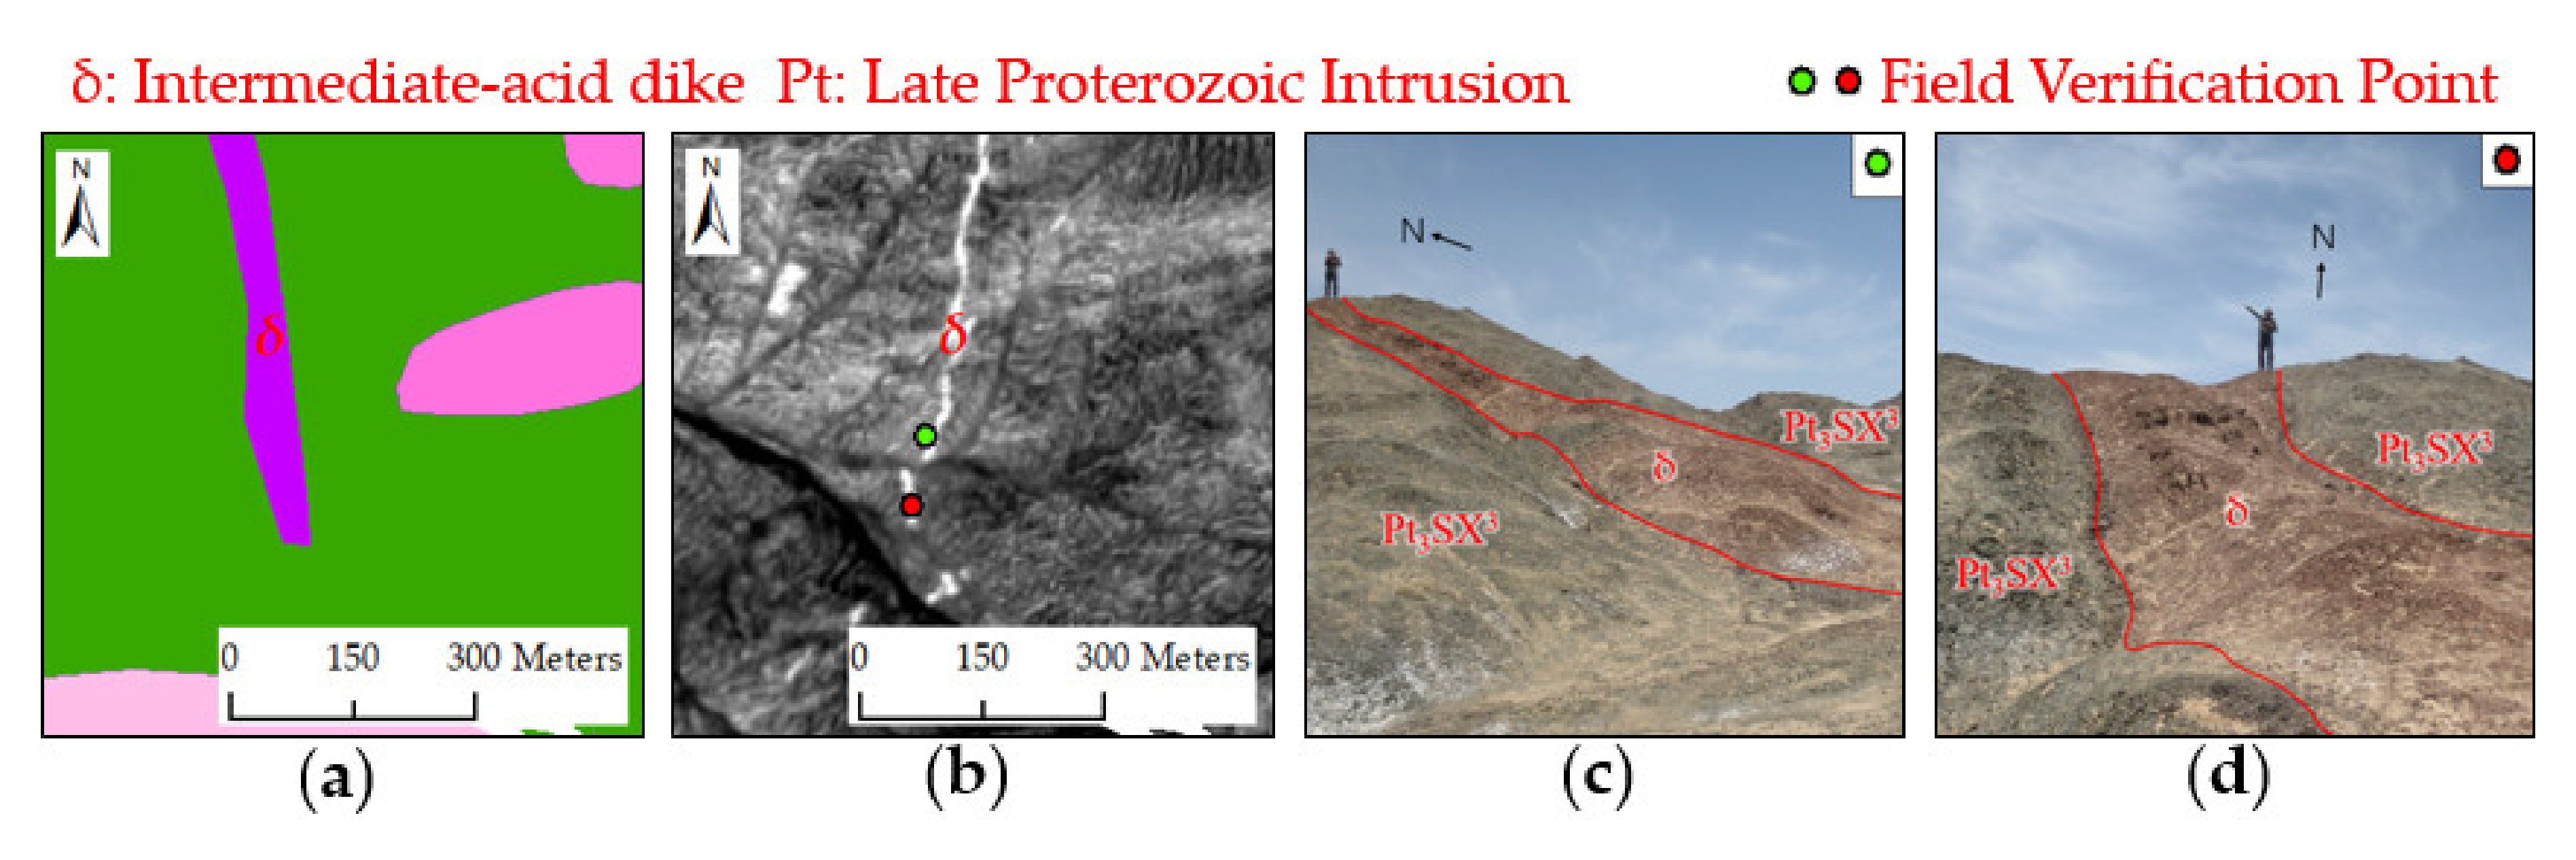
It can be seen in Figure 9 that the enhanced dikes in the BR Band 3/Band 2 were different in direction from that in the geological map. Due to the larger scale of the geological map, there might be some deviation in the detailed position of the geological body in the map. The field validation showed that the dike was NNE in the north and NNW in the south, which proved that the enhanced dikes in the BR were closer to the field conditions. Thus, the results could also help to map the dikes on a smaller scale than that of the geological map.
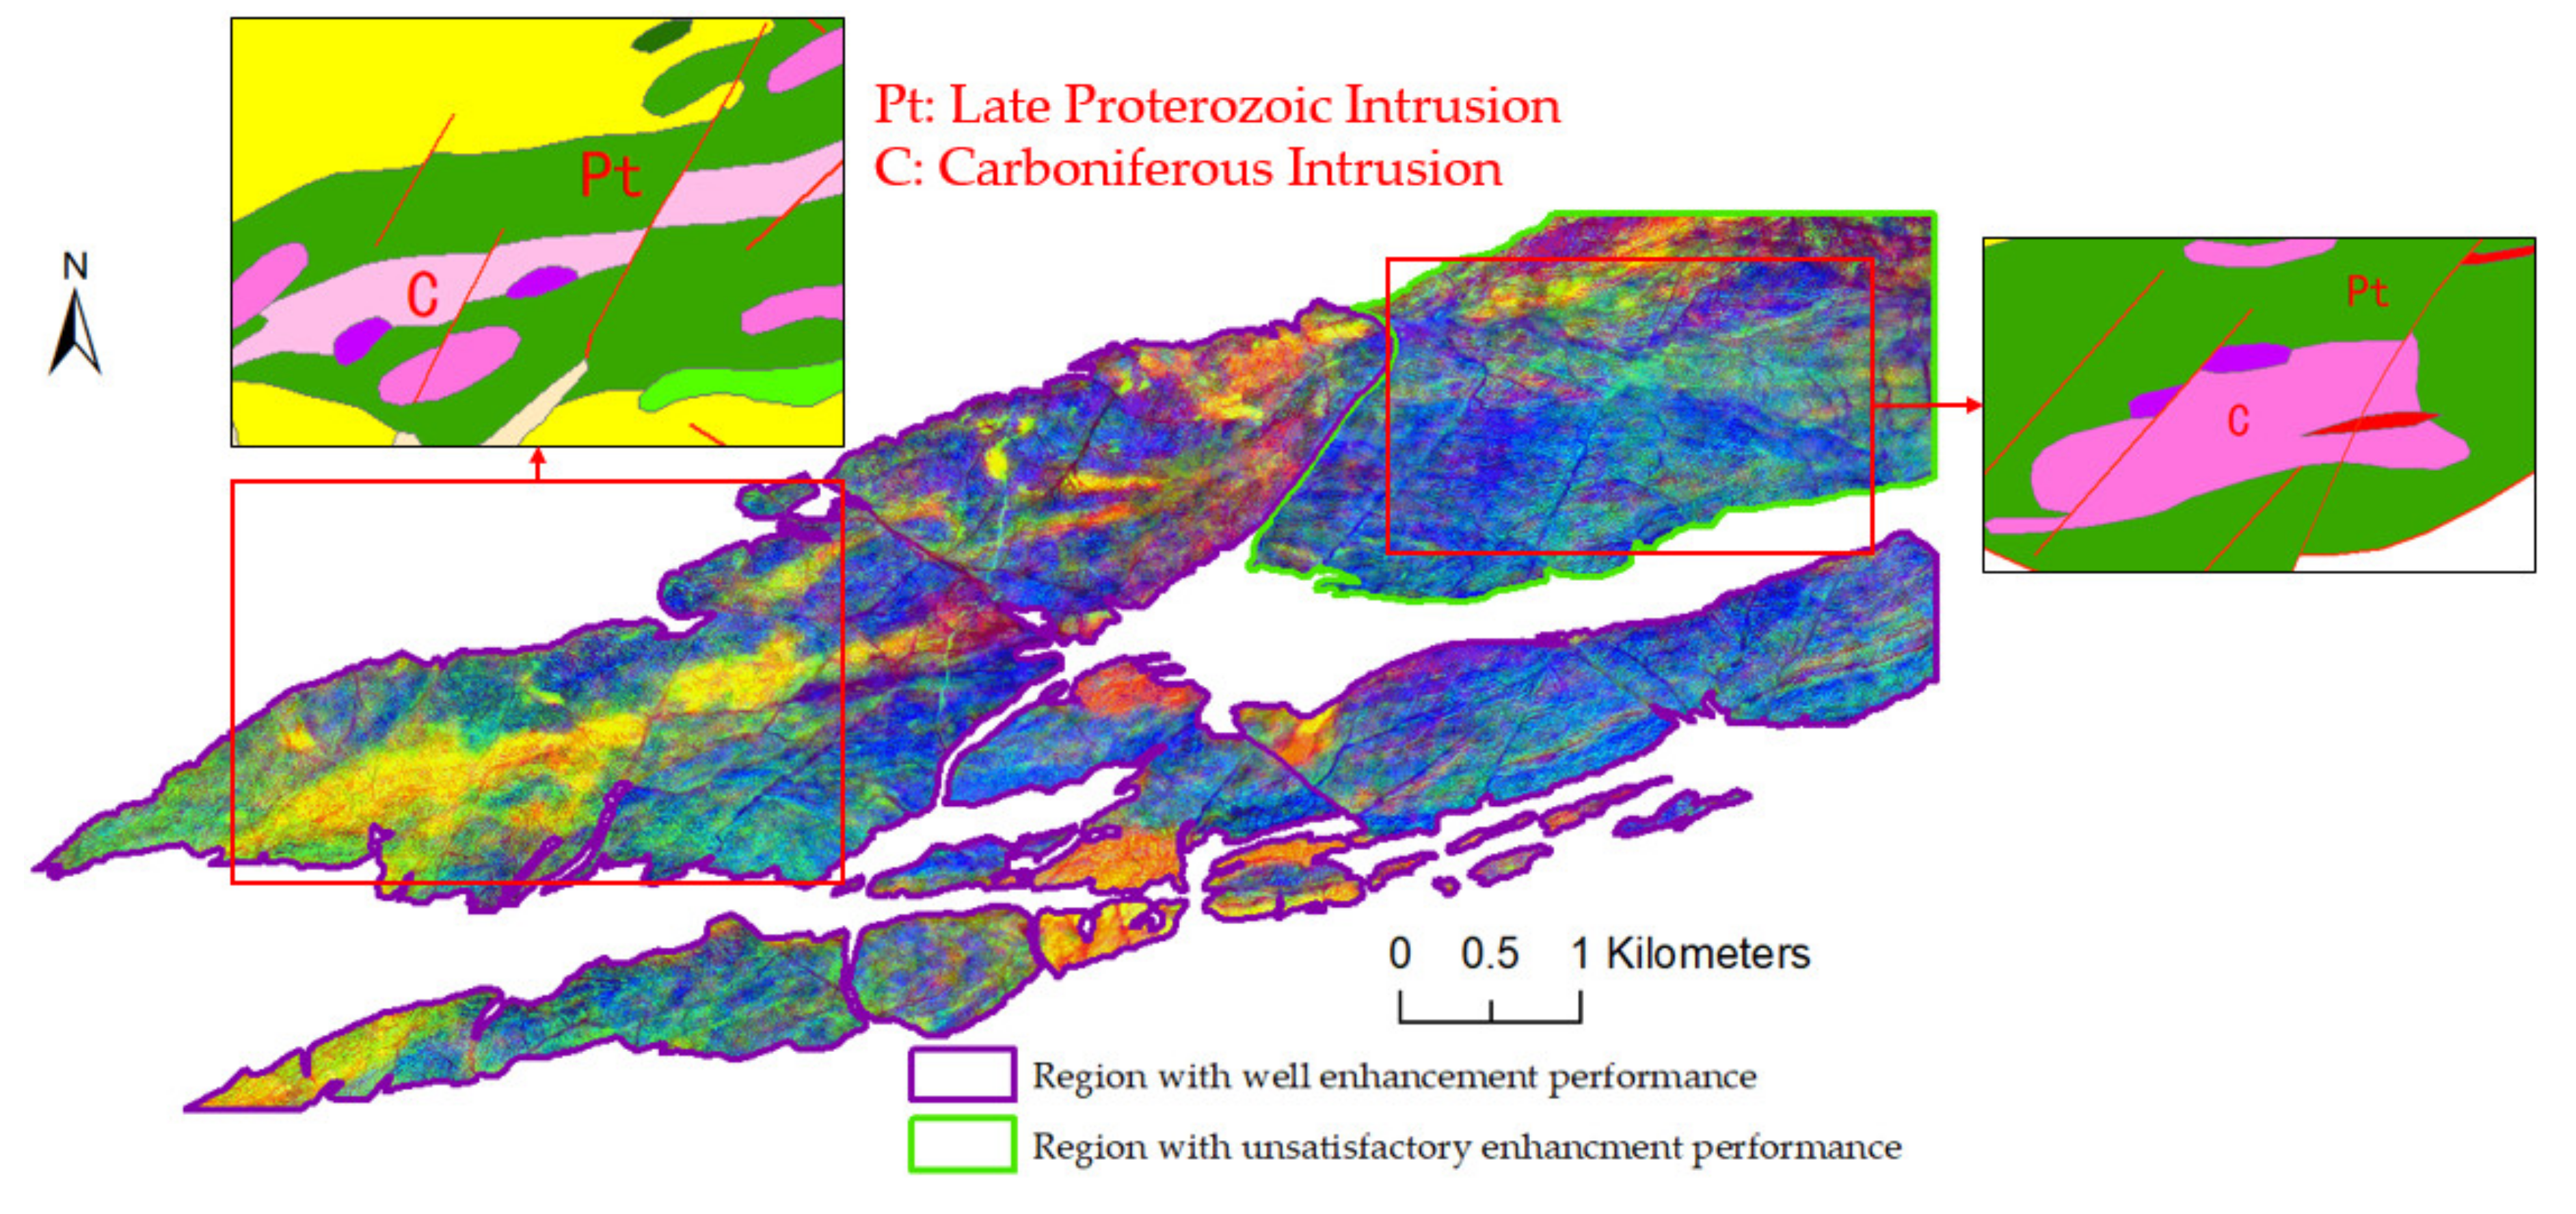
The false-color enhancement assessment was carried out using the above three enhanced images (i.e., R: (Band 10+Band 12)/Band 11, G: Band 3/Band 2 and B: Band 14/Band 13). Figure 10 shows the result of false-color enhancement. Two stage intrusions were clearly distinguished in most of the intrusive complex by color tone (Illustrated by the purple polygon in Figure 10). Carboniferous intrusions expressed a yellow or orange pattern, while Late Proterozoic intrusions expressed a blue pattern. The position of two stages intrusions were nearly the same as geological map in the region illustrated by the purple polygon in Figure 10.
Unfortunately, the performance in the northeast part of the intrusive complex in this enhancement assessment was not satisfactory (green polygon region in Figure 10). The two stage intrusions could not be distinguished in false-color image in this region. Neither the BR nor the RBD performed well (Figure 11); therefore, when combining the BR and RBD, the false-color image could not support the intrusive complex mapping in the northeast.
4.3. BRM and PCA Enhancement Results
Because BR, RBD and the false-color method were unsatisfactory in the northeast part of the intrusive complex, the BRM-PCA method was employed. The synergistic dataset of GF2, Sentinel-2, and ASTER had 14 spectral bands, so the BRM of these data had 91 band ratios. Using PC transformation, 91 PC bands were obtained, in which the first 10 bands already contained 99% of the data information.
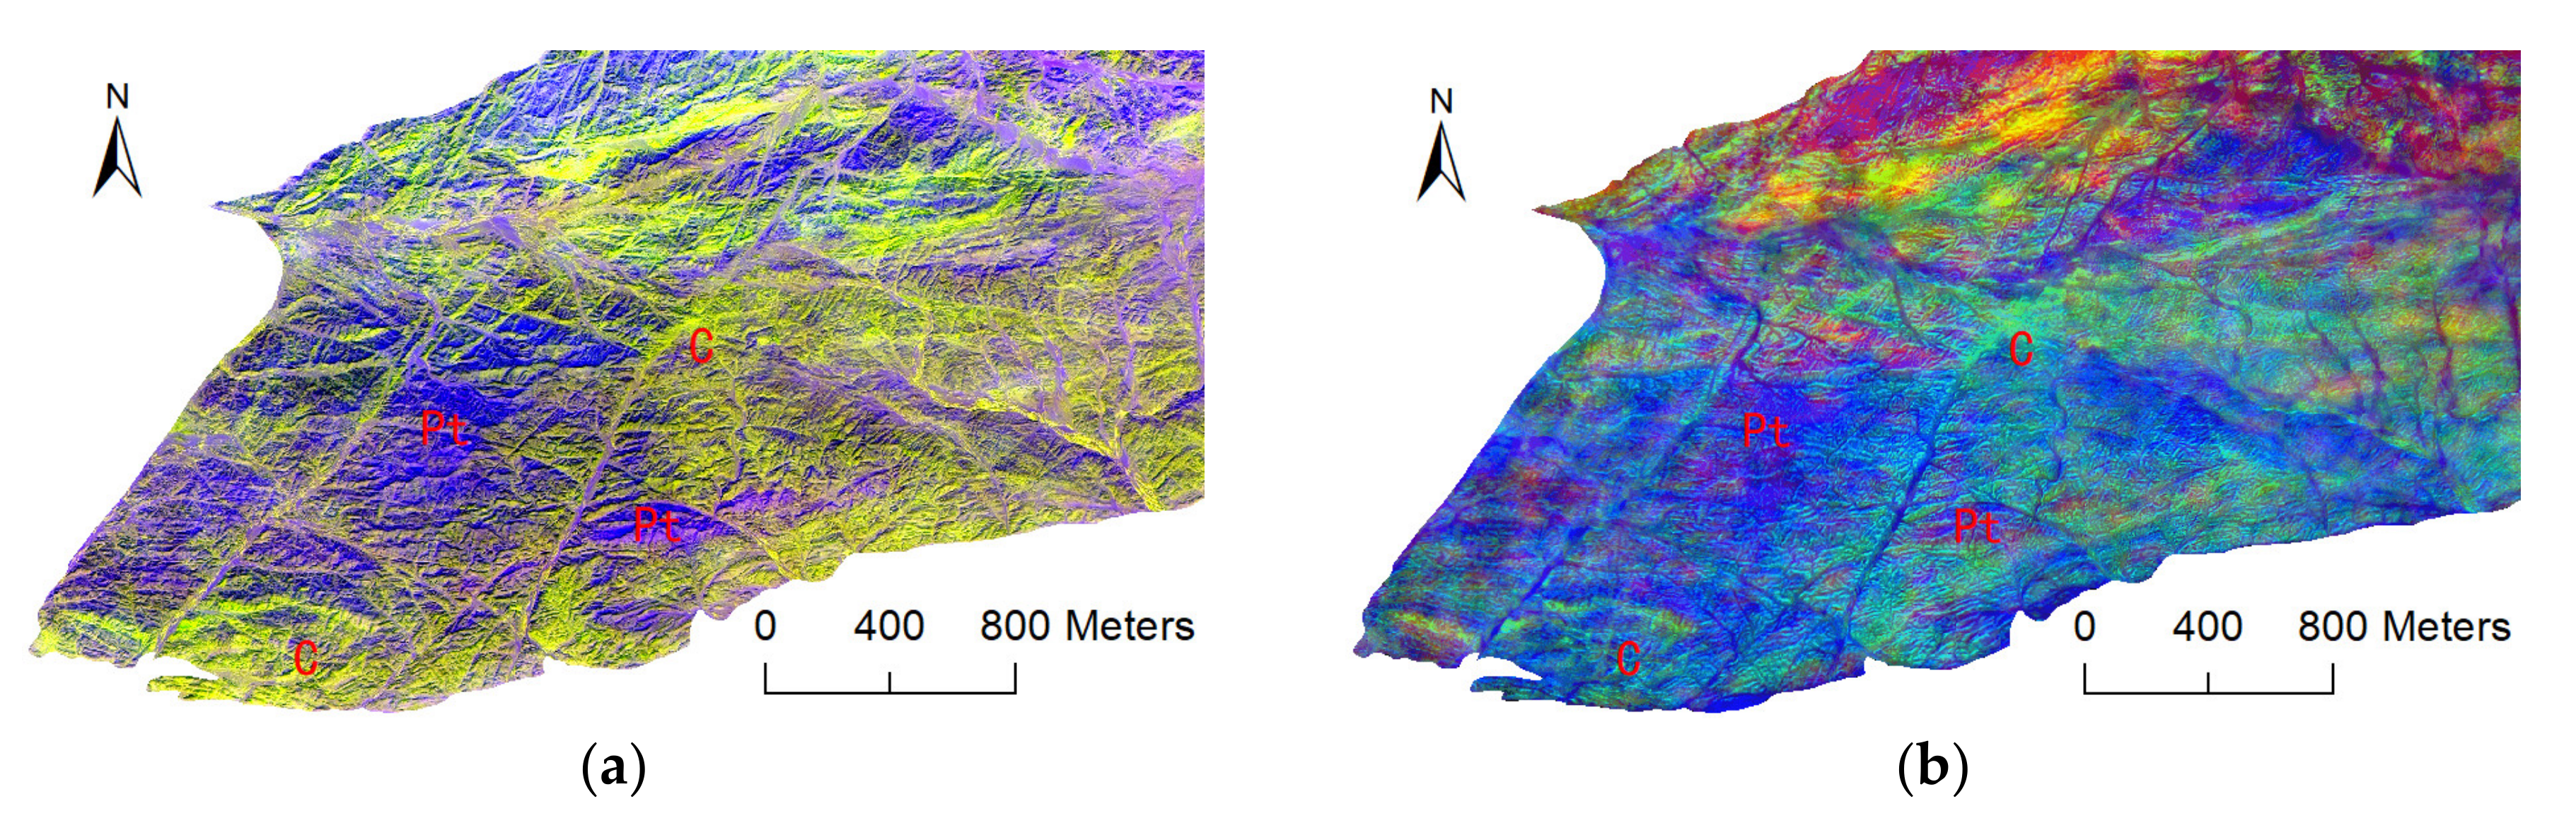
Figure 12a shows the false-color combination of PC1, PC2, and PC5 of BRM. This RGB colored image was able to enhance the spectral differences in Carboniferous and Late Proterozoic intrusions. The Late Proterozoic intrusions had blue–purple cold tones, while the Carboniferous intrusions had yellow or green–yellow tones. The two stage intrusions could be clearly distinguished, and their boundaries were obvious. Compared with the results of the former false-color of BR and RBD (Figure 12b), BRM-PCA enhancement performed much better in this area.
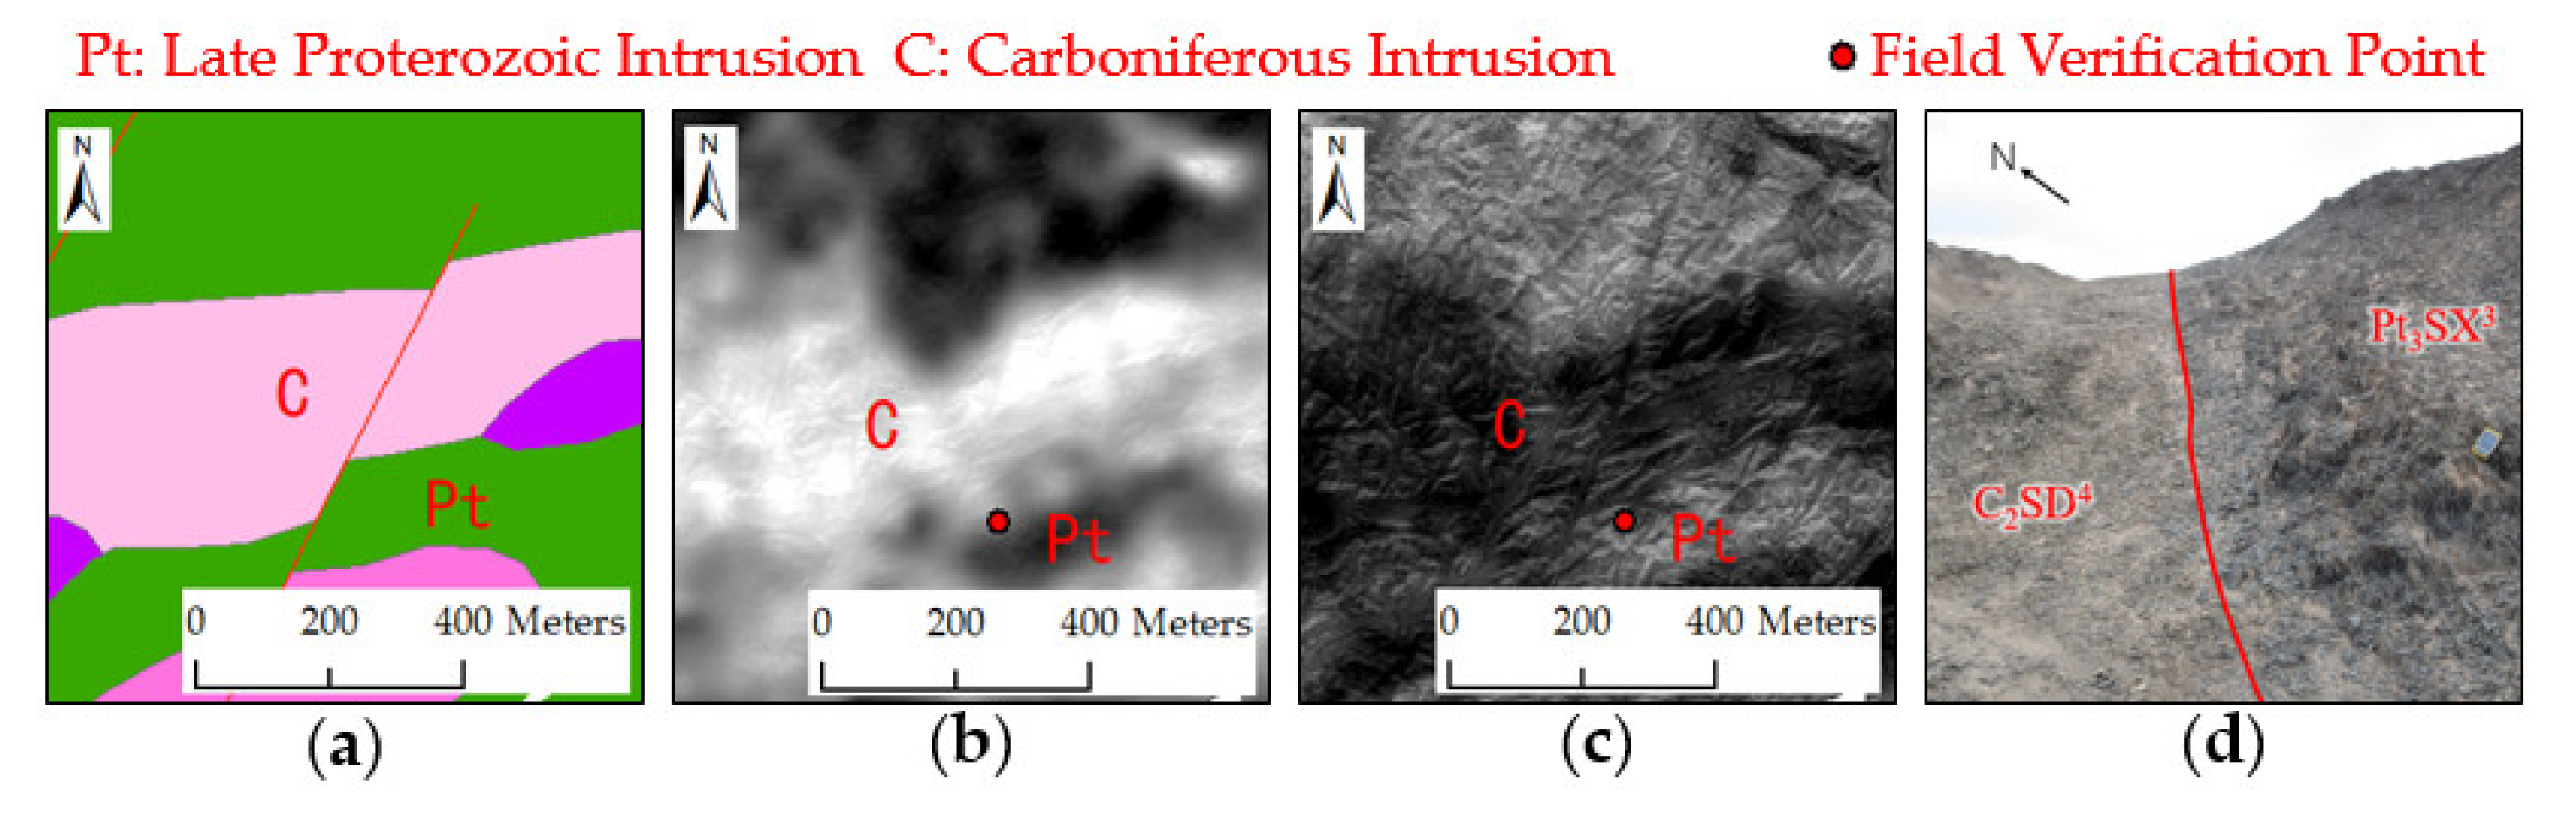
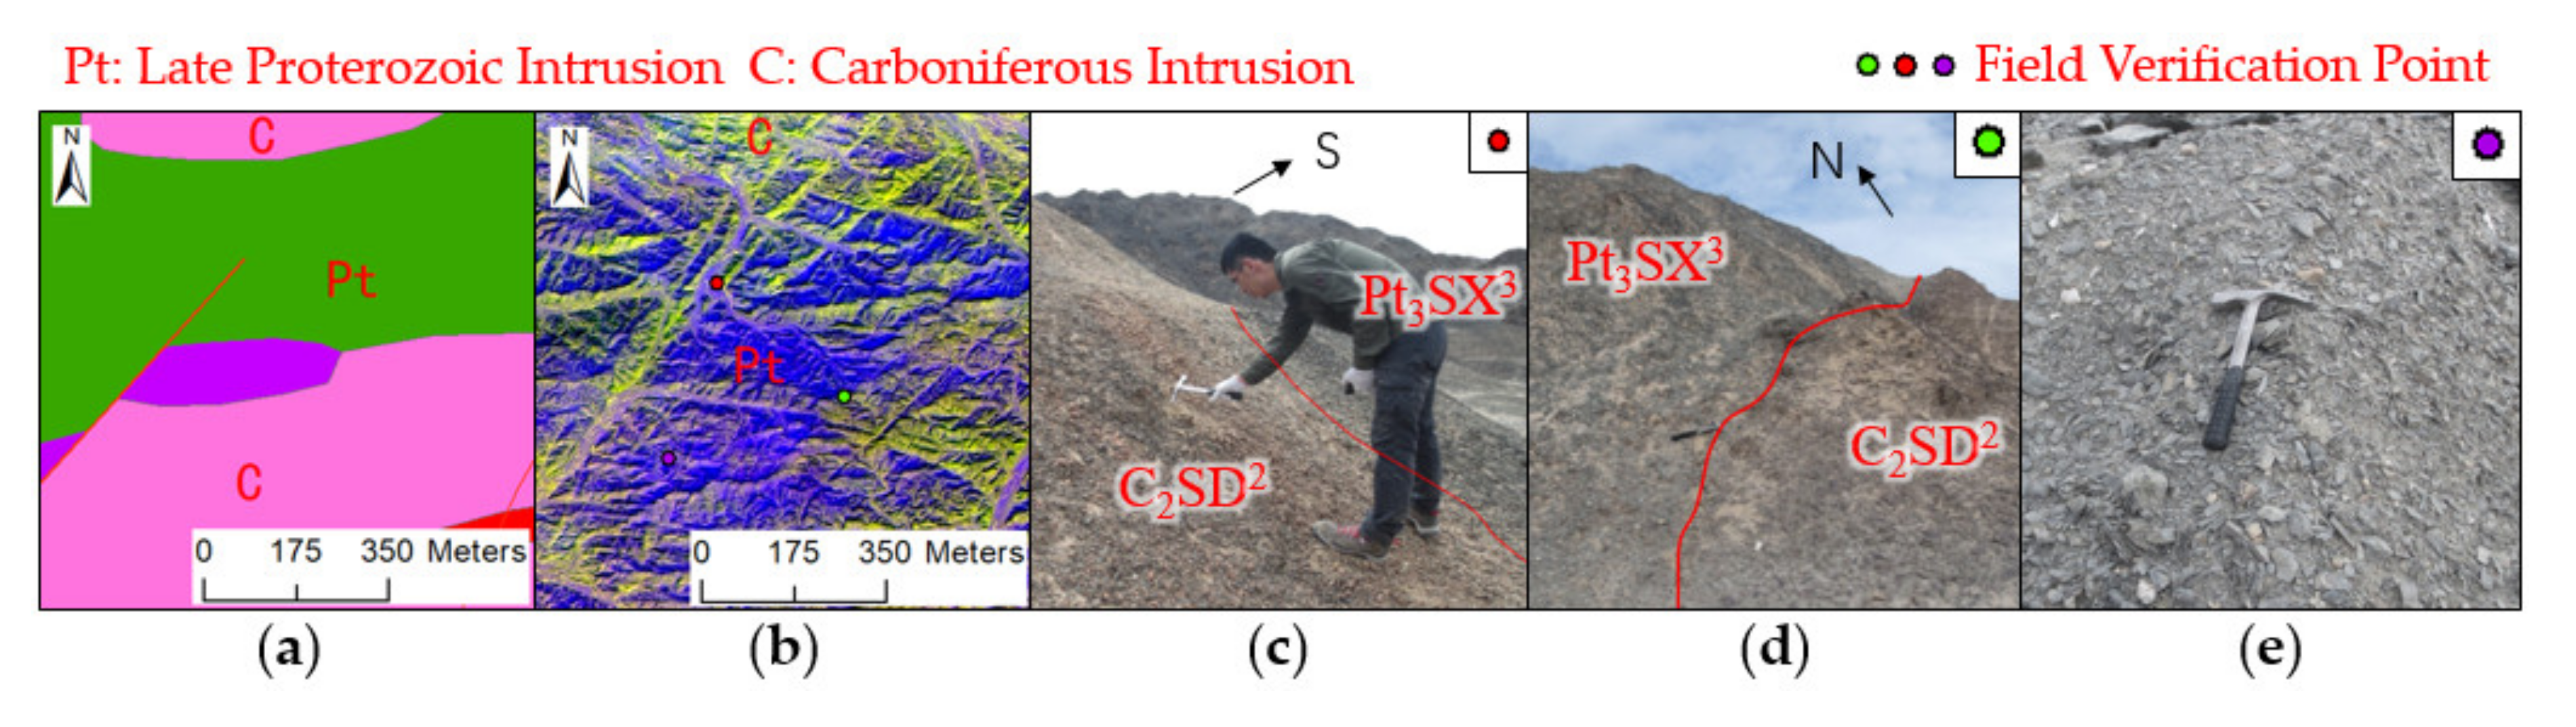
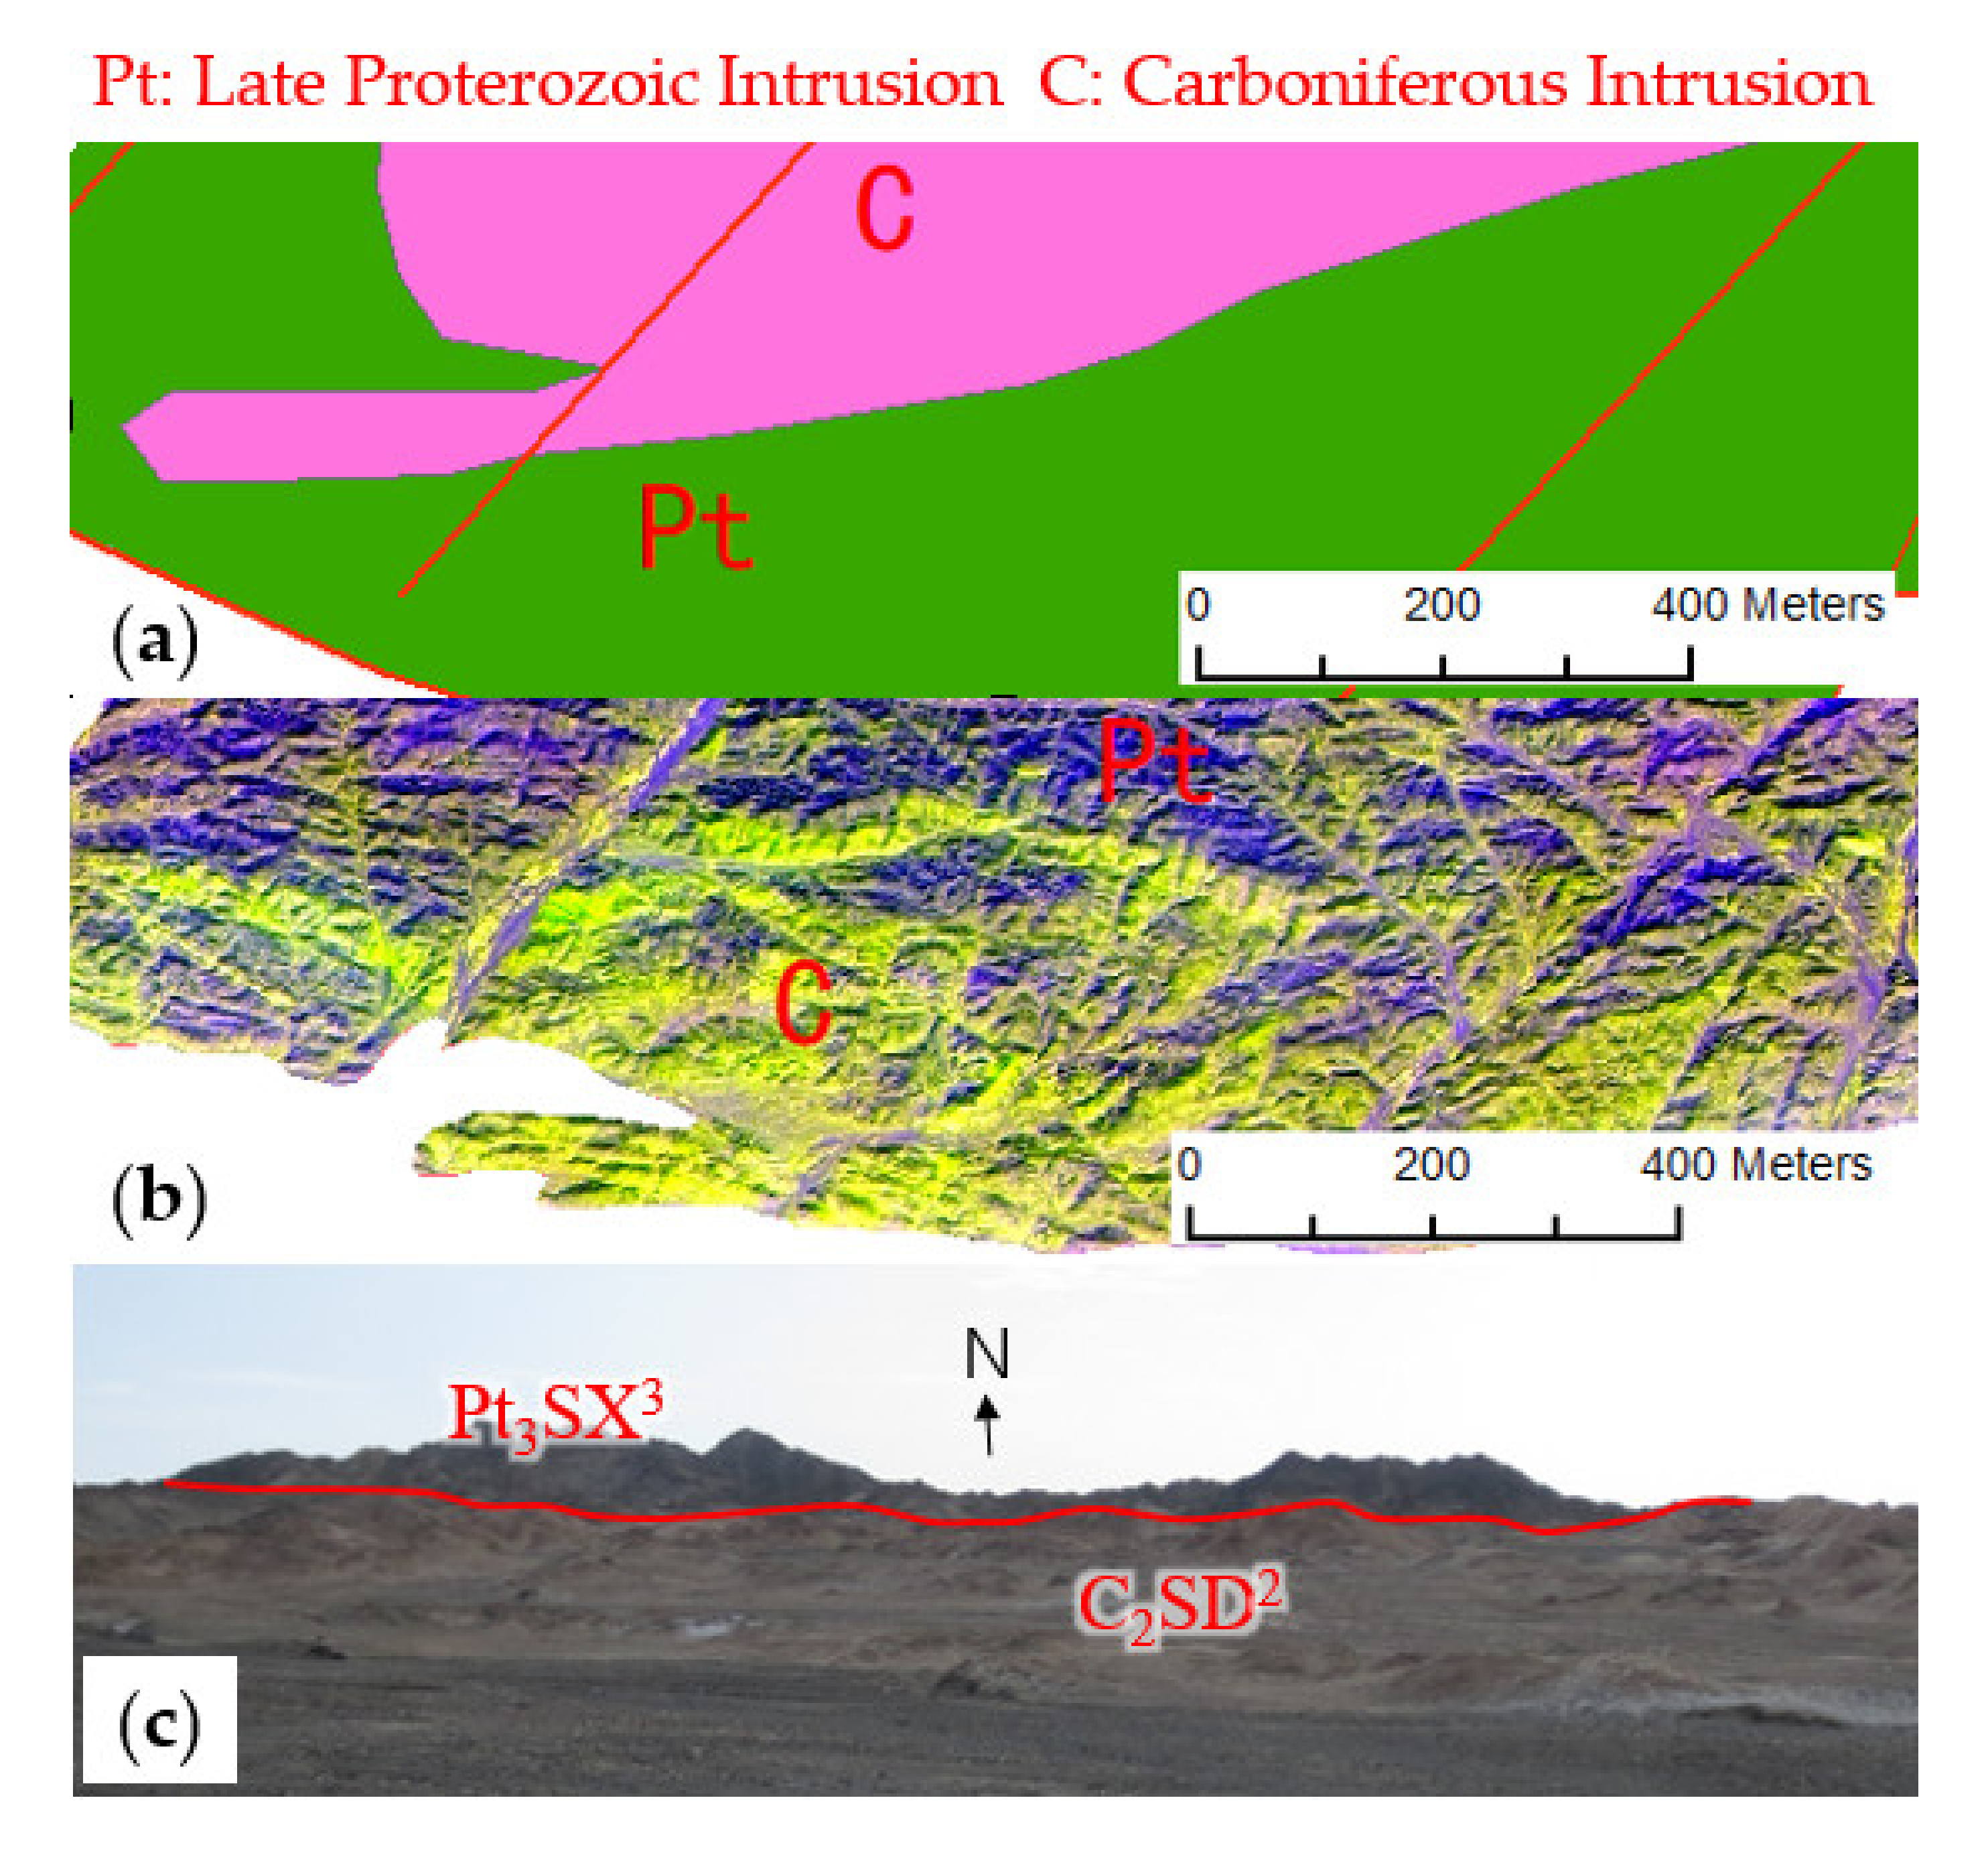
Figure 13 shows that the boundaries of the enhanced intrusions were closer to the field validation results. However, there was a difference between the BRM-PCA enhancement result and the geological map in the center of the northeast part of the study area. The geological map presented in Figure 13a shows that there was a large area in the center exposed a Carboniferous intrusion, but the BRM-PCA enhancement result shows that the Late Proterozoic was the main intrusion exposed (Figure 13b). The field investigation showed that the BRM-PCA result was closer to the field conditions (Figure 13c,d). Rock samples of exposed intrusion of this region were more intermediate and had no obvious sericite minerals (Figure 13e), which were more like the Late Proterozoic intrusion. In the south part of this region showed in Figure 14, there was also a difference between the BRM-PCA result and the geological map. The field investigation showed that the Carboniferous intrusion dominated the southern edge of the complex of this region, while the Late Proterozoic intrusion exposed to the north of Carboniferous intrusion, which corresponds to the BRM-PCA result.
4.4. Intrusion Complex Mapping Result
The false-color of the BR and RBD enhancement result was proved its performance in the west and center parts of the intrusive complex. Thus, in these regions, intrusion complex mapping was carried out based on the false-color result. The BR of Band 3/Band 2 showed excellent performance with regard to enhancing the dikes; therefore, Band 3/Band 2 were used to map the dikes. In the northeast part, mapping was carried out by using the better enhancement result of BRM-PCA. The results of all of the enhancement methods were proved by geological map and field validation. The boundary of the two-stage intrusions as well as that of dikes was determined. The mapping result is shown in Figure 15.
When comparing the mapping results and the geological map, it can be found that they are highly consistent on the whole, especially in the west and center parts of the complex. At the same time, the results of the complex areas in the northeast are significantly improved compared to those of the existing geological map, thereby providing support for small-scale regional geological surveys and mineralization research in this region.
5. Discussion
5.1. Comparsion between Fused Bands and Original Bands in SWIR When Using the BR and RBD
Based on the same wavelength region bands and image enhancement methods of BR and RBD, we compared the enhancement performance of the original ASTER SWIR bands and GS-fused SWIR bands.
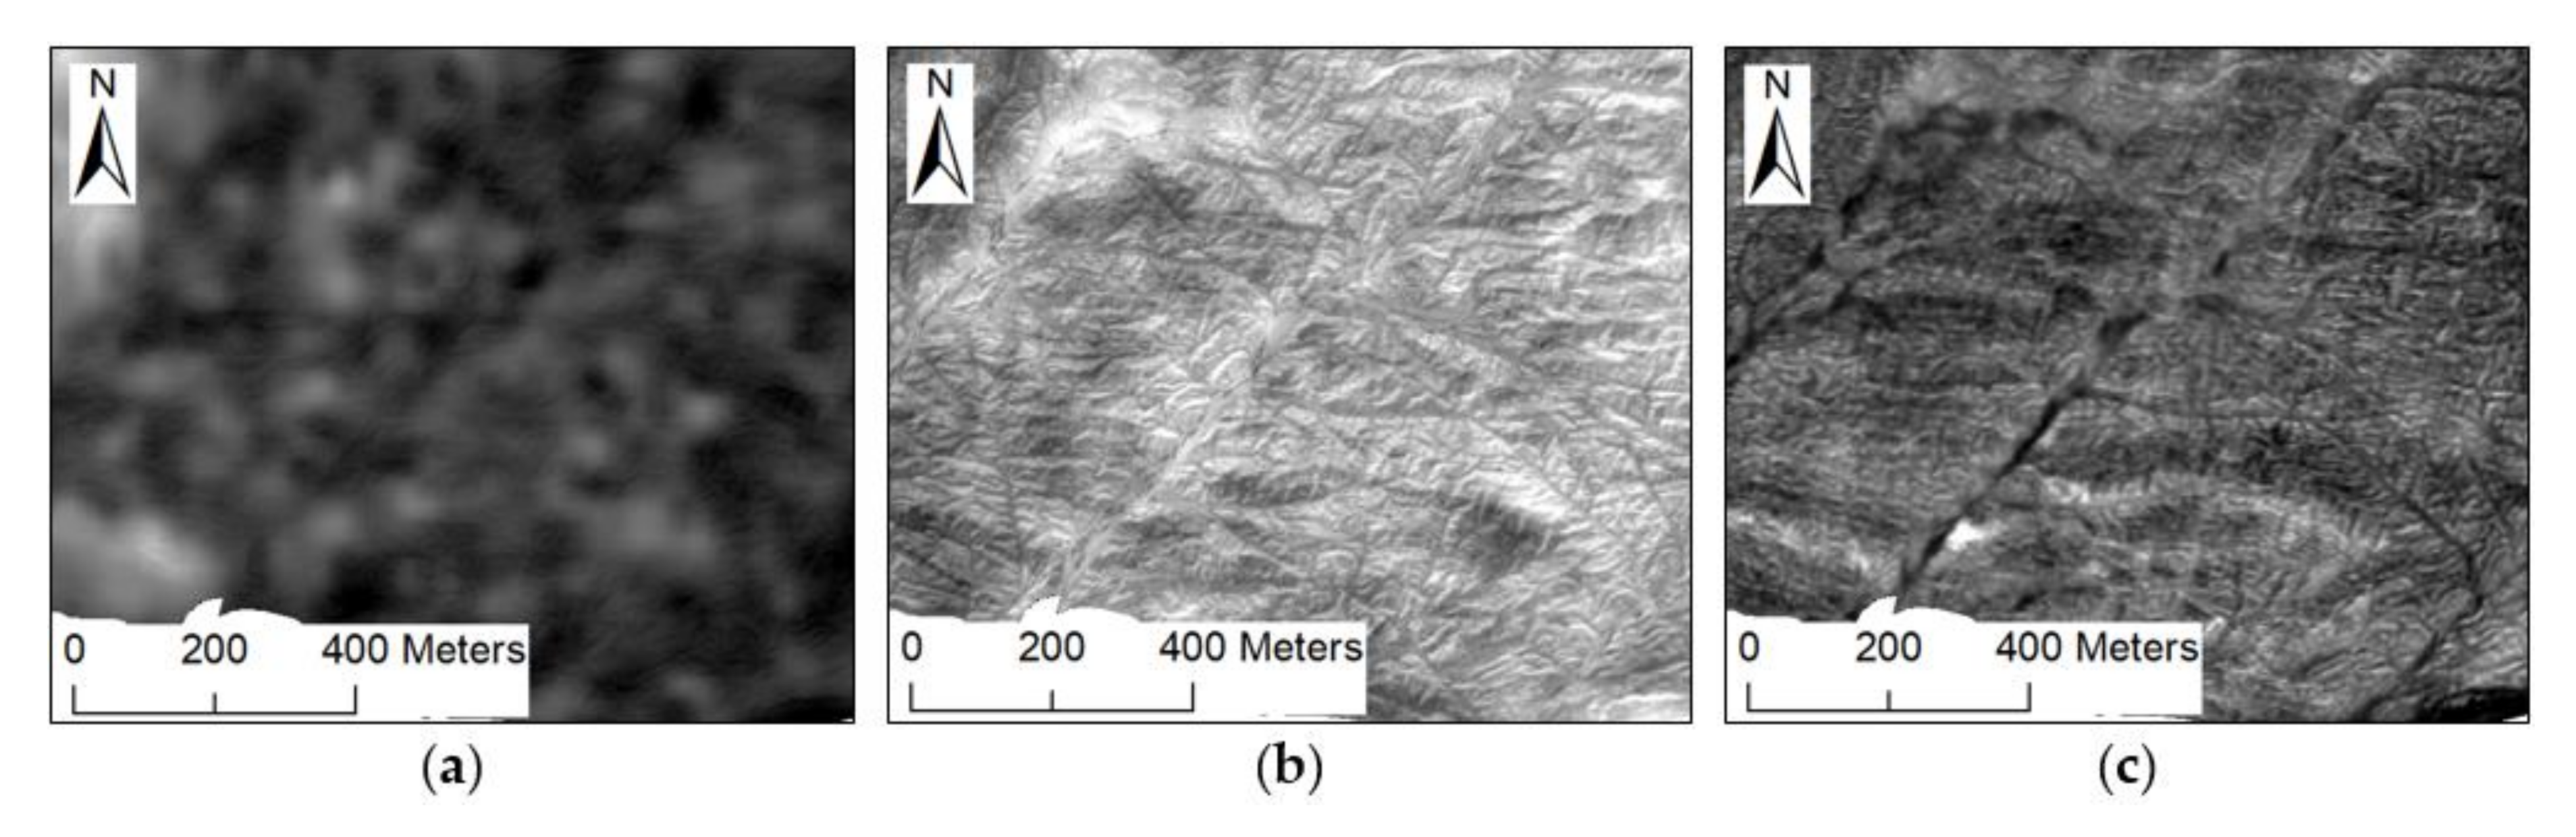
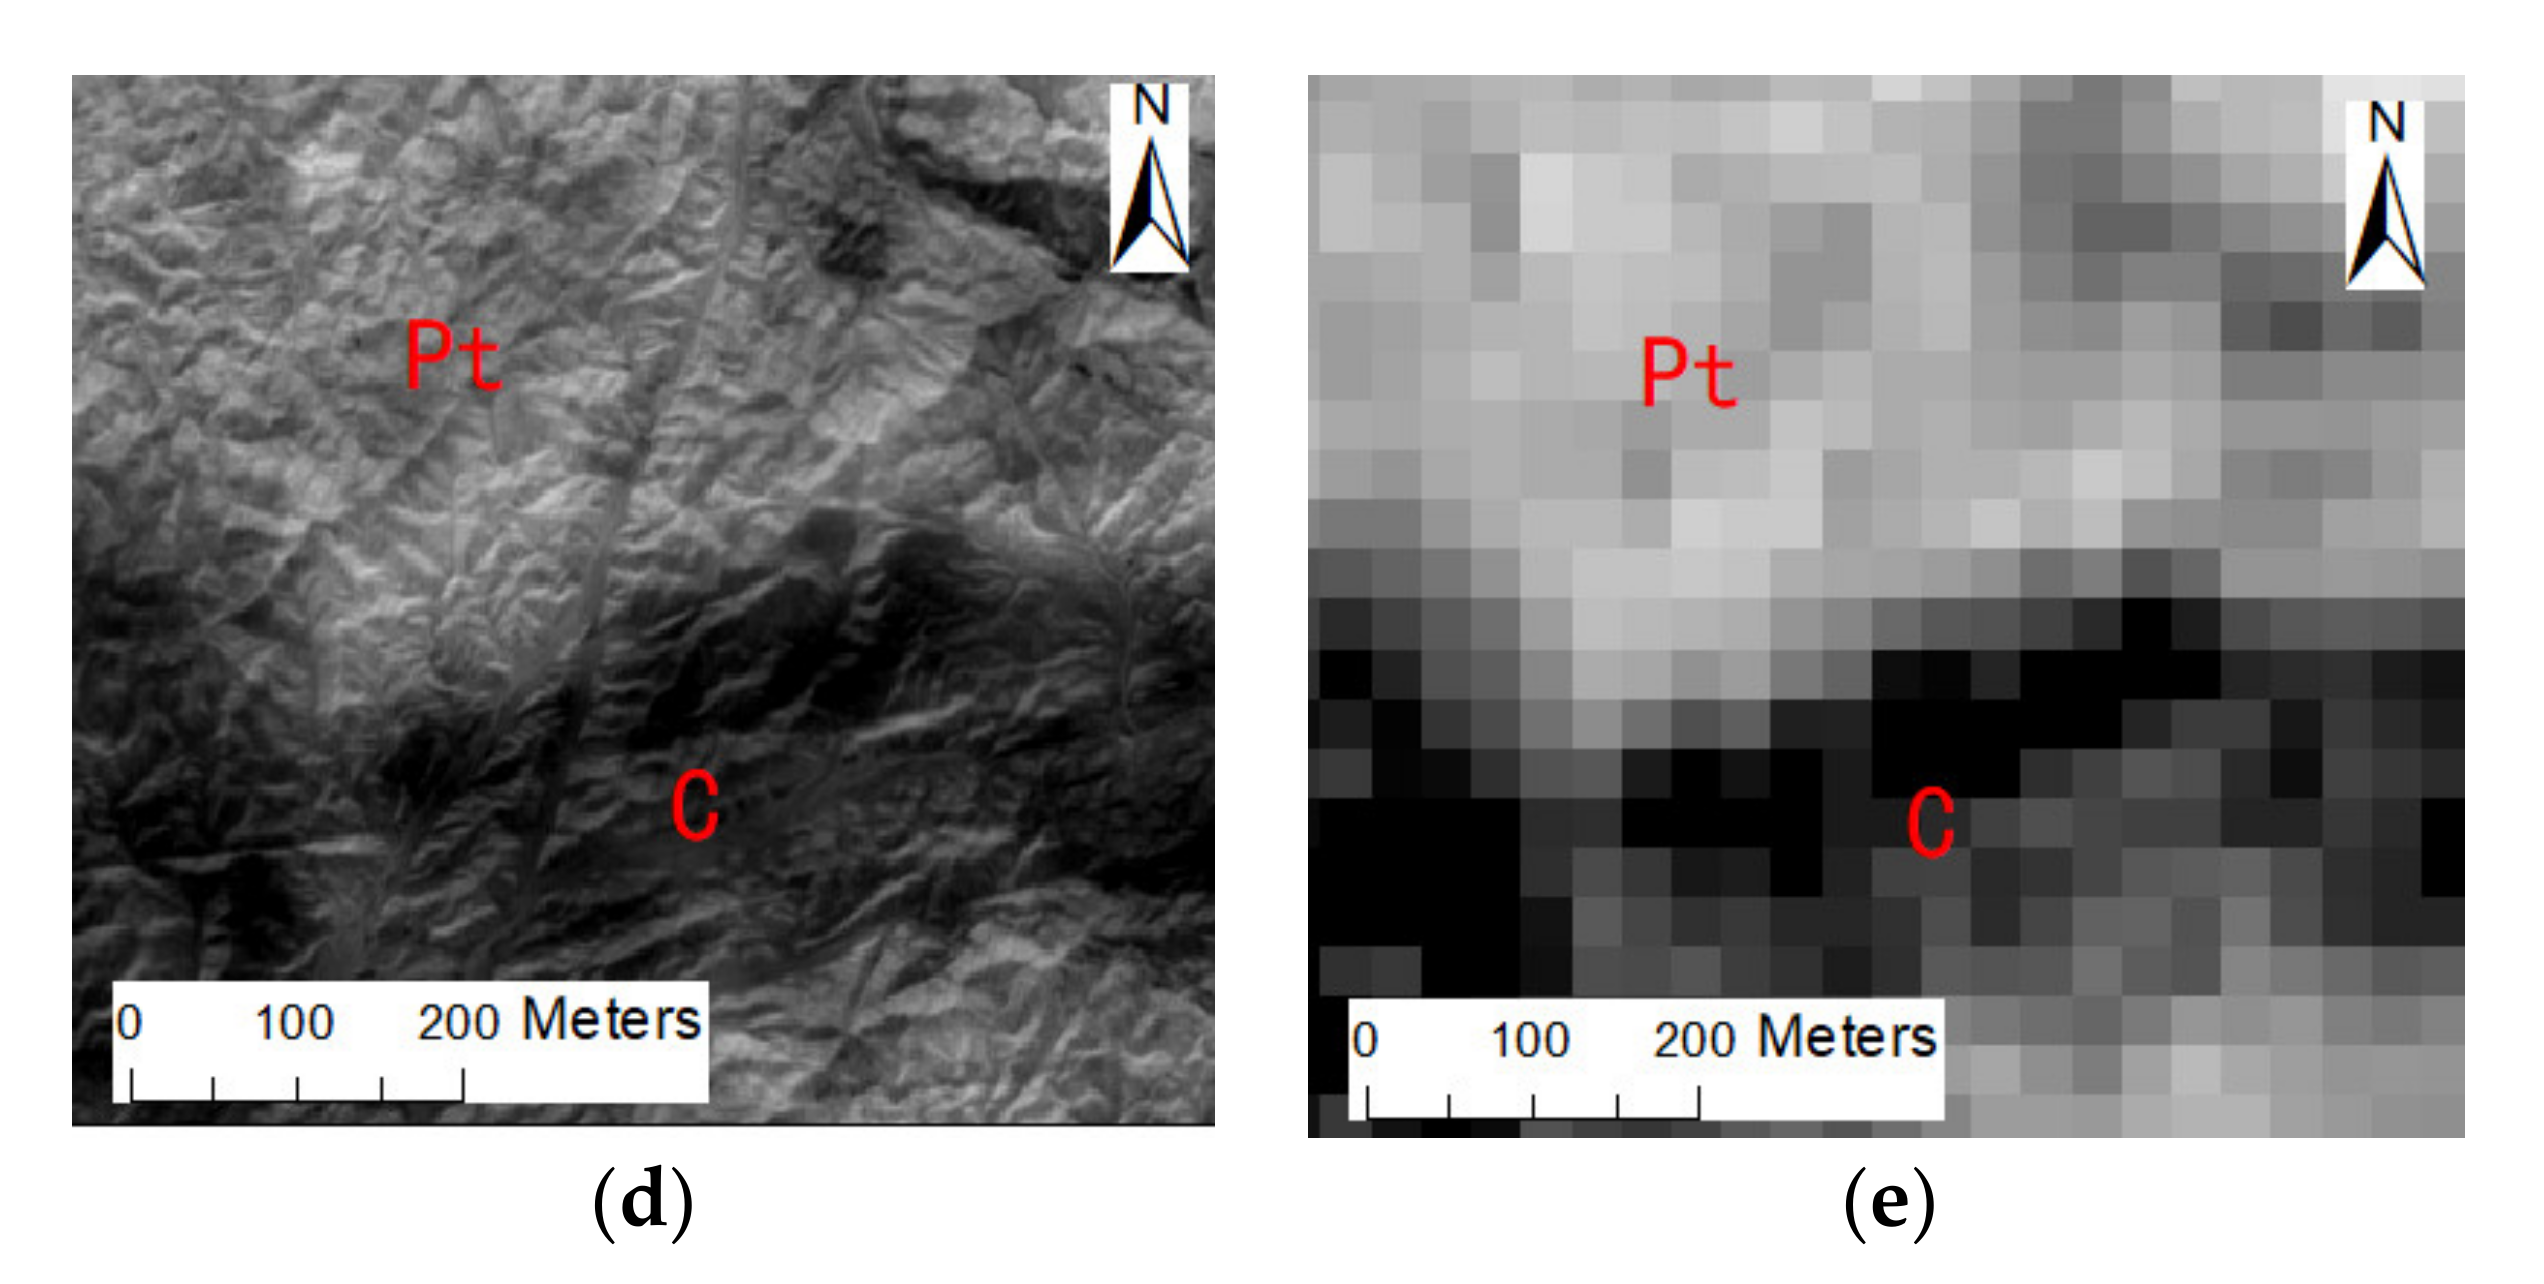
The synergistic dataset bands (Figure 16b,d) and original ASTER SWIR bands (Figure 16c,e) both enhanced the spectral differences between the two stages of intrusion, showing a stronger contrast than that of the true-color image (Figure 16a). However, the enhancement result of the original ASTER SWIR bands had a serious mixed pixel phenomenon due to the limitation of spatial resolution, making the identification of the boundary between the two stage intrusions more difficult and less accurate in small-scale. In contrast, the GS fused band enhancement results had obvious advantages in terms of spatial resolution. The phenomenon of mixed pixels at the boundary was significantly avoided in the enhancement result of synergistic dataset bands, and the texture details greatly helped to identify the boundaries. Therefore, GS fusion is necessary in the process of synergistic image construction to help the intrusion mapping in small-scale.
5.2. Comparsion of Datasets with and without Spectral Synergy When Using BRM-PCA
To prove the necessity of spectral synergy when taking using spectral bands from multi-source remote sensing data, we compared the performance of BRM-PCA method using two datasets. One dataset was created through the process of spectral synergy and then underwent GS fusion (i.e., the whole synergy process proposed in this paper), while the other dataset was created via the GS fusion directly and without undergoing the spectral synergy process. The only difference between the two datasets was the spectral synergy process. The two datasets were enhanced by the same method of BRM-PCA, and the results are shown in Figure 17.
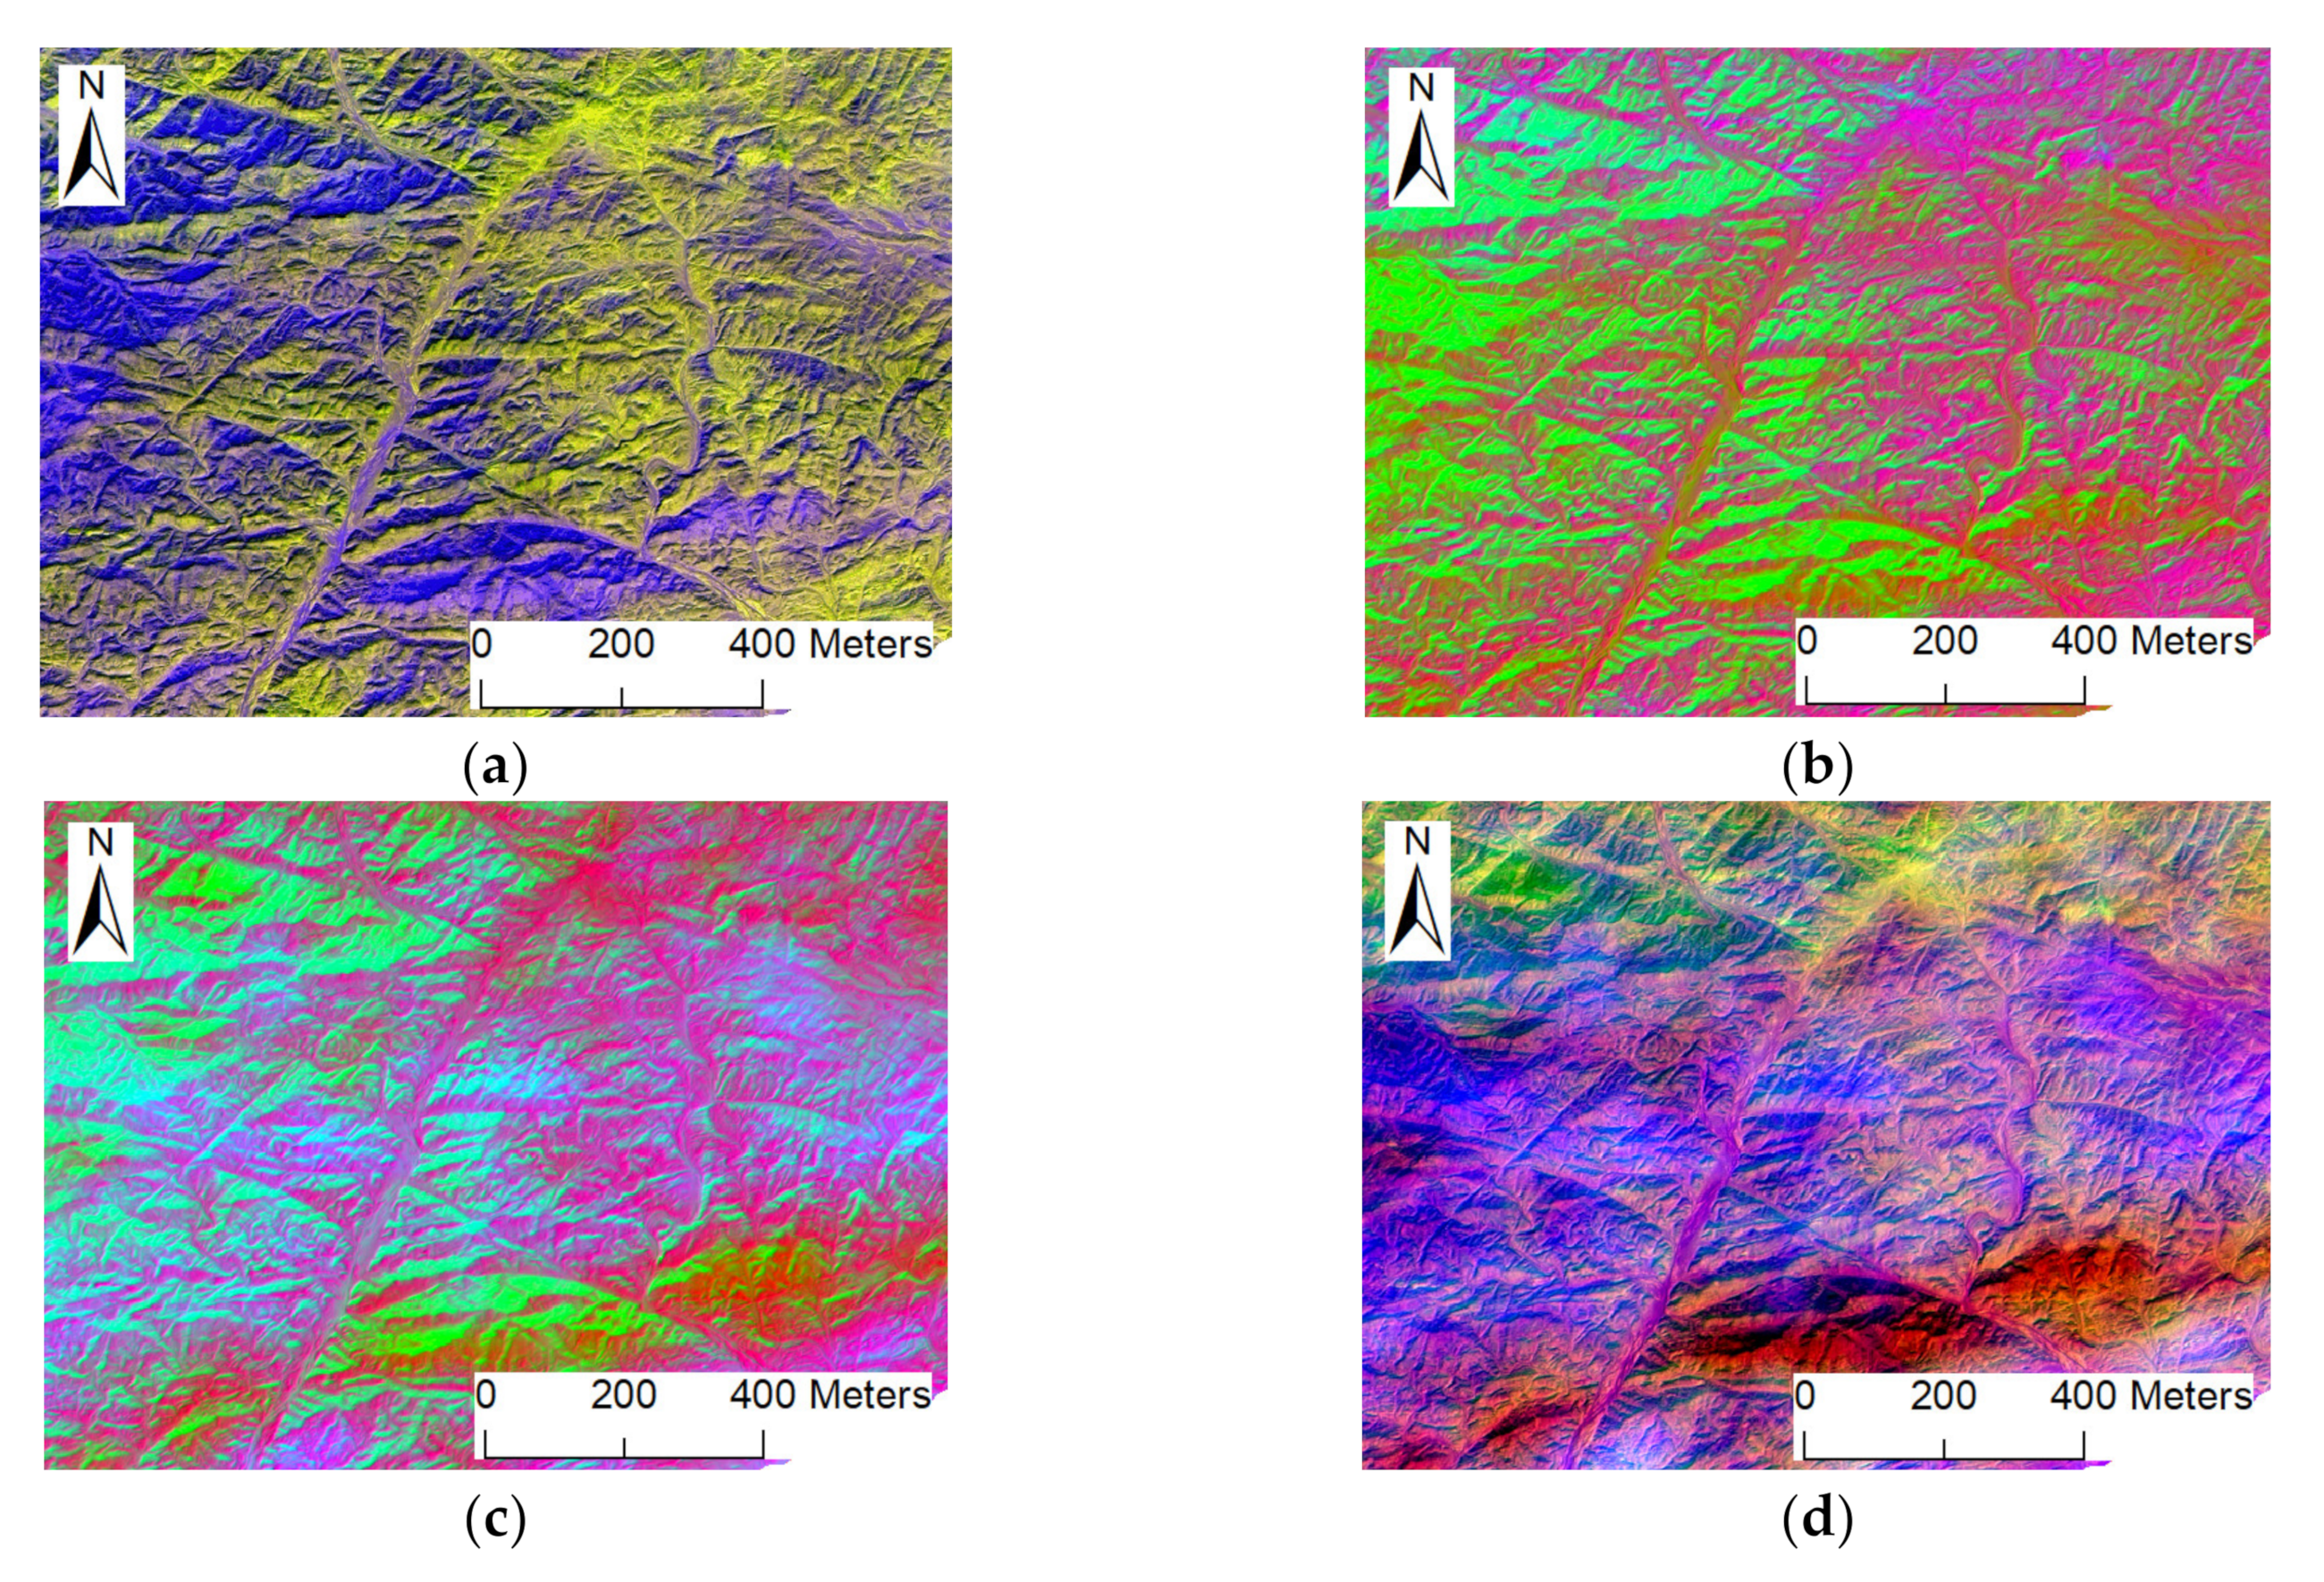
Figure 17 shows the BRM-PCA enhancement results when a synergistic image that had gone through the spectral synergy process was used, while Figure 17b–d shows three false-color combinations of the BRM-PCA bands of a dataset that had not undergone the process of spectral synergy. These had the same spectral band settings and a spatial resolution of 1 m after GS fusion. It was found that without spectral synergy, the BRM-PCA method is not effective for enhancing the difference between the two stage intrusions in complex areas. The synergistic image performed much better, proving the necessity of spectral synergy when using bands from different data sources.
Table 7 shows a comparison of the mean values of the first 13 band ratios in the BRM between the synergistic dataset and the dataset without spectral synergy, i.e., the means of the band ratio of Band 1 and the other 13 bands. It can be found that in the dataset without spectral synergy, when the data source of the spectral bands changes, the mean difference of the band ratio result becomes larger. For example, B1/B2/B3/B7 are from the GF2 sensor, so the means of the B1/B2, B1/B3, and B1/B7 ratios are similar. However, B4/B5/B6 are from Sentinel-2, so there is a significant difference between B1/B4 and the band ratio mentioned above. It is worth noting that there is a greater difference between the band ratios of GF2 and ASTER bands and the abovementioned band ratios. This is obviously due to the inconsistency of spectral responses in bands from different sensors. After spectral synergy, the numerical difference significantly reduces due to the reduction of the difference in spectral response of difference sensors.
It is well-known that the band ratio enhances the compositions of different minerals through the difference in spectral reflectance in specific spectral bands. If the dataset does not go through spectral synergy, the results of the band ratio will vary greatly as a whole when the data-source of the spectral bands changes, which may mask the less obvious spectral difference caused by the mineral content. Therefore, when ratios are calculated using bands from different data sources, the resulting ratios of the image obviously cannot reflect differences in the spectral reflectance of ground objects in specific bands without spectral synergy. BRM is based on the band ratio and is used to calculate all of the non-repetitive ratios of the spectral bands, so that the dataset without spectral synergy cannot achieve satisfactory enhancement results when BRM-PCA is used.
6. Conclusions
In this paper, we proposed a multi-source remote sensing data application method for intrusive complex mapping which includes spectral synergy based on statistical regression and spatial resolution improvement based on the GS spectral sharpening method. This method was applied to the mapping of the Mountain Senfeng intrusive complex in Xinjiang, China using GF2, Sentinal-2, and ASTER data. The results show that (1) through a combination use of GF2, Sentinel-2, and ASTER, the spectral difference of the corresponding wavelength positions in both the VNIR and SWIR of the two stages of intrusion as well as dikes in most regions can be effectively enhanced by the BR and RBD methods, and excellent enhancement results can be obtained by using BRM-PCA and all 14 bands of the synergistic image in the northeast complex region; (2) the GS fusion process gives multi-source data the same spatial resolution and solves the problem of insufficient spatial resolution of ASTER and Sentinel-2 bands in small scale study of intrusive complex mapping; (3) the spectral synergy process is necessary when using multi-source bands such as the BRM-PCA method; otherwise, satisfactory enhancement results cannot be obtained. The Mountain Sanfeng intrusive complex was successfully mapped in this paper, and this process could be used for small-scale regional geological surveys. This method may support small-scale remote sensing geological research.
Certainly, some aspects of the method proposed in this paper can be improved. Firstly, the spatial resolution of the data used in this paper varies greatly and PAN scale was used directly in this study; however, finding the optimal fusion scale may be helpful for improving the enhancement and mapping results. The way in which to evaluate multi-scale fusion results in light of the goals of geological research needs to be further studied, since the quantitative evaluation methods do not always perform well when the situation changes [52]. Secondly, a more accurate algorithm could be employed in the spectral synergy process. This paper employed the regression in the spectral synergy process, which is a method that may reduce the accuracy when there are many extreme pixel values (e.g., rocks with extremely high or very low reflectivity). This method will also cause a larger error when processing BDWs that have extremely low correlations with all BSWs. A Convolutional Neural Network (CNN) [53] may be a potential method to improve the accuracy of the spectral synergy process; although it has been frequently used in remote sensing, it needs further research in terms of multi-source bands fitting.
Author Contributions
Conceptualization, Yuzhou Zhang and Dengrong Zhang; methodology, Yuzhou Zhang and Tangao Hu; validation, Yuzhou Zhang and Dengrong Zhang; result analysis, Yuzhou Zhang; investigation, Yuzhou Zhang and Jinwei Duan; writing—original draft preparation, Yuzhou Zhang and Tangao Hu; writing—review and editing, Dengrong Zhang; visualization, Jinwei Duan; supervision, Dengrong Zhang and Tangao Hu; funding acquisition, Dengrong Zhang. All authors have read and agreed to the published version of the manuscript.
Funding
This research was funded by the Program of Research and Application of High-Resolution Remote Sensing Geology and Mineral Resources Survey Technology in Key Metallogenic Belts in Western China (Grant No. 12120113100200).
Acknowledgments
The GF2 datasets were provided by the Natural Resources Aerial Geophysical Exploration and Remote Sensing Center of China Geological Survey.
Conflicts of Interest
The authors declare that there is no conflict of interest.
References
- Soloviev, S.G. Geology, mineralization, and fluid inclusion characteristics of the Kumbel oxidized W-Cu-Mo skarn and Au-W stockwork deposit in Kyrgyzstan, Tien Shan. Miner. Depos. 2015, 50, 187–220. [Google Scholar] [CrossRef]
- Farahbakhsh, E.; Shirmard, H.; Bahroudi, A.; Eslamkish, T. Fusing ASTER and QuickBird-2 Satellite Data for Detailed Investigation of Porphyry Copper Deposits Using PCA; Case Study of Naysian Deposit. Iran. J. Indian Soc. Remote Sens. 2016, 44, 525–537. [Google Scholar] [CrossRef]
- Hunt, G.R. Spectral signatures of particulate minerals in the visible and near infrared. Geophysics 1977, 42, 501–513. [Google Scholar] [CrossRef] [Green Version]
- Cloutis, E.A.; Gaffey, M.J.; Jackowski, T.L.; Reed, K.L. Calibrations of phase abundance, composition, and particle size distribution for olivine-orthopyroxene mixtures from reflectance spectra. J. Geophys. Res. Solid Earth 1986, 91, 11641–11653. [Google Scholar] [CrossRef]
- Clark, R.N.; King, T.V.V.; Klejwa, M.; Swayze, G.A.; Vergo, N. High spectral resolution reflectance spectroscopy of minerals. J. Geophys. Res. Solid Earth 1990, 95, 12653–12680. [Google Scholar] [CrossRef] [Green Version]
- Salisbury, J.W.; Walter, L.S. Thermal infrared (2.5–13.5μm) spectroscopic remote sensing of igneous rock types on particulate planetary surfaces. J. Geophys. Res. Solid Earth 1989, 94, 9192–9202. [Google Scholar] [CrossRef]
- Abrams, M.; Abbott, E.; Kahle, A. Combined use of visible, reflected infrared, and thermal infrared images for mapping Hawaiian lava flows. J. Geophys. Res. Solid Earth 1991, 96, 475–484. [Google Scholar] [CrossRef]
- Guha, A.; Chakraborty, D.; Ekka, A.B.; Pramanik, K.; Kumar, K.V.; Chatterjee, S.; Subramanium, S.; Rao, D.A. Spectroscopic study of rocks of Hutti-Maski schist belt, Karnataka. J. Geol. Soc. India 2012, 79, 335–344. [Google Scholar] [CrossRef]
- Massironi, M.; Bertoldi, L.; Calafa, P.; Visona, D.; Bistacchi, A.; Giardino, C.; Schiavo, A. Interpretation and processing of ASTER data for geological mapping and granitoids detection in the Saghro massif (eastern Anti-Atlas, Morocco). Geosphere 2008, 4, 736–759. [Google Scholar] [CrossRef] [Green Version]
- Yamaguchi, Y.; Kahle, A.B.; Tsu, H.; Kawakami, T. Overview of Advanced Spaceborne Thermal Emission and Reflection Radiometer (ASTER). IEEE Trans. Geosci. Remote Sens. 1998, 36, 1062–1071. [Google Scholar] [CrossRef] [Green Version]
- Abrams, M. The Advanced Spaceborne Thermal Emission and Reflection Radiometer (ASTER): Data products for the high spatial resolution imager on NASA’s Terra platform. Int. J. Remote Sens. 2000, 21, 847–859. [Google Scholar] [CrossRef]
- Rowan, L.C.; Mars, J.C. Lithologic mapping in the Mountain Pass, California area using Advanced Spaceborne Thermal Emission and Reflection Radiometer (ASTER) data. Remote Sens. Environ. 2003, 84, 350–366. [Google Scholar] [CrossRef]
- Mars, J.C.; Rowan, L.C. Spectral assessment of new ASTER SWIR surface reflectance data products for spectroscopic mapping of rocks and minerals. Remote Sens. Environ. 2010, 114, 2011–2025. [Google Scholar] [CrossRef]
- Pour, A.B.; Hashim, M.; Hong, J.K.; Park, Y. Lithological and alteration mineral mapping in poorly exposed lithologies using Landsat-8 and ASTER satellite data: North-eastern Graham Land, Antarctic Peninsula. Ore Geol. Rev. 2019, 108, 112–133. [Google Scholar] [CrossRef]
- Van der Meer, F.D.; van der Werff, H.M.A.; van Ruitenbeek, F.J.A. Potential of ESA’s Sentinel-2 for geological applications. Remote Sens. Environ. 2014, 148, 124–133. [Google Scholar] [CrossRef]
- Sousa, F.J.; Sousa, D.J. Spatial Patterns of Chemical Weathering at the Basal Tertiary Nonconformity in California from Multispectral and Hyperspectral Optical Remote Sensing. Remote Sens. 2019, 11, 2528. [Google Scholar] [CrossRef] [Green Version]
- Liu, L.; Zhou, J.; Jiang, D.; Zhuang, D.F.; Mansaray, L.R.; Zhang, B. Targeting Mineral Resources with Remote Sensing and Field Data in the Xiemisitai Area, West Junggar, Xinjiang, China. Remote Sens. 2013, 5, 3156–3171. [Google Scholar] [CrossRef] [Green Version]
- Abd-El Monsef, H.; Khalifa, I.H.; Faisal, M. Mapping of hydrothermal alteration zones associated with potential sulfide mineralization using the spectral linear unmixing technique and WorldView II images at Wadi Rofaiyed, South Sinai, Egypt. Arab. J. Geosci. 2015, 8, 9285–9300. [Google Scholar] [CrossRef]
- Robson, A.; Rahman, M.M.; Muir, J. Using World View Satellite Imagery to Map Yield in Avocado (Persea americana): A Case Study in Bundaberg, Australia. Remote Sens. 2017, 9, 1223. [Google Scholar] [CrossRef] [Green Version]
- Han, L.; Zhao, B.; Wu, J.; Zhang, S.; Pilz, J.; Yang, F. An integrated approach for extraction of lithology information using the SPOT 6 imagery in a heavily Quaternary-Covered region North Baoji District of China. Geol. J. 2018, 53, 352–363. [Google Scholar] [CrossRef]
- Yang, M.; Kang, L.; Chen, H.; Zhou, M.; Zhang, J. Lithological mapping of East Tianshan area using integrated data fused by Chinese GF-1 PAN and ASTER multi-spectral data. Open Geosci. 2018, 10, 532–543. [Google Scholar] [CrossRef]
- Ghassemian, H. A review of remote sensing image fusion methods. Inf. Fusion 2016, 32, 75–89. [Google Scholar] [CrossRef]
- Chatterjee, R.S.; Prabakaran, B.; Jha, V.K. Fusion of surface relief data with high spectral and spatial resolution satellite remote sensor data for deciphering geological information in a mature topographic terrain. Int. J. Remote Sens. 2003, 24, 4761–4775. [Google Scholar] [CrossRef]
- Hadigheh, S.M.H.; Ranjbar, H. Lithological Mapping in the Eastern Part of the Central Iranian Volcanic Belt Using Combined ASTER and IRS data. J. Indian Soc. Remote Sens. 2013, 41, 921–931. [Google Scholar] [CrossRef]
- Zhang, D.D.; Zhang, L.; Xie, F. Preprocessing and fusion analysis of GF-2 satellite Remote-sensed spatial data. In Proceedings of the International Conference on Information Systems and Computer Aided Education (ICISCAE), Changchun, China, 6–8 July 2018. [Google Scholar]
- Ren, K.; Sun, W.W.; Meng, X.C.; Yang, G.; Du, Q. Fusing China GF-5 Hyperspectral Data with GF-1, GF-2 and Sentinel-2A Multispectral Data: Which Methods Should Be Used? Remote Sens. 2020, 12, 882. [Google Scholar] [CrossRef] [Green Version]
- Ghimire, P.; Lei, D.; Juan, N. Effect of Image Fusion on Vegetation Index Quality-A Comparative Study from Gaofen-1, Gaofen-2, Gaofen-4, Landsat-8 OLI and MODIS Imagery. Remote Sens. 2020, 12, 1550. [Google Scholar] [CrossRef]
- Sun, Y.Q.; Tian, S.F.; Di, B.G. Extracting mineral alteration information using WorldView-3 data. Geosci. Front. 2016, 8, 1051–1062. [Google Scholar] [CrossRef]
- Ye, B.; Tian, S.F.; Ge, J.; Sun, Y.Q. Assessment of WorldView-3 Data for Lithological Mapping. Remote Sens. 2017, 9, 1132. [Google Scholar] [CrossRef]
- Zheng, Y.F.; Xiao, W.J.; Zhao, G.C. Introduction to tectonics of China. Gondwana Res. 2013, 23, 1189–1206. [Google Scholar] [CrossRef]
- Xinjiang Bureau of Geological and Mineral Development. Report of Regional Geological Survey of P. R. China, K46E022007 & K46E0020008, Scale 1:50,000; China Geological Survey Special Publication: Xingjiang, China, 1996. [Google Scholar]
- Lobo, F.D.; Souza, P.W.M.; Novo, E.M.L.D.; Carlos, F.M.; Barbosa, C.C.F. Mapping Mining Areas in the Brazilian Amazon Using MSI/Sentinel-2 Imagery (2017). Remote Sens. 2018, 10, 1178. [Google Scholar] [CrossRef] [Green Version]
- Hu, B.; Xu, Y.Y.; Wan, B.; Wu, X.C.; Yi, G.H. Hydrothermally altered mineral mapping using synthetic application of Sentinel-2A MSI, ASTER and Hyperion data in the Duolong area, Tibetan Plateau, China. Ore Geol. Rev. 2018, 101, 384–397. [Google Scholar] [CrossRef]
- Iwasaki, A.; Tonooka, H. Validation of a crosstalk correction algorithm for ASTER/SWIR. IEEE Trans. Geosci. Remote Sens. 2005, 43, 2747–2751. [Google Scholar] [CrossRef]
- Yuan, Q.Q.; Wei, Y.C.; Meng, X.C.; Shen, H.F.; Zhang, L.P. A Multiscale and Multidepth Convolutional Neural Network for Remote Sensing Imagery Pan-Sharpening. IEEE J. Sel. Top. Appl. Earth Observ. Remote Sens. 2018, 11, 978–989. [Google Scholar] [CrossRef] [Green Version]
- Liu, J.G. Smoothing Filter-based Intensity Modulation: A spectral preserve image fusion technique for improving spatial details. Int. J. Remote Sens. 2000, 21, 3461–3472. [Google Scholar] [CrossRef]
- Alparone, L.; Aiazzi, B.; Baronti, S.; Garzelli, A.; Nencini, F. A New Method for MS plus Pan Image Fusion Assessment without Reference. In Proceedings of the IEEE International Geoscience and Remote Sensing Symposium (IGARSS), Denver, CO, USA, 31 July—4 August 2006. [Google Scholar]
- Ehlers, M. Multi-image Fusion in Remote Sensing: Spatial Enhancement vs. Spectral Characteristics Preservation. In Proceedings of the 4th International Symposium on Visual Computing, Las Vegas, NV, USA, 1–3 December 2008. [Google Scholar]
- Laben, C.A.; Brower, B.V. Process for Enhancing the Spatial Resolution of Multispectral Imagery Using Pan-Sharpening. U.S. Patent US6011875, 4 January 2000. [Google Scholar]
- Maurer, T. How to Pan-shrpin Images Using the Gram-Schmidt Pan-sharpen Method—A Recipe. In Proceedings of the International-Society-for-Photogrammetry-and-Remote-Sensing Hannover Workshop, Hannover, Germany, 21–24 May 2013. [Google Scholar]
- Pande, H.; Tiwari, P.S.; Dobhal, S. Analyzing Hyper-Spectral and Multi-Spectral Data Fusion in Spectral Domain. J. Indian Soc. Remote Sens. 2009, 37, 395–408. [Google Scholar] [CrossRef]
- Rowan, L.C.; Goetz, A.F.H.; Ashley, R.P. Discrimination of hydrothermaly altered rocks and unaltered rocks in visible and near infrared multispectral images. Geophysics 1977, 42, 522–535. [Google Scholar] [CrossRef]
- Crowley, J.K.; Brickey, D.W.; Rowan, L.C. Airborne imaging spectrometer data of the Ruby Mountains, Montana: Mineral discrimination using relative absorption band-depth images. Remote Sens. Environ. 1989, 29, 121–134. [Google Scholar] [CrossRef]
- Ge, W.Y.; Cheng, Q.M.; Jing, L.H.; Armenakis, C.; Ding, H.F. Lithological discrimination using ASTER and Sentinel-2A in the Shibanjing ophiolite complex of Beishan orogenic in Inner Mongolia, China. Adv. Space Res. 2018, 62, 1702–1716. [Google Scholar] [CrossRef]
- Hassan, S.M.; El Kazzaz, Y.A.; Taha, M.M.N.; Mohammad, A.T. Late Neoproterozoic basement rocks of Meatiq area, Central Eastern Desert, Egypt: Petrography and remote sensing characterizations. J. Afr. Earth Sci. 2017, 131, 14–31. [Google Scholar] [CrossRef]
- Rajendran, S.; Nasir, S. Hydrothermal altered serpentinized zone and a study of Ni-magnesioferrite-magnetite-awaruite occurrences in Wadi Hibi, Northern Oman Mountain: Discrimination through ASTER mapping. Ore Geol. Rev. 2014, 62, 211–226. [Google Scholar] [CrossRef]
- Bolouki, S.M.; Ramazi, H.R.; Maghsoudi, A.; Pour, A.B.; Sohrabi, G. A Remote Sensing-Based Application of Bayesian Networks for Epithermal Gold Potential Mapping in Ahar-Arasbaran Area, NW Iran. Remote Sens. 2020, 12, 105. [Google Scholar] [CrossRef] [Green Version]
- Zoheir, B.; Emam, A.; Abdel-Wahed, M.; Soliman, N. Multispectral and Radar Data for the Setting of Gold Mineralization in the South Eastern Desert, Egypt. Remote Sens. 2019, 11, 1450. [Google Scholar] [CrossRef] [Green Version]
- Askari, G.; Pour, A.B.; Pradhan, B.; Sarfi, M.; Nazemnejad, F. Band Ratios Matrix Transformation (BRMT): A Sedimentary Lithology Mapping Approach Using ASTER Satellite Sensor. Sensors 2018, 18, 3213. [Google Scholar] [CrossRef] [PubMed] [Green Version]
- Chavez, P.S.; Kwarteng, A.Y. Extracting Spectral Contrast in Landsat Thematic Mapper Image Data Using Selective Principal Component Analysis. Photogramm. Eng. Remote Sens. 1989, 55, 339–348. [Google Scholar]
- Crosta, A.P.; Moore, J.M. Enhancement of Landsat Thematic Mapper Imagery for Residual Soil Mapping in SW Minas Gerais State, Brazil: A Prospecting Case History in Greenstone Belt Terrain. In Proceedings of the 9th Thematic Conference on Remote Sensing for Exploration Geology, Calgary, AB, Canada, 2–6 October 1989; pp. 1173–1187. [Google Scholar]
- Klonus, S.; Ehlers, M. Performance of evaluation methods in image fusion. In Proceedings of the 12th International Conference on Information Fusion, Seattle, WA, USA, 6–9 July 2009. [Google Scholar]
- LeCun, Y.; Bengio, Y.; Hinton, G. Deep learning. Nature 2015, 521, 436–444. [Google Scholar] [CrossRef] [PubMed]
Figure 1.
The location and true-color image of the Mountain Sanfeng intrusive complex.

Figure 2.
Geologic map of the study area.

Figure 3.
Spectral settings of Gaofen-2 (GF-2), Sentinel-2 and Advanced Spaceborne Thermal Emission and Reflection Radiometer (ASTER).
Figure 3.
Spectral settings of Gaofen-2 (GF-2), Sentinel-2 and Advanced Spaceborne Thermal Emission and Reflection Radiometer (ASTER).

Figure 4.
Flowchart of spectral synergy processes of ASTER and GF2.

Figure 5.
Scatterplots and regression lines of bands at similar wavelength positions (BSWs).

Figure 6.
Laboratory Spectra of the Late Proterozoic, Carboniferous intrusive rock samples, and dikes in the short-wave infrared (SWIR) (a) and visible/near infrared (VNIR) (b) wavelength regions.
Figure 6.
Laboratory Spectra of the Late Proterozoic, Carboniferous intrusive rock samples, and dikes in the short-wave infrared (SWIR) (a) and visible/near infrared (VNIR) (b) wavelength regions.

Figure 7.
Enhancement Results of (Band 10+Band 12)/Band 11 relative absorption band depth (RBD) (a), Band 14/Band 13 band ratio (BR) (b), and Band 3/Band 2 BR (c).
Figure 7.
Enhancement Results of (Band 10+Band 12)/Band 11 relative absorption band depth (RBD) (a), Band 14/Band 13 band ratio (BR) (b), and Band 3/Band 2 BR (c).

Figure 8.
Geological map (a), enhancement results of (Band 10+Band 12)/Band 11 RBD (b), Band 14/Band 13 BR (c), and field validation photos (d).
Figure 8.
Geological map (a), enhancement results of (Band 10+Band 12)/Band 11 RBD (b), Band 14/Band 13 BR (c), and field validation photos (d).

Figure 9.
Geological map (a), enhancement results of Band 3/Band 2 BR (b) and field validation photos (c,d).
Figure 9.
Geological map (a), enhancement results of Band 3/Band 2 BR (b) and field validation photos (c,d).

Figure 10.
R: RBD (Band 10+Band 12)/Band 11, G: Band ratio Band 3/Band 2 and B: Band ratio Band 14/Band 13 false-color image.
Figure 10.
R: RBD (Band 10+Band 12)/Band 11, G: Band ratio Band 3/Band 2 and B: Band ratio Band 14/Band 13 false-color image.

Figure 11.
(Band 10+Band 12)/Band 11 RBD (a), Band 14/Band 13 BR (b) and Band 3/Band 2 BR (c) enhancement results in the northeast part of study area.
Figure 11.
(Band 10+Band 12)/Band 11 RBD (a), Band 14/Band 13 BR (b) and Band 3/Band 2 BR (c) enhancement results in the northeast part of study area.

Figure 12.
Enhancement Result in the Northeast Region of the Intrusive Complex by the Band Ratio Matrix (BRM)-Principal Component Analysis (PCA) Method (a) and the Former False-Color Method (b).
Figure 12.
Enhancement Result in the Northeast Region of the Intrusive Complex by the Band Ratio Matrix (BRM)-Principal Component Analysis (PCA) Method (a) and the Former False-Color Method (b).

Figure 13.
Geological map (a), enhancement result of BRM-PCA (b) and field validation photos (c–e).

Figure 14.
Enhancement result of BRM-PCA (b), geological map (a) and field validation photos (c).

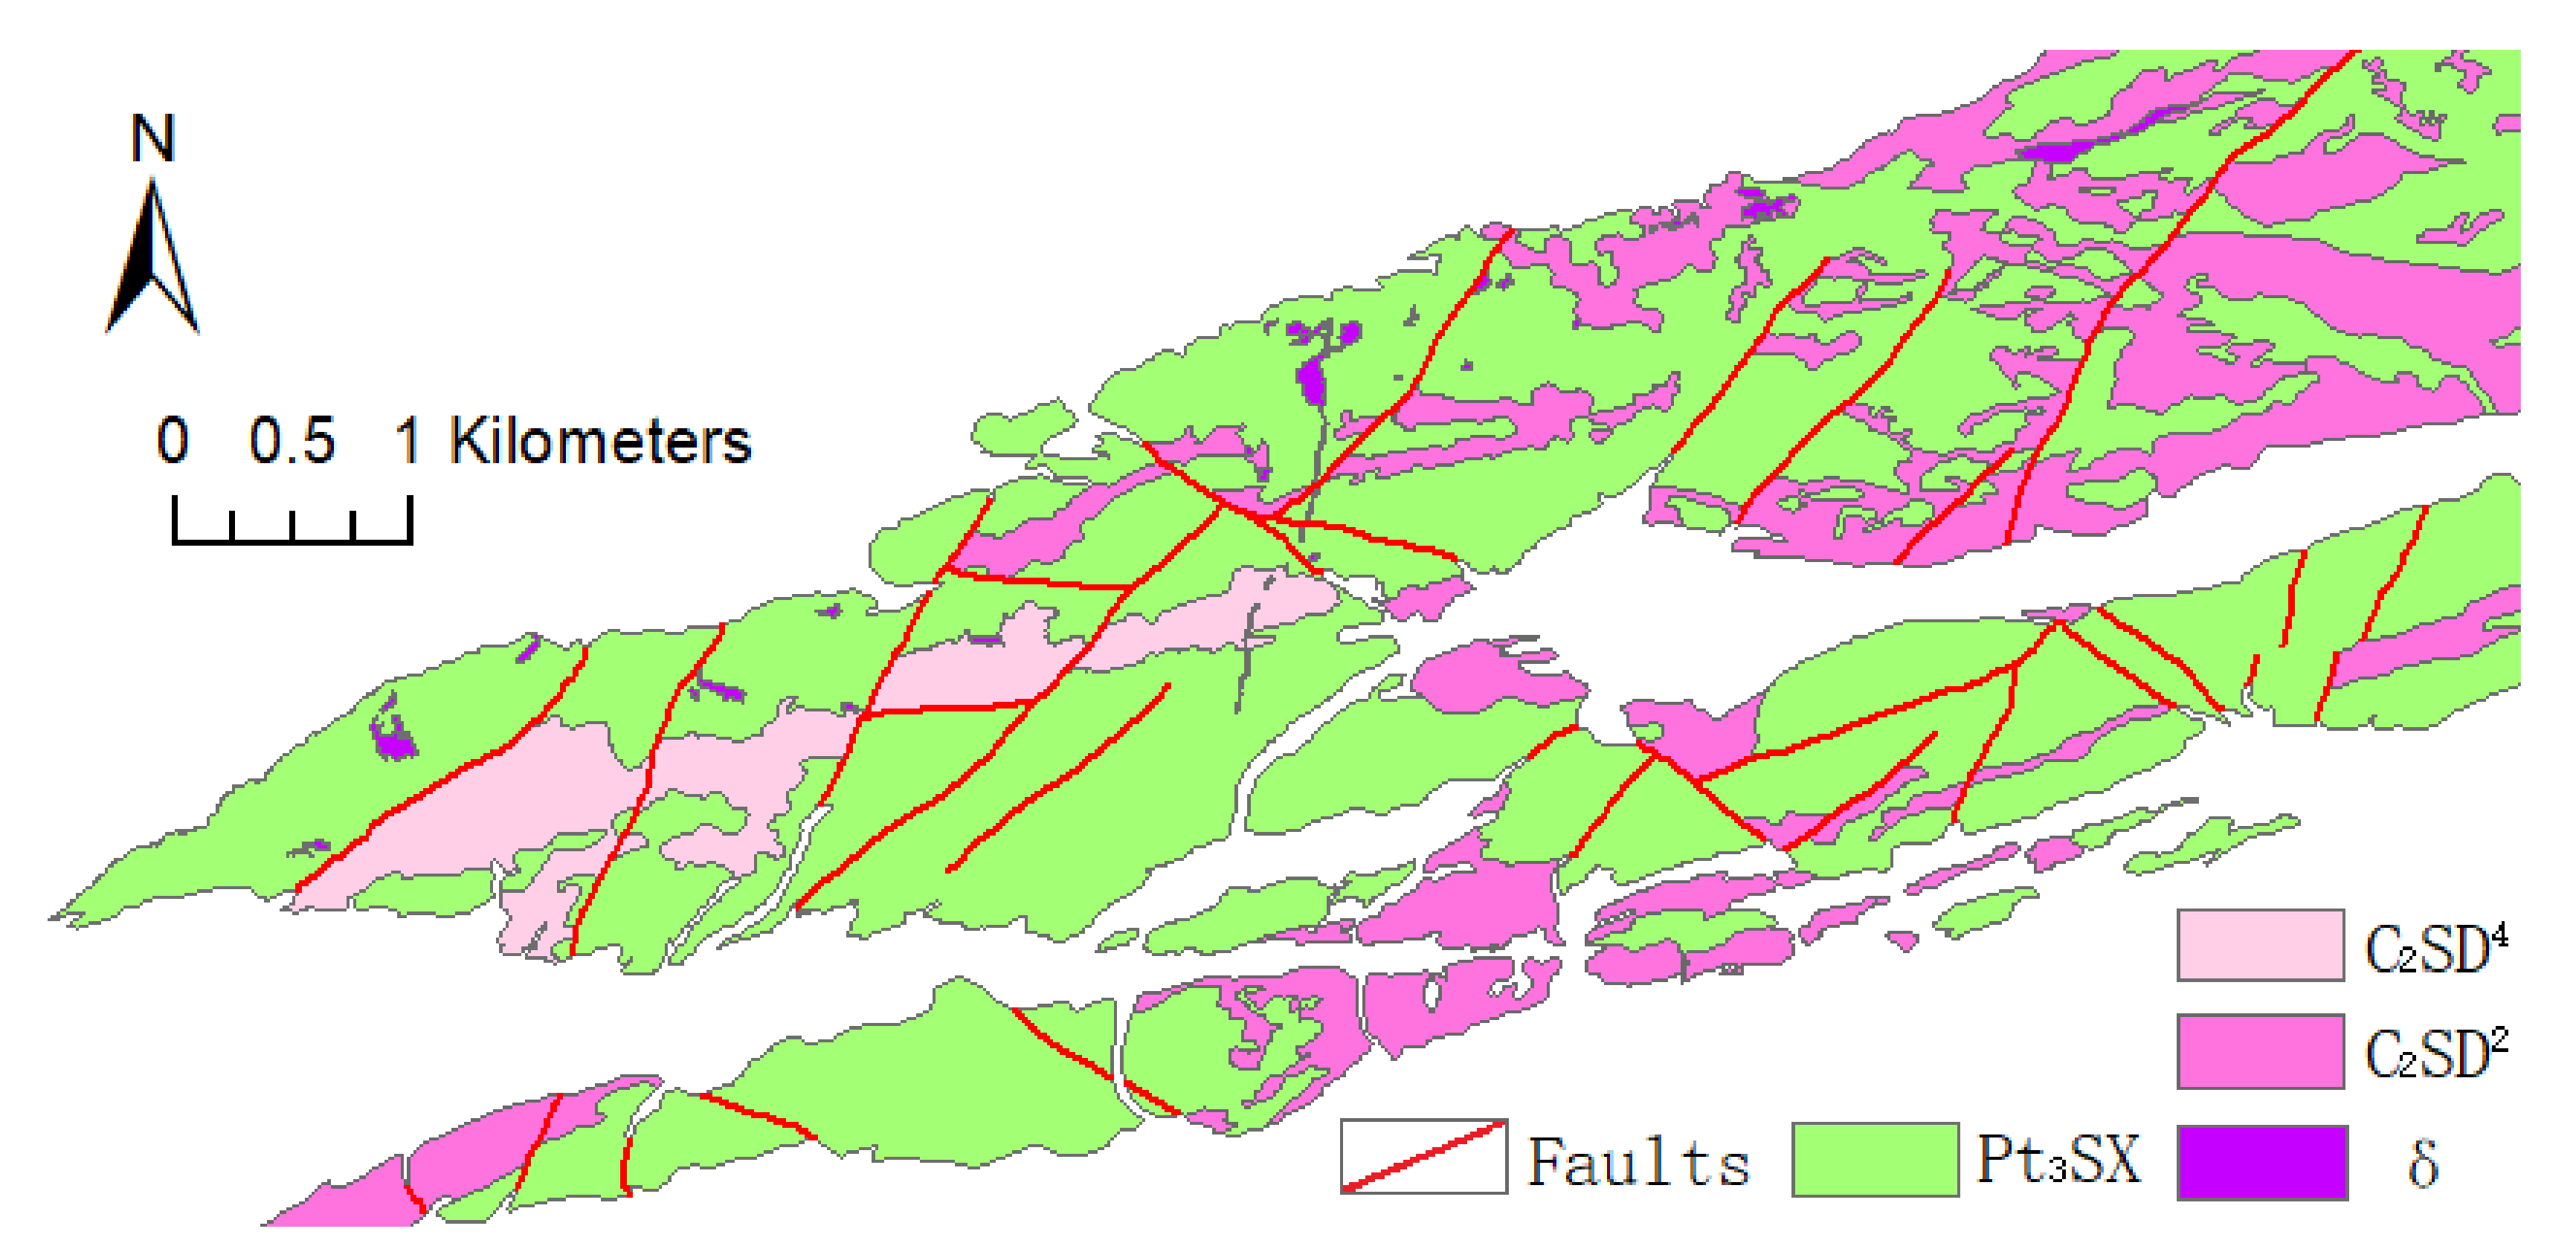
Figure 15.
Mountain Sanfeng Intrusive Complex Mapping Result.

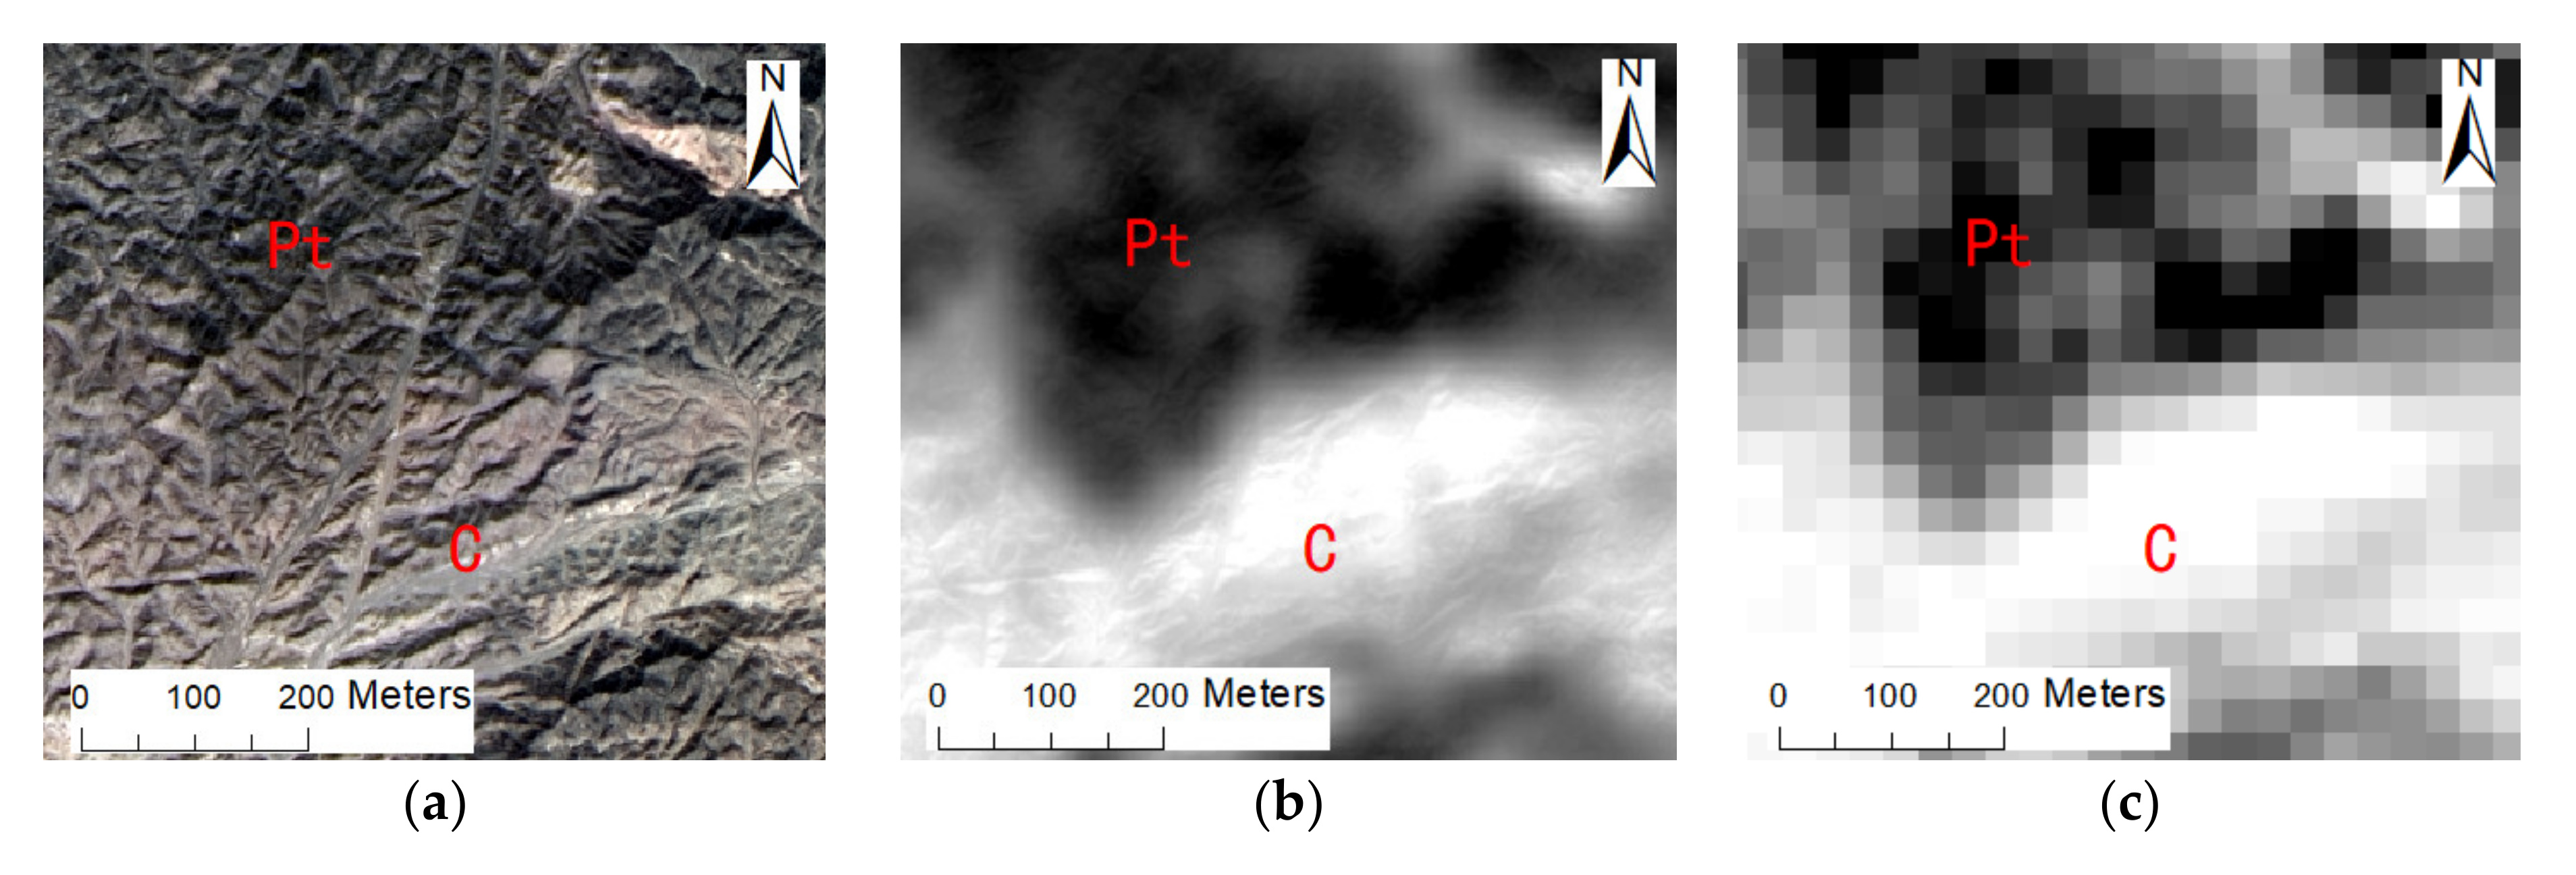
Figure 16.
True-color Image (a); GS-fused Synergistic Image RBD of (Band 10+Band 12)/Band 11 (b) and BR of Band 14/Band 13 (d); ASTER RBD of (Band 5+Band 7)/Band 6 (c) and BR of Band 9/Band 8 (e).
Figure 16.
True-color Image (a); GS-fused Synergistic Image RBD of (Band 10+Band 12)/Band 11 (b) and BR of Band 14/Band 13 (d); ASTER RBD of (Band 5+Band 7)/Band 6 (c) and BR of Band 9/Band 8 (e).


Figure 17.
BRM-PCA enhancement results using dataset with spectral synergy ((a), RGB: PC1, PC2, PC5) and using dataset without spectral synergy ((b), RGB: PC1, PC2, PC3; (c), RGB: PC1, PC2, PC5; (d), RGB: PC1, PC3, PC5).
Figure 17.
BRM-PCA enhancement results using dataset with spectral synergy ((a), RGB: PC1, PC2, PC5) and using dataset without spectral synergy ((b), RGB: PC1, PC2, PC3; (c), RGB: PC1, PC2, PC5; (d), RGB: PC1, PC3, PC5).


Table 1.
GF-2, ASTER and Sentinel-2 sensors characteristics.
| Sensor | Revisit Time (day) | Spectral Bands | Wavelength (nm) | Spatial Resolution (m) |
|---|---|---|---|---|
| Gaofen2 | 5 days when side swing is applied | Pan | 450–900 | 1 |
| MS Band1 | 450–520 | 4 | ||
| MS Band2 | 520–590 | 4 | ||
| MS Band3 | 630–690 | 4 | ||
| MS Band4 | 770–790 | 4 | ||
| ASTER | 16 (Unable to obtain new valid data now) | VNIR Band1 | 520–600 | 15 |
| VNIR Band2 | 630–690 | 15 | ||
| VNIR Band3 | 760–860 | 15 | ||
| SWIR Band4 | 1600–1700 | 30 | ||
| SWIR Band5 | 2145–2185 | 30 | ||
| SWIR Band6 | 2185-2225 | 30 | ||
| SWIR Band7 | 2235–2285 | 30 | ||
| SWIR Band8 | 2295–2365 | 30 | ||
| SWIR Band9 | 2360–2430 | 30 | ||
| TIR Band10 | 8125–8475 | 90 | ||
| TIR Band11 | 8475–8825 | 90 | ||
| TIR Band12 | 8925–9275 | 90 | ||
| TIR Band13 | 10,250–10,950 | 90 | ||
| TIR Band14 | 10,950–11,650 | 90 | ||
| Sentinel-2 | 10 (5 days based on 2 satellites) | Band1 | 433–453 | 60 |
| Band2 | 457–522 | 10 | ||
| Band3 | 542–577 | 10 | ||
| Band4 | 650–680 | 10 | ||
| Band5 | 679–718 | 20 | ||
| Band6 | 732–747 | 20 | ||
| Band7 | 773–793 | 20 | ||
| Band8 | 784–899 | 10 | ||
| Band8a | 855–885 | 20 | ||
| Band9 | 935–955 | 60 | ||
| Band10 | 1360–1390 | 60 | ||
| Band11 | 1565–1655 | 20 | ||
| Band12 | 2100–2280 | 20 |
Table 2.
Regression results of ASTER, GF2, and Sentinel-2 similar wavelength setting bands.
| Fitting Bands | Linear | Quadratic Polynomial | Logarithmic | Exponential |
|---|---|---|---|---|
| G Band2—A Band1 | 0.820728 | 0.821575 | 0.812235 | 0.810457 |
| G Band3—A Band2 | 0.801061 | 0.802802 | 0.795070 | 0.787344 |
| G Band4—A Band3 | 0.799412 | 0.801144 | 0.793241 | 0.785993 |
| S Band3—A Band1 | 0.763109 | 0.764744 | 0.764560 | 0.749160 |
| S Band4—A Band2 | 0.750512 | 0.752388 | 0.752319 | 0.732972 |
| S Band8—A Band3 | 0.711796 | 0.713203 | 0.713105 | 0.692518 |
Notes: G represents GF2, A represents ASTER, and S represents Sentinel-2.
Table 3.
Correlation between GF2 band 1 and band 2/3/4.
| Band2 | Band3 | Band4 | |
|---|---|---|---|
| Band1 | 0.993710 | 0.981188 | 0.971365 |
Table 4.
Correlation between Sentinel-2 band 5/6/7/8A and band 3/4/8.
| Band3 | Band4 | Band8 | |
|---|---|---|---|
| Band5 | 0.983793 | 0.987621 | 0.986688 |
| Band6 | 0.983378 | 0.987674 | 0.987220 |
| Band7 | 0.983346 | 0.987734 | 0.987899 |
| Band8A | 0.981903 | 0.986802 | 0.987719 |
Table 5.
Means and standard deviations of the original bands and synergistic bands.
| Original Bands | A Band1 | A Band2 | A Band3 | G Band1 | G Band2 | G Band3 | G Band4 |
| Mean | 3815.15 | 3914.88 | 4298.12 | 1497.50 | 1606.74 | 1819.46 | 1845.82 |
| Stddev | 577.35 | 607.61 | 619.10 | 283.97 | 336.01 | 400.47 | 403.77 |
| Original Bands | S Band3 | S Band4 | S Band8 | S Band5 | S Band6 | S Band7 | S Band8A |
| Mean | 2198.14 | 2470.62 | 2625.94 | 2555.55 | 2524.84 | 2544.16 | 2510.44 |
| Stddev | 221.70 | 264.81 | 287.11 | 273.25 | 272.62 | 274.00 | 269.96 |
| Synergistic Bands | G Band1 | G Band2 | G Band3 | G Band4 | |||
| Mean | 3633.57 | 3814.64 | 3912.78 | 4295.49 | |||
| Stddev | 484.32 | 563.50 | 582.29 | 593.17 | |||
| Synergistic Bands | S Band3 | S Band4 | S Band8 | S Band5 | S Band6 | S Band7 | S Band8A |
| Mean | 3780.25 | 3877.06 | 4257.97 | 4057.14 | 3992.17 | 4088.60 | 4016.88 |
| Stddev | 530.70 | 560.35 | 575.47 | 557.79 | 562.91 | 567.42 | 565.80 |
Notes: G represents GF2, A represents ASTER, and S represents Sentinel-2.
Table 6.
Synergistic image datasets of ASTER, GF-2 and Sentinel-2.
| Spectral Bands | Source Image | Source Band | Wavelength | Spectral Bands | Source Image | Source Band | Wavelength |
|---|---|---|---|---|---|---|---|
| Band 1 | GF-2 | Band1 | 450–520 | Band 8 | Sentinel-2 | Band8a | 855–875 |
| Band 2 | GF-2 | Band2 | 520–590 | Band 9 | ASTER | Band4 | 1600–1700 |
| Band 3 | GF-2 | Band3 | 630–690 | Band 10 | ASTER | Band5 | 2145–2185 |
| Band 4 | Sentinel-2 | Band5 | 698–713 | Band 11 | ASTER | Band6 | 2185–2225 |
| Band 5 | Sentinel-2 | Band6 | 733–748 | Band 12 | ASTER | Band7 | 2235–2285 |
| Band 6 | Sentinel-2 | Band7 | 765–785 | Band 13 | ASTER | Band8 | 2295–2365 |
| Band 7 | GF-2 | Band4 | 770–790 | Band 14 | ASTER | Band9 | 2360–2430 |
Table 7.
Means of the first 13 band ratios of the BRM of datasets with the spectral synergy process and without the spectral synergy process.
Table 7.
Means of the first 13 band ratios of the BRM of datasets with the spectral synergy process and without the spectral synergy process.
| Band Ratio | Spectral Synergy | Without Spectral Synergy | Band Ratio | Spectral Synergy | Without Spectral Synergy |
|---|---|---|---|---|---|
| B1/B2 | 0.953589 | 0.934671 | B1/B9 | 0.656837 | 0.263652 |
| B1/B3 | 0.929816 | 0.830386 | B1/B10 | 0.639677 | 0.257225 |
| B1/B4 | 0.885573 | 0.557248 | B1/B11 | 0.65567 | 0.263654 |
| B1/B5 | 0.90007 | 0.563648 | B1/B12 | 0.65616 | 0.263572 |
| B1/B6 | 0.876937 | 0.558797 | B1/B13 | 0.744578 | 0.298691 |
| B1/B7 | 0.841202 | 0.815966 | B1/B14 | 0.621478 | 0.249575 |
| B1/B8 | 0.89301 | 0.566098 |
© 2020 by the authors. Licensee MDPI, Basel, Switzerland. This article is an open access article distributed under the terms and conditions of the Creative Commons Attribution (CC BY) license (http://creativecommons.org/licenses/by/4.0/).
Share and Cite
MDPI and ACS Style
Zhang, Y.; Zhang, D.; Duan, J.; Hu, T. Mapping of Intrusive Complex on a Small Scale Using Multi-Source Remote Sensing Images. ISPRS Int. J. Geo-Inf. 2020, 9, 543. https://0-doi-org.brum.beds.ac.uk/10.3390/ijgi9090543
AMA Style
Zhang Y, Zhang D, Duan J, Hu T. Mapping of Intrusive Complex on a Small Scale Using Multi-Source Remote Sensing Images. ISPRS International Journal of Geo-Information. 2020; 9(9):543. https://0-doi-org.brum.beds.ac.uk/10.3390/ijgi9090543
Chicago/Turabian StyleZhang, Yuzhou, Dengrong Zhang, Jinwei Duan, and Tangao Hu. 2020. "Mapping of Intrusive Complex on a Small Scale Using Multi-Source Remote Sensing Images" ISPRS International Journal of Geo-Information 9, no. 9: 543. https://0-doi-org.brum.beds.ac.uk/10.3390/ijgi9090543
Note that from the first issue of 2016, this journal uses article numbers instead of page numbers. See further details here.