Identification and Geographic Distribution of Accommodation and Catering Centers


1
School of Information Engineering, China University of Geosciences, Beijing 100083, China
2
Key Laboratory of Land Surface Pattern and Simulation, Institute of Geographic Sciences and Natural Resources Research, Chinese Academy of Sciences, Beijing 100101, China
*
Author to whom correspondence should be addressed.
ISPRS Int. J. Geo-Inf. 2020, 9(9), 546; https://0-doi-org.brum.beds.ac.uk/10.3390/ijgi9090546
Submission received: 2 August 2020
/
Revised: 3 September 2020
/
Accepted: 13 September 2020
/
Published: 14 September 2020
(This article belongs to the Special Issue Measuring, Mapping, Modeling, and Visualization of Cities)
Abstract
:As the most important manifestation of the activities of the life service industry, the reasonable layout of spatial agglomeration and dispersion of the accommodation and catering industry plays an important role in guiding the spatial structure of the urban industry and population. Applying the contour tree and location quotient index methods, based on points of interest (POI) data of the accommodation and catering industry in Beijing and on the identification of the spatial structure and cluster center of the accommodation and catering industry, we investigated the distribution and agglomeration characteristics of the urban accommodation and catering industry from the perspective of industrial spatial differentiation. The results show that: (1) the accommodation and catering industry in Beijing presents a polycentric agglomeration pattern in space, mainly distributed within a radius of 20 km from the city center and on a relatively large scale; areas beyond this distance contain isolated single cluster centers. (2) From the perspective of the industry, the cluster centers close to the core area of the city are characterized by the agglomeration of multiple advantageous industries, while those in the outer suburbs of the city are more prominent in a single industry. (3) From the perspective of the location quotient of cluster centers, the leisure catering industries are mainly located close to the urban centers. On the contrary, the cluster centers in the outer suburbs and counties are relatively small and dominated by restaurants and fast food industries. Commercial accommodation businesses are mainly distributed in the transportation hub centers and in entertainment and leisure areas.
1. Introduction
The accommodation and catering service industry has been created to meet the needs of consumers in accommodation, catering, entertainment, business, and other areas and has gradually become an important part of the life service industry [1]. Its development scale is closely related to the living standards of residents and the scale of regional tourism activities [2,3]. In China, with the gradual improvement of the living standards, the scale of the accommodation and catering industry is increasing. By 2017, the added value of the industry reached 230.43 billion yuan (converted to the level in year 1978), an increase of 1.9 times compared to 2005. The development of this industry not only drives the consumption demand, but has also become an important channel to absorb employment in the tertiary industry, which is regarded as the “stabilizer” of high-quality economic development [4].
The geographic distribution of economic activities is driven by various multi-scale and dimensional factors, which also project the urban spatial structure [5,6]. As an industry that directly provides life services to residents, the accommodation and catering industry generally selects locations with certain attractions regarding geographical and economic aspects [1,2,7,8]. Thus, identifying cluster centers of the accommodation and catering industry is important for understanding urban and regional development, particularly in regions with rapid population growth and high urban reconstruction [9,10]. Conventional opinions about the industry distribution rely highly on expert knowledge (and/or experiences) and on analyses based on administrative district-scale economic census data [3,11]. However, the lack of accurate spatial details of industry agglomeration patterns leads to insufficient knowledge for decision-makers and managers [8,12].
The geographic distribution used here describes the spatial agglomeration or disperse pattern of industries from a combined perspective of spatial morphology and functional differences. The spatial morphology of economic activities represents the pattern or form of cluster space that is distinguished by physical boundaries [13], whereas the functional perspective describes the spatial differences in specialization and functionality of these economic clusters based on industry characteristics and location preferences [14]. With urban sprawl and suburbanization, the locations of economic activities such as manufacturing, commerce, and retail tend to deviate from the central urban area and to concentrate at fast-growing subcenters [6,15,16,17]. These changes in urban spatial structure require the identification of the economic clusters and their spatial specialization differences.
At a spatial level, the accommodation and catering industry is relatively discrete. However, with the rapid development of Internet technology, several types of geospatial data are continuously enriched, such as mobile phone signaling data, Global Positioning System (GPS) trajectory, and point of interest (POI) data. [18,19], providing high-resolution data support for evaluating the spatial distribution patterns of discrete geographical entities. For example, based on POI data and using catering POI data, Lan and Yu [20] analyzed the composition types and temporal and spatial evolution characteristics of restaurants within the Fifth Ring Road in Beijing at three different scales: the macro scale, the meso scale, and the micro scale. Similarly, Zhang and Li [21] identified the urban functional zoning, including commercial center based on the public bicycle rental records of the station and POI data of Hangzhou in China. When evaluating industrial distribution, POI data represent the most commonly used data source. They are defined as a set of geographical entities closely related to human life and contain rich information on industry categories in the city. Compared with the traditional economic census data, POI allows us to obtain the trends and spatial characteristics of development, rise and fall, layout, and migration of different industries in the city [22]. With the increasing availability of geospatial data, there is a great potential to identify and investigate the geographic distribution of the accommodation and catering industry.
Taking Beijing as a case study, we decided to apply an approach based on distribution points of interest data and their density to explore the geographic distribution of these points. The next section reviews the theories related to the geographic distribution pattern of the industry and the theoretical framework, and Section 3 describes the methodology based on the contour tree methods and the location quotient index. Section 4 presents the results of the analysis, and in Section 5, we discuss the spatial distribution of the accommodation and catering industry and the application of the proposed method. The conclusions of our study are presented in Section 6.
2. Literature Review and Theoretical Framework
2.1. Literature Review
2.1.1. Location Selection and Agglomeration Effect
From a micro-behavior perspective, the selection of a location is affected by various factors, including raw materials, accessibility to markets, labor, and transportation [23]. The classical location theories mainly analyzed the location choice behaviors of entrepreneurs based on the two aspects reducing costs and expanding the market, and the theories emphasize the importance of economic factors. The “theory of industrial location,” proposed by Weber, points out the principle of the least cost [24]. Later, Losch proposed the ‘profit maximization’ theory and stated that the industry is not necessarily located in the lowest cost position (transportation and labor costs), but rather in the area that will generate the maximum profit. Therefore, Losch’s theory puts more emphasis on total production costs [25]. Subsequently, Marshll started to draw attention to the impact of the valuable agglomeration economies and argued that industrial agglomeration can share skilled labor and specialized suppliers, thereby increasing opportunities for knowledge spillovers [26,27,28]. With the rapid growth of new institutional economics, the location theory is further enriched by introducing factors such as cultural, tax legislation, and environmental protection [29].
However, agglomeration effects would also be affected by the internal characteristics of the enterprise or types of economic activities [30]. According to our reviews on literature, two factors may have impact the strength of the agglomeration effect: the first is the cost reduction by the agglomeration of firms that belong to the same industry (referring to external economies of scale) [31], and the second is the potential to increase labor productivity by deepening the division of labor [32].
2.1.2. Geographic Distribution and Identification Methods
In geographic space, due to the location preference and agglomeration effect, economic activities are unevenly distributed and generally form several geographically concentrated clusters. Regarding the geographic distribution of economic activities, there are numerous types of patterns across a region, including monocentric, polycentric, dispersed, and monocentric specialized multipolar patterns. All these conceptions show partial differences regarding the spatial morphology and functionality of the cluster centers. The monocentric pattern refers to the situation that the economic activities are highly concentrated in one cluster, while in the polycentric pattern, the distribution of spatial clusters is relatively equal in size and function. The dispersed pattern refers to the situation in which a large part of the firms spread out across the region in a non-concentrated pattern. In comparison, the monocentric specialized multipolar pattern is a composite spatial pattern that consists of one center and multiple poles. In this pattern, one center concentrates most of the economic activities and functions, while many dispersed poles only concentrate a part of economic activities [33]. Previous studies have shown that the geographic distribution of economic activities is a dynamic process, similar to urban development. Suburbanization is an inevitable part of urbanization, and accompanied by suburbanization, population and employment opportunities gradually move and spread outward from the central urban area, slowing down the growth rate of the population in the central urban area. Accordingly, with the expansion of cities and with population growth, the net agglomeration benefits of the central urban area are constantly being consumed by diseconomies of agglomeration, leading to the formation of subcenters surrounding central urban areas. The rise of such subcenters has not only resulted in the evolution of the metropolitan area from a monocentric structure to a monocentric, specialized, multipolar or polycentric structure [34], but has also changed the urban economic space [35,36].
At present, the methods used to identify morphological characteristics of industry clusters mainly include (1) the set threshold value, based on expert opinions or experiences, (2) clustering algorithms, e.g., Local Getis-Ord Gi statistic [37], DBSCAN (density-based spatial clustering of applications with noise) [20], (3) the distance-based method, for example, Ripley’s K [38], L, and M functions [39,40], and (4) methods based on density contour. Chen and Yu [41] compared the spatial distribution structure of social and economic elements in a city to the undulating terrain surface and introduced the contour tree method [22,37] into urban center recognition. On this basis and based on POI data, Deng and Liu [42] considered the distance attenuation characteristics of the density distribution and increased the threshold value of the urban distribution boundary, with the aim to improve the accuracy of the polycentric structure. Compared to the clustering algorithms, problems such as the need to preset evaluation units and difficulties in reflecting the hierarchy of space structure are solved. Regarding the functional differences of economic clusters, methods are generally based on the comparison of a single geographic unit [43], including the Gini coefficient, the Isard index, the Herfindahl–Hirschman index, the Krugman index, the Ellison–Glaeser index, and the locational quotient (LQ) [44]. Among these indices, LQ was used most widely in previous studies because it can not only measure the extent of industry concentration, but can also perform decomposition to examine the degree of industrial concentration within and between economic clusters.
2.2. Theoretical Framework
According to our literature review, the distribution of economic activities is determined by profits and agglomeration effects, which in turn depend on the characteristics and location preferences of the industry. As part of the service sectors, the location of accommodation and catering businesses is highly linked to the population and to other economic activities that have impacts on service demand. Regarding the geographic distribution, spatial morphology and function differences are two-dimensional perspectives used to detect distribution patterns. In this sense, we combined cluster identification and industrial specialization measurement using a contour tree method and the location quotient index to reveal the geographic distribution of the accommodation and catering industry.
In terms of identification, methods based on the density contour represent a useful tool to detect the morphological structure of economic activities [41,42]. However, the threshold of an urban boundary, is set based on the proportional relationship between different POI densities and the theoretical radius of spatial distribution [45]. The spatial heterogeneity of the agglomeration effect decreases with distance; if this fact is not considered, it may lead to “over-extraction” or “insufficient extraction”. To solve this issue, we introduced a piecewise linear regression method to identify the inflection point of the decay of industrial distribution with distance, thereby considering spatial heterogeneity when determining the boundary of industrial spatial distribution.
3. Materials and Methods
3.1. Overview of the Study Area
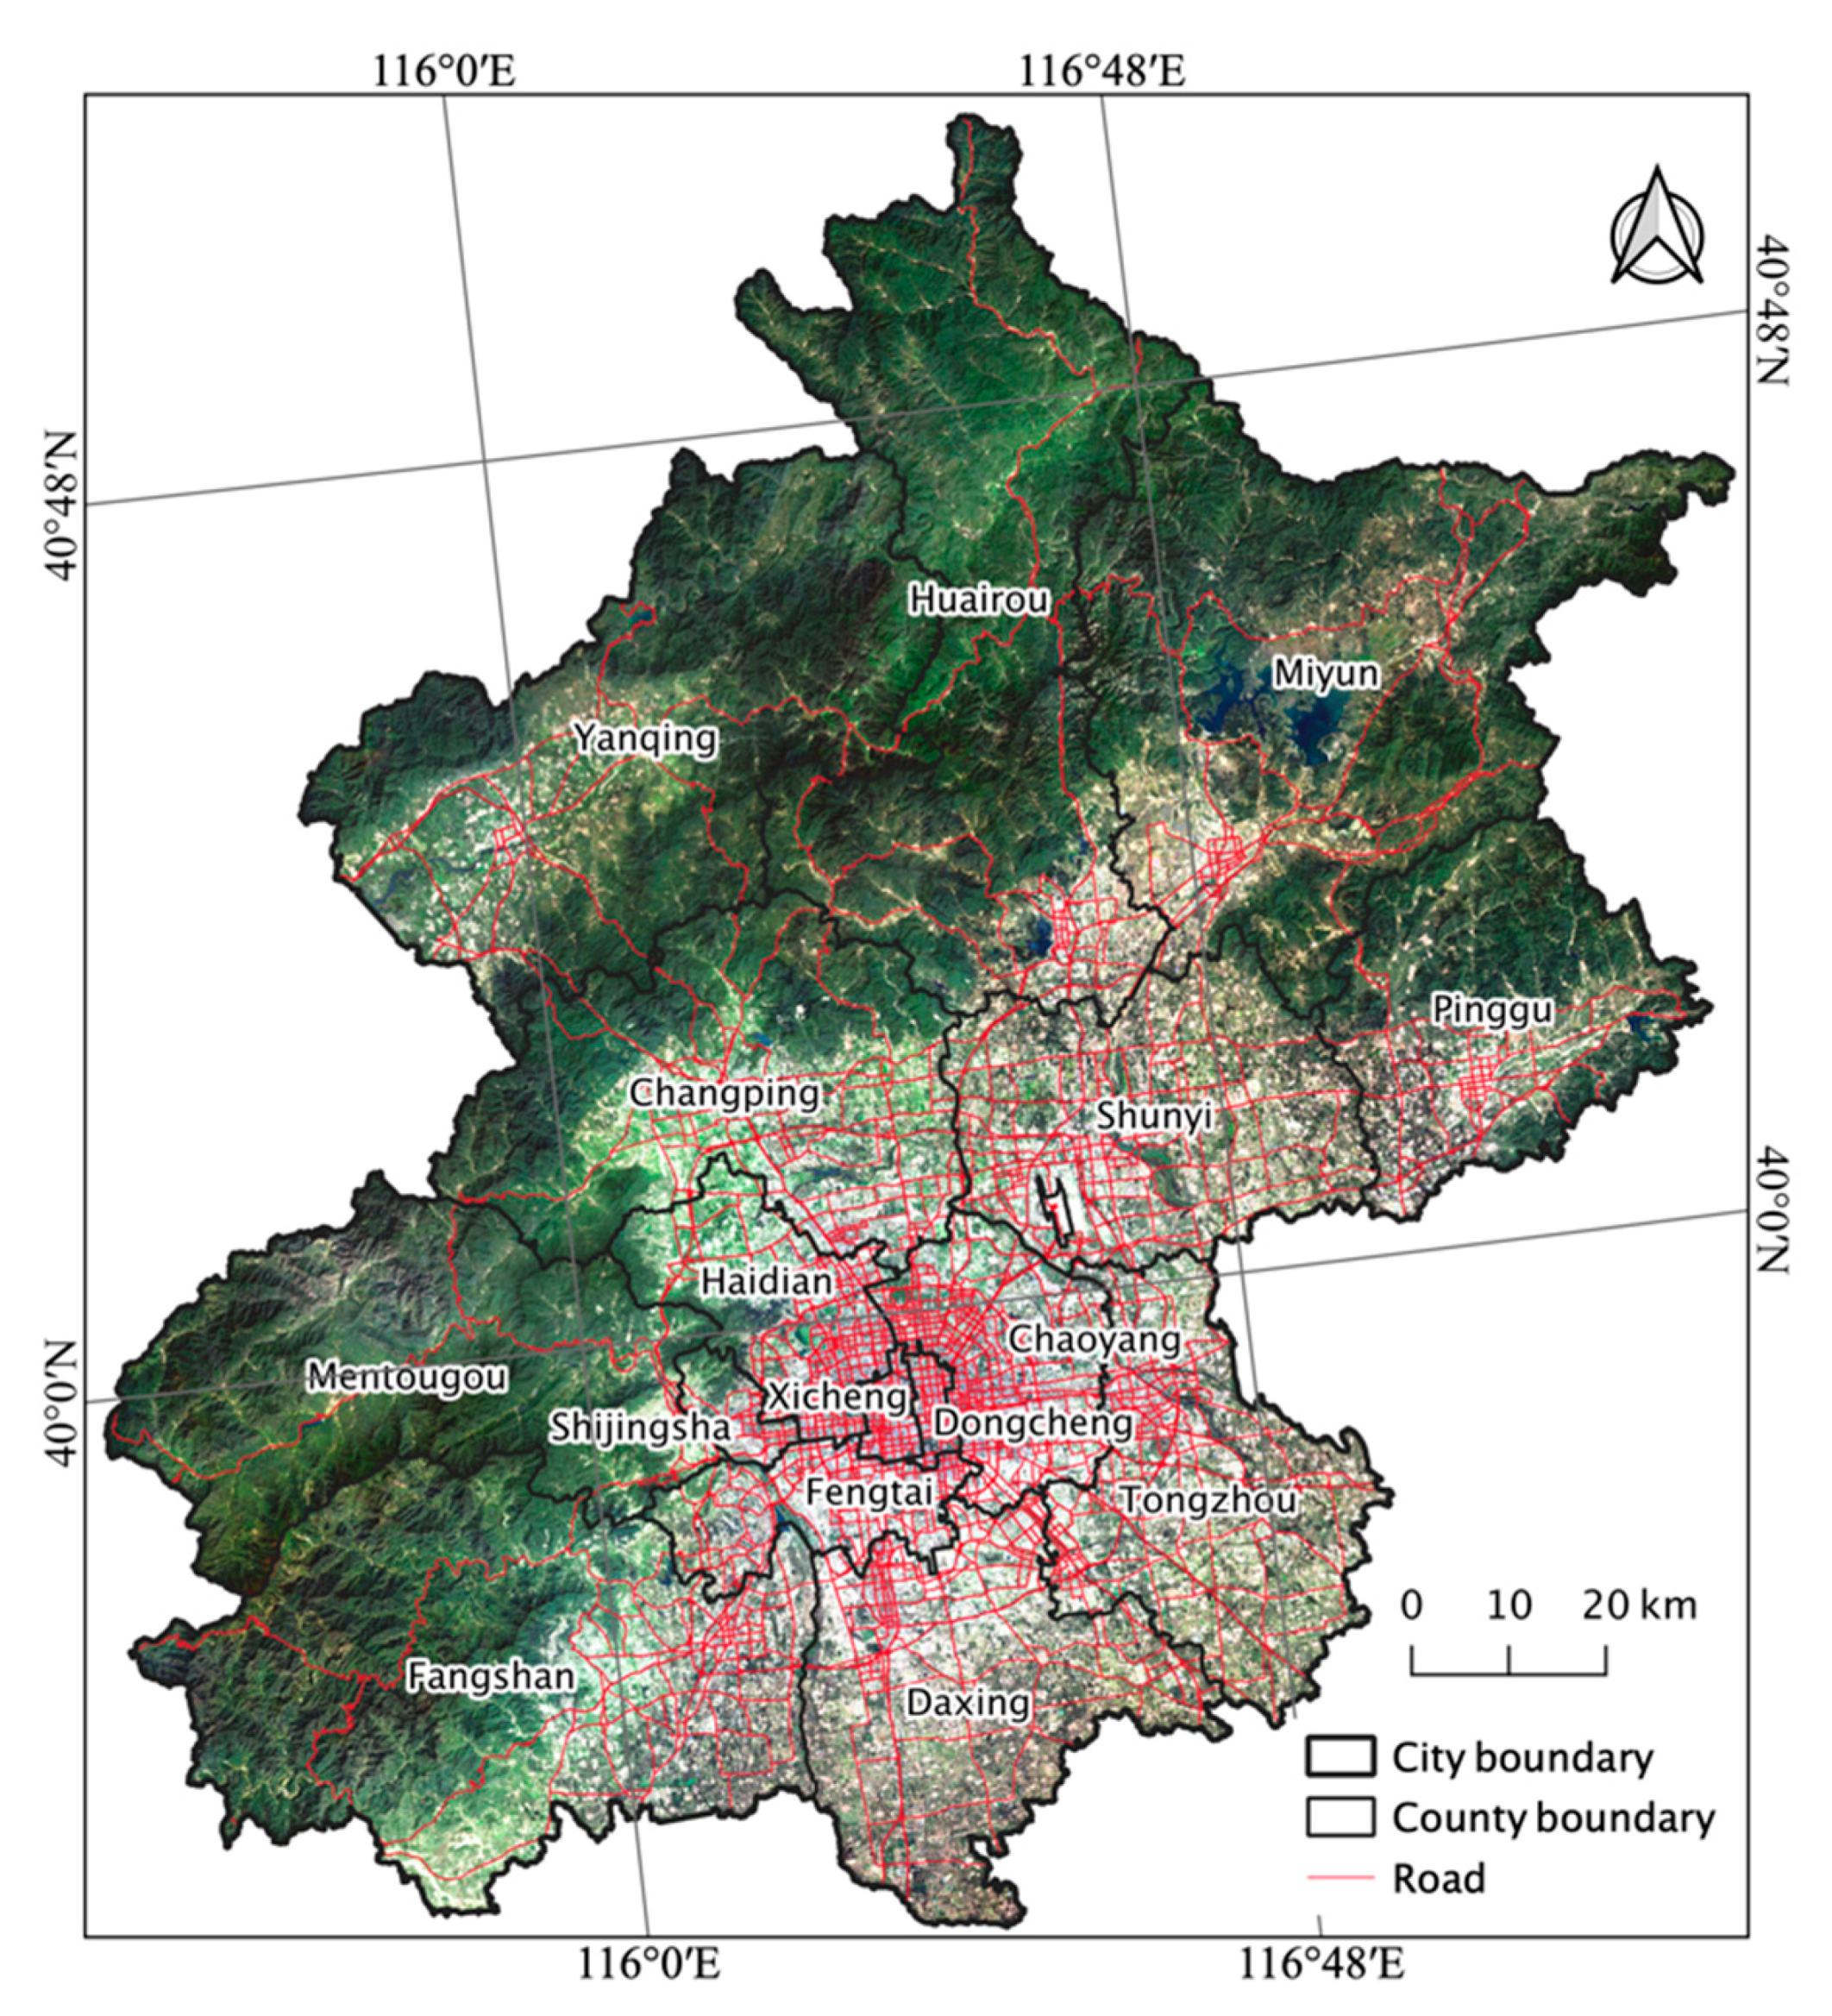
Beijing is the capital and municipality directly under the central government of China (Figure 1), the third most populated city and the most populated capital in the world. With its 3000 years of cultural history, advanced scientific and medical technology, good educational resources, and adequate social security, it significantly influences the fields of politics, economy and trade, culture, education, and science and technology. The administrative area of Beijing covers about 1.64 × 10⁴ km2. Located in the northwestern edge of the North China Plain, backed by the Yanshan Mountain, with the Yongding River flowing through the southwest of the old city, adjacent to Tianjin and Hebei Province, it has excellent natural conditions, a pleasant climate, four distinct seasons, and a wide coverage of the plain. It is also an important part of the Beijing Tianjin Hebei urban agglomeration.
3.2. Data Source
In this study, POI data were obtained from the Gaode map service by API programming of the Gaode map. We used 41,500 POI of the accommodation and catering industry in Beijing for 2018, with 2 secondary categories and 14 tertiary categories (Table 1).
3.3. Method
The method used to identify the geographic distribution of accommodation and catering businesses included two parts. First, we applied the contour tree method to identify the spatial location of cluster centers of the industry. Second, we introduced the index “location quotient” to investigate the industrial specialization among the cluster centers.
3.3.1. Identification of a Cluster Center
1. Conceptual framework
Because of the strong positive correlation between POI and human activities as well as land use intensity, the spatial distribution trend of POI reflects the relative intensity of industrial agglomeration to a certain extent [47].In this study, the cluster center of the urban accommodation and catering industry was extracted mainly to compare the spatial distribution of the industry’s POI density to the undulating terrain surface, in which the relatively uplifted area represents the area with a high distribution of this industry. Therefore, by applying the POI density data, on the basis of delimiting the boundary of industrial distribution, we used the topological and hierarchical relationship between isolines (i.e., contour lines) to identify the industrial cluster centers.
a. Determination of the spatial distribution boundary
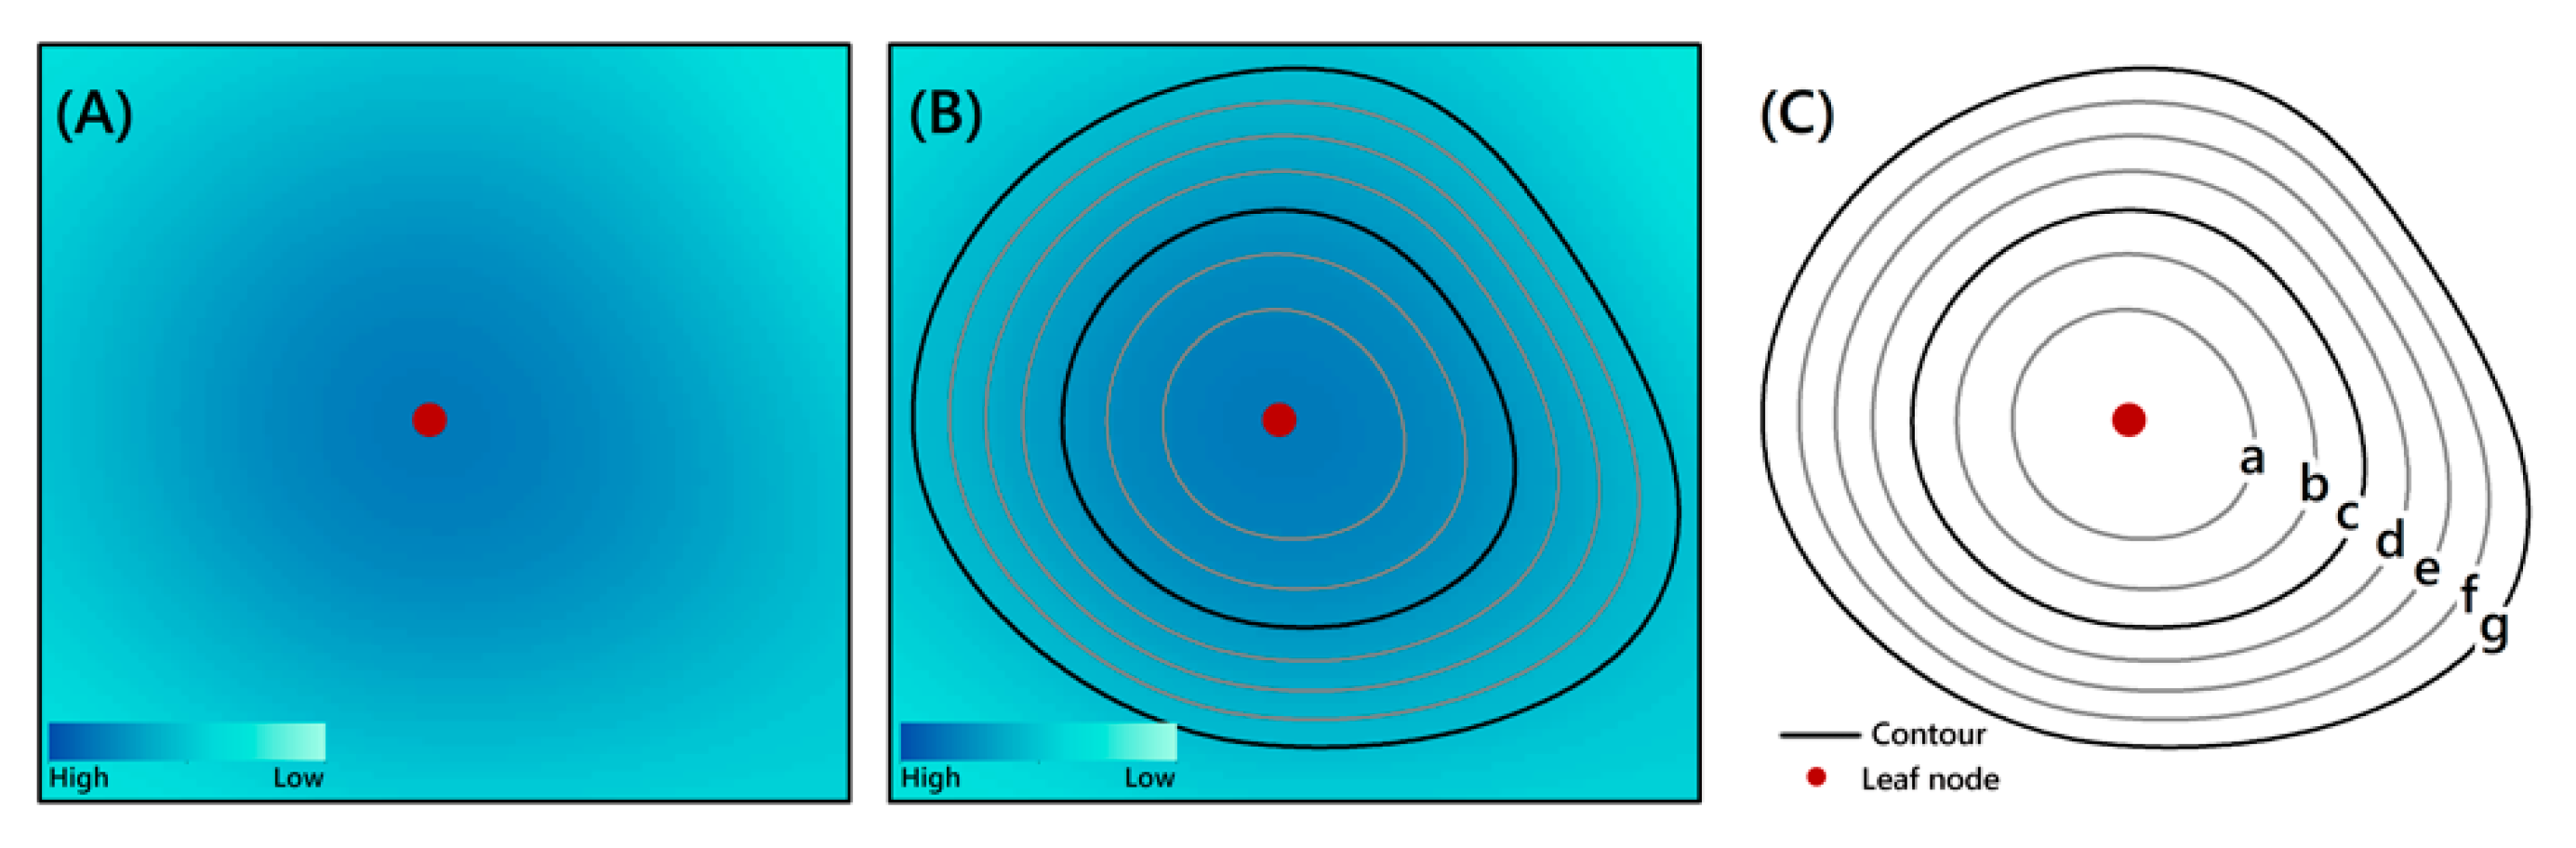
At a spatial level, the industry usually shows spatial agglomeration within a certain distance, and the decreasing speed of distribution density per unit distance increases significantly (Figure 2A) [48]. This phenomenon, when reflecting the change trend of the distance between the leaf node and its corresponding parent node, shows that there is an inflection point with a rapidly increasing slope (Figure 2B). Here, the corresponding distance of the inflection point is regarded as the critical value of the industrial distribution center. When the distance between the contour line and its corresponding leaf node exceeds the critical value, it does not belong to the scope of the urban function distribution.
b. Outline and structure of industrial distribution density
Within the scope of urban function distribution, a single concentric structure is the most essential constituent unit and can be featured by a local maximum value and a group of closed contour lines containing it (Figure 3A,B). These concentric closed contour lines are adjacent in space, and their attribute values gradually increase from the outer to the inner part (Figure 3B). After converting a single concentric structure into a nested contour tree, the region contained in each contour tree represents a relatively concentrated area of POI distribution. For example, in Figure 3C, contour g is the root node of the contour tree, representing the maximum boundary of the region, and a is the local maximum value, which is also called the leaf node in the contour tree.
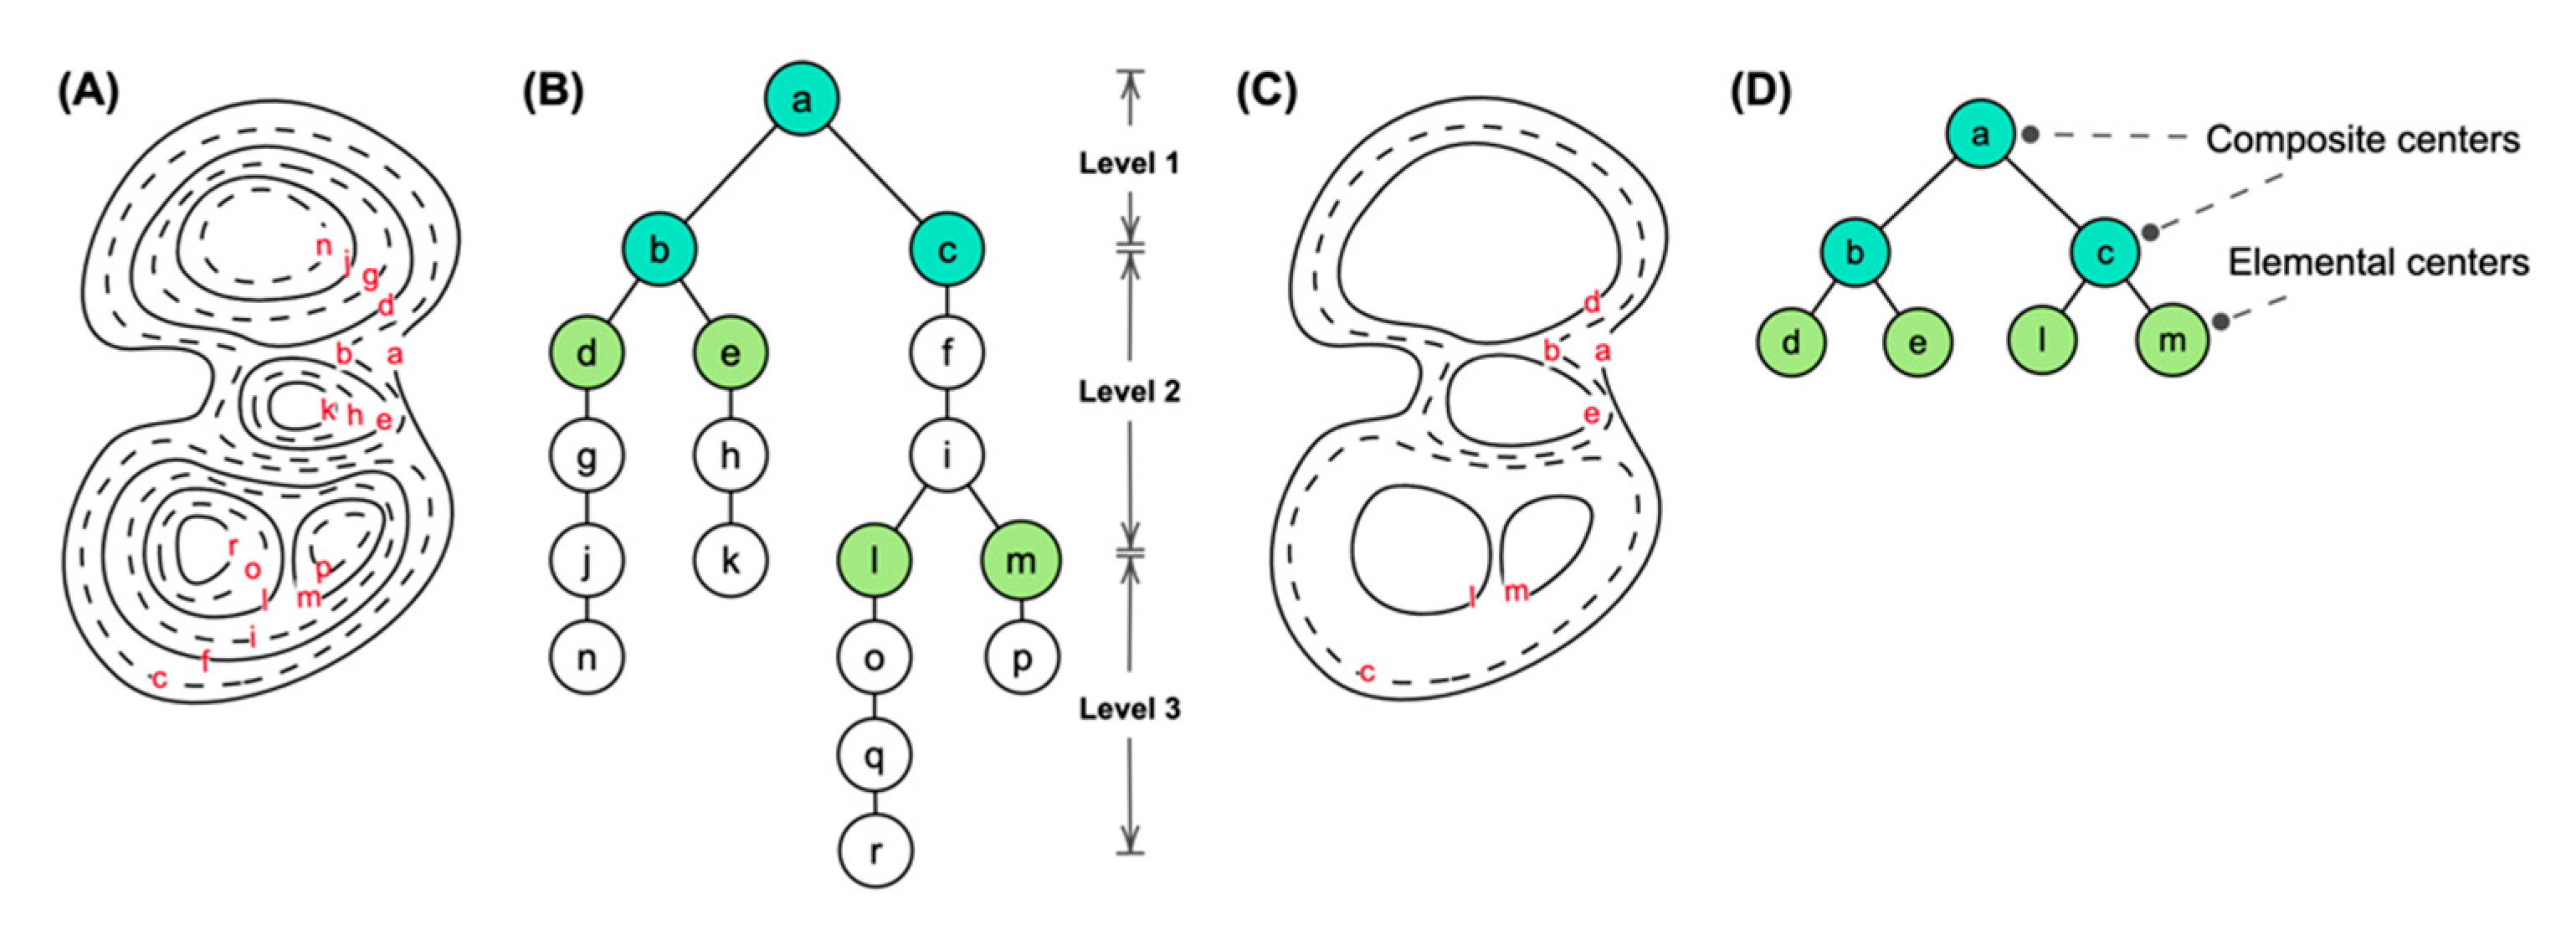
However, there may be a polycentric structure in the distribution of various industries [48,49], manifested as a compound concentric structure formed by nesting multiple single concentric closed contours once or several times (Figure 4A). Potentially, there are three types of spatial adjacency relations [50], namely nested (contained), parallel, and isolated relations, and each contour line can contain one or more adjacency relationships at the same time (Figure 4B). For example, in Figure 4C, contour i is the root node of the contour line and lowest in POI density; it directly or indirectly contains all other contour lines. For contour i, there are two sub nodes, h and k, with the same POI density, which are the two branches of the composite contour tree; contours k, i, g, f, e, d, c, and b have one sub node, while contours j and a have no sub nodes. Contours h and k are parallel in space and nested in i, respectively.
The use of POI distribution data to extract the distribution center of different functional areas is mainly based on the topological relationship between adjacent contour lines. On this basis, the contour tree is constructed based on the graph theory, and the contour line of the concentric structure (single or composite) is recognized as a local contour tree. According to the previous analysis, the root node of each local contour tree will be regarded as a basic or composite center, and the original contour tree will be simplified accordingly to only retain the nodes of the basic function center and the composite function center. For example, in Figure 5, the initial contour line is composed of 18 contour lines from a to p (Figure 5A). After being transformed into a tree structure, nodes d, e, l, and m are the root nodes of the simple concentric structure (i.e., the basic function center), while nodes a, b, and c are the composite function centers, including simple concentric structures with d, e, l, and m as root nodes (Figure 5B). In the simplified contour tree, only seven contour lines, namely a, b, c, d, e, l, and m, are retained to represent the industrial cluster centers and the corresponding hierarchical relationships (Figure 5C,D).
2. Identification process and steps
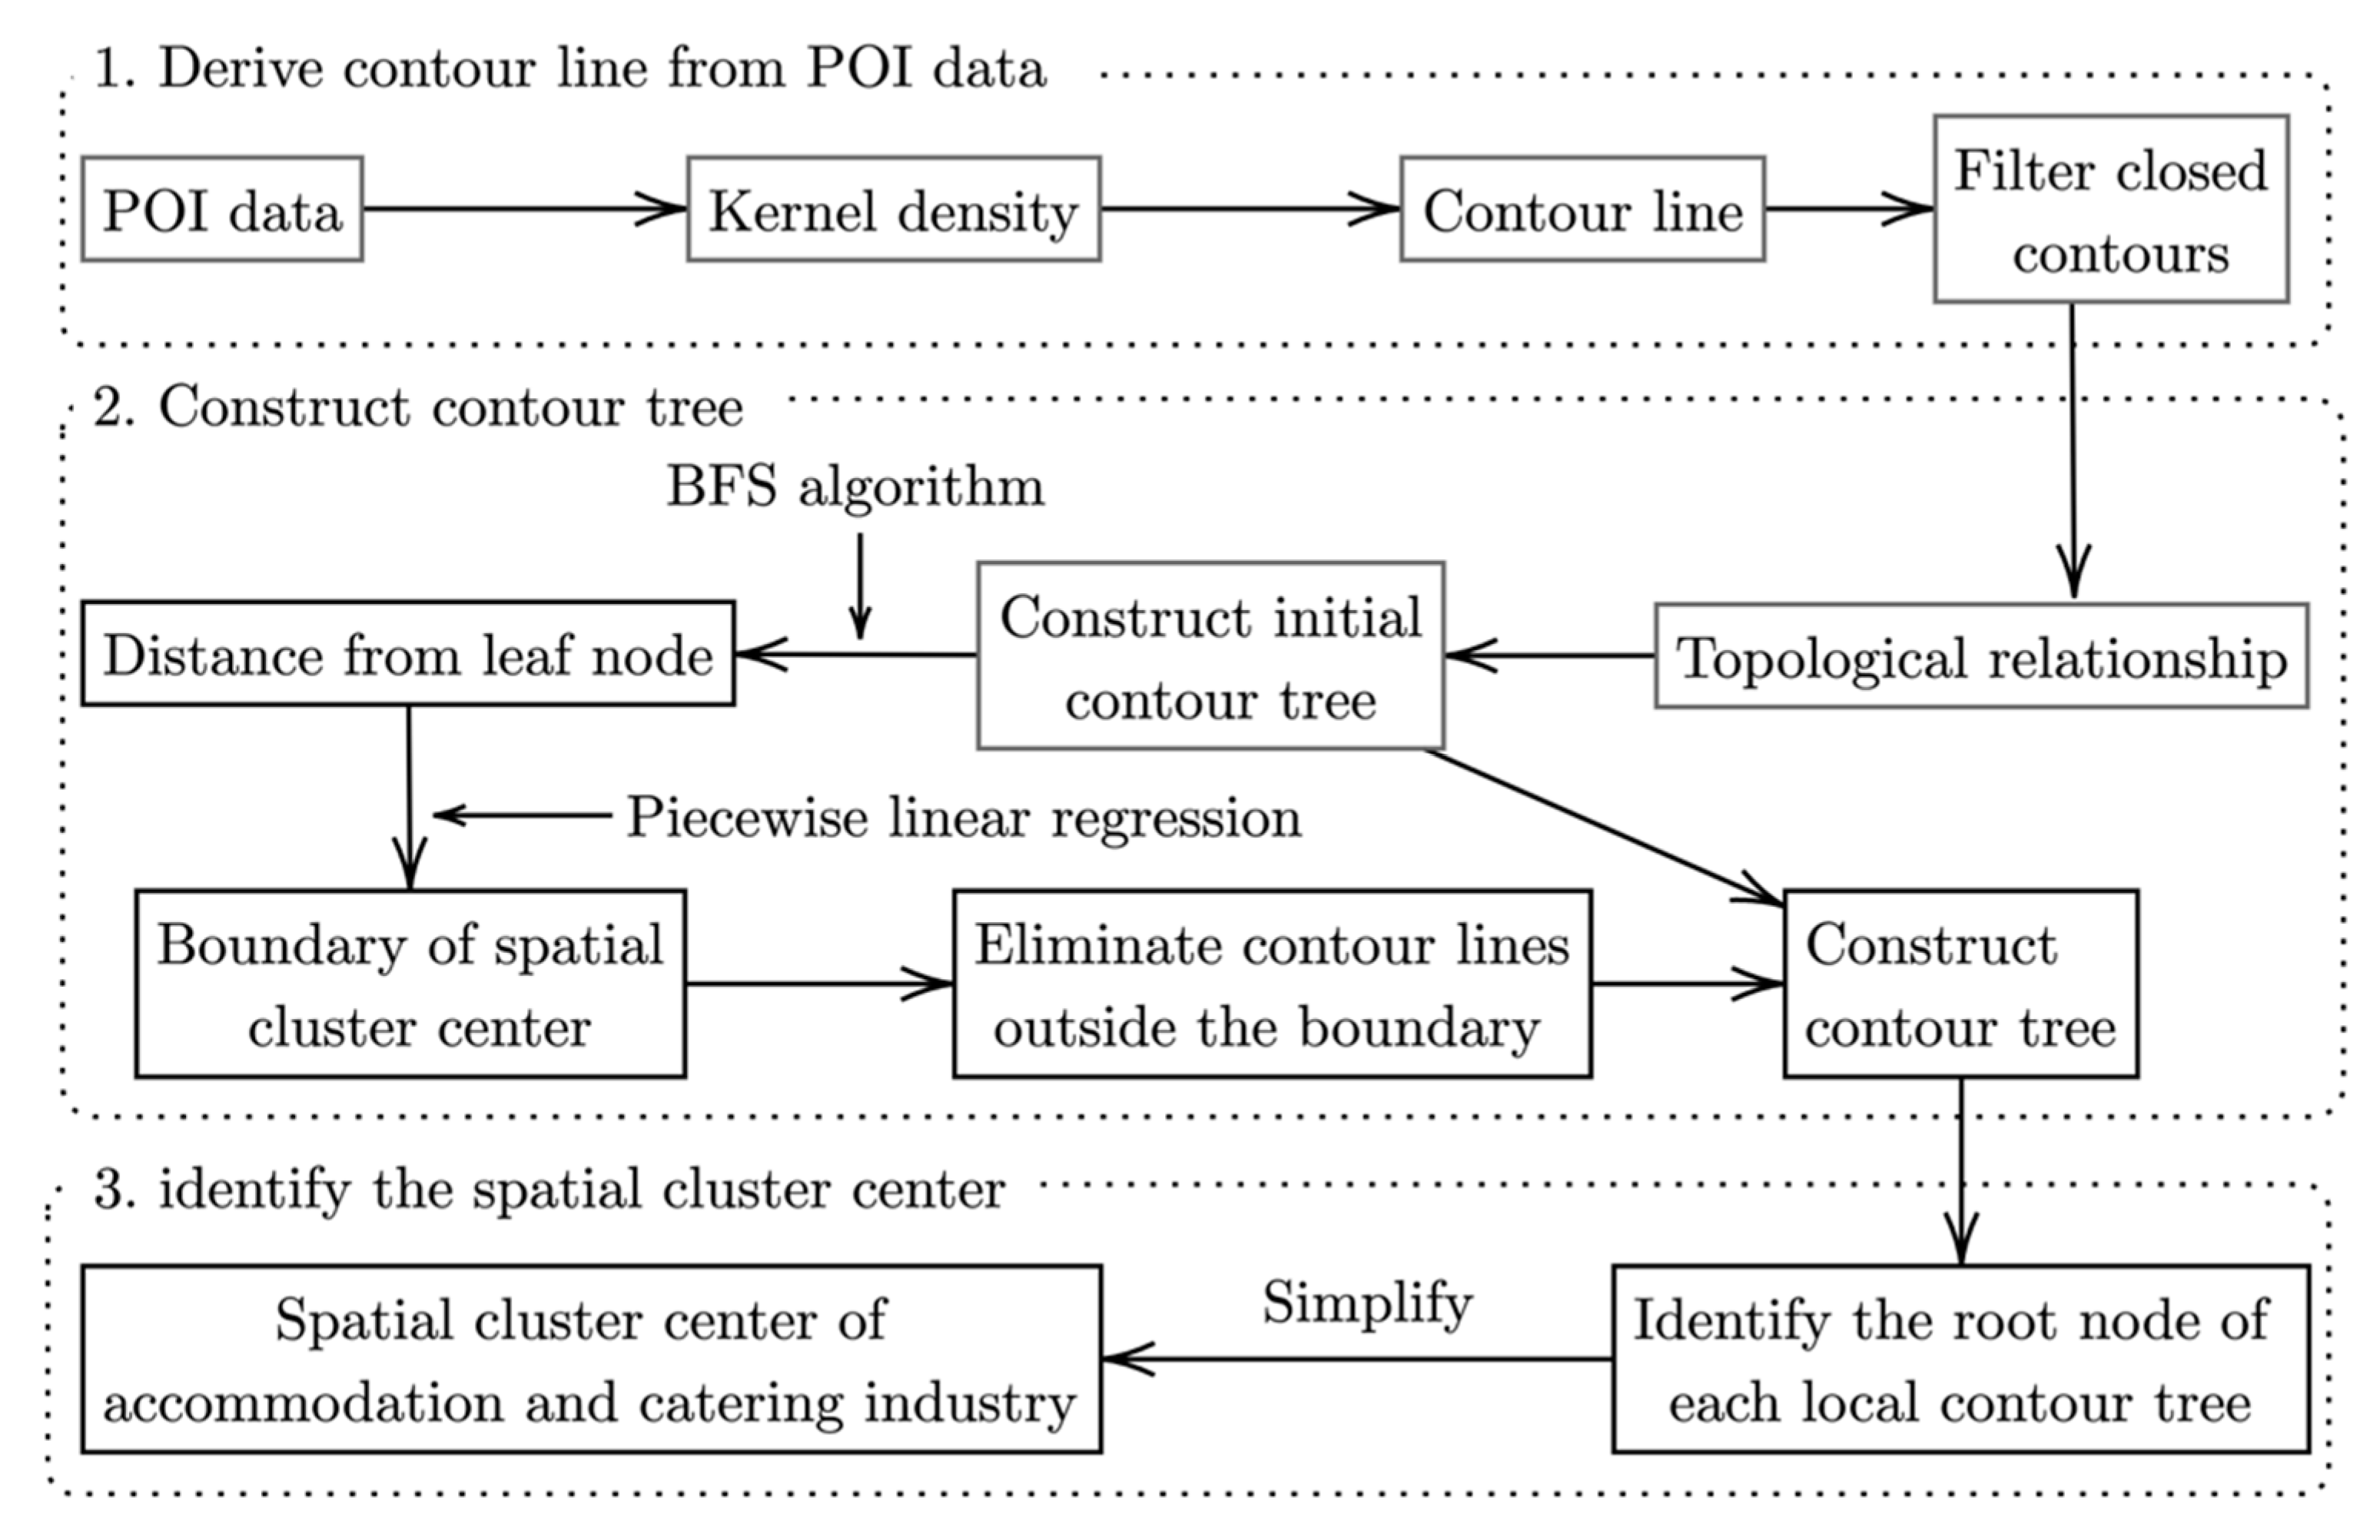
The conceptual framework is described in above. Next, we introduce the specific steps of extracting the distribution center of urban functional land (Figure 6), which are as follows:
a. Calculation of spatial distribution density
In this study, we used the kernel density function to estimate the distribution density of POI for the accommodation and catering industry. The determination of kernel density is a non-parametric density estimation method [51]. This method takes the feature points as the center and calculates the total number of POI within the search radius. In contrast to other density calculation methods, kernel density estimation increases the calculation weight of the surrounding points, which gradually decreases with the increase of the distance from the center point, that is, the center point weight is the highest, and when the distance reaches the search radius r, the weight is 0 and the sum of all weights is 1. The calculation formula is as follows:
where represents the kernel density at the spatial position i; is the distance between the spatial position j and the location i within the search radius; is the calculation weight given by position j; and n is the number of POI falling within the search radius (R). In this study, we tested the POI distribution density under four different radii (1000, 2000, 3000, and 5000 m) (Figure 7). When the search radius is 1000 and 2000 m, the extracted POI distribution contains more details, but the recognized functional land centers are in relatively small pieces. When the search radius is increased to 5000 m, the POI density distribution grid becomes smoother and more generalized. However, many cluster centers, such as Zhongguancun in the North Fourth Ring Road, are ignored. After comprehensive consideration, we selected 3000 m as the search radius of the POI kernel density function estimation.
b. Construction of the initial contour tree
The construction of the contour tree consists of two key processes: generating vector contour lines which can represent the spatial distribution of POI density and identifying the topological relationship between adjacent contour trees. When generating the POI density contour lines, the starting and interval values of the isoline are two key parameters. Four different density interval values (2.5, 5, 7.5, and 10/km2) were tested to characterize the impact on density distribution of the accommodation and catering industry. Based on the results, the contour interval value is inversely proportional to the detail degree of the POI density distribution, and the smaller interval is conducive to identify more details of the changes in POI distribution. Consequently, we selected contour intervals of 5/km−2. On this basis, the spatial join tool in ArcGIS was used to obtain the adjacency relationship of each contour tree, including nested (contained), parallel, and isolated ones, and the initial contour tree of the distribution density of the accommodation and catering industry was constructed based on the graph theory.
c. Identification of the distribution scope of urban functional areas
We used the constructed original contour tree in this study. First, the breadth first search (BFS) algorithm [52] was used to identify the local maximum value (leaf node) corresponding to each contour tree. Subsequently, for each local contour tree, the regression discontinuity method was used to identify the possible breakpoints on the average distance between the contour lines and the corresponding leaf nodes, and the POI density corresponding to the breakpoints was taken as the density critical value of the contour tree. Finally, the contour trees whose density was below the corresponding critical value were removed.
d. Simplification of the contour tree
In the simplification process, only the key nodes (the root nodes in each local contour tree) were retained. These key nodes include two types: one contains no parent nodes, and the other contains parent nodes that include at least two sub nodes. In the simplified contour tree, the contour lines corresponding to leaf nodes (without any sub nodes) are the basic function centers in the city, while the remaining contour lines are the composite function centers.
3.3.2. Location Quotient
To further analyze the leading industry and the degree of specialization of the accommodation and catering industry in different cluster centers, we introduced the location quotient [53] to analyze the specialization degree of four residential catering sub industries (including leisure catering, commercial accommodation, fast food, and restaurants). The higher the value, the higher the degree of specialization of the industry type. The calculation formula is as follows:
where Q represents the location quotient; is the distribution proportion of POI of industry A in the cluster center (K) to the whole study area; is the distribution proportion of accommodation and catering POI in the cluster center (K) to the whole study area.
4. Results
4.1. Spatial Distribution of the Accommodation and Catering Industry
4.1.1. Distribution Density
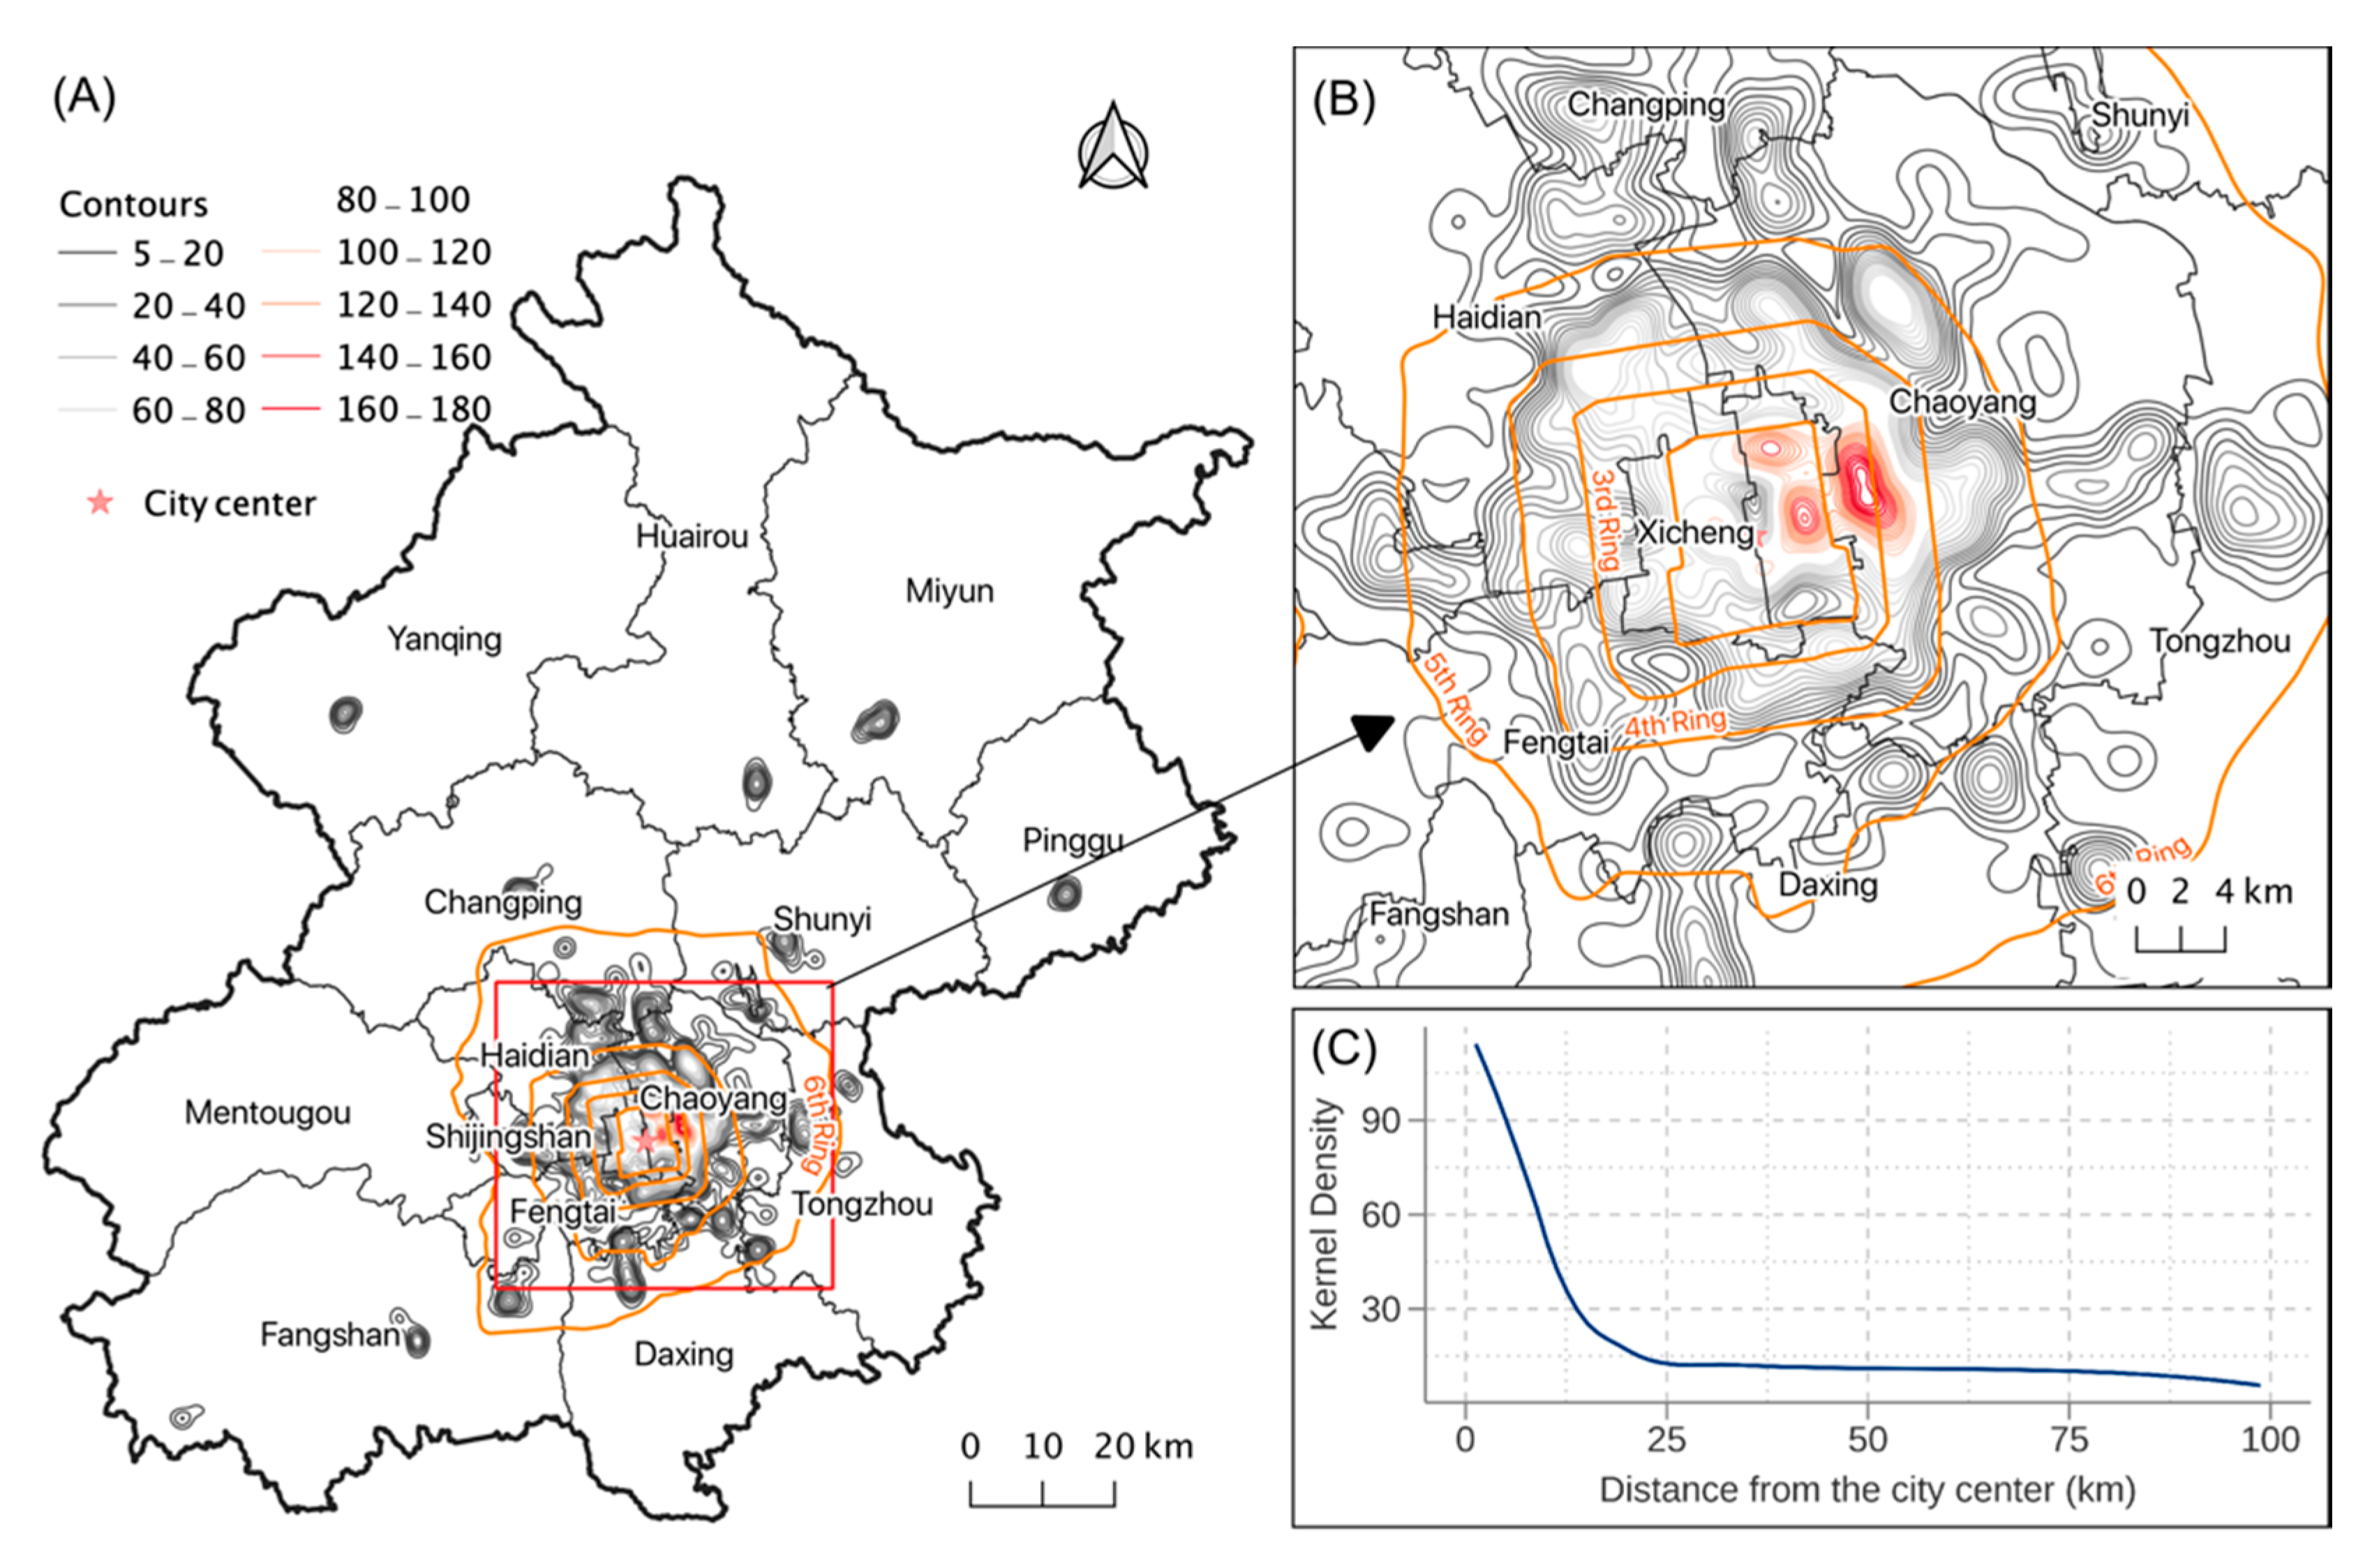
Based on the POI data of the accommodation and catering industry in Beijing, we first generated the POI density map of this industry by using kernel density distribution within the search radius of 3000 m and then generated the contour line of the density distribution at a 5-m interval (Figure 8). The average density of the accommodation and catering industry in Beijing was 26.5/km2. Considering the spatial distribution of POI density, Dongcheng District and Xicheng District had the highest average distribution density values of 86.68 and 67.85/km2, respectively, followed by Chaoyang District, Haidian District, and Fengtai District, with an average density between 22.02 and 35.06/km2. Overall, the density of the accommodation and catering industry in outer suburbs, such as Shunyi District, Fangshan District, and Huairou District, is relatively low, with an average of 11.16/km2. In addition, based on the relationship between spatial distribution location and density, the accommodation and catering industry is concentrated within a radius of 20 km from the city center (Figure 8C).
4.1.2. Spatial Structure
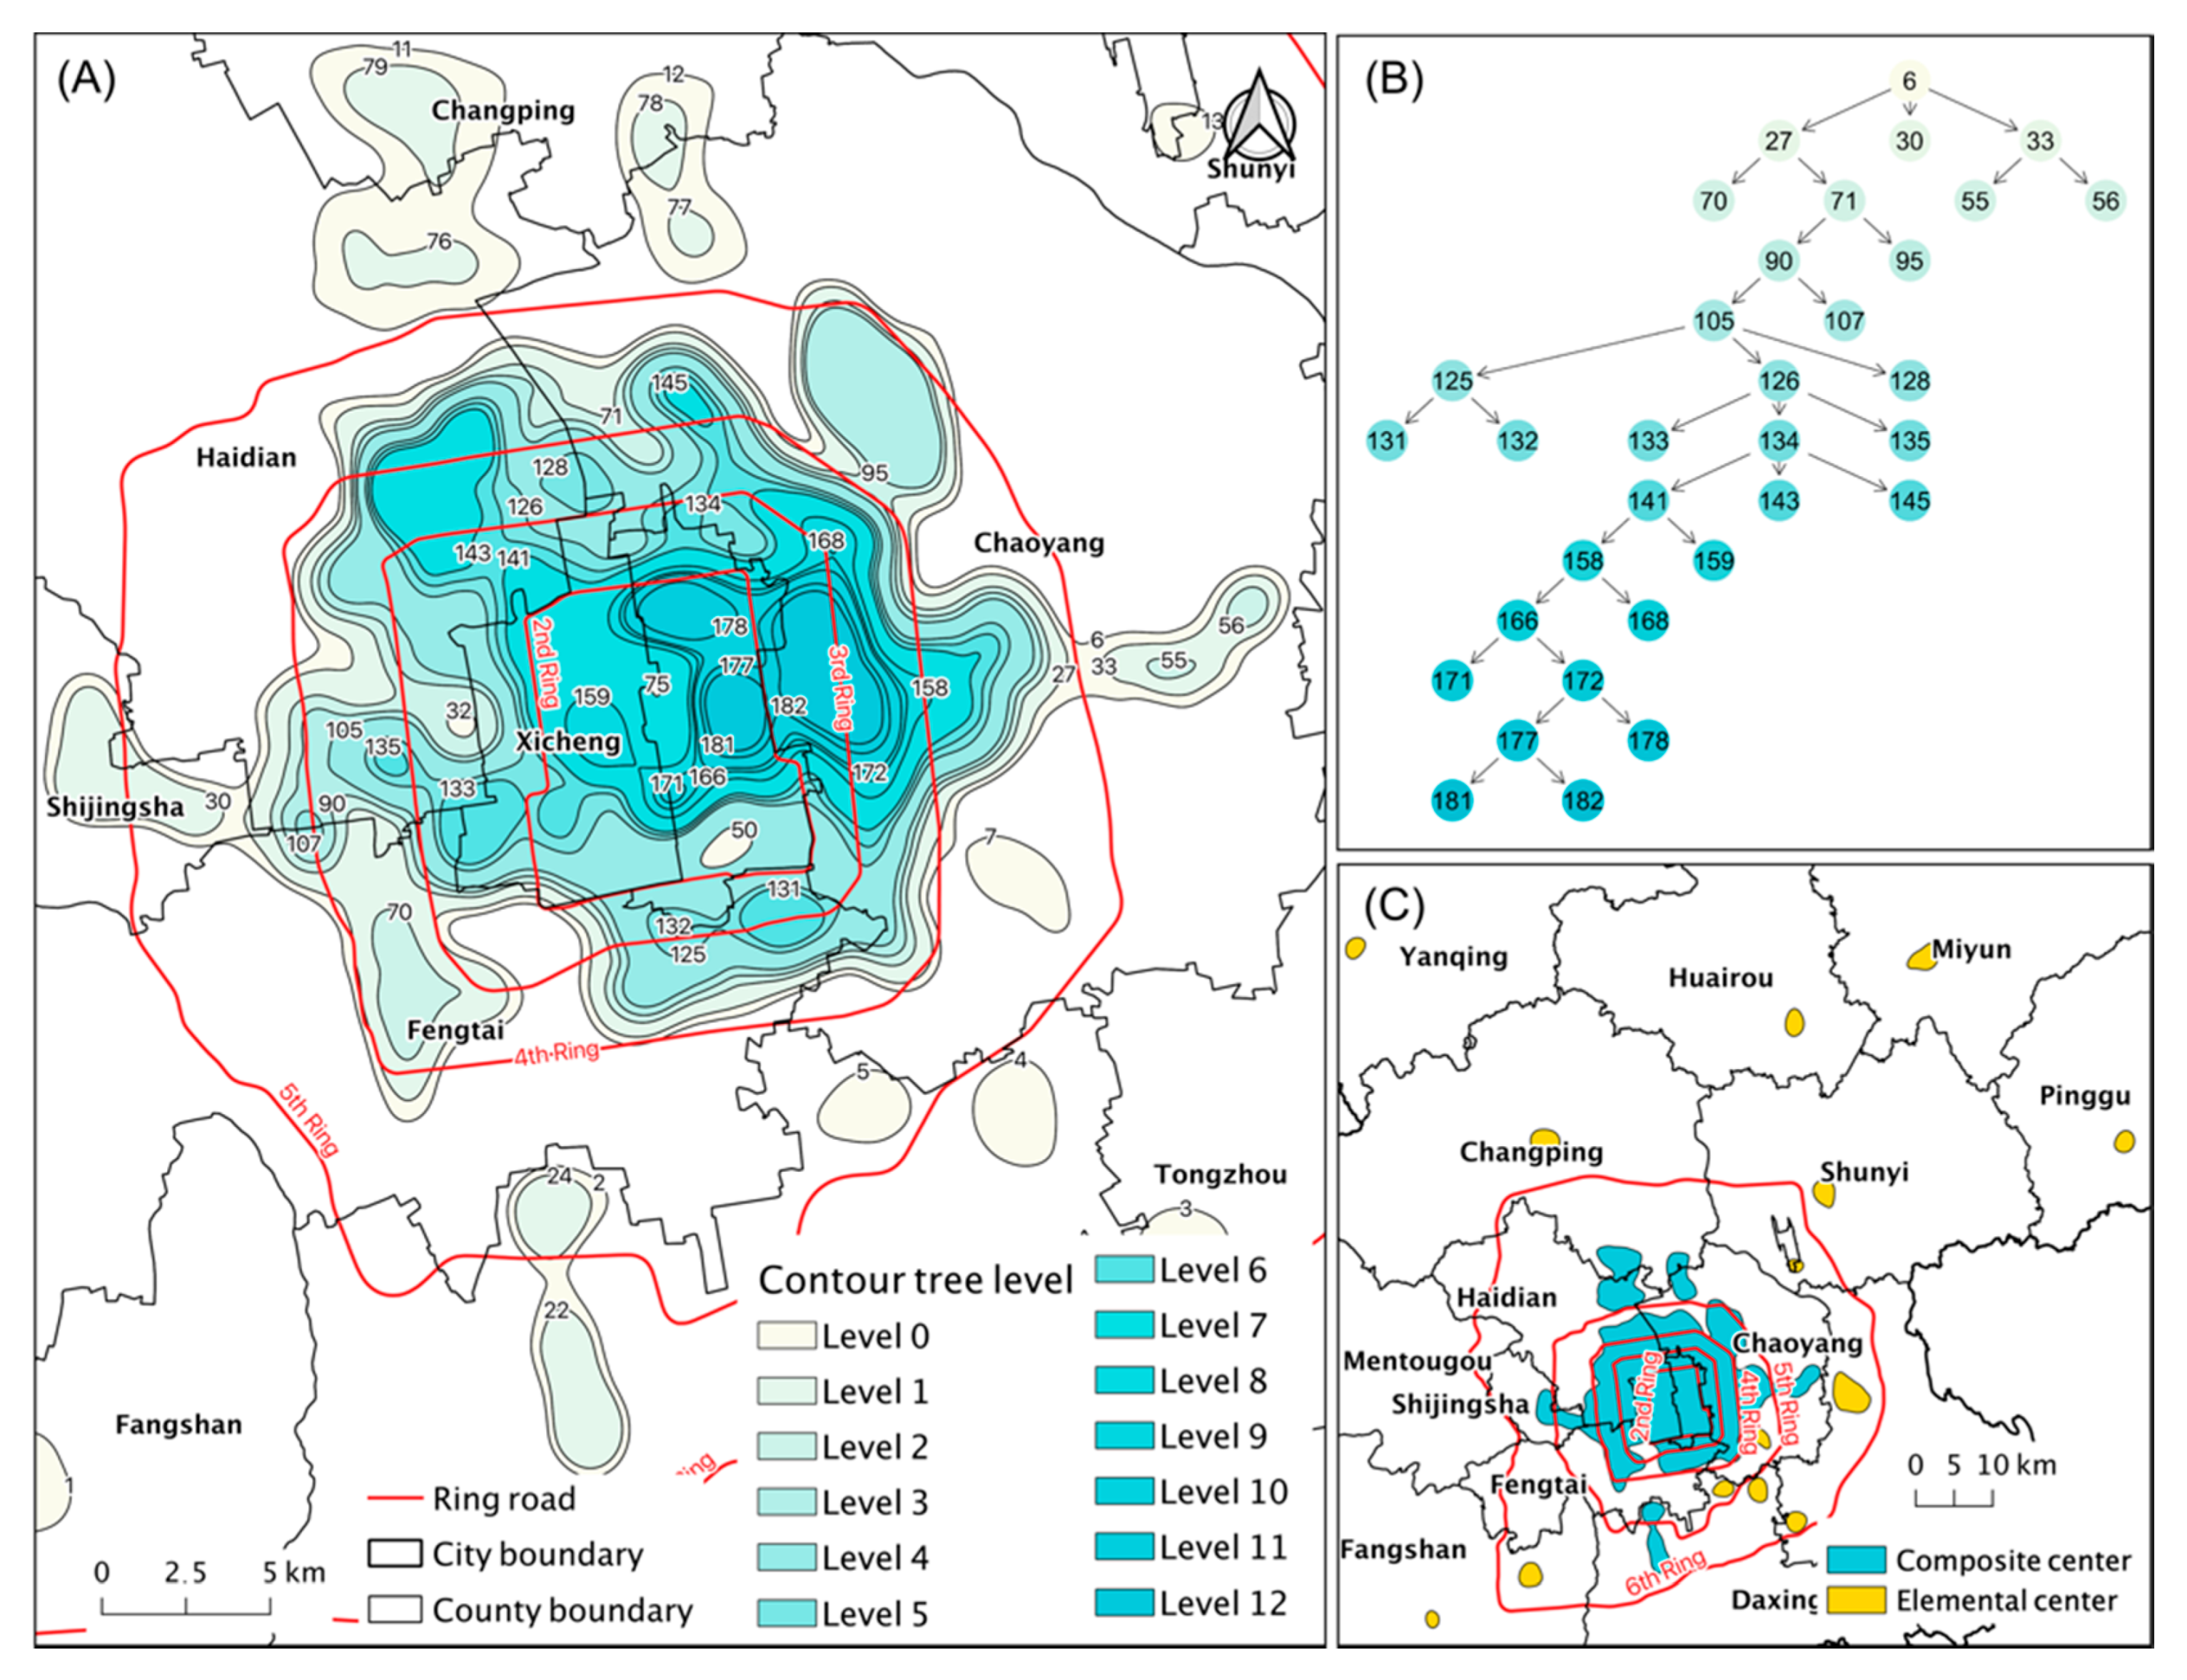
The spatial distribution of the accommodation and catering industry is shown in Figure 9; the simplified contour tree contains 21 local trees and 30 leaf nodes. The simplified contour tree is further divided into 12 isolated single centers and four composite centers (Figure 9C), according to whether other contour lines are nested. In terms of spatial scope, the composite center of accommodation and catering land covers about 478.64 km2, mainly distributed in and around the Fifth Ring Road of Beijing (Figure 9A,B), accounting for 83.34% of the city’s accommodation and catering areas. Figure 9B is a 13-level local contour tree composed of 33 nodes, which reflects the nesting relationship of the internal contour lines of the largest composite center in the city’s accommodation and catering industry. In the composite center, the high-concentration areas for accommodation and catering are mainly located in the Wangfujing-World Towers CBD area (#182), Dashilan-Tianqiao (#172), the Gulou-Lama Temple (#178), the Xidan-Xisi in Dongcheng District (#159), the Beijing West Railway Station (#133), and other areas. Single centers are mainly distributed in Yanqing, Huairou, Miyun, Pinggu, Changping, Shunyi, Fangshan, Daxing, and other suburban counties (Figure 9C).
4.1.3. Cluster Center
In total, 30 element centers (Figure 10, Table 2) of the accommodation and catering industry were extracted in this study. The distribution center of the accommodation and catering industry averaged 6.4 km2; the area of #1 center located in Tongzhou District was the largest one, reaching 17.1 km2, while the area of #30 center near Northeast of Tianzhu town in Tongzhou District was the smallest one with only 2.47 km2. In terms of the distribution density of POI, the centers #5, #25, and #23 in Chaoyang District and Dongcheng District were high-concentration areas, with an average density of 144/km2. However, the distribution centers #15, #30, and #28 in Fatou Street and the Capital International Airport Street of the Chaoyang District, the northeast of Tianzhu town in Shunyi District, and Chengguan Street in Fangshan, had the lowest density with only 13.7/km2. In terms of the distribution quantity and density of functional centers, Chaoyang District, Dongcheng District, Haidian District, and Xicheng District represented the main gathering areas of the accommodation and catering industry. In terms of the spatial distribution trend, the number of distribution centers and the POI density inside the functional centers gradually decreased with increasing distance from the city center.
The distribution of the accommodation and catering industry center is closely related to that of the following surface features: (1) Scenic spots and leisure resorts (such as zoos, resorts, sanatoriums, parks, etc.), represented by #2, #23, #28, #13, #8, and #29 centers; (2) Educational facilities (such as universities, middle schools, etc.), such as the #4 distribution center covering Dongshengyuan, Zhongguancun Street, Haidian Street, and Beixiaguan Street, where numerous colleges and universities are distributed; (3) Transportation hub centers (including railway stations, airports, etc.), such as #20 distribution center at the West Railway Station and #30 distribution center at the Capital International Airport; (4) Urban business districts (financial centers, leisure and entertainment facilities, etc.), such as #26 center located on Guang’anmenwai Street and Yuetan Street, #3 center covering Wangjing and Jiuxianqiao Streets, and #5 center covering Wangfujing-World Towers CBD. In general, the spatial distribution of accommodation and catering businesses is closely related to the distribution of urban transportation facilities and entertainment and leisure areas.
4.2. Uncertainty and Sensitivity Analysis
The setting of the contour interval is an important variable that affects the distribution range and location of the accommodation and catering industry space cluster centers. We further extracted the accommodation and catering industry distribution centers for four different contour interval values (2.5, 5, 7.5, and 10/km2) (Figure 11). Based on our results, the sensitivity of the extracted results to the interval value is characterized as “high in the center, low at the edge”, that is, there is little difference in the extracted cluster centers of the suburban counties far away from the urban center, while there are great differences in the areas near the city center or the composite center. Most likely, the areas close to the city center or the composite center are the main cluster areas of accommodation and catering. With decreasing interval values, more spatial details can be described, but at the same time, the contour tree structure (or topological relationship) also changes. In contrast, the contour lines of the outer suburbs are mostly single concentric circles, and the contour tree structure is not easily changed by the interval value. Thus, it is not sensitive to changes in the interval value.
Based on the influence of different contour intervals on the number and area of the extracted single centers, both the number and area of the detected centers increase with decreasing interval values. When the interval value is greater than 5/km2, the number of detected centers is stable at 28–30, and the total area is maintained between 170 and 190 km2 (Table 3). Considering that a smaller interval can better characterize the spatial distribution of the accommodation and catering industry, but an interval that is too small will increase the amount of calculation and will extract too many fragmented cluster centers, it is appropriate to select 5/km2 as the interval value in this study.
4.3. The Functional Difference of Cluster Centers
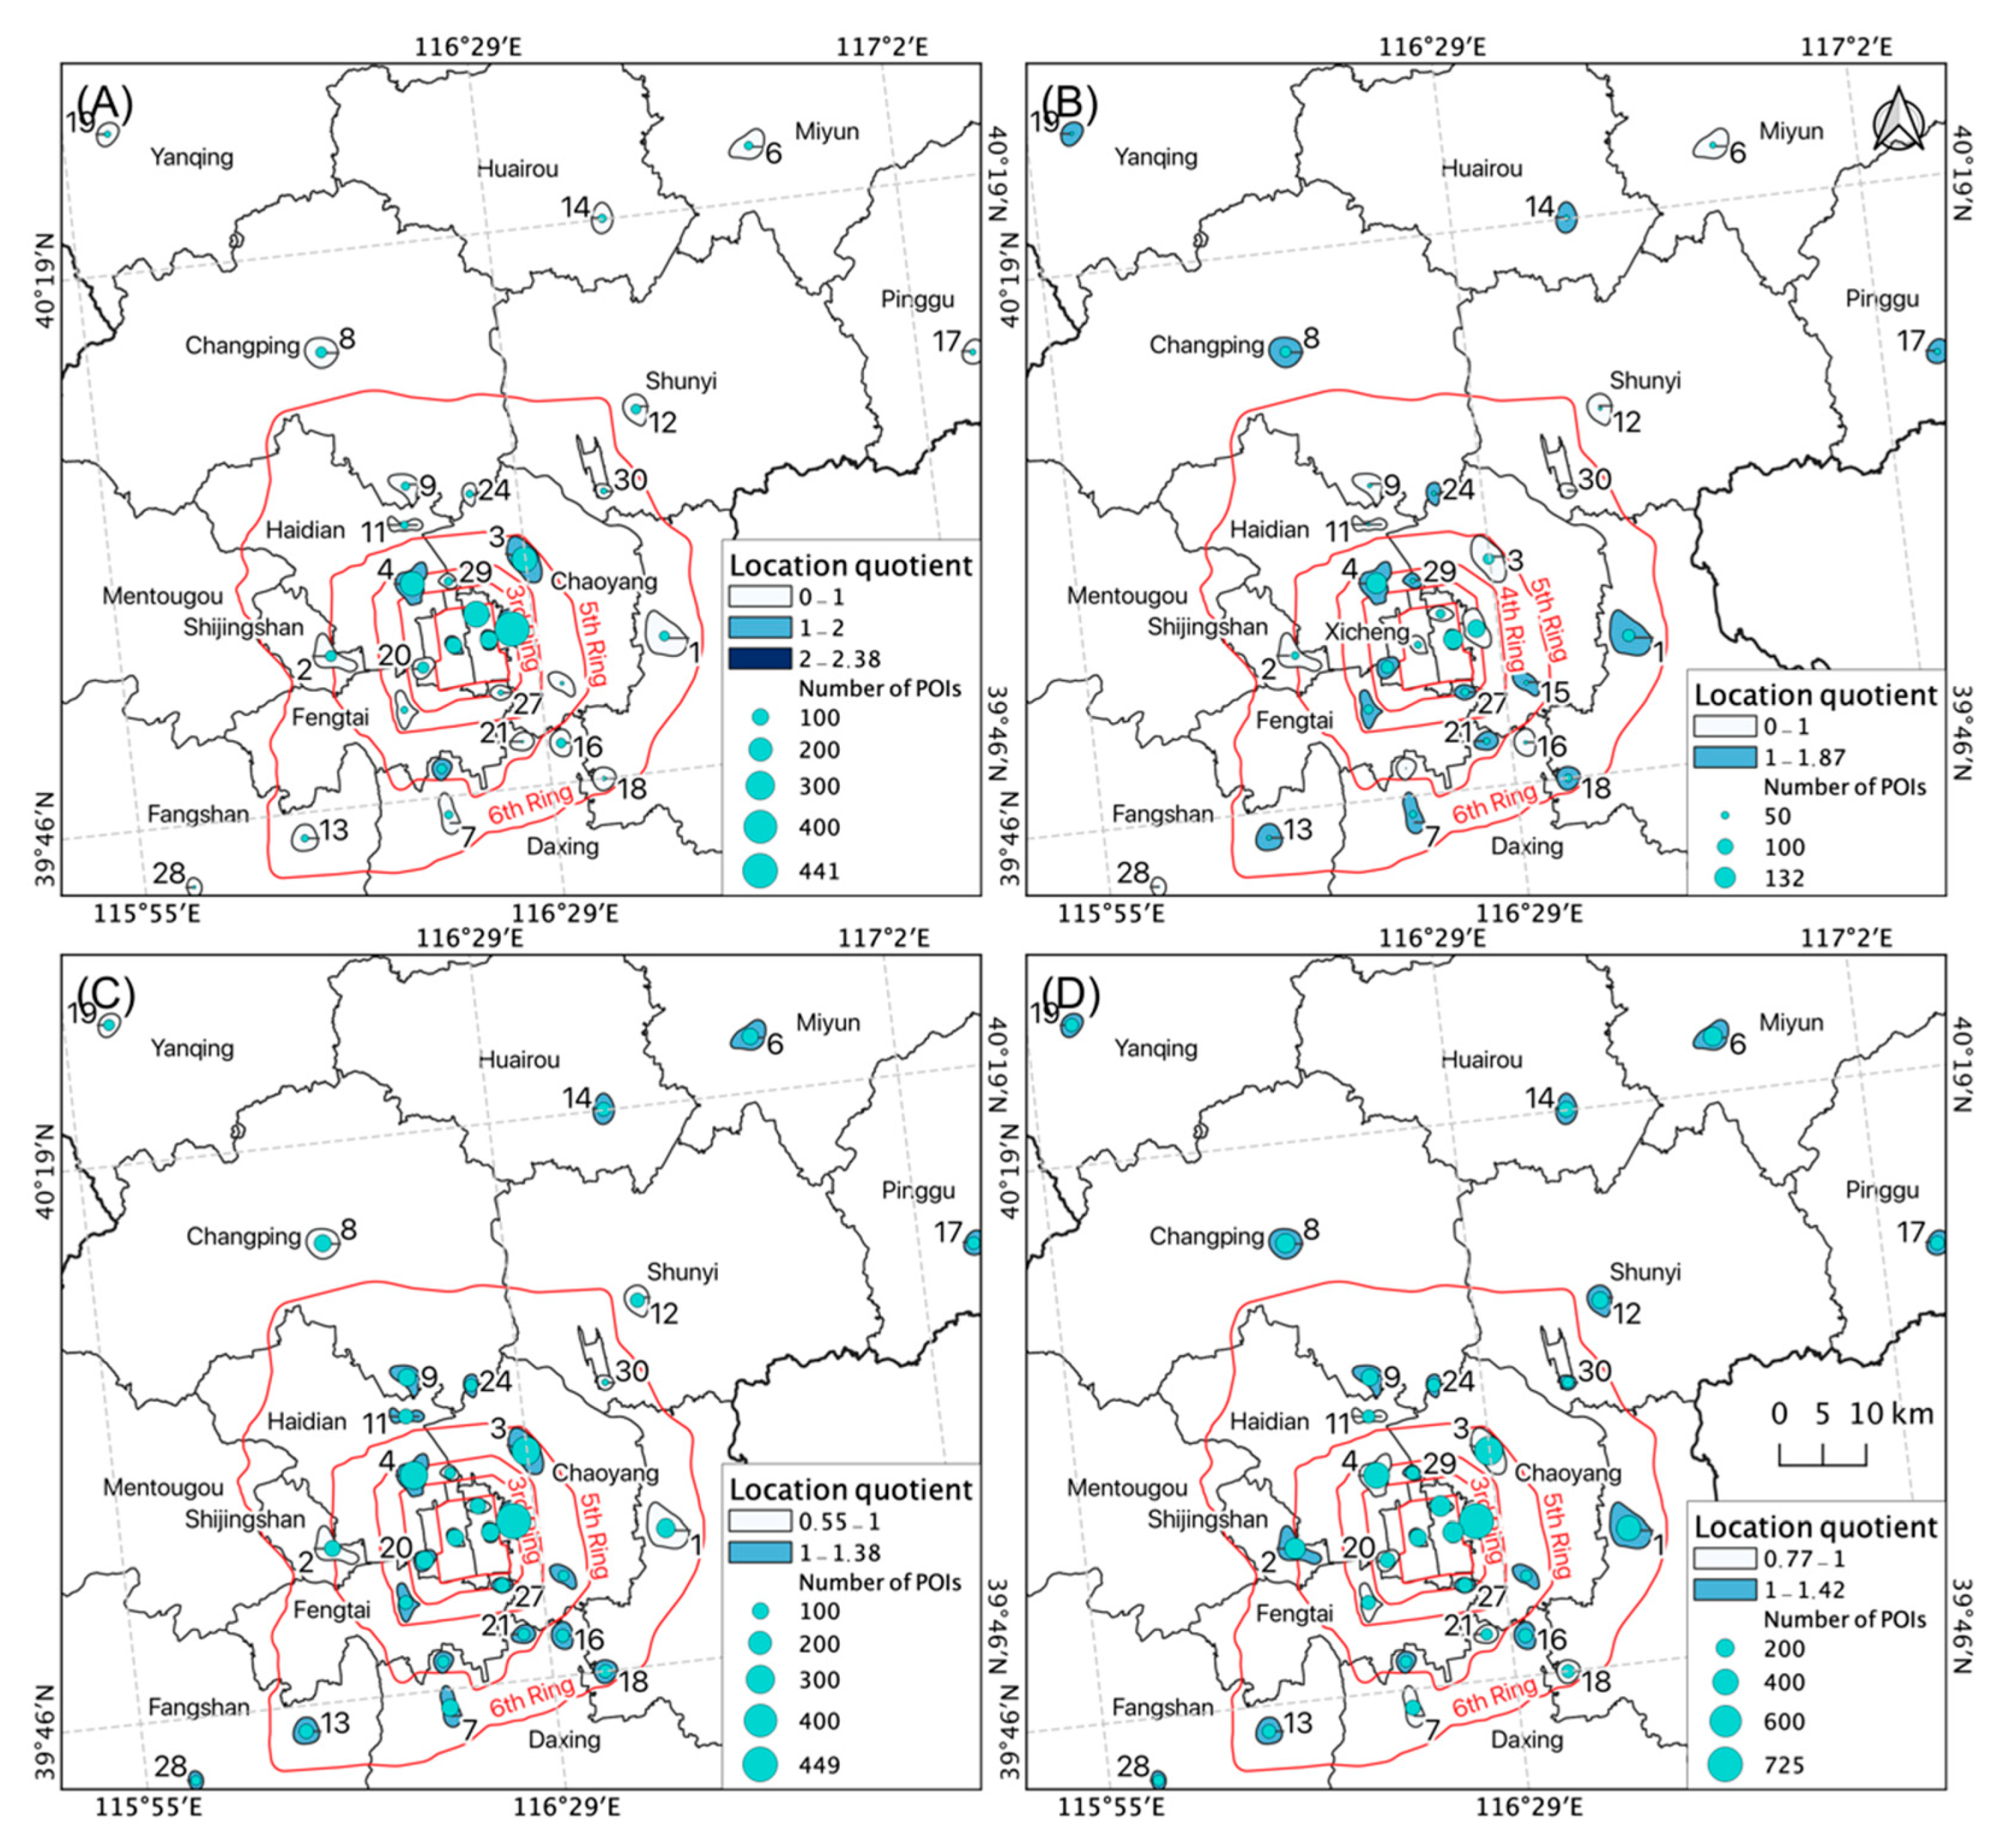
In this study, the functional differences within the accommodation and catering industry cluster centers were further evaluated using the location quotient (Figure 12 and Table A1). In general, the degree of industry specialization within different cluster centers differed. Cluster centers close to the city center are mostly characterized by multi-industry agglomeration, such as the #3 center in Wangjing-Jiuxianqiao Street of Chaoyang District, which is the cluster center of leisure catering, commercial accommodation, and fast food industries. The #4 center, located in Zhongguancun Street of Haidian District, is the cluster center of leisure food and beverage, commercial accommodation, and fast food industries. On a relative scale, some centers show significant agglomeration advantages of a single industry. For example, #12 center, located in Pingguoyuan Street in Shunyi District, is mainly used by the restaurant industry.
From the perspective of the specialization of the accommodation and catering industry, central urban areas of Beijing have more leisure catering business and less restaurants compared to the regional average. As the distance from the city center increases, the specializations of the commercial accommodation and restaurants in the cluster center increase, while the specialization of the fast food industry shows little spatial differences. According to the POI number of each cluster center, the urban central area is seldom specialized in a single industry because its POI distribution of the accommodation and catering industry is relatively dense, and the proportion of sub-industries is relatively balanced. On a relative level, it is easier to form a specialized advantage area in the cluster centers of outer suburbs because of the relatively small POI number.
5. Discussion
(1) Geographic distribution of the accommodation and cantering industry
In this study, based on POI data and density contour, we explored the geographic distribution of the accommodation and catering industry in Beijing. The industry has formed a monocentric specialized multipolar pattern; related businesses are mainly distributed in the central urban area with a large scale and complex levels, while relatively few businesses are in the outer suburban counties, showing that the development of the accommodation and catering industry in the central urban area is relatively mature. The multipolar structure pattern of the industry shows a peripheral decentralization trend. In terms of specialization or function in space, because of the differences in service levels and target population, different services present different distributions, especially regarding the specialization of commercial accommodation and leisure catering businesses, which showed completely different distribution trends (Figure 12). Compared to the regional average, high-concentration areas of commercial accommodation businesses were not located in the central area of the city, but mainly in the transportation hub centers (such as #20 and #30) and entertainment and leisure spaces (such as #23, #18, and #13). In contrast, the leisure catering industry was concentrated in the central urban area because of the target market and population linked to this industry.
Compared with other service sectors, such as business, software & information, and the retail industry, the accommodation and catering industry has a low potential for the division of labor and relatively low agglomeration effects. In this sense, the concentration layout of accommodation and catering businesses or activities produces little productivity improvement. According to these characteristics, the geographic distribution of the accommodation and catering industry actually relies more on population density. In Beijing, numerous diseases are caused by the agglomeration of the population, and the government makes many efforts to guide and relieve the service function and population by implementing urban plans [36]. As an important part of the life service industry, the multipolar pattern of the accommodation and catering industry shows that the policy effect of decentralization is embodied.
(2) Applicability of the method
The method used here to detect geographic distribution patterns of the industry combines two perspectives: morphological features and functional differences of economic clusters. This method inherits the advantages of the density contour-based method [41,48], including the identification of geometry features of cluster centers and their spatial relationship. Additionally, because of the spatial heterogeneity of the agglomeration effect, we used piecewise regression to determine the spatial distribution boundary of industries. To some extent, this could solve the issue of “over-extraction” or “insufficient extraction” caused by setting a fixed threshold. However, the mothed used in this study does not consider the size of the businesses, which would lead to underestimating the cluster size and location quotient. When the method is used to apply for a different industry or urban area, there are two factors that would impact the extraction accuracy. First, the areas of each geographic entity represented by POI should be as constant as possible, without high variance. Second, the contour interval should be determined in accordance with the characteristics of the local industry.
6. Conclusions
The dispersion and agglomeration of industries within a city is an important manifestation of service activities. Based on the POI data of accommodation and catering businesses, we analyzed the spatial structure of Beijing´s accommodation and catering industry by using the relationship between contour of POI density distribution and its spatial topology. We also discuss the spatial distribution and agglomeration characteristics of the industry. Our results show that:
(1) The spatial distribution of the accommodation and catering industry in Beijing presents a polycentric agglomeration. The contour tree was used to extract four composite centers and 12 isolated single cluster centers, in which the composite center contains 30 basic centers. In the urban centers with dense population and a dense road network (such as Dongcheng, Xicheng, Haidian, and Chaoyang, etc.), the accommodation and catering industry is characterized by multi-level nested composite agglomeration, while in the outer suburbs, such as Changping, Shunyi, Huairou, etc., it is dominated by isolated single agglomeration centers. In terms of level and scale, the accommodation and catering industry in the central urban area is at a higher level and covers a wide range, while the isolated single centers are relatively low and more scattered.
(2) There are some functional divisions in the agglomeration center. The cluster centers close to the core area of the city are characterized by the agglomeration of multiple industries, and the cluster centers in the outer suburbs of the city are more prominent in the single industry.
(3) From the perspective of the location quotient and the POI number of cluster centers, leisure catering businesses are mainly located close to urban centers. On the contrary, the cluster centers in the outer suburbs and counties are relatively small and dominated by restaurants and fast food businesses. Commercial accommodation businesses are mainly distributed in the transportation hub centers and in entertainment and leisure areas.
Author Contributions
Conceptualization, Wei Song and Ze Han; methodology, Ze Han; formal analysis, Ze Han; data curation, Ze Han; writing and original draft preparation, Ze Han; funding acquisition, Wei Song. All authors have read and agreed to the published version of the manuscript.
Funding
This work was supported by the National Natural Science Foundation of China [grant number 41671177], the Strategic Priority Research Program of Chinese Academy of Sciences [grant No. XDA20040201], the Second Tibetan Plateau Scientific Expedition and Research [grant number 2019QZKK0603], the Key Research and Development Program of China [grant numbers 2016YFA0602402 and 2018YFC1508801], and the Project from the Development Research Center of State Administration for Market Regulation, China (entitled Research on the analysis framework on quality safety situation).
Acknowledgments
We thank the Qiang Huang for preprocessing POI data and acknowledge support by the National Natural Science Foundation of China.
Conflicts of Interest
The authors declare no conflict of interest.
Appendix A

Table A1.
Location quotients of Beijing’s accommodation and catering industry cluster centers.
| No. | Leisure Dining | Commercial Accommodation | Fast Food | Restaurant |
|---|---|---|---|---|
| #1 | 0.39 | 1.10 | 0.84 | 1.27 |
| #2 | 0.64 | 0.92 | 0.84 | 1.23 |
| #3 | 1.36 | 0.53 | 1.06 | 0.96 |
| #4 | 1.33 | 1.06 | 1.07 | 0.83 |
| #5 | 1.62 | 0.55 | 1.00 | 0.90 |
| #6 | 0.44 | 0.89 | 1.00 | 1.22 |
| #7 | 0.51 | 1.20 | 1.30 | 0.95 |
| #8 | 0.64 | 1.30 | 0.94 | 1.08 |
| #9 | 0.49 | 0.72 | 1.30 | 1.08 |
| #10 | 0.44 | 1.79 | 1.01 | 0.98 |
| #11 | 0.65 | 0.82 | 1.38 | 0.95 |
| #12 | 0.75 | 0.67 | 0.98 | 1.18 |
| #13 | 0.55 | 1.04 | 1.25 | 1.01 |
| #14 | 0.61 | 1.02 | 1.00 | 1.13 |
| #15 | 0.24 | 1.61 | 1.06 | 1.07 |
| #16 | 0.91 | 0.83 | 1.03 | 1.05 |
| #17 | 0.38 | 1.40 | 1.01 | 1.10 |
| #18 | 0.22 | 1.83 | 1.13 | 0.98 |
| #19 | 0.53 | 1.05 | 0.92 | 1.19 |
| #20 | 0.81 | 1.73 | 1.19 | 0.77 |
| #21 | 0.10 | 1.87 | 1.18 | 0.98 |
| #22 | 1.21 | 0.38 | 1.15 | 1.00 |
| #23 | 2.38 | 0.74 | 0.56 | 0.84 |
| #24 | 0.60 | 1.14 | 1.08 | 1.05 |
| #25 | 1.16 | 1.67 | 0.76 | 0.91 |
| #26 | 1.38 | 0.92 | 0.97 | 0.91 |
| #27 | 0.28 | 1.60 | 1.12 | 1.03 |
| #28 | 0.19 | 0.82 | 1.12 | 1.25 |
| #29 | 0.77 | 1.25 | 0.85 | 1.10 |
| #30 | 0.79 | 0.63 | 0.55 | 1.42 |
| Mean | 0.75 | 1.10 | 1.02 | 1.05 |
| Max | 2.38 | 1.87 | 1.38 | 1.42 |
| Min | 0.10 | 0.38 | 0.55 | 0.77 |
References
- Đorđević, D.Ž.; Janković, M. Modern distribution and development of hotel industry in the world. Ekonomika 2015, 61, 99–110. [Google Scholar]
- Bull, P.J.; Church, A. The Hotel and Catering Industry of Great Britain during the 1980s: Sub-Regional Employment Change, Specialization and Dominance; John Wiley & Sons Ltd.: Chichester, UK, 1994; pp. 248–269. [Google Scholar]
- Bégin, S. The geography of a tourist business: Hotel distribution and urban development in Xiamen, China. Tour. Geogr. 2000, 2, 448–471. [Google Scholar] [CrossRef]
- Wood, R.C. Hospitality industry labour trends. Tour. Manag. 1992, 13, 297–304. [Google Scholar] [CrossRef]
- Yang, Z.; Sliuzas, R.; Cai, J.; Ottens, H.F.L. Exploring spatial evolution of economic clusters: A case study of Beijing. Int. J. Appl. Earth Obs. Geoinf. 2012, 19, 252–265. [Google Scholar] [CrossRef]
- James, P.; Bound, D. Urban morphology types and open space distribution in urban core areas. Urban Ecosyst. 2009, 12, 417. [Google Scholar] [CrossRef]
- Assaf, A.G.; Agbola, F.W. Total Productivity in the Australian Hotel Industry: Estimating and Bootstrapping Malmquist Indices. Tour. Anal. 2011, 16, 295–304. [Google Scholar] [CrossRef] [Green Version]
- Luo, H.; Yang, Y. Spatial pattern of hotel distribution in China. Tour. Hosp. Res. 2013, 13, 3–15. [Google Scholar] [CrossRef]
- Glaeser, E.L.; Kahn, M.E. Sprawl and urban growth. In Handbook of Regional and Urban Economics; Elsevier: Amsterdam, The Netherlands, 2004; Volume 4, pp. 2481–2527. [Google Scholar]
- Rienow, A.; Stenger, D.; Menz, G. Sprawling cities and shrinking regions—Forecasting urban growth in the Ruhr for 2025 by coupling cells and agents. Erdkunde 2014, 68, 85–107. [Google Scholar] [CrossRef]
- Li, J.; Sun, D. Industrial Composition and Agglomeration Shadow: Evidence from China’s Large Urban Systems. Complexity 2020, 2020, 5717803. [Google Scholar]
- Li, R.; Guo, Q.; Wu, D.; Yin, H.; Zhang, H.; Zhu, T. Spatial characteristics of development efficiency for urban tourism in eastern China: A case study of six coastal urban agglomerations. J. Geogr. Sci. 2014, 24, 1175–1197. [Google Scholar] [CrossRef]
- Dassah, E. An Examination of the Relationship between Spatial Morphology and Residential Satisfaction in Residential Settings in Garki, Abuja. Master’s Thesis, Edith Cowan University, Perth, WA, Australia, 2011. [Google Scholar]
- Liu, Z.; Liu, S. Polycentric development and the role of urban polycentric planning in China’s mega cities: An examination of Beijing’s metropolitan area. Sustainability 2018, 10, 1588. [Google Scholar] [CrossRef] [Green Version]
- Maskell, P.; Lorenzen, M. The cluster as market organisation. Urban Stud. 2004, 41, 991–1009. [Google Scholar] [CrossRef]
- Bhat, P.A.; ul Shafiq, M.; Mir, A.A.; Ahmed, P. Urban sprawl and its impact on landuse/land cover dynamics of Dehradun City, India. Int. J. Sustain. Built Environ. 2017, 6, 513–521. [Google Scholar] [CrossRef]
- Feng, J.; Zhou, Y.; Wu, F. New trends of suburbanization in Beijing since 1990: From government-led to market-oriented. Reg. Stud. 2008, 42, 83–99. [Google Scholar] [CrossRef] [Green Version]
- Weltevreden, J.W.J.; van Rietbergen, T. The implications of e-shopping for in-store shopping at various shopping locations in the Netherlands. Environ. Plan. B Plan. Des. 2009, 36, 279–299. [Google Scholar] [CrossRef]
- Rebelo, C.; Rodrigues, A.M.; Tenedório, J.A. Dasymetric Mapping Using UAV High Resolution 3D Data within Urban Areas. Remote Sens.-Basel 2019, 11, 1716. [Google Scholar] [CrossRef] [Green Version]
- Lan, T.; Yu, M.; Xu, Z.; Wu, Y. Temporal and spatial variation characteristics of catering facilities based on POI data: A case study within 5th Ring Road in Beijing. Procedia Comput. Sci. 2018, 131, 1260–1268. [Google Scholar] [CrossRef]
- Zhang, X.; Li, W.; Zhang, F.; Liu, R.; Du, Z. Identifying urban functional zones using public bicycle rental records and point-of-interest data. ISPRS Int. J. Geo-Inf. 2018, 7, 459. [Google Scholar] [CrossRef] [Green Version]
- Shen, Z.; Li, M. Big Data Support of Urban Planning and Management: The Experience in China; Springer: Berlin/Heidelberg, Germany, 2017. [Google Scholar]
- Blair, J.P.; Premus, R. Major factors in industrial location: A review. Econ. Dev. Q. 1987, 1, 72–85. [Google Scholar] [CrossRef]
- Weber, A. Theory of the Location of Industries; University of Chicago Press: Chicago, IL, USA, 1929. [Google Scholar]
- Losch, A. The Economics of Location; Yale University Press: New Haven, CT, USA, 1955. [Google Scholar]
- Ellison, G.; Glaeser, E.L.; Kerr, W.R. What causes industry agglomeration? Evidence from coagglomeration patterns. Am. Econ. Rev. 2010, 100, 1195–1213. [Google Scholar] [CrossRef] [Green Version]
- Alcácer, J.; Chung, W. Location strategies for agglomeration economies. Strateg. Manag. J. 2014, 35, 1749–1761. [Google Scholar] [CrossRef] [Green Version]
- Marshall, A. Principles of Economics: Unabridged Eighth Edition; Cosimo, Inc.: New York, NY, USA, 2009. [Google Scholar]
- Glatte, T.; Haupt, T. Location strategies: Methods and their methodological limitations. J. Eng. Des. Technol. 2015, 13, 435–462. [Google Scholar] [CrossRef]
- Badr, K.; Rizk, R.; Zaki, C. Firm productivity and agglomeration economies: Evidence from Egyptian data. Appl. Econ. 2019, 51, 5528–5544. [Google Scholar] [CrossRef]
- Rodríguez-Clare, A. The division of labor and economic development. J. Dev. Econ. 1996, 49, 3–32. [Google Scholar] [CrossRef]
- Becker, R.A.; Henderson, J.V. Intra-Industry Specialization and Urban Development; Economics of Cities: Theoretical Perspectives; Cambridge University Press: Cambridge, UK, 2000; pp. 138–166. [Google Scholar]
- Bourdeau-Lepage, L.; Huriot, J.M. On poles and centers: Cities in the French style. Urban Public Econ. Rev. 2005, 3, 12–35. [Google Scholar]
- Krehl, A.; Siedentop, S. Towards a typology of urban centers and subcenters–evidence from German city regions. Urban Geogr. 2019, 40, 58–82. [Google Scholar] [CrossRef] [Green Version]
- Lin, D.; Allan, A.; Cui, J. Does Polycentric Urban Spatial Development Lead to Less Commuting: A Perspective of Jobs-Housing Balance. In Proceedings of the 49th ISOCARP Congress, Brisbane, QLD, Australia, 1–4 October 2013; p. 10. [Google Scholar]
- Huang, D.; Liu, Z.; Zhao, X. Monocentric or polycentric? The urban spatial structure of employment in Beijing. Sustainability 2015, 7, 11632–11656. [Google Scholar] [CrossRef] [Green Version]
- Cai, J.; Huang, B.; Song, Y. Using multi-source geospatial big data to identify the structure of polycentric cities. Remote Sens. Environ. 2017, 202, 210–221. [Google Scholar] [CrossRef]
- Ripley, B.D. Modelling Spatial Patterns. J. R. Stat. Soc. Ser. B 1977, 39, 172–212. [Google Scholar] [CrossRef]
- Bade, F.-J.; Bode, E.; Cutrini, E. Spatial fragmentation of industries by functions. Ann. Reg. Sci. 2015, 54, 215–250. [Google Scholar] [CrossRef]
- Marcon, E.; Puech, F. Measures of the geographic concentration of industries: Improving distance-based methods. J. Econ. Geogr. 2009, 10, 745–762. [Google Scholar] [CrossRef] [Green Version]
- Chen, Z.; Yu, B.; Song, W.; Liu, H.; Wu, Q.; Shi, K.; Wu, J. A new approach for detecting urban centers and their spatial structure with nighttime light remote sensing. IEEE T Geosci. Remote 2017, 55, 6305–6319. [Google Scholar] [CrossRef]
- Wu, Q.; Liu, H.; Wang, S.; Yu, B.; Beck, R.; Hinkel, K. A localized contour tree method for deriving geometric and topological properties of complex surface depressions based on high-resolution topographical data. Int. J. Geogr. Inf. Sci. 2015, 29, 2041–2060. [Google Scholar] [CrossRef]
- Gokan, T. On the Usage of the Measurements of Geographical Concentration and Specialization with Areal Data. Available online: https://www.semanticscholar.org/paper/On-the-usage-of-the-measurements-of-geographical-Gokan/136c3cbf7465c54110114cdbbdc177df15bebf77 (accessed on 24 August 2020).
- Aiginger, K.; Davies, S.W. Industrial specialisation and geographic concentration: Two sides of the same coin? Not for the European Union. J. Appl. Econ. 2004, 7, 231–248. [Google Scholar] [CrossRef] [Green Version]
- Rocha, J.; Tenedório, J.A. Spatial Analysis, Modelling and Planning; Intech Open: London, UK, 2018. [Google Scholar]
- Vermote, E.; Justice, C.; Claverie, M.; Franch, B. Preliminary analysis of the performance of the Landsat 8/OLI land surface reflectance product. Remote Sens. Environ. 2016, 185, 46–56. [Google Scholar] [CrossRef]
- Barlacchi, G.; Lepri, B.; Moschitti, A. Land Use Classification with Point of Interests and Structural Patterns. IEEE Trans. Knowl. Data Eng. 2020. [Google Scholar] [CrossRef]
- Deng, Y.; Liu, J.; Liu, Y.; Luo, A. Detecting urban polycentric structure from POI data. ISPRS Int. J. Geo-Inf. 2019, 8, 283. [Google Scholar] [CrossRef] [Green Version]
- Gong, L.; Jin, M.; Liu, Q.; Gong, Y.; Liu, Y. Identifying Urban Residents’ Activity Space at Multiple Geographic Scales Using Mobile Phone Data. ISPRS Int. J. Geo-Inf. 2020, 9, 241. [Google Scholar] [CrossRef]
- Qiao, C.F.; Chen, J.; Zhao, R.L.; Li, J. Preliminary studies on contour tree-based topographic data mining. In Proceedings of the International Symposium on Spatio-Temporal, Beijing, China, 27–29 August 2005. [Google Scholar]
- Okabe, A.; Satoh, T.; Sugihara, K. A kernel density estimation method for networks, its computational method and a GIS-based tool. Int. J. Geogr. Inf. Sci. 2009, 23, 7–32. [Google Scholar] [CrossRef]
- Liu, X.; Derudder, B.; Wu, K. Measuring polycentric urban development in China: An intercity transportation network perspective. Reg. Stud. 2016, 50, 1302–1315. [Google Scholar] [CrossRef]
- Zhan, D.S.; Meng, B. Spatial clustering analysis of residential and employment distribution in Beijing based on their social characteristics. Acta Geogr. Sin. 2013, 68, 1607–1618. [Google Scholar]
Figure 1.
Map of the study area. The background is a natural color composite image displaying a combination of the visible red, green, and blue band of satellite imagery. The satellite imagery used here is Landsat 8 Operational Land Imager (OLI) 30 m images [46].
Figure 1.
Map of the study area. The background is a natural color composite image displaying a combination of the visible red, green, and blue band of satellite imagery. The satellite imagery used here is Landsat 8 Operational Land Imager (OLI) 30 m images [46].

Figure 2.
Boundary of the industrial agglomeration area. (A) Outline of industrial distribution in the city; (B) change trend of the distance between the contour line and its corresponding leaf node.
Figure 2.
Boundary of the industrial agglomeration area. (A) Outline of industrial distribution in the city; (B) change trend of the distance between the contour line and its corresponding leaf node.
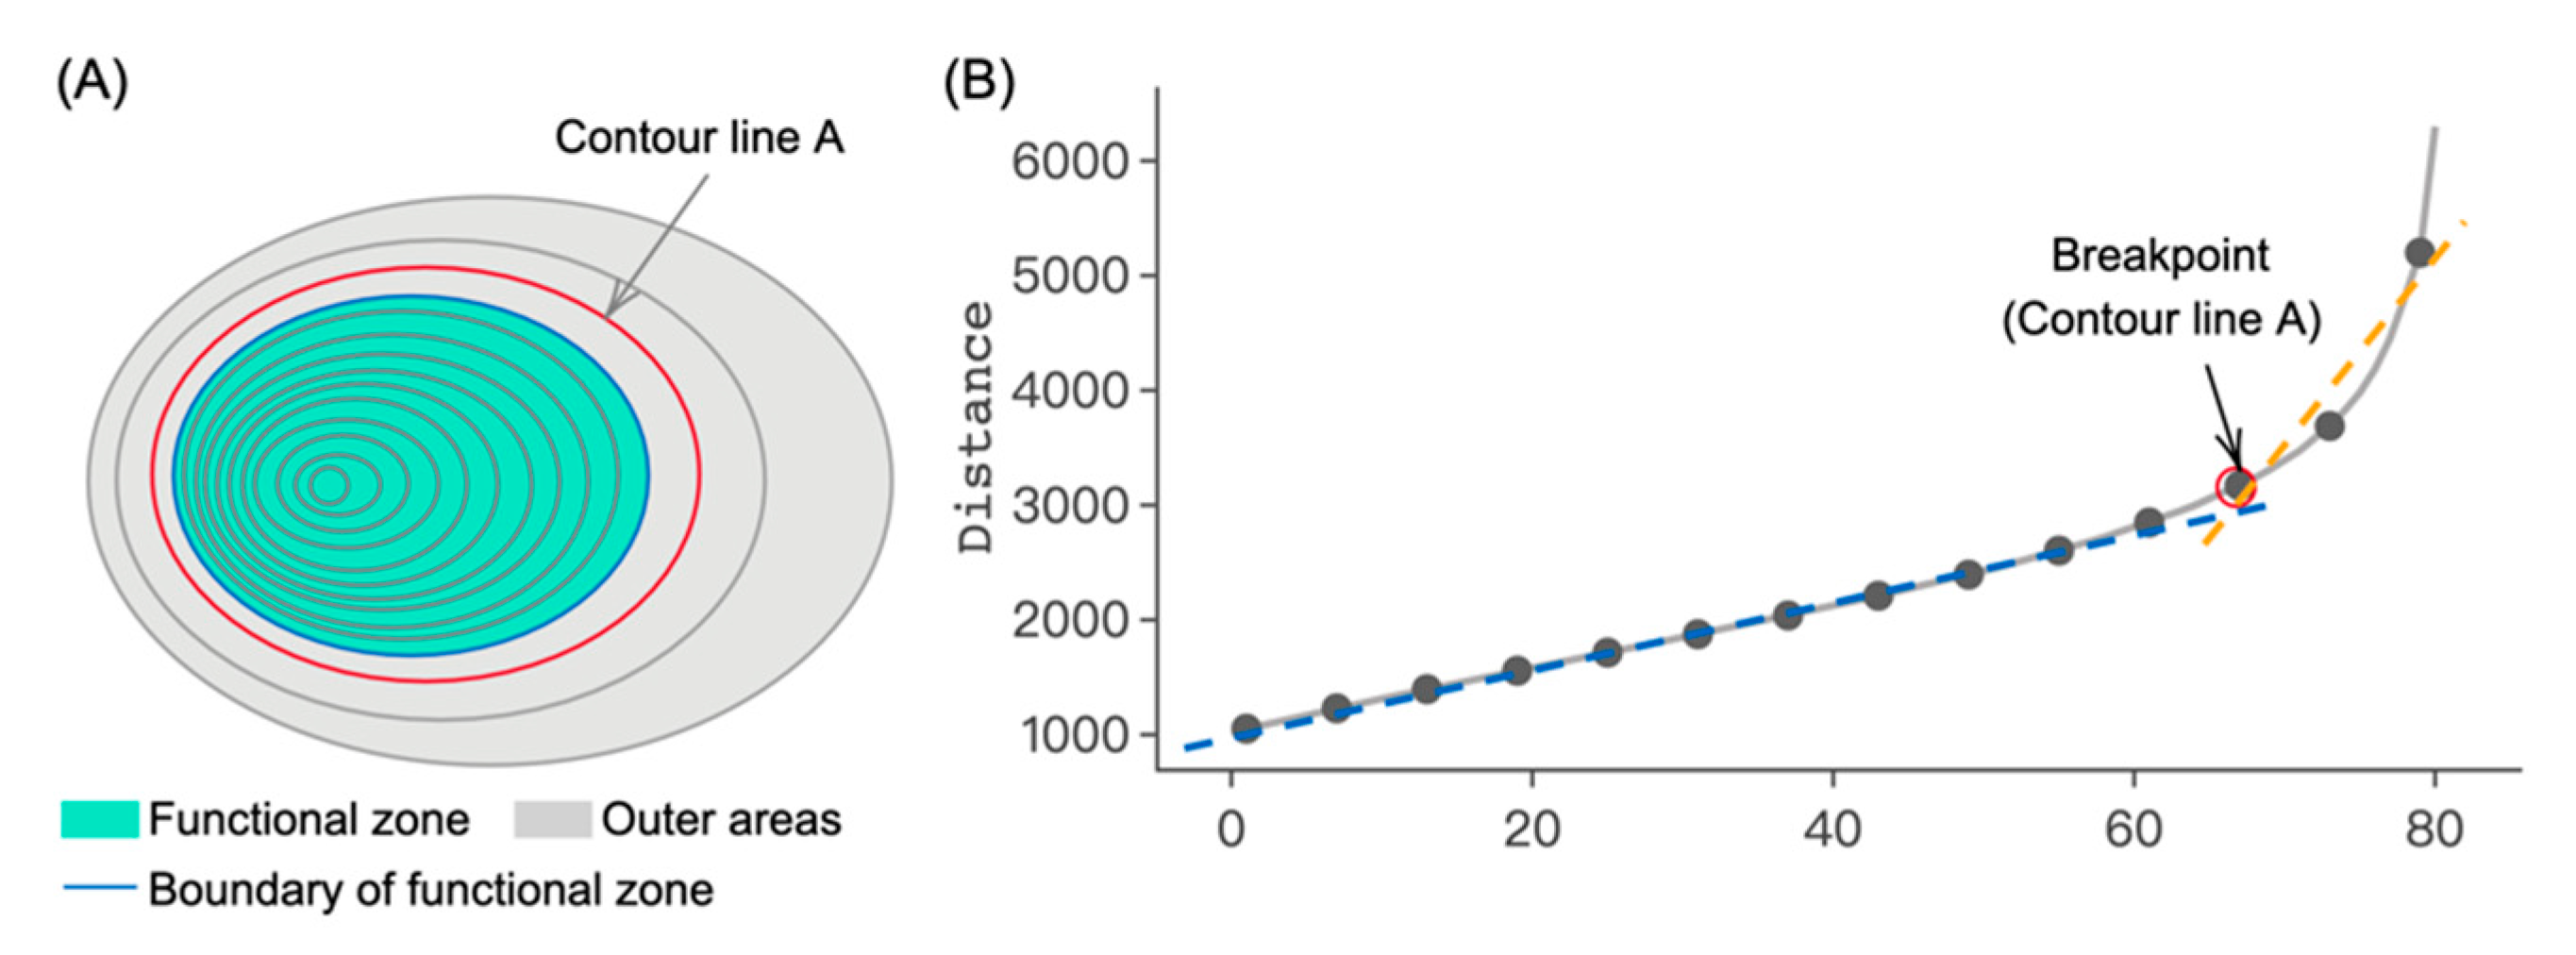
Figure 3.
Single concentric structure of point of interest (POI) density distribution. (A) POI kernel density distribution; (B) POI kernel density isolines; (C) Single concentric closed contour.
Figure 3.
Single concentric structure of point of interest (POI) density distribution. (A) POI kernel density distribution; (B) POI kernel density isolines; (C) Single concentric closed contour.

Figure 4.
Composite concentric structure of POI density distribution. (A) POI kernel density distribution; (B) POI kernel density isolines; (C) Composite concentric contour.
Figure 4.
Composite concentric structure of POI density distribution. (A) POI kernel density distribution; (B) POI kernel density isolines; (C) Composite concentric contour.
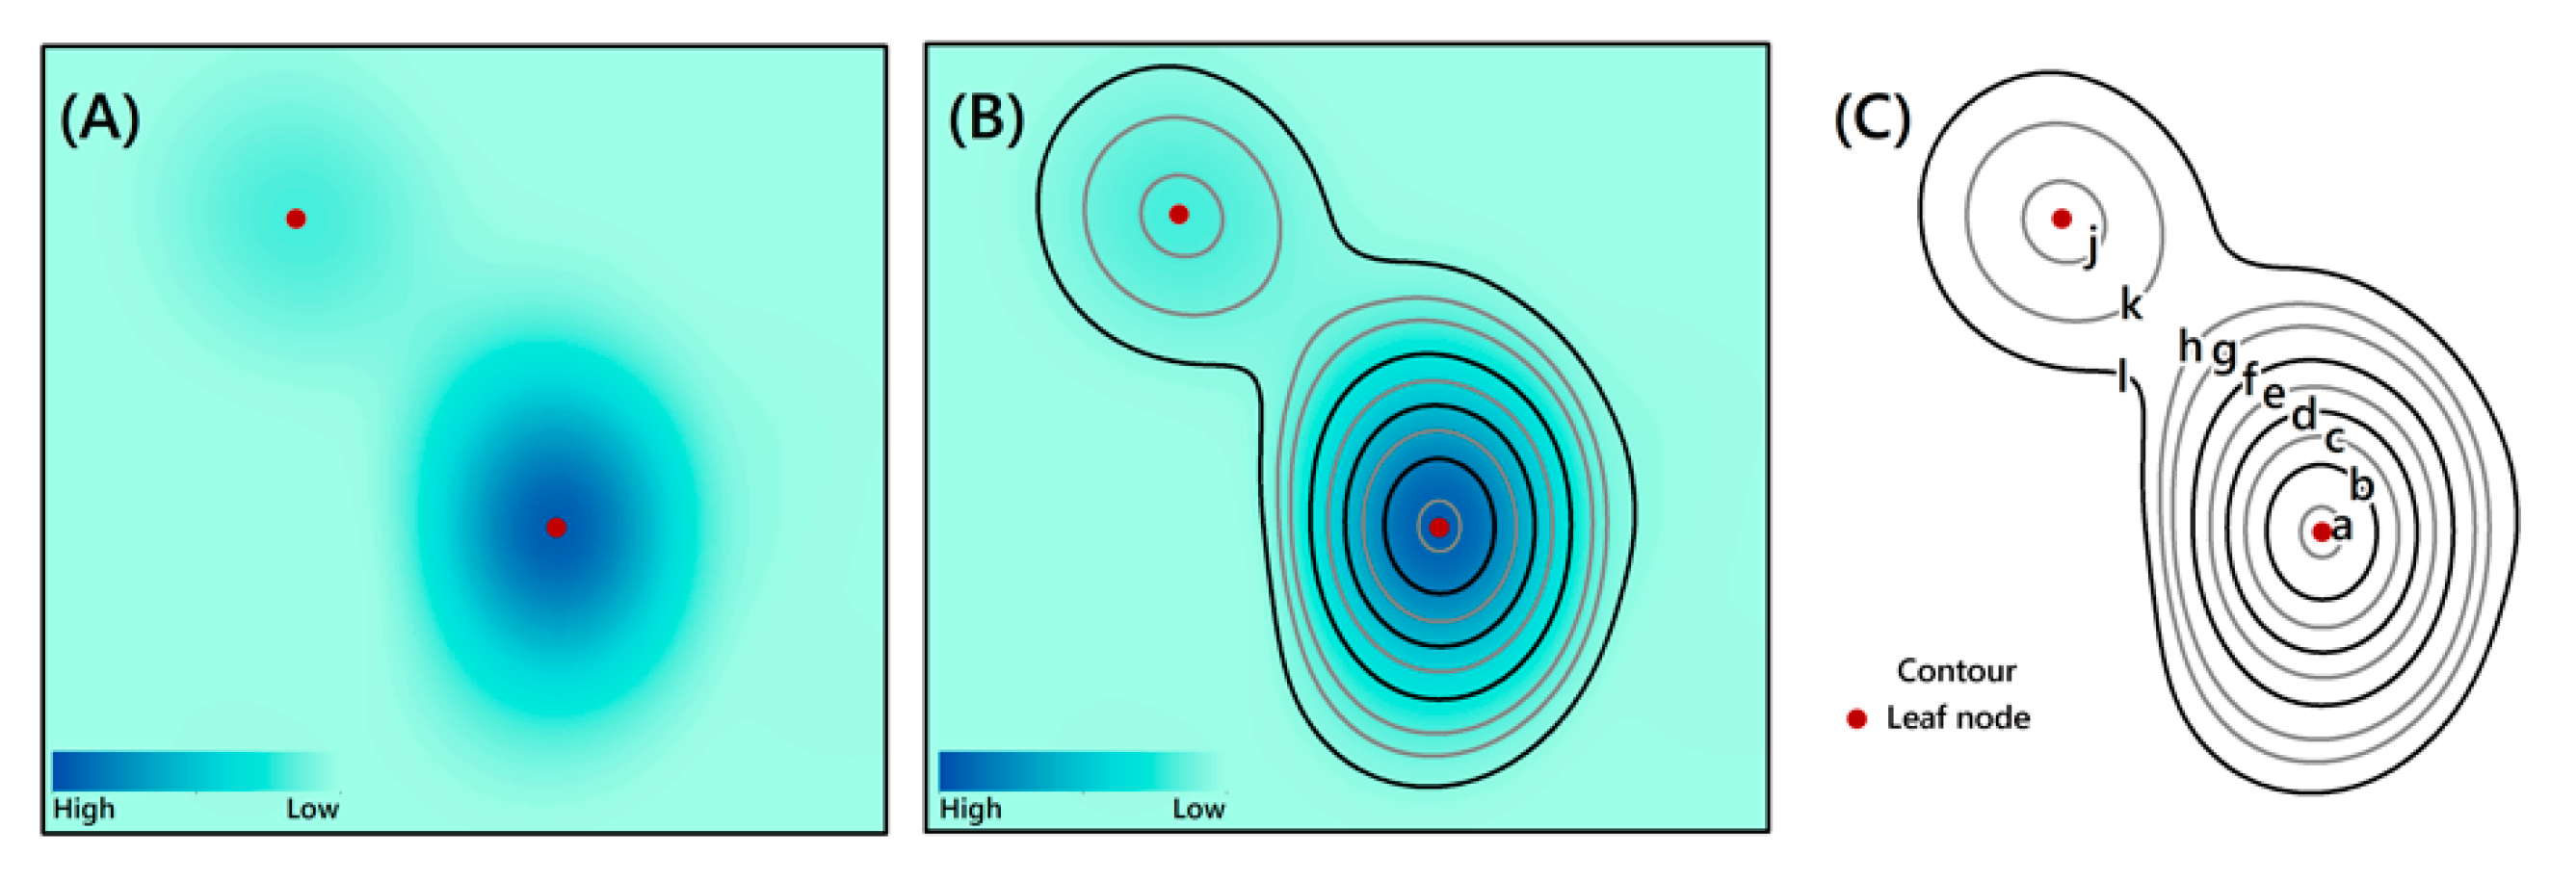
Figure 5.
Simplification of the contour tree. (A) Original contour line; (B) Original contour line tree; (C) Simplified contour line; (D) Simplified contour line tree.
Figure 5.
Simplification of the contour tree. (A) Original contour line; (B) Original contour line tree; (C) Simplified contour line; (D) Simplified contour line tree.

Figure 6.
Flowchart showing the steps for the identification of the urban industrial spatial cluster center.
Figure 6.
Flowchart showing the steps for the identification of the urban industrial spatial cluster center.

Figure 7.
Spatial distribution of POI kernel density with different search radii. (A) 1000 m; (B) 2000 m; (C) 3000 m; (D) 5000 m.
Figure 7.
Spatial distribution of POI kernel density with different search radii. (A) 1000 m; (B) 2000 m; (C) 3000 m; (D) 5000 m.
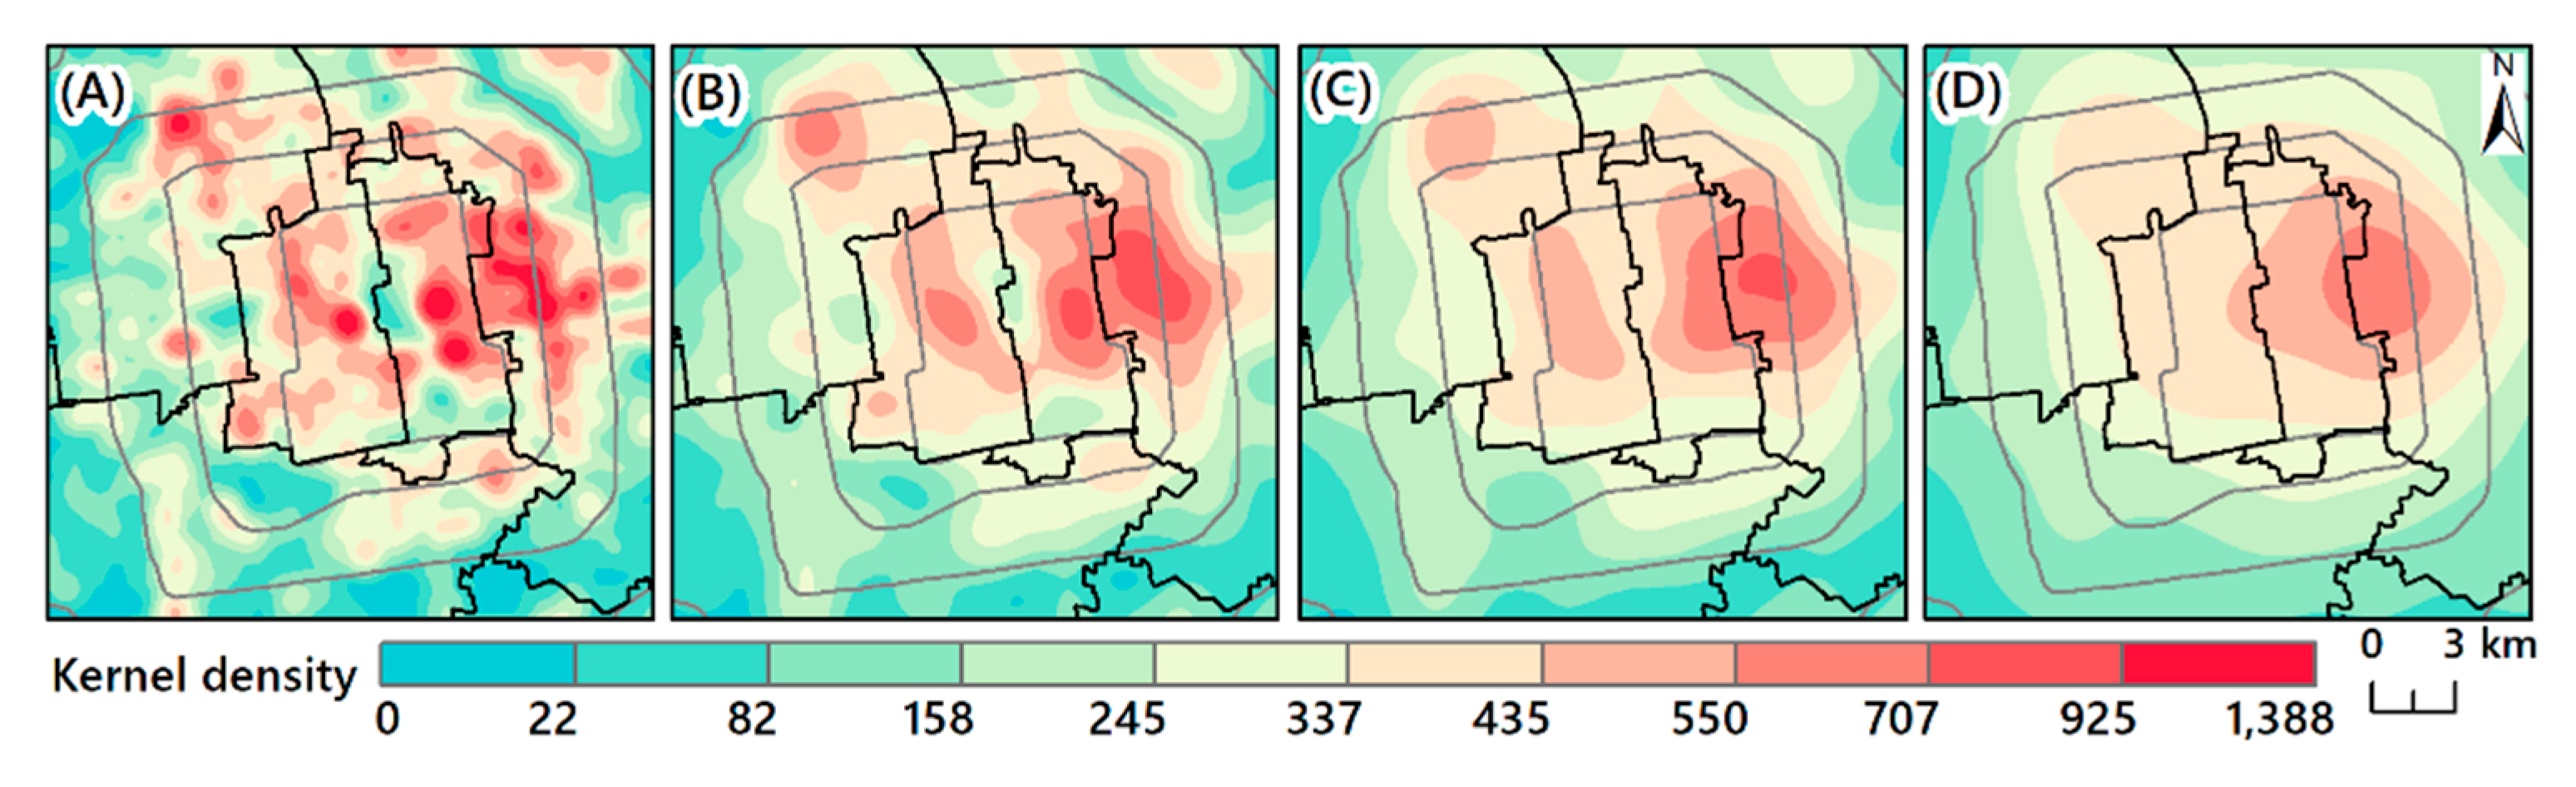
Figure 8.
Spatial distribution of the kernel density contour of the accommodation and catering industry in Beijing. (A) Distribution in Beijing; (B) Distribution within the Fifth Ring Road; (C) Relationship between the kernel density distribution distance and the distance to the urban center.
Figure 8.
Spatial distribution of the kernel density contour of the accommodation and catering industry in Beijing. (A) Distribution in Beijing; (B) Distribution within the Fifth Ring Road; (C) Relationship between the kernel density distribution distance and the distance to the urban center.

Figure 9.
Spatial distribution structure of the accommodation and catering industry in Beijing. (A) Simplified contour line; (B) Structure of the main tree; (C) Composite center and single center.
Figure 9.
Spatial distribution structure of the accommodation and catering industry in Beijing. (A) Simplified contour line; (B) Structure of the main tree; (C) Composite center and single center.

Figure 10.
Spatial distribution of accommodation and catering centers in Beijing (A) and the Fifth Ring Road (B).
Figure 10.
Spatial distribution of accommodation and catering centers in Beijing (A) and the Fifth Ring Road (B).

Figure 11.
Location and boundary of the distribution center of the (A) accommodation and (B) catering industry, extracted at different contour intervals.
Figure 11.
Location and boundary of the distribution center of the (A) accommodation and (B) catering industry, extracted at different contour intervals.

Figure 12.
Location quotient distribution of (A) leisure catering, (B) commercial accommodation, (C) fast food businesses, and (D) restaurants within Beijing´s accommodation and catering industry cluster centers. Classification into low, relatively low, medium, relatively high, and high was made by the quantile (equal count) based on the calculation result of the location quotient (Table A1).

Table 1.
Point of interest (POI) categories of accommodation and catering in Beijing.
| Category | POI Subcategory | Quantity | Proportion (%) |
|---|---|---|---|
| Leisure catering | Teahouse, tea culture center, bar, cafe, cold drink shop | 4770 | 11.48 |
| Commercial accommodation | Hotel apartment, ordinary rental apartment, star hotel, general hotel | 6736 | 16.22 |
| Fast food | Fast food | 9187 | 22.12 |
| Restaurant | Local flavor restaurants, local famous restaurants, foreign flavor restaurants, and Chinese food restaurants | 20,843 | 50.18 |
Table 2.
Attributes of Beijing’s accommodation and catering industry cluster centers (units: km, km2).
Table 2.
Attributes of Beijing’s accommodation and catering industry cluster centers (units: km, km2).
| Administrative Region | No. | Location | POI Density | Geometric Properties | ||||
|---|---|---|---|---|---|---|---|---|
| Side Length (km) | Area (km2) | Width (km) | Height (km) | Height-Width Ratio | ||||
| Dongcheng District | #25 | Jianguomen Street, Chaoyangmen Street | 144.19 | 6.59 | 3.34 | 1.80 | 2.27 | 1.26 |
| #23 | Andingmen Street, Jiaodaokou Street, east of Beixinqiao Street | 132.85 | 7.17 | 3.58 | 2.90 | 1.68 | 0.58 | |
| Xicheng District | #29 | North of Deshengmen Street | 63.63 | 5.88 | 2.57 | 2.12 | 1.75 | 0.83 |
| #26 | East of West Chang’an Street and east of Financial Street | 98.89 | 6.53 | 3.00 | 2.04 | 2.04 | 1.00 | |
| #20 | Northeast of Guang’anmenwai Street, southwest of Yuetan Street | 71.77 | 7.83 | 4.59 | 2.52 | 2.46 | 0.97 | |
| Chaoyang District | #5 | Sanlitun Street, Chaowai Street, Hujialou Street, west side of Tuanjiehu Street, Jianwai Street | 155.05 | 12.11 | 9.74 | 3.23 | 4.46 | 1.38 |
| #30 | Capital international airport Street | 23.54 | 5.64 | 2.47 | 1.87 | 1.66 | 0.89 | |
| #3 | Northeast of Wangjing Street, Jiuxianqiao Street | 65.13 | 14.35 | 13.70 | 3.97 | 5.26 | 1.33 | |
| #29 | Southwest of Yayuncun Street, northwest of Anzhen Street | 63.63 | 5.88 | 2.57 | 2.12 | 1.75 | 0.83 | |
| #24 | Northwest of Laiguangying Street | 40.55 | 6.77 | 3.22 | 1.59 | 2.62 | 1.65 | |
| #15 | Southeast of Nanmofang Town, Fatou Street, northeast of Shibalidian Town | 23.47 | 8.97 | 5.23 | 3.01 | 2.79 | 0.93 | |
| Fengtai District | #27 | South of Fangzhuang Town, north of Dongtiejiangying Street | 71.27 | 6.44 | 3.10 | 2.46 | 1.70 | 0.69 |
| #20 | Northeast of Taipingqiao Street | 71.77 | 7.83 | 4.59 | 2.52 | 2.46 | 0.97 | |
| #10 | East of Fengtai Street, north of Xincun Street, south of Lugouqiao Street | 38.37 | 10.87 | 6.10 | 2.56 | 4.40 | 1.71 | |
| Shijingshan District | #2 | South side of Pingguoyuan Street, Bajiao Street, Laoshan Street, Lugu Street and north side of Babaoshan Street | 31.74 | 14.76 | 10.59 | 4.93 | 4.33 | 0.88 |
| Haidian District | #4 | Dongshengyuan, Zhongguancun Street, Haidian Street, Beixiaguan Street | 81.08 | 13.57 | 11.22 | 3.58 | 4.85 | 1.35 |
| #29 | East of Huayuan road Street, southwest of Yayuncun Street, northwest of Anzhen Street | 63.63 | 5.88 | 2.57 | 2.12 | 1.75 | 0.83 | |
| #20 | Southeast of Yangfangdian Street | 71.77 | 7.83 | 4.59 | 2.52 | 2.46 | 0.97 | |
| #11 | Qinghe Street, Shangdi Street, Xisanqi Street | 37.04 | 10.06 | 4.38 | 3.94 | 1.70 | 0.43 | |
| Fangshan District | #28 | Chengguan Street | 24.42 | 6.02 | 2.80 | 1.66 | 2.16 | 1.30 |
| #13 | Gongchen Street, east of Xilu Street | 29.73 | 9.50 | 7.06 | 2.96 | 3.02 | 1.02 | |
| Tongzhou District | #18 | Northwest of Majuqiao Town | 30.71 | 8.26 | 5.39 | 2.63 | 2.64 | 1.00 |
| #1 | Beiyuan Street, south side of Yongshun Town, west side of Zhongcang Street, Yuqiao Street, north of Liyuan Town | 29.67 | 15.61 | 17.10 | 4.76 | 5.16 | 1.09 | |
| Shunyi District | #30 | Northeast of Tianzhu Town | 23.54 | 5.64 | 2.47 | 1.87 | 1.66 | 0.89 |
| #12 | Shengli Street, Guangming Street, east of Wangquan Street | 30.97 | 9.96 | 7.42 | 2.74 | 3.56 | 1.30 | |
| Changping District | #9 | Huilongguan Street | 41.89 | 10.97 | 7.15 | 3.39 | 3.52 | 1.04 |
| #8 | Chengbei Street, northwest of Chengnan Street | 37.18 | 11.25 | 9.97 | 3.75 | 3.41 | 0.91 | |
| #24 | South of Tiantongyuan north Street and Tiantongyuan south Street | 40.55 | 6.77 | 3.22 | 1.59 | 2.62 | 1.65 | |
| Daxing District | #7 | East of Xingfeng Street and Qingyuan Street, west of Guanyinsi Street | 31.44 | 11.25 | 7.21 | 2.38 | 4.66 | 1.96 |
| #22 | Xihongmen Town | 31.00 | 7.22 | 4.03 | 2.22 | 2.45 | 1.11 | |
| #21 | Jiugong Town | 26.49 | 7.56 | 4.34 | 2.71 | 2.11 | 0.78 | |
| #16 | Beijing Economic-Technological Development Area | 28.41 | 8.83 | 5.98 | 2.42 | 3.10 | 1.28 | |
| Huairou District | #14 | Northeast of Longshan Street, Quanhe Street | 30.47 | 9.23 | 6.34 | 2.35 | 3.50 | 1.49 |
| Pinggu District | #17 | East of Binhe Street, north of Yuyang Town, south of Xinggu Street | 28.92 | 8.31 | 5.41 | 2.51 | 2.78 | 1.11 |
| Miyun District | #6 | Northeast of Guoyuan Street, Gulou Street | 30.75 | 11.70 | 9.41 | 3.97 | 3.41 | 0.86 |
| Yanqing District | #19 | Xiangshuiyuan Street, east of Rulin Street, northwest of Yanqing Town, north of Baiquan Street | 27.71 | 8.09 | 5.04 | 2.47 | 2.70 | 1.09 |
| In total | Average value | 51.27 | 9.38 | 6.38 | 2.85 | 3.07 | 1.11 | |
| Maximum value | 155.05 | 15.61 | 17.10 | 4.93 | 5.26 | 1.96 | ||
| Minimum value | 23.47 | 5.64 | 2.47 | 1.59 | 1.66 | 0.43 | ||
Table 3.
Influences of different contour intervals on the number and area of the extracted cluster centers.
Table 3.
Influences of different contour intervals on the number and area of the extracted cluster centers.
| Interval (Centers/km) | Number of Centers | Area of the Center (km2) |
|---|---|---|
| 2.5 | 41 | 290.86 |
| 5.0 | 30 | 191.45 |
| 7.5 | 28 | 192.66 |
| 10.0 | 29 | 169.88 |
© 2020 by the authors. Licensee MDPI, Basel, Switzerland. This article is an open access article distributed under the terms and conditions of the Creative Commons Attribution (CC BY) license (http://creativecommons.org/licenses/by/4.0/).
Share and Cite
MDPI and ACS Style
Han, Z.; Song, W. Identification and Geographic Distribution of Accommodation and Catering Centers. ISPRS Int. J. Geo-Inf. 2020, 9, 546. https://0-doi-org.brum.beds.ac.uk/10.3390/ijgi9090546
AMA Style
Han Z, Song W. Identification and Geographic Distribution of Accommodation and Catering Centers. ISPRS International Journal of Geo-Information. 2020; 9(9):546. https://0-doi-org.brum.beds.ac.uk/10.3390/ijgi9090546
Chicago/Turabian StyleHan, Ze, and Wei Song. 2020. "Identification and Geographic Distribution of Accommodation and Catering Centers" ISPRS International Journal of Geo-Information 9, no. 9: 546. https://0-doi-org.brum.beds.ac.uk/10.3390/ijgi9090546
Note that from the first issue of 2016, this journal uses article numbers instead of page numbers. See further details here.