Article

A Spatial Agent-Based Model to Assess the Spread of Malaria in Relation to Anti-Malaria Interventions in Southeast Iran

by
Navid Mahdizadeh Gharakhanlou
1,
Navid Hooshangi
2 and
Marco Helbich
3,*
1
Geospatial Information Science Division, Faculty of Geodesy and Geomatics Engineering, and Center of Excellence in Geo-Information Technology, K.N. Toosi University of Technology, Tehran 1996715433, Iran
2
Department of Surveying Engineering, College of Earth Sciences Engineering, Arak University of Technology, Arak 3818146763, Iran
3
Department of Human Geography and Spatial Planning, Faculty of Geosciences, Utrecht University, 3584 CB Utrecht, The Netherlands
*
Author to whom correspondence should be addressed.
ISPRS Int. J. Geo-Inf. 2020, 9(9), 549; https://0-doi-org.brum.beds.ac.uk/10.3390/ijgi9090549
Submission received: 17 August 2020 / Revised: 9 September 2020 / Accepted: 13 September 2020 / Published: 15 September 2020

Abstract

:
Malaria threatens the lives of many people throughout the world. To counteract its spread, knowledge of the prevalence of malaria and the effectiveness of intervention strategies is of great importance. The aim of this study was to assess (1) the spread of malaria by means of a spatial agent-based model (ABM) and (2) the effectiveness of several interventions in controlling the spread of malaria. We focused on Sarbaz county in Iran, a malaria-endemic area where the prevalence rate is high. Our ABM, which was carried out in two steps, considers humans and mosquitoes along with their attributes and behaviors as agents, while the environment is made up of diverse environmental factors, namely air temperature, relative humidity, vegetation, altitude, distance from rivers and reservoirs, and population density, the first three of which change over time. As control interventions, we included long-lasting insecticidal nets (LLINs) and indoor residual spraying (IRS). The simulation results showed that applying LLINs and IRS in combination, rather than separately, was most efficient in reducing the number of infected humans. In addition, LLINs and IRS with moderate or high and high coverage rates, respectively, had significant effects on reducing the number of infected humans when applied separately. Our results can assist health policymakers in selecting appropriate intervention strategies in Iran to reduce malaria transmission.

1. Introduction

Malaria is a vector-borne disease in tropical and subtropical regions caused by Plasmodium parasites. It is transmitted through infected female Anopheles mosquitoes [1] and is endemic in more than 100 countries [2]. Iran is one such country. Although control interventions were introduced there in 1956, malaria remains a health threat with high morbidity. The provinces in the southeast of the country—namely Sistan and Baluchestan, Hormozgan, and Kerman—are malaria hotspots [3]. As a result of significant efforts to control malaria in 2000–2015, the incidence rate declined by 37% while the number of related deaths dropped by 60% [4]. Nevertheless, during the course of 2015, there were 214 million cases of malaria and 438,000 deaths worldwide [5]. Despite tremendous progress in fighting malaria throughout the world, the disease remains a grave public health concern, one that contributes to the leading causes of morbidity and mortality in many countries, including Iran [6,7].
The spread of malaria depends on the population density, the density of Anopheles mosquitoes, and mosquitoes’ access to humans [8]. Therefore, these spreading mechanisms are also targeted through interventions that usually concentrate on reducing mosquito populations [9,10] or limiting their access to humans, or both [10,11,12]. The majority of interventions are focused on reducing the spread of malaria by killing mosquitoes [9,10,11,12]. This is usually done by eliminating mosquitoes’ breeding sites and habitats by means of larval source management (LSM) [9] or by adding insecticides to the internal walls and ceilings of housing structures where Anopheles mosquitoes may come into contact with the insecticide (i.e., indoor residual spraying (IRS)) [10]. Alternatively, the application of insecticidal nets (i.e., insecticide-treated nets (ITNs) and long-lasting insecticidal nets (LLINs)) on windows and doors not only kills mosquitoes but also limits their ability to reach humans [10,11,12]. These interventions have been extensively used as malaria control interventions. At least one of them has been applied in malaria-endemic countries or regions, such as Benin [11], Bangladesh [13], Madagascar [14], Tanzania [15,16], sub-Saharan Africa [17], and Myanmar [18]. Amongst the aforementioned interventions, ITNs or LLINs are claimed in the majority of studies to be the most effective single malaria-control intervention [12,17,19]. To sharply reduce the spread of malaria and to control its spread, control interventions are sometimes used in combination in malaria-endemic regions. Among the combined interventions, ITNs/LLINs with IRS [3,11,13] and ITNs/LLINs with LSM [12,20] are most often realized, but knowledge of their effectiveness is less well developed.
Computational approaches including mathematical modeling, cellular automata, and agent-based modeling (ABM) have been utilized to assess the spread of various epidemiological diseases [21,22,23,24,25], especially malaria [8,26,27], and related intervention programs [16,24,25,27,28]. Although some previous studies used mathematical modeling to investigate the effectiveness of malaria control interventions [16,29], this approach is limited by assuming that the population is homogeneous throughout space while neglecting people’s movements and interactions. In order to overcome some of these shortcomings, cellular automata models were proposed to simulate disease spreading [30,31] and control interventions [32]. Although cellular automata can improve some aspects of mathematical models, especially the heterogeneity of the population, their major limitation is that although they can simulate different cell states, they cannot simulate the dynamic and individual movements of humans and mosquitoes together with their space-time interactions. By contrast, ABM is capable of circumventing these constraints by simulating the movement and interaction of individuals with each other and with the environment [8]; both are of central importance in simulating the spread of malaria. Despite the potential of ABMs, only a few studies have used ABM to model the spread of malaria, and even fewer have been carried out to monitor the spread of malaria along with the usefulness of interventions [10,28,33,34,35].
The main aim of this research was to apply our spatially explicit ABM [8] to assess (1) the spread of malaria and (2) the effectiveness of the two most common malaria control interventions, namely LLINs and IRS, individually and in combination. The main innovation of this research is that it took into account various parameters of coverage rate, mosquito repellency, and the mortality rate for both control interventions. In addition, the spread of malaria was investigated for the diverse values of these parameters. The main contribution of this research is that it can assist health policymakers in selecting the most appropriate malaria-control intervention and then determining the best coverage rate of interventions in the study area.

2. Materials and Methods
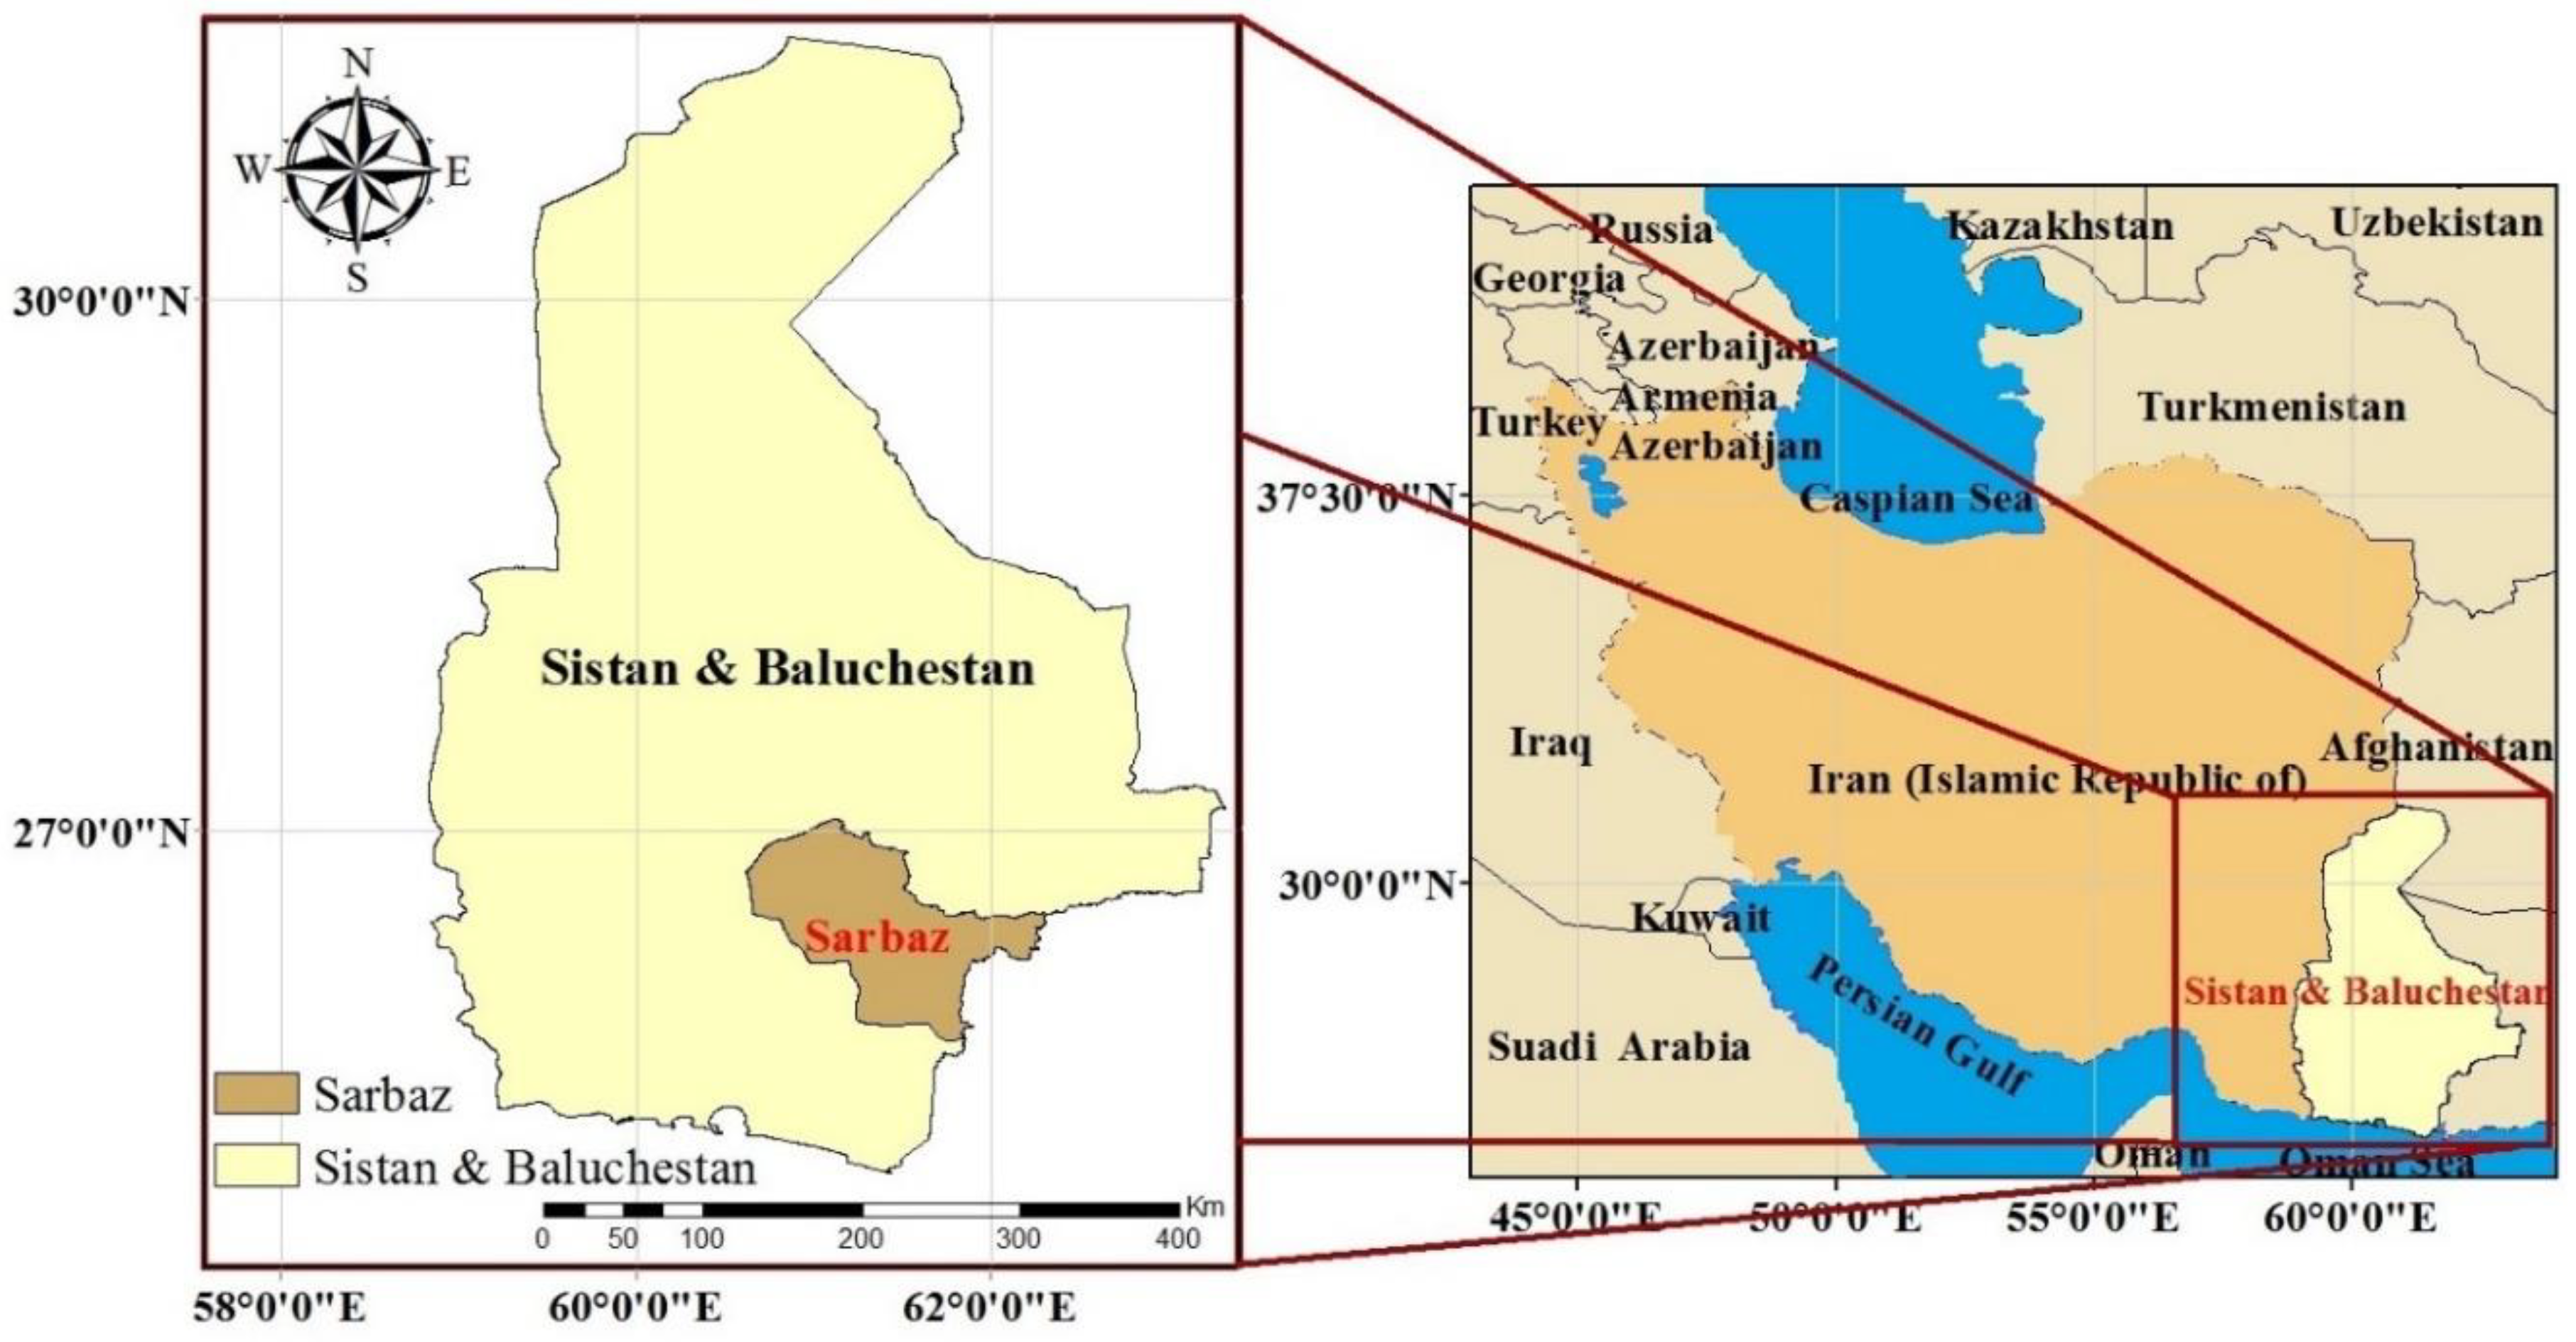
2.1. Study Area

The southeast provinces of Iran (i.e., Sistan and Baluchestan, Hormozgan, and Kerman) are endemic regions of malaria [3]. The county of Sarbaz (25°50′–27°05′ N and 60°40′–62°20′ E; Figure 1), which is in the southeast of the province of Sistan and Baluchestan and has a population of approximately 164,500 people, was chosen as the study area because of its high malaria incidence in 2013–2014 [36].

2.2. Data and Preprocessing of the Input Data

We first reviewed the literature to identify the principal factors affecting the spread of malaria and then collected data from various sources [37,38,39,40]. Table 1 summarizes the obtained data.
Data preparation was performed using ArcGIS 10.3 software. A digital elevation model (DEM) with a spatial resolution of 30 m was obtained through the Shuttle Radar Topography Mission (SRTM) and clipped to the boundary of the study area. A normalized differentiated vegetation index (NDVI) [41] was calculated for each month based on the near-infrared and red bands of Landsat 8 satellite images (30 m spatial resolution) for 2013 and 2014. An NDVI captures the level of green biomass and ranges from +1 to −1. Positive values are indicative of larger amounts of greenery and negative values are indicative of non-biomass (e.g., water) [42]. To receive continuous layers of average air temperature (in °C) as well as relative humidity per month, we interpolated the point data measured at twelve stations in 2013–2014 across Sistan and Baluchestan by means of kriging [43]. We determined Euclidean distances from rivers and dams. Kernel density analysis [44] was used to obtain a surface of human population density in villages and cities. Finally, all these datasets were converted to a common spatial resolution of 35 m.

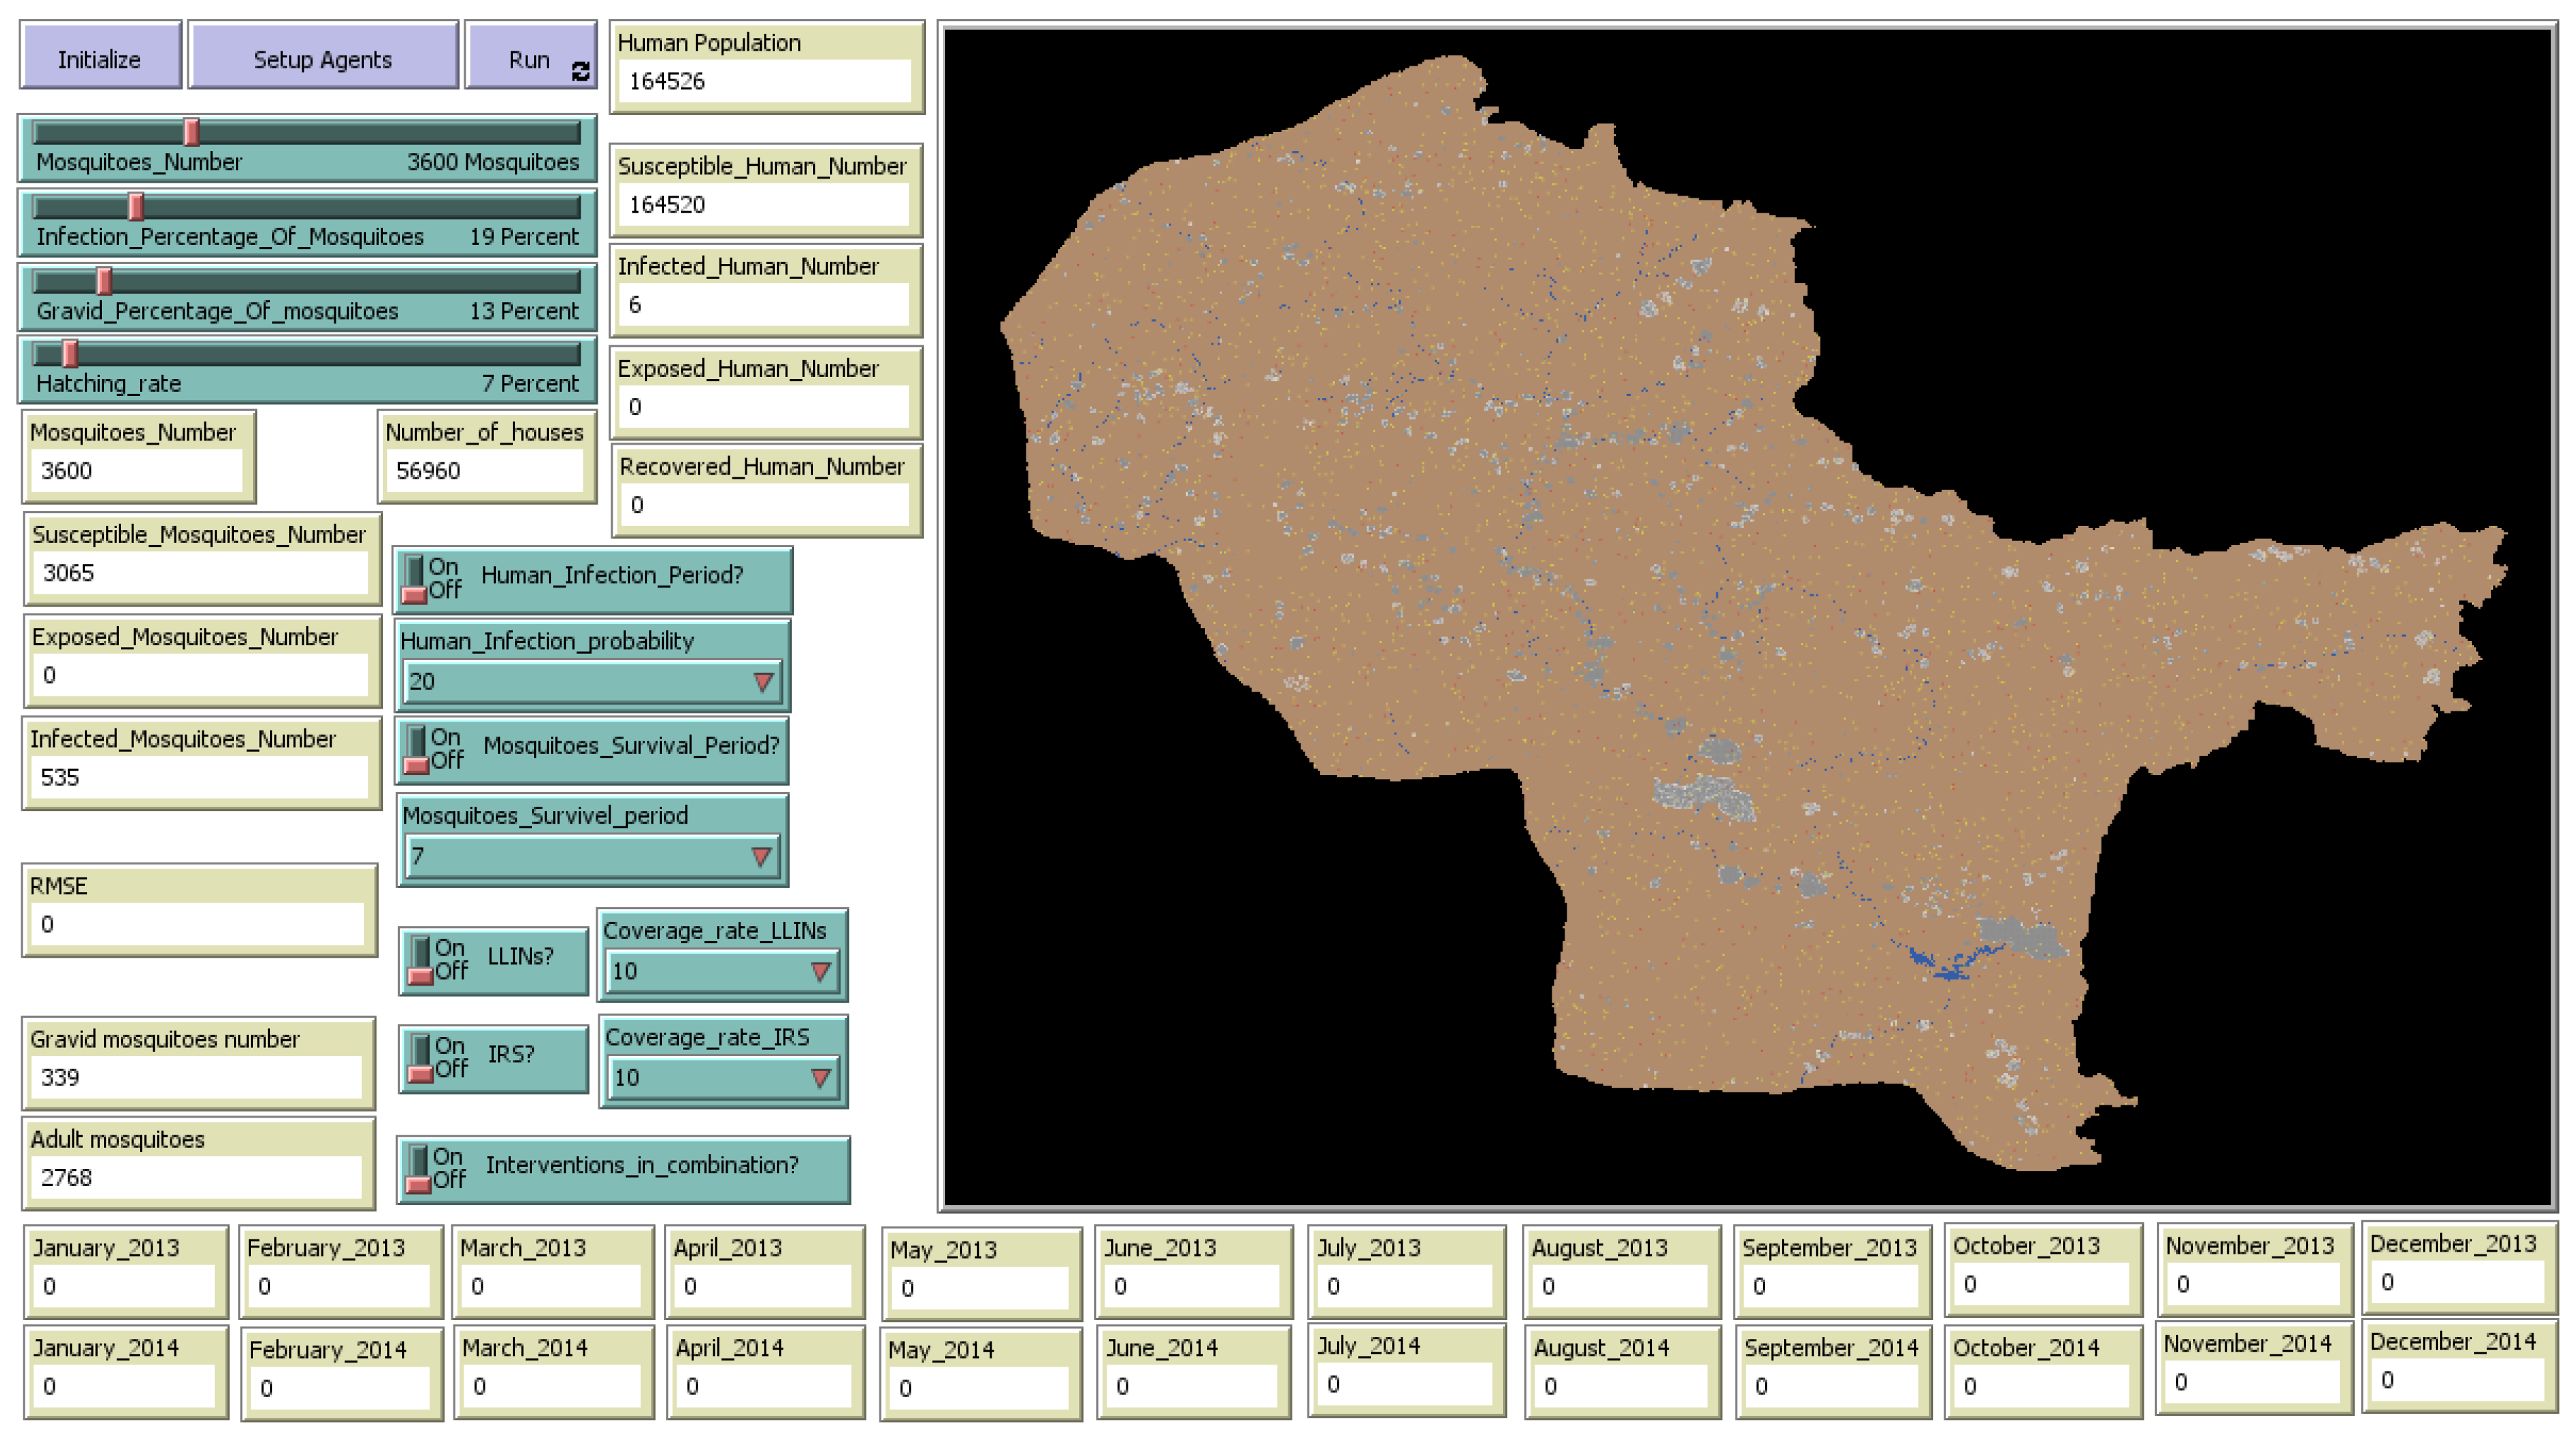
2.3. ABM Development
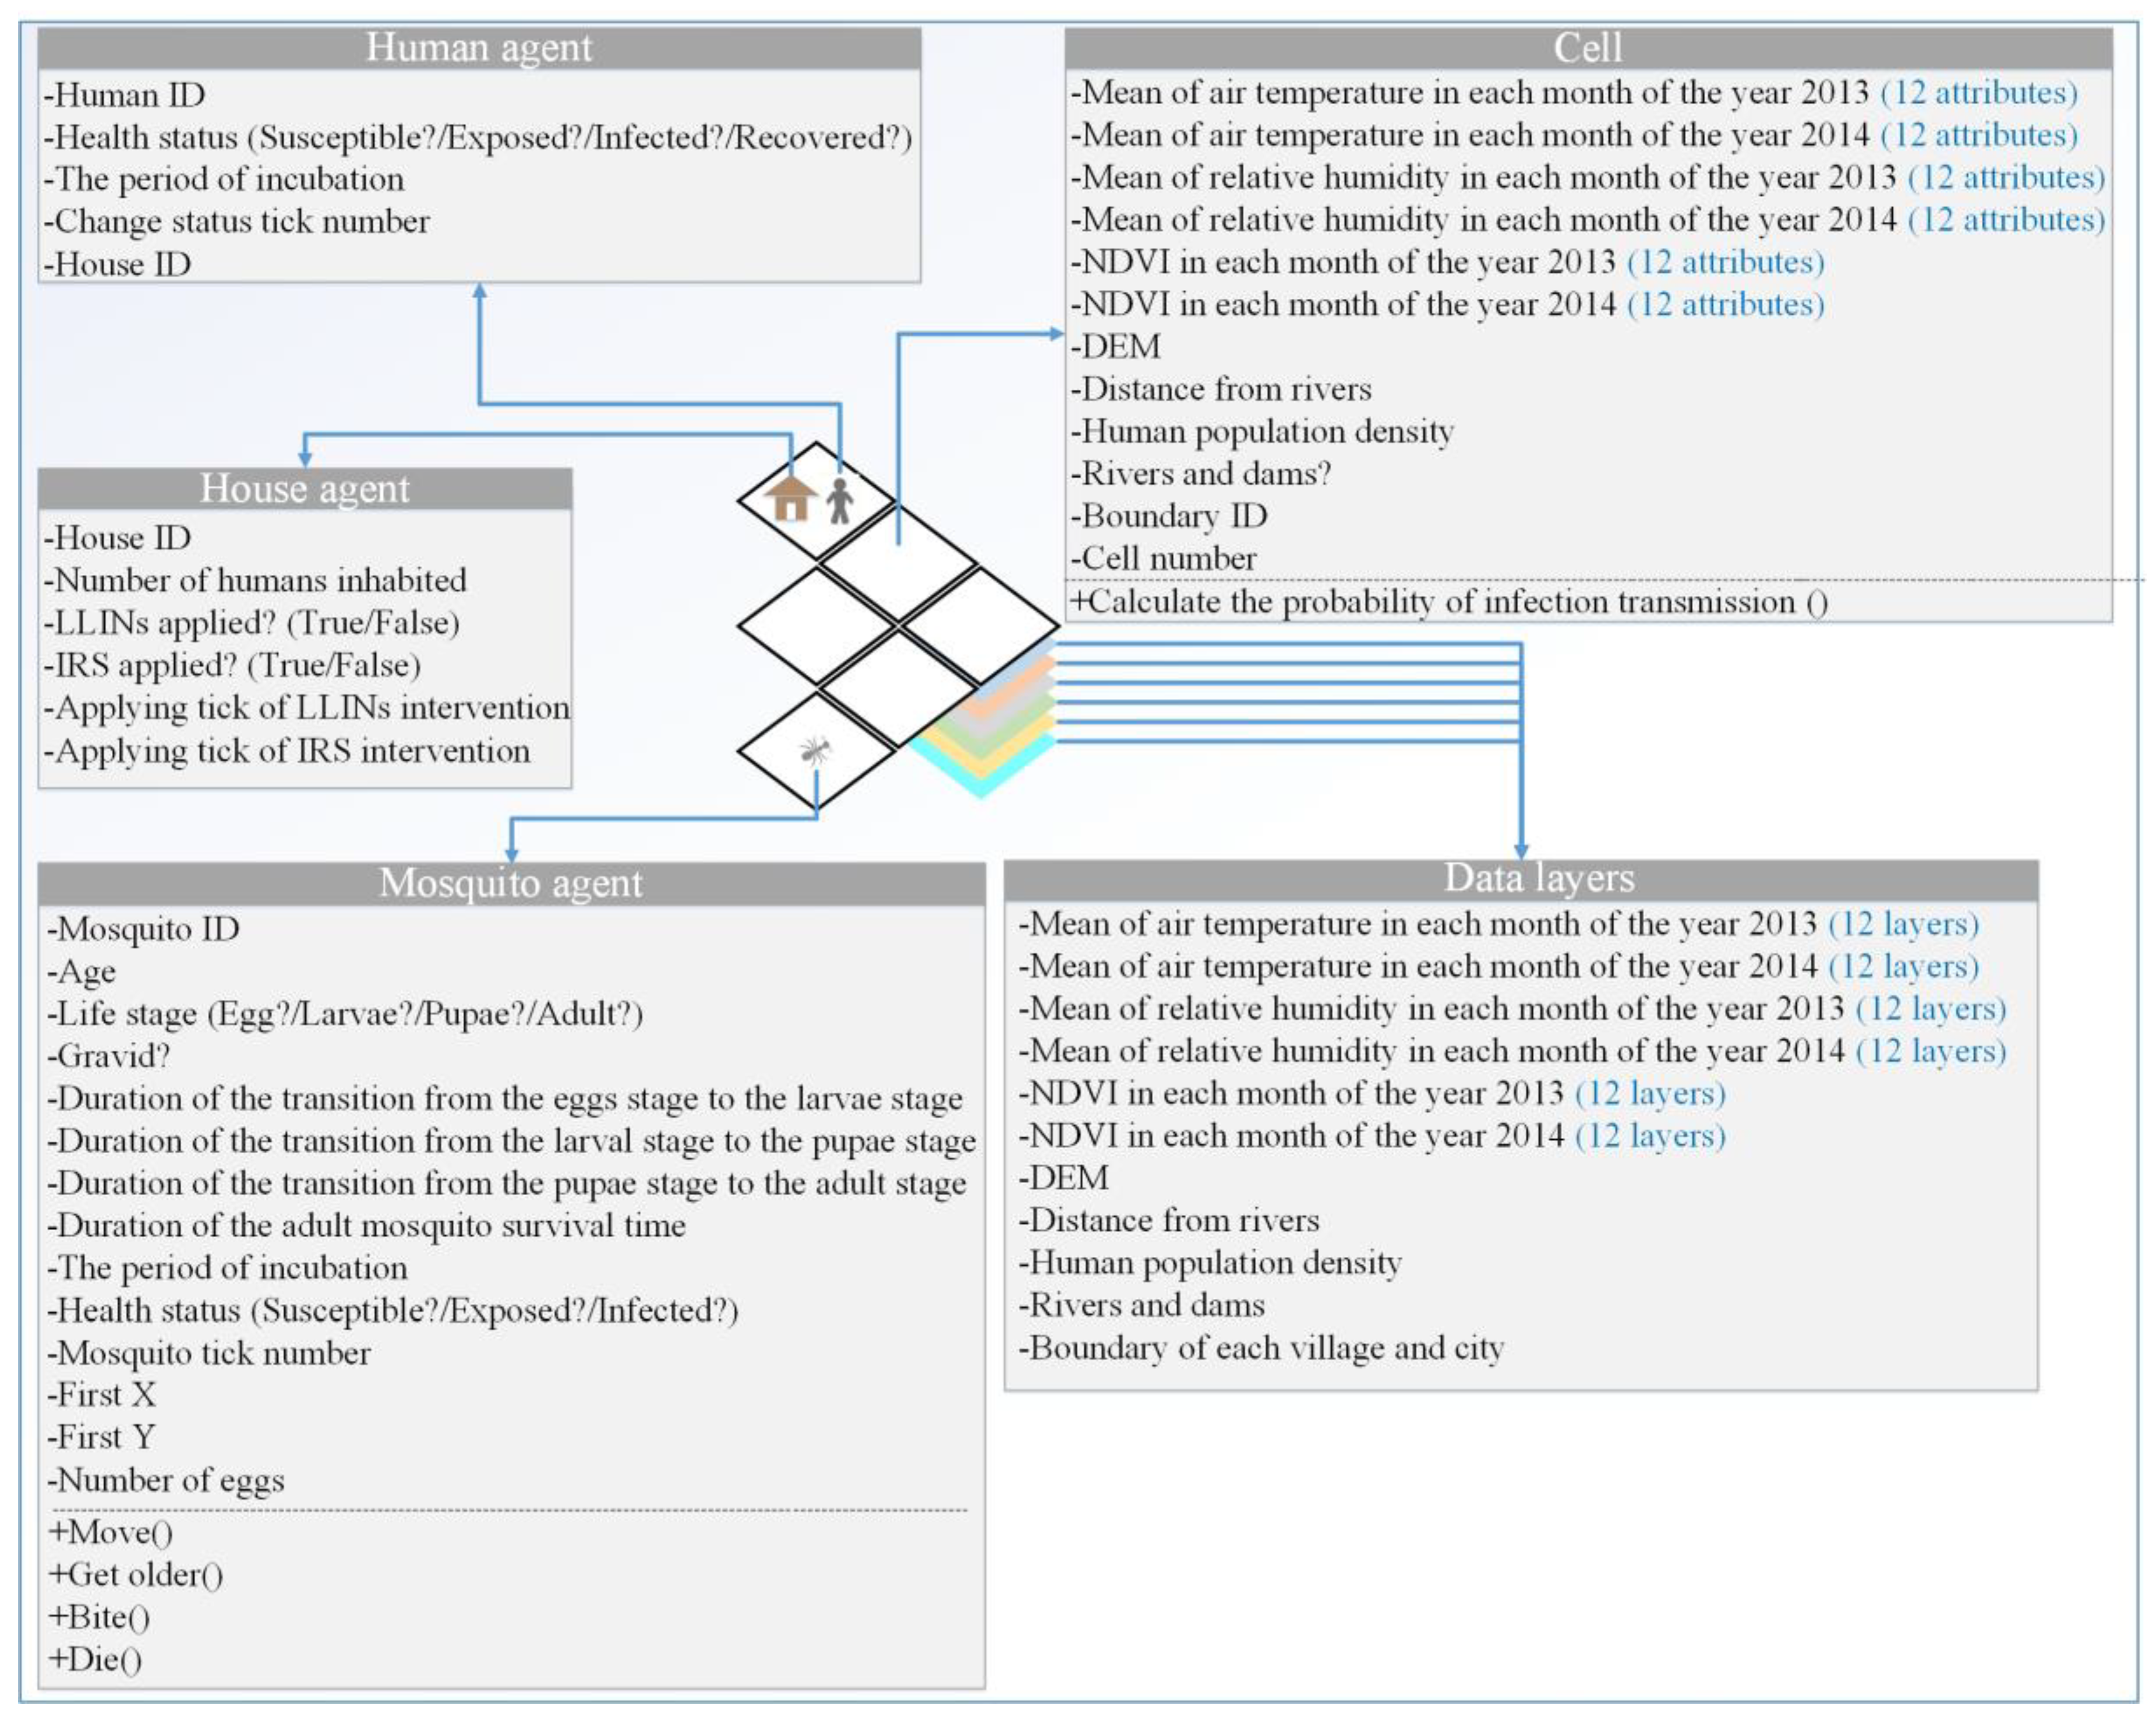
To simulate the spread of malaria, we used the agent-based platform NetLogo 6.0.4 [45]. Figure 2 shows the graphical user interface of our developed ABM (see also [8]).

2.3.1. Environment

Malaria transmission depends on several factors, particularly environmental ones. To take into account the spatial and temporal effects of environmental factors on the spread of malaria, the environment (i.e., a raster of cells [46]) of our ABM was considered based on numerous data layers, namely air temperature, relative humidity, vegetation, altitude, distance from rivers and dams, human population density, rivers and dams, and boundaries of villages and cities. For the cells of the ABM’s environment, we defined an attribute with regard to each data layer (Figure 3). In addition, to have a more dynamic model, we assumed that air temperature, relative humidity, and vegetation change every month during the simulation period. To apply the impacts of these factors on the spread of malaria, we calculated the infection probability of susceptible human agents when they are bitten by infected mosquitoes. In this way, the infection probability of human agents changes from one cell with a spatial resolution of 35 m to another, similar, cell throughout the environment of the ABM as well as over the simulation period.

2.3.2. Agents

We considered mobile agents and static agents. Although both agents were located in specific locations in the environment, only mobile agents were able to move and explore the entire environment according to their predefined behavior. Figure 3 summarizes all aspects of our ABM along with their behavioral characteristics.

1. Anopheles Mosquito Agents

Egg, larvae, pupae, and adult are the four stages of a mosquito’s lifecycle [47]. Only in the adult stage can mosquitoes fly and act as malaria vectors [47]. At the beginning of the simulation, mosquito agents started their lives at a random age by being randomly allocated to one of the four lifecycle stages. Then, with each time step of the simulation (i.e., 24 h), the age of the mosquitoes was increased and a transition over the life stages occurred until they died.
The feeding cycle of female mosquitoes consists of five stages: host-seeking, host-encountering, biting, resting, and ovipositing (laying new eggs). Female mosquitoes seek humans only during the night [48]. If they succeed in finding a human, they will bite and start sucking blood. After obtaining a full blood meal, they rest for a few days while they digest the blood and develop eggs. Mosquitoes spawn in places where water is present; they therefore look for water bodies that are suitable for oviposition [27]. This cycle repeats until the female mosquito dies.
In our ABM, mosquito agents were initially randomly located in the environment at the beginning of the simulation. Mosquito agents’ foraging was performed in a twofold manner: random and directional flights. A mosquito agent flies randomly when there are no humans or water bodies in its perception range of 50 m. When a resource is detected, the mosquito flies directly towards it.
After finding and biting a human, mosquitoes look for suitable water bodies in which to lay eggs. To mimic such behavior in our ABM, the mosquito agents moved to one of the eight neighboring cells where there was water. If none of the eight neighboring cells had water, the mosquito moved randomly to one of the eight neighboring cells. Rivers and reservoirs in Sarbaz county were considered the only aquatic habitats for the mosquitoes.

2. Human Agents

We assumed that the only hosts are humans and that the process of biting humans happens only at night [48]. In Iran, due to the small difference between the length of night and day over the year (less than 2 h), most people usually go to work after sunrise and return home before sunset, and Anopheles mosquitoes rest during this period. Therefore, people are exposed to mosquito bites only at night, when they are at home. Given these assumptions, there was no need to model the movement of human agents and it was presumed that human agents are static agents attached to their home addresses [8].
Each human agent was considered as one person in the real world. Human agents were distributed according to the locations of the house agents (i.e., human agents were placed in the cells that contained the house agents) where malaria control interventions could be applied. Due to a lack of data on the number of houses and the number of people living in each house in Sarbaz county, we estimated these figures on the basis of the population and the number of households in Sarbaz county. To determine the number of houses, we allocated to each house a household comprising, on average, five human agents. The number of human agents (persons) allocated to a house was a randomly generated number between 2 and 8. Guided by Iranian population statistics, the random numbers followed a normal distribution with an average of 5 and a standard deviation of 2.

2.3.3. Transmission of Malaria

Cells of the ABM’s environment include various attributes whose values are correspondingly initialized based on the data layers. The probability of infection transmission was based on cells representing air temperature, relative humidity, vegetation, altitude, distance from rivers and reservoirs, and population density. First, the values of these six cell attributes were reclassified into 10 classes. Based on earlier studies [37,38,39,40], each class received a value between 1 and 10 representing its importance in the spread of malaria; then, all reclassified values derived in each cell were combined with specific weights according to Equation (1). The weights were determined based on a pairwise comparison of factors using the analytic hierarchy process (AHP) [49].
V cell   ( i , j ) = ( 0.3885 × T cell   ( i , j ) ) + ( 0.2594 × H cell   ( i , j ) ) + ( 0.1739 × D cell   ( i , j ) ) + ( 0.0699 × N cell   ( i , j ) ) + ( 0.0635 × D R   cell   ( i , j ) ) + ( 0.0448 × P D   cell   ( i , j ) )
Here, T refers to the reclassified temperature value, H is the reclassified humidity value, D is the reclassified DEM value, N is the reclassified NDVI value, D R is the reclassified value of the distance from rivers and reservoirs, and P D is the reclassified value of human population density in cell i,j. Finally, the probability of infection transmission in each cell was determined by normalizing the value obtained from Equation (1).
During the simulation, mosquito agents could take one of three states, namely susceptible, exposed, or infected. State changes occur dynamically under certain conditions. The susceptible mosquito agent has a 2% chance of becoming exposed if it coincides with the infected human agent in the same cell [50]. The exposed mosquito becomes infected after approximately 10–21 days [47] and remains infected for the rest of its life. Likewise, at any moment during the simulation a human agent is either susceptible, exposed, infected, or recovered in accordance with a susceptible-exposed-infected-recovered-susceptible (SEIRS) model [8]. The states of human agents change under certain conditions over time. They remain susceptible until they coincide with infected mosquitoes in the same cells. In this case, cells represent the probability of infection transmission from an infected mosquito to a susceptible human (i.e., the probability that a susceptible human agent becomes exposed) by normalizing the value obtained from Equation (1) [8]. Table 2 provides a summary of the selected ABM input parameters. For parameters whose values were defined in a range, a normal distribution was assumed.

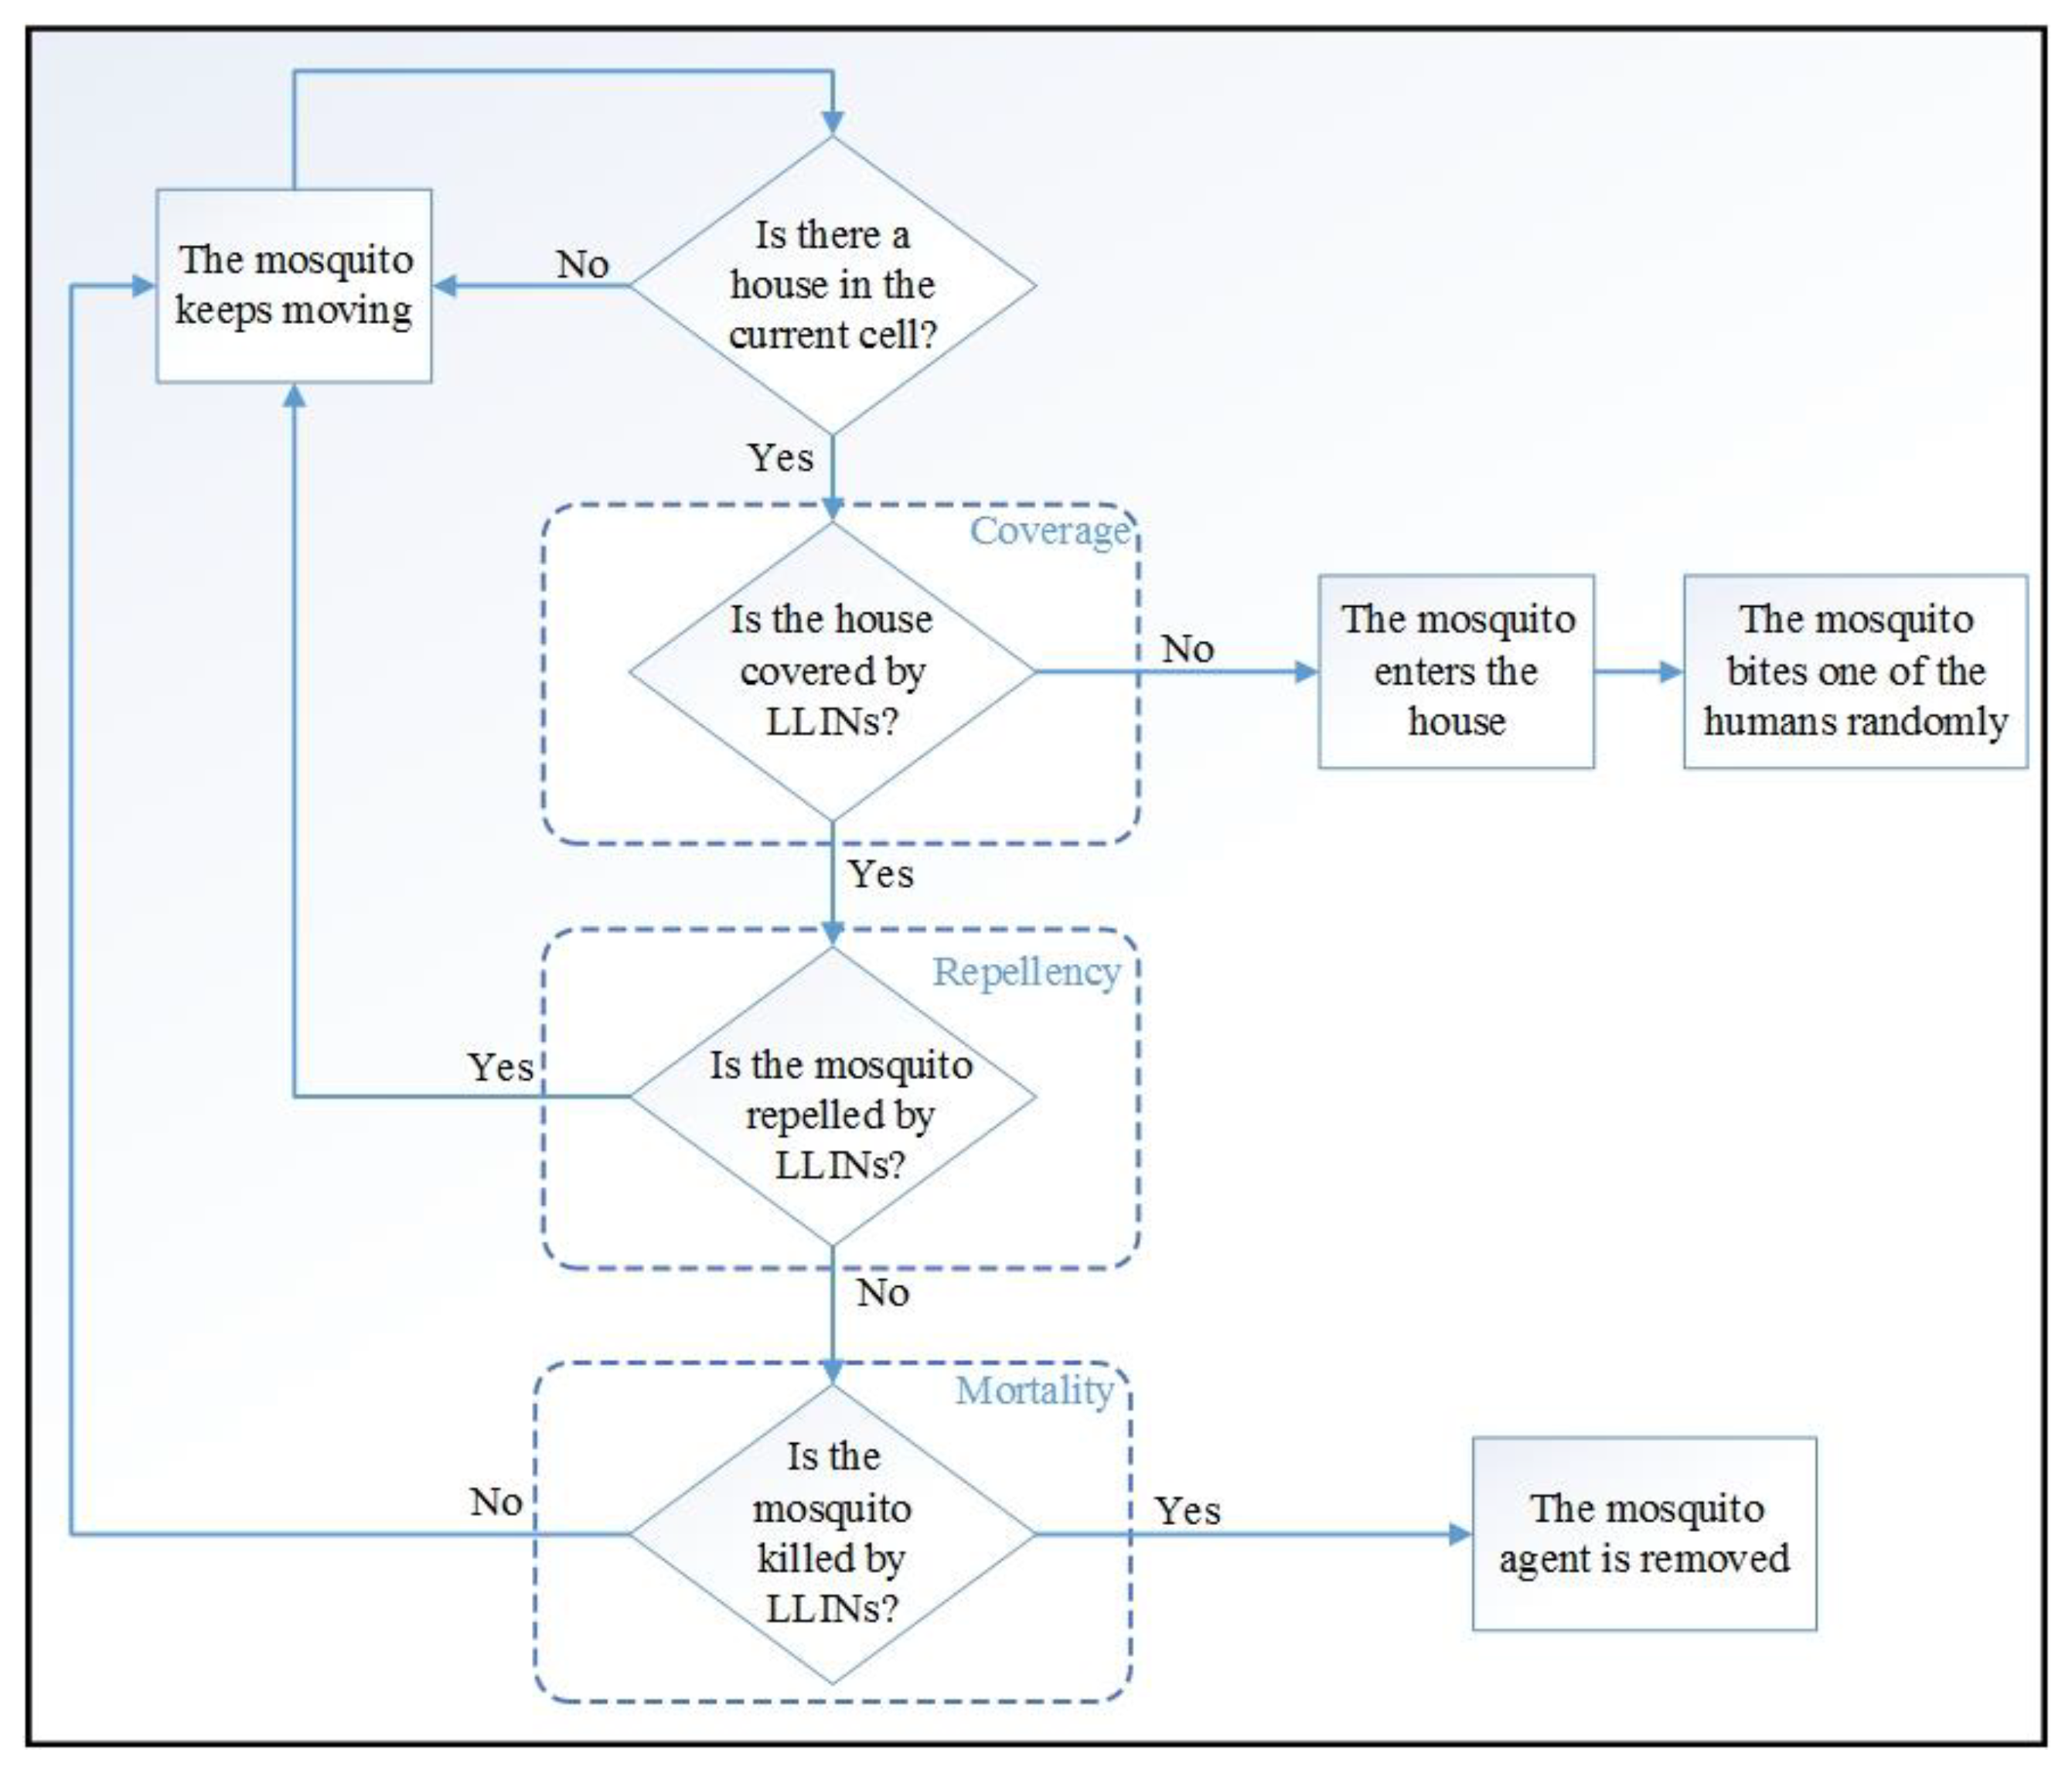
2.3.4. Malaria Interventions

The spread of malaria depends on mosquitoes’ population density and their access to humans. Any action that reduces or eliminates at least one of these components is considered an intervention.

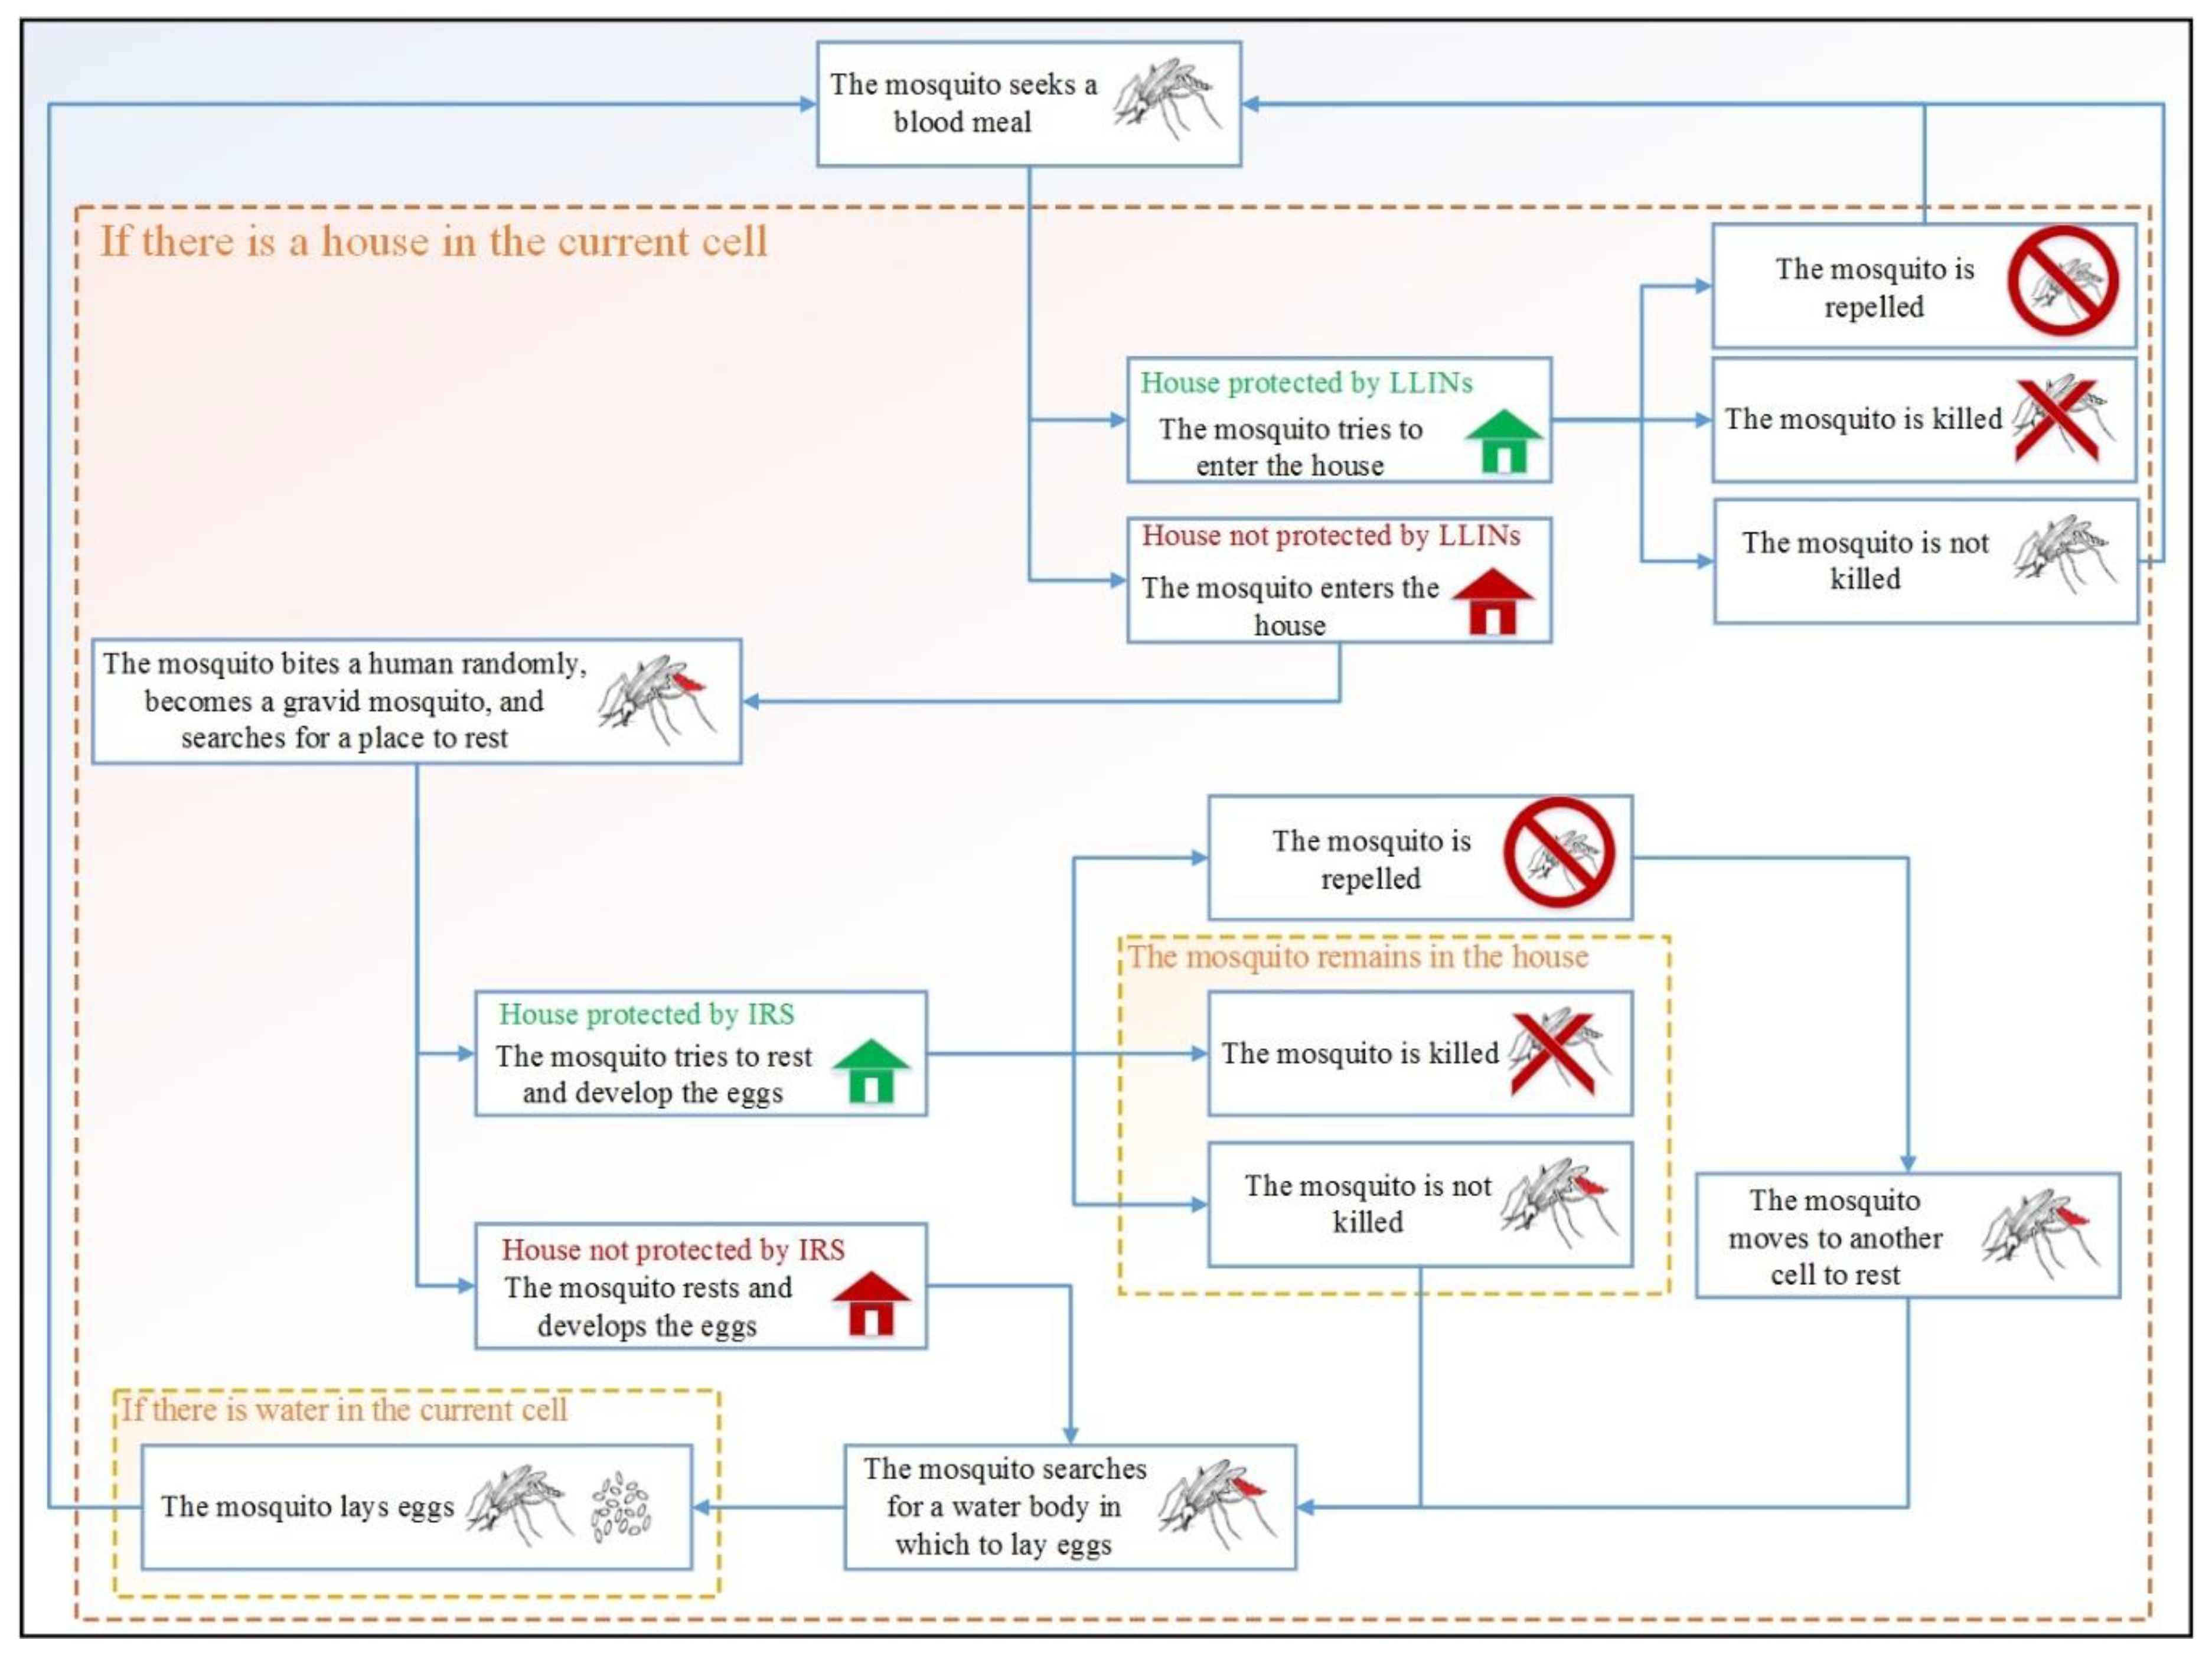
1. Applying Long-Lasting Insecticidal Nets (LLINs) Separately

LLINs limit mosquitoes’ access to humans, and the insecticide used in them kills mosquitoes. To apply LLINs in the ABM, the coverage rate, mosquito repellency, and mortality rate of the insecticide chemicals were considered. The coverage rate indicates the percentage of houses covered by LLINs. The mosquito repellency indicates the percentage of mosquitoes that are repelled by the insecticide. The mortality rate indicates the probability of mosquitoes being killed when encountering insecticide-treated nets. Figure 4 illustrates the LLINs’ function with the considered parameters.

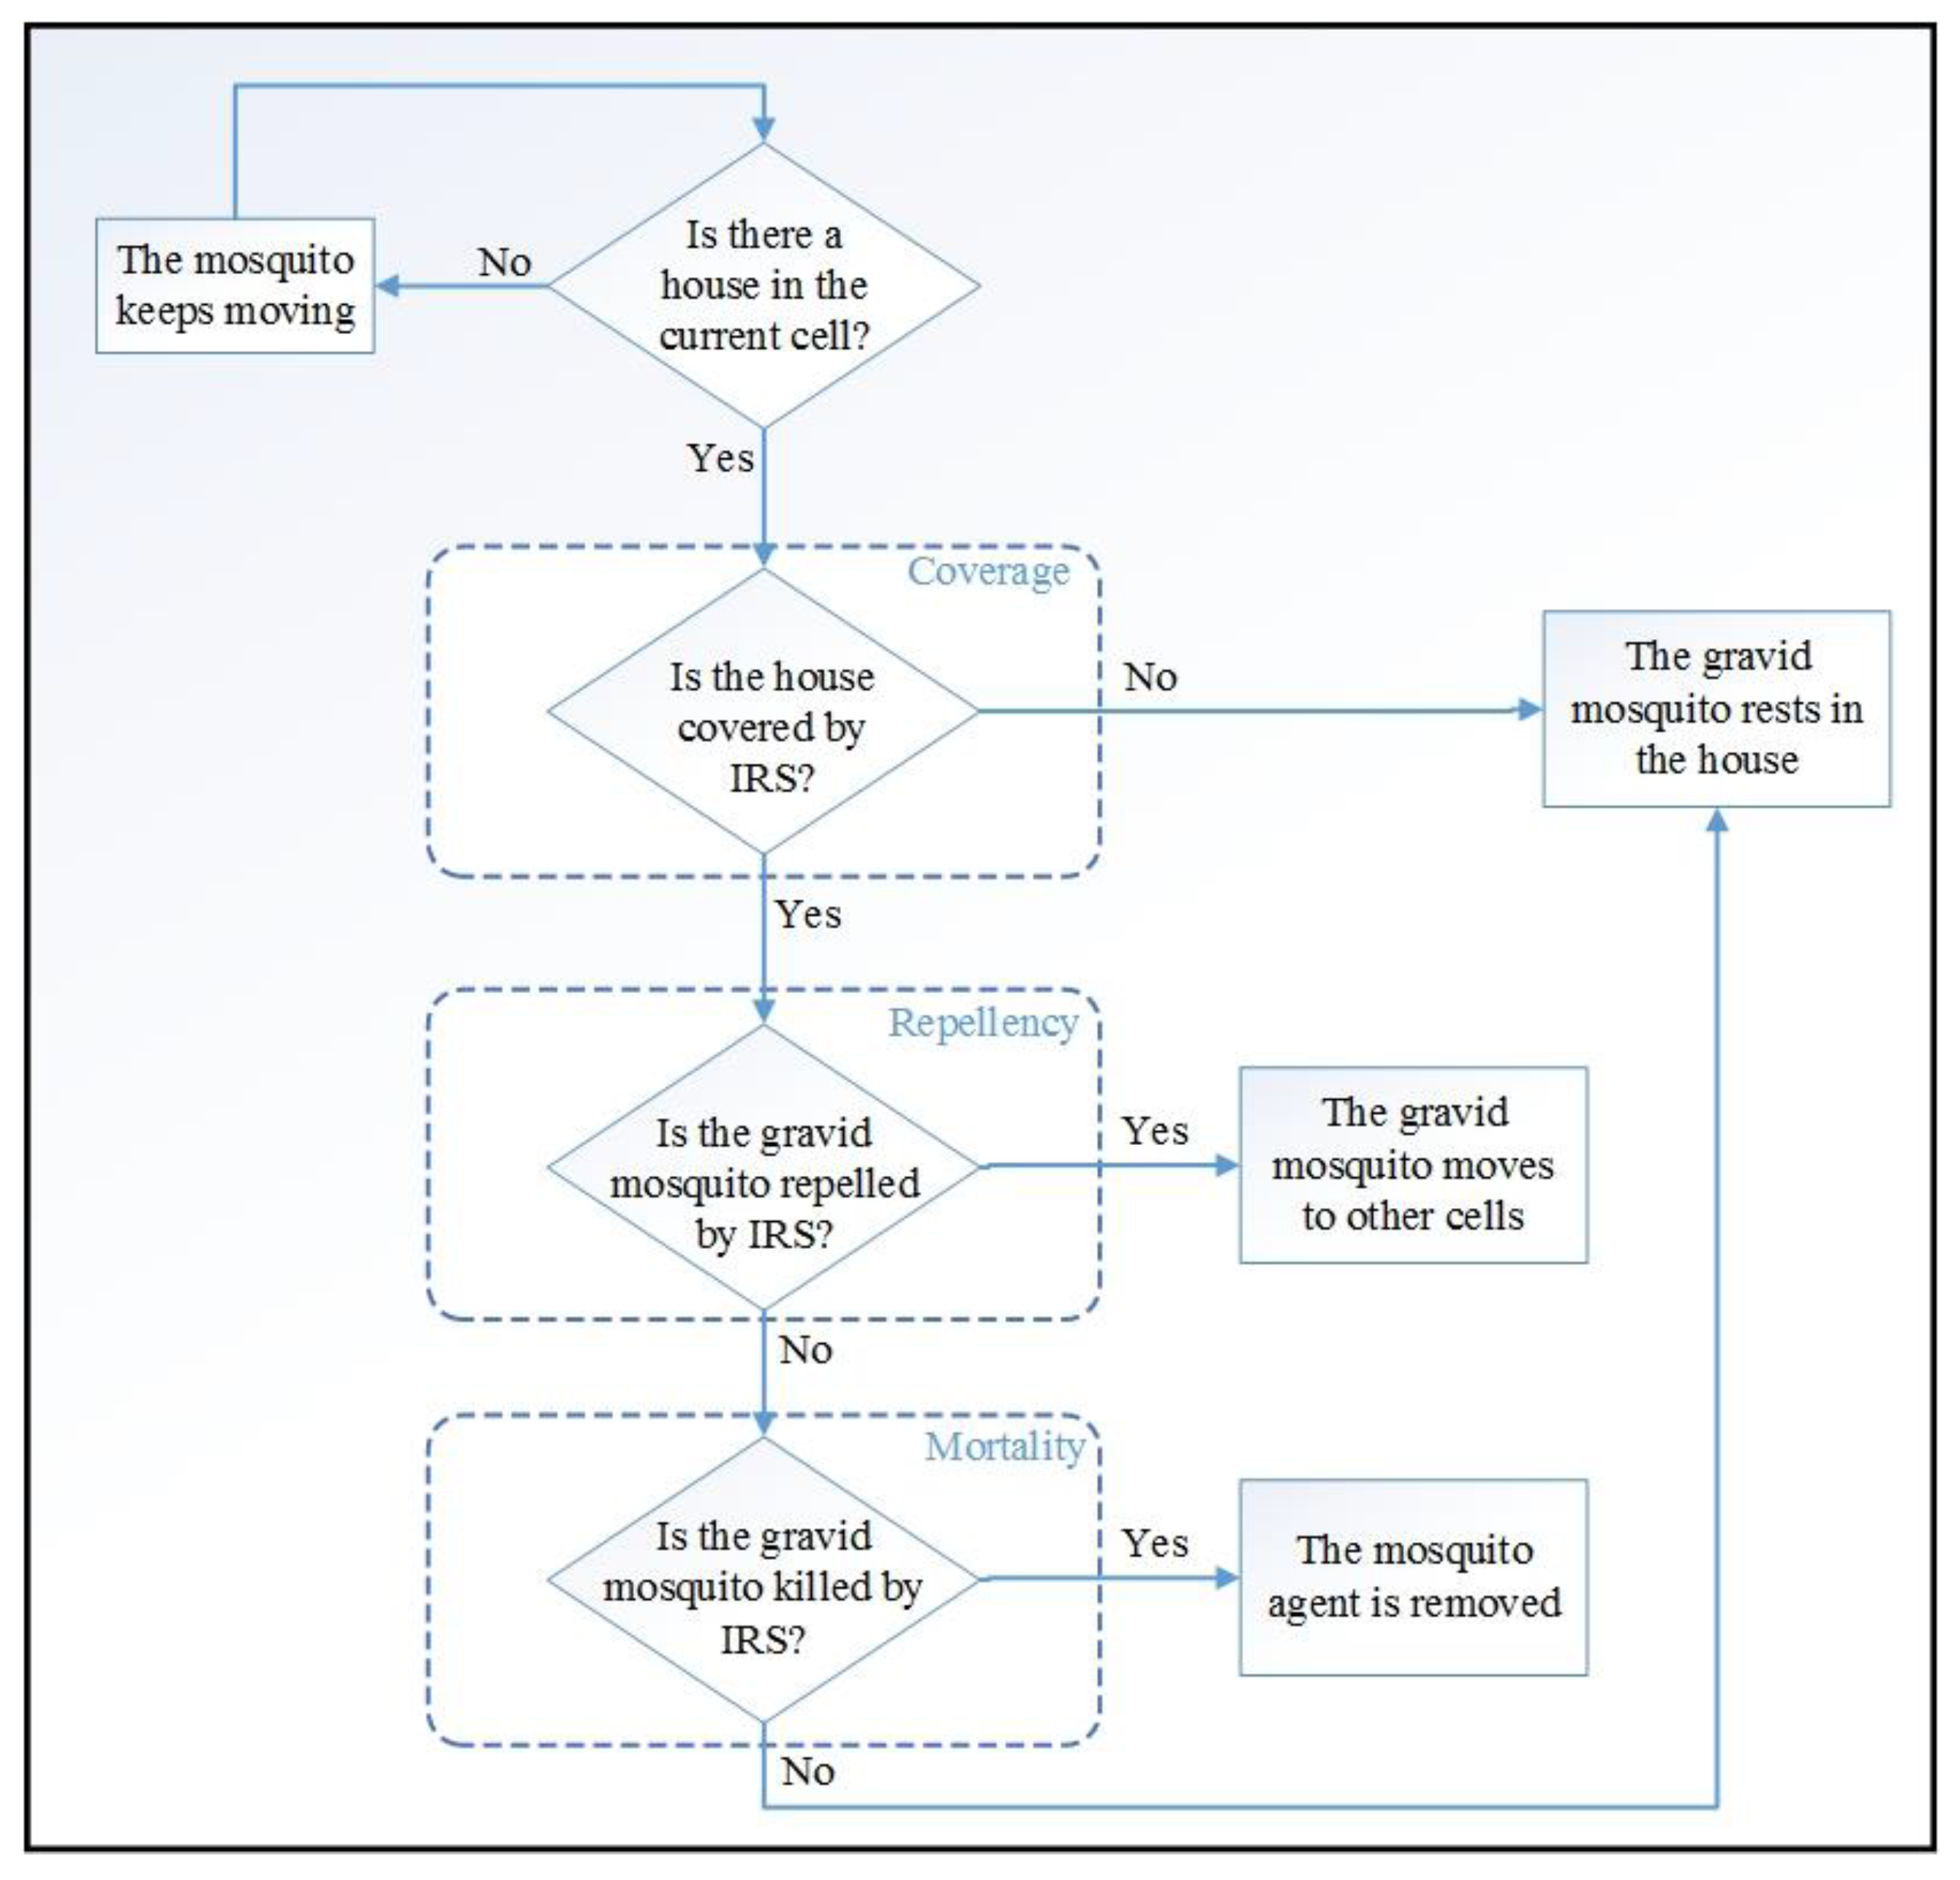
2. Applying Indoor Residual Spraying (IRS) Separately

IRS works when gravid mosquitoes rest in places that are covered by the IRS. In this case, the gravid mosquitoes will die based on the mortality rate parameter. The mosquitoes may also move away from a location if they detect the presence of insecticides. In addition, the probability of gravid mosquitoes being killed depends on the mortality rate of the insecticides used. Figure 5 shows the role of the IRS in preventing the spread of malaria, as implemented in our ABM.

3. Applying LLINs and IRS in Combination

In a real-world setting, more than one intervention is frequently applied. To reflect this in the ABM, we applied the LLINs and IRS intervention in tandem, as shown in Figure 6. Mosquito agents seek human agents until they are able to find houses. LLINs are the first intervention that is likely to kill them if they are not repelled by chemicals. LLINs also prevent the entry of mosquitoes. If a house is not protected by LLINs, mosquitoes enter the house and randomly bite one of the human agents and then rest. In this case, mosquitoes are likely to be killed if they remain in the house covered with IRS if they are not repelled by insecticide chemicals. Otherwise, after resting and developing their eggs, they look for water bodies suitable for oviposition.

2.3.5. Verification, Calibration, and Validation

Because simulation models are an approximation of the real world, they rarely exactly mirror a real-world system; it is therefore essential to ensure that the implementation of a model matches specifications and assumptions concerning the model conception (i.e., verification process). It is then imperative to check the accuracy of the model’s representation applied to the real system (i.e., validation process). To adjust the unknown or unmeasured parameters, there is also a need to revise the model until it closely mimics the real-world situation (i.e., calibration process). We verified our model in two ways. First, we considered all the parameters to be constant and changed the number of mosquito agents at the beginning of the simulation. Second, the infection probability of human agents was changed from 20%, to 50% and 80% while the remaining parameters were kept constant.
Due to a lack of data representing the real number of mosquitoes, the percentage of infected mosquitoes, the percentage of gravid mosquitoes, and the hatching rate of eggs at the beginning of the simulation (January 2013), the model was implemented several times with various parameter values. For any parameter, the simulation was run 100 times and the root mean square error (RMSE) was calculated according to the average number of infected human agents for each month and the real numbers of monthly malaria cases in 2013. The RMSE was calculated according to Equation (2):
RMSE = k = 1 n ( Y ^ k Y k ) 2 n
where Y ^ k is the predicted value (i.e., the average number of infected human agents after 100 simulation runs per month) and Y k is the actual observed value (i.e., the real number of malaria cases recorded per month of the year 2013). The smaller the RMSE value, the better the model fit. By comparing the RMSE values, the best set of values for the unknown parameters was determined (i.e., lowest RMSE).
For model validation, we compared the predicted values obtained from the model with the observed ones and the goodness of fit using Chi2 tests. The test statistic Χ 2 was computed as follows:
Χ 2 = l = 1 m ( P l O l ) 2 O l
Here, P l are the predicted values (i.e., the average numbers of infected human agents after 100 simulation runs per month), O l are the observed values (i.e., the real number of malaria cases recorded per month of the year 2014), the suffix l runs over months, and m is the number of months. To determine statistical significance, we compared the empirical with the critical values at the 5% significance level.

3. Results

3.1. Model Verification

In our first model verification, we tested 2000, 5000, and 8000 mosquito agents and compared the average number of infected human agents obtained after 100 simulation runs. By increasing the number of mosquito agents while keeping the remaining parameters constant, the number of infected human agents increased as expected, on average, after 100 simulation runs over two years, as follows: 894.83, 1975.38, and 4603.73, for 2000, 5000, and 8000 mosquito agents, respectively. The percentage of infected mosquito agents, the gravid percentage of mosquito agents, and the hatching rate of eggs at the beginning of the simulation were assumed to be 30%, 20%, and 10%, respectively.
In our second experiment addressing the infection probability of human agents, we considered 20%, 50%, and 80% as the infection probabilities of human agents in all cells across the environment (i.e., the probability that a susceptible human agent becomes exposed when bitten by an infected mosquito). For each of the three values, the model was again executed 100 times and the average numbers of infected human agents obtained after a two-year simulation were compared. We expected that increasing the infection probability of human agents will also increase the number of infected human agents in the model. The average number of infected human agents was 1082.64, 2657.23, and 5871.49 for 20%, 50%, and 80%, respectively. The number of mosquito agents, the infection percentage of mosquito agents, the gravid percentage of mosquito agents, and the hatching rate of eggs at the beginning of the simulation were assumed to be 4000, 30%, 20%, and 10%, respectively. This model verification procedure confirmed once again that our implemented ABM accurately represents the conceptual description and specifications.

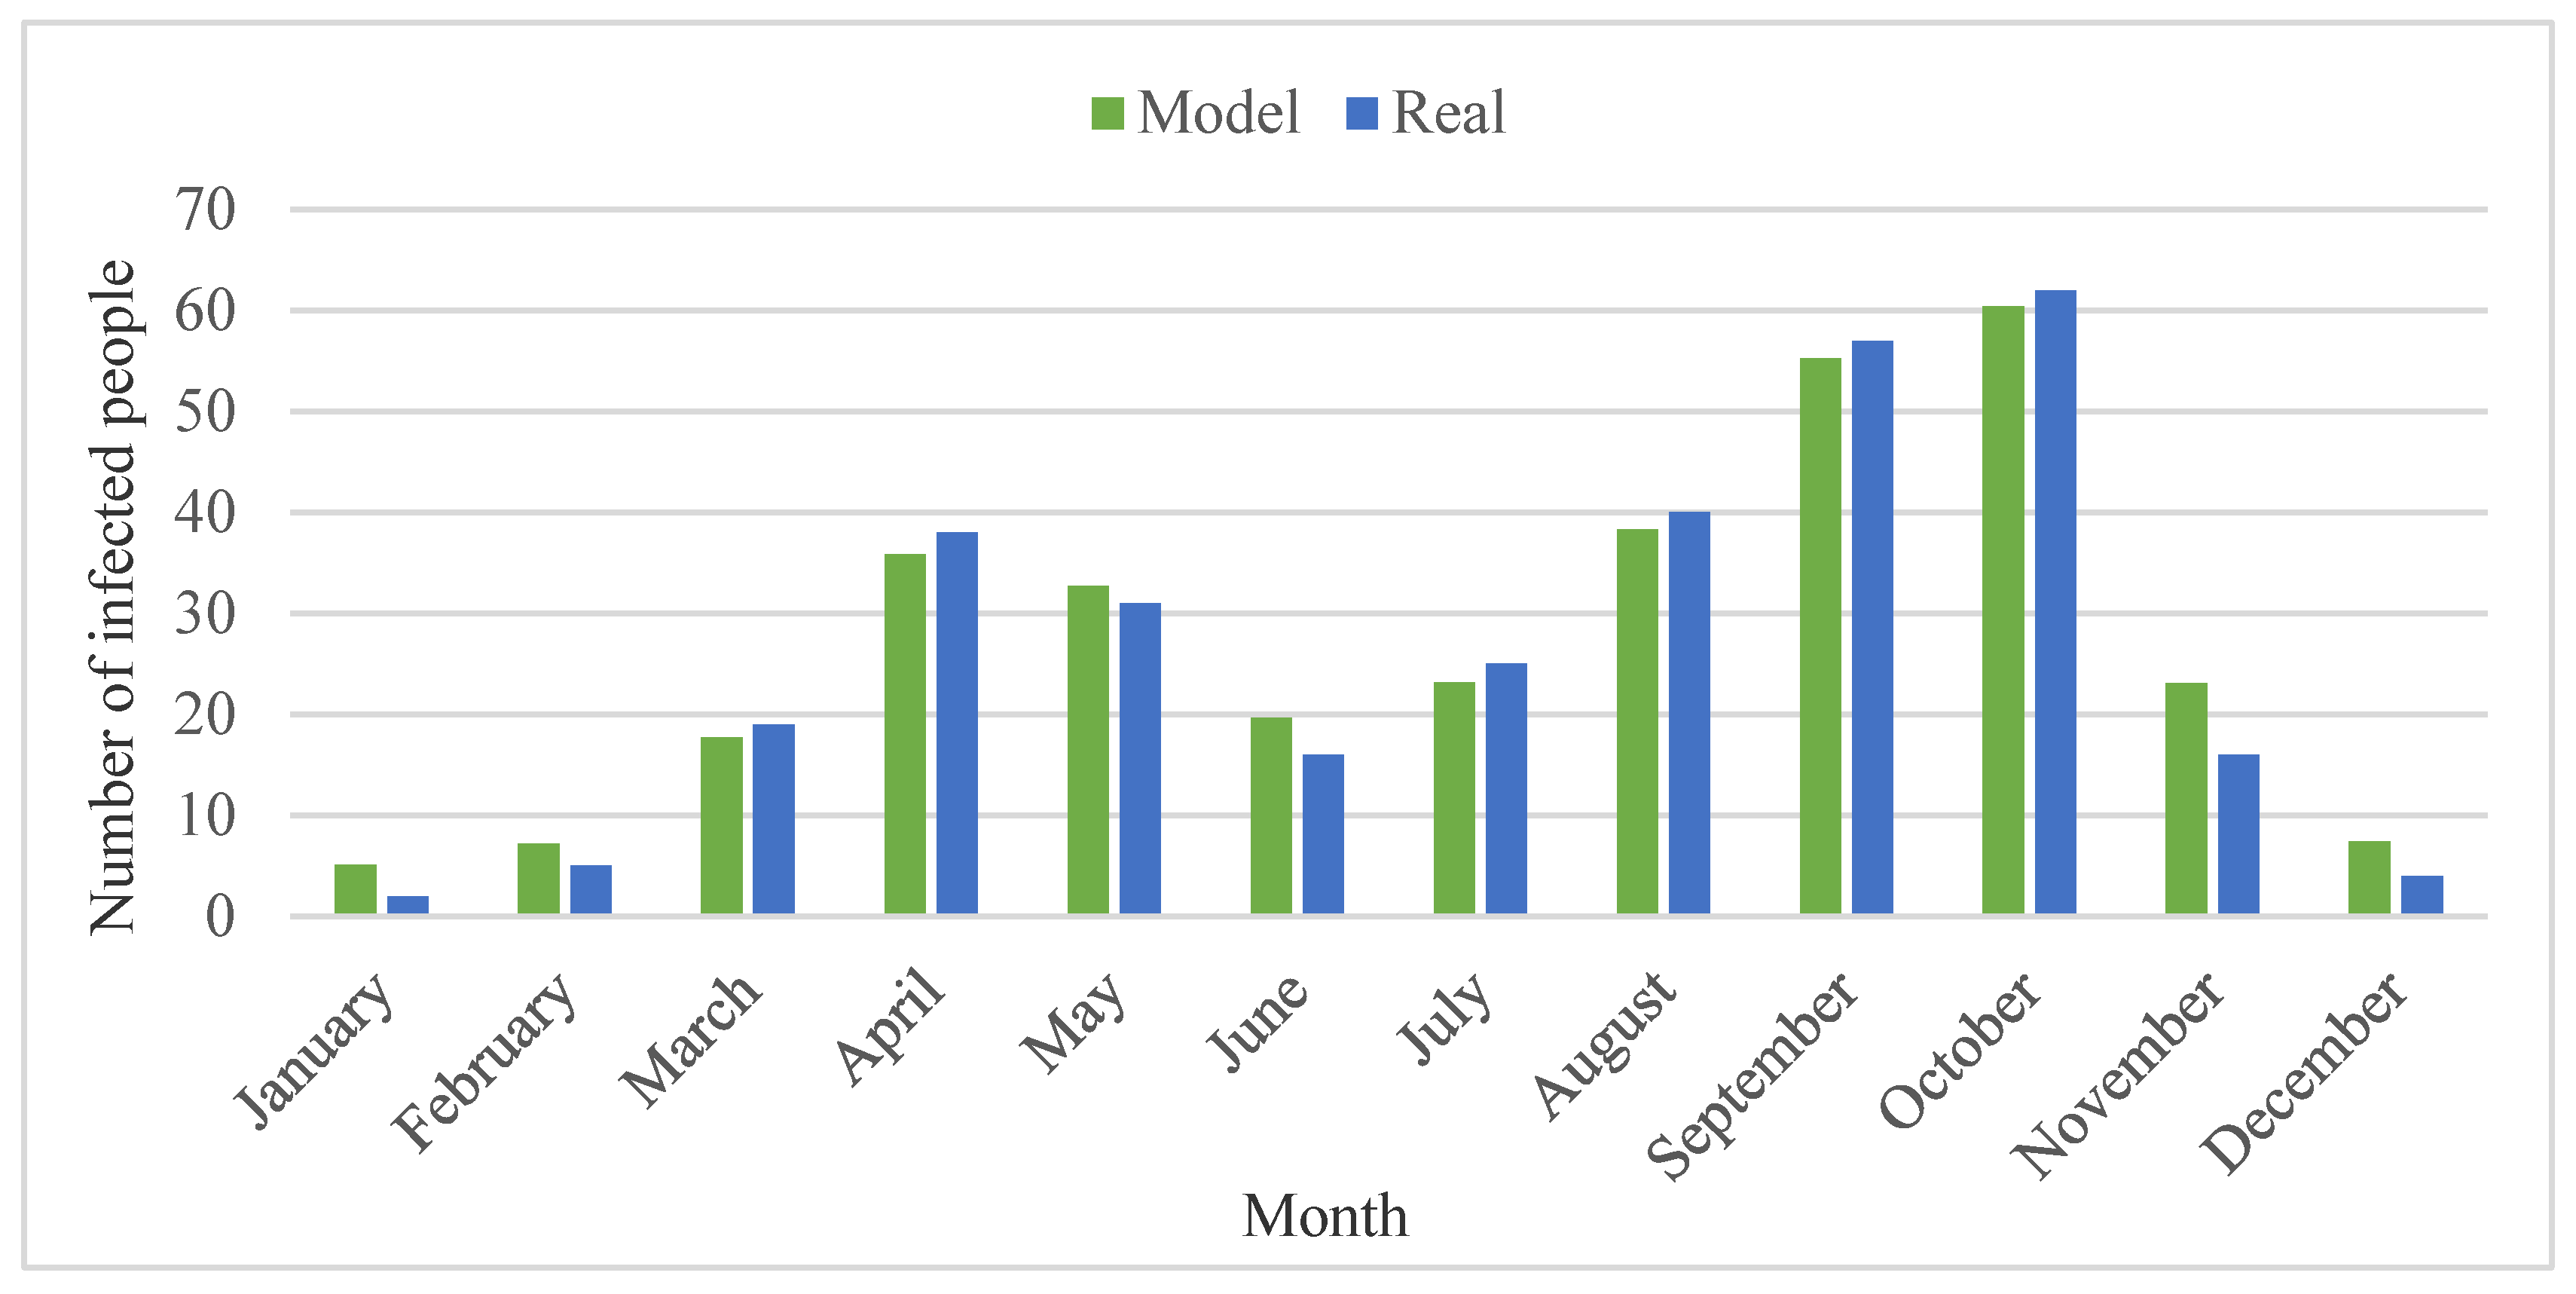
3.2. Model Calibration and Validation

The best model fit was obtained when the number of mosquito agents was considered to be 3600, of which 19% and 13% were assumed to be infected and gravid mosquito agents, respectively. In this case, the value of the hatching rate parameter was assumed to be 7%. The best RMSE during model calibration was 1.668 infected people.
Figure 7 presents a comparison of both the predicted and the observed values in each month of 2014. As can be seen, the model results closely resembled the observed number of infected people in the county of Sarbaz. In order to perform model validation, we also calculated the Chi2 statistic based on the average numbers of infected human agents after 100 simulation runs for each month (i.e., the predicted values) as well as the real number of malaria cases recorded for each month of the year 2014 (i.e., the observed values). The acceptance or rejection of the null hypothesis (which assumes that there is no significant difference between the observed and the expected value) was determined based on comparing the Chi2 value with the critical value. We accepted the null hypothesis that there are no significant differences between the observed and the predicted number of infected people.
Both the model calibration and the validation process were performed with all applied malaria interventions (i.e., LLINs and IRS) in Sarbaz county for the years 2013 and 2014. According to the Iranian Ministry of Health and Medical Education, in 2013 and 2014, 6371 and 5693 houses, respectively, were covered by LLINs intervention; the figures for IRS intervention were 9214 and 9226 houses, respectively.
As done previously [53], the values allocated to the mosquito repellency were randomly generated numbers between 2.02% and 8.08% following a normal distribution with a mean of 5.05 and a standard deviation of a quarter of its mean due to the deltamethrin (Deltamethrin is a cyanogroup pyrethroid insecticide and is among the first photo-stable synthetic pyrethroids.) insecticide chemical used in Sarbaz county. In addition, to allocate the mortality rate parameter, we assumed a normal distribution based on deltamethrin efficiency in killing mosquitoes regarding the number of days elapsed since application (Table 3).

3.3. Investigating the Number of Infected Human Agents When Applying Control Interventions

To investigate the percentage reduction in the average number of infected human agents, the model was again implemented 100 times with and without applying interventions. To assess the number of infected human agents when applying control interventions of LLINs and IRS separately and together, three situations were assumed, in which these interventions were applied annually by 10%, 25%, and 40% of the households in the study area. The coverage rates of 10% (low), 25% (moderate), and 40% (high) were determined by experts’ opinions.
Applying the interventions in our model was performed monthly as well as in the identical monthly proportions to the LLINs and IRS interventions applied in the study area in the years 2013 and 2014. We assumed that control interventions were applied on the first day of each month. Table 4 summarizes the average number of infected human agents obtained after 100 simulation runs for two years as well as the percentage reduction per coverage rate. The range of values, averages, and standard deviations allocated to mosquito repellency and mortality rate parameters were identical in both interventions due to the same insecticide chemical (deltamethrin) being used.
The percentage reductions in the average numbers of infected human agents for the identical coverage rates of both interventions were much higher for the LLINs intervention than for the IRS intervention (Table 4). This result indicates that the use of LLINs is more effective than the use of IRS. This may be because in LLINs intervention, the mosquitoes’ access to humans is restricted, whereas in the IRS, the mosquitoes have some access to humans and can still bite them. In addition, our results indicate that the IRS intervention is more effective in reducing the number of infected human agents when it is applied with a high coverage rate, whereas LLINs intervention with moderate and high coverage rates is highly effective. Therefore, the IRS intervention can be an effective intervention if it is applied in a large number of houses, while LLINs are highly effective for moderate and high coverage rates. The average number of infected human agents was also examined when LLINs and IRS were applied in combination (Table 5).
A comparison of Table 4 and Table 5 shows that applying two interventions in combination had more impact on reducing the number of infected human agents than the application of a single intervention. Table 5 shows that an increase in the coverage rates of LLINs and IRS resulted in reducing the average number of infected human agents.
The potential benefit of combining interventions in terms of reducing malaria transmission has been asserted throughout the world [3,11,12,13,16,20]. Our modeling results for Sarbaz county indicate that combining LLINs and IRS is highly recommended. In addition, of the most effective malaria control interventions (i.e., ITNs/LLINs, IRS, and LSM), the use of ITNs/LLINs has been demonstrated to be the most efficient single control intervention [12,17,19]. Our findings indicate that LLINs with moderate or high coverage rates and IRS with high coverage rates can significantly reduce the number of infected humans if combined approaches are not feasible.

3.4. Strengths and Limitations

The strengths of our ABM include: (i) an explicit description of the malaria transmission cycle between humans and mosquitoes and the control interventions; (ii) the movement of mosquito agents was considered neither completely randomly nor consciously; (iii) the transmission of malaria was taken into account regarding a combination of various environmental factors that influences the cell probability of being infected differently; (iv) air temperature, relative humidity, and vegetation were considered per month rather than keeping these environmental conditions constant over time; (v) malaria control interventions with various parameter settings were applied; and (vi) LLINs and IRS control interventions were applied both separately and in combination.
The main limitation of this research was that malaria occurrence data were available only at the county level and not on a more detailed spatial scale. Having malaria occurrence data at such a detailed level would allow us to calibrate and validate the model not only based on the temporal pattern of malaria occurrence, but also concerning the spatial patterns and the malaria transmission potential of locations. This could be of importance in applying control interventions as well as investigating their efficiency more accurately. To address these shortcomings, we recommend that future research simulate the spread of malaria in areas where malaria occurrence data are available at a lower level than the county. Furthermore, there is a strong need to compare the simulated spatiotemporal patterns of malaria spreading with actual data.

4. Conclusions

Despite significant global efforts to eliminate malaria, its spread remains a major public health issue. In this article, we proposed a novel spatial agent-based model to simulate the spread of malaria for Sarbaz, Iran, and to assess the effectiveness of two interventions, namely the use of long-lasting insecticidal nets (LLINs) and indoor residual spraying (IRS), individually and together. Our simulation results suggest that (1) both interventions successfully reduced the spread of malaria and (2) the spread of malaria was more effectively prevented when LLINs and IRS were implemented in combination rather than separately. Our findings can assist health policymakers in selecting and implementing appropriate intervention strategies to reduce malaria transmission. We recommend applying LLINs with a moderate to high coverage rate or IRS with a high coverage rate to reduce the number of infected humans if combined interventions cannot be applied.

Author Contributions

Conceptualization, Navid Mahdizadeh Gharakhanlou and Navid Hooshangi; methodology, Navid Mahdizadeh Gharakhanlou and Navid Hooshangi; software, Navid Mahdizadeh Gharakhanlou; validation, Navid Mahdizadeh Gharakhanlou and Navid Hooshangi; formal analysis, Navid Mahdizadeh Gharakhanlou and Navid Hooshangi; writing and editing, Navid Mahdizadeh Gharakhanlou, Navid Hooshangi and Marco Helbich. All authors have read and agreed to the published version of the manuscript.

Funding

This research received no external funding.

Acknowledgments

We appreciate the constructive comments received from the four reviewers on an earlier version of the manuscript. We would like to express our sincere thanks and appreciation to the personnel of the Sistan and Baluchestan’s Center for Disease Control and Prevention for providing and sharing the malaria notification, and the Ministry of Health and Medical Education for sharing the applied malaria control interventions notification in the county of Sarbaz. Finally, we thank the publisher for waiving the article processing charge.

Conflicts of Interest

The authors declare no conflict of interest.

References

  1. Carter, R.; Mendis, K.N. Evolutionary and Historical Aspects of the Burden of Malaria. Clin. Microbiol. Rev. 2002, 15, 564–594. [Google Scholar] [CrossRef] [PubMed] [Green Version]
  2. Rajkumar, S.; Jebanesan, A.; Nagarajan, R. Effect of leaf essential oil of Coccinia indica on egg hatchability and different larval instars of malarial mosquito Anopheles stephensi. Asian Pac. J. Trop. Med. 2011, 4, 948–951. [Google Scholar] [CrossRef] [Green Version]
  3. Akbari, H.; Majdzadeh, R.; Foroushani, A.R.; Raeisi, A. Timeliness of Malaria Surveillance System in Iran. Iran. J. Public Health 2013, 42, 39–47. [Google Scholar] [PubMed]
  4. World Health Organization (WHO); United Nations Children’s Fund (UNICEF). Achieving the Malaria MDG Target: Reversing the Incidence of Malaria 2000–2015. 2015. Available online: https://www.who.int/malaria/publications/atoz/9789241509442/en/ (accessed on 13 February 2020).
  5. World Health Organization (WHO). World Malaria Report World Health Organization. 2016. Available online: https://www.who.int/malaria/publications/world-malaria-report-2015/report/en/ (accessed on 13 February 2020).
  6. McKelvie, W.R.; Haghdoost, A.; Raeisi, A. Defining and detecting malaria epidemics in south-east Iran. Malar. J. 2012, 11, 81. [Google Scholar] [CrossRef] [PubMed] [Green Version]
  7. Sheikhzadeh, K.; Haghdoost, A.; Bahrampour, A.; Raeisi, A.; Zolala, F.; Farzadfar, F.; Kasaeian, A.; Parsaeian, M. Predicting Malaria Transmission Risk in Endemic Areas of Iran: A Multilevel Modeling Using Climate and Socioeconomic Indicators. Iran. Red Crescent Med. J. 2017, 19, 45132. [Google Scholar] [CrossRef]
  8. Gharakhanlou, N.M.; Mesgari, M.S.; Hooshangi, N. Developing an agent-based model for simulating the dynamic spread of Plasmodium vivax malaria: A case study of Sarbaz, Iran. Ecol. Inform. 2019, 54, 101006. [Google Scholar] [CrossRef]
  9. Fillinger, U.; Lindsay, S.W. Larval source management for malaria control in Africa: Myths and reality. Malar. J. 2011, 10, 353. [Google Scholar] [CrossRef] [PubMed] [Green Version]
  10. Alam, M.Z.; Arifin, S.N.; Al-Amin, H.M.; Alam, M.S.; Rahman, M.S. A spatial agent-based model of Anopheles vagus for malaria epidemiology: Examining the impact of vector control interventions. Malar. J. 2017, 16, 432. [Google Scholar] [CrossRef] [PubMed] [Green Version]
  11. Corbel, V.; Akogbeto, M.; Damien, G.B.; Djènontin, A.; Chandre, F.; Rogier, C.; Moiroux, N.; Chabi, J.; Banganna, B.; Padonou, G.G.; et al. Combination of malaria vector control interventions in pyrethroid resistance area in Benin: A cluster randomised controlled trial. Lancet Infect. Dis. 2012, 12, 617–626. [Google Scholar] [CrossRef]
  12. Yakob, L.; Yan, G. Modeling the effects of integrating larval habitat source reduction and insecticide treated nets for malaria control. PLoS ONE 2009, 4, e6921. [Google Scholar] [CrossRef]
  13. Alam, M.S.; Chakma, S.; Khan, W.A.; Glass, G.E.; Mohon, A.N.; Elahi, R.; Norris, L.C.; Podder, M.P.; Ahmed, S.; Haque, R.; et al. Diversity of anopheline species and their Plasmodium infection status in rural Bandarban, Bangladesh. Parasites Vectors 2012, 5, 150. [Google Scholar] [CrossRef] [Green Version]
  14. Kesteman, T.; Randrianarivelojosia, M.; Raharimanga, V.; Randrianasolo, L.; Piola, P.; Rogier, C. Effectiveness of malaria control interventions in Madagascar: A nationwide case-control survey. Malar. J. 2016, 15, 83. [Google Scholar] [CrossRef] [Green Version]
  15. Okumu, F.O.; Chipwaza, B.; Madumla, E.P.; Mbeleya, E.; Lingamba, G.; Moore, J.; Ntamatungro, A.J.; Kavishe, D.R.; Moore, S.J. Implications of bio-efficacy and persistence of insecticides when indoor residual spraying and long-lasting insecticide nets are combined for malaria prevention. Malar. J. 2012, 11, 378. [Google Scholar] [CrossRef] [Green Version]
  16. Chitnis, N.; Schapira, A.; Smith, T.; Steketee, R. Comparing the effectiveness of malaria vector-control interventions through a mathematical model. Am. J. Trop. Med. Hyg. 2010, 83, 230–240. [Google Scholar] [CrossRef] [Green Version]
  17. Giardina, F.; Kasasa, S.; Sié, A.; Utzinger, J.; Tanner, M.; Vounatsou, P. Effects of vector-control interventions on changes in risk of malaria parasitaemia in sub-Saharan Africa: A spatial and temporal analysis. Lancet Glob. Health 2014, 2, e601–e615. [Google Scholar] [CrossRef] [Green Version]
  18. Lwin, M.M.; Sudhinaraset, M.; San, A.K.; Aung, T. Improving malaria knowledge and practices in rural Myanmar through a village health worker intervention: A cross-sectional study. Malar. J. 2014, 13, 5. [Google Scholar] [CrossRef] [Green Version]
  19. Bowen, H.L. Impact of a mass media campaign on bed net use in Cameroon. Malar. J. 2013, 12, 36. [Google Scholar] [CrossRef] [Green Version]
  20. Fillinger, U.; Ndenga, B.; Githeko, A.; Lindsay, S.W. Integrated malaria vector control with microbial larvicides and insecticide-treated nets in western Kenya: A controlled trial. Bull. World Health Organ. 2009, 87, 655–665. [Google Scholar] [CrossRef]
  21. Rao, D.M.; Chernyakhovsky, A.; Rao, V. Modeling and analysis of global epidemiology of avian influenza. Environ. Model. Softw. 2009, 24, 124–134. [Google Scholar] [CrossRef]
  22. Pérez, L.; Dragićević, S. An agent-based approach for modeling dynamics of contagious disease spread. Int. J. Health Geogr. 2009, 8, 50. [Google Scholar] [CrossRef] [PubMed] [Green Version]
  23. Ajelli, M.; Merler, S. An individual-based model of hepatitis A transmission. J. Theor. Boil. 2009, 259, 478–488. [Google Scholar] [CrossRef] [PubMed] [Green Version]
  24. Bouchnita, A.; Jebrane, A. A hybrid multi-scale model of COVID-19 transmission dynamics to assess the potential of non-pharmaceutical interventions. Chaos Solitons Fractals 2020, 138, 109941. [Google Scholar] [CrossRef] [PubMed]
  25. Gharakhanlou, N.M.; Hooshangi, N. Spatio-temporal simulation of the novel coronavirus (COVID-19) outbreak using the agent-based modeling approach (case study: Urmia, Iran). Inform. Med. Unlocked 2020, 20, 100403. [Google Scholar] [CrossRef]
  26. Linard, C.; Ponçon, N.; Fontenille, D.; Lambin, E.F. A multi-agent simulation to assess the risk of malaria re-emergence in southern France. Ecol. Model. 2009, 220, 160–174. [Google Scholar] [CrossRef]
  27. Arifin, S.; Arifin, R.R.; Pitts, D.d.A.; Rahman, M.S.; Nowreen, S.; Madey, G.R.; Collins, F.H. Landscape Epidemiology Modeling Using an Agent-Based Model and a Geographic Information System. Land 2015, 4, 378–412. [Google Scholar] [CrossRef] [Green Version]
  28. Arifin, S.N.; Madey, G.R.; Collins, F.H. Examining the impact of larval source management and insecticide-treated nets using a spatial agent-based model of Anopheles gambiae and a landscape generator tool. Malar. J. 2013, 12, 290. [Google Scholar] [CrossRef]
  29. Griffin, J.T.; Bhatt, S.; Sinka, M.E.; Gething, P.W.; Lynch, M.; Patouillard, E.; Shutes, E.; Newman, R.D.; Alonso, P.; Cibulskis, R.E.; et al. Potential for reduction of burden and local elimination of malaria by reducing Plasmodium falciparum malaria transmission: A mathematical modelling study. Lancet Infect. Dis. 2016, 16, 465–472. [Google Scholar] [CrossRef] [Green Version]
  30. Quan-Xing, L.; Zhen, J. Cellular automata modelling of SEIRS. Chin. Phys. 2005, 14, 1370–1377. [Google Scholar] [CrossRef]
  31. White, S.H.; Del Rey, A.M.; Sánchez, G.R. Modeling epidemics using cellular automata. Appl. Math. Comput. 2007, 186, 193–202. [Google Scholar] [CrossRef] [PubMed]
  32. Sirakoulis, G.C.; Karafyllidis, I.; Thanailakis, A. A cellular automaton model for the effects of population movement and vaccination on epidemic propagation. Ecol. Model. 2000, 133, 209–223. [Google Scholar] [CrossRef]
  33. Gu, W.; Novak, R.J. Predicting the impact of insecticide-treated bed nets on malaria transmission: The devil is in the detail. Malar. J. 2009, 8, 256. [Google Scholar] [CrossRef] [PubMed]
  34. Gu, W.; Novak, R.J. Agent-based modelling of mosquito foraging behaviour for malaria control. Trans. R. Soc. Trop. Med. Hyg. 2009, 103, 1105–1112. [Google Scholar] [CrossRef] [PubMed] [Green Version]
  35. Bomblies, A. Agent-based modeling of malaria vectors: The importance of spatial simulation. Parasites Vectors 2014, 7, 308. [Google Scholar] [CrossRef] [Green Version]
  36. Norouzinejad, F.; Ghaffari, F.; Raeisi, A. Epidemiological status of malaria in Iran, 2011–2014. Asian Pac. J. Trop. Med. 2016, 9, 1055–1061. [Google Scholar] [CrossRef] [Green Version]
  37. Kelly-Hope, L.A.; Hemingway, J.; McKenzie, F.E. Environmental factors associated with the malaria vectors Anopheles gambiae and Anopheles funestus in Kenya. Malar. J. 2009, 8, 268. [Google Scholar] [CrossRef] [Green Version]
  38. Patz, J.A.; Graczyk, T.K.; Geller, N.; Vittor, A.Y. Effects of environmental change on emerging parasitic diseases. Int. J. Parasitol. 2000, 30, 1395–1405. [Google Scholar] [CrossRef] [Green Version]
  39. Kigozi, R.; Zinszer, K.; Mpimbaza, A.; Sserwanga, A.; Kigozi, S.P.; Kamya, M. Assessing temporal associations between environmental factors and malaria morbidity at varying transmission settings in Uganda. Malar. J. 2016, 15, 511. [Google Scholar] [CrossRef] [PubMed] [Green Version]
  40. Hasyim, H.; Nursafingi, A.; Haque, U.; Montag, D.; Groneberg, D.A.; Dhimal, M.; Kuch, U.; Müller, R. Spatial modelling of malaria cases associated with environmental factors in South Sumatra, Indonesia. Malar. J. 2018, 17, 1–15. [Google Scholar] [CrossRef] [Green Version]
  41. Sadeghi, M.; Babaeian, E.; Tuller, M.; Jones, S.B. The optical trapezoid model: A novel approach to remote sensing of soil moisture applied to Sentinel-2 and Landsat-8 observations. Remote Sens. Environ. 2017, 198, 52–68. [Google Scholar] [CrossRef] [Green Version]
  42. Helbich, M. Spatiotemporal Contextual Uncertainties in Green Space Exposure Measures: Exploring a Time Series of the Normalized Difference Vegetation Indices. Int. J. Environ. Res. Public Health 2019, 16, 852. [Google Scholar] [CrossRef] [Green Version]
  43. Khan, A.R.; Rafique, M.; Rahman, S.U.; Basharat, M.; Shahzadi, C.; Ahmed, I. Geo-spatial analysis of radon in spring and well water using kriging interpolation method. Water Supply 2019, 19, 222–235. [Google Scholar] [CrossRef]
  44. Binion-Rock, S.M.; Reich, B.J.; Buckel, J.A. A spatial kernel density method to estimate the diet composition of fish. Can. J. Fish. Aquat. Sci. 2019, 76, 249–267. [Google Scholar] [CrossRef]
  45. Wilensky, U. Center for Connected Learning and Computer-Based Modeling, in NetLogo; Northwestern University: Evanston, IL, USA, 1999. [Google Scholar]
  46. Mahdizadeh Gharakhanlou, N.; Mesgari, M. Developing a cellular automata model for simulating rainfall-runoff process (case study: Babol catchment). Int. Arch. Photogramm. Remote Sens. Spat. Inf. Sci. 2019, 697–702. [Google Scholar] [CrossRef] [Green Version]
  47. Centers for Disease Control and Prevention (CDC). Biology of Anopheles Mosquitoes. 2018; Last Updated 14 November 2018. Available online: https://www.cdc.gov/malaria/about/biology/mosquitoes/ (accessed on 11 January 2020).
  48. Ribeiro, J. Role of saliva in blood-feeding by arthropods. Annu. Rev. Entomol. 1987, 32, 463–478. [Google Scholar] [CrossRef]
  49. Teknomo, K. Analytic Hierarchy Process (AHP) Tutorial. Available online: https://people.revoledu.com/kardi/tutorial/ (accessed on 24 April 2020).
  50. Li, J.; Zhao, Y.; Li, S. Fast and Slow dynamics of Malaria model with relapse. Math. Biosci. 2013, 246, 94–104. [Google Scholar] [CrossRef] [PubMed]
  51. Centers for Disease Control and Prevention (CDC). Incubation Period of Malaria. 2019; Last Updated 4 January 2019. Available online: https://www.cdc.gov/malaria/about/disease.html (accessed on 11 January 2020).
  52. Mbogo, R.W.; Luboobi, L.S.; Odhiambo, J.W. A Stochastic Model for Malaria Transmission Dynamics. J. Appl. Math. 2018, 2018, 1–13. [Google Scholar] [CrossRef] [Green Version]
  53. Kongmee, M.; Boonyuan, W.; Achee, N.L.; Prabaripai, A.; Lerdthusnee, K.; Chareonviriyaphap, T. Irritant and Repellent Responses of Anopheles harrisoni and Anopheles minimus upon Exposure to Bifenthrin or Deltamethrin Using an Excito-Repellency System and a Live Host. J. Am. Mosq. Control Assoc. 2012, 28, 20–29. [Google Scholar] [CrossRef] [PubMed]
  54. Khosravani, M.; Rafatpanah, A.; Amiri, S.-A.; Zare, A. The Field Practices of Lambdacyhalothrin and Deltamethrin Insecticides Against Adult Mosquitoes of Anopheles stephensi as the Main Vector of Malaria: Residual Effects. Zahedan J. Res. Med. Sci. 2017, 19, 7629. [Google Scholar] [CrossRef] [Green Version]
Figure 1. Geographical location of the study area, namely Sarbaz county in the province of Sistan and Baluchestan, Iran.
Ijgi 09 00549 g001
Figure 2. The developed agent-based model in NetLogo 6.0.4.
Ijgi 09 00549 g002
Figure 3. Parameters and settings of the agent-based model.
Ijgi 09 00549 g003
Figure 4. Flowchart of Long-Lasting Insecticidal Nets’ (LLINs) role.
Ijgi 09 00549 g004
Figure 5. Flowchart of the Indoor Residual Spraying’s (IRS) function.
Ijgi 09 00549 g005
Figure 6. Flowchart of applying LLINs and IRS in combination.
Ijgi 09 00549 g006
Figure 7. Comparison of the modeled and real observed numbers of infected people in the county of Sarbaz for each month in 2014.
Ijgi 09 00549 g007
Table 1. Datasets.
Table 1. Datasets.
DatasetDataSource
Spatial dataVectorPointMean monthly air temperature in 2013–2014Iran Meteorological Organization
Mean monthly relative humidity in 2013–2014
Villages and cities in 2013National Cartographic Center, Iran
PolylineRivers in 2013
PolygonBoundaries of villages and cities in 2013
Dams in 2013
RasterMonthly normalized differentiated vegetation index (NDVI) in 2013–2014Landsat 8 OLI (Operational Land Imager) and TIRS (Thermal Infrared Sensor), downloaded from the website https://earthexplorer.usgs.gov/
Digital elevation model (DEM)Shuttle Radar Topography Mission (SRTM), United States Geological Survey (USGS), downloaded from https://earthexplorer.usgs.gov/
Census dataHuman population in 2011Statistical Center of Iran, downloaded from https://www.amar.org.ir/english/
Control interventions notificationApplied malaria control interventions in 2013–2014Center for Communicable Disease Management, Ministry of Health and Medical Education, Iran
Malaria notificationMonthly number of malaria cases in 2012, 2013, and 2014Center for Disease Control and Prevention of Sistan and Baluchestan Province, Iran
Table 2. Summary of the input parameters.
AgentsParametersValue/Range of ValueMeanStandard DeviationReference
Anopheles MosquitoesDuration of transition from egg stage to larvae stage2–3 days--[47]
Duration of transition from larval stage to pupae stage5–8 days6.5 days(6.5/8) days
Duration of transition from pupae stage to adult stage2–3 days--
Duration of adult mosquito’s lifespan7–30 days18.5 days(18.5/4) days
Number of eggs per reproduction50–200 eggs125 eggs(125/4) eggs
Total number of eggs laid by a mosquito during its lifespan500--
Duration of digesting blood meal and eggs development in mosquito’s body2–3 days--
Duration of exposed state (incubation period)10–21 days15.5 days(15.5/4) days
Probability of becoming exposed2%--[50]
Maximum daily range of movement250 2 m ≈ 10 cell--[27]
Maximum distance that Anopheles mosquitoes can move away from their habitats (flight range)2100 m = 60 cells--[26]
HumansDuration of exposed state (incubation period)7–30 days18.5 days(18.5/4) days[51]
Probability of a human agent becoming susceptible after having recovered (recovery probability)(0.01)*(Number of days since human agent recovered)--[52]
Probability of a human agent recovering (treatment probability)(0.037)*(Number of days since human agent infected)--
Table 3. Allocated ranges of values to mortality rate parameter regarding the number of days elapsed since application.
Number of Days ElapsedMortality Rate Parameter
Range of Value [54]MeanStandard Deviation
1–35[97.5–100%]98.75%0.77%
36–49[95–97.5%]96.25%0.75%
50–63[89–95%]92%1.44%
64–77[79–89%]84%1.31%
78–91[71.5–79%]75.25%1.18%
92–105[64.5–71.5%]68%1.06%
106–120[58.5–64.5%]61.5%0.96%
>120[0–58.5%]29.25%7.31%
Table 4. Results of applying interventions of LLINs and IRS separately.
Separate InterventionsCoverage RateAverage Number of Infected Human AgentsPercentage Reduction in the Average Number of Infected Human Agents
LLINs10%830.0218.957%
25%584.8142.899%
40%100.4690.191%
IRS10%949.317.309%
25%837.5418.222%
40%685.9433.025%
Table 5. Results of applying LLINs and IRS in combination.
Two Interventions in CombinationCoverage RatesAverage Number of Infected Human Agents in 100 RunsPercentage Reduction in the Average Number of Infected Human Agents after LLIN and IRS Implementation
LLINsIRS
LLINs and IRS10%10%769.7924.838%
25%678.6233.740%
40%570.5244.294%
25%10%542.3547.045%
25%463.2854.765%
40%388.9162.027%
40%10%85.7691.626%
25%59.3394.207%
40%46.9395.418%

