Article

Two Korean Endemic Clematis Chloroplast Genomes: Inversion, Reposition, Expansion of the Inverted Repeat Region, Phylogenetic Analysis, and Nucleotide Substitution Rates

1
Institute of Natural Science, Yeungnam University, Gyeongsan-si, Gyeongbuk-do 38541, Korea
2
Department of Life Sciences, Yeungnam University, Gyeongsan-si, Gyeongbuk-do 38541, Korea
3
Forest Biodiversity Division, Korea National Arboretum, 415 Gwangneungsumogwon-ro, Soheul-eup, Pocheon-si, Gyeonggi-do 11186, Korea
4
Department of Life Science, Gachon University, Seongnam-si, Gyeonggi-do 13120, Korea
5
DMZ Botanic Garden, Korea National Arboretum, 916-70, Punchbowl-ro, Haean-myeon, Yanggu, Gangwon-do 24564, Korea
6
Research Planning and Coordination Division, Korea National Arboretum, 415 Gwangneungsumogwon-ro, Soheul-eup, Pocheon-si, Gyeonggi-do 11186, Korea
*
Author to whom correspondence should be addressed.
Submission received: 22 January 2021 / Revised: 13 February 2021 / Accepted: 16 February 2021 / Published: 19 February 2021

Abstract

:
Previous studies on the chloroplast genome in Clematis focused on the chloroplast structure within Anemoneae. The chloroplast genomes of Cleamtis were sequenced to provide information for studies on phylogeny and evolution. Two Korean endemic Clematis chloroplast genomes (Clematis brachyura and C. trichotoma) range from 159,170 to 159,532 bp, containing 134 identical genes. Comparing the coding and non-coding regions among 12 Clematis species revealed divergent sites, with carination occurring in the petD-rpoA region. Comparing other Clematis chloroplast genomes suggested that Clematis has two inversions (trnH-rps16 and rps4), reposition (trnL-ndhC), and inverted repeat (IR) region expansion. For phylogenetic analysis, 71 protein-coding genes were aligned from 36 Ranunculaceae chloroplast genomes. Anemoneae (Anemoclema, Pulsatilla, Anemone, and Clematis) clades were monophyletic and well-supported by the bootstrap value (100%). Based on 70 chloroplast protein-coding genes, we compared nonsynonymous (dN) and synonymous (dS) substitution rates among Clematis, Anemoneae (excluding Clematis), and other Ranunculaceae species. The average synonymoussubstitution rates (dS)of large single copy (LSC), small single copy (SSC), and IR genes in Anemoneae and Clematis were significantly higher than those of other Ranunculaceae species, but not the nonsynonymous substitution rates (dN). This study provides fundamental information on plastid genome evolution in the Ranunculaceae.

1. Introduction

The development of sequencing technology has enabled next-generation sequencing (NGS), which generates large amounts of data in a short time [1]. The increased availability of genomic data has led to the exploration of plant evolutionary history, including identifying hybrid origins [2], mapping organelles [3] or complete genomes [4], and tracing gene transfers among organelles [5]. The chloroplast (cp) is a self-replicating organelle in plants introduced through endosymbiosis and it plays a crucial role in photosynthesis [6]. The cp genome typically consists of a large single copy (LSC), a small single copy (SSC), and two inverted repeat (IR) regions. In angiosperms, cp genomes generally range from 120 to 160 kb in length and contain 110–130 genes. The gene content and gene order are highly conserved in most angiosperms [7,8], but different studies have reported changes in the cp genome, including gene loss [9,10], inversions or deletions [11,12], and the expansion or contraction of the IR regions [13,14]. Although the majority of IR regions in land plants range from 15 to 30 kb in length and contain four rRNA genes, five tRNA genes, and four coding genes, variation in locus- and lineage-specific structures has been reported [15,16]. The IR region has been considered to be involved in genome stability [17], and, therefore, suppressed synonymous and nonsynonymous mutations were observed in the IR region relative to the SC regions [18,19]. Although IR regions contribute to structural stability and are known to change conservatively, variable length variation has been observed. Large expansions (exceeding several kb) were reported in the IR regions of Pelargonium [20], Berberis [21], and Asarum [22]. In contrast, the contraction of the IR regions has been observed in legumes [23] and Erodium [24]. The variation in expansion and contraction in IR regions is correlated with the substitution rate of genes [5,14,15]. Although some studies have schematized their structure [25], no comprehensive research has been conducted, including only fragmented research in Clematis L.
The family Ranunculaceae is within an early-diverging angiosperm lineage and comprises 59–62 genera and approximately 2500 species with a worldwide distribution [26,27]. The family is often utilized as a model system for research on plant evolution, given its high morphological diversity (e.g., fruit types and floral organization) [25,27]. The conventional cytologic classification recognizes three chromosome types: R (Ranunculus), T (Thalictrum), and C (Coptis). [28,29]. Other classifications have been proposed using morphological characters [26,30] and molecular data [27,31]. A recently published phylogenomic study using cp genome sequences reported that T-type chromosomal characteristics are important for the classification of Ranunculaceae [25]. Such genome studies evaluated genome diversity beyond estimating relationships. In the past decade, the cp genome analysis of Ranunculaceae revealed intracellular gene transfer (infA, rpl32, and rps16) in the tribe Delphinieae and genus Thalictrum [32]. In addition, the phylogenetic relationship and genomic structure of Aconitum spp. [33,34], Hepatica [35], and Pulsatilla [36] have been analyzed. However, there is still a need for in-depth research at the genus level. The Clematis genome has been directly published [37,38], as well as being used for other major studies [25,39,40]. Many studies have focused on Aconitum species, which are used in traditional herbal medicine in Asia [34,41,42]. Therefore, to the best of our knowledge, ours is the first study to perform genome-scale comparisons among Clematis species.
Clematis, commonly known as leather flowers, of Ranunculaceae comprise approximately 250–350 species, from lianas to subshrubs [43,44]. Clematis is a popular horticulture species in gardens, and various cultivars have been produced in Japan and China [45]. This genus occurs in almost all continents except Antarctica and shows great diversity in East Asia and North America [26,46]. Although several molecular studies of the Clematis tribe Anemoneae have been conducted and supported their monophyly, only some fragmentary sequences and partial intergenic spacers were used [47,48,49]. The Clematis cp genomes were used as related species for the study of other species. Therefore, there were no genomic comparative analyses among Clematis species [38,39]. Recently conducted phylogenetic analyses using complete cp genome sequences [50] provided important insight into two small genera, Archiclematis and Naravelia, that are closely related to Clematis and indicated that they should be included in Clematis. However, comparative genomic studies on the variation in structural diversity in Aconitum [5] and Coptis [25] in Ranunculaceae are still insufficient.
In Korea, the genus Clematis comprises 22 species, including three endemic species (C. brachyura, C. trichotoma, and C. fusca var. coreana) [51]. An anatomy study conducted by Oh [52] separated each Korea endemic three species. However, there has never been a morphological and molecular phylogenetic analysis of the Korean Clematis species.
In the present study, we characterized the complete cp genomes of two Korean endemic Clematis species (C. brachyura and C. trichotoma). The aims of the present study were 1) to determine the molecular features of the genomes and 2) to compare Clematis and related taxa, focusing on structural variation such as inversions, rearrangements, and IR expansion–contraction. This study also calculated the substitution rates to trace the correlation between IR expansion and gene duplication in Clematis. Finally, protein-coding genes were used to reconstruct the phylogenetic relationships among Clematis and related species in Ranunculaceae.

2. Results

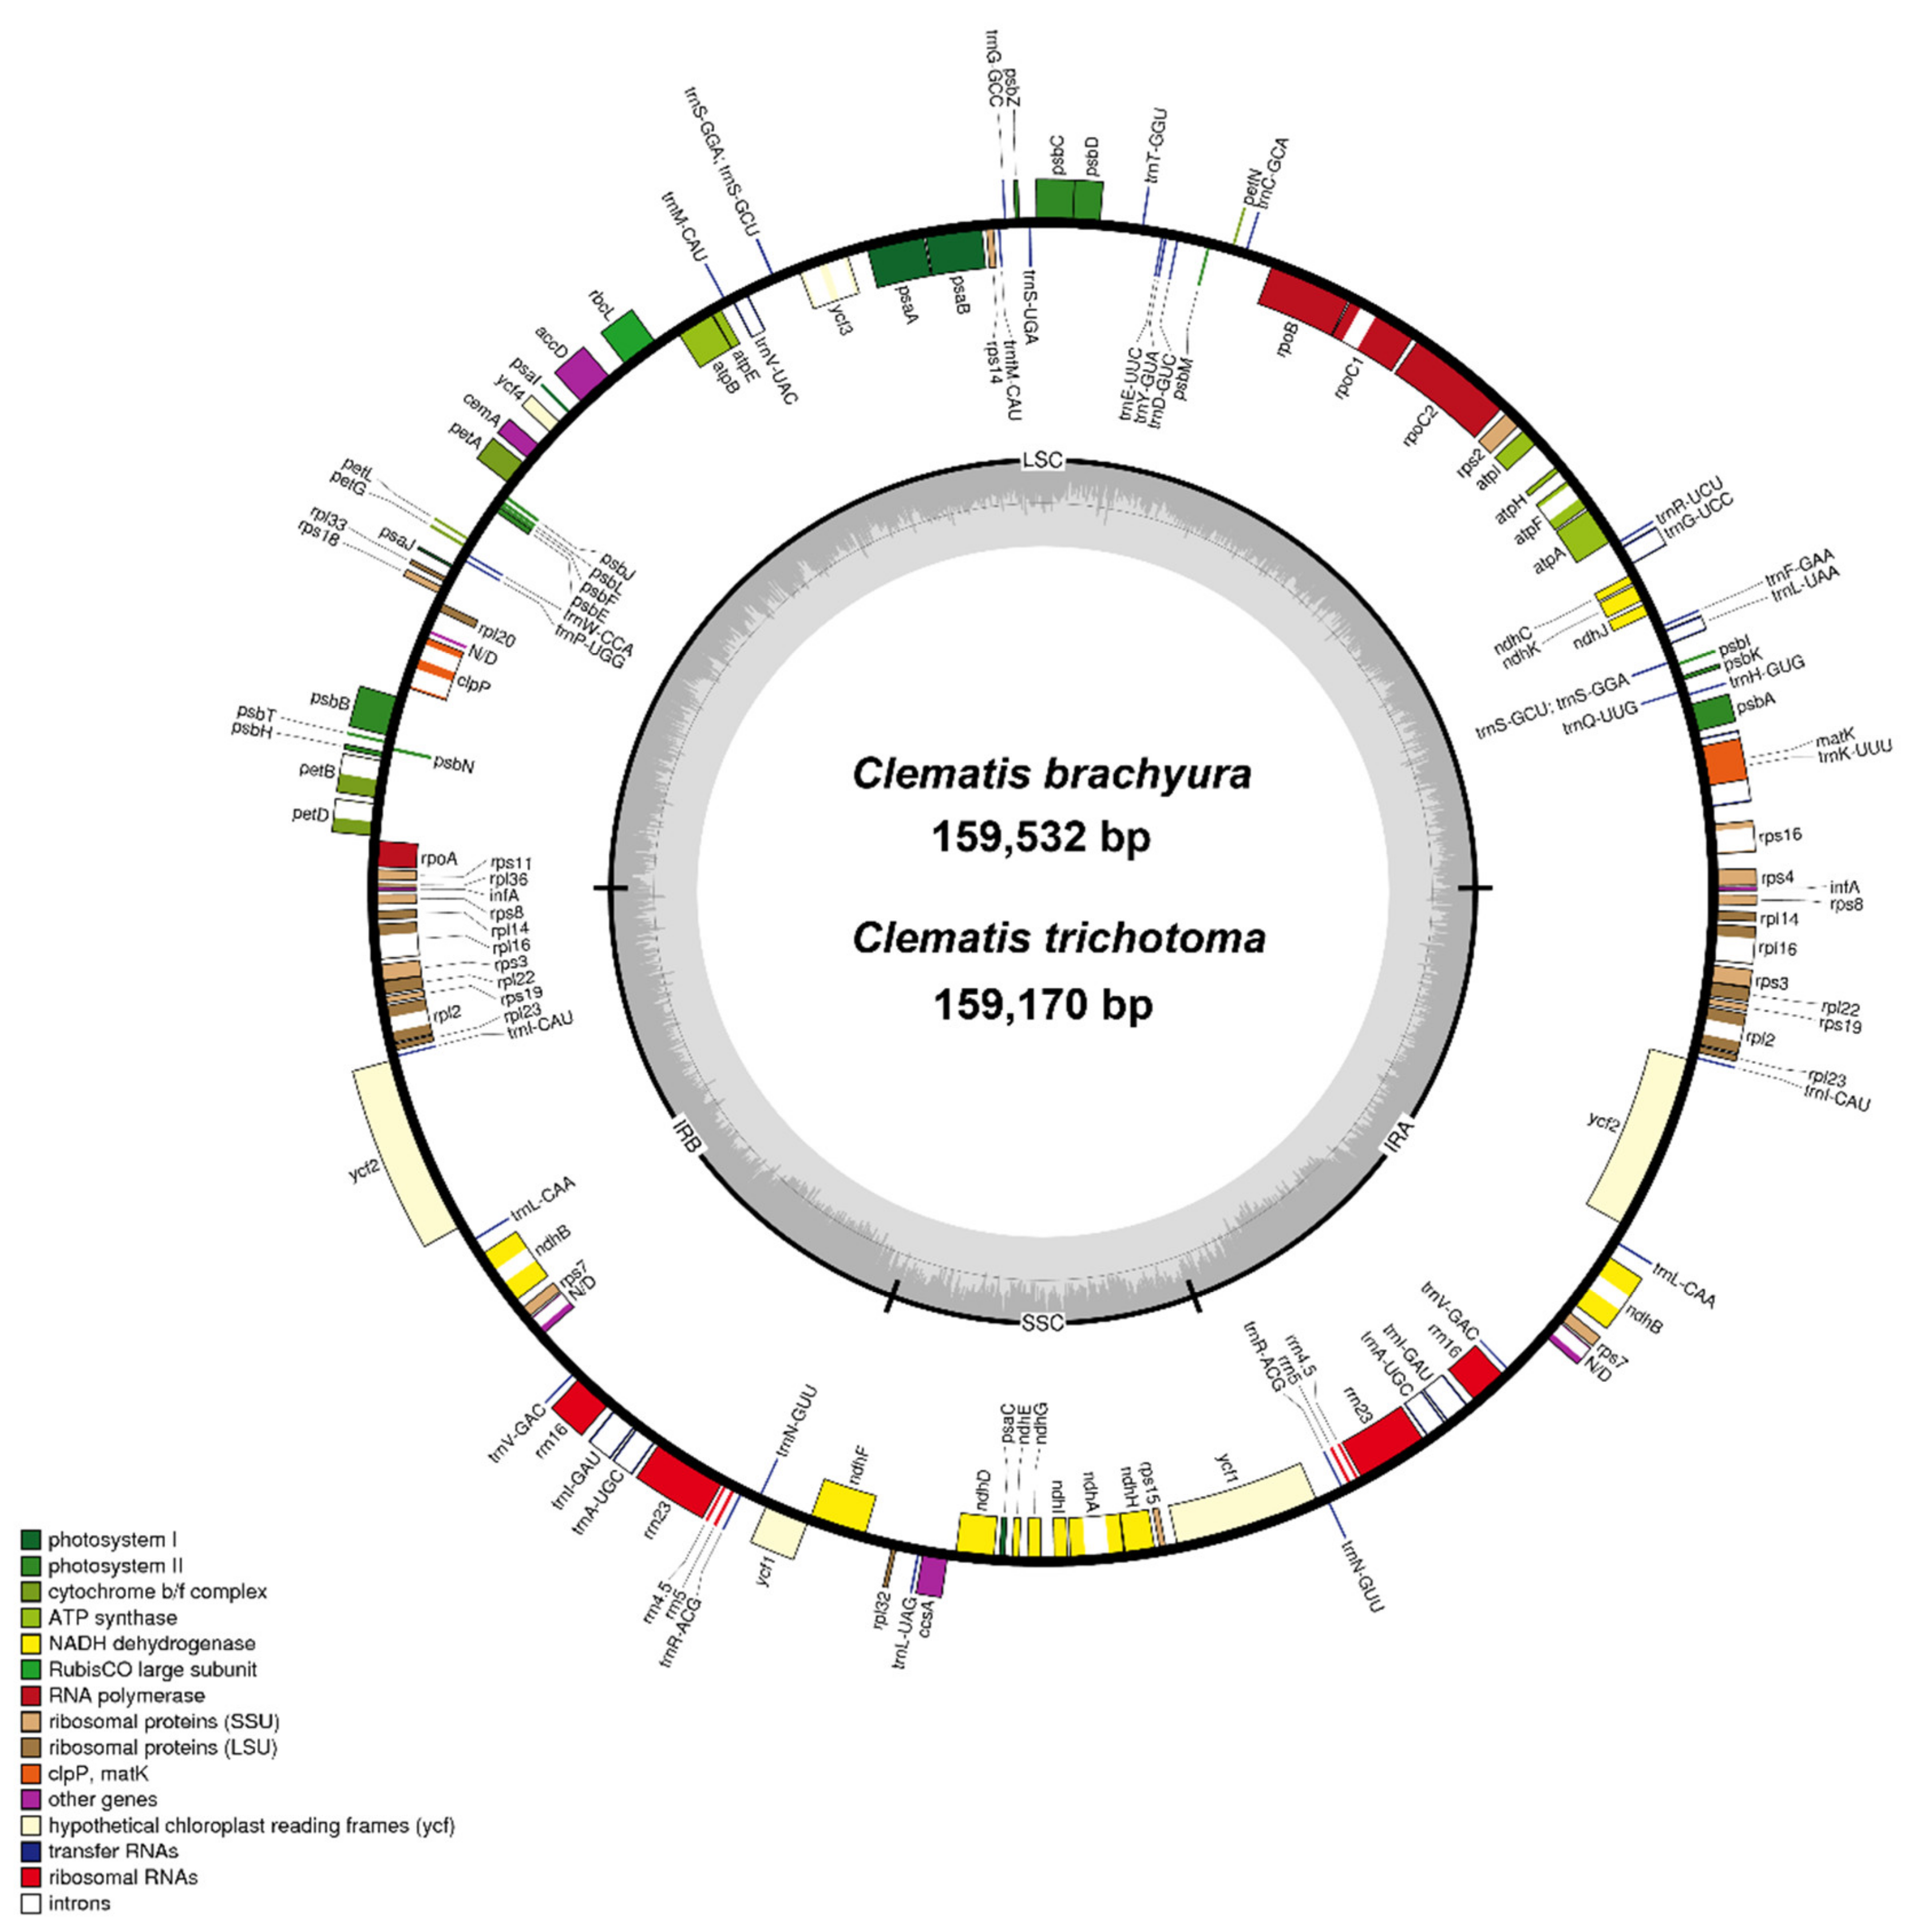
2.1. General Chloroplast Genome Features

Two Korean endemic species, C. brachyura (MH104710) and C. trichotoma (MH104711), plastid genomes are 159,532 and 159,170 bp in length, respectively. The genomes of the two species had a typical quadripartite structure in which an LSC region (79,341 and 79,339 bp) and an SSC region (18,105 and 17,997 bp) were separated by two IRs (31,043 and 30,917 bp) (Figure 1 and Table S1). The cp of C. trichotoma was the smallest among Clematis plastomes. In the two newly added cp genomes, 13 species of plastomes contained identical gene contents (134 genes, including 89 protein-coding, 8 rRNA, and 36 tRNA genes). The infA and rpl32 genes were pseudogenized in all Clematis (Table S1).
The overall guanine–cytosine (GC) content of both C. brachyura and C. trichotoma was similar to 38% (LSC, 36.3%; SSC, 31.3%; IR, 42.1%) and 38% (LSC, 36.4%; SSC, 31.4%; IR, 42%), respectively. A total of 23 genes were duplicated in the IR regions, including 7 tRNA genes (trnI-CAU, trnL-CAA, trnV-GAC, trnI-GAU, trnA-UGC, trnR-ACG, and trnN-GUU), 4 rRNA genes (5S rRNA, 4.5S rRNA, 23S rRNA, and 16S rRNA), and 12 protein-coding genes (rps8, rpl14, rps16, rps3, rpl22, rps19, rpl2, rpl23, ycf2, ndhB, rps7, and rps12). Sixteen genes (atpF, ndhA, ndhB, petB, petD, rpl2, rpl16, rpoC1, rps12, rps16, trnA-UGC, trnG-UCC, trnI-GAU, trnK-UUU, trnL-UAA, and trnV-UAC) contained one intron, and clpP and ycf3 each contained two introns. Of the 16 intron genes, the intron sequence in trnK-UUU was the longest (2551 bp), and the intron sequence in trnL-UAA was the smallest (493 bp).

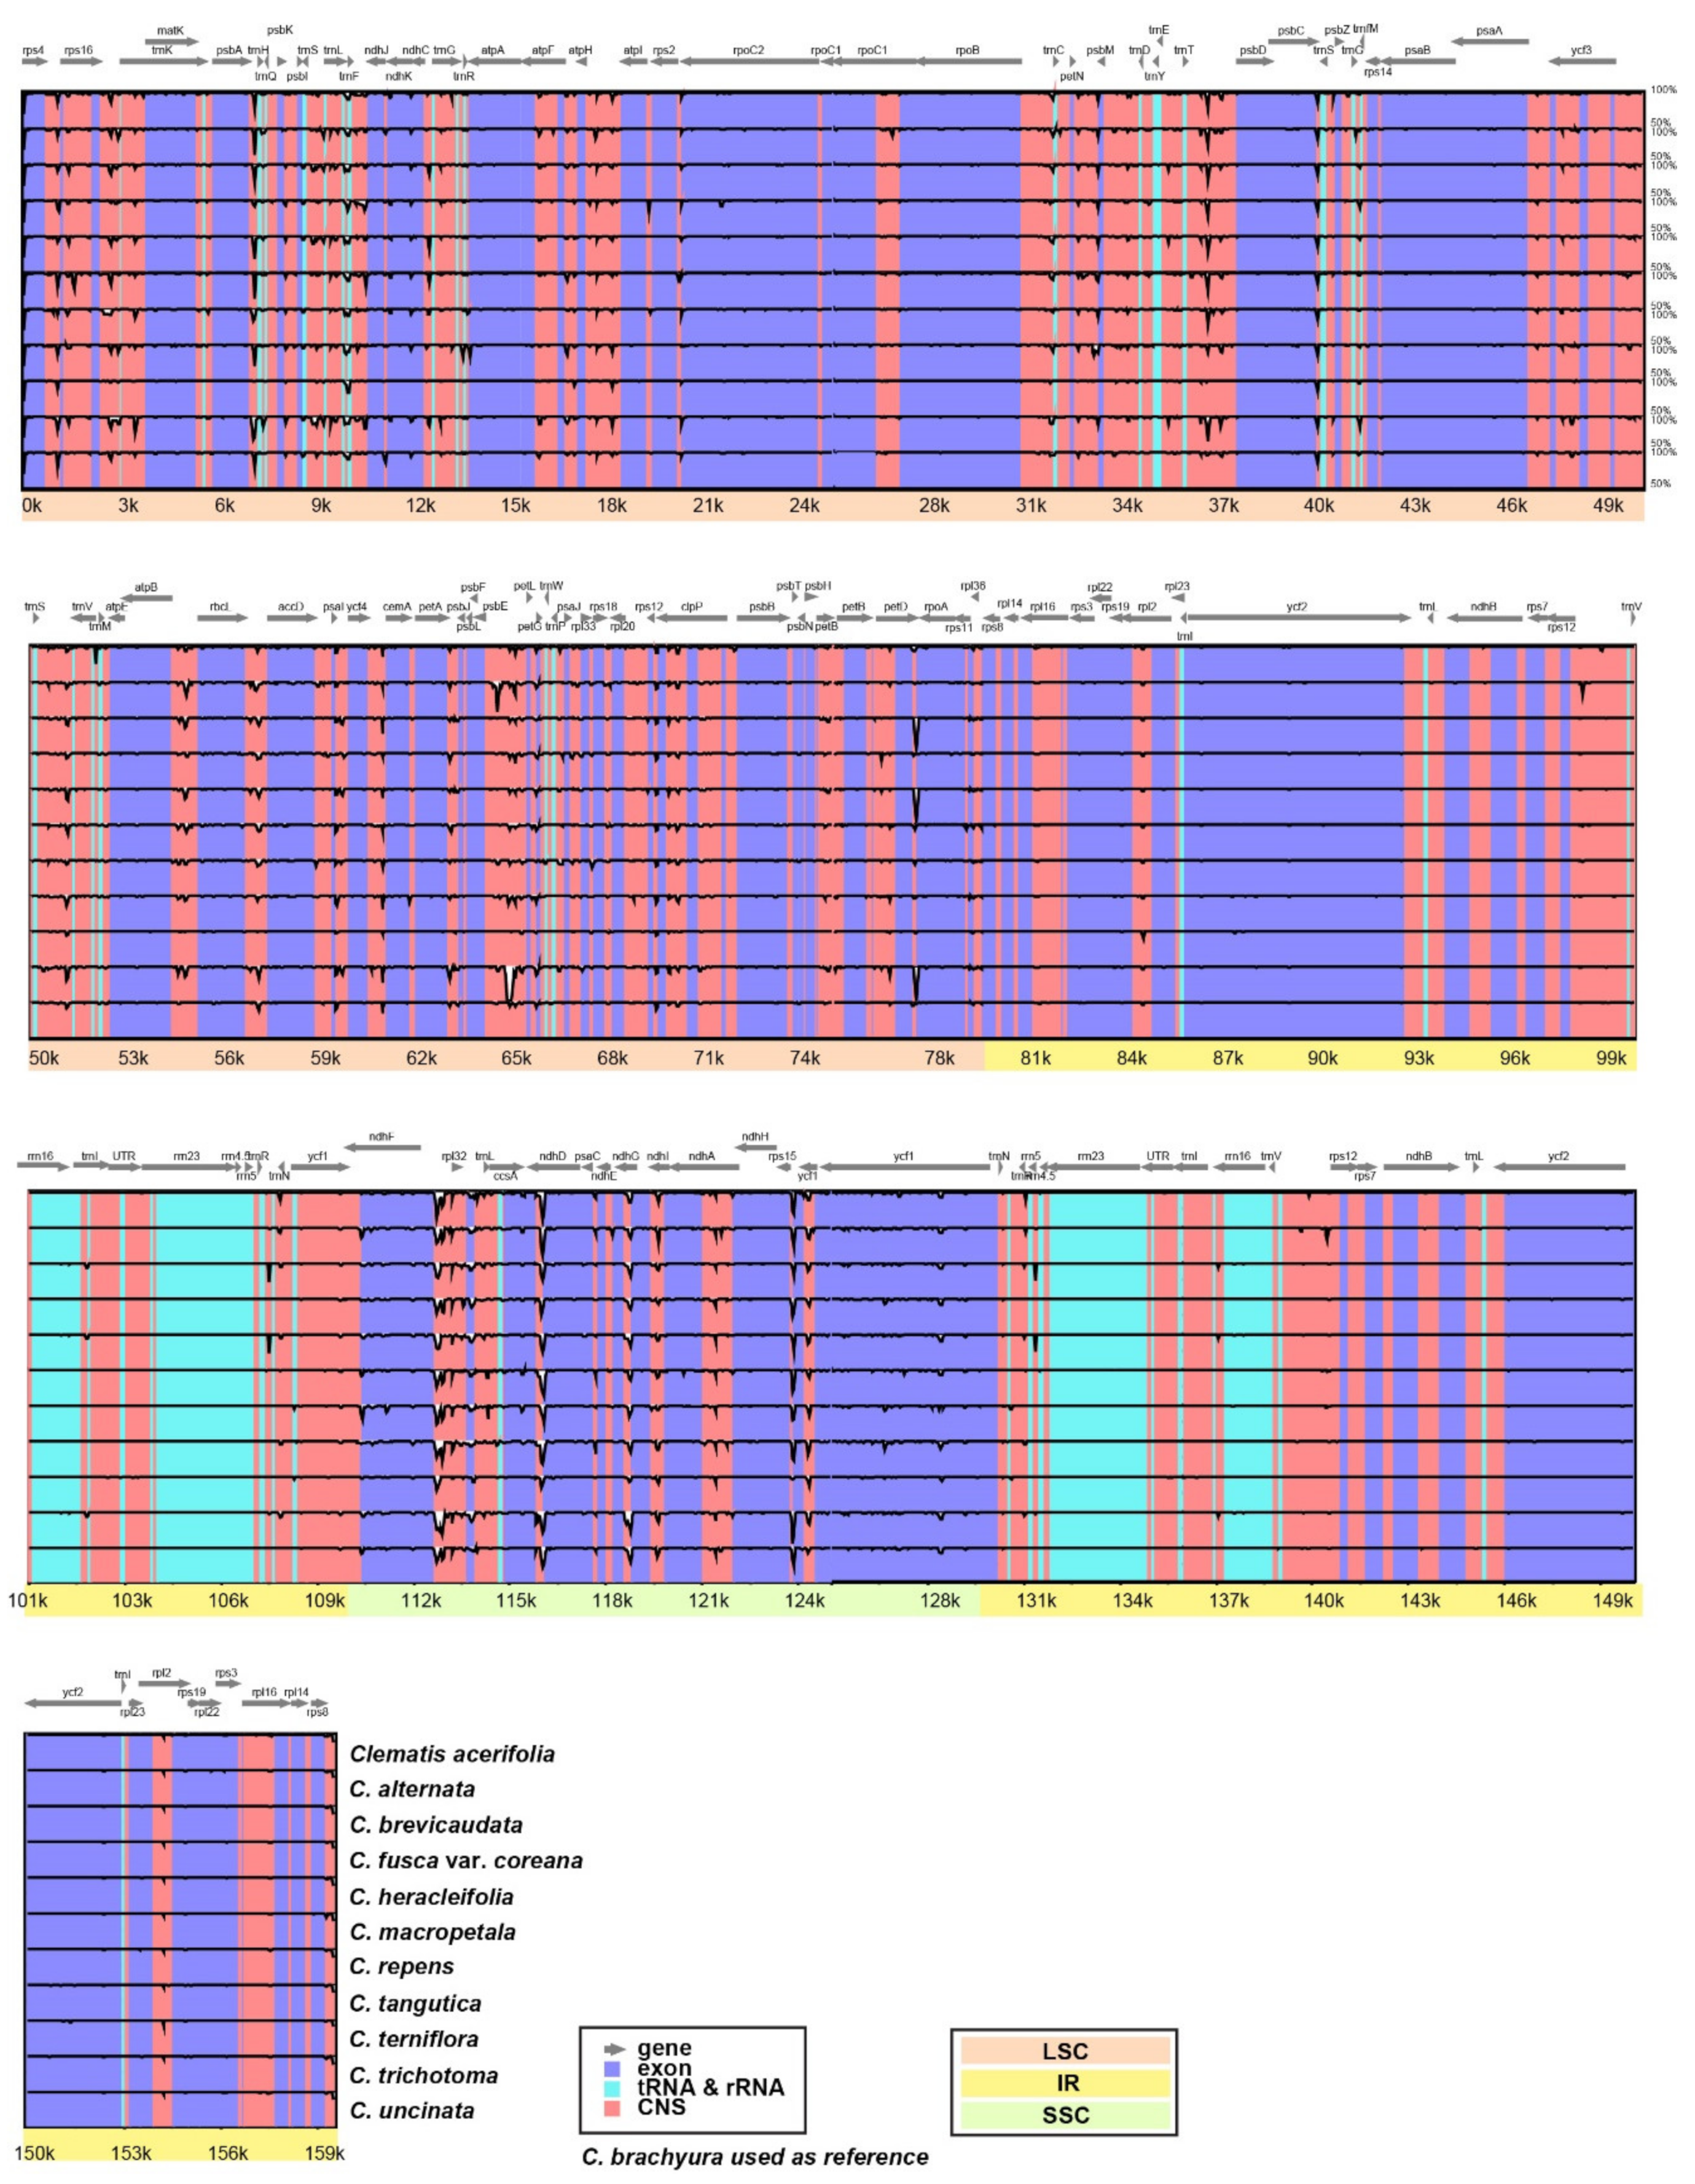
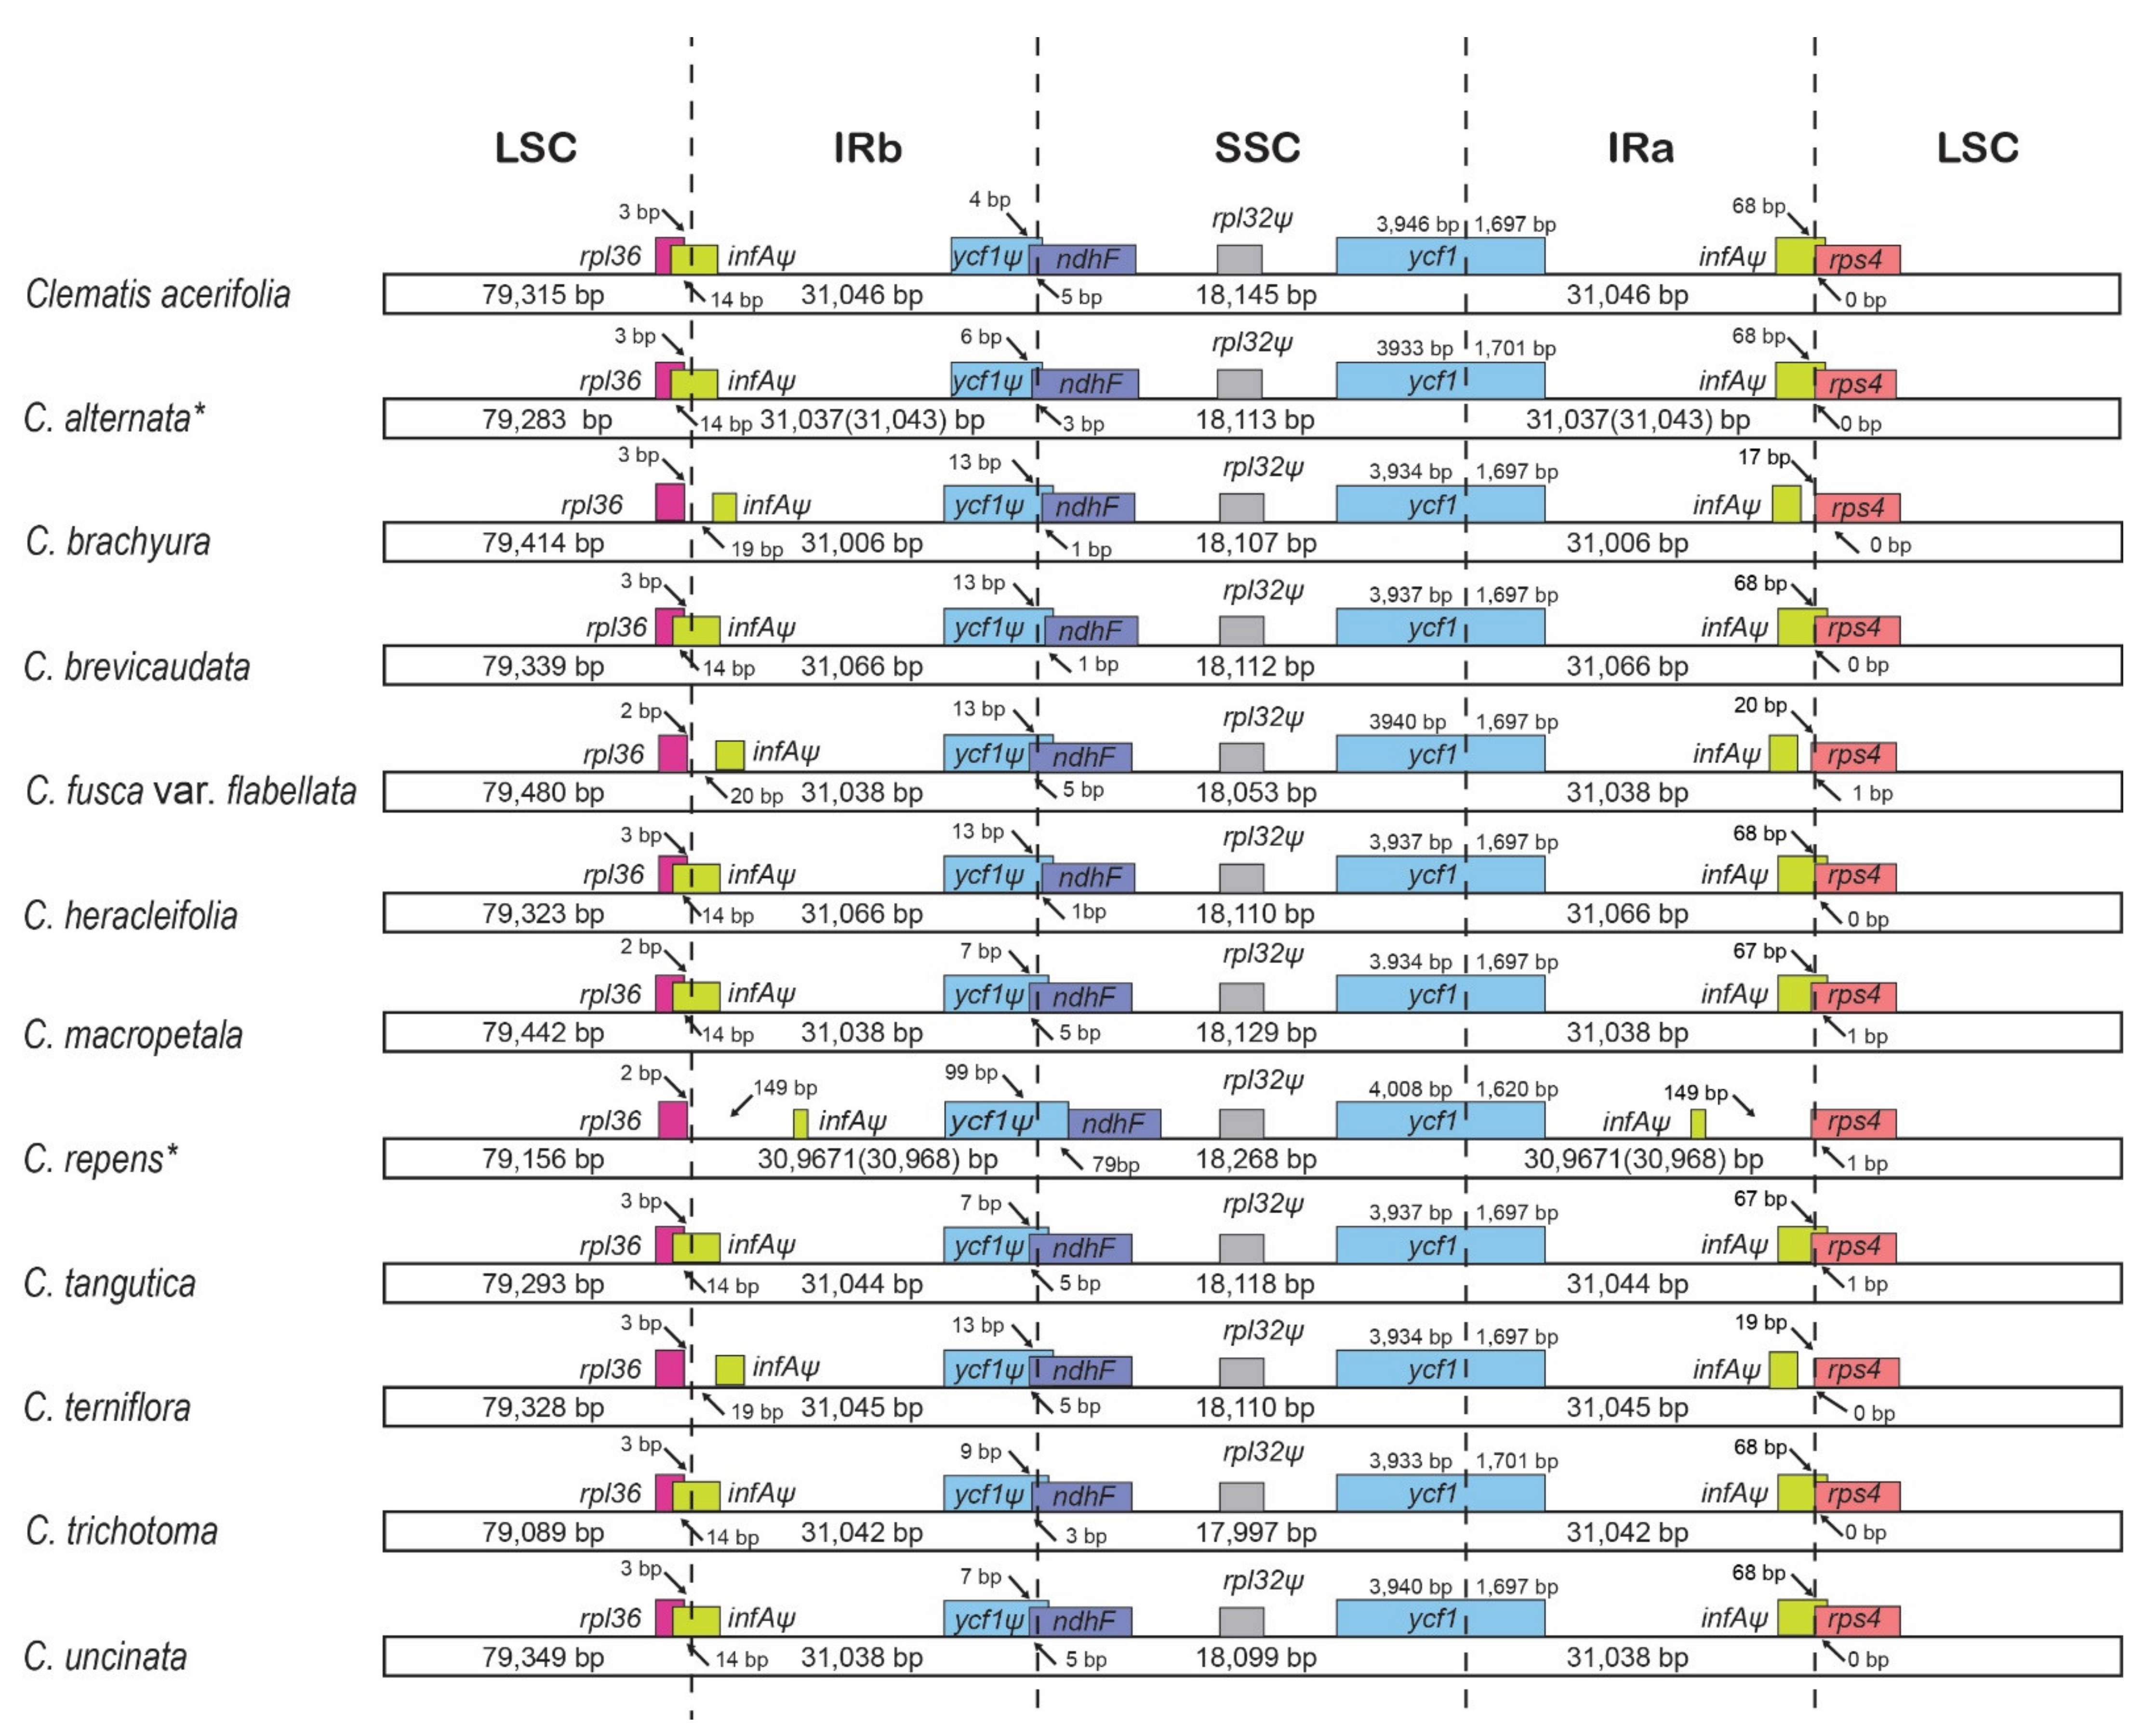
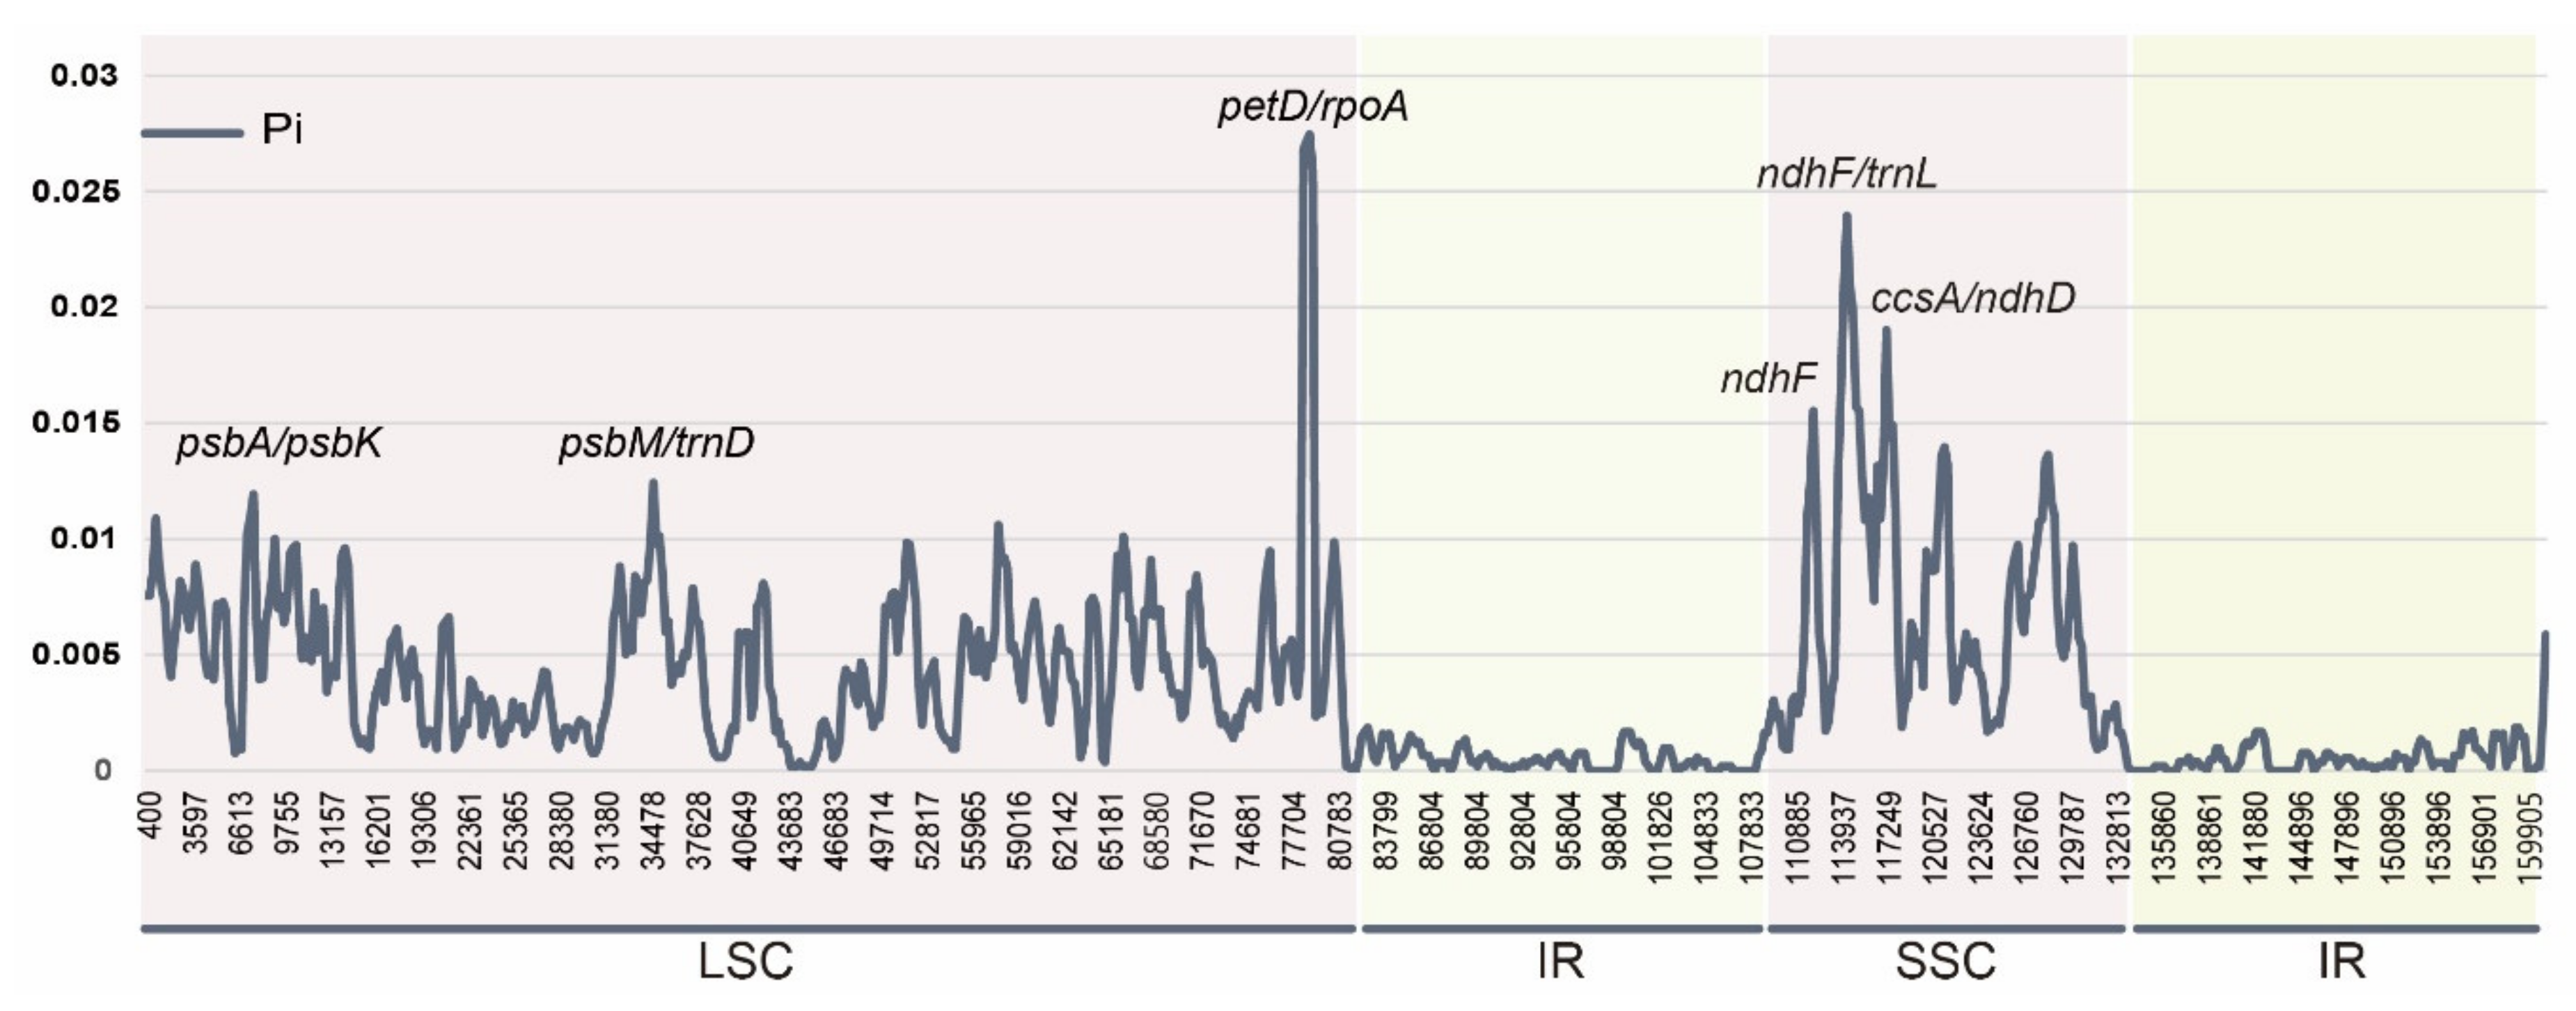
2.2. Comparative Analyses

The complete cp genome sequences of 12 Clematis species were plotted with mVISTA using the annotated C. brachyura cp genome as a reference (Figure 2). Based on the overall sequence identity indicated by the peaks and valleys among all 12 Clematis species, the results revealed that the LSC and SSC regions were divergent and the pairs of IR regions were highly conserved. Five non-coding regions (trnT-psbD, atpB-rbcL, psbE-petL, pet D-rpoA, and ccsA-ndhD) located in the SC regions were highly AT-rich and caused indels in C. trichotoma of more than 200 bp. High polymorphism was also observed in regions involved in pseudogenes (infAψ and rpl32ψ).
The IR and SC junctions of eight genes (including three kinds of pseudogenes) in 12 Clematis species were compared. The longest LSC was observed in C. flabellata (79,480), IR in C. heracleifolia (31,066), and SSC in C. repens (18,268) (Figure 3). Although protein-coding genes (rpl36, ndhF, ycf1, and rps4) showed less variation, non-functional pseudogenes revealed a high variation between species. In particular, the C. repens boundary was shown to be highly different from that of other plastomes.
The gene number and gene order were identical (Figure 3 and Table S1) in all 12 Clematis chloroplast genomes and the shared characteristics of two non-functional pseudogenes in chloroplasts (Figure 4). The pseudogenization events of infAψ and rpl32ψ in the chloroplast genomes of Clematis were caused by different mechanisms, such as the loss of part of the coding region and frameshift mutation, respectively. Compared to the complete (functional) infAψ gene of Helleborus, a 180bp deletion was identified in Clematis species (Figure 4a). The shortest was observed in C. repens at 42 bp, including 14 amino acids. The tail regions of infAψ in four species (C. brachyura, C. flabellata, C. loureiroana, and C. terniflora), which share short genes, occurred due to point mutations in AT-rich regions and short insertions. The alignment of rpl32ψ genes was also influenced by the AT-rich regions of the 160 bp region. Compared with complete Helleborus, the Clematis species, which have short-type rpl32ψ, suffered point mutations in the 90 bp region (Figure 4b).
The sliding window analysis conducted using DnaSP revealed highly variable regions in the 12 Clematis cp genomes (Figure 5). The average nucleotide diversity (Pi) over the entire cp genome was 0.00358, and four highly variable regions were identified based on a significantly higher Pi value of >0.015. The most variable region was the petD/ropA intergenic region with a Pi value of 0.02745. The alignment of the sequences of these regions detected distinctive variation between the four types (Figure S1). Polymorphism was detected in 12 species (C. acerifolia, C. repens, C. macropetala, C. brachyura, C. terniflora, C. uncinata, C. flabellata, C. alternata, C. loureiroana, and C. tangutica) due to substitution and short-region insertions/deletions. However, one group comprising three species (C. brevicaudata, C. heracleifolia, and C. trichotoma) showed a completely different sequence frame comprising approximately 100 bp. Other highly polymorphic sequences were located in psbApsbK and psbMtrnD in the LSC regions. The highly variable regions of SSC were two intergenic regions, ndhF/trnL-UAG (Pi = 0.0208) and ccsA/ndhD (Pi = 0.01901), and one genic region: ndhF (Pi = 0.01514).

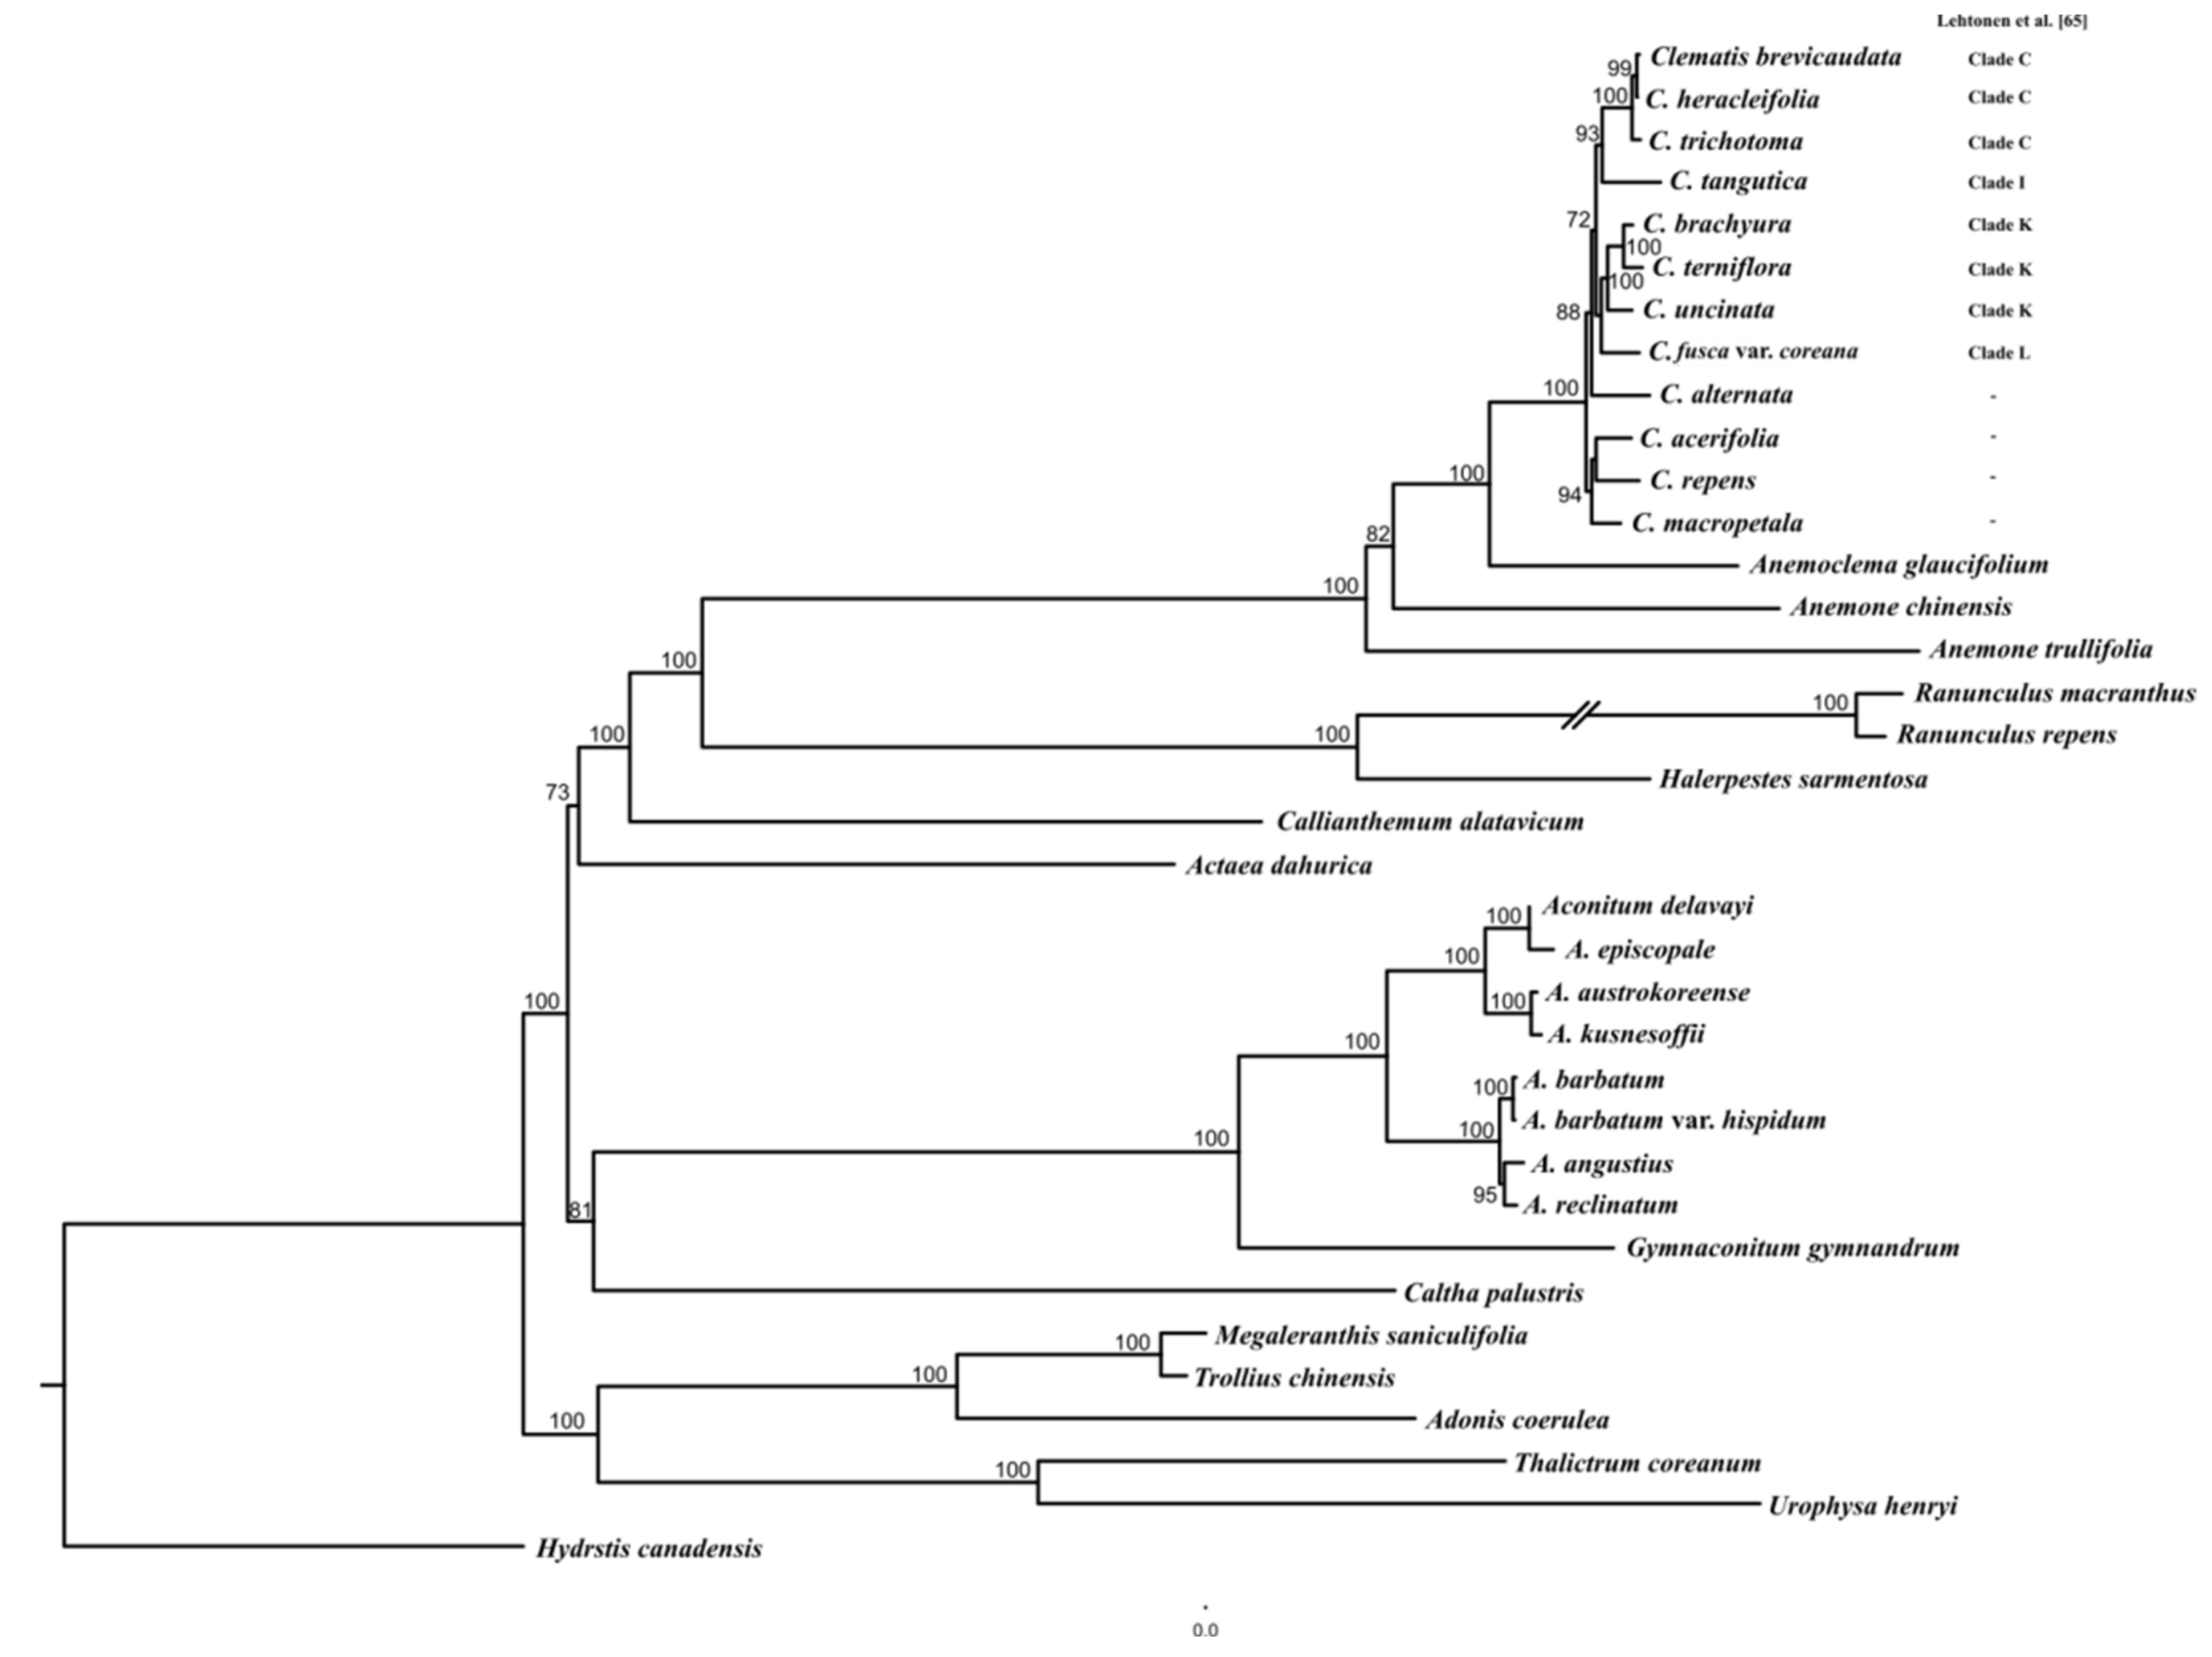
2.3. Phylogenetic Relationships Analysis

For phylogenetic analysis, 71 protein-coding genes (51,496 bp) were aligned from 36 Ranunculaceae cp genomes, including 12 Clematis (Figure 6, Table S2). The monophyly of the Anemoneae clade was highly supported (BS = 100) and the clade was closely related to the Ranunculus + Halerpestes clade. The Clematis clade is monophyletic, with high bootstrap support (BS = 100). The results of the present study confirmed that Clematis forms sister relationships with Anemoclema, Pulsatilla, and Anemone. The Korean endemic plants C. brachyura and C. terniflora formed one clade with high bootstrap support (BS = 100) and C. trichotoma is sister to C. heracleifolia and C. brevicaudata with high bootstrap support (BS = 100).

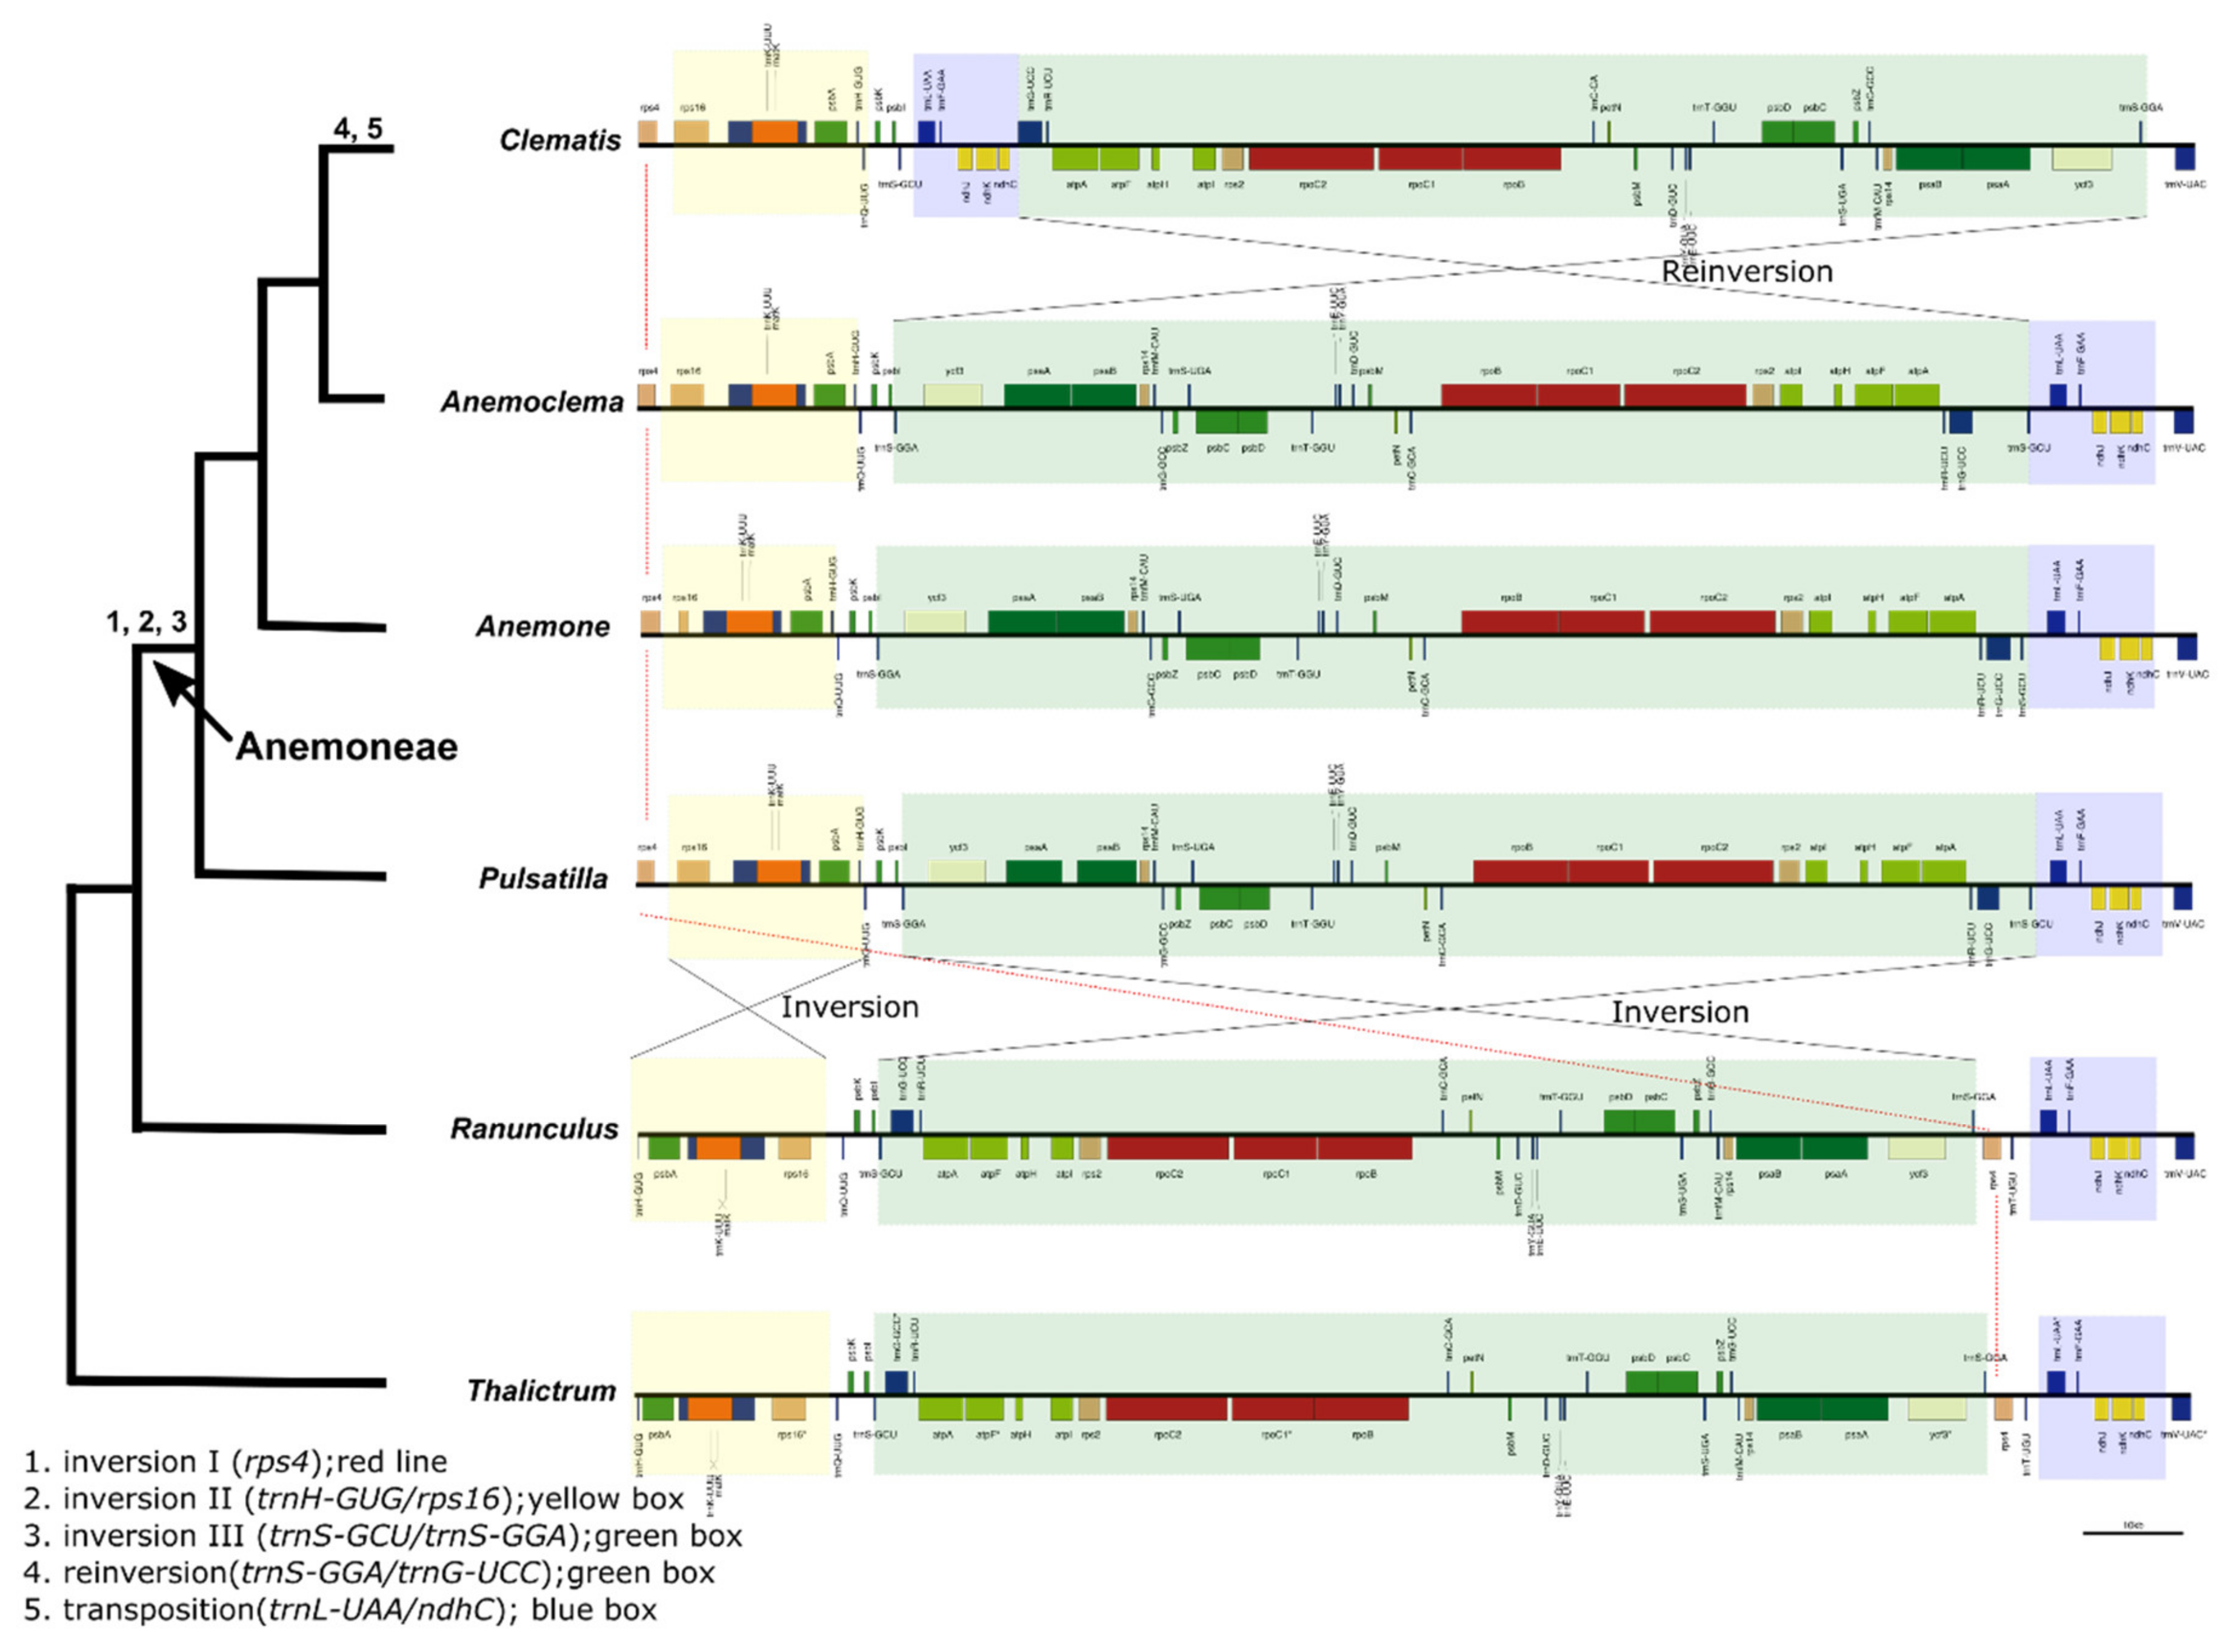
2.4. Intergeneric Genome Comparative Analyses

Clematis species have a well-conserved genomic structure and gene order (Table S1). Here, Clematis species were compared with other Ranunculaceae genomes to identify genome rearrangements for each genus. In the tribe Anemoneae (Pulsatilla, Anemone, Anemoclema, and Clematis), inversion occurred in the LSC region (Figure 7). In Anemoclema, Anemone, and Pulsatilla, there were three inversions (Inversion I, rps4; Inversion II, trnH-GUG/rps16; and Inversion III, trnS-GCU/trnS-GGA). However, Clematis has different rearrangements and repositions. Comparisons between Clematis and other Anemoneae (Anemoclema, Anemone, and Pulsatilla) showed that Clematis has the same two inversions (Inversion I, rps4; Inversion II, trnH-GUG/rps16), whereas Clematis has repositioning (trnL-UAA/ndhC) and reinversion (trnS-GGA/trnG-UCC), and the gene order of the region (trnS-GGA/trnG-UCC) was similar to that of Ranunculus and Thalictrum (Figure 7).
The Anemoneae species showed a pattern of IR expansion, with the majority of expansion occurring in the LSC region. This region contains rps4, rpl14, rpl16, rps3, rpl22, rps19, and rpl2.

2.5. Comparison of Substituion Rates of Genes among Clematis, Anemoneae, and Ranunculaceae

The nucleotide substitution rates were compared among Clematis, Anemoneae (excluding Clematis), and Ranunculaceae (Table S1). Seventy protein-coding genes were shared among 36 Ranunculaceae species. The average of synonymous substitution rates (dS) in the LSC, IR, and SSC genes of Anemoneae and Clematis were significantly higher than those of Ranunculaceae (p < 0.05), whereas the average of nonsynonymous substitution rates (dN) in the LSC, IR, and SSC genes of Anemoneae and Clematis were not significantly different (Figure 8).
The comparison of dS among cp genes showed that 34 genes and 11 genes in Clematis species were significantly higher than those in Ranunculaceae and Anemoneae, respectively (p < 0.05). Seventeen genes in Anemoneae had significantly higher dS values than in Ranunculaceae. Among the 70 plastid coding genes, 14 genes (atpE, atpH, atpI, cemA, ndhJ, petA, petB, psbD, psbN, rpl36, rps7, rps11, rps18, and ycf3) of the Anemoneae and Clematis species had significantly higher dS than other Ranunculaceae species (p < 0.05) (Figure S2 and Table S3).
In Clematis, the dN for 25 genes was significantly higher than that of Ranunculaceae, and seven genes were significantly higher than those in Anemoneae species (p < 0.05). Thirteen genes (matK, ndhC, ndhD, ndhF, ndhH, petA, psbK, rpl2, rpl36, rpoC1, rpoC2, rps11, and rps14) of Anemoneae and Clematis had significantly higher dN than the other Ranunculaceae species (p < 0.05) (Figure S2 and Table S3).
To comprehensively examine the substitution rate of seven directly engaged genes in IR expansion and contraction, this study used seven genes distributed in IR-SC partial junctions (type A: Anemoneae; type B: Ranunculaceae without Anemoneae) (Figure 9). This analysis excluded the rps19 gene because of its inconsistent location among the examined taxa. The rpl2 gene, which was consistently located in the IR region, was used as a control condition, with the dS value being the lowest. The junction-localized gene rpl22 had the highest dS value compared with the other genes (Figure 9). The dS value of rps8 in type B was higher than that of rps8 in type A (p < 0.05). Similarly, the dS values of rpl14 and rpl16 in type B were significantly higher than those in type A (p < 0.01). However, the rps3 and rpl2 genes did not show a distinct difference between types A and B. The dN of SC to the IR-shifted rpl14 and rpl16 genes in type A were higher than those of rpl14 and rpl16 in type B. However, the rps3 and rpl22 genes in type A were higher than those in Type B (Figure 9).

3. Discussion

Clematis contains well-recognized economical and horticultural species that are globally distributed [54]. In East Asia, there are 147 species (93 endemic) in China [55], 29 species (13 endemic) in Japan [56], and 22 species (4 endemic) on the Korean peninsula [52,57]. In the present study, we characterized the cp genomes of two Korean endemic Clematis species (C. brachyura and C. trichotoma) and compared them with those of related species in Ranunculaceae (Figure 1; Table S1). Contrary to the theory of a conserved typical structures in the cp genome [5,22], structural variation was revealed in Clematis. Zhai et al. [25] found that Clematis had experienced four rearrangements compared with Coptis, which is an ancestral condition in Ranunculaceae and has a typical chloroplast structure. These inversions were indicated by short dispersed repeats or tRNAs, which play a role in promoting gene order changes by nonhomologous recombination [58]. Comparisons among Clematis species showed the largest genome size in C. acerifolia (159,552 bp) and the smallest in C. macropetala (159,647 bp). A pair of IRs exceeded 30,000 bp in all Clematis genomes, which was confirmed to be caused by six/seven genes introduced from the LSC. A pair of infA and rpl32 genes was identified as pseudogenes (Table S1 and Figure 4). A pseudogenized event has been reported in Ranunculaceae and is inferred to involve genes from cp that lost their function after intercellular gene transfer to the nucleus [5]. After pseudogenization, the infA and rpl32 genes suffered frameshift mutations and substitutions/deletions [33].
As for nonfunctional infA and rpl32 in Clematis, notably we found two types that were different in length (Figure 4). To the best of our knowledge, this finding has not been discussed in previous studies, which might have been insufficient, given the availability of whole cp genomes [25]. The infA gene is known to be transcribed as polycistronic mRNA and is a constituent of the ribosomal protein (rpl23) operon [59], whereas rpl32 plays a role in the ribosome structure. According to Millen et al. [60], the gene loss (e.g., pseudogenization) of infA independently occurred several times during evolution and might have been derived from the translocation of the gene to the nucleus. Similarly, the absence of the rpl32 gene was identified in Thalictroideae (including Aquilegia, Enemion, Isopyrum, Leptopyrum, Paraquilegia, Semiaquilegia, and Thalictrum) [33]. Additionally, the transfer of rpl32 to the nucleus has been reported in angiosperms [33]. However, there is no evidence for the transfer of infA and rpl32 from the cp genome to the nuclear genome in Clematis. Further studies on the transcriptomes of these two genes should be conducted to clarify the effects of length variation in Clematis.
The interspecies comparisons based on mVISTA (Figure 2) and nucleotide diversity (Figure 5) showed that the highly variable (low identity) region was mainly distributed in the SC regions compared with the IR region. Most highly variable regions were identified near the SC-IR junctions of intergenic spacers of petD/rpoA in LSC and ndhF/trnL in the SSC region. Notably, the highest nucleotide diversity (Pi = 0.02745) was found in the region petD/rpoA and showed highly distinct variation (Figure S1). Unlike the rest of the species, three species (C. brevicaudata, C. heracleifolia, and C. trichotoma) shared entirely different sequences comprising approximately 90 bp. C. trichotoma, a species endemic to South Korea, had the shortest length of inclusion compared with the other two species (C. brevicaudata and C. heracleifolia). This unique polymorphism might be the result of isolation from a common ancestor and a distinct differentiated lineage [61]. Although additional studies using comprehensive species are needed, this result suggests that the petD/rpoA region can be applied as a useful tool in phylogenetic inference or to study evolutionary history. The analysis of the endpoint in single-copy (SC) and IR regions is important because their length variation is caused by expansion and/or contraction [8]. The junction boundary results showed that functional groups (rpl36, ndhF, ycf1, and rps4) have similar tendencies, except for pseudogenized gene groups (infAψ and ycf1ψ). However, the junction endpoint (e.g., petD/rpoA and ndhF/trnL) was revealed to be over 70% AT-rich with various poly A sequences, and this poly-A region might play an important role in IR expansion or trigger variation [62]. In addition to AT-rich and dispersed repeats, substitution rates are also related to IR expansion [14,63,64,65].
Previous phylogenetic studies of Clematis were based on a few molecular markers. Xie et al. [32] showed that Clematis divided 10 clades based on the sampling of about 75 Clematis species using nr ITS and three chloroplast markers (atpB-rbcL, psbA-trnH-trnQ, and rpoB-trnC regions). However, this study did not include C. trichotoma. Lehtonen et al. [53] sampled 194 species which include C. brachyura and C. trichotoma. Lehtonene et al. [53] suggested that phylogeny divided genus Clematis into 12 clades ed, and C. brachyra and C. trichotoma were placed as clade C and clade K, respectively. This study showed C. brachyura was closely related to C. terniflora, which was also placed in clade C by a previous study [53]. The C. trichotoma was sister to C. heracleifolia and C. brevicaudata. Three species were placed in clade K by a previous study [53]. Thus, our results supported the relationship of genus Clematis by Lehtonene et al. [53].
Conformational changes in cp genomes (e.g., inversion, extension, contraction, and rearrangement) are major issues [66,67]. Previous studies have shown that Clematis and Anemone species have multiple inversions and transpositions that include many genes in the LSC region (Figure 7) [36,40]. However, these studies did not analyze the substitution rates. In the case of Geraniaceae, Weng et al. [68] suggested that plastid genome rearrangement was correlated with acceleration in dN. Most inversions in Clematis and Anemoneae occurred in the LSC region. Our data showed that the average dS in Anemoneae and Clematis LSC genes were significantly higher than that of Ranunculus LSC genes, whereas the dN was not significantly different. Weng et al. [68] suggested plastid genome rearrangements are correlated with the acceleration of dN. However, these were not the same as previously reported trends.
Anemoneae, including Clematis, experienced IR expansion from six or seven protein-coding genes, which are usually located in the LSC region [25]. A similar case was also reported in Tetracentron and Trochodendron (Trochodendraceae) [69], of which five protein-coding genes (rps8, rpl14, rpl16, rps3, and rpl22) have shifted to IR regions. It was suggested that a pair of IR regions increased genetic stability (repair/maintenance efficiency) and thus played a role in the stability of genes positioned in IR as compared to SC regions. However, other studies have reported that IR does not contribute to genome stability in several genera (Pelargonium, [15]; Erodium, [24]; Plantago, [14]). Our results showed that the genes located in the IR regions had relatively low dS values; type A genes that experienced expansion of IR did not follow this trend (Figure 8). In other words, the expansion in Clematis did not support the hypothesis of the involvement of the IR regions in stability. It had reduced he DtNA repair/maintenance efficiency in the cp genome, which increased destabilization accompanied by recombination and substitution [15]. A distinct tendency was not confirmed in the dS values of the six genes in the extended region. Our results hypothesized that the dS of IR expansion is lower than that of the SC region, and the estimated value will reveal the increase/decrease direction. The dS (rps8, rpl14, and rpl16) values were consistent with expectations; however, two genes (rps3 and rpl22) were found to be the same as type B or higher (Figure 8). These genes have experienced evolutionary history without direction, such as the locus-specific, IR-independent effects [15] shown in legumes [16], Silene [70], and Pelargonium [15].
The results of the present study enlarged the genomic data of endemic species on the Korean Peninsula. In particular, Clematis species have IR expansion and structural mutations among intergenic species. The IR structural variation provides valuable insight into the evolutionary history of cp genomes in Ranunculaceae. In addition, phylogenetic analysis and discovery of divergence hotspots revealed fundamental data for understanding the relationships among the genera and species of Ranunculaceae.

4. Materials and Methods

4.1. Taxon Sampling, DNA Extraction, Chloroplast Genome Sequencing, and Characterization

Fresh young leaves of C. brachyura and C. trichotoma were collected from wild individuals. Voucher specimens of two Clematis accessions were deposited in the Herbarium of the Korea National Arboretum (KH). Total genomic DNA was isolated using the DNeasy Plant Mini Kit (Qiagen Inc., Valencia, CA, USA). The quality of genomic DNA was measured using Nano Drop 2000 (Thermo Fisher Inc., Waltham, MA, USA), and quantity was checked using 1% agarose gel. Illumina paired-end libraries were constructed and sequenced on the MiSeq platform by Macrogen Inc. (Seoul, South Korea). A total of 8,572,072 and 7,505,088 reads of the 301-bp paired-end sequence (550 insert size) were generated from the sequencing libraries of C. brachyura and C. trichotoma, respectively. All the paired-end reads of each species were assembled de novo into draft contigs using Velvet v. 1.2.03 [71]. Thereafter, contigs were assembled into a circular complete genome with the reference genome of C. terniflora (NC_028000) using Geneious v. 10.2.2 [72]. Protein coding genes and rRNA genes were identified using the Dual Organellar GenMe Annotator [73] and tRNA genes were identified using tRNAscan-SE 2.0 [74]. The gene region and protein coding sequences were manually adjusted using Geneious v. 10.2.2 [72]. Two Clematis circular cp genome maps were drawn using OGDRAW [75].

4.2. Interspecific Genome Comparative Analyses

The complete cp genomes of C. brachyura and C. trichotoma from this study and cp genomes of 10 other Clematis species from GenBank were compared using mVISTA [76,77] with the LAGAN alignment program [78]. To compare the cp genomes of 12 Clematis species, the C. brachyuran cp genome was used as a reference. Major variations in the gene content or features of Clematis cp genomes were manually identified using Geneious v. 10.2.2 [72]. For accurate genome comparison, the gene annotation of 10 Clematis species was performed again with BLASTN, BLASTX, and tRNAscan-SE [74].
A DNA polymorphism analysis was performed using DNA Sequence Polymorphism (DnaSP) v6 [79] to calculate the nucleotide diversity (Pi) and to identify highly variable sites among Clematis cp genomes. Cp genome sequences were aligned using MAFFT implemented in Geneious v. 10.2.2 [72,80]. In the DNA polymorphism analysis, the window length was set to 800 bp and the step size was set to 200 bp.

4.3. Phylogenetic Analysis

In the phylogenetic reconstruction of the core Ranunculaceae group, 12 Clematis species, including two from this study, and a total of 17 genera and 36 taxa of Ranunculaceae were included (Table S2). The cp genome of Hydrastis canadensis (KY085918) from GenBank was used as the outgroup because Hydrastis (Hydrastideae) is one of the most basal lineages of Ranunculaceae and has a sister relationship with the core Ranunculaceae and Coptideae [25]. The phylogenetic analysis data matrix was constructed using 76 commonly shared protein-coding genes from 36 Ranunculaceae cp genomes. Protein-coding genes were extracted and aligned using MAFFT [80]. Aligned protein-coding genes were concatenated using Geneious [72]. The program jModelTest 2 was employed to determine the optimal substitution model [81]. Maximum likelihood (ML) analyses were performed using RAxML v7.4.2, with 1000 bootstrap replicates using the selected best-fitting model: the GRT + I + G model [82].

4.4. Substitution Rate Estimation

Seventy protein-coding genes shared by 36 Ranunculaceae species (including 12 Clematis species) were extracted and aligned using MAFFT [80] (Table S2). Phylogenetic analysis was performed using the ML method on RaxML [82]. To estimate the rates of nucleotide substitution, nonsynonymous and synonymous rates were calculated in PAML v.4.8 [83] using the CODEML option employing the F3 × 4 codon frequency model, and gapped regions were excluded with the “cleandata = 1” option. Rate estimations were performed on the following datasets: (1) concatenated genes for LSC, SSC, IR, and five genes (rps8, rpl14, rpl16, rps3, and rpl22) that are located in LSC or IR among Anemoneae (excluding Clematis), Clematis, and other Ranunculaceae species. (2) All the individual genes from plastid genes among Anemoneae (excluding Clematis), Clematis, and other Ranunculaceae species. (3) The five genes (rps8, rpl14, rpl16, rps3, and rpl22) that are located in LSC or IR between Anemoneae (including Clematis) and other Ranunculaceae species. Statistical analyses were conducted using R v. 3.4.2, and Bonferroni correction for comparison was applied.

5. Conclusions

In this study, the cp genomes of two Korean endemic species (C. brachyura and C. trichotoma) were assembled. As for angiosperms, the cp genome size, structure, and gene contents were highly conserved. However, this study demonstrates that infA and rpl32 genes in Clematis were inferred to be pseudogenes. In addition, two inversions, reposition, and IR expansion were detected in the genus Clematis. The phylogenetic analyses of the genus Clematis are monophyletic, with 100% bootstrap values. C. brachyura and C. terniflora formed a clade with 100% bootstrap values and C. trichotoma was placed as a sister to C. heracleifolia and C. brevicaudata with 100% bootstrap values, which supports a previous phylogenetic study [66]. The comparative analysis of Clematis cp genes showed several variation hotspots. The IR expansions and rearrangements of the Clematis cp genome are not correlated with the acceleration in substitution rates. This study could be used for phylogenetic studies in Clematis and whole cp genome comparison.

Supplementary Materials

The following are available online at https://0-www-mdpi-com.brum.beds.ac.uk/2223-7747/10/2/397/s1: Figure S1: Alignment of petD/rpoA region from 12 Clematis species. Figure S2: Substitution rate value (dS, dN) of 70 protein-coding genes from Anemoneae, Clematis, and Ranunculaceae. Table S1: Summary of the chloroplast genomes of Clematis species used in this study. LSC, large single copy; SSC, small single copy; IR, inverted repeat. Table S2: Accession numbers for species included in the phylogenetic and substitution rates analysis. Table S3: Comparison of substitution rates of chloroplast genes among Clematis, Anemoneae and Ranunculaceae species.

Author Contributions

Conceptualization: K.S.C. and K.C.; methodology: K.S.C. and Y.-H.H.; software, K.S.C. and Y.-H.H.; formal analysis, K.S.C., Y.-H.H., and H.-Y.G.; writing—original draft preparation, K.S.C. and Y.-H.H.; writing—review and editing, K.S.C., Y.-H.H., H.-Y.G., and D.-K.K.; visualization, K.S.C., Y.-H.H., and H.-Y.G.; supervision, S.-H.O.: project administration, D.-K.K., and S.-H.O.: funding acquisition, K.C., D.-K.K., and S.-H.O. All authors have read and agreed to the published version of the manuscript.

Funding

This research was funded by grants from Scientific Research (KNA1-1-13, 14–1) of the Korea National Arboretum.

Institutional Review Board Statement

Not applicable.

Informed Consent Statement

Not applicable.

Data Availability Statement

The data presented in this study are openly available in GenBank.

Acknowledgments

We thank Jungsim Lee, Keum Seon Jeong, Dong-Keun Yi, and Minjung Joo for sampling and laboratory assistance throughout the project.

Conflicts of Interest

The authors declare no conflict of interest.

References

  1. Mardis, E.R. DNA sequencing technologies: 2006–2016. Nat. Protoc. 2017, 12, 213–218. [Google Scholar] [CrossRef] [PubMed]
  2. Zhu, T.; Wang, L.; You, F.M.; Rodriguez, J.C.; Deal, K.R.; Chen, L.; Li, J.; Chakraborty, S.; Balan, B.; Jiang, C.-Z. Sequencing a Juglans regia × J. microcarpa hybrid yields high-quality genome assemblies of parental species. Hortic. Res. 2019, 6, 55. [Google Scholar] [CrossRef] [Green Version]
  3. Ha, Y.-H.; Kim, C.; Choi, K.; Kim, J.-H. Molecular phylogeny and dating of Forsythieae (Oleaceae) provide insight into the Miocene history of Eurasian temperate shrubs. Front. Plant Sci. 2018, 9, 99. [Google Scholar] [CrossRef] [Green Version]
  4. Velasco, R.; Zharkikh, A.; Affourtit, J.; Dhingra, A.; Cestaro, A.; Kalyanaraman, A.; Fontana, P.; Bhatnagar, S.K.; Troggio, M.; Pruss, D. The genome of the domesticated apple (Malus × domestica Borkh.). Nat. Genet. 2010, 42, 833–839. [Google Scholar] [CrossRef] [PubMed]
  5. Park, S.; An, B.; Park, S. Recurrent gene duplication in the angiosperm tribe Delphinieae (Ranunculaceae) inferred from intracellular gene transfer events and heteroplasmic mutations in the plastid matK gene. Sci. Rep. 2020, 10, 2720. [Google Scholar] [CrossRef] [PubMed] [Green Version]
  6. Howe, C.J.; Barbrook, A.C.; Koumandou, V.L.; Nisbet, R.E.R.; Symington, H.A.; Wightman, T.F. Evolution of the chloroplast genome. Philos. Trans. R. Soc. London Ser. B Biol. Sci. 2003, 358, 99–107. [Google Scholar] [CrossRef] [Green Version]
  7. Sugiura, M. The chloroplast genome. In 10 Years Plant Molecular Biology; Schilperoort, R.A., Dure, L., Eds.; Springer: Dordrecht, the Netherlands, 1992; pp. 149–168. [Google Scholar]
  8. Wicke, S.; Schneeweiss, G.M.; Depamphilis, C.W.; Müller, K.F.; Quandt, D. The evolution of the plastid chromosome in land plants: Gene content, gene order, gene function. Plant Mol. Biol. 2011, 76, 273–297. [Google Scholar] [CrossRef] [PubMed] [Green Version]
  9. Funk, H.T.; Berg, S.; Krupinska, K.; Maier, U.G.; Krause, K. Complete DNA sequences of the plastid genomes of two parasitic flowering plant species, Cuscuta reflexa and Cuscuta gronovii. BMC Plant Biol. 2007, 7, 45. [Google Scholar] [CrossRef] [PubMed] [Green Version]
  10. Wicke, S.; Müller, K.F.; de Pamphilis, C.W.; Quandt, D.; Wickett, N.J.; Zhang, Y.; Renner, S.S.; Schneeweiss, G.M. Mechanisms of functional and physical genome reduction in photosynthetic and nonphotosynthetic parasitic plants of the broomrape family. Plant Cell 2013, 25, 3711–3725. [Google Scholar] [CrossRef] [Green Version]
  11. Saski, C.; Lee, S.-B.; Daniell, H.; Wood, T.C.; Tomkins, J.; Kim, H.-G.; Jansen, R.K. Complete chloroplast genome sequence of Glycine max and comparative analyses with other legume genomes. Plant Mol. Biol. 2005, 59, 309–322. [Google Scholar] [CrossRef]
  12. Schwarz, E.N.; Ruhlman, T.A.; Sabir, J.S.M.; Hajrah, N.H.; Alharbi, N.S.; Al-Malki, A.L.; Bailey, C.D.; Jansen, R.K. Plastid genome sequences of legumes reveal parallel inversions and multiple losses of rps16 in papilionoids. J. Syst. Evol. 2015, 53, 458–468. [Google Scholar] [CrossRef]
  13. Dugas, D.V.; Hernandez, D.; Koenen, E.J.M.; Schwarz, E.; Straub, S.; Hughes, C.E.; Jansen, R.K.; Nageswara-Rao, M.; Staats, M.; Trujillo, J.T. Mimosoid legume plastome evolution: IR expansion, tandem repeat expansions, and accelerated rate of evolution in clpP. Sci. Rep. 2015, 5, 16958. [Google Scholar] [CrossRef] [Green Version]
  14. Zhu, A.; Guo, W.; Gupta, S.; Fan, W.; Mower, J.P. Evolutionary dynamics of the plastid inverted repeat: The effects of expansion, contraction, and loss on substitution rates. New Phytol. 2016, 209, 1747–1756. [Google Scholar] [CrossRef] [Green Version]
  15. Weng, M.L.; Ruhlman, T.A.; Jansen, R.K. Expansion of inverted repeat does not decrease substitution rates in Pelargonium plastid genomes. New Phytol. 2017, 214, 842–851. [Google Scholar] [CrossRef] [Green Version]
  16. Magee, A.M.; Aspinall, S.; Rice, D.W.; Cusack, B.P.; Sémon, M.; Perry, A.S.; Stefanović, S.; Milbourne, D.; Barth, S.; Palmer, J.D. Localized hypermutation and associated gene losses in legume chloroplast genomes. Genome Res. 2010, 20, 1700–1710. [Google Scholar] [CrossRef] [PubMed] [Green Version]
  17. Knox, E.B. The dynamic history of plastid genomes in the Campanulaceae sensu lato is unique among angiosperms. Proc. Natl. Acad. Sci. USA 2014, 111, 11097–11102. [Google Scholar] [CrossRef] [PubMed] [Green Version]
  18. Yi, D.-K.; Lee, H.-L.; Sun, B.-Y.; Chung, M.Y.; Kim, K.-J. The complete chloroplast DNA sequence of Eleutherococcus senticosus (Araliaceae); comparative evolutionary analyses with other three asterids. Mol. Cells 2012, 33, 497–508. [Google Scholar] [CrossRef] [Green Version]
  19. Hirao, T.; Watanabe, A.; Kurita, M.; Kondo, T.; Takata, K. Complete nucleotide sequence of the Cryptomeria japonica D. Don. chloroplast genome and comparative chloroplast genomics: Diversified genomic structure of coniferous species. BMC Plant Biol. 2008, 8, 70. [Google Scholar] [CrossRef] [Green Version]
  20. Chumley, T.W.; Palmer, J.D.; Mower, J.P.; Fourcade, H.M.; Calie, P.J.; Boore, J.L.; Jansen, R.K. The complete chloroplast genome sequence of Pelargonium × hortorum: Organization and evolution of the largest and most highly rearranged chloroplast genome of land plants. Mol. Biol. Evol. 2006, 23, 2175–2190. [Google Scholar] [CrossRef] [PubMed]
  21. Ma, J.; Yang, B.; Zhu, W.; Sun, L.; Tian, J.; Wang, X. The complete chloroplast genome sequence of Mahonia bealei (Berberidaceae) reveals a significant expansion of the inverted repeat and phylogenetic relationship with other angiosperms. Gene 2013, 528, 120–131. [Google Scholar] [CrossRef] [PubMed]
  22. Sinn, B.T.; Sedmak, D.D.; Kelly, L.M.; Freudenstein, J.V. Total duplication of the small single copy region in the angiosperm plastome: Rearrangement and inverted repeat instability in Asarum. Am. J. Bot. 2018, 105, 71–84. [Google Scholar] [CrossRef] [Green Version]
  23. Downie, S.R.; Palmer, J.D. Use of chloroplast DNA rearrangements in reconstructing plant phylogeny. In Molecular Systematics of Plants; Soltis, P.S., Soltis, D.E., Doyle, J.J., Eds.; Springer: Boston, MA, USA, 1992; pp. 14–35. [Google Scholar]
  24. Blazier, J.C.; Jansen, R.K.; Mower, J.P.; Govindu, M.; Zhang, J.; Weng, M.-L.; Ruhlman, T.A. Variable presence of the inverted repeat and plastome stability in Erodium. Ann. Bot. 2016, 117, 1209–1220. [Google Scholar] [CrossRef] [Green Version]
  25. Zhai, W.; Duan, X.; Zhang, R.; Guo, C.; Li, L.; Xu, G.; Shan, H.; Kong, H.; Ren, Y. Chloroplast genomic data provide new and robust insights into the phylogeny and evolution of the Ranunculaceae. Mol. Phylogenet. Evol. 2019, 135, 12–21. [Google Scholar] [CrossRef]
  26. Tamura, M. Angiospermae: Ordnung Ranunculales, Fam. Ranunculaceae. In Die Natürlichen Pflanzenfamilien; Hiepko, P., Ed.; Duncker and Humblot: Berlin, Germany, 1995; Volume 17, pp. 324–349. [Google Scholar]
  27. Emadzade, K.; Lehnebach, C.; Lockhart, P.; Hörandl, E. A molecular phylogeny, morphology and classification of genera of Ranunculeae (Ranunculaceae). Taxon 2010, 59, 809–828. [Google Scholar] [CrossRef]
  28. Cossard, G.; Sannier, J.; Sauquet, H.; Damerval, C.; de Craene, L.R.; Jabbour, F.; Nadot, S. Subfamilial and tribal relationships of Ranunculaceae: Evidence from eight molecular markers. Plant Syst. Evol. 2016, 302, 419–431. [Google Scholar] [CrossRef]
  29. Gregory, W.C. Phylogenetic and cytological studies in the Ranunculaceae Juss. Trans. Am. Philos. Soc. 1941, 31, 443–521. [Google Scholar] [CrossRef]
  30. Hutchinson, J. Contributions towards a phylogenetic classification of flowering plants. Bull. Misc. Inf. 1923, 9, 65–89. [Google Scholar]
  31. Xie, L.; Wen, J.; Li, L.; Xie, L.; Wen, J.; Li, L. Phylogenetic analyses of Clematis (Ranunculaceae) based on sequences of nuclear ribosomal ITS and three plastid regions. Syst. Bot. 2011, 36, 907–921. [Google Scholar] [CrossRef]
  32. Park, S.; Jansen, R.K.; Park, S. Complete plastome sequence of Thalictrum coreanum (Ranunculaceae) and transfer of the rpl32 gene to the nucleus in the ancestor of the subfamily Thalictroideae. BMC Plant Biol. 2015, 15, 40. [Google Scholar] [CrossRef] [PubMed] [Green Version]
  33. Chen, X.; Li, Q.; Li, Y.; Qian, J.; Han, J. Chloroplast genome of Aconitum barbatum var. puberulum (Ranunculaceae) derived from CCS reads using the PacBio RS platform. Front. Plant Sci. 2015, 6, 42. [Google Scholar] [CrossRef] [Green Version]
  34. Kong, H.; Liu, W.; Yao, G.; Gong, W. A comparison of chloroplast genome sequences in Aconitum (Ranunculaceae): A traditional herbal medicinal genus. Peer J. 2017, 5, e4018. [Google Scholar] [CrossRef] [Green Version]
  35. Park, S.; Park, S. Large-scale phylogenomics reveals ancient introgression in Asian Hepatica and new insights into the origin of the insular endemic Hepatica maxima. Sci. Rep. 2020, 10, 16288. [Google Scholar] [CrossRef] [PubMed]
  36. Zhang, T.; Xing, Y.; Xu, L.; Bao, G.; Zhan, Z.; Yang, Y.; Wang, J. Comparative analysis of the complete chloroplast genome sequences of six species of Pulsatilla Miller, Ranunculaceae. Chin. Med. 2019, 14, 53. [Google Scholar] [CrossRef] [PubMed] [Green Version]
  37. Li, M.; Yang, B.; Chen, Q.; Zhu, W.; Ma, J.; Tian, J. The complete chloroplast genome sequence of Clematis terniflora DC. (Ranunculaceae). Mitochondr. DNA A 2016, 27, 2470–2472. [Google Scholar] [CrossRef] [PubMed]
  38. Park, K.T.; Park, S. Complete chloroplast genome of Clematis fusca var. coreana (Ranunculaceae). Mitochondr. DNA A 2016, 27, 4056–4058. [Google Scholar] [CrossRef] [PubMed]
  39. Liu, H.; He, J.; Ding, C.; Lyu, R.; Pei, L.; Cheng, J.; Xie, L. Comparative analysis of complete chloroplast genomes of Anemoclema, Anemone, Pulsatilla, and Hepatica revealing structural variations among genera in tribe Anemoneae (Ranunculaceae). Front. Plant Sci. 2018, 9, 1097. [Google Scholar] [CrossRef] [Green Version]
  40. He, J.; Yao, M.; Lyu, R.-D.; Lin, L.-L.; Liu, H.-J.; Pei, L.-Y.; Yan, S.-X.; Xie, L.; Cheng, J. Structural variation of the complete chloroplast genome and plastid phylogenomics of the genus Asteropyrum (Ranunculaceae). Sci. Rep. 2019, 9, 15285. [Google Scholar] [CrossRef] [PubMed] [Green Version]
  41. Liang, X.; Chen, L.; Song, L.; Fei, W.; He, M.; He, C.; Yin, Z. Diterpenoid alkaloids from the root of Aconitum sinchiangense WT Wang with their antitumor and antibacterial activities. Nat. Prod. Res. 2017, 31, 2016–2023. [Google Scholar] [CrossRef]
  42. Park, I.; Kim, W.; Yang, S.; Yeo, S.-M.; Li, H.; Moon, B.C. The complete chloroplast genome sequence of Aconitum coreanum and Aconitum carmichaelii and comparative analysis with other Aconitum species. PLoS ONE 2017, 12, e0184257. [Google Scholar] [CrossRef] [Green Version]
  43. Chaudhary, M.I.; Qing, H.; Xiao, P.G.; Cheng, Y. Clematis huchouensis T AMURA: A traditional Chinese herbal medicine and its quality control using a high performance liquid chromatography technique. Biol. Pharm. Bull. 2007, 30, 165–168. [Google Scholar] [CrossRef] [PubMed] [Green Version]
  44. Yan, S.; Wang, P.; He, S.; Liu, B.; Li, Y. Ornamental characters of plants of Clematis L. from Henan and their utilization. Henan Sci. 2005, 23, 218–220. [Google Scholar]
  45. Bender, S. Clematis. In The Southern Living Garden Book; Bender, S., Ed.; Southern Living Magazine: Birmingham, AL, USA, 2004; pp. 0–250. [Google Scholar]
  46. Wen-Tsai, W.; Lei, X.I.E. A revision of Clematis sect. Tubulosae (Ranunculaceae). J. Syst. Evol. 2006, 45, 425–457. [Google Scholar]
  47. Jiang, N.; Zhou, Z.; Yang, J.-B.; Zhang, S.-D.; Guan, K.-Y.; Tan, Y.-H.; Yu, W.-B. Phylogenetic reassessment of tribe Anemoneae (Ranunculaceae): Non-monophyly of Anemone sl revealed by plastid datasets. PLoS ONE 2017, 12, e0174792. [Google Scholar] [CrossRef]
  48. Johansson, J.T. A revised chloroplast DNA phylogeny of the Ranunculaceae. In Systematics and Evolution of the Ranunculiflorae; Jensen, U., Kadereit, J.W., Eds.; Springer: Vienna, Austria, 1995; pp. 253–261. [Google Scholar]
  49. Wang, W.; Lu, A.-M.; Ren, Y.; Endress, M.E.; Chen, Z.-D. Phylogeny and classification of Ranunculales: Evidence from four molecular loci and morphological data. Perspect. Plant Ecol. Evol. Syst. 2009, 11, 81–110. [Google Scholar] [CrossRef]
  50. Liu, H.-J.; Ding, C.-H.; He, J.; Cheng, J.; Pei, L.Y.; Xie, L. Complete chloroplast genomes of Archiclematis, Naravelia and Clematis (Ranunculaceae), and their phylogenetic implications. Phytotaxa 2018, 343, 214–226. [Google Scholar] [CrossRef]
  51. Korea National Arboretum. Checklist of Vascular Plants in Korea; Korea National Arboretum: Pocheon, Korea, 2017; pp. 156–159. [Google Scholar]
  52. Oh, H.S. An anatomical study of Clematis in Korea. Korean J. Taxon. 1971, 3, 1–2. [Google Scholar] [CrossRef]
  53. Lehtonen, S.; Christenhusz, M.J..; Falck, D. Sensitive phylogenetics of Clematis and its position in Ranunculaceae. Bot. J. Linn. Soc. 2016, 182, 825–867. [Google Scholar] [CrossRef] [Green Version]
  54. Kubitzki, K.; Rohwer, J.G.; Bittrich, V. The Families and Genera of Vascular Plants: Volume II Flowering Plants: Dicotyledons, Magnoliid, Hamamelid and Caryophyllid Families; Springer: Berlin/Heidelberg, Germany, 1993. [Google Scholar]
  55. Wu, Z.Y.; Raven, P.H.; Hong, D.Y. Flora of China, Aconitum Linnaeus; Science Press: Beijing, China; Missouri Botanical Garden Press: St. Louis, MI, USA, 2001; Volume 6, pp. 333–386. [Google Scholar]
  56. Iwatsuki, K.; Yamazaki, T.; Boufford, D.E.; Ohba, H. Flora of Japan, Vol. IIa: Angiospermae, Dicotyledoneae, Archichlamydeae (a); Kodansha: Tokyo, Japan, 2006. [Google Scholar]
  57. Chung, G.Y.; Chang, K.S.; Chung, J.-M.; Choi, H.J.; Paik, W.-K.; Hyun, J.-O. A checklist of endemic plants on the Korean Peninsula. Korean J. Plant Taxon. 2017, 47, 264–288. [Google Scholar] [CrossRef] [Green Version]
  58. Lee, H.-L.; Jansen, R.K.; Chumley, T.W.; Kim, K.-J. Gene relocations within chloroplast genomes of Jasminum and Menodora (Oleaceae) are due to multiple, overlapping inversions. Mol. Biol. Evol. 2007, 24, 1161–1180. [Google Scholar] [CrossRef] [Green Version]
  59. Hirose, T.; Ideue, T.; Wakasugi, T.; Sugiura, M. The chloroplast infA gene with a functional UUG initiation codon. FEBS Lett. 1999, 445, 169–172. [Google Scholar] [CrossRef] [Green Version]
  60. Millen, R.S.; Olmstead, R.G.; Adams, K.L.; Palmer, J.D.; Lao, N.T.; Heggie, L.; Kavanagh, T.A.; Hibberd, J.M.; Gray, J.C.; Morden, C.W. Many parallel losses of infA from chloroplast DNA during angiosperm evolution with multiple independent transfers to the nucleus. Plant Cell 2001, 13, 645–658. [Google Scholar] [CrossRef] [Green Version]
  61. Lee, S.R.; Kim, K.; Lee, B.Y.; Lim, C.E. Complete chloroplast genomes of all six Hosta species occurring in Korea: Molecular structures, comparative, and phylogenetic analyses. BMC Genom. 2019, 20, 833. [Google Scholar] [CrossRef]
  62. Goulding, S.E.; Wolfe, K.H.; Olmstead, R.G.; Morden, C.W. Ebb and flow of the chloroplast inverted repeat. Mol. Gen. Genet. MGG 1996, 252, 195–206. [Google Scholar] [CrossRef]
  63. Perry, A.S.; Wolfe, K.H. Nucleotide substitution rates in legume chloroplast DNA depend on the presence of the inverted repeat. J. Mol. Evol. 2002, 55, 501–508. [Google Scholar] [CrossRef] [PubMed]
  64. Wolfe, K.H.; Li, W.-H.; Sharp, P.M. Rates of nucleotide substitution vary greatly among plant mitochondrial, chloroplast, and nuclear DNAs. Proc. Natl. Acad. Sci. USA 1987, 84, 9054–9058. [Google Scholar] [CrossRef] [PubMed] [Green Version]
  65. Yi, D.-K.; Kim, K.-J. Complete chloroplast genome sequences of important oilseed crop Sesamum indicum L. PLoS ONE 2012, 7, e35872. [Google Scholar] [CrossRef] [PubMed] [Green Version]
  66. Takahashi, D.; Sakaguchi, S.; Isagi, Y.; Setoguchi, H. Comparative chloroplast genomics of series Sakawanum in genus Asarum (Aristolochiaceae) to develop single nucleotide polymorphisms (SNPs) and simple sequence repeat (SSR) markers. J. For. Res. 2018, 23, 387–392. [Google Scholar] [CrossRef]
  67. Palmer, J.D.; Nugent, J.M.; Herbon, L.A. Unusual structure of geranium chloroplast DNA: A triple-sized inverted repeat, extensive gene duplications, multiple inversions, and two repeat families. Proc. Natl. Acad. Sci. USA 1987, 84, 769–773. [Google Scholar] [CrossRef] [PubMed] [Green Version]
  68. Weng, M.-L.; Blazier, J.C.; Govindu, M.; Jansen, R.K. Reconstruction of the ancestral plastid genome in Geraniaceae reveals a correlation between genome rearrangements, repeats, and nucleotide substitution rates. Mol. Biol. Evol. 2014, 31, 645–659. [Google Scholar] [CrossRef] [Green Version]
  69. Sun, Y.; Moore, M.J.; Meng, A.; Soltis, P.S.; Soltis, D.E.; Li, J.; Wang, H. Complete plastid genome sequencing of Trochodendraceae reveals a significant expansion of the inverted repeat and suggests a Paleogene divergence between the two extant species. PLoS ONE 2013, 8, e60429. [Google Scholar] [CrossRef] [Green Version]
  70. Sloan, D.B.; Alverson, A.J.; Wu, M.; Palmer, J.D.; Taylor, D.R. Recent acceleration of plastid sequence and structural evolution coincides with extreme mitochondrial divergence in the angiosperm genus. Silene Genome Biol. Evol. 2012, 4, 294–306. [Google Scholar]
  71. Zerbino, D.R.; Birney, E. Velvet: Algorithms for de novo short read assembly using de Bruijn graphs. Genome Res. 2008, 18, 821–829. [Google Scholar] [CrossRef] [PubMed] [Green Version]
  72. Kearse, M.; Moir, R.; Wilson, A.; Stones-Havas, S.; Cheung, M.; Sturrock, S.; Buxton, S.; Cooper, A.; Markowitz, S.; Duran, C.; et al. Geneious Basic: An integrated and extendable desktop software platform for the organization and analysis of sequence data. Bioinformatics 2012, 28, 1647–1649. [Google Scholar] [CrossRef]
  73. Wyman, S.K.; Jansen, R.K.; Boore, J.L. Automatic annotation of organellar genomes with DOGMA. Bioinformatics 2004, 20, 3252–3255. [Google Scholar] [CrossRef] [Green Version]
  74. Schattner, P.; Brooks, A.N.; Lowe, T.M. The tRNAscan-SE, snoscan and snoGPS web servers for the detection of tRNAs and snoRNAs. Nucleic Acids Res. 2005, 33, W686–W689. [Google Scholar] [CrossRef]
  75. Lohse, M.; Drechsel, O.; Bock, R. OrganellarGenomeDRAW (OGDRAW): A tool for the easy generation of high-quality custom graphical maps of plastid and mitochondrial genomes. Curr. Genet. 2007, 52, 267–274. [Google Scholar] [CrossRef]
  76. Frazer, K.A.; Pachter, L.; Poliakov, A.; Rubin, E.M.; Dubchak, I. VISTA: Computational tools for comparative genomics. Nucleic Acids Res. 2004, 32, W273–W279. [Google Scholar] [CrossRef]
  77. Mayor, C.; Brudno, M.; Schwartz, J.R.; Poliakov, A.; Rubin, E.M.; Frazer, K.A.; Pachter, L.S.; Dubchak, I. VISTA: Visualizing global DNA sequence alignments of arbitrary length. Bioinformatics 2000, 16, 1046. [Google Scholar] [CrossRef] [PubMed] [Green Version]
  78. Brudno, M.; Do, C.B.; Cooper, G.M.; Kim, M.F.; Davydov, E.; Green, E.D.; Sidow, A.; Batzoglou, S. NISC comparative sequencing program. LAGAN and Multi-LAGAN: Efficient tools for large-scale multiple alignment of genomic DNA. Genome Res. 2003, 13, 721–731. [Google Scholar] [CrossRef] [PubMed] [Green Version]
  79. Librado, P.; Rozas, J. DnaSP v5: A software for comprehensive analysis of DNA polymorphism data. Bioinformatics 2009, 25, 1451–1452. [Google Scholar] [CrossRef] [PubMed] [Green Version]
  80. Katoh, K.; Misawa, K.; Kuma, K.; Miyata, T. MAFFT: A novel method for rapid multiple sequence alignment based on fast Fourier transform. Nucleic Acids Res. 2002, 30, 3059–3066. [Google Scholar] [CrossRef] [PubMed] [Green Version]
  81. Santorum, J.M.; Darriba, D.; Taboada, G.L.; Posada, D. jmodeltest. org: Selection of nucleotide substitution models on the cloud. Bioinformatics 2014, 30, 1310–1311. [Google Scholar] [CrossRef] [PubMed] [Green Version]
  82. Stamatakis, A. RAxML-VI-HPC: Maximum likelihood-based phylogenetic analyses with thousands of taxa and mixed models. Bioinformatics. 2006, 22, 2688–2690. [Google Scholar] [CrossRef] [PubMed]
  83. Yang, Z. PAML 4: Phylogenetic analysis by maximum likelihood. Mol. Biol. Evol. 2007, 24, 1586–1591. [Google Scholar] [CrossRef] [PubMed] [Green Version]
Figure 1. Chloroplast genome map for two Clematis species. Genes shown outside the circle are transcribed clockwise, whereas those inside the circle are transcribed counterclockwise. Genes belonging to different functional groups are colored. The dashed area in the inner circle indicates the GC content of the genome.
Plants 10 00397 g001
Figure 2. Chloroplast genome sequence alignment of 12 species of Clematis with C. brachyura used as a reference. The sequence identities were calculated and visualized in mVISTA. LSC, large single copy; SSC, small single copy; IR, inverted repeat.
Plants 10 00397 g002
Figure 3. Comparisons of junctions (LSC to IR and IR to SSC IR region) among the chloroplast genomes of Clematis. * indicates different lengths between pairs of IRs. LSC, large single copy; SSC, small single copy; IR, inverted repeat.
Plants 10 00397 g003
Figure 4. Alignment of two pseudogenes in Clematis. (A) ψ infAψ; (B) ψ rpl32.
Plants 10 00397 g004
Figure 5. Sliding window analysis of the whole chloroplast genome for nucleotide diversity (Pi) compared among 12 Clematis species.
Plants 10 00397 g005
Figure 6. Maximum likelihood tree derived from 36 species and based on 77 concatenated protein-coding genes of Ranunculaceae. Bootstrap support values >70% are shown on the branches. Clade of Clematis followed Lehtonene et al. [53]. “-” did not include species by previous study [53].
Plants 10 00397 g006
Figure 7. Patterns of rearrangement in the large single copy in Ranunculus. Rearrangement events are mapped on the branches.
Plants 10 00397 g007
Figure 8. Comparison of synonymous (dS) and nonsynonymous (dN) substitution rates among Anemoneae, Clematis, and Ranunculaceae. (A) Comparison of dS; (B) Comparison of dN. LSC, large single copy region; IR, inverted repeat region; LSC or IR, genes were located in the LSC or IR regions; SSC; small single copy region. Asterisks indicate p < 0.05 (***).
Plants 10 00397 g008
Figure 9. Extension of inverted repeat (IR) region in Anemoneae. IR expansion shown with red line. (A) Type A of IR expansion in Anemoneae; (B) type B of IR in Ranunculaceae excluding Anemoneae); (C) comparison of dN and dS between type A and type B genes. Asterisks indicate p < 0.05 (*) and p < 0.01 (**).
Plants 10 00397 g009
Publisher’s Note: MDPI stays neutral with regard to jurisdictional claims in published maps and institutional affiliations.

