Article

Spatial Distribution and Climate Warming Impact on Abies kawakamii Forest on a Subtropical Island

1
Experimental Forest, National Chung Hsing University, No. 145 Xingda Rd., Taichung City 40227, Taiwan
2
Department of Forestry, National Chung Hsing University, No. 145 Xingda Rd., Taichung City 40227, Taiwan
3
Department of Biological Resources, National Chiayi University, No. 300 Syuefu Rd., Chiayi City 60004, Taiwan
4
Department of Forestry and Natural Resources, National Chiayi University, No. 300 Syuefu Rd., Chiayi City 60004, Taiwan
5
Botanical Garden Division, Taiwan Forestry Research Institute, No. 53 Nanhai Rd., Zhongzheng District, Taipei City 10066, Taiwan
*
Authors to whom correspondence should be addressed.
Submission received: 23 April 2022 / Revised: 14 May 2022 / Accepted: 16 May 2022 / Published: 19 May 2022
(This article belongs to the Section Plant Ecology)

Abstract

:
Species distribution modeling (SDM) is currently the primary tool for predicting suitable habitats for species. In this study, we used Abies kawakamii, a species endemic to Taiwan. Being the only Abies species distributed in high mountains, it acts as an ecological indicator on the subtropical island. We analyzed a vegetation map derived from remote sensing and ground surveys using SDM. The actual distribution of A. kawakamii in Taiwan has a total area of 16,857 ha distributed at an altitude of 2700–3600 m, and it often forms a monodominant forest at 3100–3600 m with the higher altitude edge as a forest line. Exploring the potential distribution of A. kawakamii through MaxEnt showed that the suitable habitat was 73,151 ha under the current climate. Under the scenarios of temperature increases of 0.5, 1.0, 1.5, and 2.0 °C, suitable habitat for A. kawakamii will gradually decrease to 70.2%, 47.1%, 30.2%, and 10.0% of this area, respectively, indicating that A. kawakamii will greatly decline under these climate warming scenarios. Fire burning disturbance may be the most significant damage to A. kawakamii at present. Although A. kawakamii has been protected by conservation areas and its natural regeneration is in good condition, it rarely has the opportunity to migrate upwards during climate warming. We suggest that in the future, research on the natural regeneration and artificial restoration of A. kawakamii should be emphasized, especially in the forest line ecotone.

1. Introduction

Species distribution modeling (SDM) is currently the primary tool for predicting suitable habitats for species [1,2,3,4]. SDM links the ecological theory of species–environment relationships with statistical learning methods and geospatial data to understand and predict species distributions and habitats [5]. It is widely used in biogeography, biological conservation, and environmental change research [6,7,8]. In recent years, the number of SDM-related studies has increased in number each year [9,10]. SDM is a powerful tool to support forest management, and it can be used to forecast climate change impacts on forests [11]. To date, many different methods have been developed to predict species occurrences based on environmental characteristics [11,12,13]. Among these SDM methods, MaxEnt (maximum entropy) [14,15,16] is the most commonly used. Many studies have used MaxEnt to explore habitat suitability and climate change [17,18]. Compared with the more complex ensemble SDM, the MaxEnt model’s performance is comparable to the ensemble approach, and MaxEnt has the advantages of reduced calculation time and simplicity [19].
The genus Abies is composed of approximately 50 species globally, which are distributed in the subalpine to alpine regions of Europe, Asia, North America, Central America, and the northernmost part of Africa, mostly in cold and temperate climates in the Northern Hemisphere [20,21]. Only four Abies species (i.e., Abies kawakamii (Hayata) T.Itô, A. webbiana (Wall. ex D.Don) Lindl., A. religiosa (Kunth) Schltdl. & Cham., and A. fansipanensis Q.P.Xiang) are distributed in subtropical regions, and all of them are ecological indicators of the genus [20,21,22]. Among them, A. kawakamii is an endemic and relic tree species that composes monodominant forest and builds forest lines in high mountain areas in subtropical Taiwan [23,24,25,26,27]. It plays an essential role in the subalpine ecosystem and presents a unique forest landscape [28,29]. Plants at high altitudes are susceptible to climate change [30,31] and rarely have the opportunity to migrate upwards under warming conditions [32,33,34]. Abies tree species that grow on the island’s high mountains, such as A. koreana [35,36,37], may face a more severe decline. Unfortunately, both past observations and future predictions show a clear warming trend for Taiwan [38,39,40], and it is necessary to understand the spatial distribution of A. kawakamii in the high mountain areas of this subtropical island. This study analyzed a vegetation map derived from remote sensing and ground surveys of A. kawakamii using SDM. Evaluating actual and potential spatial distribution, we predict the future trend of the distribution area of A. kawakamii under climate warming scenarios.

2. Results

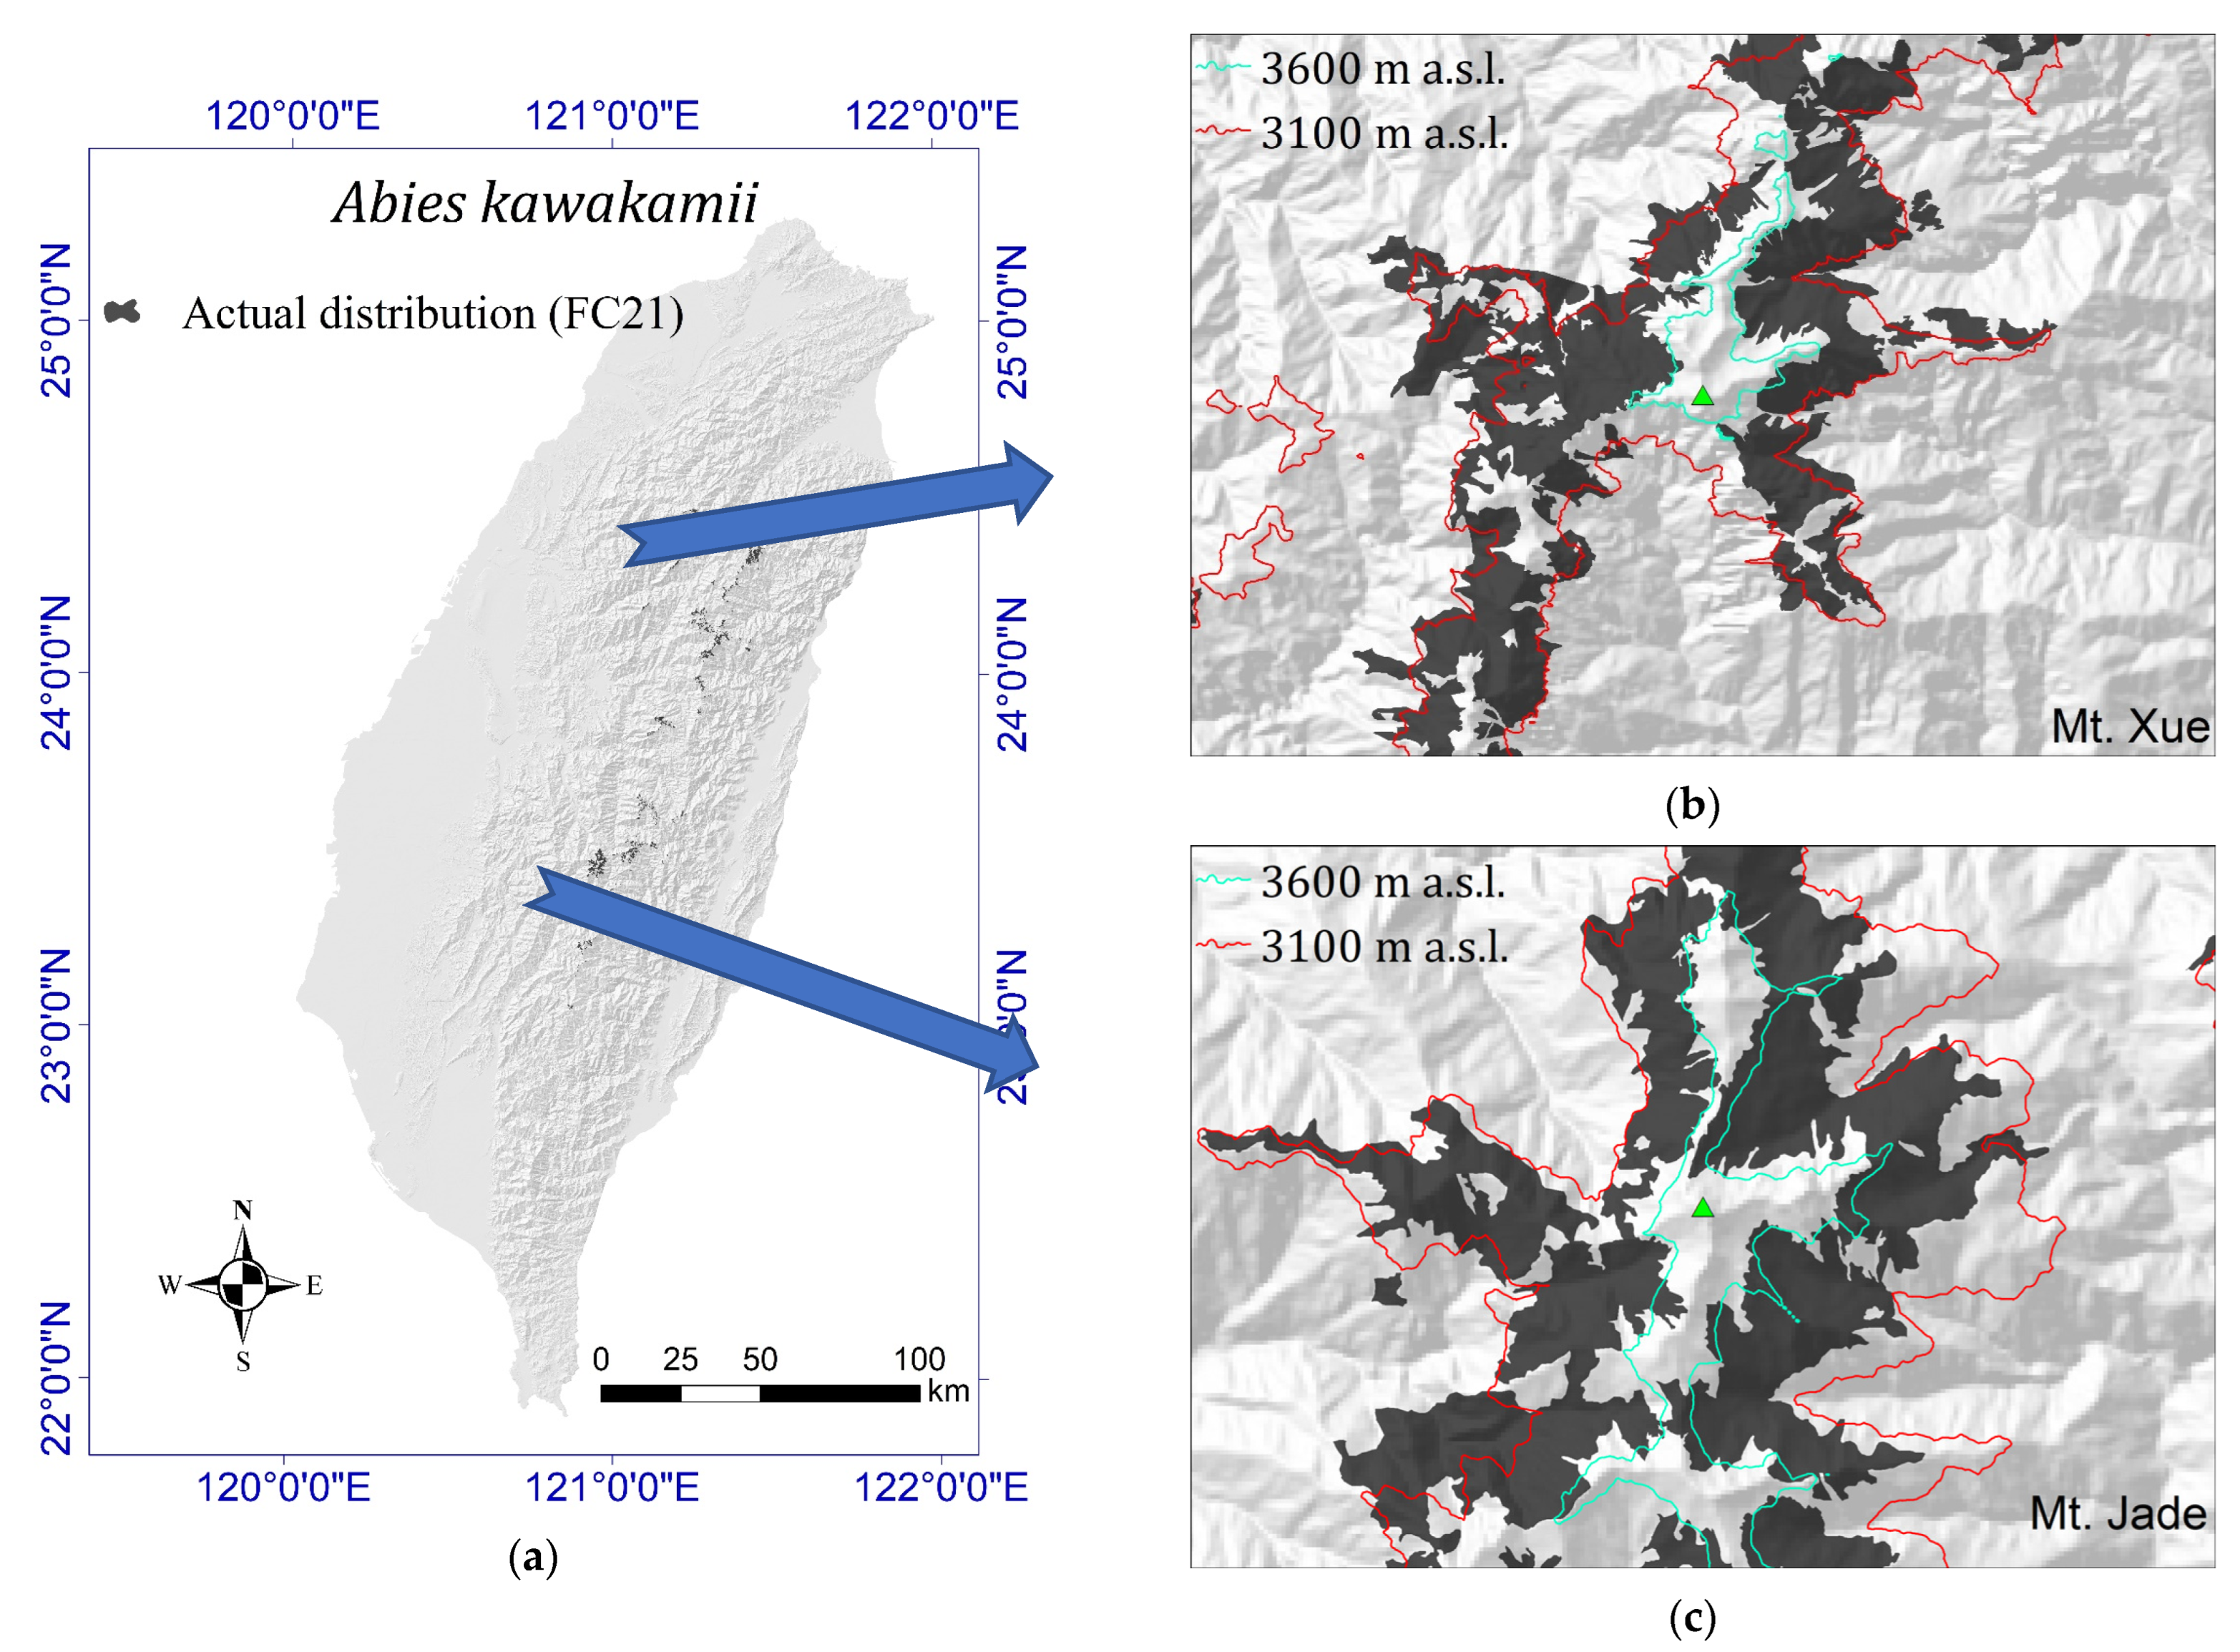
2.1. Current Actual Distribution of A. kawakamii

Table 1 reveals the actual area of A. kawakamii in each 100 m altitude zone. The current actual distribution of A. kawakamii was extracted from the FC21 polygon (A. kawakamii formation represented as a black polygon in Figure 1) of the TVDIM vegetation map [41]. The results show that the total area of the actual area distribution of A. kawakamii is 16,857 ha, which is only 0.47% of the total area on the island of Taiwan (Figure 1a). No particular difference was detected in the distribution of A. kawakamii in different directions (Figure 1). The actual distribution of A. kawakamii is mainly concentrated on high mountains such as Mount Jade (Figure 1b) and Mount Xue (Figure 1c).

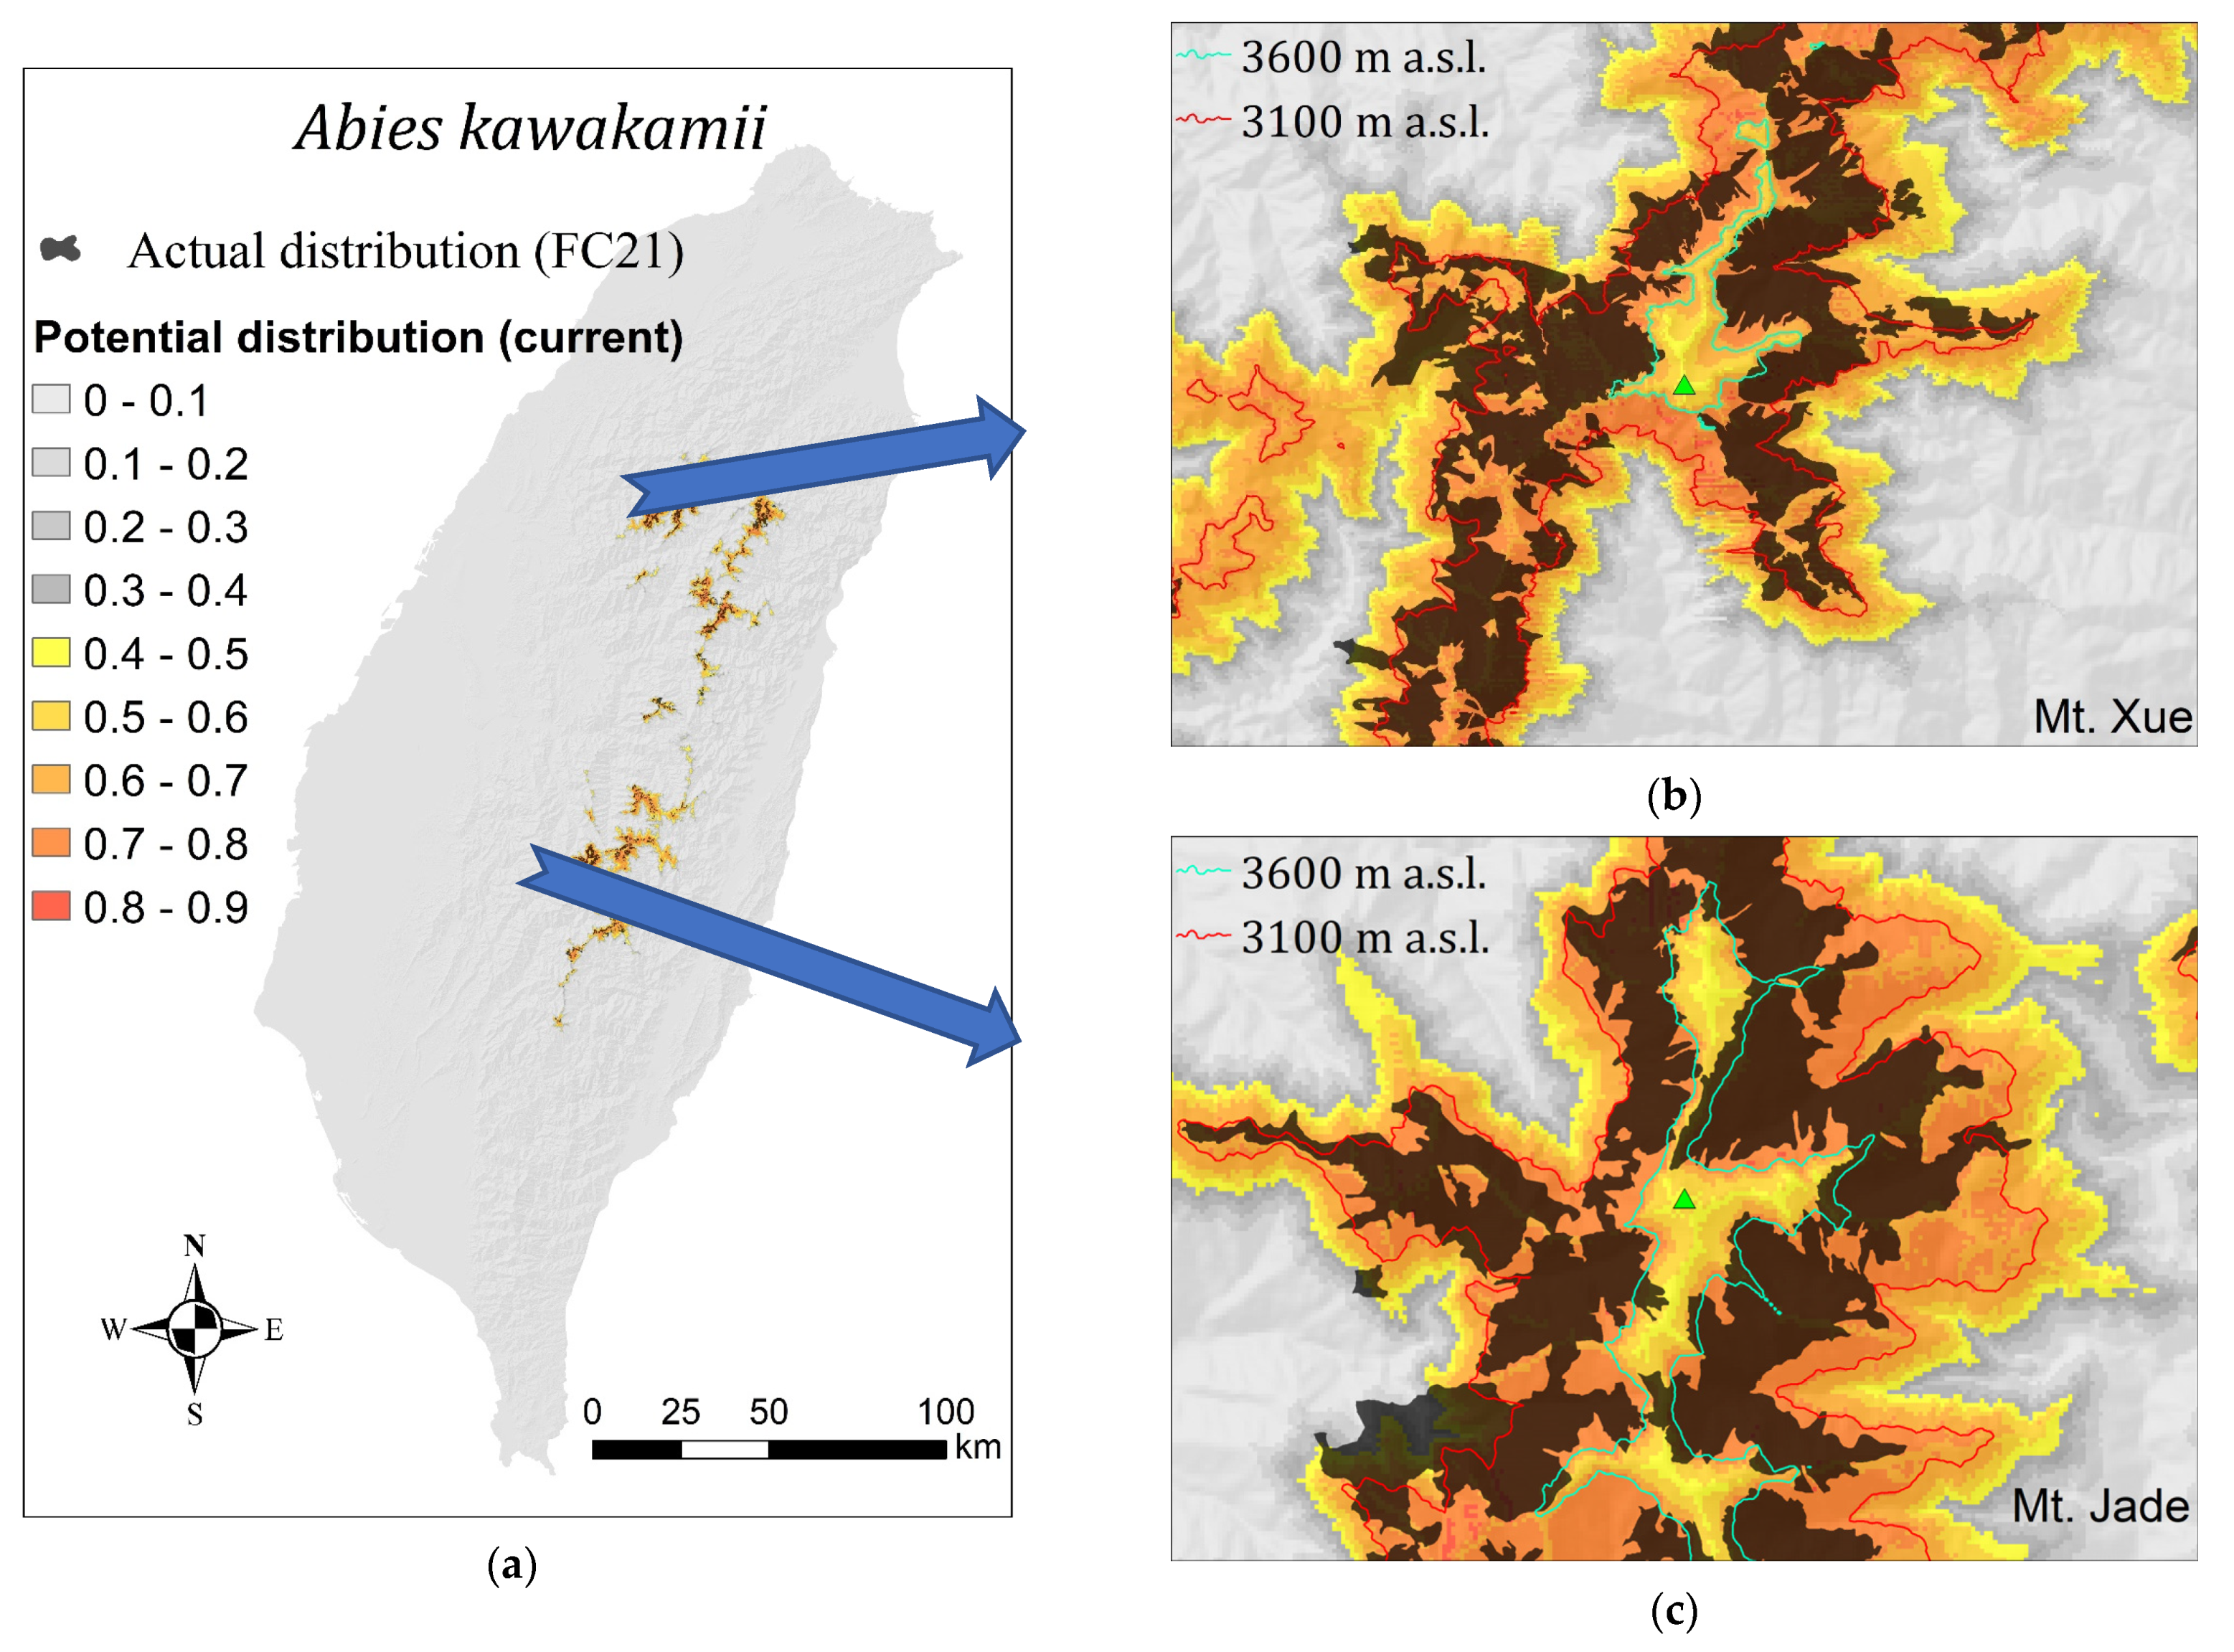
2.2. Potential Distribution Modeling Using MaxEnt

After calculating the correlation coefficients of 21 pre-selected environmental variables, for the 8 environmental variables selected and used in MaxEnt (Table 2), EWI occupied absolute importance, which means that the distribution of A. kawakamii is mainly controlled by altitude or a more precise thermal index.
The AUC value of our model was 0.9628, which indicates excellent accuracy [42]. The potential distribution or the occurrence probability of A. kawakamii simulated by MaxEnt is shown in the orange tone in Figure 2, and its Cloglog log value ranged from 0.0000 to 0.8580. Two commonly used thresholds of species presence/absence [43,44,45] were calculated. Threshold 1 (equal training sensitivity and specificity = 0.4046) was more reasonable than threshold 2 (maximum training sensitivity plus specificity = 0.0972). Therefore, we used a threshold of 0.4046 to determine the presence or absence of A. kawakamii (Figure 2).
Figure 3 shows the results of predicting the distribution of A. kawakamii using 3100–3600 m contours [23,24] and EWI (effective warmth index) = 12–32 [24,46], and overlapping its actual and potential distributions.
Table 2. Percent contribution and permutation importance of the eight variables used in MaxEnt.
VariablesDescription and ReferencePercent ContributionPermutation Importance
EWIEffective warmth index [46]97.699.6
PERPotential evapotranspiration ratio [47]1.00.0
bio15Precipitation seasonality [48]0.40.0
WLSWhole light sky space [49]0.40.1
PWRRatio of winter half-year precipitation to Bio12 [23]0.20.1
bio12Annual precipitation [48]0.20.0
bio4Precipitation of driest month [48]0.10.0
bio9Precipitation of coldest quarter [48]0.00.1

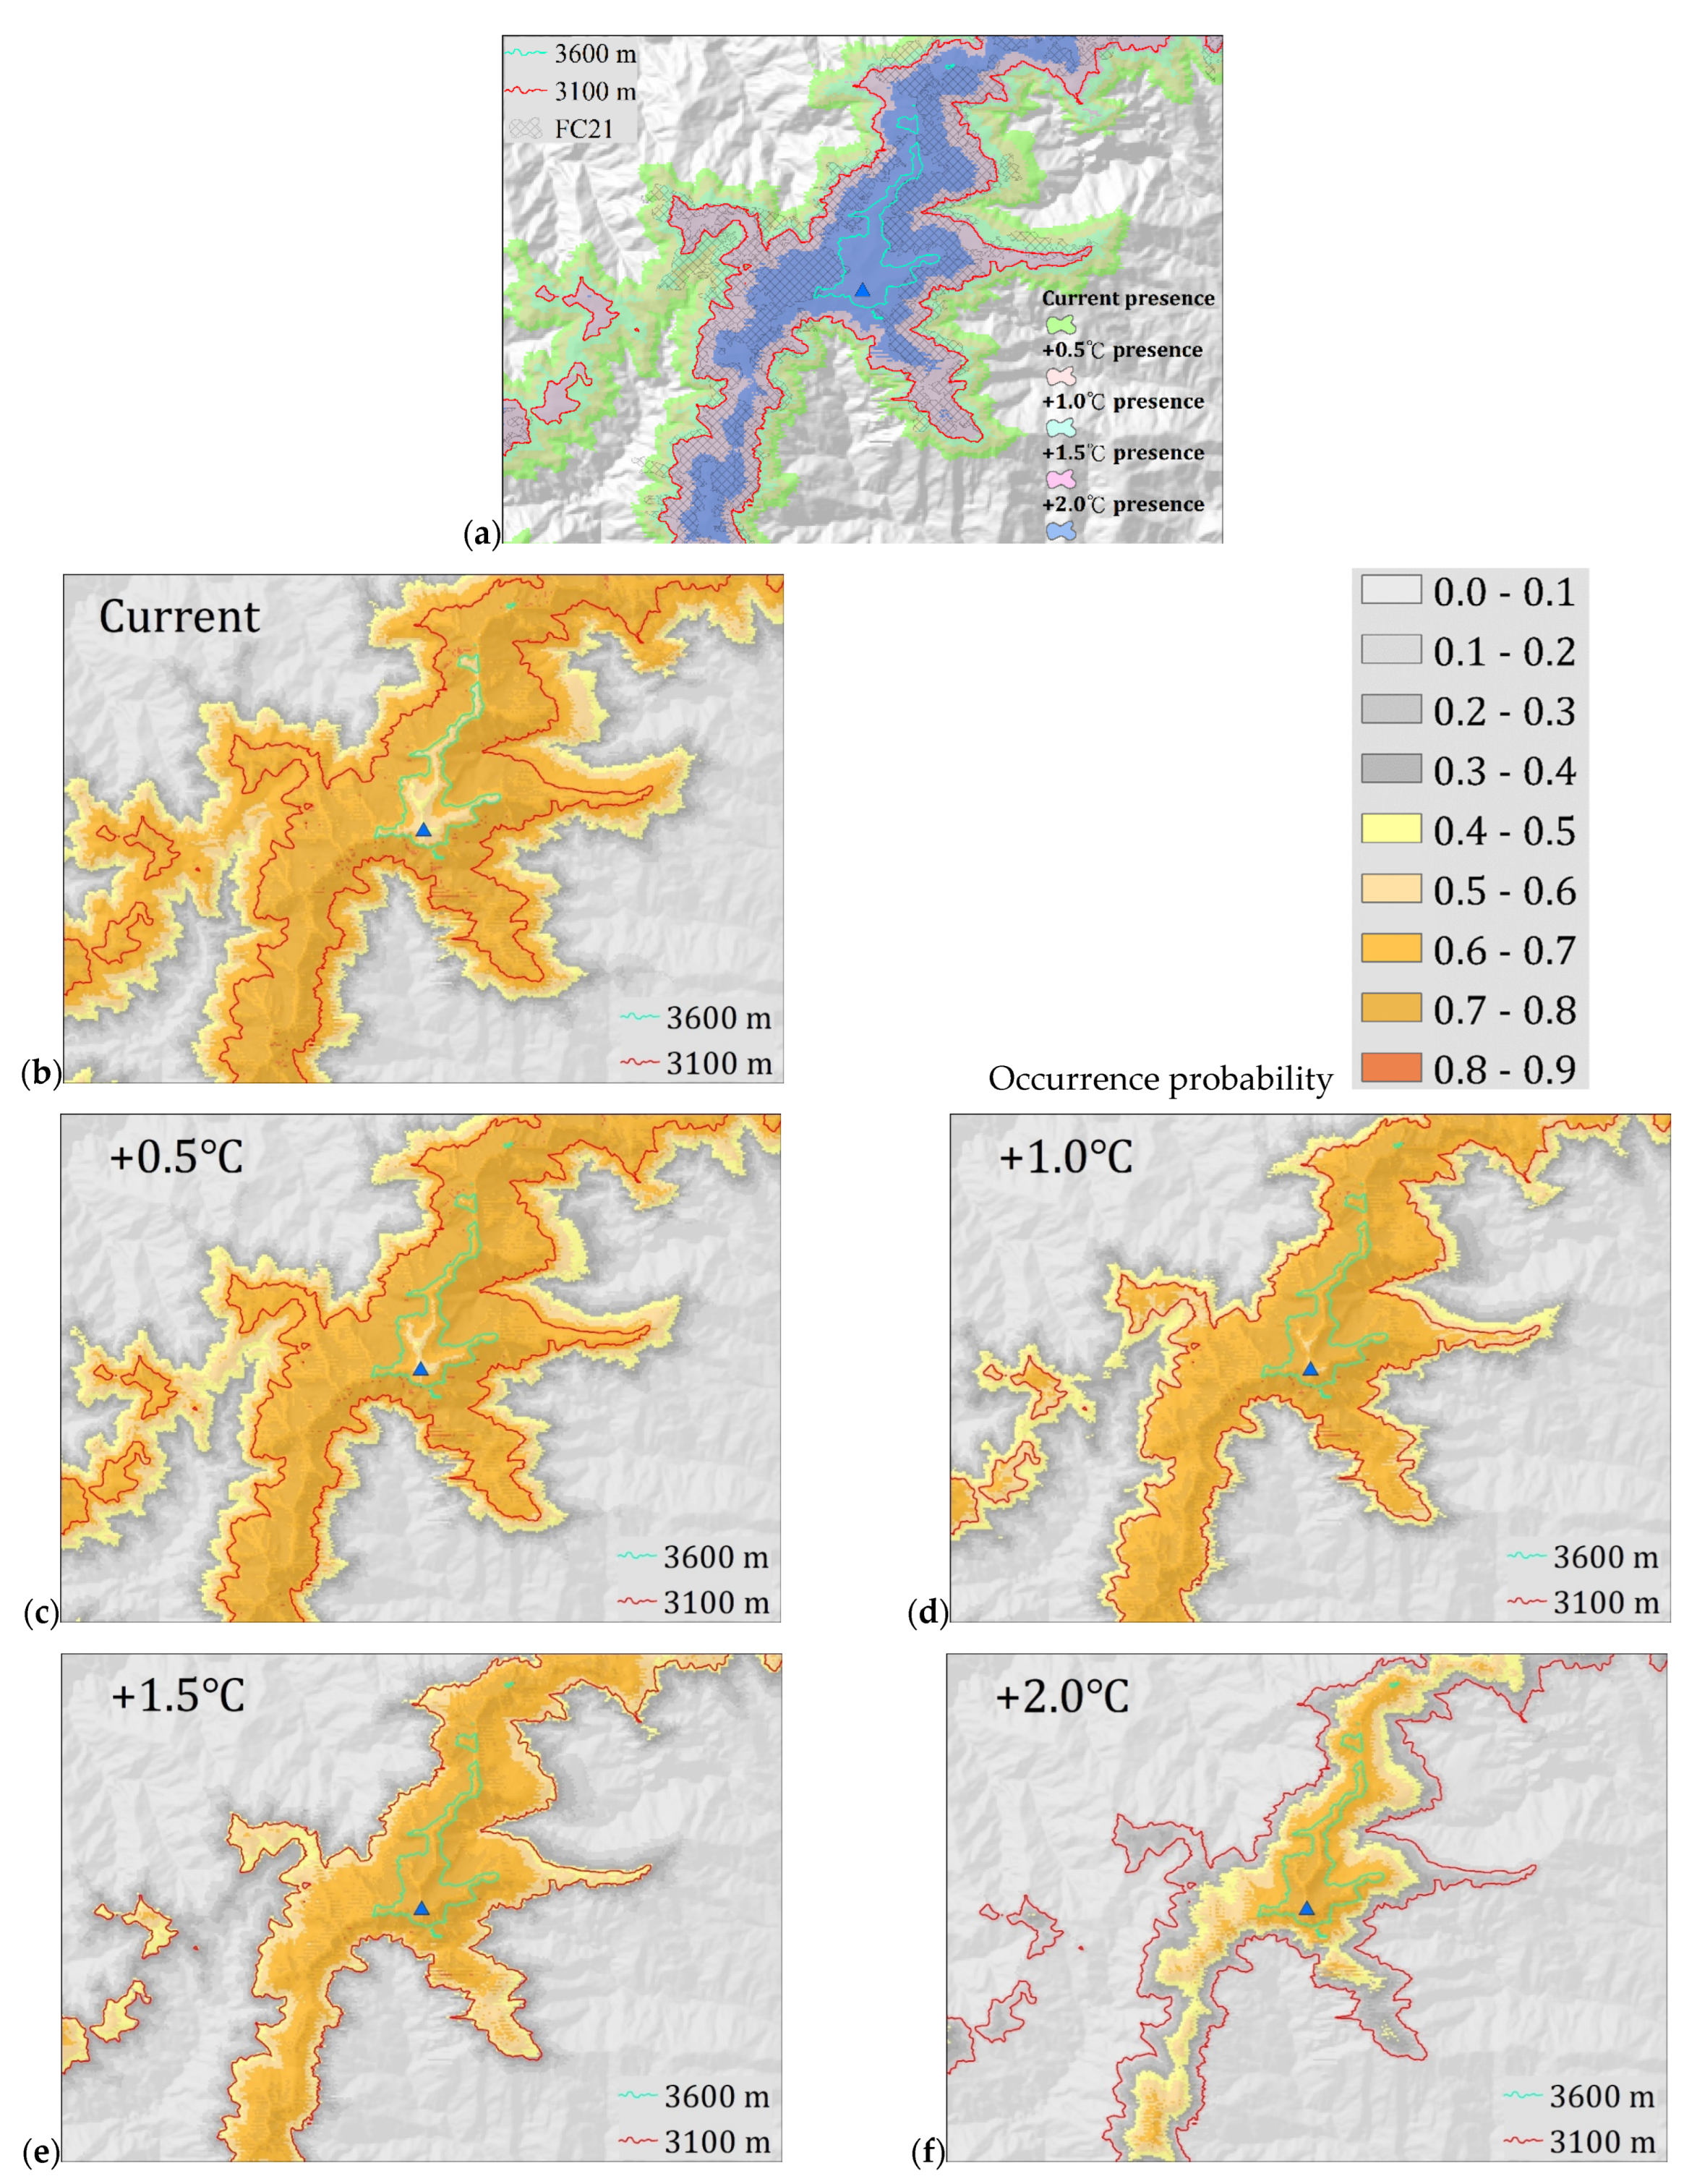
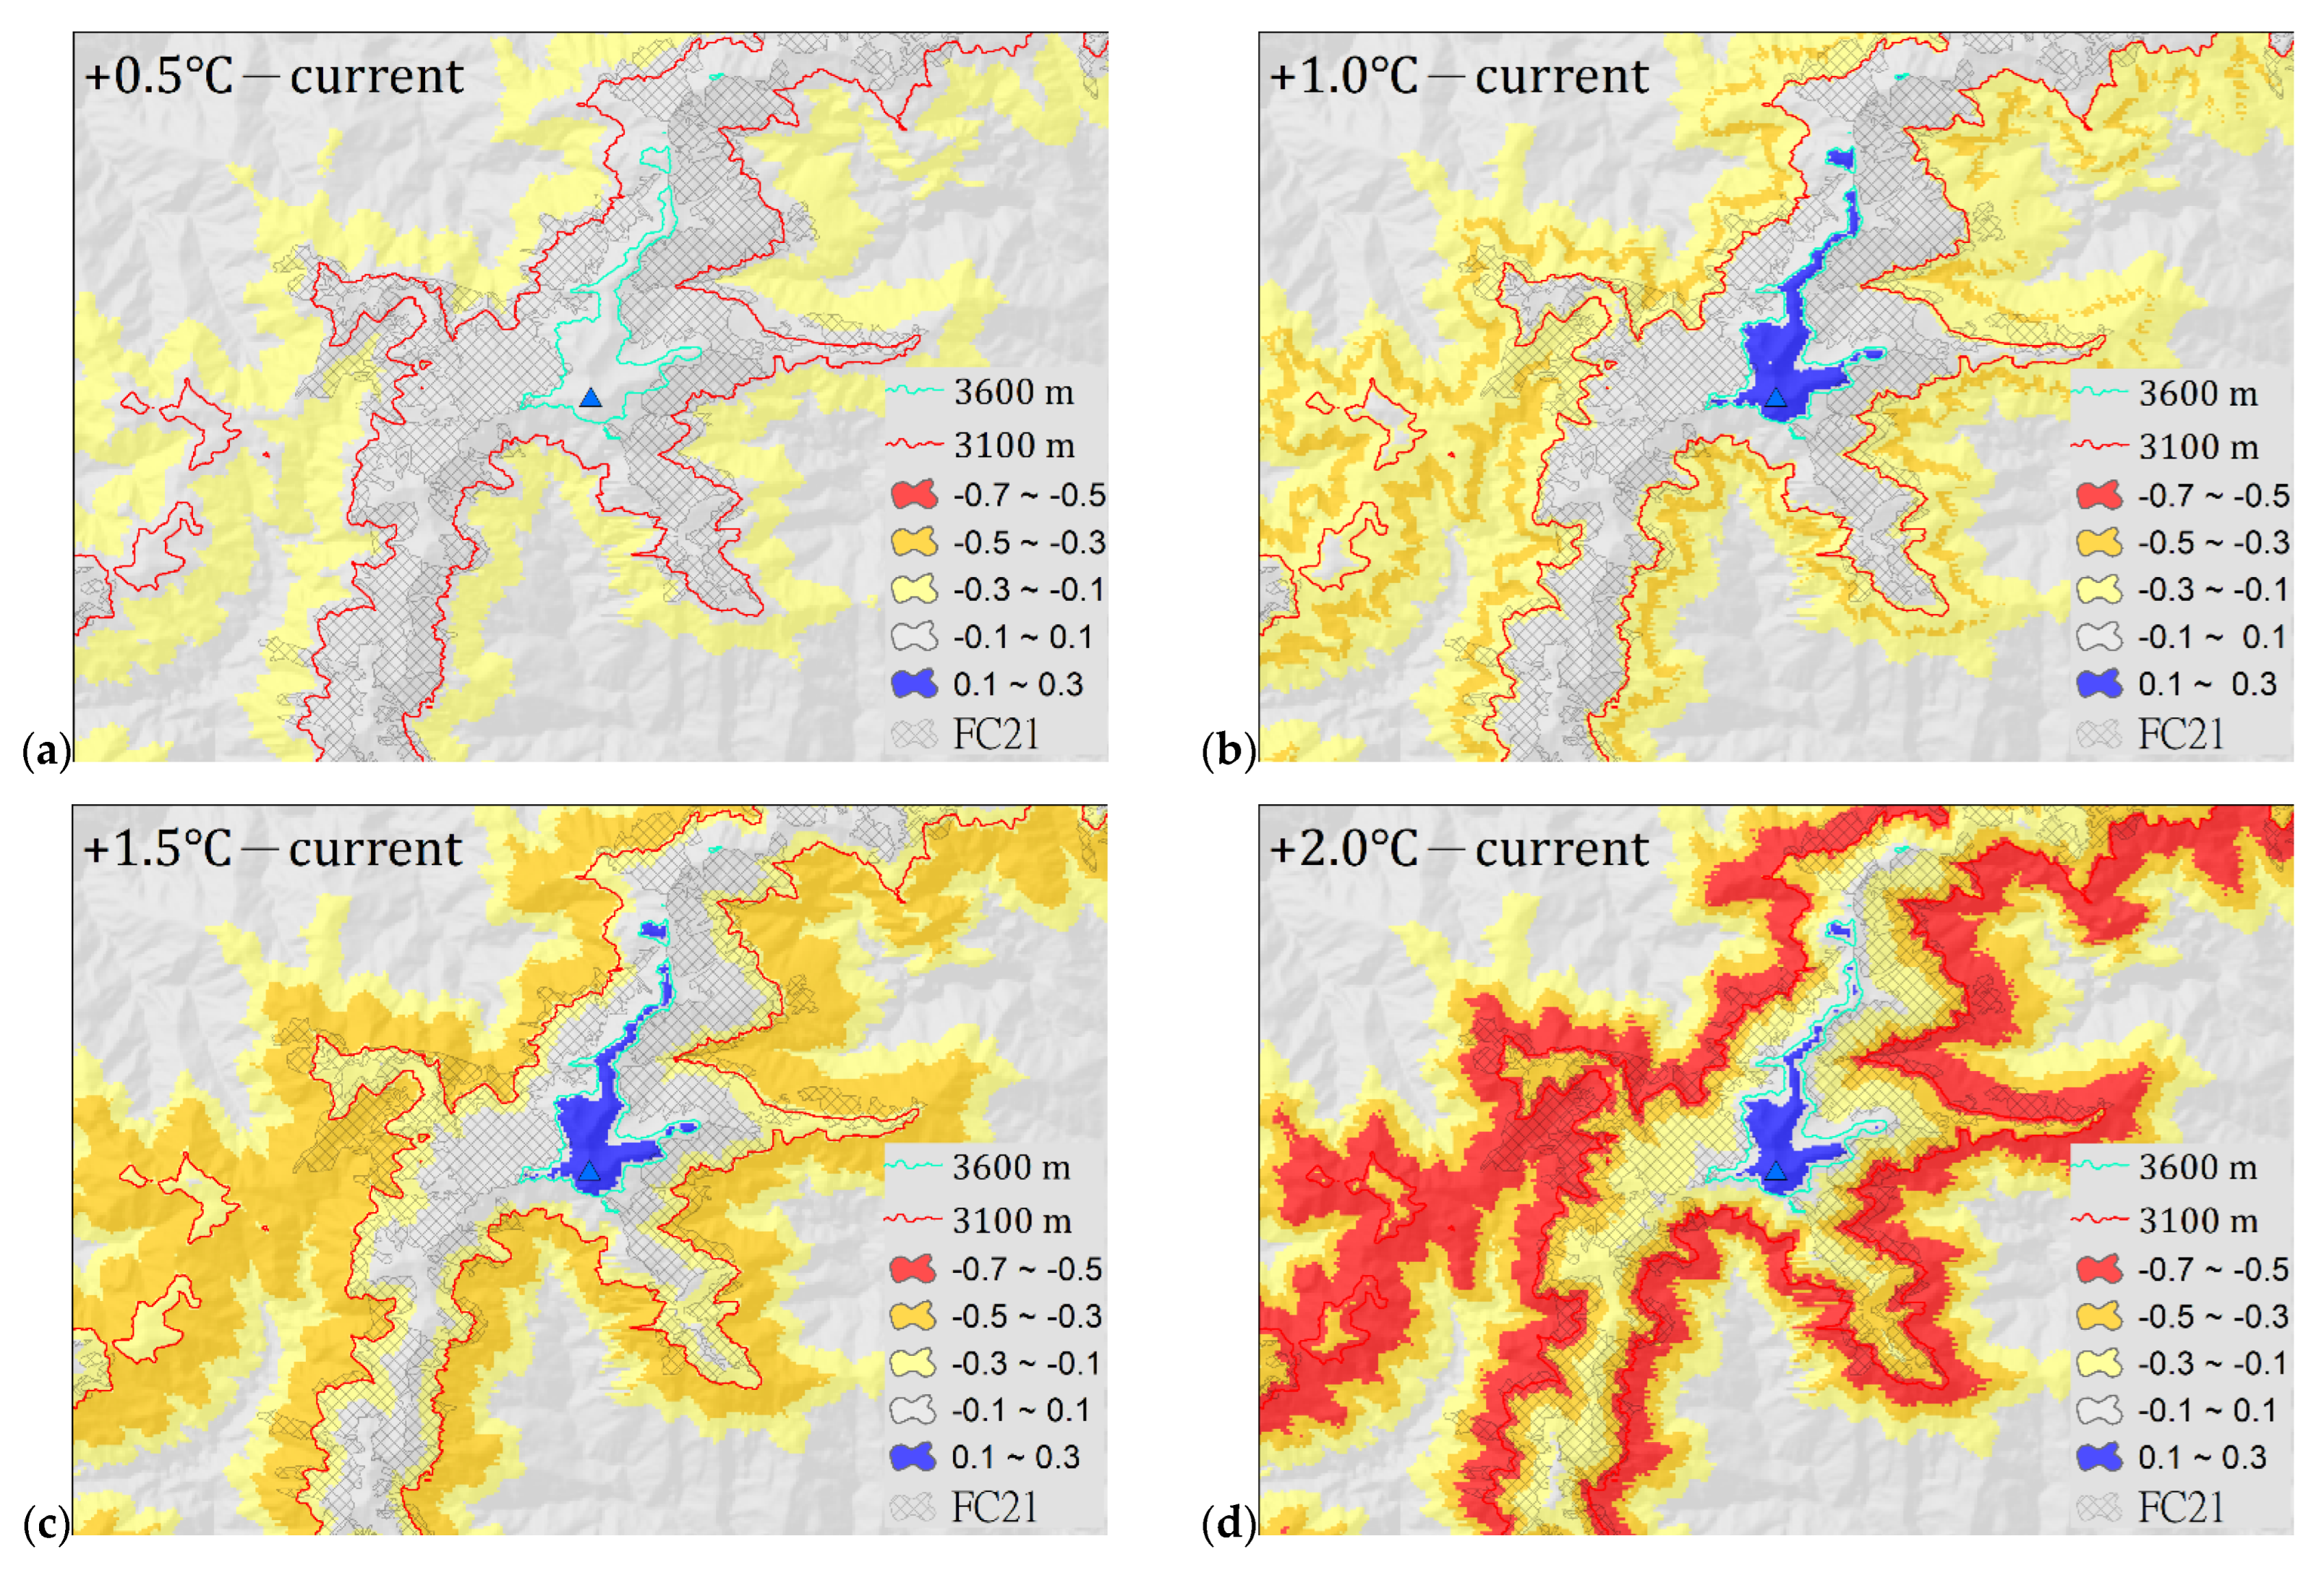
2.3. Potential Distribution under Climate Warming Scenarios

A. kawakamii will gradually lose suitable habitats at lower altitudes under increasing temperatures of 0.5, 1.0, 1.5, and 2.0 °C. Using equal training sensitivity and specificity as the threshold to convert the occurrence probability value to presence–absence binary data, when the temperature increased by 0.5, 1.0, 1.5, and 2.0 °C, the presence areas of A. kawakamii were 51,323, 34,476, 22,106, and 7338 ha, respectively (Table 3); that is, the suitable habitats of A. kawakamii will gradually decrease to 70.2%, 47.1%, 30.2%, and 10.0% of the current area. This illustrates the loss and gain of A. kawakamii habitat areas under the +0.5~+2.0 °C climate warming scenario. Overall, A. kawakamii is migrating and shrinking to high-altitude areas as the temperature rises. In other words, it loses its original habitats in lower places and gains new habitats in higher places, and the area lost is much larger than the area gained. Table 4 further explains the loss and gain changes in Figure 4. We defined Cloglog ± 0.1–0.3 as a low loss or gain change, Cloglog ± 0.3–0.5 as a medium change, and Cloglog ± 0.5–0.7 as a high change.
Table 3. Summary of the spatial distribution layers of A. kawakamii.
LayerArea (ha)HabitatMeaning and Reference
Actual distribution16,857ActualCombining the ground survey of existing vegetation and the interpretation of remote sensing images to map the current actual distribution polygons of A. kawakamii-dominant forests [41]
Range of 3100–3600 m contours25,571PotentialThe altitude range of A. kawakamii forests observed in the field [24,50]
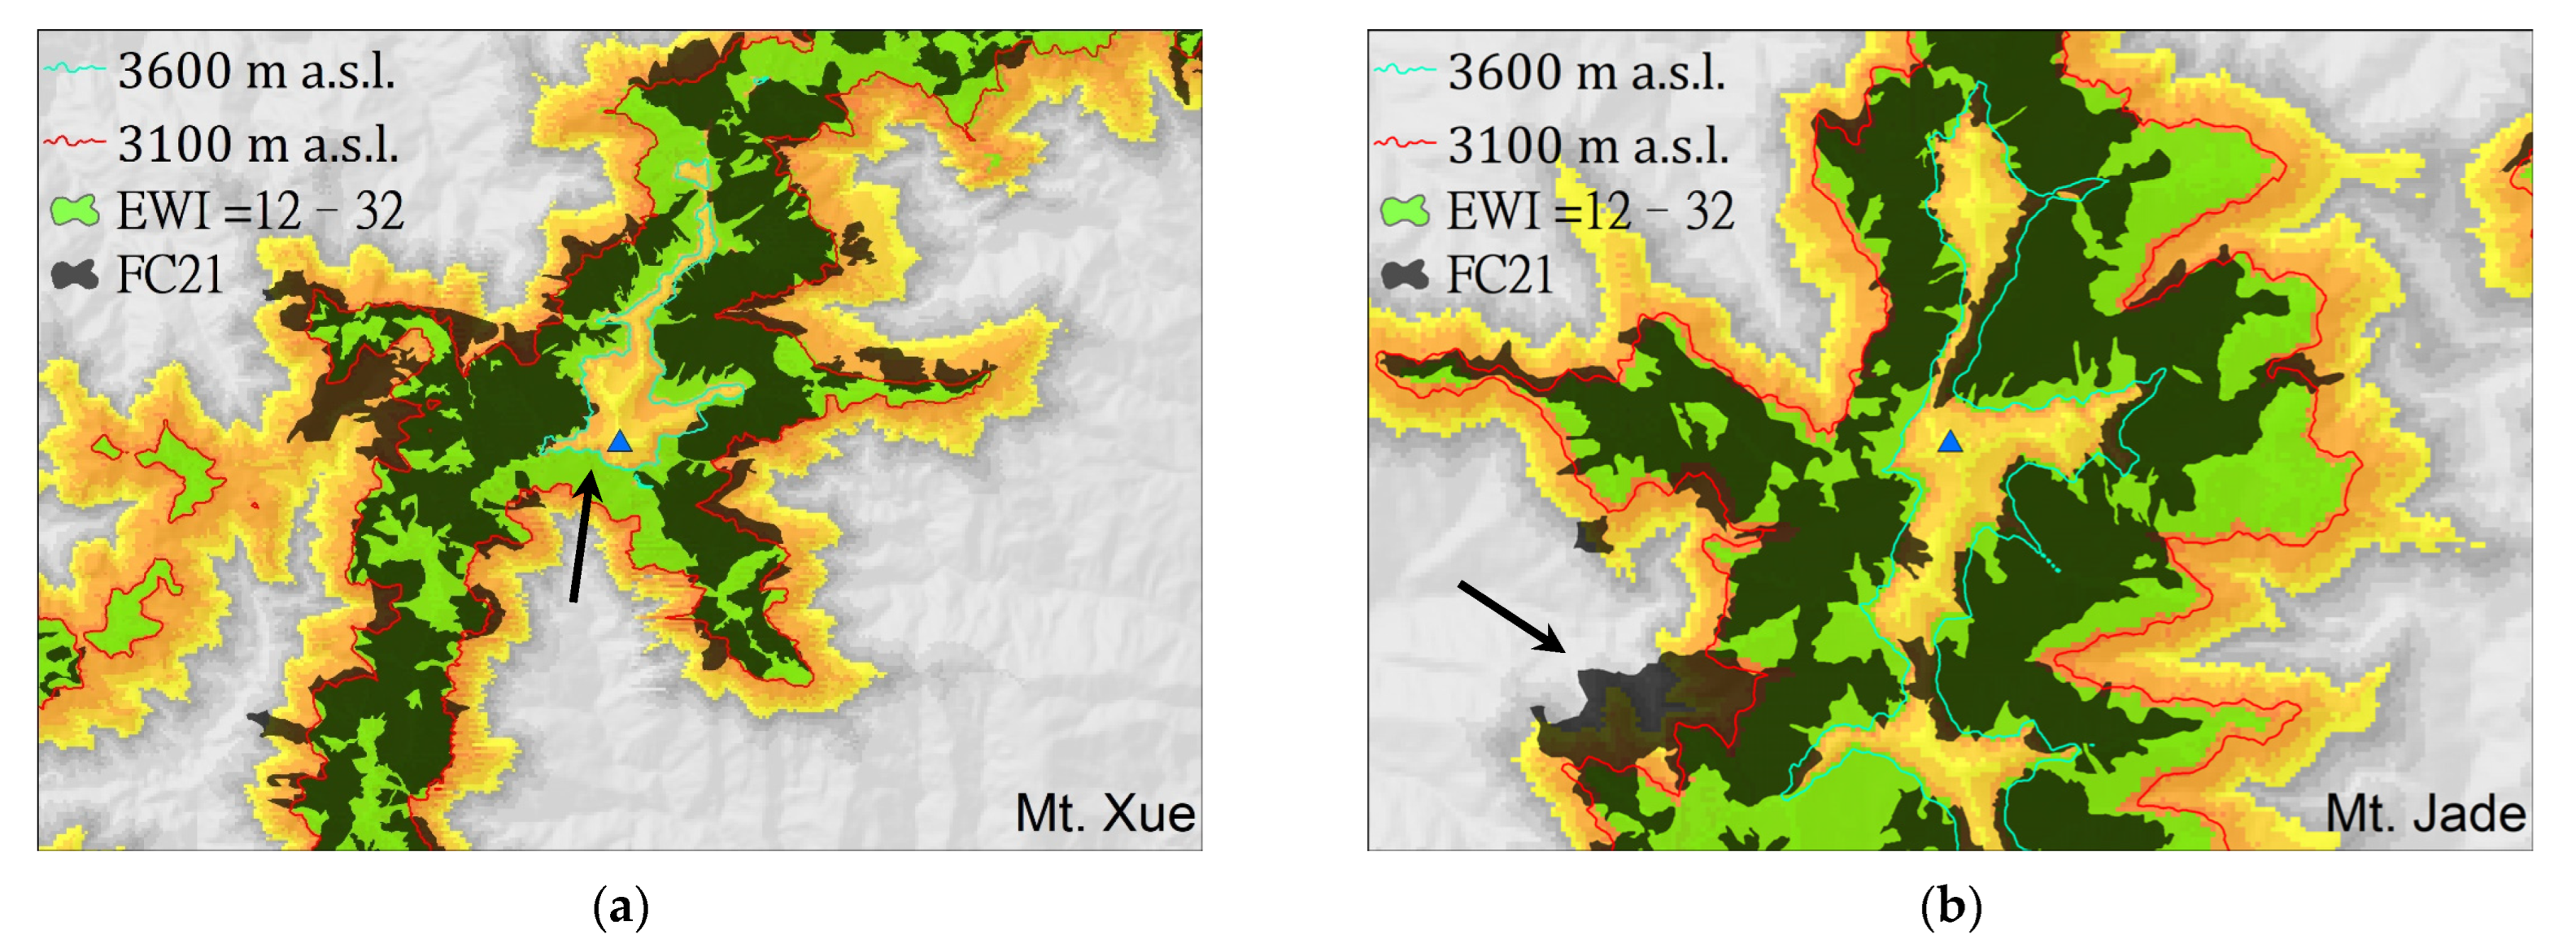
Range of EWI (effective warmth index) = 12–3220,922PotentialUse of the more ecologically significant thermal index (relative to the altitude) to estimate the temperature niche of the A. kawakamii forest belt [46]
Range of WI (warmth index) = 12–3620,989PotentialUse of the more ecologically significant thermal index (relative to the altitude) to estimate the temperature niche of the A. kawakamii forest belt [50]
Presence range of potential distribution for the current climate73,151PotentialA species-suitable index value [51] or predicted probability of occurrence [16] of A. kawakamii individuals is higher than the presence threshold
Presence range of potential distribution for the +0.5 °C scenario51,323PotentialPredicted distribution of A. kawakamii by MaxEnt under the +0.5 °C scenario [52]
Presence range of potential distribution for the +1.0 °C scenario34,476PotentialPredicted distribution of A. kawakamii by MaxEnt under the +1.0 °C scenario [52]
Presence range of potential distribution for the +1.5 °C scenario22,106PotentialPredicted distribution of A. kawakamii by MaxEnt under the +1.5 °C scenario [52]
Presence range of potential distribution for the +2.0 °C scenario7338PotentialPredicted distribution of A. kawakamii by MaxEnt under the +2.0 °C scenario [52]

3. Discussion

3.1. Current Actual Distribution of A. kawakamii

A. kawakamii grows in the altitude zone of 2300–3800 m asl (Table 1), and the total actual area of A. kawakamii is 16,857 ha, which is less than the 20,000 ha claimed by the Taiwan Forest Bureau in previous investigations [42]. In the past, the low-altitude limit of A. kawakamii has been overestimated [20,50,53]. The area of A. kawakamii forest appearing in the 2700–3100 m altitude zone is 39.30%, and it is 57.0% in the 3100–3600 m zone and 96.3% in the 2700–3600 m zone. Many reports [24,26,50] have mentioned that A. kawakamii is mainly distributed at an altitude of 3100–3600 m asl. Therefore, we overlapped these two contour lines, and Figure 1b,c show that most A. kawakamii fall within this altitude range. Through field observation and investigation [25], it was determined that A. kawakamii exist as monodominant forests (Figure 5a) at 3100–3600 m, often mixing with Tsuga chinensis below 3100 m asl and mixing with Juniperus morrisonicola to form the forest line (Figure 5d) above 3600 m. The current actual distribution of A. kawakamii is located in the region of latitude 23.05120–24.47351 N and longitude 120.86114–121.49303 E (Figure 1a). Compared with A. fansipanensis, which is distributed in the southernmost limits of Eurasian Abies species and only occurs on mountains of 2900–3100 m in northern Vietnam (latitude 22°18′ N and longitude 103°48′ E [22]), A. kawakamii is the second southernmost species in Asia. Both A. fansipanensis and A. kawakamii are isolated from the other Asian Abies in distribution and confined to the alpine range.

3.2. Potential Distribution Modeling by MaxEnt

Out of 21 pre-selected environmental variables, 13 variables were deleted in order to reduce redundancy and collinearity between variables [54] and to consider their contribution and ecological significance [10,55]. The AUC value of modeling A. kawakamii potential distribution by Maxent was 0.9628, which uses eight important environmental variables (Table 2) and indicates excellent accuracy [56].

3.2.1. Range of EWI = 12–32 vs. Actual Distribution of A. kawakamii

Su [50] used the warmth index (WI = 12–36) to define the A. kawakamii forest belt (with an area of 20,989 ha; in Table 3), which is widely used in Taiwan ecological fields. Meanwhile, Chiu et al. [46] further associated the temperature sum with thermal seasonality to propose the effective warmth index (EWI), and EWI = 12–32 can slightly better fit the A. kawakamii forest belt (area of 20,922 ha), as shown in Figure 3. When converting altitude into the thermal index, 3100–3600 m is approximately equivalent to EWI 12–32 (Figure 3). In order to cover the actual distribution of A. kawakamii, the lower limit of EWI should be further revised in the future.

3.2.2. Potential vs. Actual Distribution of A. kawakamii

Most research on the spatial distribution of plants is based on the equilibrium assumption; that is, analyzing the natural distribution of species to assess the actual living needs of the species [7]. However, due to the facts of chance, isolation, fundamental niche, realized niche [4,57], etc., the actual distribution of plants is often smaller than the potentially suitable distribution area. Thus, Figure 2 and Table 3 clearly show that the potential distribution area of A. kawakamii (73,151 ha; orange tone in Figure 2) is larger than the actual distribution area of A. kawakamii (16,857 ha; black polygon in Figure 2). As an example, in Figure 3a, the arrow indicates a suitable habitat for A. kawakamii, but they do not currently exist there due to the fact of past fire disturbances.

3.2.3. Distributions of Dominant Stands vs. Individuals of A. kawakamii

In Table 3, we use A. kawakamii individual, A. kawakamii-dominant forest, and A. kawakamii forest belt to represent the species growing in scattered individuals, sometimes isolated [16,51], in forest formations [24], and in the altitudinal vegetation belt [46,50], respectively. When a species forms a dominant forest, it is usually within its optimum ecological amplitude, and individual plants sometimes extend to the two ends of the environmental amplitude [58]. Our results clearly show that the present area of the simulated A. kawakamii individual (73,151 ha; Table 3) is wider than that of the A. kawakamii-dominant forest (16,857 ha; actual) or the A. kawakamii forest belt (20,922 or 20,989 ha predicted by EWI or WI).

3.2.4. The Influence of Non-Climatic Factors on the Distribution of A. kawakamii

Although the climatic climax theory can explain most or large-scale plant distributions, the interaction of factors such as soil, topography, and interspecies competition will modify the actual distribution of A. kawakamii. Therefore, the actual distribution of A. kawakamii does not appear in the potentially suitable areas near the tops of Mount Xue and Mount Jade (Figure 2b,c), where wind and rock avalanches are strong. On the other hand, the distribution of actual A. kawakamii in places with sheltered wind and good soil conditions may exceed its potential range, as indicated by the arrow at the bottom left in Figure 3b.

3.3. Potential Distribution under Climate Warming Scenarios

As can be seen from the overlapped map in Figure 4, A. kawakamii shrinks in distribution area under warming scenarios and shows a trend of gradual migration to higher altitudes. The decline in area and upward migration of A. kawakamii affected by climate warming are consistent with other Abies species or alpine and subalpine plants [35,36,59,60]. The potential distributions of A. kawakamii in the +0.5~+2.0 °C warming situations show different degrees of losses of 35,368–71,178 ha and gains of 276–580 ha (Table 4). The loss and gain of these potential distributions mean the upward movement of A. kawakamii toward suitable habitats. The range gained at +1.0 °C is not much different from that at +1.5 and +2.0 °C, because the only place where A. kawakamii can migrate upward is to the area above 3600 m asl. In addition to the aforementioned substantial decline in the potential habitats of A. kawakamii (Figure 4), its current actual distribution is also highly precarious. Due to the Abies sensitivity to warming [35,61], the loss of current actual habitats of A. kawakamii is likely to occur. Figure 6 reveals that the actual distributions of A. kawakamii in the +0.5~+2.0 °C warming scenarios show different degrees of losses of 3991–16,220 ha (also, see Table 4). With the time lag between warming and plant migration [62] and topographic disintegration and interspecies competition when up-shifting [63] (see the A. kawakamii forest line in Figure 5d), the gaining of new habitat (Figure 6) by A. kawakamii will be quite difficult; in particular, when the temperature rises by 2.0 °C, A. kawakamii will have lost 16,220 ha, leaving only 637 ha of habitat. That is, A. kawakamii will have lost almost all of its original habitat areas. These few opportunities to migrate to higher altitudes are a common predicament for alpine and subalpine plants [32,33,34,54] and for a variety of Asian subtropical and temperate Abies species [35,36].

3.4. Conservation and Challenges in the Future

In terms of the in situ conservation of A. kawakamii, it is basically only necessary to pay attention to fire disturbance. At present, almost all A. kawakamii are protected by national parks and wildlife refuges and have natural regeneration in monodominant forests (Figure 5c) and forest margins (Figure 5f), indicating that the in situ conservation of A. kawakamii is good. The most serious damage to A. kawakamii in recent years has been caused by man-made fires (Figure 5e), so it is necessary to strengthen fire prevention awareness. No serious pests, diseases, or ungulate animals have been found to harm A. kawakamii regeneration [64,65,66,67].
However, the sustainability of A. kawakamii is full of crises in the future. Our results point out that both the actual and potential A. kawakamii distribution will severely decline in the context of climate warming. In terms of ex situ conservation strategies, A. kawakamii seed storage is feasible. Abies species are classified as true orthodox seeds [68]. The Taiwan Forest Bureau (TFB) and Taiwan Forest Research Institute (TFRI) currently have a long-term store of A. kawakamii seeds. However, seeds for the preservation of marginal and genetically distinct A. kawakamii populations should be emphasized, and more biotechnology means have been proposed [69]. Due to the fact that A. kawakamii is limited to the highest mountain areas, the escape space available for migration is extremely limited. A. kawakamii that has uniform genetic diversity, low differentiation, low numbers of population-specific haplotypes, and neutral evolution characterizes contemporary refuge populations [70]. More is needed than just the ex situ planting that was recommended by Shao et al. [36]. Due to the various obstacles near the A. kawakamii forest line, such as topographic disintegration (the grey rubble in Figure 5d), interspecies competition when up-shifting [63], migration speed [59], and warming affecting seedling establishment, relevant research on A. kawakamii in the nursery and afforestation settings, suitable habitat availability, colonization, and migration will be necessary. Future climate warming could lead to tree-line advances if viable seeds and suitable substrates for recruitment are available [71]. Based on the fact that A. kawakamii is promoted by microclimate and topographic sheltering [72] (Figure 5g) and seedlings appear under Yushania niitakayamensis in the transition zone (Figure 5h), we suggest that long-term ecological monitoring programs and regeneration trials of A. kawakamii should be carried out in the valleys close to the forest line.

4. Materials and Methods

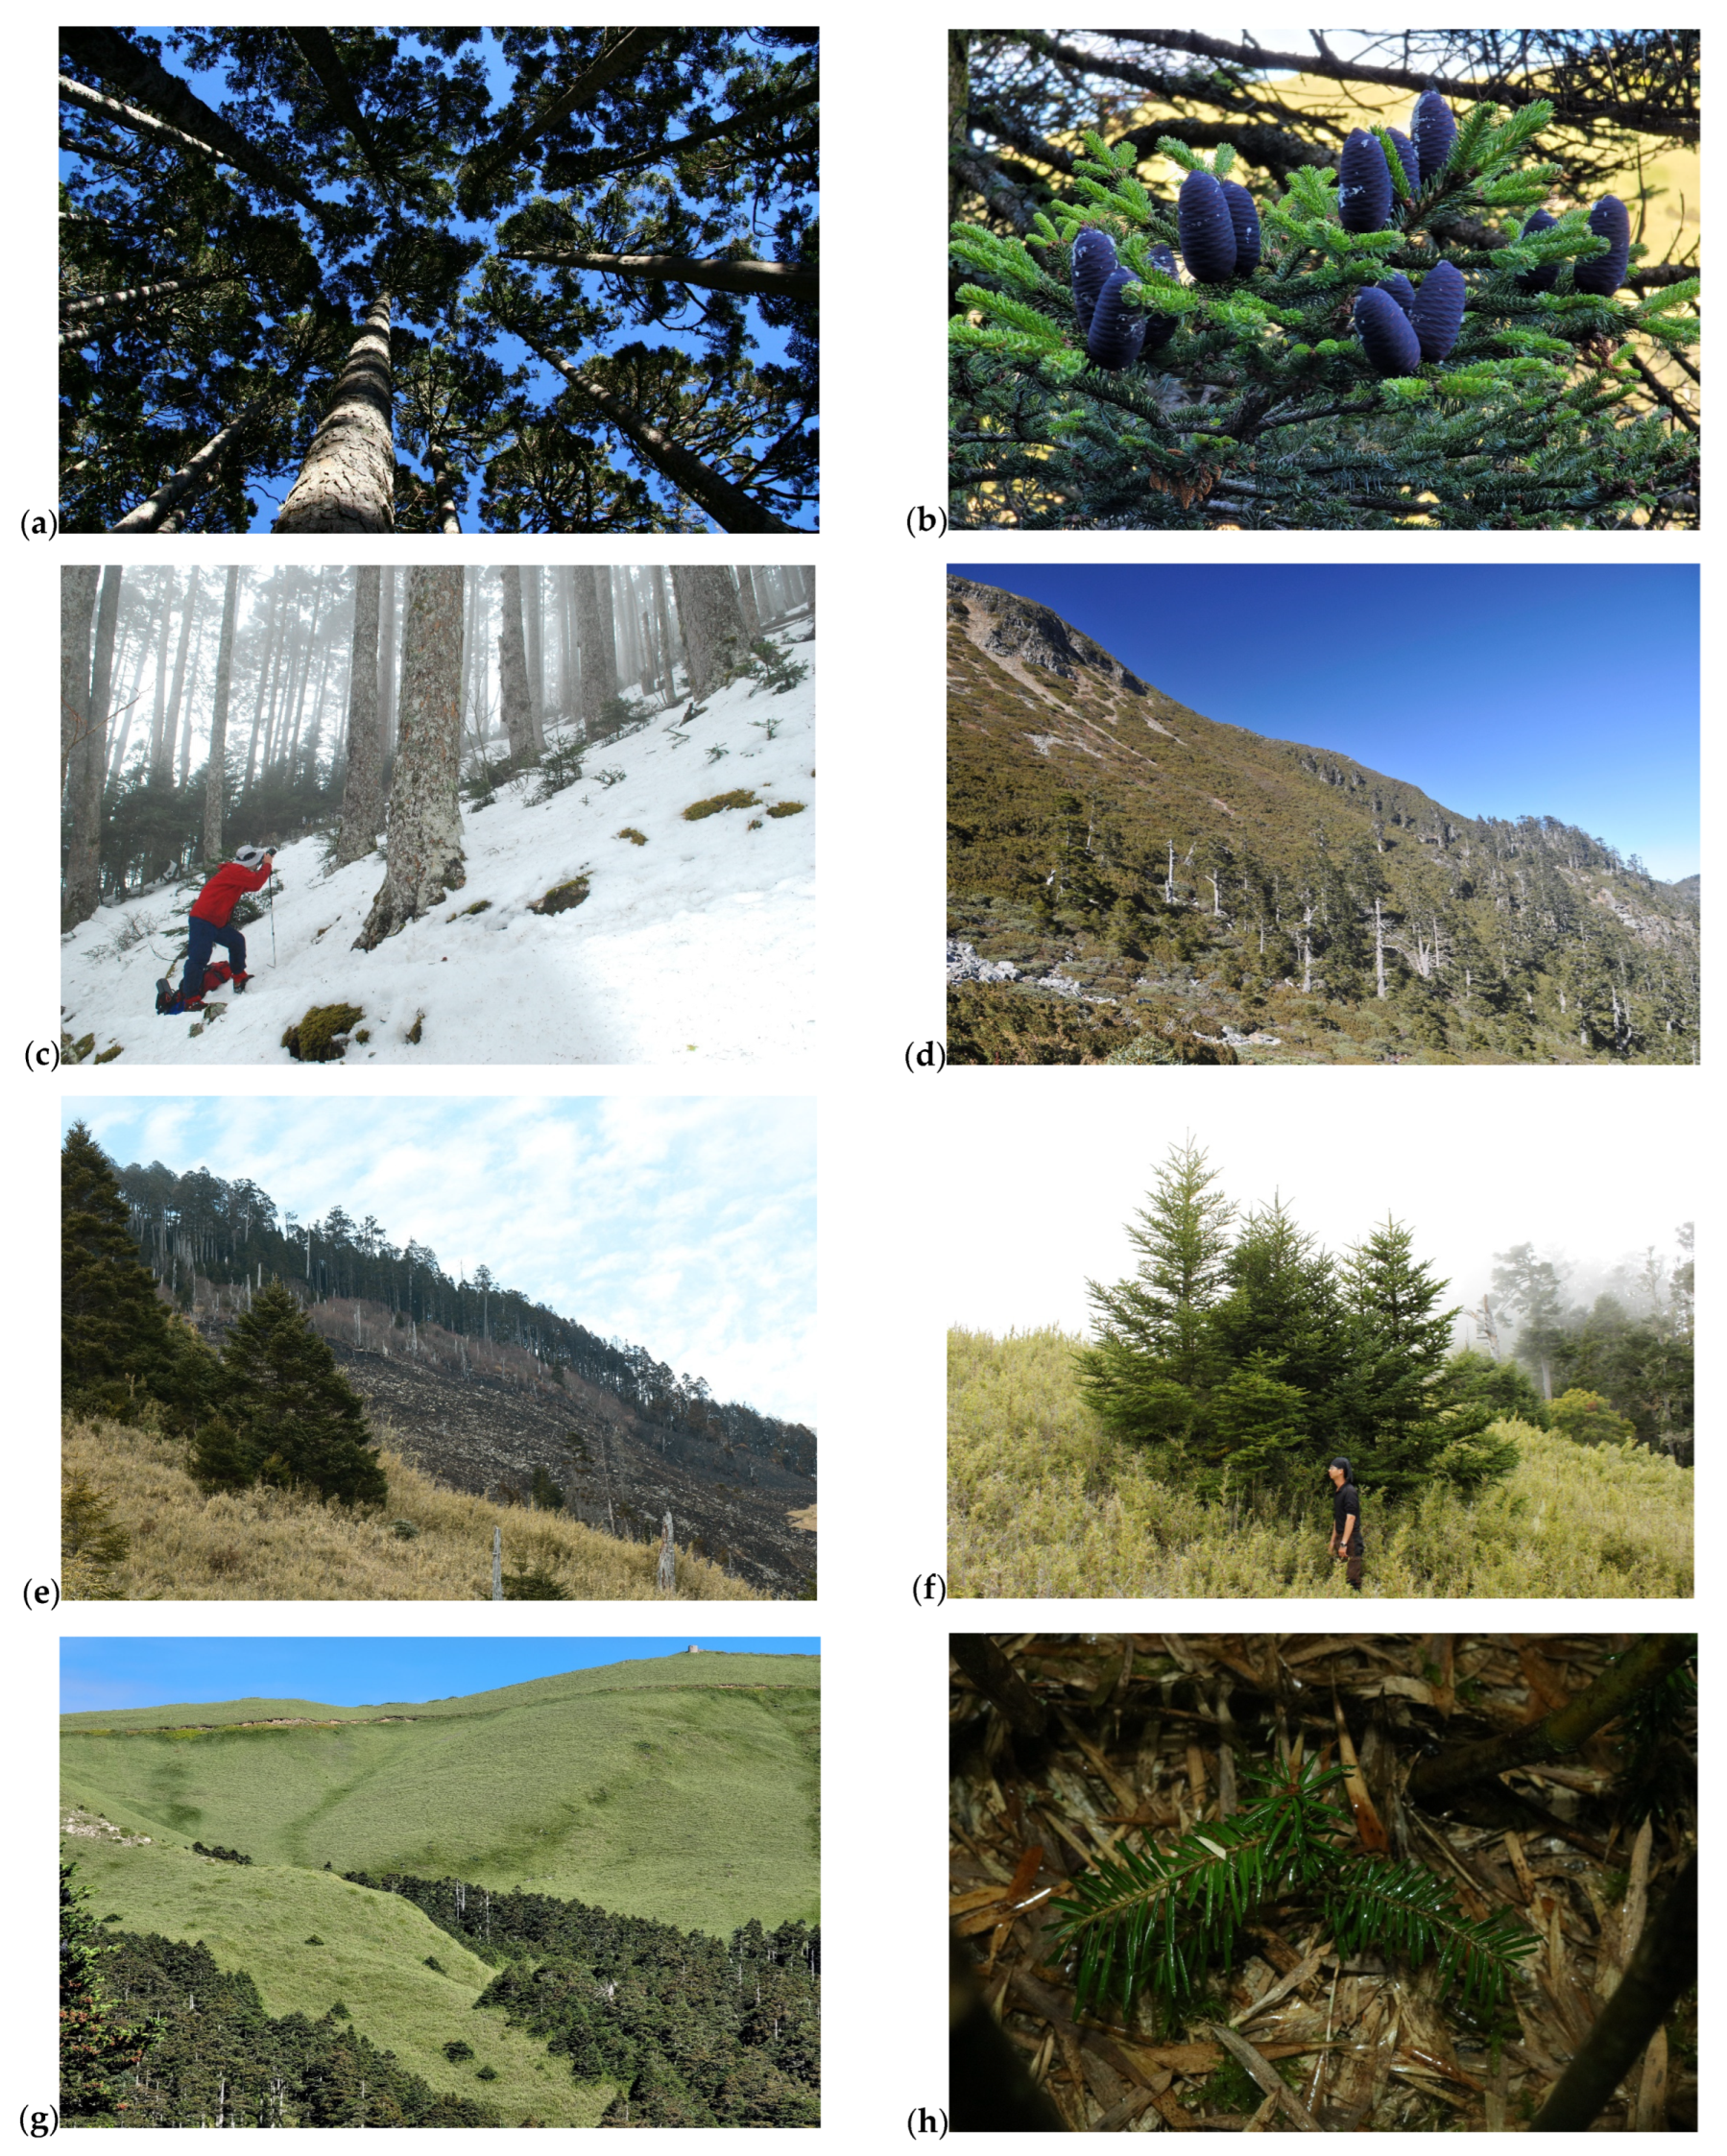
4.1. Study Area and Target Species

Taiwan is a mountain island in the continental shelf of East Asia (Figure 1). Its total area is approximately 35,889 km2. The highest peak is Mount Jade (3952 m asl), and the second highest is Mount Xue (3886 m asl). There are 268 high mountains above 3000 m asl, which is rare globally. The climate is dominated by the East Asian monsoon, with annual rainfall ranging from 1023 to 4880 mm and the annual average temperature ranging from 4.0 to 25.0 °C [73]. It has alternating winter and summer monsoons, and steep and complex terrain forms diverse plant habitats [50]. During the Ice Age, Taiwan became a refuge for many plants when a large land bridge extended from eastern China to Taiwan. Our target tree species, A. kawakamii, migrated from the Eurasian continent to Taiwan island through the Taiwan Strait [22].
Our target species, A. kawakamii, is a coniferous relic tree endemic in the high-altitude mountains of Taiwan [50]. It is the only Abies tree species that grows on subtropical islands and is close to the southernmost limit of Abies species [21,22]. In Taiwan, A. kawakamii exists in high-altitude areas, and it is almost a pure forest type (Figure 5a) with good fruiting conditions (Figure 5b). The A. kawakamii of today have good natural regeneration in gaps (Figure 5c). At approximately 3600 m asl, A. kawakamii has reached the upper limit of its distribution due to the facts of topography, geology, wind, and competition from krummholz species to form a forest line (Figure 5d).
In the past, the understanding of A. kawakamii spatial distribution was limited. There were descriptive reports of A. kawakamii altitude ranges such as 2400–3600 [20], 2800–3500 [53], and 3100–3600 m [24,50]. Until the completion of the Taiwan Vegetation Diversity Inventory and Mapping Project (TVDIM) [41], a vegetation map of A. kawakamii formation (FC21 polygon) was not available, and there is still no detailed analysis of its spatial distribution characteristics. The TVDIM project focused on the mapping of the existing natural vegetation. We extracted the FC21 polygon of the TVDIM vegetation map to further explore the actual distribution of A. kawakamii and its relationship with the environment.

4.2. SDM Calibration

In brief, SDM consists of three parts [10,74], namely, a dependent variable (species occurrence data), explanatory variables (environmental predictors), and an algorithm or function for representing species–environment relationships (modeling methods). In this article, we used a standard and robust SDM method for presence-only species data [19,75]—MaxEnt—to predict the suitable or potential distribution of A. kawakamii. The effectiveness of MaxEnt modeling depends on the appropriate sample sizes and prevalence of species occurrence points [76,77], and on the identification of environmental variables that can explain the species distribution [78,79].
The sources of species occurrence data of A. kawakamii included the following: (1) Individual coordinate records from our field survey, all herbariums, and the GBIF database [80]. After filtering for duplicate points and unreasonable coordinates (such as those located in the ocean), a total of 230 points of A. kawakamii were used for SDM. (2) Points extracted from the National Vegetation Diversity Inventory and Mapping Project (NVDIMP) database [41] at a fixed distance of 500 m were also used. In this way, 683 occurrence points of A. kawakamii were obtained. The 230 points of the former set were extremely unevenly distributed, and most of them were near hiking trails. Therefore, we selected the 683 evenly distributed occurrence points of the latter set as the dependent variable of SDM.
We evaluated a comprehensive set of 62 environmental variables (Table S1), and their consistent spatial resolution was a 40 m grid [10]. Based on our prior knowledge [80], we preselected 21 environmental variables that may affect the distribution of A. kawakamii. In order to reduce the redundancy and collinearity of variables [32,54], we adapted the synthetic strategy for integrating the correlation coefficient, contribution level, and expert choice of predictors to select the suitable environmental variables [10]. In addition, Taiwan shows a clear warming trend (1.0–1.4 °C/100 years) and no evidence supporting the possibility of precipitation changes [38]. Thus, we simulated the environment of climate warming with temperature increases of 0.5, 1.0, 1.5, and 2.0 °C and calculated the relevant climate variables in the four scenarios. Currently available high-resolution layers of global climate warming scenarios mainly include three databases: (1) CliMond [81,82] with a maximum resolution of 30 s, (2) WorldClim [51,83] with a maximum resolution of 10 s, and (3) CHELSA [84], although the spatial resolution of this database is too low for A. kawakamii. Therefore, in this study, a temperature increase of 2 °C was used as the climate warming scenario, and the 40 m spatial grid layer with temperature increases of 0.5, 1.0, 1.5, and 2.0 °C was recalculated for the environmental variables of MaxEnt. These layers were used as predictors of the influence of the warming scenario on A. kawakamii. MaxEnt [16,73,85] was adopted to predict the suitable or potential distribution of A. kawakamii in current and warming environments. The operating parameters were random 25-fold cross-validation, 5000 maximum iterations, and in the Cloglog output format with other default settings.

4.3. Accuracy Evaluation

The area under the receiver operating characteristic curve (AUC) [86] was used to evaluate the accuracy of MaxEnt. AUC measures the model’s ability to correctly classify a species as present or absent [87]. AUC values range between 0 and 1, with maximum accuracy achieved with values of 1, accuracy no better than random with values of 0.5, and values of <0.5 indicating performance worse than random [85]. The rough guide for classifying MaxEnt modeling accuracy [42] is excellent (AUC > 0.9), good (AUC = 0.8–0.9), average (AUC = 0.7–0.8), poor (AUC = 0.6–0.7), and insufficient (AUC = 0.5–0.6).

4.4. Threshold of Species Presence/Absence

MaxEnt produces continuous predictions, namely a Cloglog output, which can be regarded as a species-suitable index value [51] or predicted probability of presence [16]. There are several thresholds, including minimum training presence, 10 percentile training presence, equal training sensitivity and specificity, maximum training sensitivity plus specificity, equate entropy of threshold and original distributions, balance training omission, predicted area, and threshold value, to convert the continuous Cloglog suitability scores predictions of MaxEnt to species presence or absence [16]. The specific thresholds can convert the continuous probability to a binary (presence/absence) map that is easier to apply to species conservation and climate change impacts [88]. In this article, we adopted the recommendations of several reports [43,47,48,53] to use the equal training sensitivity and specificity and the maximum training sensitivity plus specificity as the threshold to reclassify the continuous Cloglog as the presence/absence map of A. kawakamii.

5. Conclusions

Taiwan is the only habitat of the relic species A. kawakamii globally. The detailed distribution and the impact of climate warming on A. kawakamii have been unclear in the past. This article explored the actual distribution of A. kawakamii. It is concentrated at an altitude of 2700–3600 m asl, covering only 16,857 ha. Its upper edge forms the forest line. In climate warming, the potential habitats of A. kawakamii will decline significantly, especially when the temperature rises by 2 °C, it will lose 97.3% of its area. Today, A. kawakamii is mainly protected by conservation areas, and its natural regeneration is good. However, it has minimal opportunities to move upwards under climate warming scenarios because it is on the highest mountain in Taiwan. In response to the impact of warming, research on the natural regeneration and artificial restoration of the upper edge of A. kawakamii should be strengthened in the future.

Supplementary Materials

The following supporting information can be downloaded at: https://0-www-mdpi-com.brum.beds.ac.uk/article/10.3390/plants11101346/s1, Table S1: List of the 62 environmental variables; Table S2: The pairwise Pearson correlation coefficients of 21 pre-selected environmental variables.

Author Contributions

Conceptualization, C.-A.C., H.-Y.T. and M.-C.L.; methodology, software, validation, and formal analysis, C.-A.C., H.-Y.T., C.-T.L. and M.-C.L.; investigation, resources, and data curation, C.-A.C., H.-Y.T. and K.-C.C.; writing—original draft preparation, C.-A.C.; writing—review and editing, H.-Y.T. and M.-C.L.; visualization, C.-T.L.; supervision, project administration, and funding acquisition, H.-Y.T. All authors have read and agreed to the published version of the manuscript.

Funding

This work was supported by the Shei-Pa National Park Headquarters, No. SP106114.

Institutional Review Board Statement

Not applicable.

Informed Consent Statement

Not applicable.

Data Availability Statement

Not applicable.

Acknowledgments

We acknowledge Wei Wang, Pei-Hua Li, Chih-Chiang Wang, and Hung-Chih Lin for the field data collection for this study. We are grateful to Shei-Pa National Park Headquarters for providing research funding and assistance.

Conflicts of Interest

The authors declare no conflict of interest.

References

  1. Guisan, A.; Thuiller, W. Predicting species distribution: Offering more than simple habitat models. Ecol. Lett. 2005, 8, 993–1009. [Google Scholar] [CrossRef] [PubMed]
  2. Elith, J.; Leathwick, J.R. Species distribution models: Ecological explanation and prediction across space and time. Annu. Rev. Ecol. Evol. Syst. 2009, 40, 677–697. [Google Scholar] [CrossRef]
  3. Franklin, J. Mapping Species Distributions: Spatial Inference and Prediction; Cambridge University Press: Cambridge, UK, 2009. [Google Scholar]
  4. Peterson, A.T.; Soberón, J.; Pearson, R.G.; Anderson, R.P.; Martínez-Meyer, E.; Nakamura, M.; Araújo, M.B. Ecological Niches and Geographic Distributions; Princeton University Press: Princeton, NJ, USA, 2011. [Google Scholar]
  5. Elith, J.; Franklin, J. Species Distribution Modeling. In Encyclopedia of Biodiversity, 2nd ed.; Levin, S.A., Ed.; Elsevier Inc.: Amsterdam, The Netherlands, 2013; pp. 692–705. [Google Scholar]
  6. Franklin, J. Moving beyond static species distribution models in support of conservation biogeography: Moving beyond static species distribution models. Divers. Distrib. 2010, 16, 321–330. [Google Scholar] [CrossRef]
  7. Booth, T.H. Species distribution modelling tools and databases to assist managing forests under climate change. For. Ecol. Manag. 2018, 430, 196–203. [Google Scholar] [CrossRef]
  8. Westwood, R.; Westwood, A.R.; Hooshmandi, M.; Pearson, K.; LaFrance, K.; Murray, C. A field-validated species distribution model to support management of the critically endangered Poweshiek skipperling (Oarisma poweshiek) butterfly in Canada. Conserv. Sci. Pract. 2020, 2, e163. [Google Scholar] [CrossRef] [Green Version]
  9. Guisan, A.; Tingley, R.; Baumgartner, J.B.; Naujokaitis-Lewis, I.; Sutcliffe, P.R.; Tulloch, A.I.T.; Regan, T.J.; Brotons, L.; McDonald-Madden, E.; Mantyka-Pringle, C.; et al. Predicting species distributions for conservation decisions. Ecol. Lett. 2013, 16, 1424–1435. [Google Scholar] [CrossRef]
  10. Lin, C.T.; Chiu, C.A. Comparison of predictor selection procedures in species distribution modeling: A case study of Fagus hayatae. Cerne 2020, 26, 172–182. [Google Scholar] [CrossRef]
  11. Guisan, A.; Thuiller, W.; Zimmermann, N.E. Habitat Suitability and Distribution Models: With Applications in R.; Cambridge University Press: Cambridge, UK, 2017. [Google Scholar]
  12. Mainali, K.P.; Warren, D.L.; Dhileepan, K.; McConnachie, A.; Strathie, L.; Hassan, G.; Karki, D.; Shrestha, B.B.; Parmesan, C. Projecting future expansion of invasive species: Comparing and improving methodologies for species distribution modeling. Glob. Chang. Biol. 2015, 21, 4464–4480. [Google Scholar] [CrossRef]
  13. Norberg, A.; Abrego, N.; Blanchet, F.G.; Adler, F.R.; Anderson, B.J.; Anttila, J.; Araújo, M.B.; Dallas, T.; Dunson, D.; Elith, J.; et al. A comprehensive evaluation of predictive performance of 33 species distribution models at species and community levels. Ecol. Monogr. 2019, 89, e01370. [Google Scholar] [CrossRef]
  14. Phillips, S.J.; Anderson, R.P.; Schapire, R.E. Maximum entropy modeling of species geographic distributions. Ecol. Model. 2006, 190, 231–259. [Google Scholar] [CrossRef] [Green Version]
  15. Phillips, S.J.; Dudík, M. Modeling of species distributions with Maxent: New extensions and a comprehensive evaluation. Ecography 2008, 31, 161–175. [Google Scholar] [CrossRef]
  16. Phillips, S.J.; Anderson, R.P.; Dudík, M.; Schapire, R.E.; Blair, M.E. Opening the black box: An open-source release of Maxent. Ecography 2017, 40, 887–893. [Google Scholar] [CrossRef]
  17. Wan, J.Z.; Wang, C.J.; Tan, J.F.; Yu, F.H. Climatic niche divergence and habitat suitability of eight alien invasive weeds in China under climate change. Ecol. Evol. 2017, 7, 1541–1552. [Google Scholar] [CrossRef] [PubMed] [Green Version]
  18. Nguyen, T.T.; Gliottone, I.; Pham, M.P. Current and future predicting habitat suitability map of Cunninghamia konishii Hayata using MaxEnt model under climate change in Northern Vietnam. Eur. J. Ecol. 2021, 7, 1–17. [Google Scholar] [CrossRef]
  19. Kaky, E.; Nolan, V.; Alatawi, A.; Gilbert, F. A comparison between Ensemble and MaxEnt species distribution modelling approaches for conservation: A case study with Egyptian medicinal plants. Ecol. Inform. 2020, 60, 101150. [Google Scholar] [CrossRef]
  20. Liu, T.S. A Monograph of the Genus Abies; Department of Forestry, College of Agriculture National Taiwan University: Taipei, Taiwan, 1971. [Google Scholar]
  21. Xiang, X.; Cao, M.; Zhou, Z. Fossil history and modern distribution of the genus Abies (Pinaceae). Front. For. China 2007, 2, 355–365. [Google Scholar] [CrossRef]
  22. Xiang, Q.P. Abies fansipanensis—A new species of the genus Abies from Vietnam. J. Syst. Evol. 1997, 35, 356–359. [Google Scholar]
  23. Su, H.J. Studies on the climate and vegetation types of the natural forests in Taiwan (III): A scheme of geographical climatic regions. Q. J. China For. 1985, 18, 33–44. [Google Scholar]
  24. Chiu, C.A.; Lin, H.C.; Liao, M.C.; Tseng, Y.H.; Ou, C.H.; Lu, K.C.; Tzeng, H.Y. A physiognomic classification scheme of potential vegetation of Taiwan. Q. J. For. Res. 2008, 30, 89–112. [Google Scholar]
  25. Liao, M.C.; Tsai, S.T.; Wang, W.; Tzeng, H.Y.; Ou, C.H. Study on population structure of Abies kawakamii (Hayata) Ito in East Xue Trail of Xue Mountain. Q. J. For. Res. 2013, 35, 1–14. [Google Scholar]
  26. Li, P.H.; Liao, M.C.; Tzeng, H.Y.; Tseng, Y.H.; Yen, T.M. Applicability evaluation of tree volume equation for Abies kawakamii (Hayata) Ito based on stem analysis data in Taiwan. J. For. Res. 2021, 26, 336–343. [Google Scholar] [CrossRef]
  27. Wang, W.; Liao, M.C.; Tzeng, H.Y. Competition in Abies kawakamii forests at subtropical high mountain in Taiwan. PLoS ONE 2021, 16, e0254791. [Google Scholar] [CrossRef] [PubMed]
  28. Wang, W.; Chiu, C.A.; Tsai, S.T.; Hsu, C.K.; Tzeng, H.Y.; Lu, K.C. Vegetation Research along the East Trail of Mt. Shei. Q. J. For. Res. 2010, 32, 15–34. [Google Scholar]
  29. Morley, P.; Donoghue, D.; Chen, J.C.; Jump, A.S. Integrating remote sensing and demography for more efficient and effective assessment of changing mountain forest distribution. Ecol. Inform. 2018, 43, 106–115. [Google Scholar] [CrossRef] [Green Version]
  30. Pauli, H.; Gottfried, M.; Grabherr, G. Effects of climate change on mountain–Ecosystemsupward shifting of alpine plants. World Resour. Rev. 1996, 8, 382–390. [Google Scholar]
  31. Winkler, D.E.; Lubetkin, K.C.; Carrell, A.A.; Jabis, M.D.; Yang, Y.; Kueppers, L.M. Responses of Alpine Plant Communities to Climate Warming. Ecosystem Consequences of Soil Warming; Academic Press: Cambridge, MA, USA, 2019; pp. 297–346. [Google Scholar]
  32. Randin, C.F.; Vuissoz, G.; Liston, G.E.; Vittoz, P.; Guisan, A. Introduction of snow and geomorphic disturbance variables into predictive models of alpine plant distribution in the Western Swiss Alps. Arct. Antarct. Alp. Res. 2009, 41, 347–361. [Google Scholar] [CrossRef]
  33. Bell, D.M.; Bradford, J.B.; Lauenroth, W.K. Mountain landscapes offer few opportunities for high-elevation tree species migration. Glob. Chang. Biol. 2014, 20, 1441–1451. [Google Scholar] [CrossRef]
  34. Maxwell, C.J.; Scheller, R.M. Identifying Habitat Holdouts for High Elevation Tree Species Under Climate Change. Front. For. Glob. Chang. 2020, 2, 94. [Google Scholar] [CrossRef]
  35. Koo, K.A.; Kong, W.S.; Park, S.U.; Lee, J.H.; Kim, J.; Jung, H. Sensitivity of Korean fir (Abies koreana Wils.), a threatened climate relict species, to increasing temperature at an island subalpine area. Ecol. Model. 2017, 353, 5–16. [Google Scholar] [CrossRef]
  36. Shao, Y.Z.; Zhang, X.C.; Phan, L.K.; Xiang, Q.P. Elevation shift in Abies Mill. (Pinaceae) of subtropical and temperate China and Vietnam—Corroborative evidence from cytoplasmic DNA and ecological niche modeling. Front. Plant Sci. 2017, 8, 578. [Google Scholar] [CrossRef] [Green Version]
  37. Altman, J.; Treydte, K.; Pejcha, V.; Cerny, T.; Petrik, P.; Srutek, M.; Song, J.S.; Trouet, V.; Dolezal, J. Tree growth response to recent warming of two endemic species in Northeast Asia. Clim. Chang. 2020, 162, 1345–1364. [Google Scholar] [CrossRef]
  38. Hsu, H.H.; Chen, C.T. Observed and projected climate change in Taiwan. Meteorol. Atmos. Phys. 2002, 79, 87–104. [Google Scholar] [CrossRef]
  39. Jump, A.S.; Huang, T.J.; Chou, C.H. Rapid altitudinal migration of mountain plants in Taiwan and its implications for high altitude biodiversity. Ecography 2012, 35, 204–210. [Google Scholar] [CrossRef]
  40. O’Sullivan, K.S.W.; Ruiz-Benito, P.; Chen, J.C.; Jump, A.S. Onward but not always upward: Individualistic elevational shifts of tree species in subtropical montane forests. Ecography 2021, 44, 112–123. [Google Scholar] [CrossRef]
  41. Chiou, C.R.; Hsieh, C.F.; Wang, J.C.; Chen, M.Y.; Liu, H.Y.; Yeh, C.L.; Yang, S.Z.; Chen, T.Y.; Hsia, Y.J.; Song, G.Z.M. The first national vegetation inventory in Taiwan. Taiwan J. For. Res. 2009, 24, 295–302. [Google Scholar]
  42. Parolo, G.; Rossi, G. Upward migration of vascular plants following a climate warming trend in the Alps. Basic Appl. Ecol. 2008, 9, 100–107. [Google Scholar] [CrossRef]
  43. Liu, C.; Berry, P.M.; Dawson, T.P.; Pearson, R.G. Selecting thresholds of occurrence in the prediction of species distributions. Ecography 2005, 28, 385–393. [Google Scholar] [CrossRef]
  44. Cao, Y.; DeWalt, R.E.; Robinson, J.L.; Tweddale, T.; Hinz, L.; Pessino, M. Using Maxent to model the historic distributions of stonefly species in Illinois streams: The effects of regularization and threshold selections. Ecol. Model. 2013, 259, 30–39. [Google Scholar] [CrossRef]
  45. Trisurat, Y.; Bhumpakphan, N. Effects of land use and climate change on Siamese Eld’s Deer (Rucervus eldii siamensis) distribution in the transboundary conservation area in Thailand, Cambodia, and Lao PDR. Front. Environ. Sci. 2018, 6, 35. [Google Scholar] [CrossRef] [Green Version]
  46. Chiu, C.A.; Lin, P.H.; Hsu, C.K.; Shen, Z.H. A novel thermal index improves prediction of vegetation zones: Associating temperature sum with thermal seasonality. Ecol. Indic. 2012, 23, 668–674. [Google Scholar] [CrossRef]
  47. Holdrige, L.R. Life Zone Ecology; Tropical Science Center: San José, Costa Rica, 1967; p. 148. [Google Scholar]
  48. Fick, S.E.; Hijmans, R.J. WorldClim 2: New 1-km spatial resolution climate surfaces for global land areas. Int. J. Climatol. 2017, 37, 4302–4315. [Google Scholar] [CrossRef]
  49. Lai, Y.J.; Chou, M.D.; Lin, P.H. Parameterization of topographic effect on surface solar radiation. J. Geophys. Res. Atmos. 2010, 115, D01104. [Google Scholar] [CrossRef] [Green Version]
  50. Su, H.J. Studies on the climate and vegetation types of the natural forests in Taiwan (II): Altitudinal vegetation zones in relation to temperature gradient. Q. J. Chin. For. 1984, 17, 57–73. [Google Scholar]
  51. Elith, J.; Phillips, S.J.; Hastie, T.; Dudík, M.; Chee, Y.E.; Yates, C.J. A statistical explanation of MaxEnt for ecologists. Divers. Distrib. 2011, 17, 43–57. [Google Scholar] [CrossRef]
  52. Ngarega, B.K.; Masocha, V.F.; Schneider, H. Forecasting the effects of bioclimatic characteristics and climate change on the potential distribution of Colophospermum mopane in southern Africa using Maximum Entropy (Maxent). Ecol. Inform. 2021, 65, 101419. [Google Scholar] [CrossRef]
  53. Liu, Y.C.; Lu, F.Y.; Ou, C.H. Trees of Taiwan; Monographic Publication No. 7; College of Agriculture, National Chung-Shing University: Taichung, Taiwan, 1988. [Google Scholar]
  54. Taiwan Forest Bureau/Anonymous. The Third Forest Resources and Land Use Inventory in Taiwan; Taiwan Forest Bureau, Province Council of Agriculture: Taipei, Taiwan, 1995.
  55. Randin, C.F.; Engler, R.; Normand, S.; Zappa, M.; Zimmermann, N.E.; Pearman, P.B.; Vittoz, P.; Thuiller, W.; Guisan, A. Climate change and plant distribution: Local models predict high-elevation persistence. Glob. Chang. Biol. 2009, 15, 1557–1569. [Google Scholar] [CrossRef] [Green Version]
  56. Porfirio, L.L.; Harris, R.M.; Lefroy, E.C.; Hugh, S.; Gould, S.F.; Lee, G.; Bindoff, N.L.; Mackey, B. Improving the use of species distribution models in conservation planning and management under climate change. PLoS ONE 2014, 9, e113749. [Google Scholar] [CrossRef] [Green Version]
  57. Barve, N.; Barve, V.; Jiménez-Valverde, A.; Lira-Noriega, A.; Maher, S.P.; Peterson, A.T.; Soberón, J.; Villalobos, F. The crucial role of the accessible area in ecological niche modeling and species distribution modeling. Ecol. Model. 2011, 222, 1810–1819. [Google Scholar] [CrossRef]
  58. Whittaker, R.H. Evolution and Measurement of Species Diversity. Taxon 1972, 21, 213–251. [Google Scholar] [CrossRef] [Green Version]
  59. Chen, I.C.; Hill, J.K.; Ohlemüller, R.; Roy, D.B.; Thomas, C.D. Rapid range shifts of species associated with high levels of climate warming. Science 2011, 333, 1024–1026. [Google Scholar] [CrossRef]
  60. Zu, K.; Wang, Z.; Zhu, X.; Lenoir, J.; Shrestha, N.; Lyu, T.; Luo, A.; Li, Y.; Ji, C.; Peng, S.; et al. Upward shift and elevational range contractions of subtropical mountain plants in response to climate change. Sci. Total Environ. 2021, 783, 146896. [Google Scholar] [CrossRef] [PubMed]
  61. Rabasa, S.G.; Granda, E.; Benavides, R.; Kunstler, G.; Espelta, J.M.; Ogaya, R.; Peñuelas, J.; Scherer-Lorenzen, M.; Gil, W.; Grodzki, W.; et al. Disparity in elevational shifts of E uropean trees in response to recent climate warming. Glob. Chang. Biol. 2013, 19, 2490–2499. [Google Scholar] [CrossRef] [PubMed]
  62. Zimmer, A.; Meneses, R.I.; Rabatel, A.; Soruco, A.; Dangles, O.; Anthelme, F. Time lag between glacial retreat and upward migration alters tropical alpine communities. Perspect. Plant Ecol. Evol. Syst. 2018, 30, 89–102. [Google Scholar] [CrossRef]
  63. Schickhoff, U.; Bobrowski, M.; Böhner, J.; Bürzle, B.; Chaudhary, R.P.; Gerlitz, L.; Heyken, H.; Lange, J.; Müller, M.; Scholten, T.; et al. Do Himalayan treelines respond to recent climate change? An evaluation of sensitivity indicators. Earth Syst. Dyn. 2015, 6, 245–265. [Google Scholar] [CrossRef]
  64. McCain, A.H.; Scharpf, R.F. Phytophthora shoot blight and canker disease of Abies spp. Plant Dis. 1986, 70, 1036–1037. [Google Scholar] [CrossRef]
  65. Tsankov, G.; Mirchev, P.; Ovcharov, D. Insect pests and their role in the decline and dying of silver fir (Abies alba) in Bulgaria. Nauka Za Gorata 1994, 31, 23–33. [Google Scholar]
  66. Motta, R. Impact of wild ungulates on forest regeneration and tree composition of mountain forests in the Western Italian Alps. For. Ecol. Manag. 1996, 88, 93–98. [Google Scholar] [CrossRef]
  67. Klopcic, M.; Jerina, K.; Boncina, A. Long-term changes of structure and tree species composition in Dinaric uneven-aged forests: Are red deer an important factor? Eur. J. For. Res. 2010, 129, 277–288. [Google Scholar] [CrossRef]
  68. Bonner, F.T. Storage of Seeds. In The Woody Plant Seed Material. Agriculture Handbook 727; USDA, Forest Service: Washington, DC, USA, 2008; pp. 85–96. [Google Scholar]
  69. Krajňáková, J.; Gömöry, D.; Häggman, H. Biotechnology tools for conservation of the biodiversity of European and Mediterranean Abies species. In Biotechnology and Biodiversity. Sustainable Development and Biodiversity; Ahuja, M.R., Ramawat, K.G., Eds.; Springer International Publishing: Cham, Switzerland, 2014; Volume 14, pp. 287–310. [Google Scholar]
  70. Shih, F.L.; Hwang, S.Y.; Cheng, Y.P.; Lee, P.F.; Lin, T.P. Uniform genetic diversity, low differentiation, and neutral evolution characterize contemporary refuge populations of Taiwan fir (Abies kawakamii, Pinaceae). Am. J. Bot. 2007, 94, 194–202. [Google Scholar] [CrossRef] [Green Version]
  71. Munier, A.; Hermanutz, L.; Jacobs, J.D.; Lewis, K. The interacting effects of temperature, ground disturbance, and herbivory on seedling establishment: Implications for treeline advance with climate warming. Plant Ecol. 2010, 210, 19–30. [Google Scholar] [CrossRef]
  72. Greenwood, S.; Chen, J.C.; Chen, C.T.; Jump, A.S. Strong topographic sheltering effects lead to spatially complex treeline advance and increased forest density in a subtropical mountain region. Glob. Chang. Biol. 2014, 20, 3756–3766. [Google Scholar] [CrossRef] [PubMed]
  73. Chiu, C.A.; Lin, P.H.; Lu, K.C. GIS-based tests for quality control of meteorological data and spatial interpolation of climate data: A case study in mountainous Taiwan. Mt. Res. Dev. 2009, 29, 339–349. [Google Scholar] [CrossRef]
  74. Sangermano, F.; Eastman, J.R. A GIS framework for the refinement of species geographic ranges. Int. J. Geogr. Inf. Sci. 2012, 26, 39–55. [Google Scholar] [CrossRef]
  75. Guisan, A.; Zimmermann, N.E.; Elith, J.; Graham, C.H.; Phillips, S.; Peterson, A.T. What matters for predicting the occurrences of trees: Techniques, data, or species’ characteristics? Ecol. Monogr. 2007, 77, 615–630. [Google Scholar] [CrossRef] [Green Version]
  76. Wisz, M.S.; Hijmans, R.J.; Li, J.; Peterson, A.T.; Graham, C.H.; Guisan, A.; NCEAS Predicting Species Distributions Working Group. Effects of sample size on the performance of species distribution models. Divers. Distrib. 2008, 14, 763–773. [Google Scholar] [CrossRef]
  77. Grimmett, L.; Whitsed, R.; Horta, A. Presence-only species distribution models are sensitive to sample prevalence: Evaluating models using spatial prediction stability and accuracy metrics. Ecol. Model. 2020, 431, 109194. [Google Scholar] [CrossRef]
  78. Austin, M.P.; Van Niel, K.P. Improving species distribution models for climate change studies: Variable selection and scale: Species distribution models for climate change studies: Variable selection and scale. J. Biogeogr. 2011, 38, 1–8. [Google Scholar] [CrossRef]
  79. Fourcade, Y.; Besnard, A.G.; Secondi, J. Paintings predict the distribution of species, or the challenge of selecting environmental predictors and evaluation statistics. Glob. Ecol. Biogeogr. 2018, 27, 245–256. [Google Scholar] [CrossRef]
  80. Global Biodiversity Information Facility. Available online: https://www.gbif.org/ (accessed on 5 December 2021).
  81. Kriticos, D.J.; Webber, B.L.; Leriche, A.; Ota, N.; Macadam, I.; Bathols, J.; Scott, J.K. CliMond: Global high resolution historical and future scenario climate surfaces for bioclimatic modelling. Methods Ecol. Evol. 2012, 3, 53–64. [Google Scholar] [CrossRef]
  82. Global Climatologies for Bioclimatic Modelling. Available online: https://www.climond.org (accessed on 20 December 2021).
  83. Global Climate and Weather Data. Available online: https://www.worldclim.org (accessed on 6 December 2021).
  84. Climatologies at High Resolution for the Earth’s Land Surface Areas. Available online: https://www.chelsa-climate.org (accessed on 3 January 2022).
  85. Steven, J.P.; Dudik, M.; Schapire, R.E. Maxent Software for Modeling Species Niches and Distributions (Version 3.4.1). Available online: https://biodiversityinformatics.amnh.org/open_source/maxent/ (accessed on 20 December 2021).
  86. Swets, J.A. Measuring the accuracy of diagnostic systems. Science 1988, 240, 1285–1293. [Google Scholar] [CrossRef] [Green Version]
  87. Krause, C.M.; Cobb, N.S.; Pennington, D.D. Range shifts under future scenarios of climate change: Dispersal ability matters for Colorado Plateau endemic plants. Nat. Areas J. 2015, 35, 428–438. [Google Scholar] [CrossRef]
  88. Lobo, J.M.; Jiménez-Valverde, A.; Real, R. AUC: A misleading measure of the performance of predictive distribution models. Glob. Ecol. Biogeogr. 2008, 17, 145–151. [Google Scholar] [CrossRef]
Figure 1. Actual distribution of Abies kawakamii (FC21 formation, black polygon) in Taiwan. Red line: 3100 m contour; blue line: 3600 m contour. (a) Taiwan island, (b) Mount Xue, and (c) Mount Jade.
Plants 11 01346 g001
Figure 2. Potential (occurrence probability under the current climate, orange tone) and actual (FC21 formation, black polygon) distribution of Abies kawakamii forest. (a) Taiwan island, (b) Mount Xue, and (c) Mount Jade.
Plants 11 01346 g002
Figure 3. Predictive distribution of Abies kawakamii, using EWI = 12–32 (green polygon), overlapping its actual (FC21, block polygon) and potential (occurrence probability, orange tone) distribution. (a) Mt. Xue and (b) Mt. Jade.
Plants 11 01346 g003
Figure 4. Changes in suitable habitat areas of A. kawakamii on Mount Xue (a) under different climate warming scenarios, (b) current climate, (c) under the +0.5 °C scenario, (d) under the +1.0 °C scenario, (e) under the +1.5 °C scenario, and (f) under the +2.0 °C scenario.
Plants 11 01346 g004
Figure 5. Abies kawakamii forests in Taiwan: (a) monodominant species forest, (b) cone of A. kawakamii, (c) gap regeneration (on the left), (d) forest line, (e) fire disturbance, (f) regeneration after fire disturbance, (g) topographic sheltering, and (h) seedling in understory, Yushania niitakayamensis.
Plants 11 01346 g005
Figure 6. Loss (warm color) and gain (blue) of A. kawakamii habitat areas on Mount Xue under the +0.5~+2.0 °C warming scenarios: (a) +0.5, (b) +1.0, (c) +1.5, and (d) +2.0 °C.
Plants 11 01346 g006
Table 1. The current actual area of A. kawakamii forest at each altitude range.
Elevation Zone (m)Area (ha)% of Total Area
2200–229900.0%
2300–239980.0%
2400–2499260.2%
2500–25991180.7%
2600–26992841.7%
2700–27995013.0%
2800–28999865.9%
2900–2999187411.1%
3000–3099326219.4%
3100–3199373622.2%
3200–3299277016.4%
3300–339916669.9%
3400–34999515.6%
3500–35994892.9%
3600–36991681.0%
3700–3799150.1%
3800–389900.0%
Total16,857100.0%
Table 4. Under the +0.5~+2.0 °C warming scenario, the loss and gain of A. kawakamii potential distributions in Taiwan.
ScenarioActual Distribution (16,857 ha)Potential Distribution (73,151 ha)
+0.5 °CLow loss: 3991 ha
Medium loss: 0 ha
High loss: 0 ha
The total area of loss: 3991 ha (23.7%)
Low loss: 35,368 ha
Medium loss: 0 ha
High loss: 0 ha
The total area of loss: 35,368 ha (48.3%)
Low gain: 276 ha
+1.0 °CLow loss: 7704 ha
Medium loss: 2153 ha
High loss: 0 ha
Total area of loss: 9857 ha (58.5%)
Low loss: 33,644 ha
Medium loss: 22,571 ha
High loss: 0 ha
Total area of loss: 56,216 ha (76.8%)
Low gain: 580 ha
+1.5 °CLow loss: 5925 ha
Medium loss: 7102 ha
High loss: 59 ha
Total area of loss: 13,086 ha (77.6%)
Low loss: 13,238 ha
Medium loss: 50,624 ha
High loss: 185 ha
Total area of loss: 64,047 ha (87.6%)
Low gain: 545 ha
+2.0 °CLow loss: 2923 ha
Medium loss: 4588 ha
High loss: 8709 ha
Total area of loss: 16,220 ha (96.2%)
Low loss: 4992 ha
Medium loss: 25,904 ha
High loss: 40,282 ha
Total area of loss: 71,178 ha (97.3%)
Low gain: 475 ha
Publisher’s Note: MDPI stays neutral with regard to jurisdictional claims in published maps and institutional affiliations.

