Article

Analysis, Modeling and Multi-Spectral Sensing for the Predictive Management of Verticillium Wilt in Olive Groves †

1
Industrial Systems Institute, Athena Research Center, 26504 Patras, Greece
2
Gaia Robotics S.A., 25002 Patras, Greece
3
Irida Labs S.A., 26504 Patras, Greece
*
Authors to whom correspondence should be addressed.
This paper is an extended version of our paper published in Artificial Intelligence of Things at the Core of Secure, Connected and Dependable CPS Workshop, SETN2020, Athens, Greece, 2–4 September 2020.
J. Sens. Actuator Netw. 2021, 10(1), 15; https://0-doi-org.brum.beds.ac.uk/10.3390/jsan10010015
Submission received: 30 November 2020 / Revised: 25 January 2021 / Accepted: 5 February 2021 / Published: 18 February 2021
(This article belongs to the Special Issue Secure, Efficient Cyber-Physical Systems and Wireless Sensors)

Abstract

:
The intensification and expansion in the cultivation of olives have contributed to the significant spread of Verticillium wilt, which is the most important fungal problem affecting olive trees. Recent studies confirm that practices such as the use of innovative natural minerals (Zeoshell ZF1) and the application of beneficial microorganisms (Micosat F BS WP) restore health in infected trees. However, for their efficient implementation the above methodologies require the marking of trees in the early stages of infestation—a task that is impractical with traditional means (manual labor) but also very difficult, as early stages are difficult to perceive with the naked eye. In this paper, we present the results of the My Olive Grove Coach (MyOGC) project, which used multispectral imaging from unmanned aerial vehicles to develop an olive grove monitoring system based on the autonomous and automatic processing of the multispectral images using computer vision and machine learning techniques. The goal of the system is to monitor and assess the health of olive groves, help in the prediction of Verticillium wilt spread and implement a decision support system that guides the farmer/agronomist.

1. Introduction

Olive cultivation in Greece is widespread. Olive groves occupy an area of more than 2 million acres, having about 130 million olive trees [1]. This represents a large percentage of the total agricultural land and a very large percentage of agricultural land that would be, considering territorial characteristics such as low fertility and sloping, difficult or impossible to exploit from other crops.
Verticillium wilt is the biggest fungal problem of olive cultivation. It contributes to a serious reduction in olive productivity, plant capital destruction and soil degradation. Verticillium wilt causes a gradual malfunction and eventually a complete blockage of the vessels of the tree, in part or in whole, interrupting the movement of water from the roots to the leaves, resulting in interruption of the water supply in the affected part of the tree. This reduction in water supply leads to nutritional deficiencies and even starvation of the branches. Before the complete blockage and total necrosis of the affected tissue associated with the part of the root that has been infected, there precedes a stage of temporary water stress, a reversible stress, which can be mainly attributed to the closure of the stomata of the affected plant tissue [2].
In this preliminary stage of temporary stress, deregulation in the process of photosynthesis is caused, since the leaf pigments that are responsible for the canopy photosynthetic activity (mainly chlorophyll) are unable to function properly [3]. This impediment of the photosynthetic activity leads to a subsequent degradation of the canopy pigment percentage which results in a slight light-green discoloration of the leaves; a discoloration that is very subtle and very difficult to detect with the naked eye, especially in its early stages where photosynthetic activity has been hampered but the percentage of chlorophyll pigments in the canopy remains unchanged.
Thermal and multispectral surveying has shown high correlations of leaves’ spectral characteristics with the degree of infestation (Table 1), as measured in the 11 point scale of Table 2 [4]. On this basis, using aerial imaging by unmanned aerial vehicles, we created the platform “My Olive Grove Coach” (MyOGC).
The main goal of MyOGC is the development of an intelligent system that will monitor olive groves and support farmers in the detection and treatment of Verticillium, using multispectral sensors and spectrophotometers. With MyOGC it will be possible to (a) collect important data on the progress of tree infestation; (b) quickly detect the problem using innovative signal processing methods and multispectral imaging and computer vision, in combination with machine learning techniques, thereby providing accurate spatial identification of affected trees; (c) guide the farmer/agronomist when required, with a communication and decision-making support system, with appropriate interventions and maps of quantitative and qualitative characteristics of the grove.

Related Work

Remote sensing of agricultural crops that facilitates the timely prediction of plant infestation by diseases has developed rapidly. Both in Greece and abroad, companies have been set up to provide services that monitor and support farmers and their fields. Table 3 presents platforms available to farmers and producers that offer remote monitoring of their fields and collection of agricultural data by remote sensing. Table 4 presents a comparison of some systems and data capturing sensors that are on the market, available as commercial solutions for monitoring vegetation and crops.
Apart from commercial applications targeting farmers and other specialists of the field, there is significant research interest in using remote sensing data [7,8,9,10,11] in relation to automating and facilitating all aspects of crops management, like disease monitoring, predicting and preventing [2,5], to crops yield monitoring and optimization [12,13,14,15].
Specific applications include computer vision algorithms targeting productivity monitoring through tree counting/tree crown delineation [7,8,10,16] and health assessment through calculations of vegetation indices [17,18]. More specifically, a very relevant approach has been proposed in [19] for fast detection of olive trees affected by xyllela fastidiosa using multispectral images from unmanned aerial vehicles (UAVs).
In the detection and delineation of individual tree crowns, deep learning and machine learning approaches [7,16,20] also exhibit commendable results. A recent semi-supervised approach [16], employing a convolutional neural network (CNN), combines Lidar and RGB data, yielding similar outcomes to classical unsupervised algorithms. CNNs were also used with multi-spectral imaging data [20,21]. In [20], a deep network was employed to differentiate trees, bare soil and weeds. Li et al. [22] developed a CNN framework to detect oil palm trees. Even though they provide accurate results, they need large amounts of training data.
There is also significant research going on in the use of visible and infrared spectroscopy for disease detection in plants in a fast, non-destructive and cost-effective manner. Photosynthetic pigments in the canopy of every plant, such as chlorophyll, anthocyanins and carotenoids interact with sunlight, constantly absorbing the energy of certain useful bands and reflecting the excess energy from bands that are not utilized in photosynthesis. The visible and infrared portions of the electromagnetic spectrum are the prime candidates for providing timely information on the physiological stress levels in the plants, even before the symptoms can be perceived from the human eye. Different studies have been conducted for disease detection in plants using this technology and new useful insights on the correlations between plant reflectance properties and their biophysical properties are being discovered constantly [23,24,25].
Lastly, on sourcing data for remote sensing, there exists a variety of active, passive and mixed sources, such as Geodetic Satellites, Lidars and more recently, UAVs [11,14,18,21,26,27] (Figure 1). Of those three main sources, none provide a clear advantage; rather, they compliment each other on the fronts of cost, resolving power, easiness of use and other relevant metrics. MyOGC uses unmanned aerial vehicles (UAVs), recognizing their low cost, ability for regular updates and resolving power as key advantages towards the goal of early infestation detection and accurate plant status classification. Other advantages of UAVs for use in precision agriculture are detailed in the recent survey in [26].

2. Materials and Methods

2.1. Conceptual Architecture

The MyOGC integrated system provides an overall automation solution for detecting the Verticillium wilt from aerial multi-spectral images. The basic user requirements for the MyOGC platform are to support different methods of data insertion—manually from the user or directly from the multispectral sensor located to the drone. Thus, it combines cloud and edge computing technologies, ensuring a highly efficient and scalable high-demanding data processing system and the execution of adapted AI prediction models in an embedded platform in the user’s edge devices. The functional module of the MyOGC platform is depicted in Figure 2.
The MyOGC system consists of four main sub systems: (a) The core has a coordination role; it provides the interfaces to the users and edge devices and it accepts and schedules data processes requests for execution in the other subsystems; (b) the data storage combines a classical relational database management system (RDBMS) and file system to store metadata, multi-spectral images and results; (c) the containers execution engine initiates containers which execute specific data processing tasks during a data processing pipeline; and (d) the drone hosts the edge device, a Coral Edge TPU device from Google, deployed for executing region of interest detection and classification tasks.
In the core subsystem, the process orchestrator is the module that receives input data and requests for processing. Such requests can be either the process of multi-spectral images of an olive field and the prediction of the spread of the disease on it, or use the stored data in order to train the AI prediction models (both cloud and embedded). According to the request, it selects the appropriate analysis workflow, it calculates the required resources and it proceeds to create the execution plan. The plan contains the data processing microservices that must be used and a workflow that defines the execution order of the analysis tasks. the process orchestrator coordinates and monitors the analysis workflow, initiating each step and passing the intermediate results between the tasks.
The two interfaces of the core subsystem are a graphical user interface (GUI) and a HTTP-based application programming interface (API). The GUI is the point of interaction of the users with the system. It is implemented using the Python Django Framework and Angular Js library for the frontend. The user can define fields, upload new multispectral images of a field and ask for processing while the results are depicted in a Geographic-based interactive map. The HTTP API is mainly used for the interoperability between the cloud platform and the edge device, embedded in the drone. The HTTP API uses the GET and POST methods for allowing the invocation of methods that support various tasks, such as image uploading, downloading new trained IA models, image process execution and prediction uploading.
The data storage, as mentioned before, is the centralized subsystem, responsible to securely store all the data of the MyOGC integrated system. An RDBMS is used for storing users and fields’ metadata, pre-processed data, devices connection info, prediction results, etc. On the other hand, the filesystem is used to save binary files, such as the input and processed images and the AI trained prediction models.
The containers execution environment takes advantage of the virtual containers technology, providing on demand data process functionalities in a cloud infrastructure. Each container is independent of computational resources and provides a specific data analysis task using the microservices architectural model [28]. There are four microservices in the MyOGC architecture: (a) the tree crown detection, (b) the vegetation indices calculation, (c) the AI prediction for the Verticillium wilt disease—presence and spread and (d) the AI prediction model training. All these microservices run independently and they execute specific tasks which are invoked as services by the process orchestrator. The container orchestrator’s main role is the instantiation of the appropriate containers to be available for the execution of an analysis task. It executes a credit-based algorithm [29] for scheduling the instantiation of the containers according to the number of user requests and the available computational resources of the cloud infrastructure. This approach ensures both the scalability and the reuse of the cloud resources for serving the on-demand user’s requests in the most efficient manner.
Finally, the drone sub-system aims to bring the intelligence provided by the AI prediction models near to the user’s main device. In MyOGC, the drone with a multi-spectral camera is used to capture the aerial image datasets. These datasets contain overlapping images that can be merged to create a reflectance map, which is a mosaic of the area of interest where each of the pixels in the image represents the actual reflectance of the imaged object used for plant health analysis and the detection of the Verticillium wilt in olive trees. The classic procedure is to upload the images in the MyOGC platform for further processing and algorithmic analysis. The MyOGC system provides and additional feature. An embedded board with GPU capabilities is installed with the camera in the drone. A compact version of the AI prediction models is installed in the embedded, which is able to perform the data process analysis on the spot. The results are sent to the MyOGC platform for presentation to the user.

2.2. Multimodal Processing Approaches

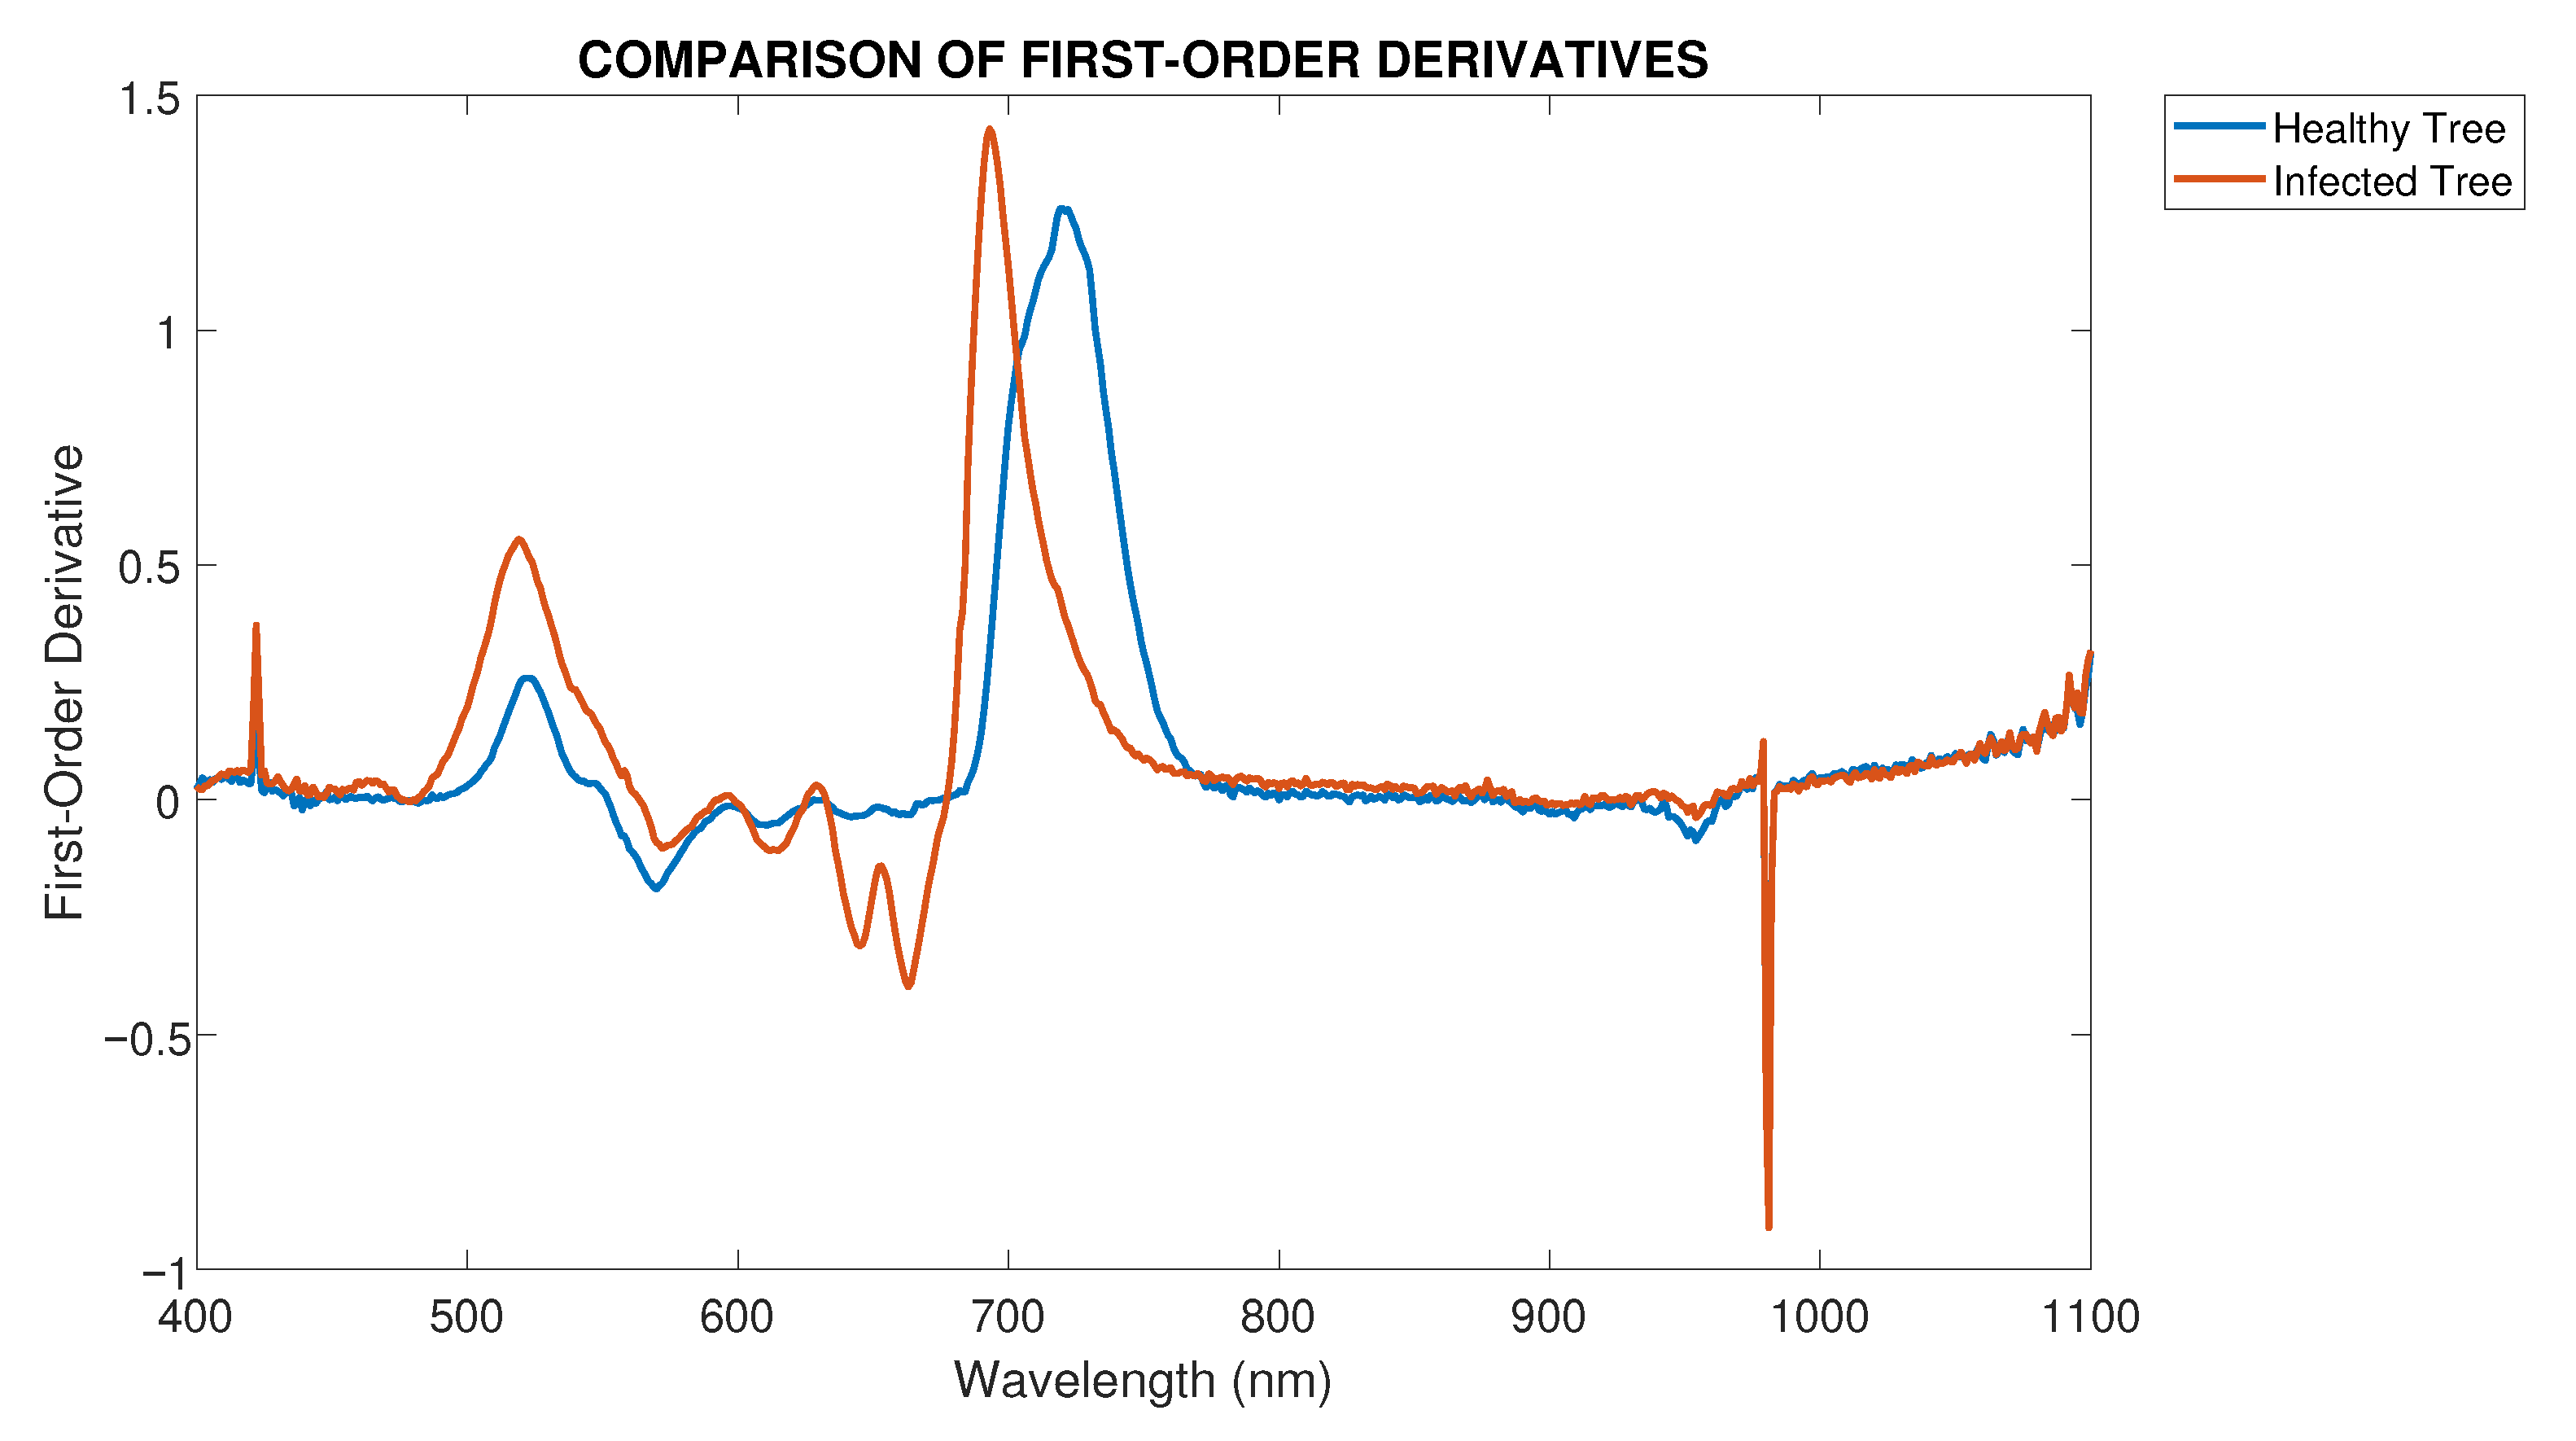
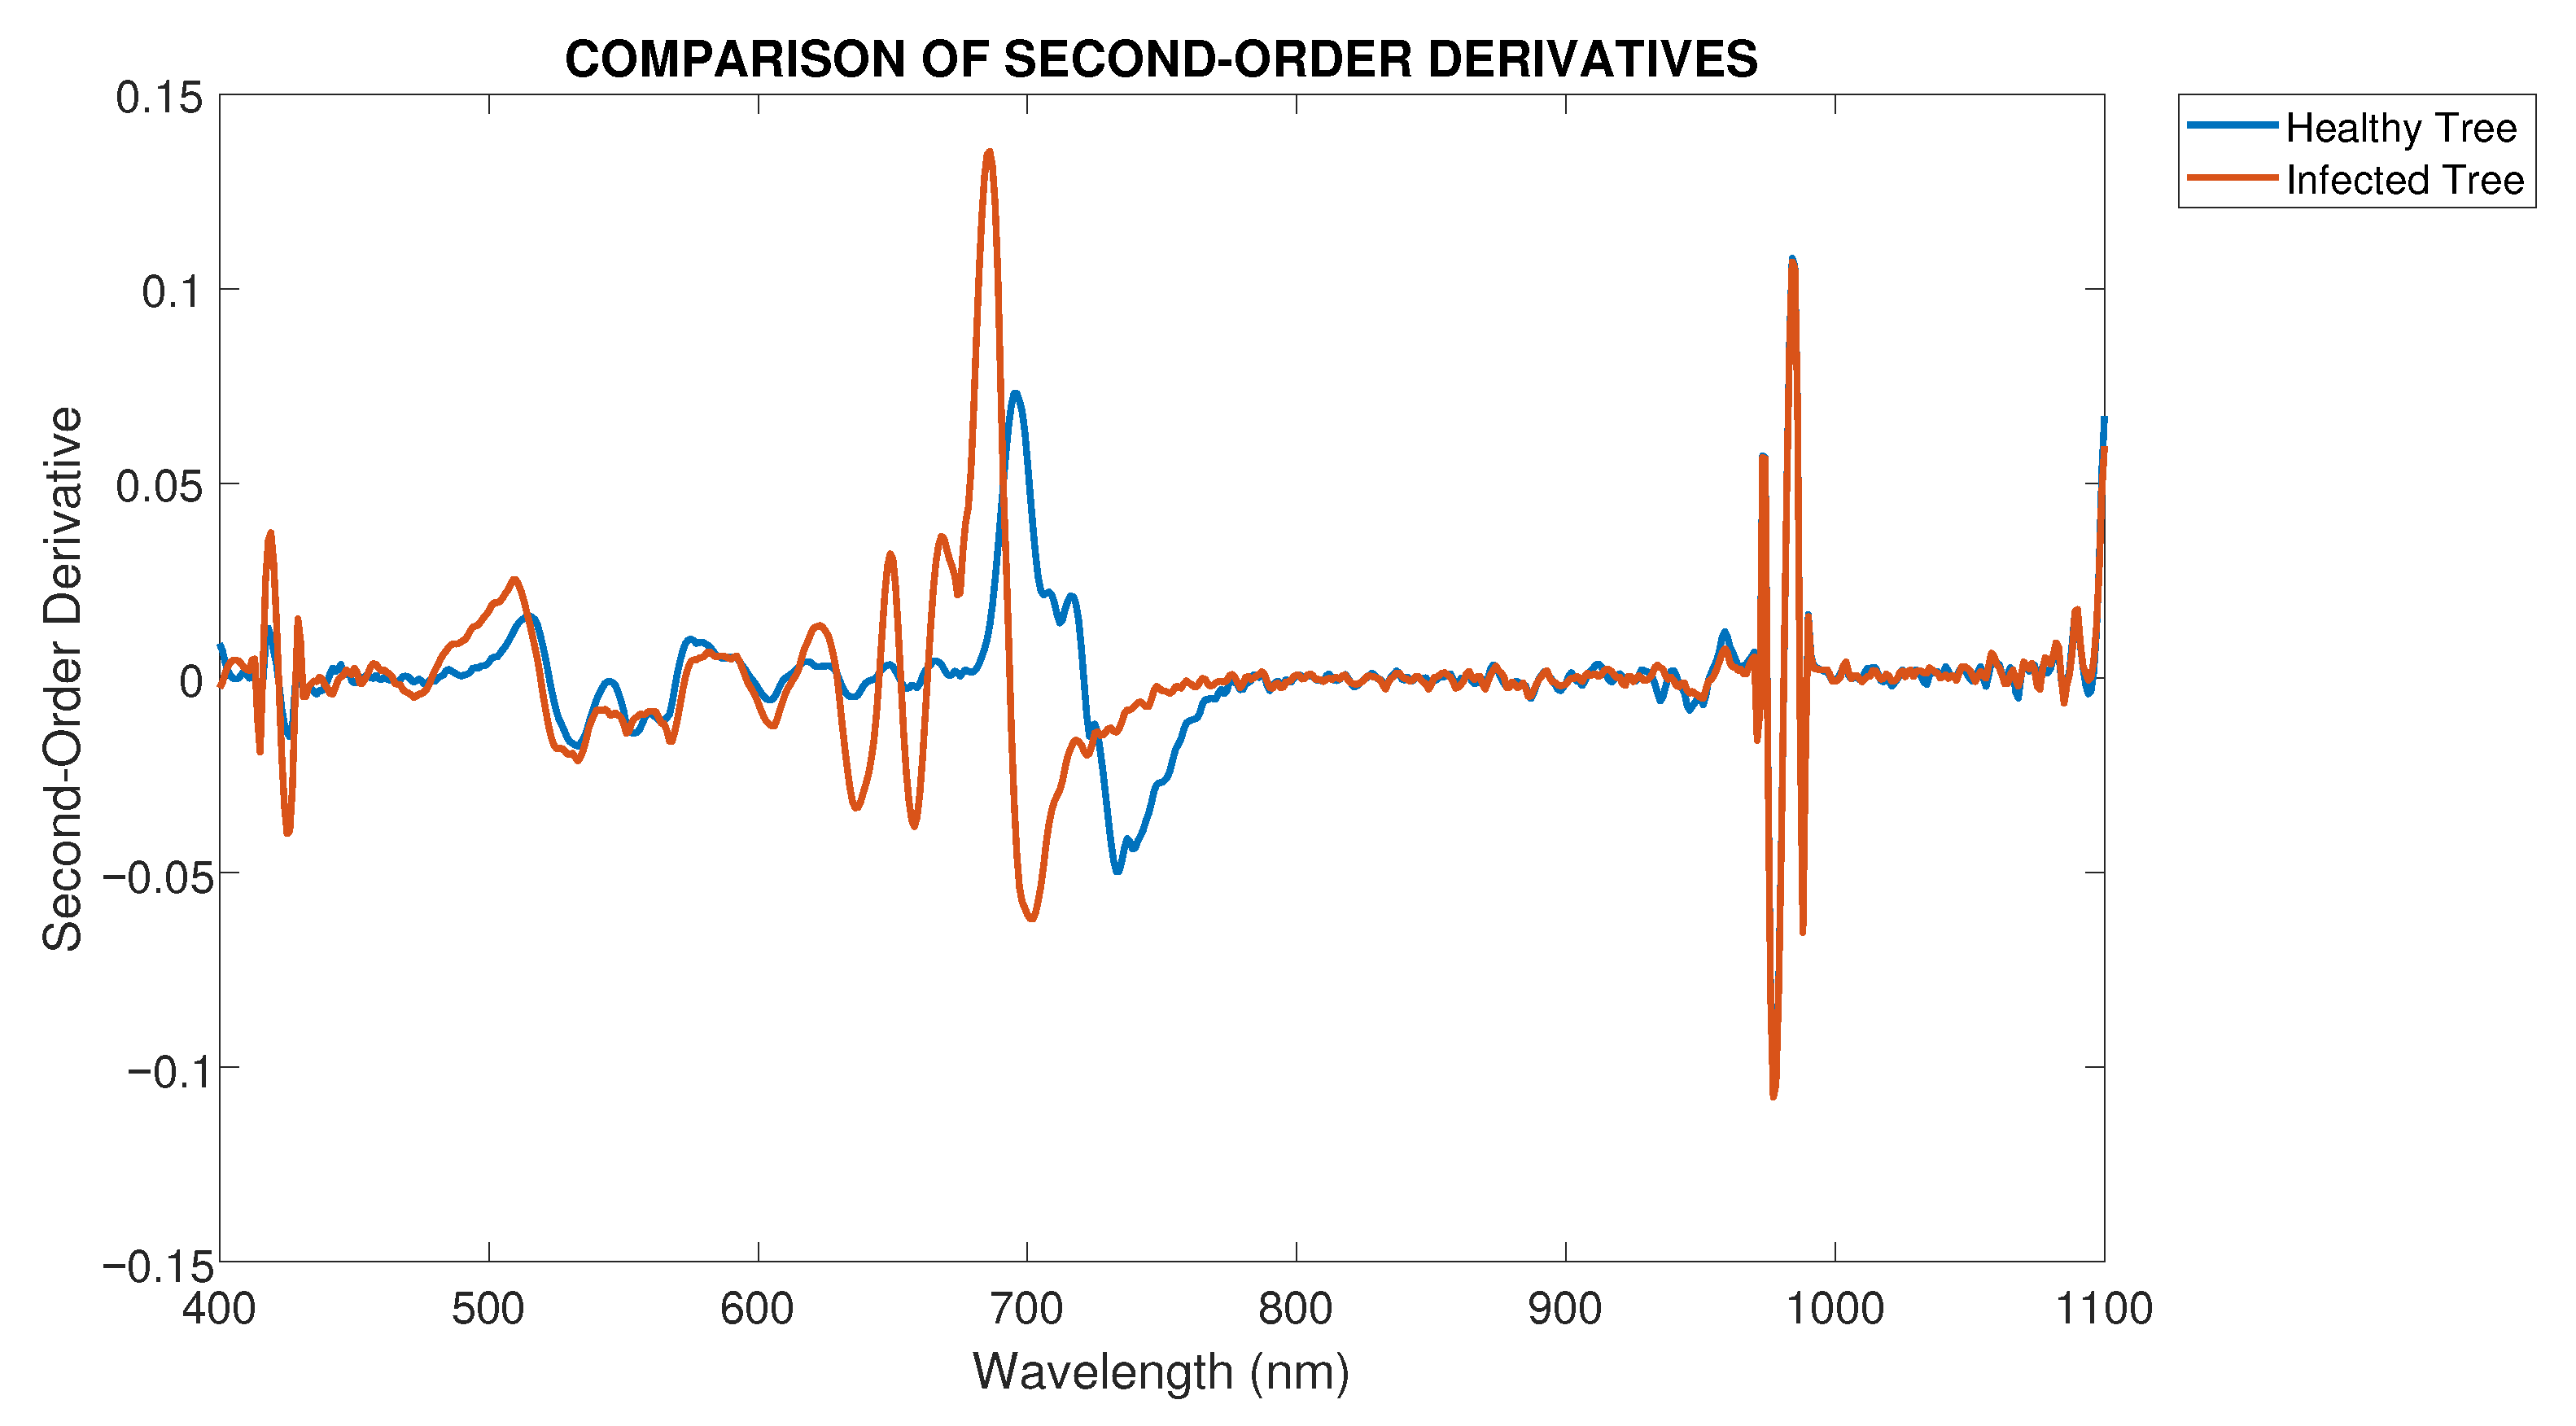
Plant leaves contain information which is highly associated with their health. Optical leaf properties such as reflectance and transmittance are useful in remote sensing techniques for disease detection. They allow early detection, well before they can be perceived by the human eye, in a non-invasive manner.
In assessing a plant’s health, the most basic and common metric used is the reflection of vegetation, i.e., the ratio of the reflected radiation to the incident radiation. An assumption is made that the reflection of vegetation at a certain electromagnetic wavelength, or spectral reflectivity, depends on the properties of the vegetation due to factors such as the type of each plant, its water content, its chlorophyll content and its morphology [30]. However, there may be a need to compare measurements that are more related to biophysical variables than to the spectral reflectivity itself. For these reasons, Vegetation Indices are often calculated. These indicators are obtained when two or more wavelength bands are used in an equation to calculate the corresponding vegetation index. In addition, vegetation indicators can help minimize problems related to reflectivity data, such as changes in viewing angles, atmospheric distortions and shadows, especially as most vegetation indicators are calculated as ratios of two or more wavelength bands [30,31]. Different vegetation markers use different wavelength zones and provide information on different biophysical variables [32]. For example, one of the most commonly used indicators is the Normalized Difference Vegetation Index (NDVI) [6,33]. NDVI uses the wavelength corresponding to the red (RED—670 nm) color band and is absorbed to a very large extent by the chlorophyll in the foliage of the plants, and the wavelength band corresponding to the near-infrared (NIR—800 nm) in which the chlorophyll shows the most intense reflection (Equation (1)). NDVI values range from −1 to 1 with the values closest to 1 corresponding to healthier and denser vegetation. NDVI can be calculated using reflexivity or non-physical measurements for the wave bands.
NDVI = NIR RED NIR + RED
Another example where a vegetation index can provide biophysical information is the normalized difference red edge (NDRE) which is calculated using the near-infrared and red-edge wavelength bands (REG—750 nm), and the green exceedance index (GEI), which is calculated using the red, blue and green wavelength bands. Research for GEI showed that the measured gross primary product in a deciduous forest was significantly correlated with GEI. Thus, a specialized vegetation index can be used as a substitute for measurable biophysical variables that are important when evaluating the phenology of a particular site or plant.
Calculation of vegetation indices is usually done on a pixel-by-pixel basis and is, therefore, very sensitive to even slight image distortions. In order to calculate the real changes in biochemical and physiological parameters of vegetation, collected multispectral data have to be geometrically and radiometrically aligned, calibrated and corrected, so as to ensure that the pixels in two images represent the same soil characteristics and the same soil point. Thus, a crucial part of MyOGC is the correct design and implementation of appropriate geometric transformations and spatial-temporal image filters which include, characteristically, algorithms for image registration and alignment, image stitching, creation of orthomosaic with photogrammetry techniques, spectral and luminosity corrections and noise filtering. Classical computer vision techniques are, in most cases, adequate for the implementation of the aforementioned processes. Usually, though, image registration requires many resources, especially when, as in our case, there are significant differences between the input images. To efficiently and accurately align them, we process them successively in pairs, based on the similarity of the spectral response of each band: RED and GRE; GRE and REG; and finally, REG and NIR. We then combine successive pairs with motion homography. This yields satisfactory results. In our case, the above process has been found to be much quicker and more accurate that other frequently employed techniques by other tools that were tried (Table 4) but a detailed analysis of its performance is needed to confirm any benefits.
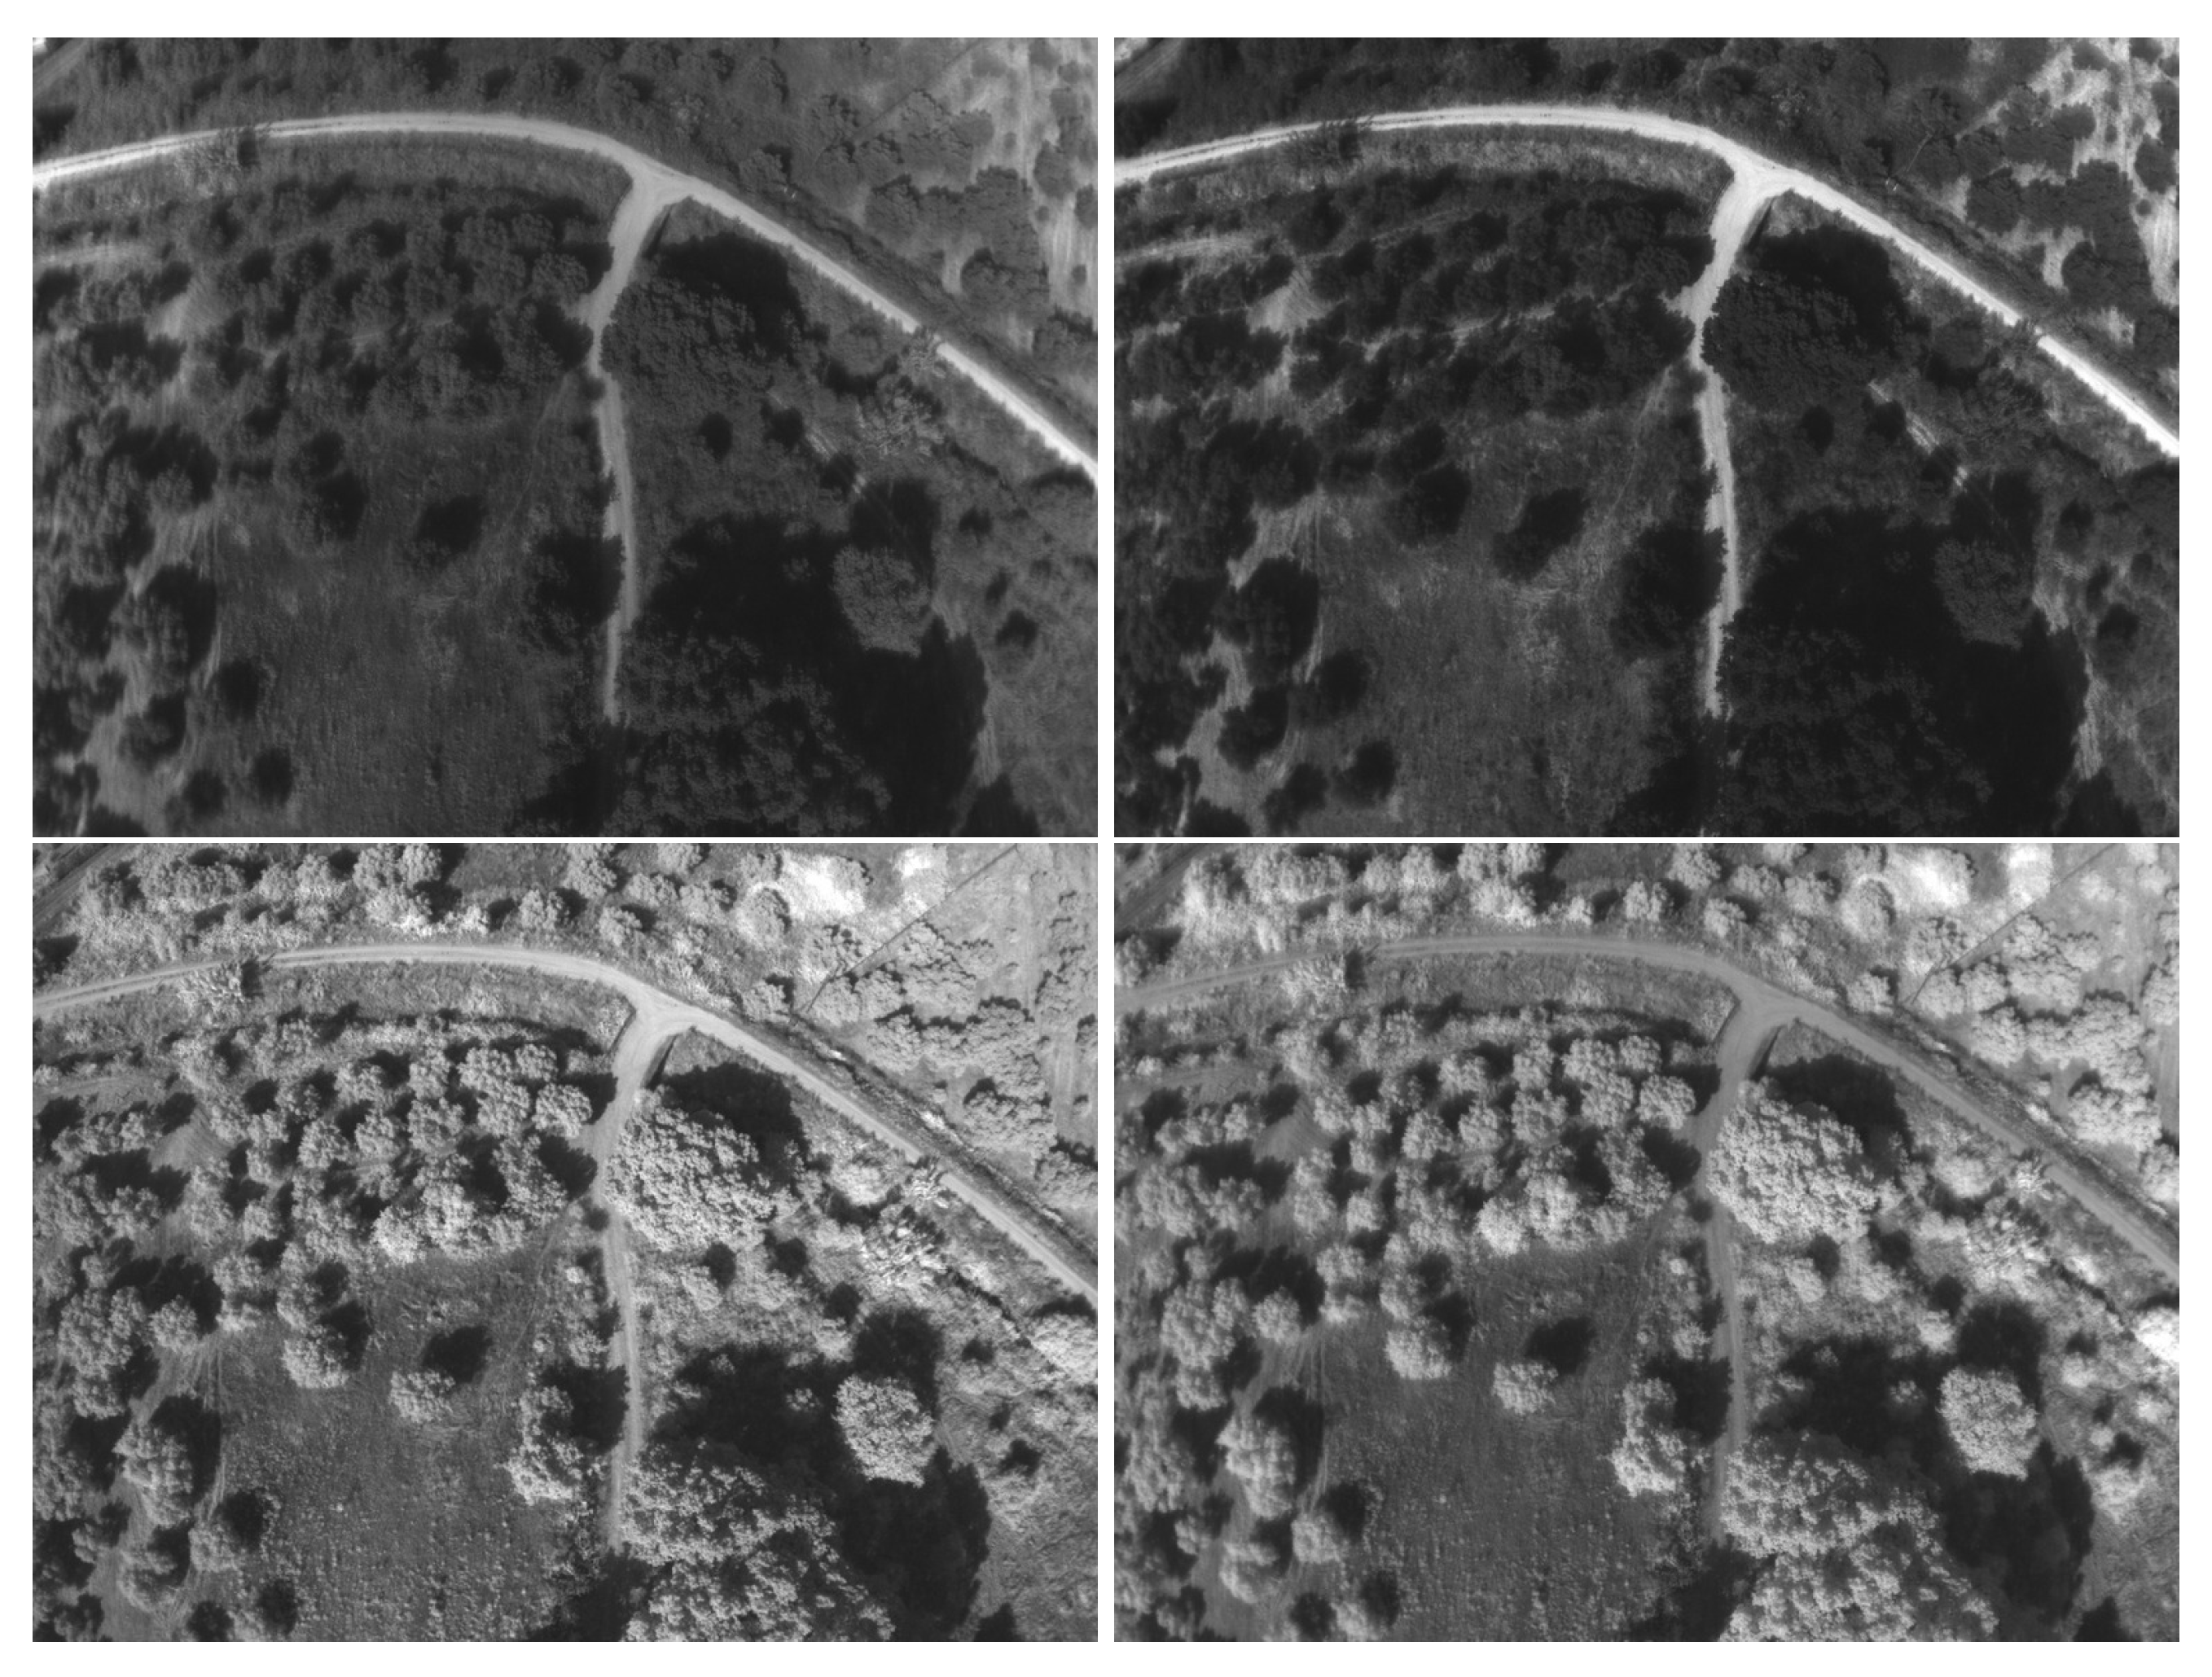
Another class of processing algorithms relates to the removal of image noise due to data acquisition and enhancing the distinction between the objects under detection (i.e., tree crowns) and the background (i.e., shaded area). To remove unneeded details and smooth out the detection of relevant characteristics, a median filter of disc-shaped kernel is applied. The kernel size is correlated to the expected or the desirable minimum radius of tree features. After experimentation with kernel sizes, a kernel corresponding to a real length of about 50 cm was found to be adequate.
The next stage in processing of the multispectral data concerns the extraction of useful macroscopic characteristics of the grove, in an individual tree basis. A key part of this process is the detection of individual olive trees and the delineation of their crown. This is achieved by using state of the art classical computer vision techniques [10,18] (Table 5) and techniques developed specifically for MyOGC. Though the state-of-the-art techniques are usually adequate for this task, we developed a modified version that is appropriate for on-the-fly execution on an embedded device, mounted on a UAV, thus facilitating the real-time monitoring process. More specifically, MyOGC employs a distance-based algorithm, in the four dimensional multimodal space, that estimates the probability that an image region belongs to a tree. The distance is calculated in reference to a point (RP) in the multi-spectral intensity space that shows maximum correlation with the spectral response of the trees to be delineated. The rationale is that regions that contain a point very close to the RP have a very high probability of belonging to a tree as a whole, rather than as individual pixels. Therefore, roughly, the probability P ( A ) that the center pixel of a region A of area S A belongs to a tree is inversely proportional to the minimum distance of every pixel ( p i A ) of the the disc to the reference point p RP . That is, we employ a minimum local filter in respect to the distance of each pixel in the image to the reference point. This is expressed by an equation of the form of Equation (2). The denominator part ( 1 + min p i A p i , p RP ) takes values from 1 + 0 to 1 + 2 . The value of 1 is achieved when the minimum distance is 0, meaning that there is a point in the disc that coincides with the reference point.
P ( A ) 1 S A 1 1 + min p i A p i , p RP
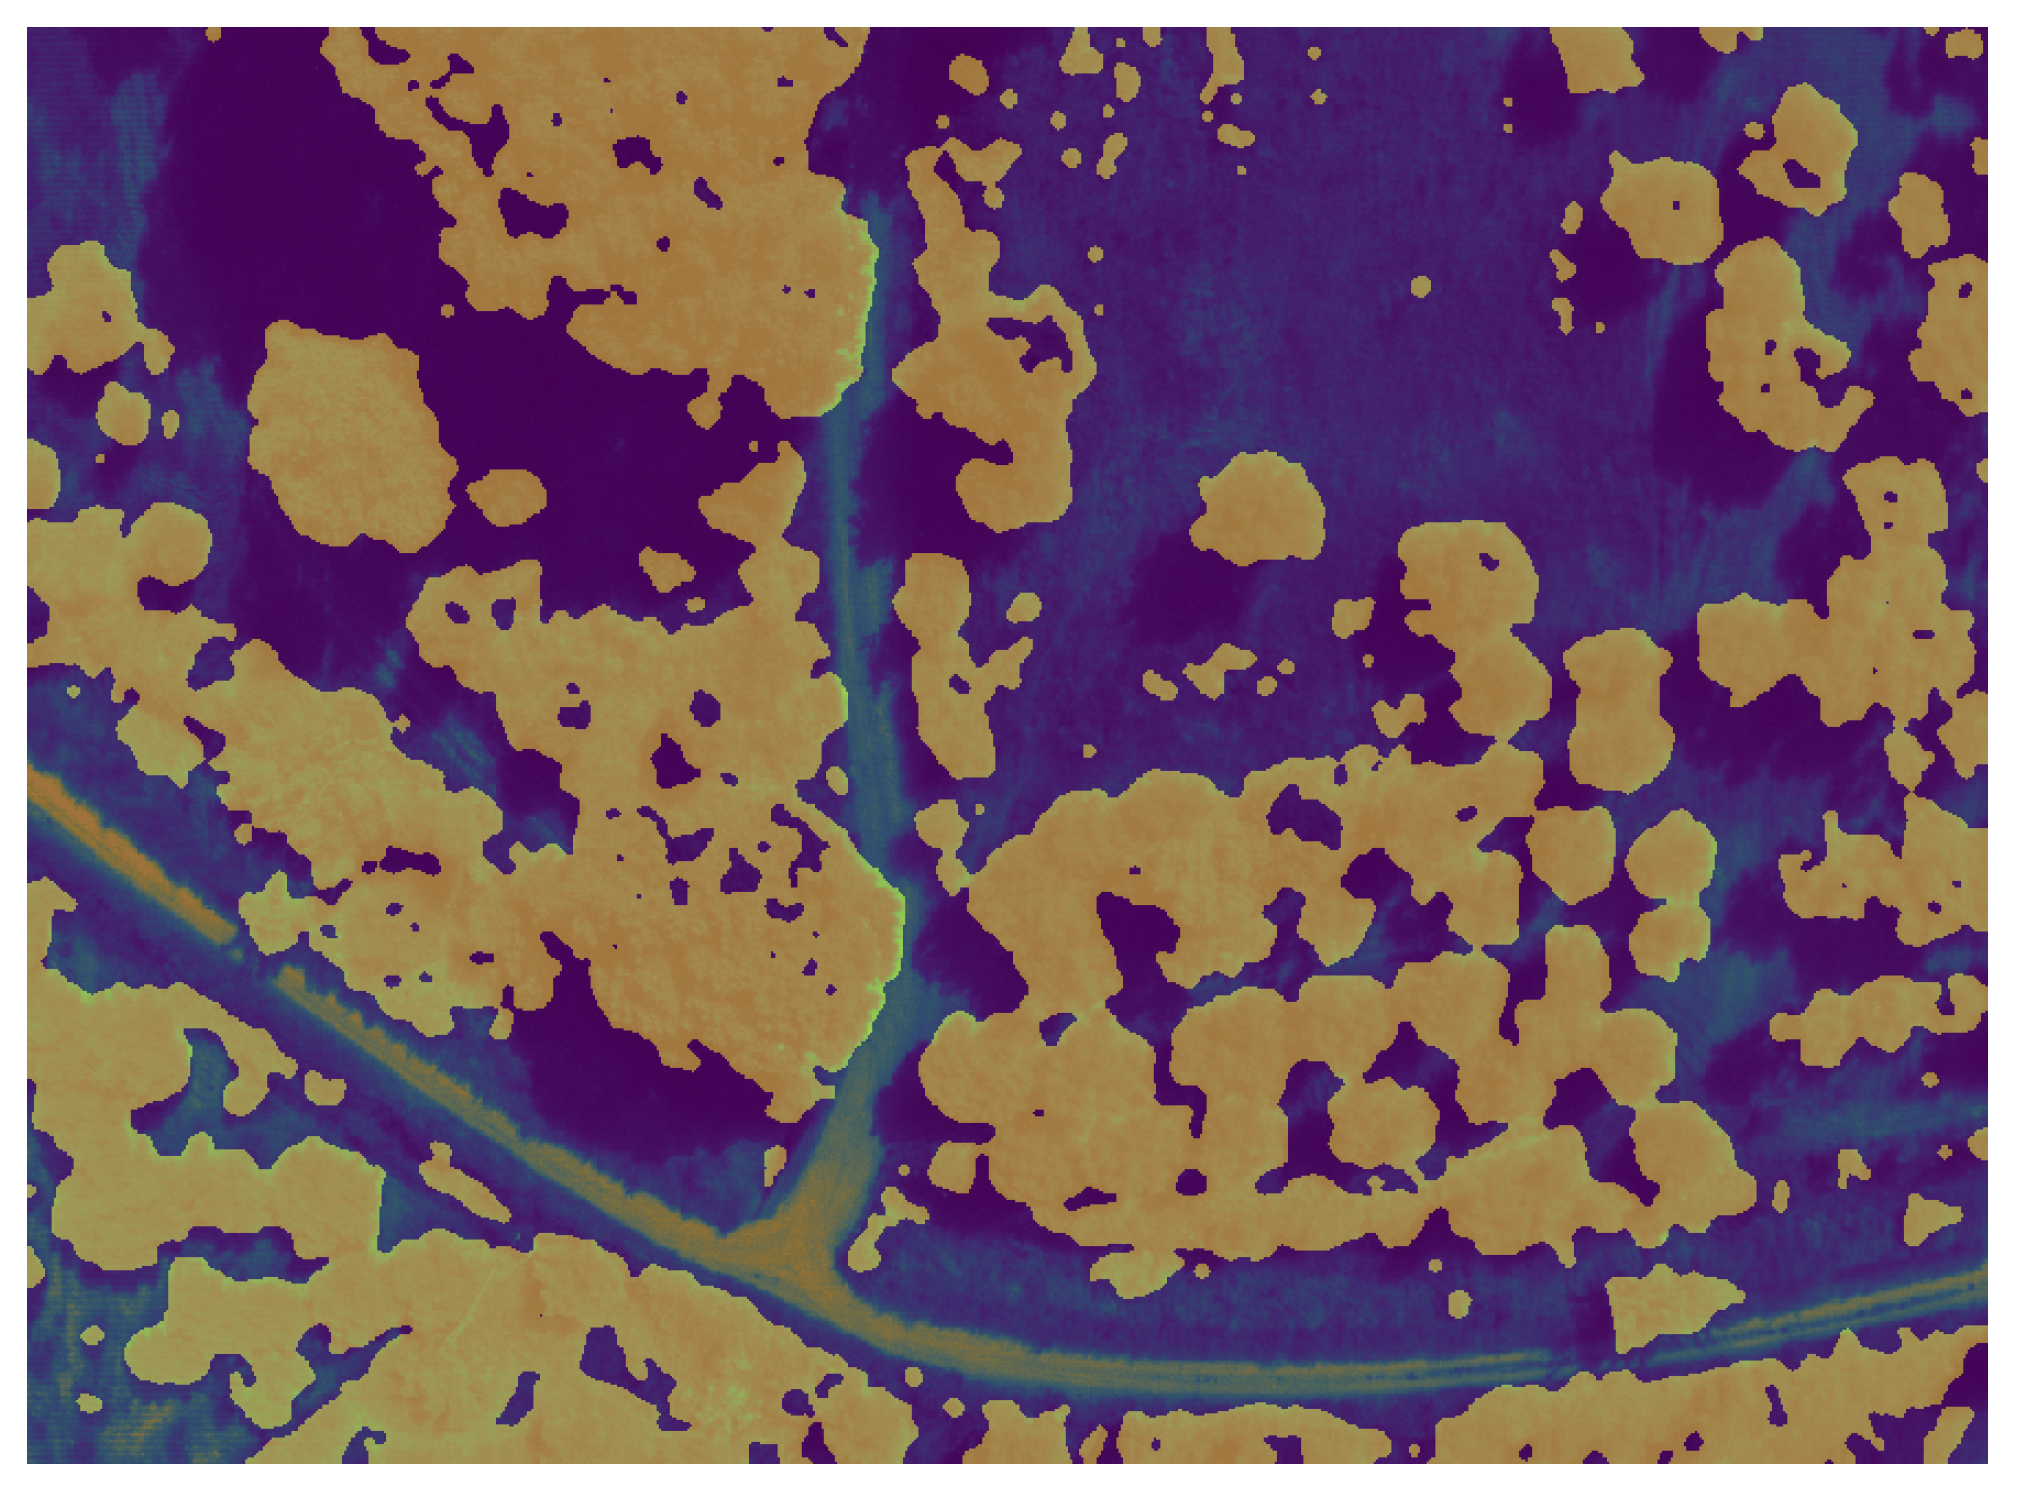
The (RP) can be extracted from spectral data available from the literature, or experimentally estimated from the input data. Using this algorithm MyOGC achieves fast and accurate crown delineation (Figure 3). Furthermore, this algorithm was used to generate groundtruth data to train a type of neural network that can be executed on embedded devices (Section 2.4). This allowed for real-time crown delineation using only one-band images.

2.3. Annotation of Data

The synergy of the UAV multispectral camera and the portable spectrophotometer serves the purposes of early diagnosis of Verticillium wilt in olive trees [2,
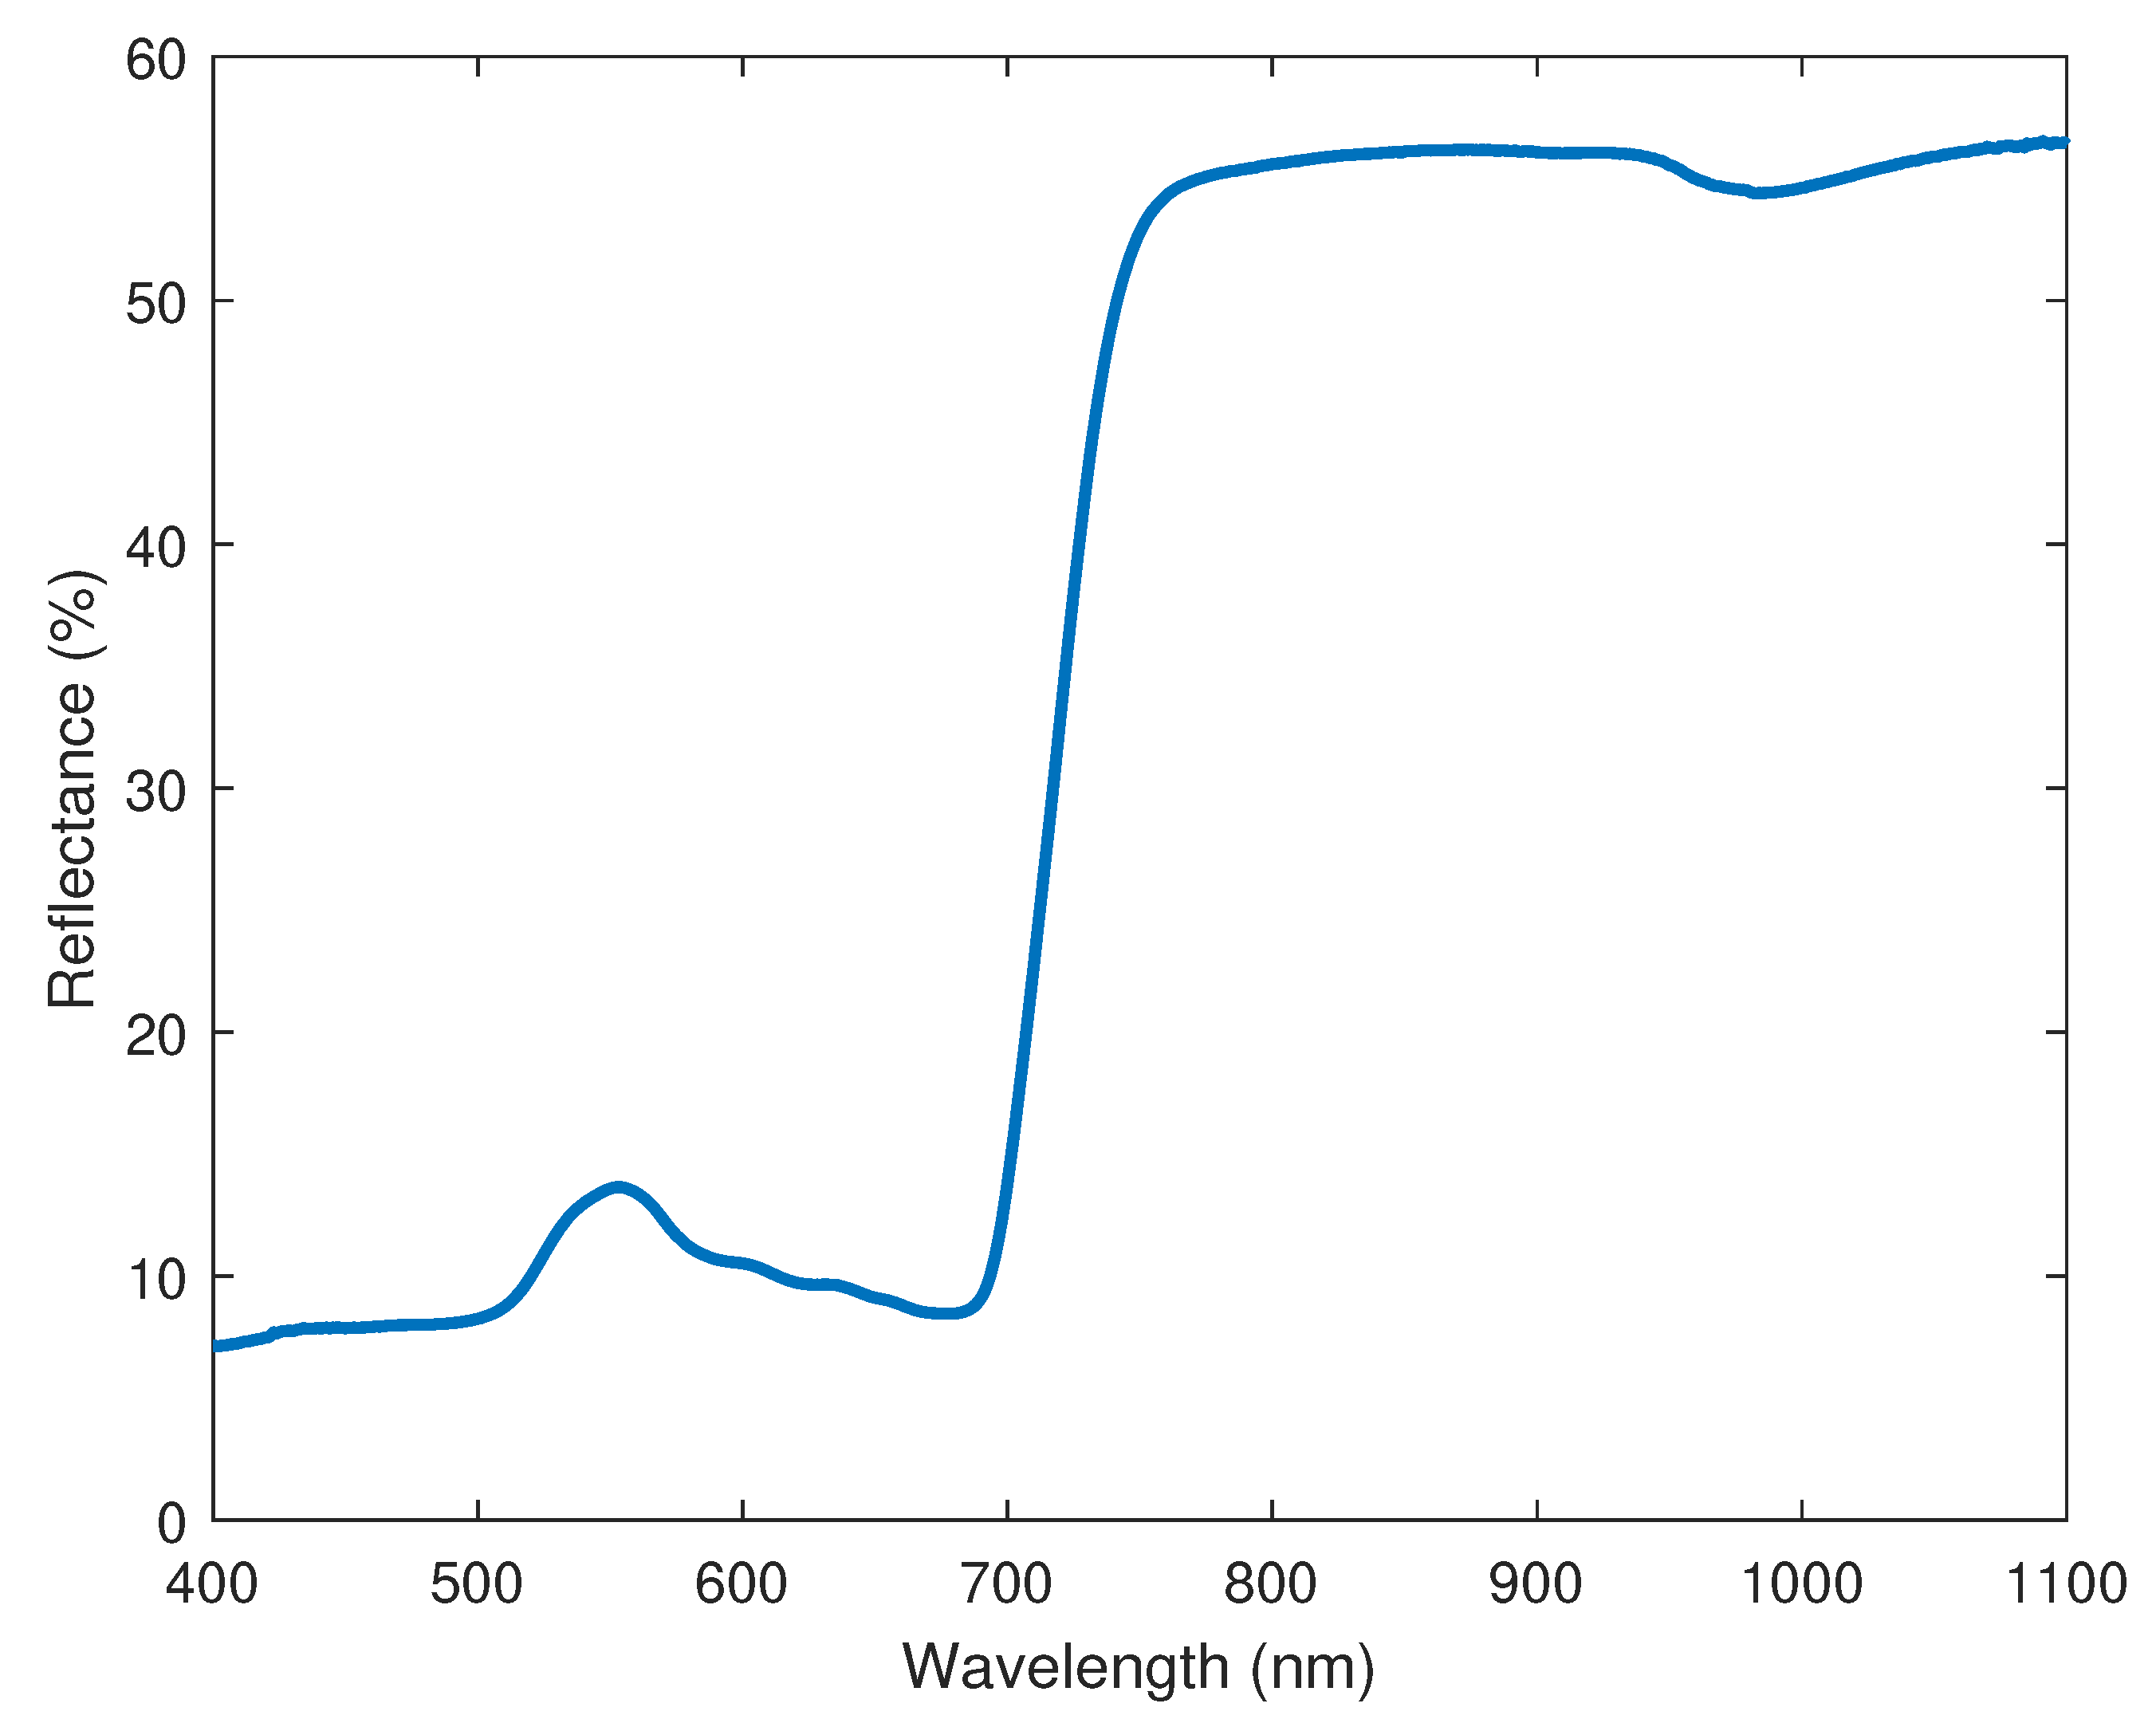
6]. The next step of the multimodal processing is thus the characterization of the input data. MyOGC employs two methods of annotation: (i) using spectral data from the laboratory analysis and (ii) using the NDVI and NDRE indices. For annotation using the data of the laboratory analysis, a similar procedure is followed as for the crown delineation case, extending the categorization levels from two (ground/tree) to four (or more) stress levels. Specifically, each pixel of the image is categorized into one of four categories, based on its spectral proximity to a characteristic reference spectrum. The reference spectrum is obtained from the laboratory analysis, from the average of the spectral responses of individual leaves that are in different stages of the 11-point scale (Table 2).
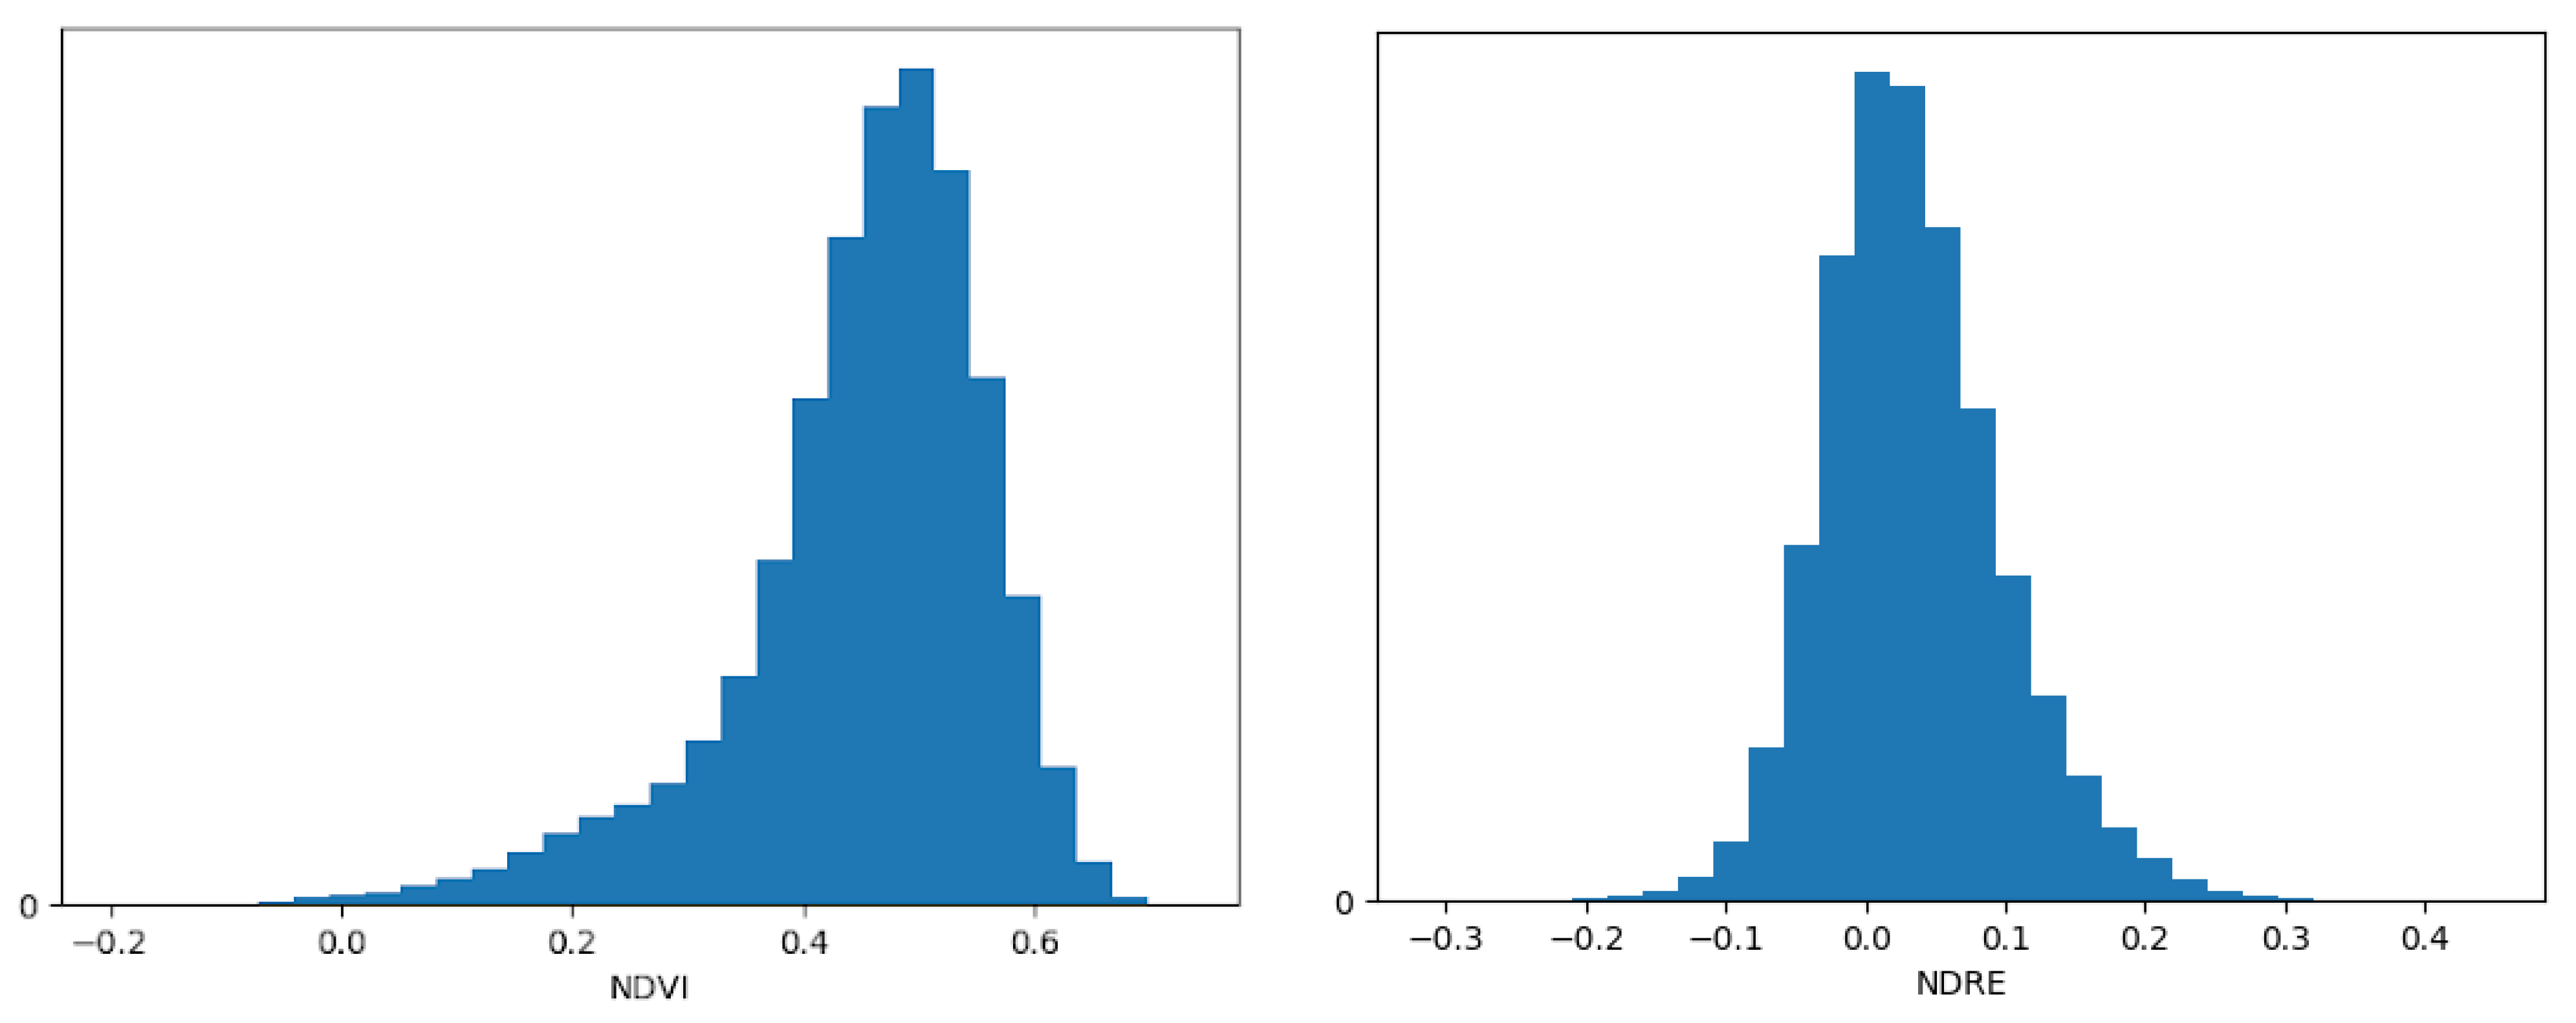
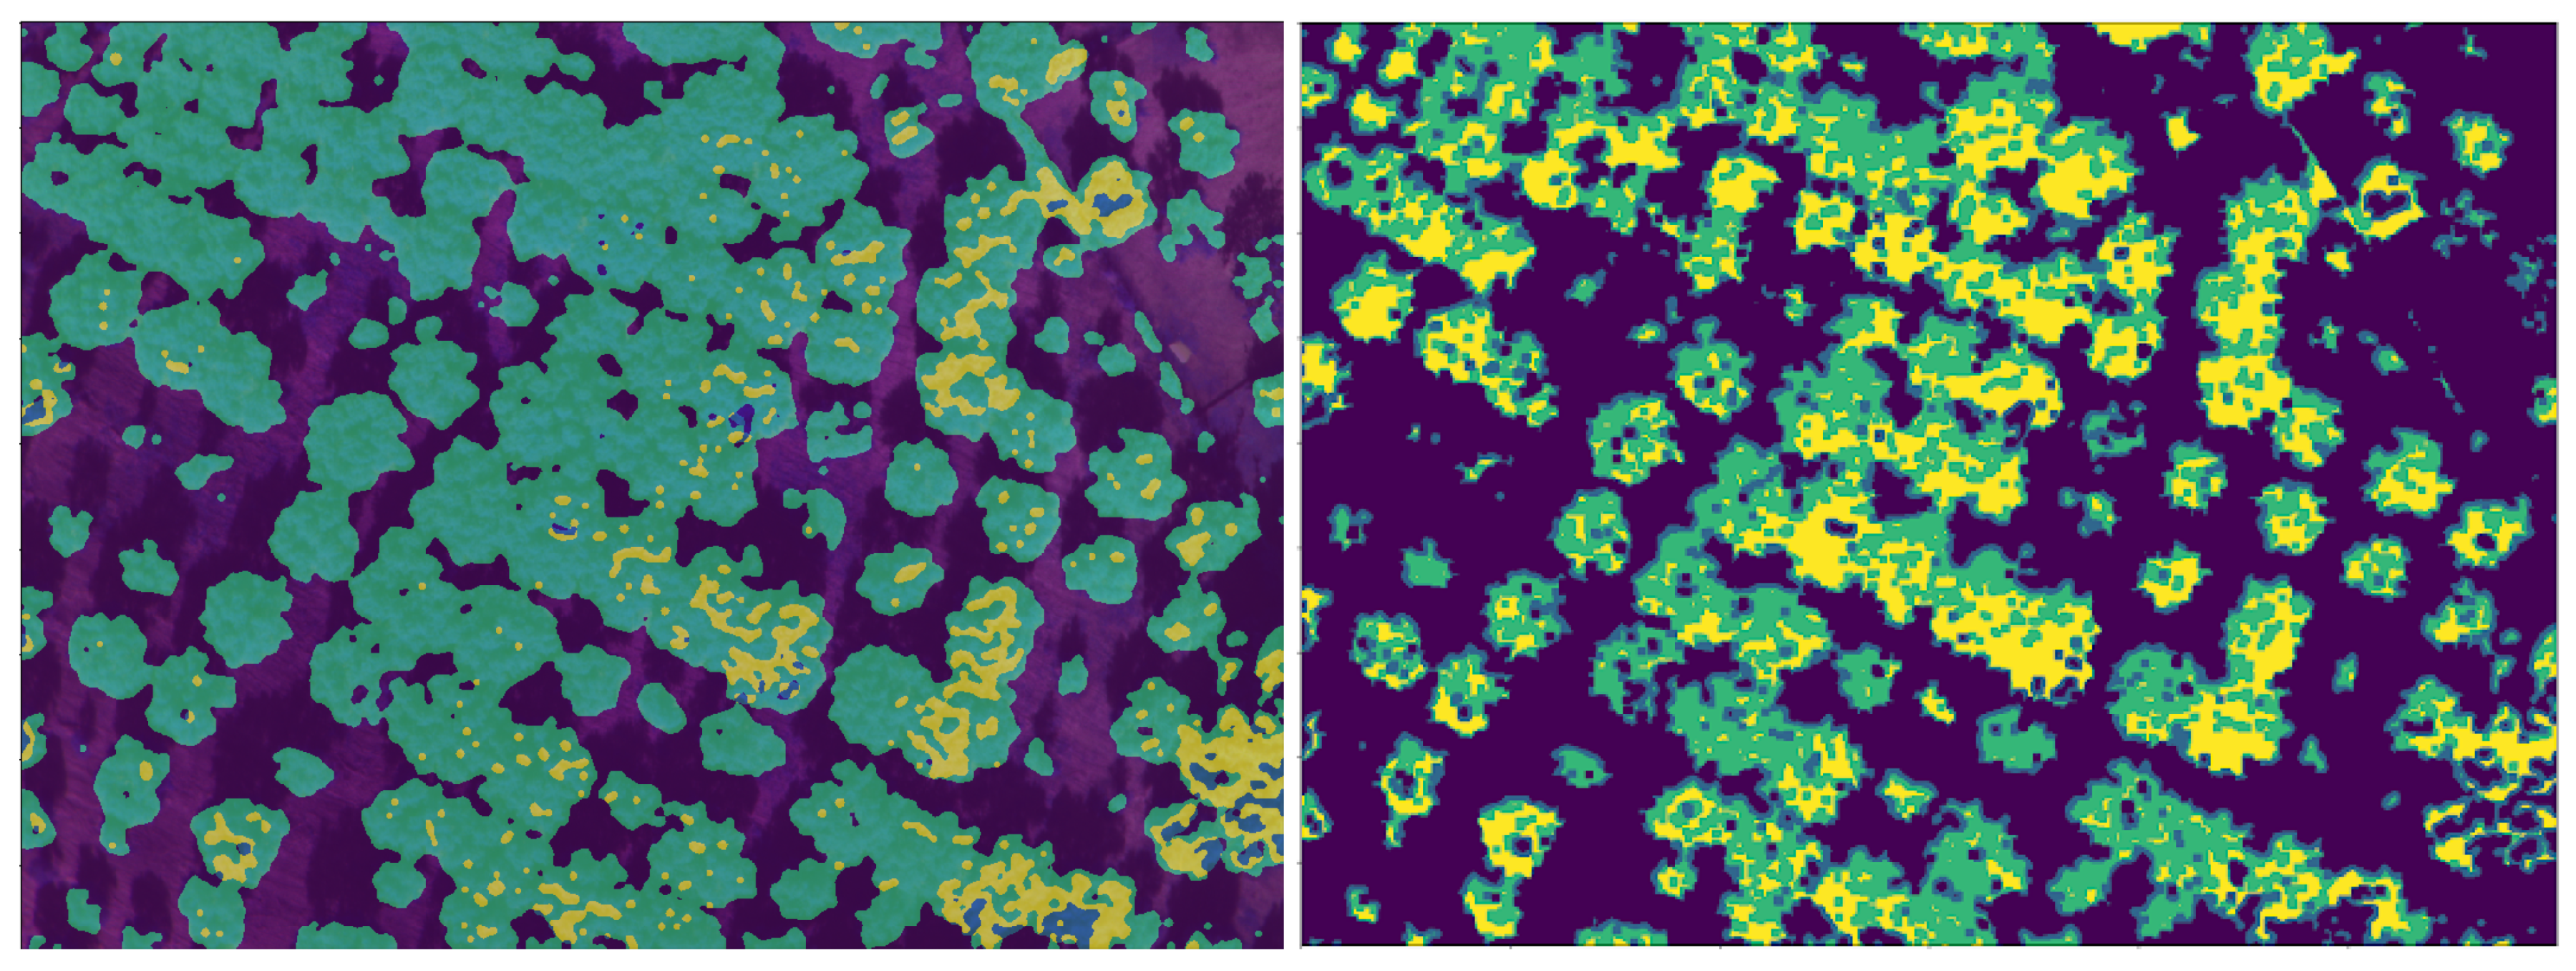
For annotation using the NDVI and NDRE indices, the crown delineation algorithm is first applied to isolate the areas of interest and enhance the resolution of the indices. Then, a statistical analysis of the distribution of the NDVI and NDRE (Figure 4) provides threshold values that divide the areas of interest into categories. The fusion of these categories for each vegetation index gives the final annotation (Figure 5). Previous results have shown that the NDVI and NDRE have high sensitivity to Verticillium wilt symptoms in olive trees [2]. In our case, though, a full comparison to state-of-the-art methods and an assessment of the advantages of our modified methods could not be made as the occurrence of Verticillium wilt on the groves under study was very low. We should note, however, that the success of the MyOGC does not depend on the details of the prediction algorithm, as this is an easily upgradable component.

2.4. Real Time Processing on Edge Devices

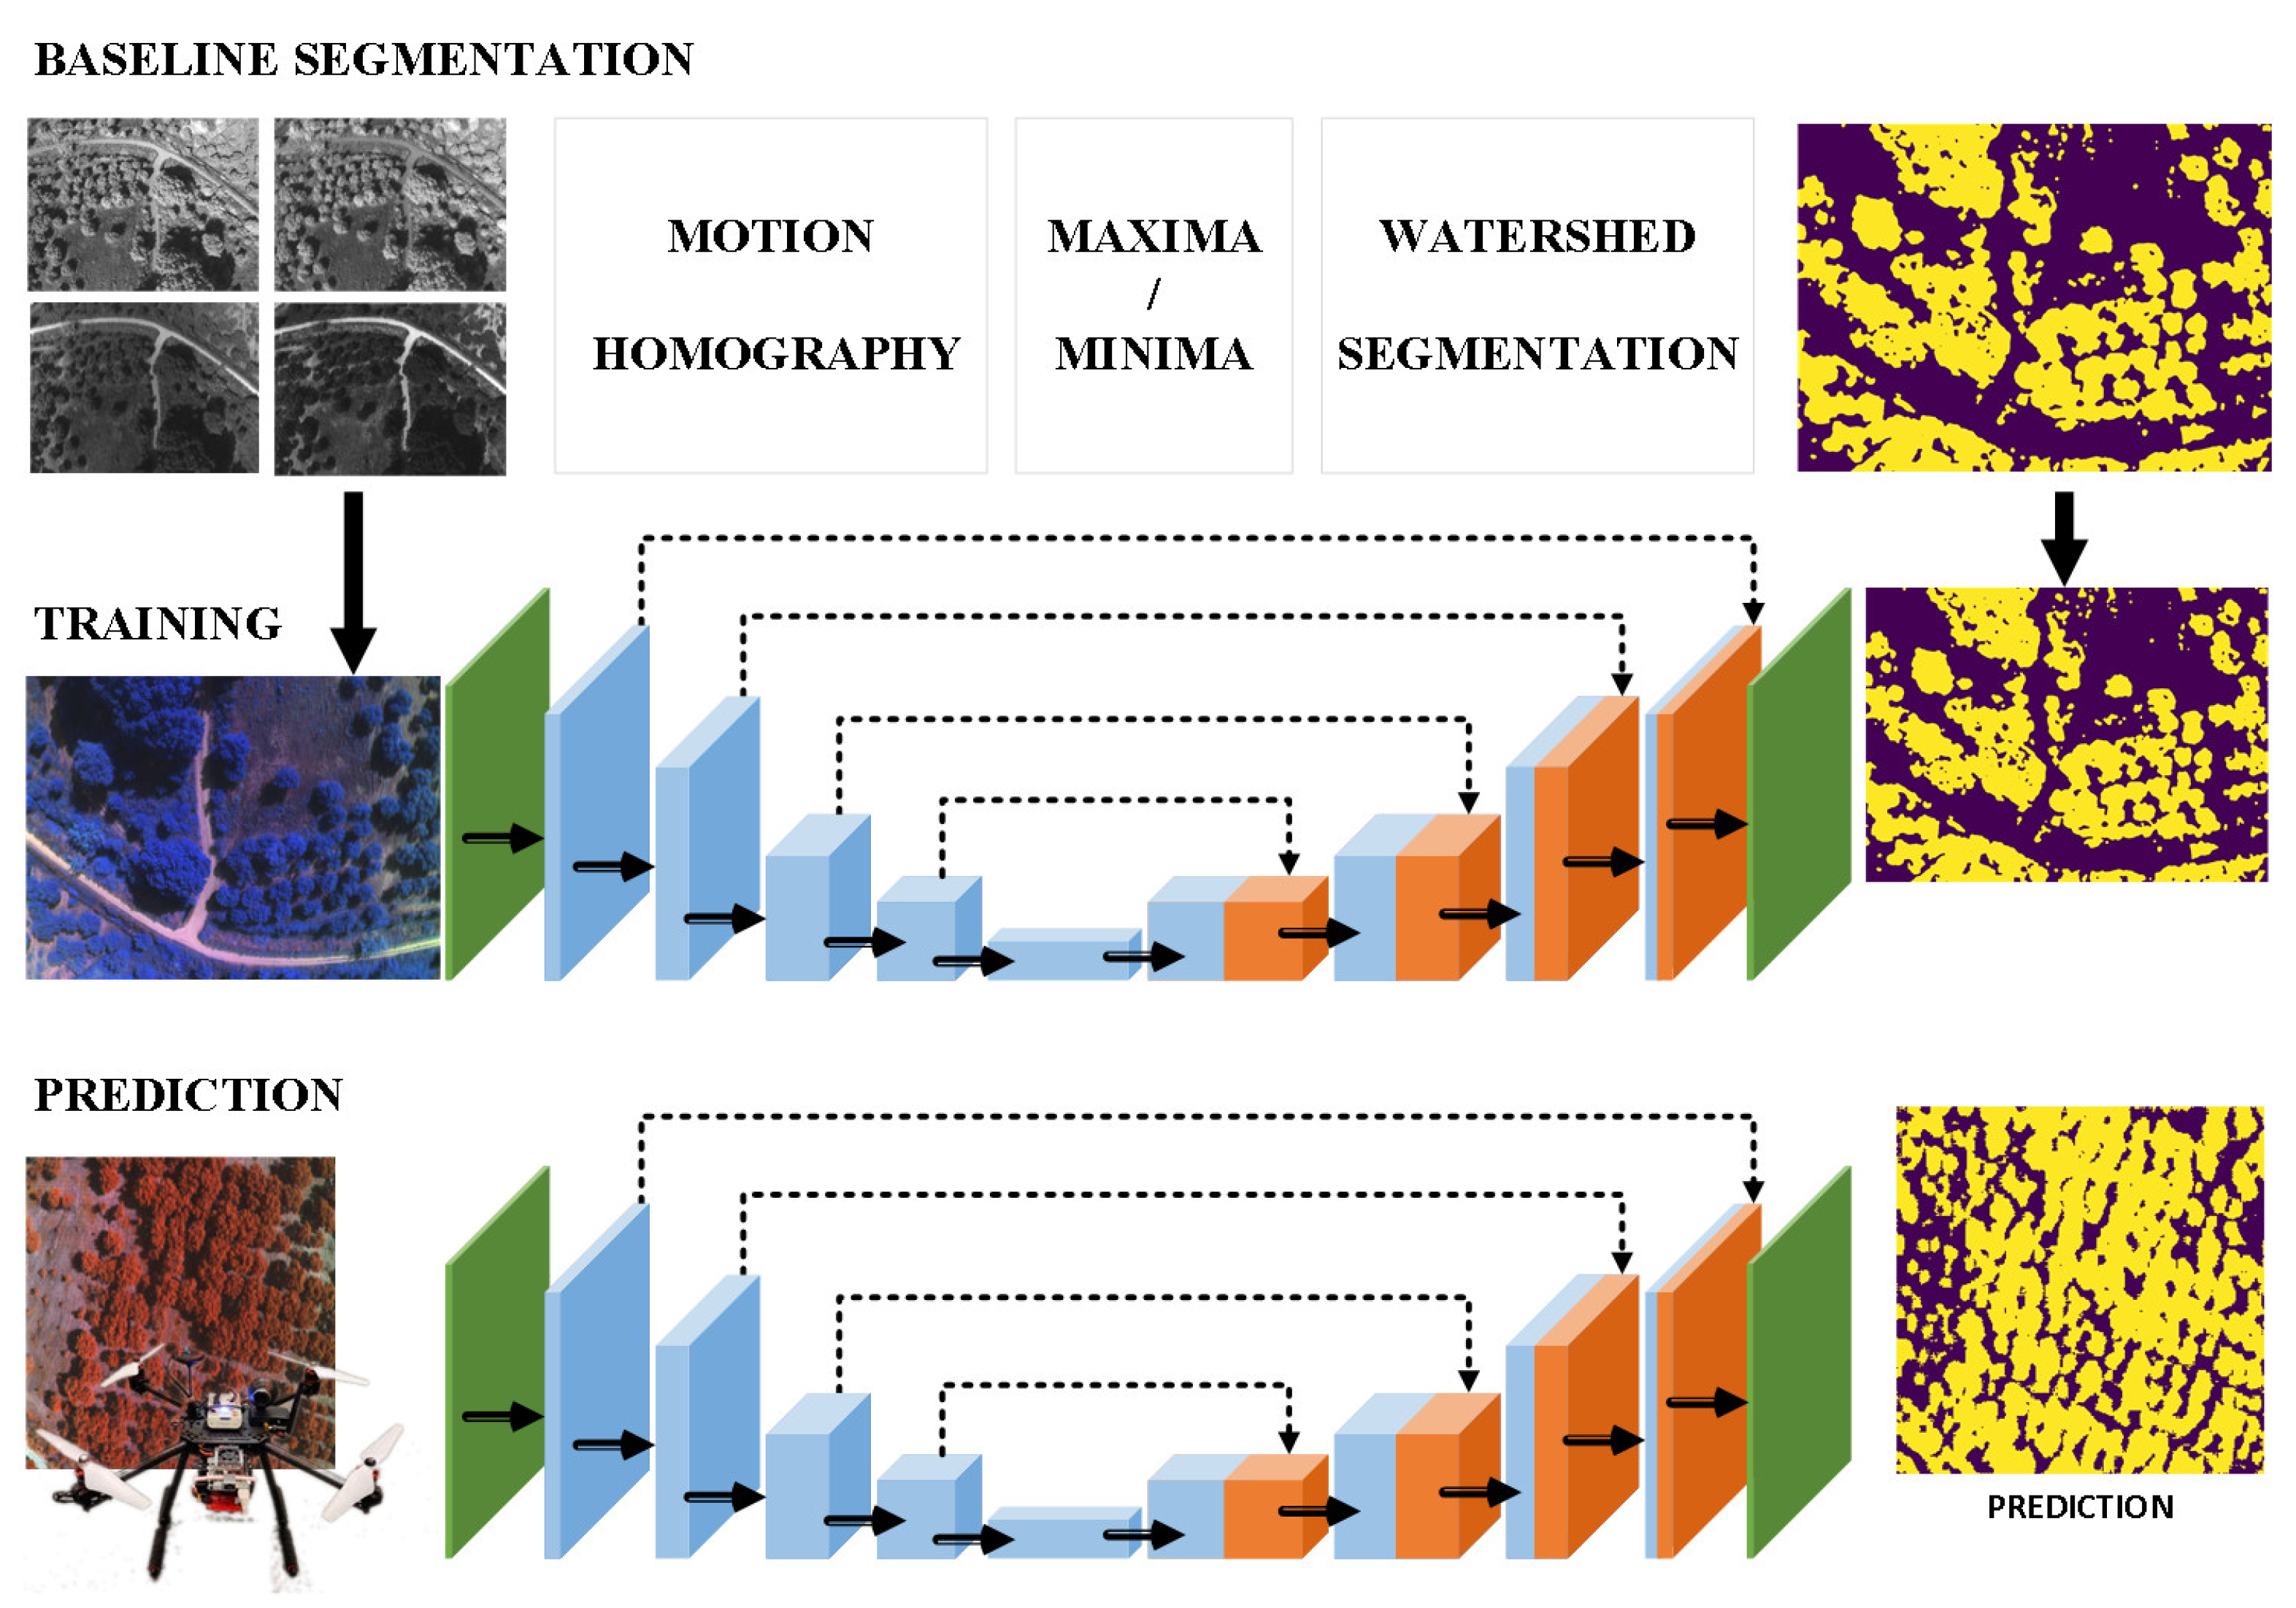
A second method is used for the same multimodal processing purposes but targeting a different platform, an embeddable device tuned for running ML applications. This device can be mounted on the UAV and connects to the multispectral sensors, allowing real time processing of the captured multispectral images. To make possible the on-the-fly processing of incomplete and noisy data, we use a convolutional neural network (CNN), a class of NN that is ideal for tasks involving image segmentation and classification, trained on ground truth data that are automatically generated from classically processed multispectral images. In the CNN architecture (Figure 6) the input data are fed to successive down-scaling layers (left branch) to reduce the spatial resolution of the feature maps and then to corresponding up-scaling layers (right branch), increasing the spatial resolution of the feature maps. The CNN is trained to classify either multimodal or unimodal data, balancing needs for accuracy or speed. The results of the classification by the CNN can be seen in
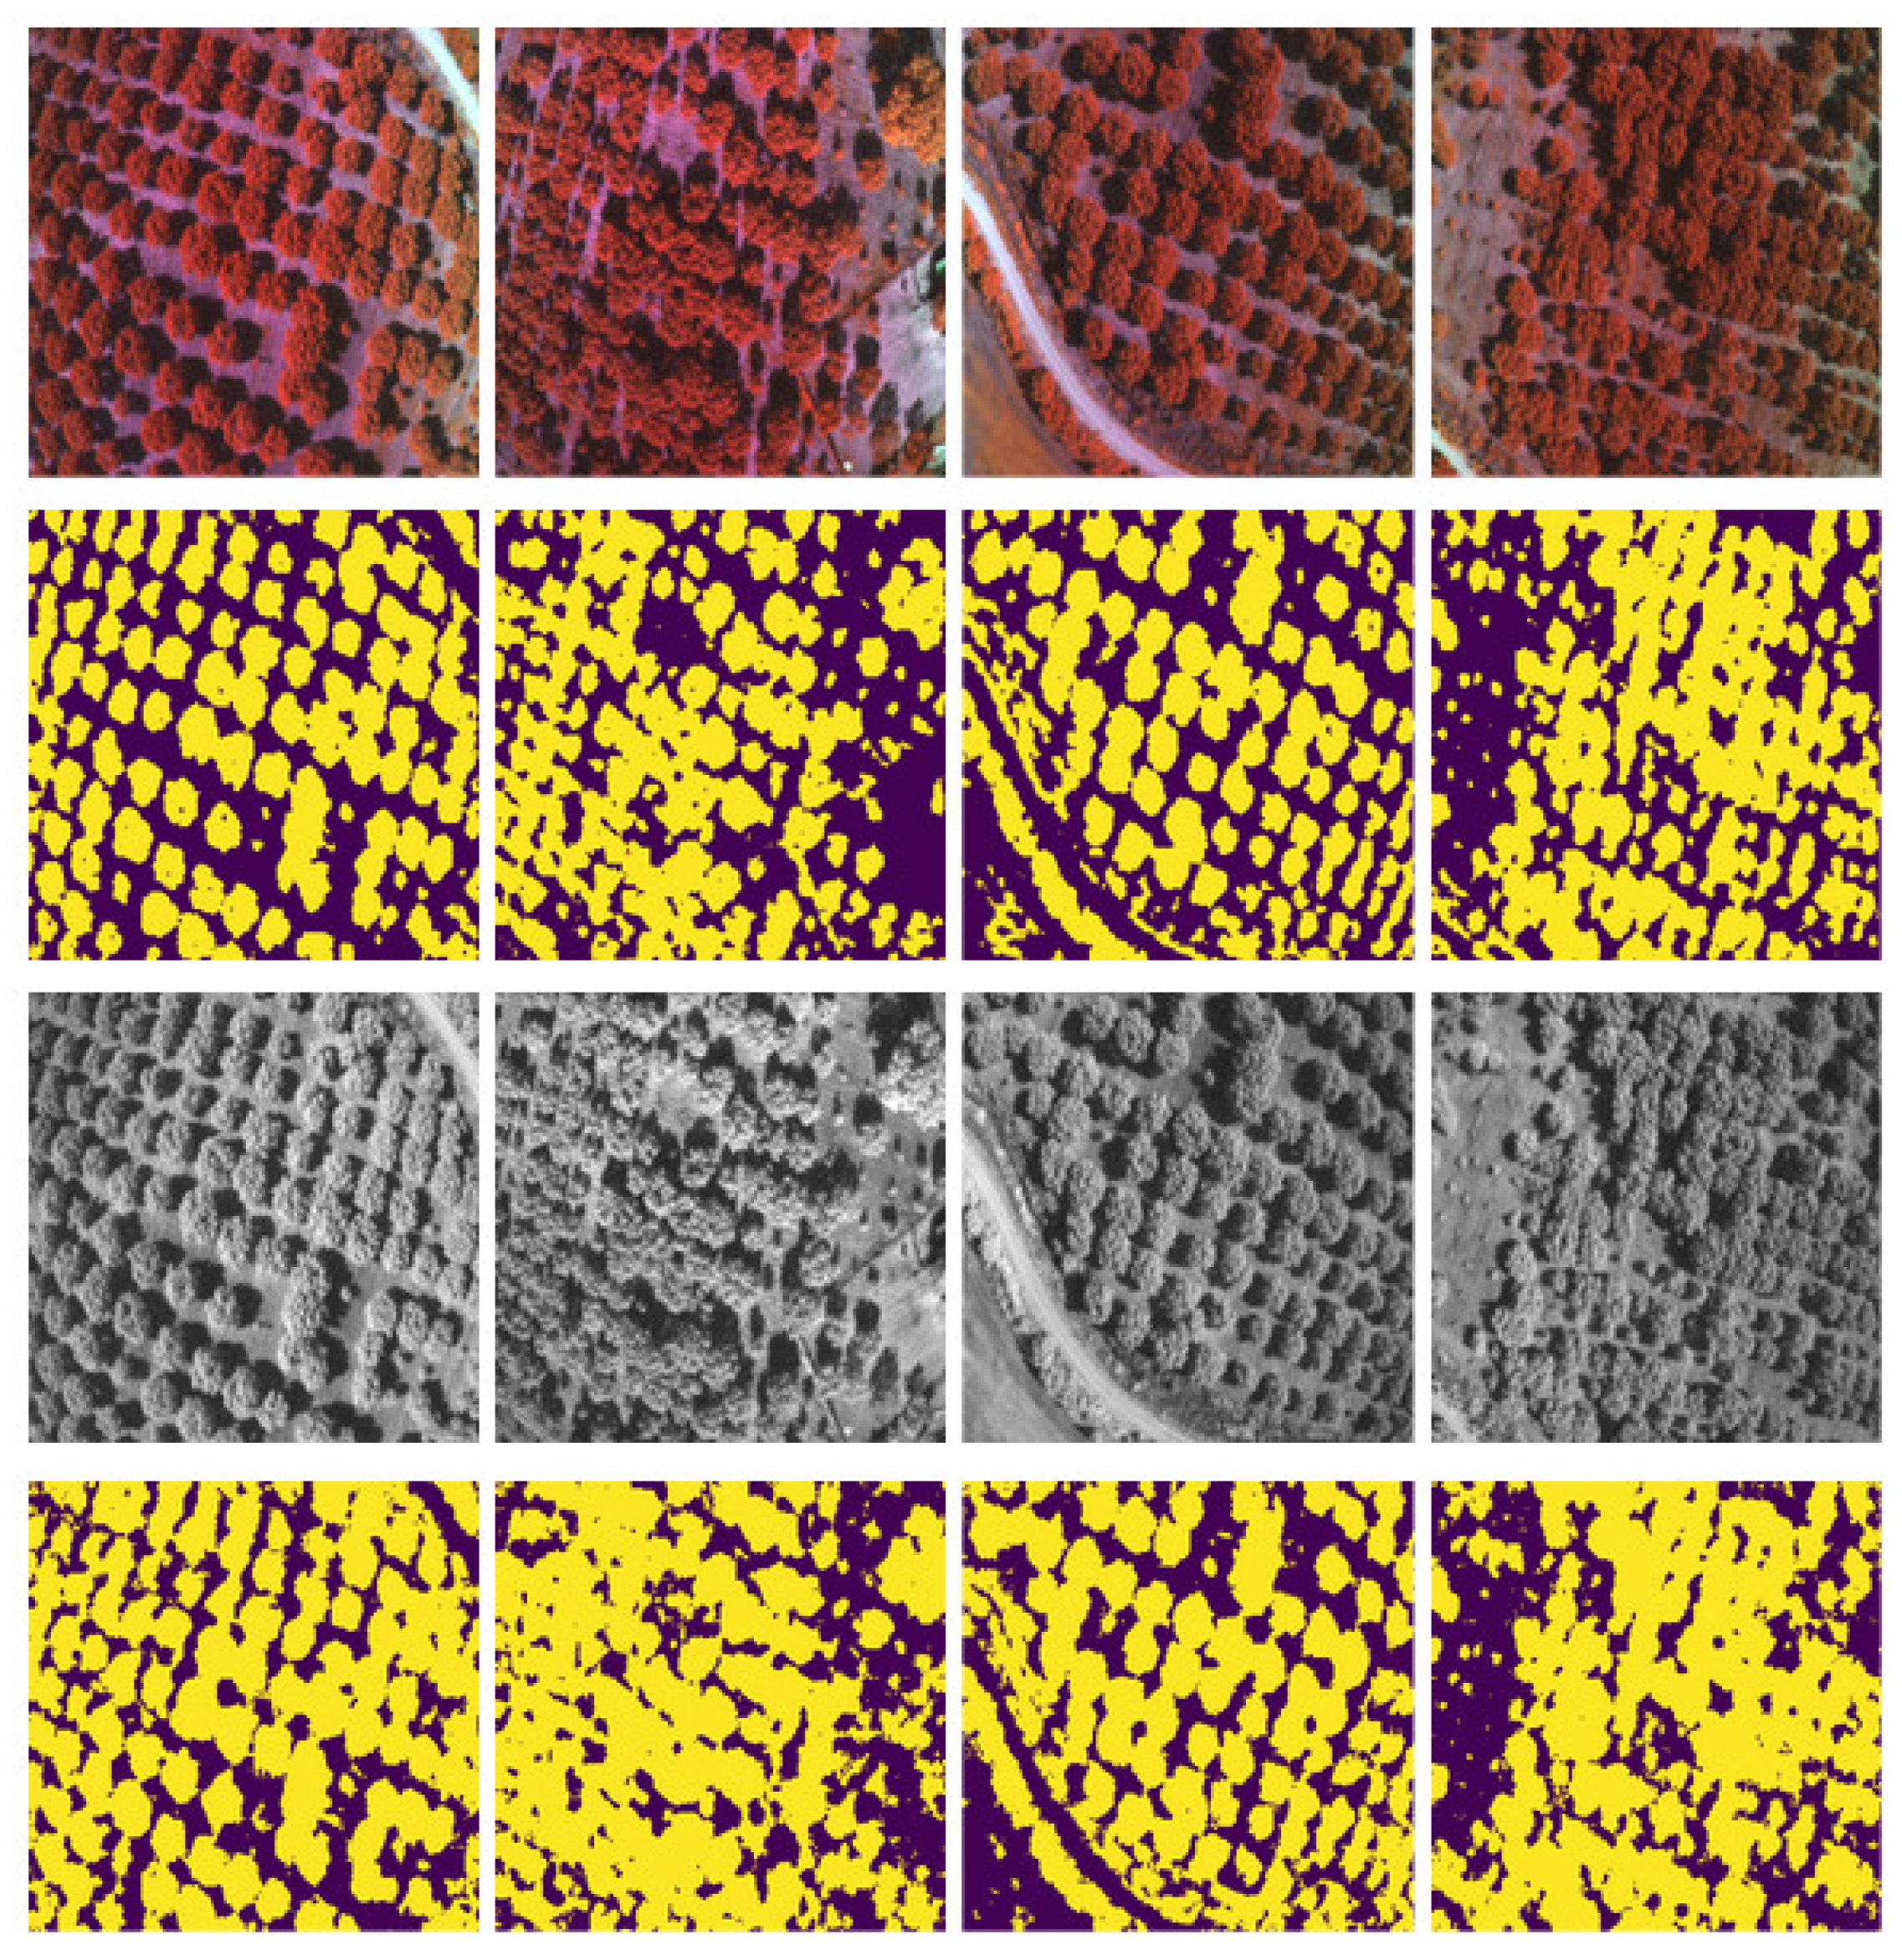
 Figure 7.
The main trade-offs between the simple computer vision and the CNN methods are in implementation complexity, accuracy and efficiency. On one hand, the CV approach is much simpler to implement and shows high and consistent accuracy, but is not efficient enough and therefore not a good choice for embedded devices. The CNN approach, on the other hand, is significantly more complex and requires much more work to get to satisfactory results; furthermore, the accuracy of segmentation is not as consistent as in the CV case and the CNN may need some fine-tuning and readjustment between runs or between fields. The deciding advantage, though, of the CNN method is that it gives very good results when deploying data from fewer bands or even one band, eliminating the preprocessing overhead (Table 6), and making the method suitable for low power and low memory embedded platforms, especially on ML-tuned devices that further enhance the efficiency benefits of the method. To the authors’ knowledge, automatically training and accurately calculating tree crowns in real time from one-band data is a new contribution to the literature. Details and elaboration on the method have been presented in [34].

2.5. My Olive Grove Coach Platforms

MyOGC system consists of two basic platforms: (a) the cloud platform that contains the most of the MyOGC subsystems and (b) the edge platform which is an embedded board (Coral’s Dev Board) capable of executing complex AI and image processing techniques. The roles and interconnections between them are depicted in the Section 2 of the current article.
The cloud platform’s GUI is the main access point for the users to the MyOGC system. It provides the basic authorization and authentication mechanism and the forms for managing the fields related meta-data, such as location, photography sessions, owner and prediction results.
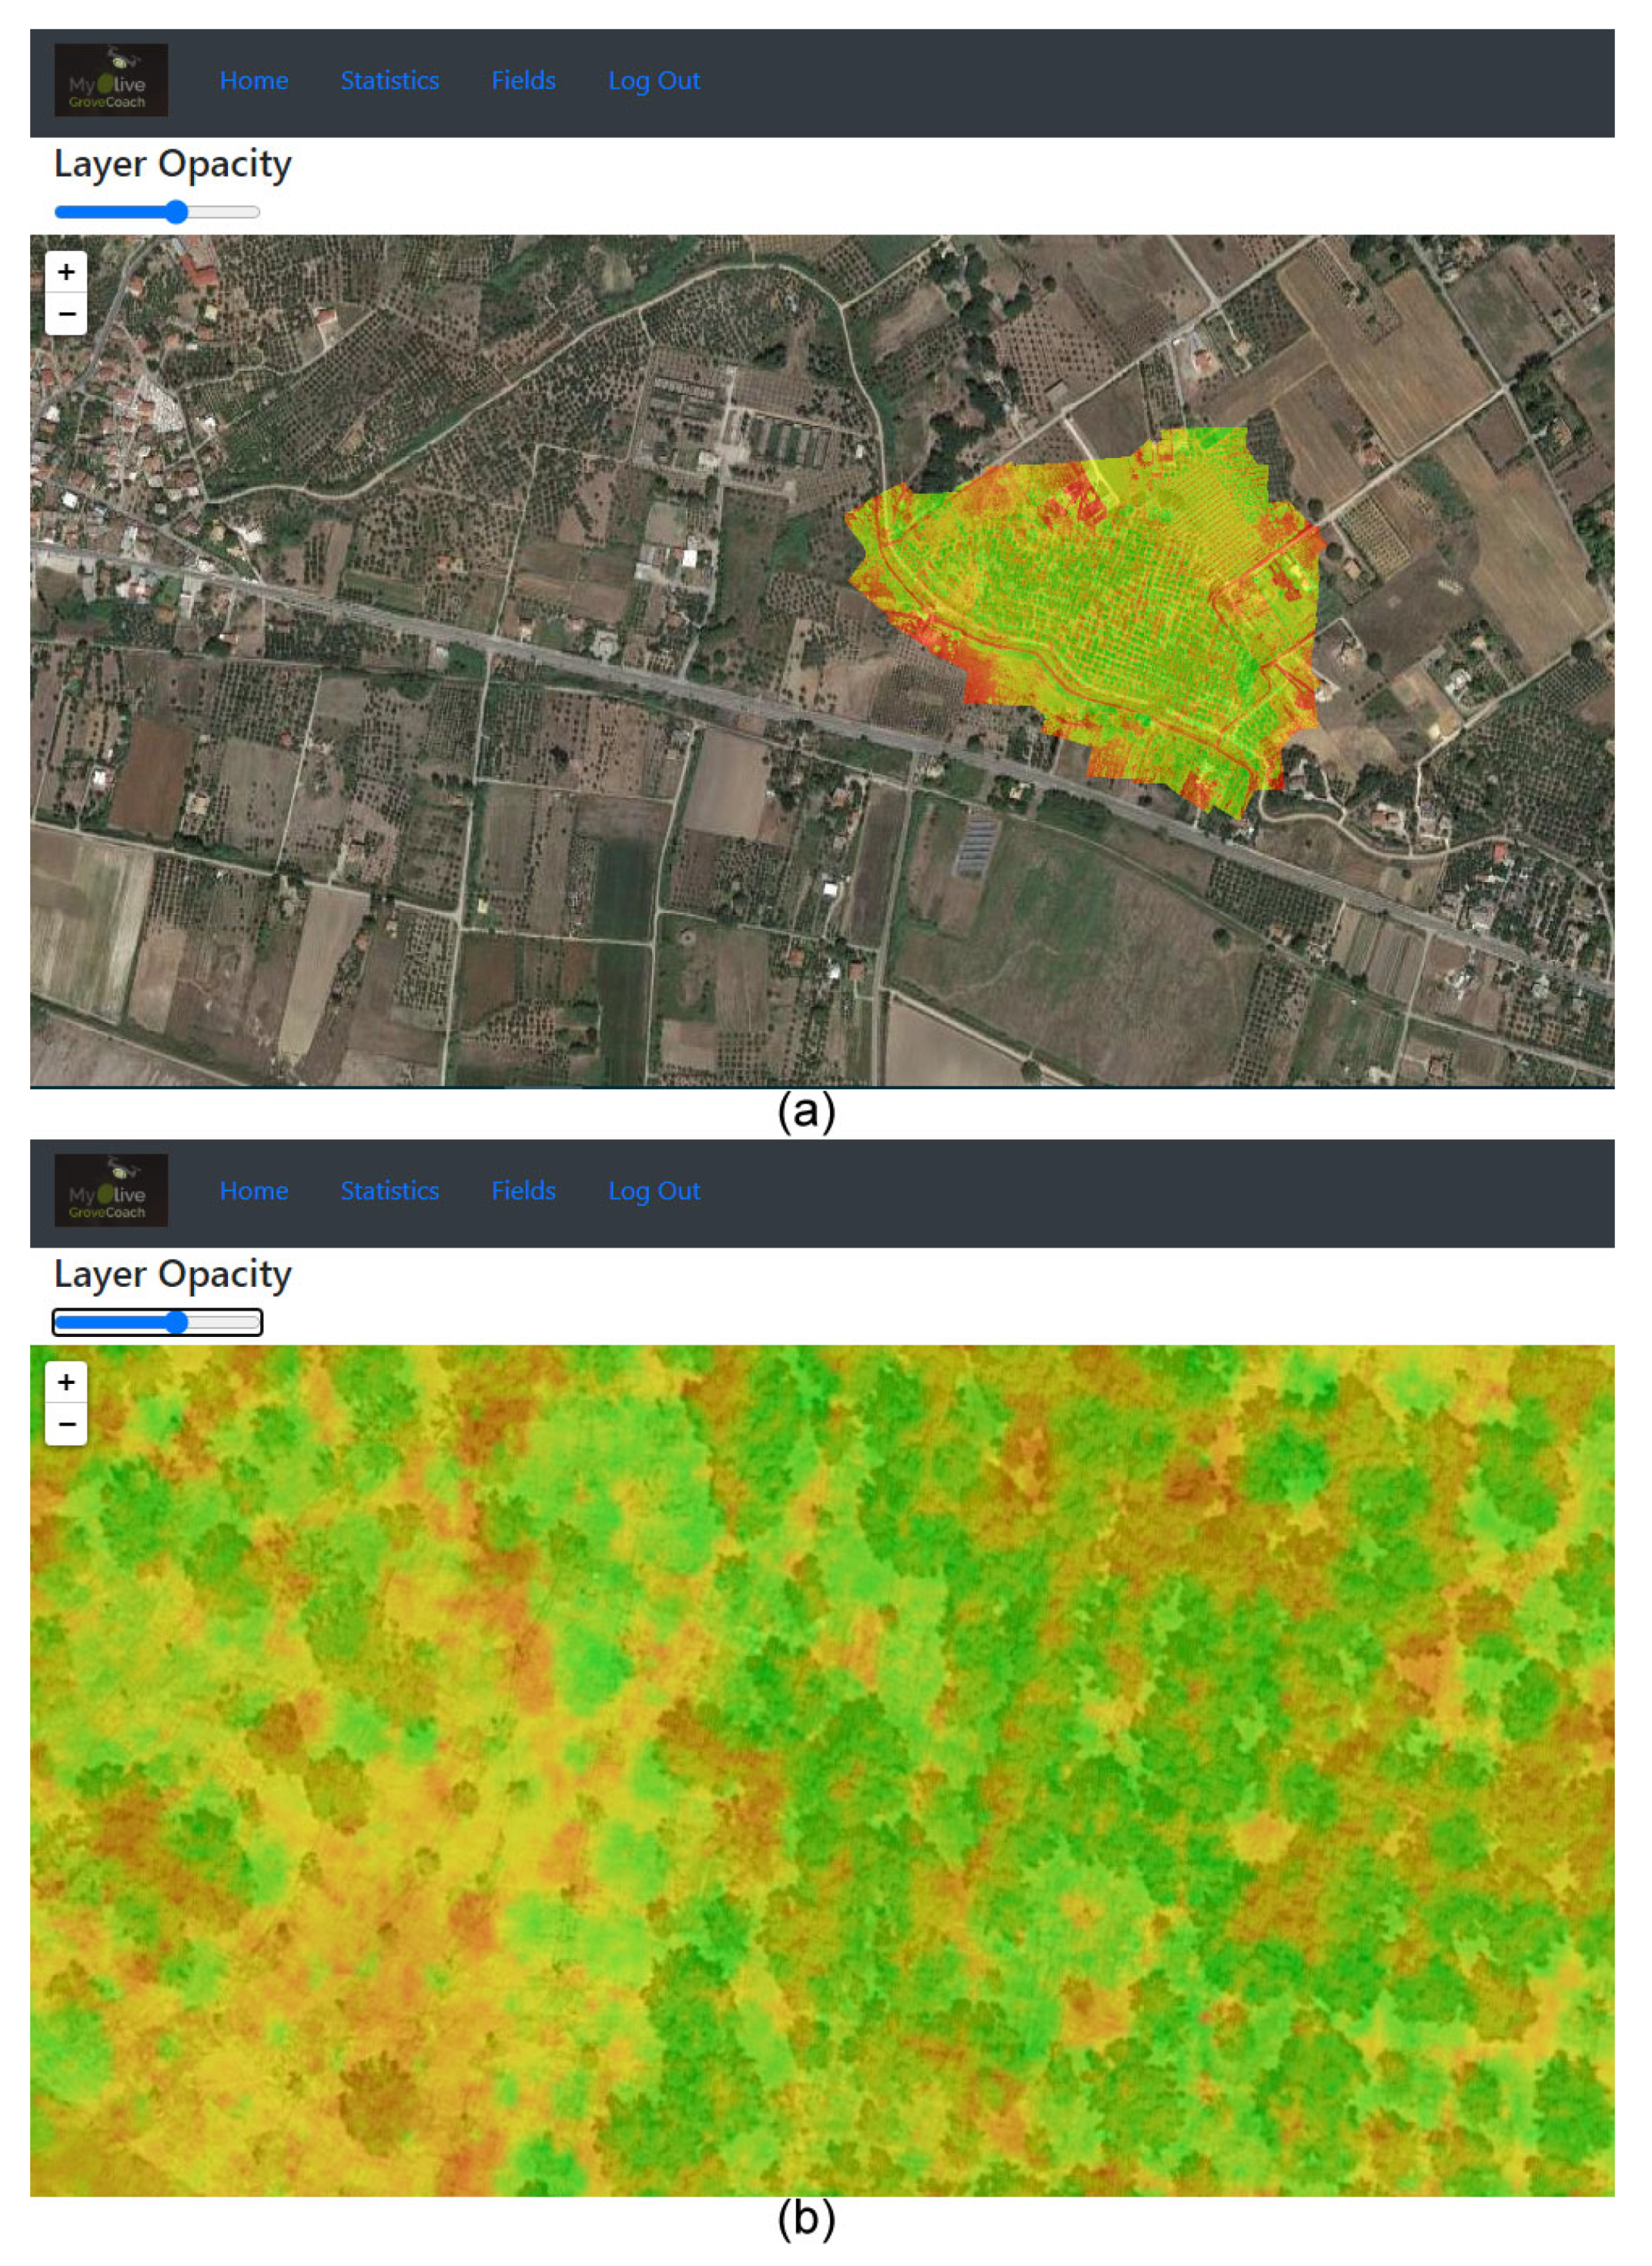
Regarding the prediction results, in order to demonstrate the condition of the fields to their respective farmers, the platform generates multiple colored layers, which are presented as overlays on the original map of the field. When the end-user decides to spectate a field, the platform redirects to a specific interactive map screen where the preprocessed orthomosaic with three basic colors (red, yellow, green) is presented. Green represents healthy trees without phytopathological stress signs; yellow represents stress which is quantified by reduced photosynthetic activity of the affected plant’s canopy and therefore possible onset of disease symptoms; and finally, red indicates sick trees and/or ground. The end-user can zoom in and out of the map, in order to preview every single tree on the map, with great detail.
For the map’s representation, Google’s Leaflet library was utilized with Google Map’s satellite image tiles. The overlay is a preprocessed orthomosaic that was constructed with open source photogrammetry software (“OpenSFM” and “GDAL” libraries), ensuring the maintenance of the spectral reflectance accuracy (reflectance map) and the exact geographical coordinates of the original multispectral images. Consequently, the image is rendered with a level of transparency, and the map is initialized based on the orthomosaic’s coordinates. In this manner, only the farmers’ fields which can be stretched with map zooms are visualized (Figure 8).
The edge platform used in MyOGC is the “Dev Board” by Coral. It is a development board for prototyping on-device ML products. The device’s Edge-TPU is ideal for running embedded ML applications. In this project a dev-board is employed on the drone in order to assist and assess the data collection procedure in real time, bypassing the need for the cpu-intensive and time consuming step (uploading images to the server and processing), at least for preliminary data analysis. More specifically, algorithms are run on the dev-board that delineate the olive trees and provide preliminary info for their health status.

3. Results

3.1. Data, Trials and Evaluation

MyOGC uses two main sources of data: (a) data from direct reflectance measurements of leaves, collected from fields and used as samples for training the assessment and prediction algorithms, and (b) data from aerial surveying with multispectral cameras.
Plant leaves contain information which are highly associated with their health [35]. Optical leaf properties such as reflectance and transmittance are useful in remote sensing techniques for disease detection in a non-invasive manner well before perceived by the human eye. In this way, disease expansion is prevented or significantly restricted in olive groves, thereby minimizing the economic loss of the farmer [36].
Olive leaves’ reflectance measurements are performed in certain bands of the electromagnetic spectrum, mainly in visible and near infrared [37]. A typical reflectance spectrum of a healthy plant is similar to Figure 9. The reflectance of healthy leaves is usually low [38] in the visible spectrum (400–700 nm) due to the significant absorbance of chlorophyll. Healthy plants have high chlorophyll concentration, since this substance is crucial for photosynthesis, allowing plants to absorb light energy. Chlorophyll reflects the green portion of the spectrum, producing the characteristic green color of the leaves. Healthy leaves reflect strongly in the near infrared spectrum as the absorbance of infrared light would cause overheat and consequently damage of plant tissue.
However, when a plant is stressed, the process of photosynthesis slows down, chlorophyll content is reduced, allowing other pigments to appear. These pigments reflect light with wavelengths that are perceived as yellow or orange by the human eye. Diseased plant leaves absorb infrared light while they reflect the visible portion of the spectrum. Diseased plant is gradually drying up and eventually it dies. Generally, it has been observed that the effect of a disease on a plant changes its leaf reflectance in a specific manner [39]. Consequently, reflectance change of plant leaves is correlated to certain diseases. Remote sensing techniques combined with visible/near-infrared spectroscopy [40] are capable of diagnosing diseases at an early stage [41] without observable indicators by simply measuring the reflectance of a plant’s leaf.
When light illuminates a leaf, two types of reflectance are observed [42], specular and diffuse reflectance. Specular reflectance occurs at the epidermis–air interface. Specular reflectance does not contain useful information for the health of a plant as the reflected light does not penetrate the interior tissue of the leaf and therefore does not interact with biochemical constituents (chlorophyll, carotenoids, etc.) except with its surface, providing some information about its properties.
In contrast, the light collected by diffuse reflectance has interacted with the mesophyll [43], the inner part of the leaf, where multiple scattering and absorption of light by its biochemical constituents occurs. The light from diffuse reflectance contains information about the biochemistry of the leaf. As a result, diffuse reflectance plays an important role in determining the health status of a plant, while specular reflectance acts as noise [44].
The diffuse reflectance component of a leaf is usually measured using a spectrophotometer and an integrating sphere [45,46]. The diffused reflectance component is diffused inside the integrating sphere, while the specular reflectance component exits to the outside of the integrating sphere.
In our laboratory, we performed leaf reflectance measurements using Lambda 35 UV/Vis Spectrophotometer along with an integrating sphere and Spectralon as the reflectance standard. We collected leaf samples from olive trees infected with Verticillium wilt at different stages over a long period of time starting from March up to June at 15 day intervals. Five leaf samples were usually collected from randomly selected branches of each tree. Each olive leaf was mounted in a special sample holder provided by the spectrophotometer’s manufacturer. The sample holder was placed at the exit port of the integrating sphere. A light source that consisted of wavelength range of 190 to 1100 nm was at the entrance port of the integrating sphere.
We collected leaf reflectance spectra from about 400 to 1100 nm. Then, after the leaf reflectance collection, we performed data analysis using MATLAB. We calculated a mean reflectance for each tree and the standard deviation. Next, we performed a first-order derivative analysis. Due to the high sensitivity of derivative analysis to noise, we applied a Savitzky–Golay filter [47] for smoothing the data with a polynomial order of 4 and a frame length of 17.
The first-order derivative analysis provides information for the reflectance slope in the red-edge position. The slope in the red-edge is highly associated with the chlorophyll content of the leaf. If the slope of a leaf reflectance spectrum is low, then its chlorophyll content is low. This means that the leaf is infected or it is slowly dying The peak of the first-order derivative reflectance spectrum of a diseased leaf is sharply blue shifted, while for the healthy leaf, a moderate blue shift of the peak of the first-order derivative is observed (Figure 10). This is an indication of a decrease in the chlorophyll concentration in the leaves of the olive trees and their possible infection by Verticillium wilt. Moreover, in the second-order derivative analysis, the heights of the peaks of the diseased leaf are increased due to chlorophyll reduction [48] (Figure 11).
The aerial multispectral images were collected using a Pix4d Parrot Sequoia camera mounted on a C0 class drone. The Parrot camera is a multispectral camera capturing images on the four characteristic bands: green (550 nm), red (660 nm), red edge (735 nm) and near-infrared (790 nm). Figure 12 visualizes a typical drone flight pattern, at a height of 70 m. A sample of the collected images is presented in Figure 13.
An early processing stage takes place on the dev board mounted on the drone, providing some real-time preliminary analysis of the olive grove. Notably, this first analysis includes visualization of olive trees crowns (Figure 3) and vegetation indices.

3.2. Synthetic Data Generation

The effectiveness of deep learning algorithms significantly relies on the proper acquisition and manual annotation of a large amount of good quality data. In many cases, limitations occur that have to do with the lack of expert knowledge for data labeling, difficulties on capturing large quantities of data with sufficient variety, or even the ability of capturing good quality data volumes might be extremely expensive and under privacy restrictions. In such cases, the lack of real-world data can be tackled by generating synthetic data that share the same basic characteristics with the real data.
The use of synthetic data can be twofold. For example, synthetic data can be initially used to train a deep learning model with the intention to use them on real-world data, or even train generative models that refine synthetic data for making them more suitable for training. In addition, synthetic data can be used to increase real-world datasets, or even be generated from existing data using generative models, in order to produce a hybrid dataset able to effectively cover the data distribution that is not adequately represented in the real dataset and, therefore, alleviate dataset bias.
In this line of research and due to lack of large volumes of proper olive tree data in different environmental condition, generation of synthetic data is investigated here with the use of Blender tool. Blender is an open source software for creating 3D environments, able to run on any operating system and having the ability to write scripts and addons in Python programming language. In our case, scripting was used in the Blender environment for generating multiple olive trees with great variability. From just a few leaves collected from the field and the use of specific textures of the tree branches, trunks and soil, a close-to-real synthetic tree and a number of synthetic trees were created, using the sequential approach shown in the block diagram of Figure 14.
This approach constitutes the virtual olive grove under consideration, which can change dynamically regarding:
  • The number of trees it contains;
  • The locations of the trees in the area;
  • The types and levels of disease they may carry;
  • The timeslot of the captured image within the day or within a period (e.g., position of the sun, level of vegetation);
  • The shooting height (from the edges of the trees up to the tree a height corresponding to the shooting height of the images in the field).
Initially, the appropriate textures needed for the olive tree creation (healthy/ill leaves, branches, trunk) and the positions of the soil around the trees were gathered (Figure 15a,b). The 3D model of the leaf was then produced (Figure 15c), followed by the creation of the branch by replicating the created leaf model, or combining multiple leaf models (Figure 15d–f).
Using the created branches and combining them with the olive tree trunk texture, an olive tree can be created. By replicating the same methodology a random number of trees can be positioned onto the given soil, as shown on Figure 16.
Using specialized tools and additional applications, trees such as those shown in Figure 17 were created. In addition, by introducing the specifications and properties of the camera and lens used to capture on-field images, we can accurately simulate the shooting conditions. The correct placement of the sun (light source) is possible, if the geographical coordinates of the field under consideration are known, but it is not certain that they will contribute to the improvement of the resolution of the system.

4. Discussion

Monitoring vegetation using drones can provide important data for the assessment of the condition of crops. The implementation of precision agriculture and its adoption has become feasible thanks to the development of sensor technologies and the convergence of other technological solutions, e.g., UAVs combined with procedures to link mapped variables to appropriate farming management actions. However, it is vital that data collection with today’s media be done as carefully as possible, as it will be the basis for future studies of precision agriculture and ecological monitoring. Despite the plug-and-play nature of the latest generation of multispectral sensors developed to quantify the physiological status of crops, such as Parrot Sequoia and MicaSense RedEdge, a number of factors require careful consideration if the goal is to collect high quality and scientifically calibrated data that are comparable between sensors, geographically and over time.
In order to achieve the project’s goals, MyOGC was developed and implements a workflow for processing agricultural multispectral data. This workflow takes into account the technical aspects and challenges of multispectral sensors, such as flight planning, weather and sun conditions and aspects of geographic positioning.

5. Conclusions

By using multispectral imaging solutions from UAV-enabled remote sensing solutions and employing innovative signal processing methods in combination with machine learning techniques, MyOGC offers an olive grove monitoring system that is useful in the early detection and prediction of Verticillium wilt spread, and provides a platform that helps the farmer asses the condition of his fields through maps of important characteristics of the grove and guides the agronomist through a communication and decision-making support system.

Author Contributions

Conceptualization, C.X., C.A. and A.L.; methodology, C.X., D.A., C.A., C.T. and A.L.; software, K.B., I.E., S.K., A.M. and C.T.; formal analysis and investigation, A.T.; writing—original draft preparation, K.B., A.T. and C.X.; writing—review and editing, all authors contributed equally; supervision, D.A., C.A., C.T. and A.L.; project administration, A.L. All authors have read and agreed to the published version of the manuscript.

Funding

My Olive Grove Coach (MyOGC) (MIS 5040498) is implemented under the Action for the Strategic Development on the Research and Technological Sector, co-financed by national funds through the Operational Programme of Western Greece 2014–2020 and European Union funds (European Regional Development Fund).

Data Availability Statement

The data presented in this study are available on request from the corresponding authors.

Conflicts of Interest

The authors declare no conflict of interest.

References

  1. Herder, M.D.; Moreno, G.; Mosquera-Losada, R.; Palma, J.; Sidopoulou, A.; Santiago Freijanes, J.J.; Crous-Duran, J.; Paulo, J.A.; Tomé, M.; Pantera, A.; et al. Current Extent and Trends of Agroforestry in the EU27. Available online: https://www.agforward.eu/index.php/en/current-extent-and-trends-of-agroforestry-in-the-eu27.html (accessed on 30 November 2020).
  2. Calderón, R.; Navas-Cortés, J.A.; Lucena, C.; Zarco-Tejada, P.J. High-resolution airborne hyperspectral and thermal imagery for early detection of Verticillium wilt of olive using fluorescence, temperature and narrow-band spectral indices. Remote Sens. Environ. 2013, 139, 231–245. [Google Scholar] [CrossRef]
  3. Fradin, E.F.; Thomma, B.P. Physiology and molecular aspects of Verticillium wilt diseases caused by V. dahliae and V. albo-atrum. Mol. Plant Pathol. 2006, 7, 71–86. [Google Scholar] [CrossRef] [PubMed]
  4. Zartaloudis, Z.; Iatrou, M.; Savvidis, G.; Savvidis, K.; Glavenas, D.; Theodoridou, S.; Kalogeropoulos, K.; Kyparissi, S. A new 11-point calibration scale of Verticillium wilt of olive verified by thermal remote sensing and plant analysis. In Proceedings of the 17th PanHellenic Plant Pathology Conference, Volos, Greece, 13–18 October 2014. [Google Scholar]
  5. Iatrou, G.; Mourelatos, S.; Zartaloudis, Z.; Iatrou, M.; Gewehr, S.; Kalaitzopoulou, S. Remote Sensing for the Management of Verticillium Wilt of Olive. Fresenius Environ. Bull. 2016, 25, 3622–3628. [Google Scholar]
  6. Calderón, R.; Navas-Cortés, J.A.; Zarco-Tejada, P.J. Early detection and quantification of Verticillium wilt in olive using hyperspectral and thermal imagery over large areas. Remote Sens. 2015, 7, 5584. [Google Scholar] [CrossRef] [Green Version]
  7. Li, W.; He, C.; Fu, H.; Zheng, J.; Dong, R.; Xia, M.; Yu, L.; Luk, W. A Real-Time Tree Crown Detection Approach for Large-Scale Remote Sensing Images on FPGAs. Remote Sens. 2019, 11, 1025. [Google Scholar] [CrossRef] [Green Version]
  8. Karantzalos, K.; Argialas, D. Towards automatic olive tree extraction from satellite imagery. In Proceedings of the XXth ISPRS Congress on Geo-Imagery Bridging Continents, Istanbul, Turkey, 12–23 July 2004; pp. 12–23. [Google Scholar]
  9. Khan, A.; Khan, U.; Waleed, M.; Khan, A.; Kamal, T.; Marwat, S.N.K.; Maqsood, M.; Aadil, F. Remote Sensing: An Automated Methodology for Olive Tree Detection and Counting in Satellite Images. IEEE Access 2018, 6, 77816–77828. [Google Scholar] [CrossRef]
  10. Dalponte, M.; Frizzera, L.; Gianelle, D. Individual tree crown delineation and tree species classification with hyperspectral and LiDAR data. PeerJ 2019, 6, e6227. [Google Scholar] [CrossRef]
  11. Torres-Sánchez, J.; López-Granados, F.; Borra-Serrano, I.; Peña, J.M. Assessing UAV-collected image overlap influence on computation time and digital surface model accuracy in olive orchards. Precis. Agric. 2018, 19, 115–133. [Google Scholar] [CrossRef]
  12. Santos-Rufo, A.; Mesas-Carrascosa, F.J.; García-Ferrer, A.; Meroño-Larriva, J.E. Wavelength Selection Method Based on Partial Least Square from Hyperspectral Unmanned Aerial Vehicle Orthomosaic of Irrigated Olive Orchards. Remote Sens. 2020, 12, 3426. [Google Scholar] [CrossRef]
  13. Levner, I.; Bulitko, V. Machine learning for adaptive image interpretation. In Proceedings of the AAAI, San Jose, CA, USA, 25–29 July 2004; pp. 870–876. [Google Scholar]
  14. Wu, X.; Shen, X.; Cao, L.; Wang, G.; Cao, F. Assessment of Individual Tree Detection and Canopy Cover Estimation using Unmanned Aerial Vehicle based Light Detection and Ranging (UAV-LiDAR) Data in Planted Forests. Remote Sens. 2019, 11, 908. [Google Scholar] [CrossRef] [Green Version]
  15. Karydas, C.; Gewehr, S.; Iatrou, M.; Iatrou, G.; Mourelatos, S. Olive Plantation Mapping on a Sub-Tree Scale with Object-Based Image Analysis of Multispectral UAV Data; Operational Potential in Tree Stress Monitoring. J. Imaging 2017, 3, 57. [Google Scholar] [CrossRef] [Green Version]
  16. Weinstein, B.G.; Marconi, S.; Bohlman, S.; Zare, A.; White, E. Individual tree-crown detection in RGB imagery using semi-supervised deep learning neural networks. bioRxiv 2019, 1309. [Google Scholar] [CrossRef] [Green Version]
  17. Lu, S.; Lu, F.; You, W.; Wang, Z.; Liu, Y.; Omasa, K. A robust vegetation index for remotely assessing chlorophyll content of dorsiventral leaves across several species in different seasons. Plant Methods 2018, 14, 15. [Google Scholar] [CrossRef] [PubMed] [Green Version]
  18. Gomez-Candon, D.; Labbé, S.; Virlet, N.; Jolivot, A.; Regnard, J.L. High resolution thermal and multispectral UAV imagery for precision assessment of apple tree response to water stress. In Proceedings of the International Conference on Robotics and Associated High-Technologies and Equipment for Agriculture and Forestry RHEA; PGM: Madrid, Spain, 2014. [Google Scholar]
  19. Di Nisio, A.; Adamo, F.; Acciani, G.; Attivissimo, F. Fast Detection of Olive Trees Affected by Xylella Fastidiosa from UAVs Using Multispectral Imaging. Sensors 2020, 20, 4915. [Google Scholar] [CrossRef]
  20. Csillik, O.; Cherbini, J.; Johnson, R.; Lyons, A.; Kelly, M. Identification of citrus trees from unmanned aerial vehicle imagery using convolutional neural networks. Drones 2018, 2, 39. [Google Scholar] [CrossRef] [Green Version]
  21. Santos, A.A.D.; Marcato Junior, J.; Araújo, M.S.; Di Martini, D.R.; Tetila, E.C.; Siqueira, H.L.; Aoki, C.; Eltner, A.; Matsubara, E.T.; Pistori, H.; et al. Assessment of CNN-Based Methods for Individual Tree Detection on Images Captured by RGB Cameras Attached to UAVs. Sensors 2019, 19, 3595. [Google Scholar] [CrossRef] [Green Version]
  22. Li, W.; Fu, H.; Yu, L.; Cracknell, A. Deep learning based oil palm tree detection and counting for high-resolution remote sensing images. Remote Sens. 2017, 9, 22. [Google Scholar] [CrossRef] [Green Version]
  23. Card, D.H.; Peterson, D.L.; Matson, P.A.; Aber, J.D. Prediction of leaf chemistry by the use of visible and near infrared reflectance spectroscopy. Remote Sens. Environ. 1988, 26, 123–147. [Google Scholar] [CrossRef]
  24. Curran, P.J.; Dungan, J.L.; Macler, B.A.; Plummer, S.E.; Peterson, D.L. Reflectance spectroscopy of fresh whole leaves for the estimation of chemical concentration. Remote Sens. Environ. 1992, 39, 153–166. [Google Scholar] [CrossRef]
  25. Wu, D.; Feng, L.; Zhang, C.; He, Y. Early Detection of Botrytis cinerea on Eggplant Leaves Based on Visible and Near-Infrared Spectroscopy. Trans. ASABE 2008, 51, 1133–1139. [Google Scholar] [CrossRef]
  26. Radoglou-Grammatikis, P.; Sarigiannidis, P.; Lagkas, T.; Moscholios, I. A compilation of UAV applications for precision agriculture. Comput. Netw. 2020, 172, 107148. [Google Scholar] [CrossRef]
  27. Guirado, E.; Tabik, S.; Alcaraz-Segura, D.; Cabello, J.; Herrera, F. Deep-learning Versus OBIA for Scattered Shrub Detection with Google Earth Imagery: Ziziphus lotus as Case Study. Remote Sens. 2017, 9, 1220. [Google Scholar] [CrossRef] [Green Version]
  28. Feng, L.; Kudva, P.; Da Silva, D.; Hu, J. Exploring serverless computing for neural network training. In Proceedings of the 2018 IEEE 11th International Conference on Cloud Computing (CLOUD), San Francisco, CA, USA, 2–7 July 2018; IEEE: Piscataway, NJ, USA, 2018; pp. 334–341. [Google Scholar]
  29. Pegkas, A.; Alexakos, C.; Likothanassis, S. Credit-based algorithm for Virtual Machines Scheduling. In Proceedings of the 2018 Innovations in Intelligent Systems and Applications (INISTA), Thessaloniki, Greece, 3–5 July 2018; IEEE: Piscataway, NJ, USA, 2018; pp. 1–6. [Google Scholar]
  30. Deering, D.W. Rangeland Reflectance Characteristics Measured by Aircraft and Spacecraft Sensors. Ph.D Thesis, Texas A&M Universtiy, College Station, TX, USA, 1978. [Google Scholar]
  31. Reifsnyder, W.E. Analytical Methods in Biophysical Ecology. BioScience 1981, 31, 156. [Google Scholar] [CrossRef] [Green Version]
  32. Xue, J.; Su, B. Significant remote sensing vegetation indices: A review of developments and applications. J. Sens. 2017, 2017, 1353691. [Google Scholar] [CrossRef] [Green Version]
  33. Calderón Madrid, R.; Navas Cortés, J.A.; Montes Borrego, M.; Landa del Castillo, B.B.; Lucena León, C.; Jesús Zarco Tejada, P. Detection of Verticillium wilt of olive trees and downy mildew of opium poppy using hyperspectral and thermal UAV imagery. In EGU General Assembly Conference Abstracts; Copernicus Publications: Göttingen, Germany, 2014; p. 129. [Google Scholar]
  34. Blekos, K.; Nousias, S.; Lalos, A. Efficient automated U-Net based tree crown delineation using UAV multi-spectral imagery on embedded devices. In Proceedings of the IEEE-International Conference on Industrial Informatics (INDIN), Guangzhou, China, 11–13 July 2020. [Google Scholar]
  35. Sankaran, S.; Mishra, A.; Ehsani, R.; Davis, C. A review of advanced techniques for detecting plant diseases. Comput. Electron. Agric. 2010, 72, 1–13. [Google Scholar] [CrossRef]
  36. Savary, S.; Ficke, A.; Aubertot, J.N.; Hollier, C. Crop losses due to diseases and their implications for global food production losses and food security. Food Secur. 2012, 4, 519–537. [Google Scholar] [CrossRef]
  37. Peñuelas, J.; Filella, I. Visible and near-infrared reflectance techniques for diagnosing plant physiological status. Trends Plant Sci. 1998, 3, 151–156. [Google Scholar] [CrossRef]
  38. Gates, D.M.; Keegan, H.J.; Schleter, J.C.; Weidner, V.R. Spectral Properties of Plants. Appl. Opt. 1965, 4, 11–20. [Google Scholar] [CrossRef]
  39. Polischuk, V.P.; Shadchina, T.M.; Kompanetz, T.I.; Budzanivskaya, I.G.; Boyko, A.L.; Sozinov, A.A. Changes in reflectance spectrum characteristic of nicotiana debneyi plant under the influence of viral infection. Arch. Phytopathol. Plant Prot. 1997, 31, 115–119. [Google Scholar] [CrossRef]
  40. Zhang, J.C.; Pu, R.L.; Wang, J.H.; Huang, W.J.; Yuan, L.; Luo, J.H. Detecting powdery mildew of winter wheat using leaf level hyperspectral measurements. Comput. Electron. Agric. 2012, 85, 13–23. [Google Scholar] [CrossRef]
  41. Bravo, C.; Moshou, D.; West, J.; McCartney, A.; Ramon, H. Early Disease Detection in Wheat Fields using Spectral Reflectance. Biosyst. Eng. 2003, 84, 137–145. [Google Scholar] [CrossRef]
  42. Brakke, T.W. Specular and diffuse components of radiation scattered by leaves. Agric. For. Meteorol. 1994, 71, 283–295. [Google Scholar] [CrossRef]
  43. Brodersen, C.R.; Vogelmann, T.C. Do epidermal lens cells facilitate the absorptance of diffuse light? Am. J. Bot. 2007, 94, 1061–1066. [Google Scholar] [CrossRef] [PubMed] [Green Version]
  44. Li, Y.; Chen, Y.; Huang, J. An Approach to Improve Leaf Pigment Content Retrieval by Removing Specular Reflectance through Polarization Measurements. IEEE Trans. Geosci. Remote Sens. 2019, 57, 2173–2186. [Google Scholar] [CrossRef]
  45. Lukeš, P.; Stenberg, P.; Rautiainen, M.; Mõttus, M.; Vanhatalo, K.M. Optical properties of leaves and needles for boreal tree species in Europe. Remote Sens. Lett. 2013, 4, 667–676. [Google Scholar] [CrossRef]
  46. Mõttus, M.; Sulev, M.; Hallik, L. Seasonal Course of the Spectral Properties of Alder and Birch Leaves. IEEE J. Sel. Top. Appl. Earth Obs. Remote Sens. 2014, 7, 2496–2505. [Google Scholar] [CrossRef]
  47. Schafer, R.W. What is a Savitzky-Golay filter? [lecture notes]. IEEE Signal Process. Mag. 2011, 28, 111–117. [Google Scholar] [CrossRef]
  48. Imanishi, J.; Nakayama, A.; Suzuki, Y.; Imanishi, A.; Ueda, N.; Morimoto, Y.; Yoneda, M. Nondestructive determination of leaf chlorophyll content in two flowering cherries using reflectance and absorptance spectra. Landsc. Ecol. Eng. 2010, 6, 219–234. [Google Scholar] [CrossRef] [Green Version]
Figure 1. Research by remote sensing source.
Jsan 10 00015 g001
Figure 2. MyOGC overall architecture.
Jsan 10 00015 g002
Figure 3. Automatic delineation of olive trees (overlay).
Jsan 10 00015 g003
Figure 4. Histogram of NDVI and NDRE values.
Jsan 10 00015 g004
Figure 5. Annotation of images according to tree health. Spectral method (left) and NDVI/NDRE fusion (right). In this case trees seem healthy (green) or slightly stressed (yellow).
Jsan 10 00015 g005
Figure 6. CNN processing pipeline and architecture.
Jsan 10 00015 g006
Figure 7. Input images (rows 1 and 3) and respective output classifications from the CNN (rows 2 and 4).
Jsan 10 00015 g007
Figure 8. The MyOGC-GUI interactive map where (a) the orthomosaic is depicted as overlay in the original satellite field image and (b) is its zoom in on the level where the trees are clearly depicted.
Jsan 10 00015 g008
Figure 9. Typical reflectance spectrum of a healthy plant.
Jsan 10 00015 g009
Figure 10. First-order derivative analysis of a healthy and an infected tree.
Jsan 10 00015 g010
Figure 11. Second-order derivative analysis of a healthy and an infected tree.
Jsan 10 00015 g011
Figure 12. Typical flight path of a UAV while collecting data from a field.
Jsan 10 00015 g012
Figure 13. Sample of raw input images. One image per spectral band, taken at the same time using a multispectral camera. From left to right and top to bottom: GRE—green (550 nm), RED—red (660 nm), REG—red edge (735 nm), NIR—near infrared (790 nm).
Jsan 10 00015 g013
Figure 14. Synthetic data creation chain for olive trees.
Jsan 10 00015 g014
Figure 15. Olive branch creation procedure: (a) leaves, front and back views, (b) leaf texture extraction, (c) leaf 3d model, (d) branch image, (e) branch texture, (f) final branches.
Jsan 10 00015 g015
Figure 16. Creation of multiple trees: (a) olive tree branches, combined with the trunk texture (c), produce the tree (d) placed onto the soil having the texture inherited by (b), with (e) being the final olive tree.
Jsan 10 00015 g016
Figure 17. Virtual field with olives: (a) horizontal view, (b) view from vertical to field of view.
Jsan 10 00015 g017
Table 1. Hyperspectral indices that are often used for the prediction and detection of Verticillium wilt in olive trees [2,5,6].
Structural
(Enhanced) Normalized Difference Vegetation Index—(E)NDVI
Renormalized Difference Vegetation Index—RDVI
Optimized Soil-Adjusted Vegetation Index—OSAVI
Normalized Difference Red Edge Index—NDRE
Visible Atmospherically Resistant Index—VARI
Green Exceedance Index—GEI
Carotenoid
Structure-Intensive Pigment Index—SIPI
Pigment Specific Simple Ratio Carotenoids—PSSRc
Chlorophyll a + b
Pigment Specific Simple Ratio Chlorophyll a, b—PSSRa/b
Transformed Chlorophyll Absorption in Reflectance Index—TCARI
Table 2. Verticillium infection scale [4].
Infection LevelDescription
0Healthy tree
1Tree looks healthy (slight crown discolloration)
2Chlorotic hair (yellow-bronze color)
slight twisting or curving of the extreme leaves
3Dry inflorescence-inflorescence-dehydration of twigs
4Drying of a twig or a branch
5Dry arm-section or half of the tree
6A main branch or arm of a tree retains vegetation
775 % of the tree has died
8A branch of the tree retains vegetation
9A small section or a branch of the tree retains vegetation
10Drying of the whole tree
Table 3. Platforms available to farmers and producers for remote monitoring of fields.
PlatformRegionAlgorithmsDescriptionImaging
AGERpointUSNDVI, VARI, ENDVI, NDRECapture precise agriculture data using Lidar enabled dronesLidar, optical sensors
GamayaSwitzerlandNDVI, VARIA farming management solution using hyperspectral imagingLidar
HummingbirdUK, Russia, Ukraine, Brazil, New Zeland, AustraliaNDVI, VARI, ENDVIArtificial intelligence business that provides advanced crop analysisLidar, Satellite Planes
Ceres ImagingUS, Hawaii, AustraliaNDVI, VARIAerial spectral imagery company that is using low-flying planesPlanes
TaranisRussia, Israel, Argentina, Brazil, US, UkraineNDVI, VARIAgriculture intelligence platform that uses computer vision, data science and deep learning algorithms to effectively monitor fieldsLidar, Satellite, Planes
DroneDeployALLNDVI, VARI, ENDVIAnalyze and provide a full range of stats: plant counting, plant health tools and stress detectors that enable precise yield increase and increase of overall profit.Lidar
AgEagleUSNDVI, VARI, ENDVIAerial data collection and analytics solutions help farmers and agronomists to acquire high quality, actionable intelligenceLidar, Satelite, Planes
DeveronCanada, USNDVI, NDREDrone data company focused on agricultureLidar
Table 4. Comparison of indicative remote sensing systems available on the market.
RedEdge-MX (Micacense)SlantView (SlantRange)Parrot SEQUOIA+Sentera Quad Sensor
ApplicationPlant health indexesPrecision agriculturePrecision agriculturePrecision agriculture. Plant health analysis
Spectral BandsBlue, Green, Red, Red Edge, Near-IR470, 550, 620, 650, 710, 850 (nm)Green, Red, Red Edge, Near-IR
SensorGlobal ShutterGlobal ShutterGlobal Shutter 16 MP RGB 4 × 1.4 MPGlobal Shutter 1.2 MP RGB 3 × 1.2 MP Mono
ResolutionGSD: 8 cm/px@120 mGSD: 2 cm/px@160 mRGB: 4608 × 3456 px, Single: 1280 × 960 pxGSD: 4.5 cm/px@200 m, 9.1 cm/px@400 m
Capture Rate1 fps, 12-bit RAW1 fps, 8–10 bit depth1 fps[email protected] MP. 20–24 fps@720 p
FoV46.2 HFOV-RGB: 63.9 HFOV. Single: 48.5 HFOV50 HFOV. 49 VFOV
Tech AdvantagesMultiple triggering optionsGPS / IMU + EKFGPS, IMU, mangetometer SD Card slot. Image Processing by Pix4D32 GB SD card per sensor
Table 5. Representative algorithms used for crown delineation.
Simple Image ProcessingMachine LearningDeep Learning
Valley followingMaximum probabilityConvolutional Neural Networks
Region growingSupport Vector Machines
Watershed segmentationRandom Forest
Template matching
Table 6. Total execution time for the CNN crown delineation methods.
OperationTime (ms)
TrainingPreprocessing (per image)5450
Training (per epoch)12,200
InferencePreprocessing (per image)
- one band110
- multi spectral3920
I/O operations20
InferenceTable 7
Table 7. Comparison of trained models in terms of execution times (inference) and accuracy.
Inference Times (ms)Accuracy (%)
CPUEdge TPUMulti-SpectralGRE Band
Base model96-8984
TPU model-288883
Publisher’s Note: MDPI stays neutral with regard to jurisdictional claims in published maps and institutional affiliations.

