Improved Smart Pillow for Remote Health Care System


1
Department of Computer Engineering, Guangdong Business and Technology University, Zhaoqing 526020, China
2
Faculty of Engineering and Information Technology, University of Technology, Sydney, NSW 2007, Australia
*
Author to whom correspondence should be addressed.
J. Sens. Actuator Netw. 2021, 10(1), 9; https://0-doi-org.brum.beds.ac.uk/10.3390/jsan10010009
Submission received: 12 December 2020
/
Revised: 18 January 2021
/
Accepted: 20 January 2021
/
Published: 28 January 2021
(This article belongs to the Special Issue Sensor Networks and IoT in eHealth Applications)
Abstract
:The outbreak of novel coronavirus (COVID-19) resulted in the clinical decision that reduced direct contact is optimal, especially for senior citizens residing in nursing homes. A smart pillow adapted for the Remote Healthcare System is presented in this paper, whose core is a Bluetooth (BT) host equipped with temperature and pressure sensors. The measurement of Core Body Temperature (CBT) from the perspective of heat transfer is first analyzed, with two proven effective methods introduced—classical Zero-Heat-Flux (ZHF) and Dual-Heat-Flux (DHF)—then finally the similarities between the Smart Pillow and ZHF are demonstrated. A pressure pad is inserted inside the pillow to detect occupancy and the specific position of the head on the pillow that meets clinical diagnostic needs. Furthermore, a real-time proactive monitoring mode is enabled for urgent warnings, which forces the pillow to keep detecting and reporting data in a defined time duration but results in rapid battery drain of the pillow. In this way, the system can detect the CBT and in-bed situation of the inhabitant without being physically present to determine critical measurements. Utility of this system can be extended to elderly people living alone in regional or remote areas, such that medical help can be dispatched as soon as possible in case of medical emergency.
1. Introduction
Coronavirus Disease 2019 (COVID-19) has immeasurably changed the world, such that social distancing is emphasized in various media outlets, as well as elderly people being more vulnerable and in need of social care at their residence. A Remote Healthcare System can record critical health data such as contactless body temperature remotely in real-time, while provide timely assistance when necessary. Such a system is not only suitable for today’s difficult times but also well into the future.
1.1. Evolution of Measurement of Core Body Temperature (MCBT)
The human body can regulate heat production and heat loss in varying circumstances to maintain constant temperature, such that the balance between heat produced and lost can be represented by the means of body temperature. Core Body Temperature (CBT) [1,2,3,4,5,6,7,8,9,10,11,12] is the temperature of the interior of the body, which is opposed to the peripheral temperature such as that of the skin. The traditional and relatively accurate method to measure CBT is by use of a rectal thermometer, which is invasive and inconvenient. As CBT is a vital parameter to determine the patient’s health status, researchers work continuously to find non-invasive methods to measure CBT effectively and accurately. Zero-Heat-Flux (ZHF) and Dual-Heat-Flux (DHF) are two of the main methods that are extensively tested and productized.
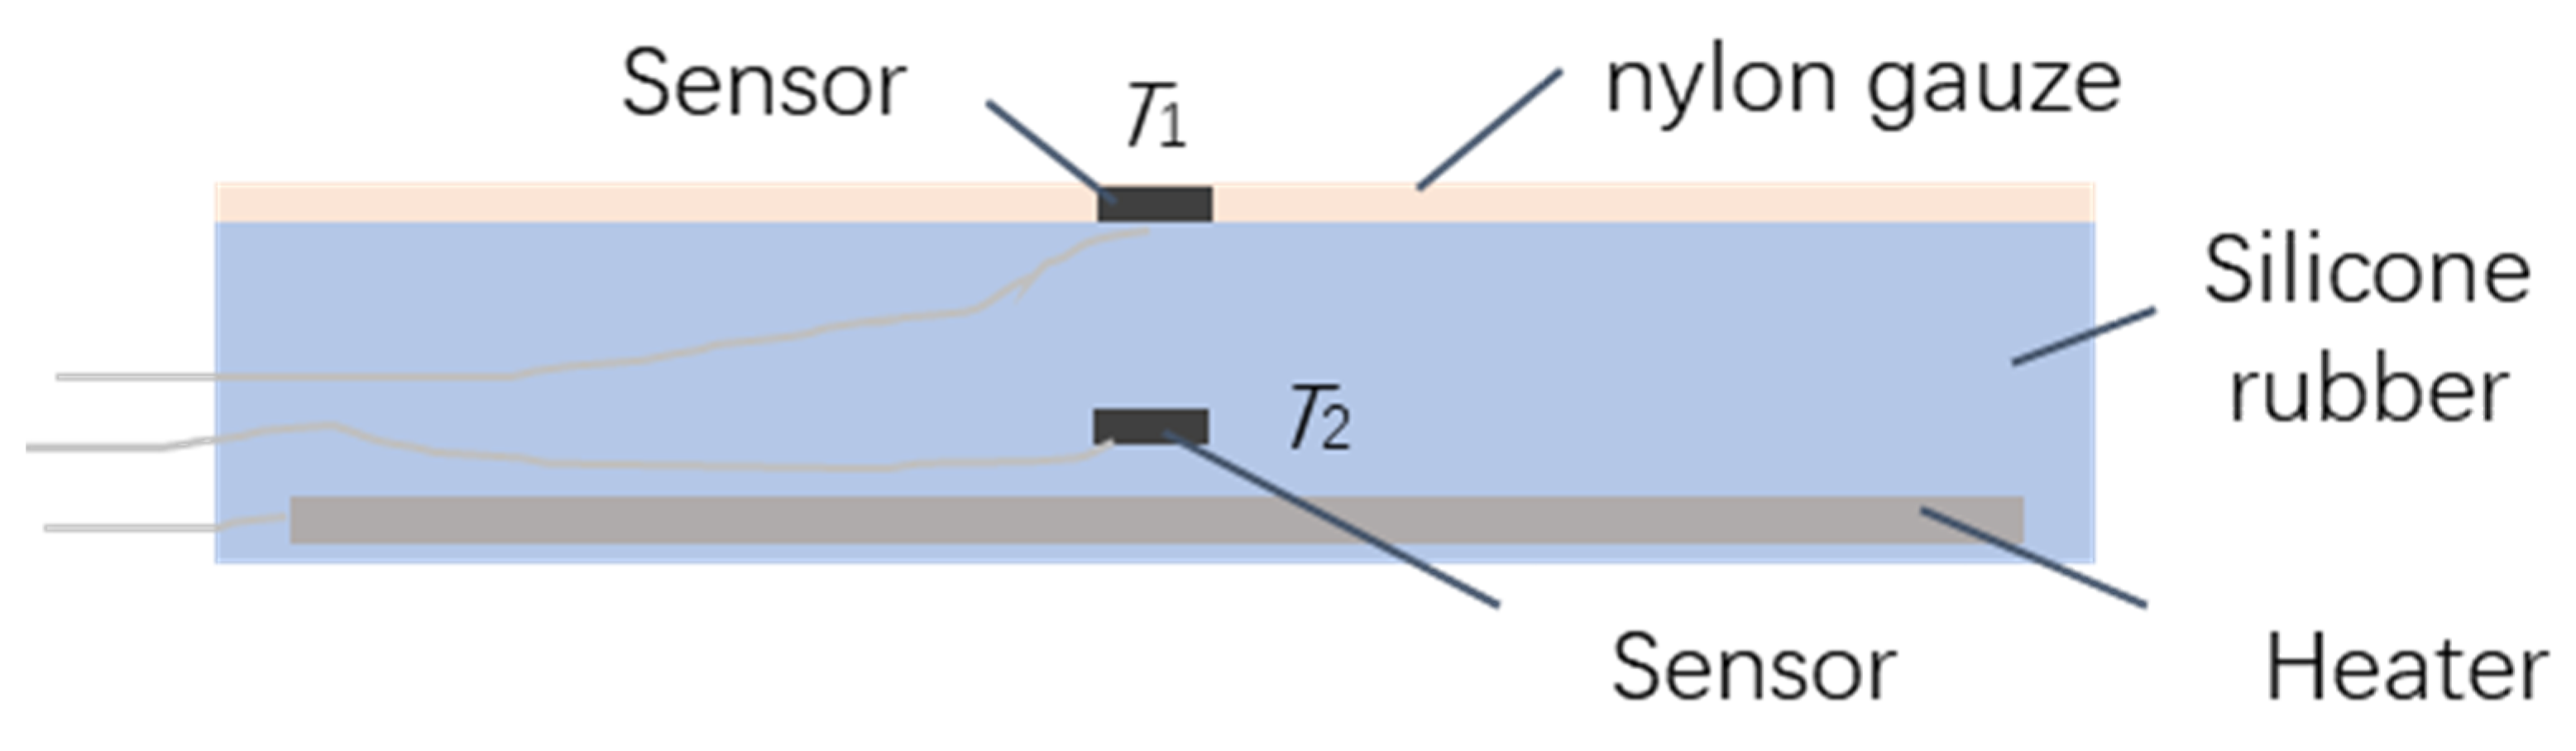
Zero-Heat-Flux (ZHF) is the method of measuring the deep body temperature. This is where an area on the skin without heat flux from the core to the surface is constructed, such that when thermal equilibrium reaches the peripheral skin temperature is the same as CBT theoretically. The method by Fox et al. in 1973 [1] was incrementally improved or adapted by various researchers and manufacturers [2,3,4,5,6,7]. The diagram of the original ZHF probe is shown in Figure 1, with the size of the probe about 6 cm × 6 cm × 0.6 cm. The upper side of the diagram will be the side closest to the skin.
The probe is comprised of silicone rubber, with one temperature sensor T1 installed in the middle of the upper surface, the other temperature sensor T2 and a heater is embedded inside the rubber. They are all connected to hardware the control the heater output to ensure that the reading of T1 is equivalent to T2 over time.
Silicone rubber is selected because it is easy to be shaped and its thermal conductivity is relatively low (approximately 0.1 W/mK) to avoid heat diffusion, so it provides a thermal insulation at the skin’s surface to limit heat lost to the ambient environment. To measure core temperature accurately and reliably, the device requires a long time to reach thermal equilibrium between the various thermal compartments and the ambient environment.
The conclusions reached by ZHF are slightly different from the evaluation of several researchers. Fox et al. [1] said that the probe gives a temperature closely comparable with other methods for CBT in the resting subject, while Gunga et al. [2] believed that probe based on ZHF is not accurate enough for performing a single individual MCBT, yet it seems to be a valid, non-invasive alternative for monitoring circadian rhythm profiles. Eshraghi et al. [3] tested the SpotOn Prototype ZHF cutaneous thermometer by 3M [4] and agreed that CBT can be noninvasively measured using the ZHF method. Yamakage [5] employed the CTM-205 by Terumo (Tokyo, Japan) and found that the application of the equipment is limited by its high cost and relatively slow response rate.
Two temperature sensors are employed to make it a double-sensor thermometer. Mazgaoker et al. [6] evaluated the accuracy of Tcore from Draeger [7] under heat stress, they found that the temperatures from Tcore were within ±0.3 °C of the rectal measurement.
Dependency on a heater element is the evident weakness of ZHF, so while it is non-invasive, its inflexibility makes it not economical. Based on heat transfer, an improved method named Dual-Heat-Flux (DHF) was proposed to overcome the issue brought by the heater of ZHF.
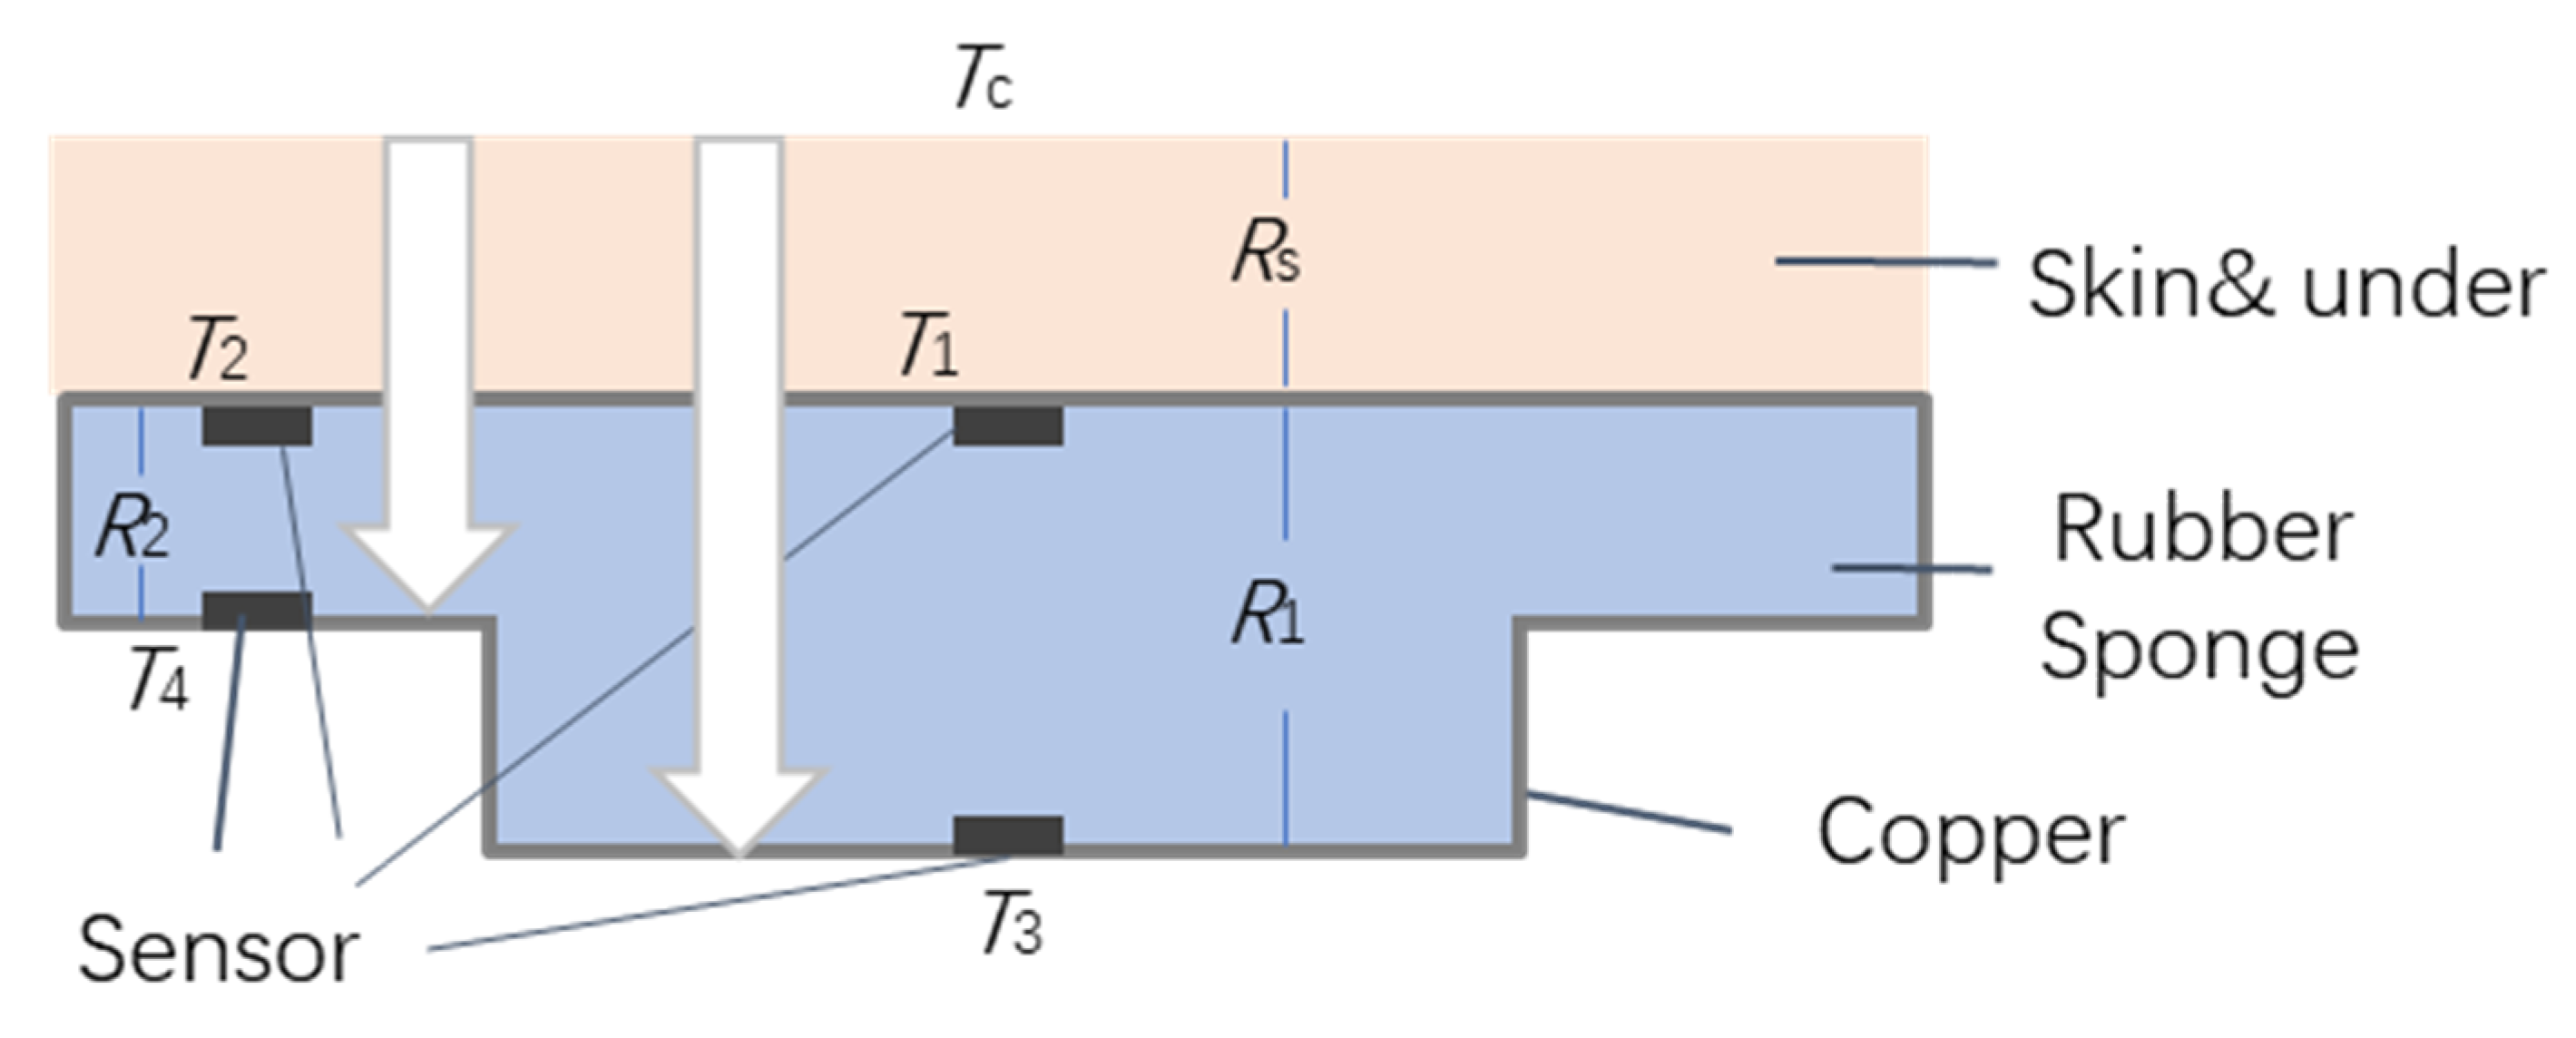
As implied by the name, DHF means two heat flux channels are employed in comparison to one heat flux channel in ZHF. To construct two channels, four sensors are employed, and the height of channels must be different to form two discrete but comparable channels. The two channels could be integrated together or separated. An integrated probe is shown in Figure 2; with its shape resembling a hat. T1, T3 form a channel with thermal resistance R1 while T2 and T4 forms the other with thermal resistance R2. The rubber sponge is selected as an insulation layer and copper is chosen for its good conduction properties. The upper side of probe with T1 and T2 will be closest to the skin. If CBT is Tc, Rs is the thermal resistance of skin and the subcutaneous tissue.
The heat flow for the two channels is:
Rs is variable depending on the subject, so it is removed from the formula and Tc is the target:
Theoretically, R is proportional to the height of rubber sponge if the material is homogenous, so K can be calculated via measurable heights, but the heat flux dose exists in both a vertical and horizontal direction. K can be attained by experimental work and calculated as:
Kitamura et al. [8] suggest that K is sensitive to ambient temperature, and Feng et al. [9] find that the thickness of skin and subcutaneous tissue layer affects the results. Both sources review the performance of DHF equipment they manufactured.
Kitamura et al. concluded that the results of DHF and ZHF are very similar, with the correlation coefficient between the two methods being 0.970 (). Feng et al. determined the system had the potential for reliable continuous CBT measurement in rest and could reflect CBT variations during exercise.
Notably, the distinct difference between ZHF and DHF is with or without a heater, but DHF still needs to wire all the sensors to a Micro-Controller Unit (MCU) to detect the thermal equilibrium. Considering the strict insulation that DHF needs, it is not possible to embed the MCU inside the rubber sponge, which reduces the convenience and flexibility of DHF.
The other issue of DHF is the initialization time, as without a heater, DHF needs more time to reach thermal equilibrium compared to ZHF, with experimental results showing the initial time for ZHF is about 15 min and DHF is 25 min. Song et al. [10] tried to improve the DHF by employing multiple Artificial Neural Networks (ANN), as they modeled the relationship among human body temperature, skin temperature and the ambient temperature for ANN, but the balance of computational load and reaction time became an issue when applying ANNs.
Huang et al. [11] optimized a wearable deep body thermometer based on DHF in its structure. They first simulated the improved structure in theory by finite element analysis method, then implementing the prototype and verifying the efficiency in experiment by mimicking skin temperature. They found that the improved structure of thermometer can reach an accuracy error rate about 0.3 °C, with a similar result to Draeger based on ZHF.
Tamura et al. [12] present various body temperature measurement techniques and discuss the types of wearable devices for patient monitoring. Al-Khafajiy [13] described a framework combining a smart-phone app and Wearable Sensors for Smart Healthcare Monitoring System (SW-SHMS) for elderly people. One of the main layers in the proposed system is the patient layer, also named wearable devices, which includes skin temperature sensors and Bluetooth is the preferred wireless communication protocol. They are concerned with the latency and packet loss.
A smart aging system is presented by Ghayvat et al. [14], as they employ the hidden wellness parameter to implement well-being monitoring and anomaly detection. They offered an exceptional sensor data fusion technique through different sensing modalities and the design of a novel activity learning model by adding behavioral observations. They claim that the new system enhances accuracy to 98.17% from the original value of 80%.
A secure thermal-energy aware routing protocol for Wireless Body Area Networks (WBAN) based on Blockchain technology is proposed by Shahbazi et al. [15], with stability and efficiency prioritized in their design when managing the limitations of temperature and energy. They applied the Hyperledger Caliper, a benchmarking tool, and Castalia, a simulation tool, to prove the improvement of their protocol in preserving residual energy and balancing of temperature. Majumder et al. [16] review wearable sensors for remote health monitoring, first introducing various health monitoring systems, and then discussing textile-based wearable sensors and the different options of wireless technologies. They are concerned with information privacy, data security, energy efficiency and reliable communication, all of which are emphasized in our proposed system.
1.2. Core Body Temperature Minimum (CBTM) from the Smart Pillow
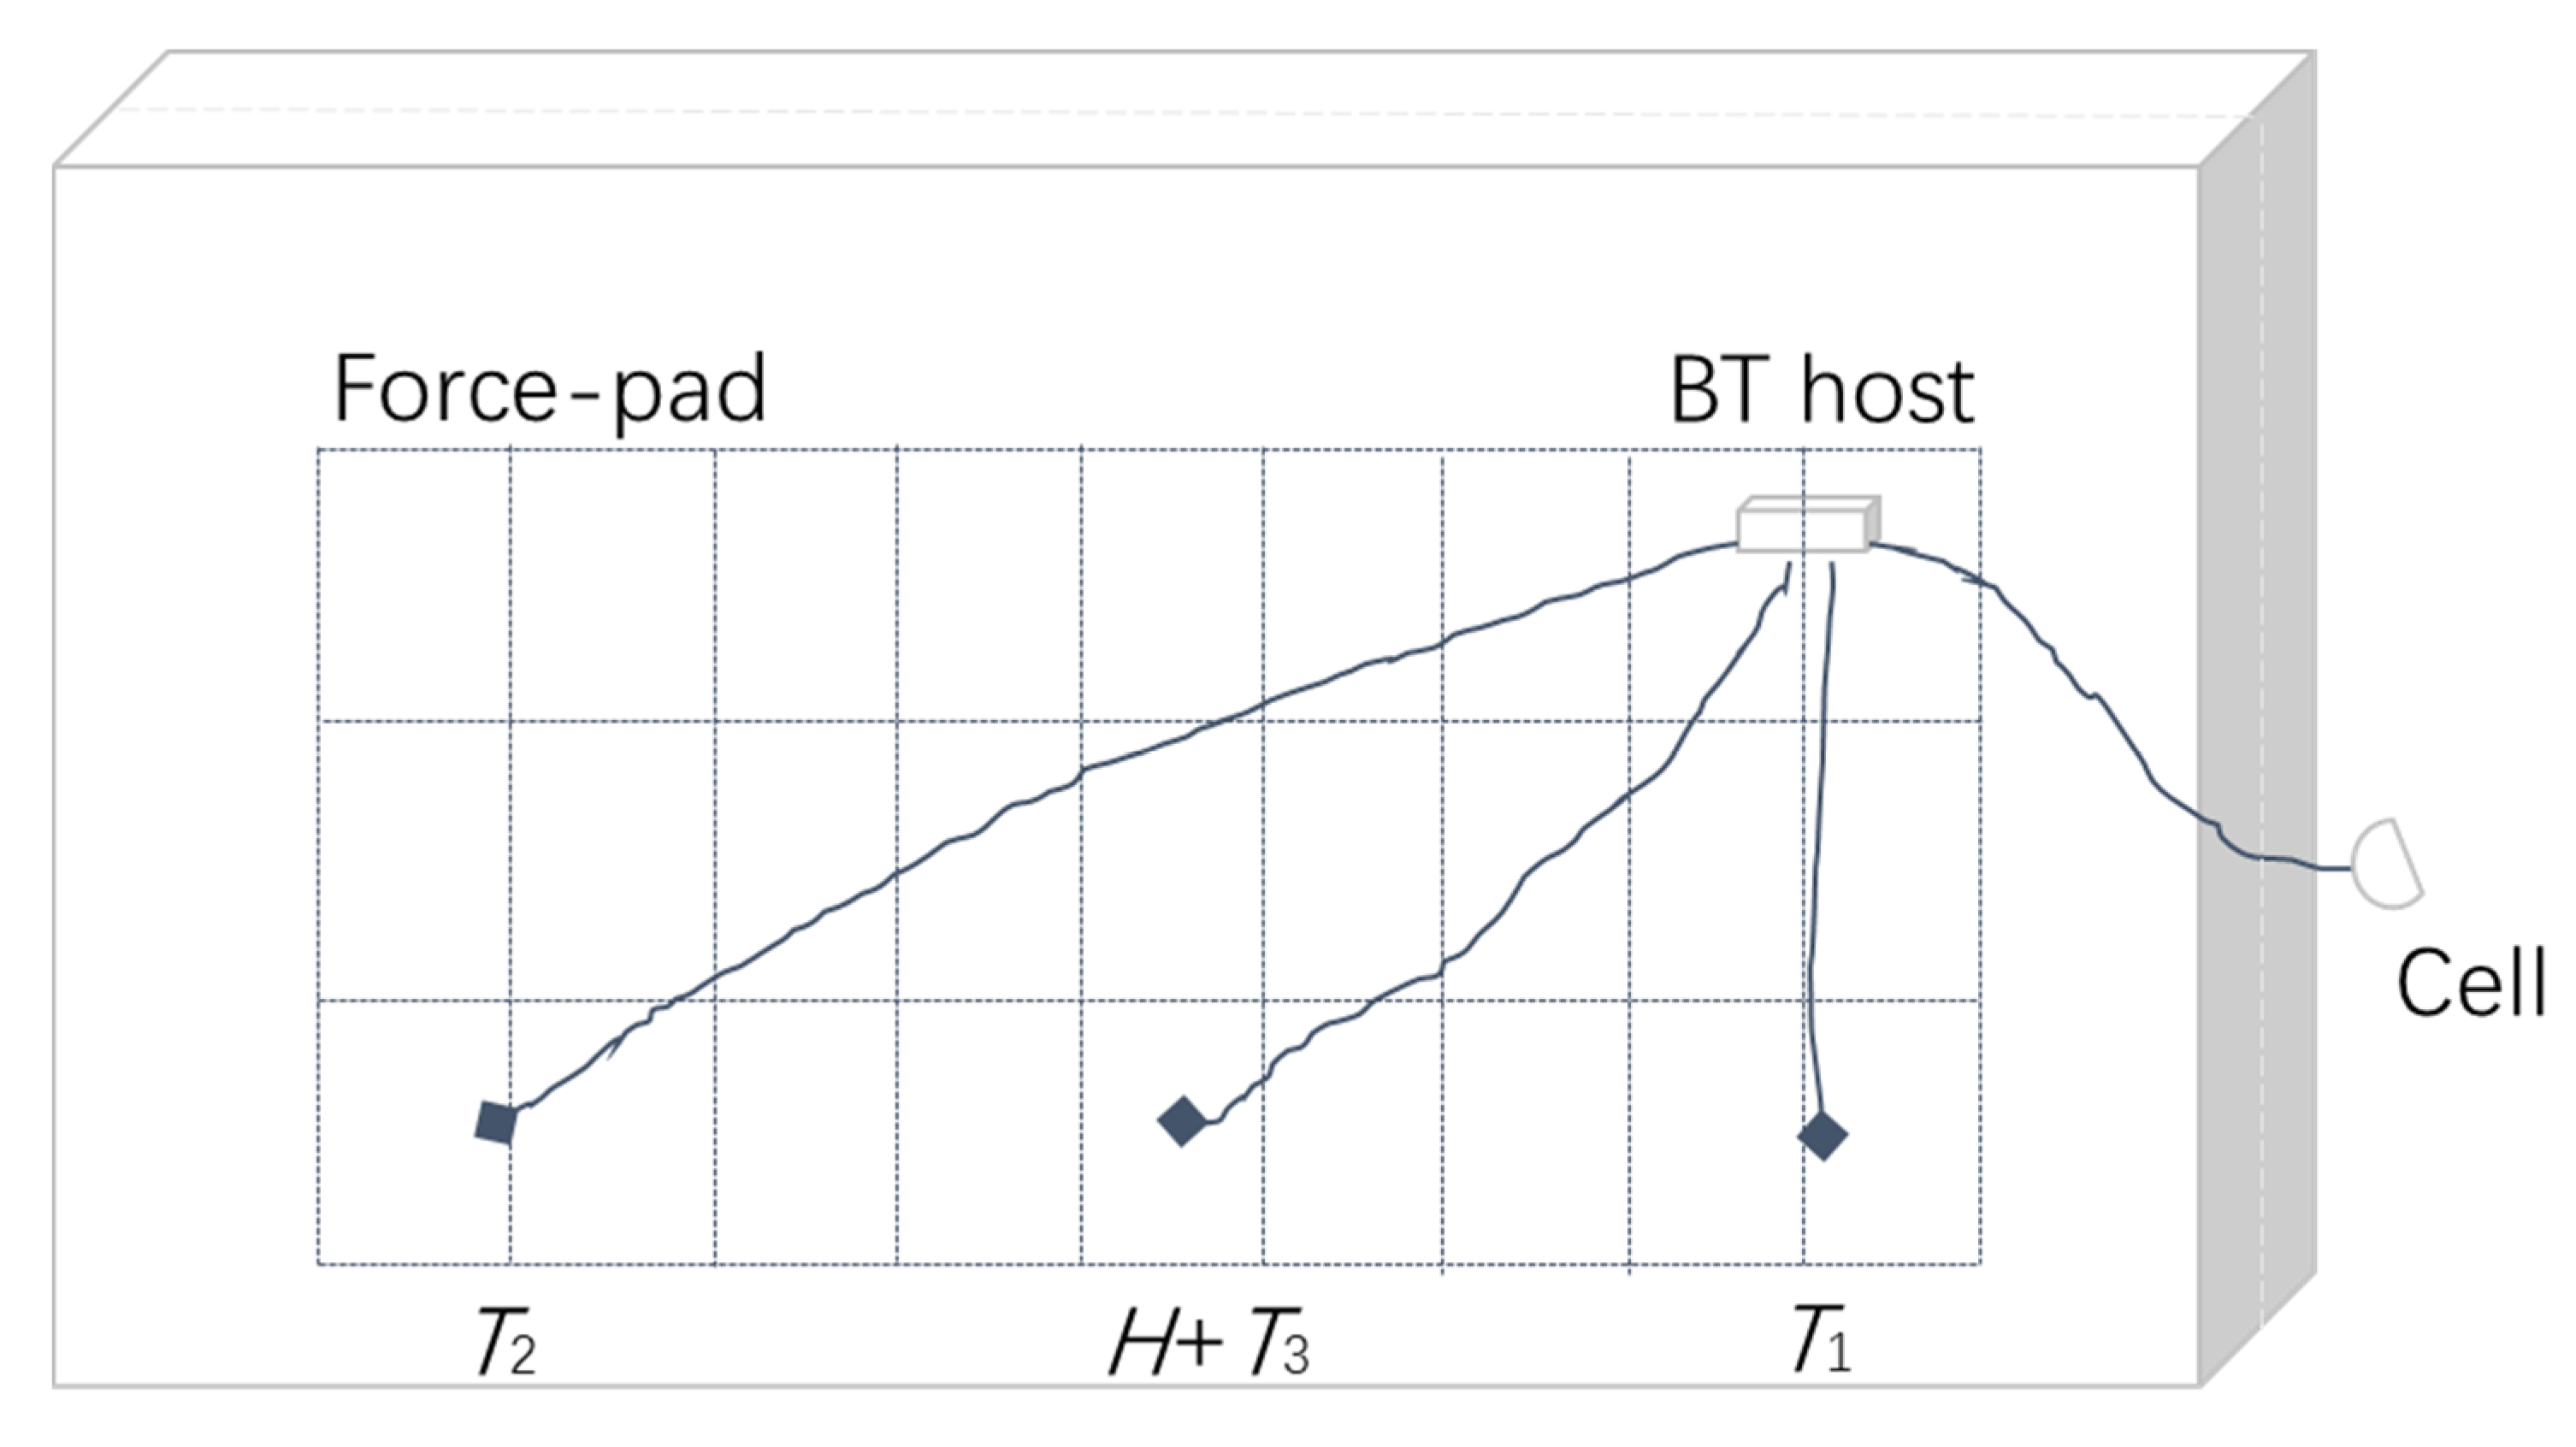
We introduced a Smart Pillow for health sensing by embedding temperature and humidity sensors in the pillow [17]. The diagram of the “Smart Magic Pillow” is shown in Figure 3. Three temperature sensors are evenly distributed on the head resting side of the pillow, with a humidity sensor integrated with the middle sensor.
Data from the sensors go through a gateway equipped with Bluetooth (BT) and Wi-Fi, eventually connecting to the cloud. By analyzing the data, the environmental parameters in the bedroom, bedtime routine and sleeping habits can be studied, including body temperature when specific conditions are met.
As the head does not rest with the temperature sensor directly, the pillowcase and hair acts as an insulator, an appropriate compensated factor for body temperature is determined by Fuzzy Logic algorithms. It is proved by experiments that the result is close to the real body temperature, but it cannot replace a thermometer.
Machine learning is applied in the paper [18] to find a better and more accurate body temperature, but the result is not ideal because of the lack of consistency and insufficient volume of the training data.
In this paper, we adapt the smart pillow for the Remote Healthcare System, with a pressure sensor consisting of 4 × 10 elements to detect the user’s existence. A unique protocol not dependent on any third-party is designed for reliable communication between the cloud server and the pillow. A real-time proactive monitoring mode is added for emergency concerns.
2. Materials and Methods
The related heat transfer principle of the pillow is presented, which is followed by the introduction of the pressure sensor, the force-pad, and how it is integrated into the pillow. Then the proactive monitoring is implemented by the unique communication protocol for the Remote Healthcare System, finally putting together the whole picture of the system.
2.1. Bioheat Transfer Principles
Heat transfer [19] within the human body is called bioheat transfer [20] that is more complex than in conventional environments because of the metabolism and blood flow, both of which are related to heat exchange. Heat transfer occurs as a difference of temperature, with non-invasive MCBT being difficult to determine as ambient temperature is volatile. Conduction, convection, and radiation are three types of heat transfer processes. Fourier’s Law of Heat Conduction describes the amount of energy being transferred per unit time in the following equation:
where the heat flux, , is the flow of heat through a unit area per unit of time, is the temperature difference along a distance in the direction of conduction and is the thermal conductivity of the material.
Likewise, Newton’s Law of Cooling is the expression for convection:
where Ts is the temperature of surface, Tꝏ is the temperature of the environment, and the parameter h is the convection heat transfer coefficient. Radiation is the surface emissive power of matter; E is prescribed by the Stefan-Boltzmann Law:
where Ts is the absolute temperature (K) of the surface and is the Stefan Boltzmann constant, is a radiative emissivity of the surface, whose values are in the range of .
Density (ρ) and specific heat (cp) are two properties used extensively in thermodynamic analysis. The product ρcp, commonly called the volumetric heat capacity, measures the ability of a material to store thermal energy. Thermal diffusivity α is the ratio of the thermal conductivity k to the heat capacity ρcp:
Large α means a quick change in thermal environment, whereas small α means a slow response. The other concept of thermal transfer is thermal resistance:
ΔT is the difference of temperature, similar to U in electricity, and q is the heat flux which is similar to electric current I. The balance of thermal energy for a control volume at an instant can be expressed as:
where q stands for the sum of thermal and mechanical energy, qst as stored energy, qin and qout as energy input and output and qg for energy generation. The expansion of this equation results to the Penn equation:
With the value of qst, qin includes the first two terms in the right, the first term is from thermal conduction and the gradient in temperature within the tissue, while the second term is from blood perfusion, where ω is the blood perfusion rate, ρb and cb are the density and specific heat of the blood, and Ta is the temperature of the arterial blood. qm represents qg, which is the metabolic heat generation in the skin tissue.
Heat transfer at the outer surface of the human body can consist of a combination of all kinds of boundary conditions (BC) that are convection, radiation and sweat. It can be written as:
The parts of convection and radiation are explained before, with qe being the evaporative heat losses due to sweat. According to the analysis from Pompei [21], q heat lost from the skin to the environment can be modeled as:
H is a combined heat transfer coefficient, A is the area of surface, and Tskin and Tenv, is the temperature of skin and environment, respectively. Similarly, heat from the artery to the skin is mainly via blood perfusion, can be simplified as:
where W is the blood perfusion rate and C is the blood specific heat, such that the heat balance is determined as:
The final target temperature Tcore can be found by:
As all the other variables can be measured or inferred, only H, which is a combined heat transfer coefficient, depends on experimental information. This is the theory and formulation of thermal transfer inside and outside of the human body, along with the presentation of the theoretical applications to measure the CBT via the smart pillow being briefed in the following sections.
2.2. CBT from the Smart Magic Pillow
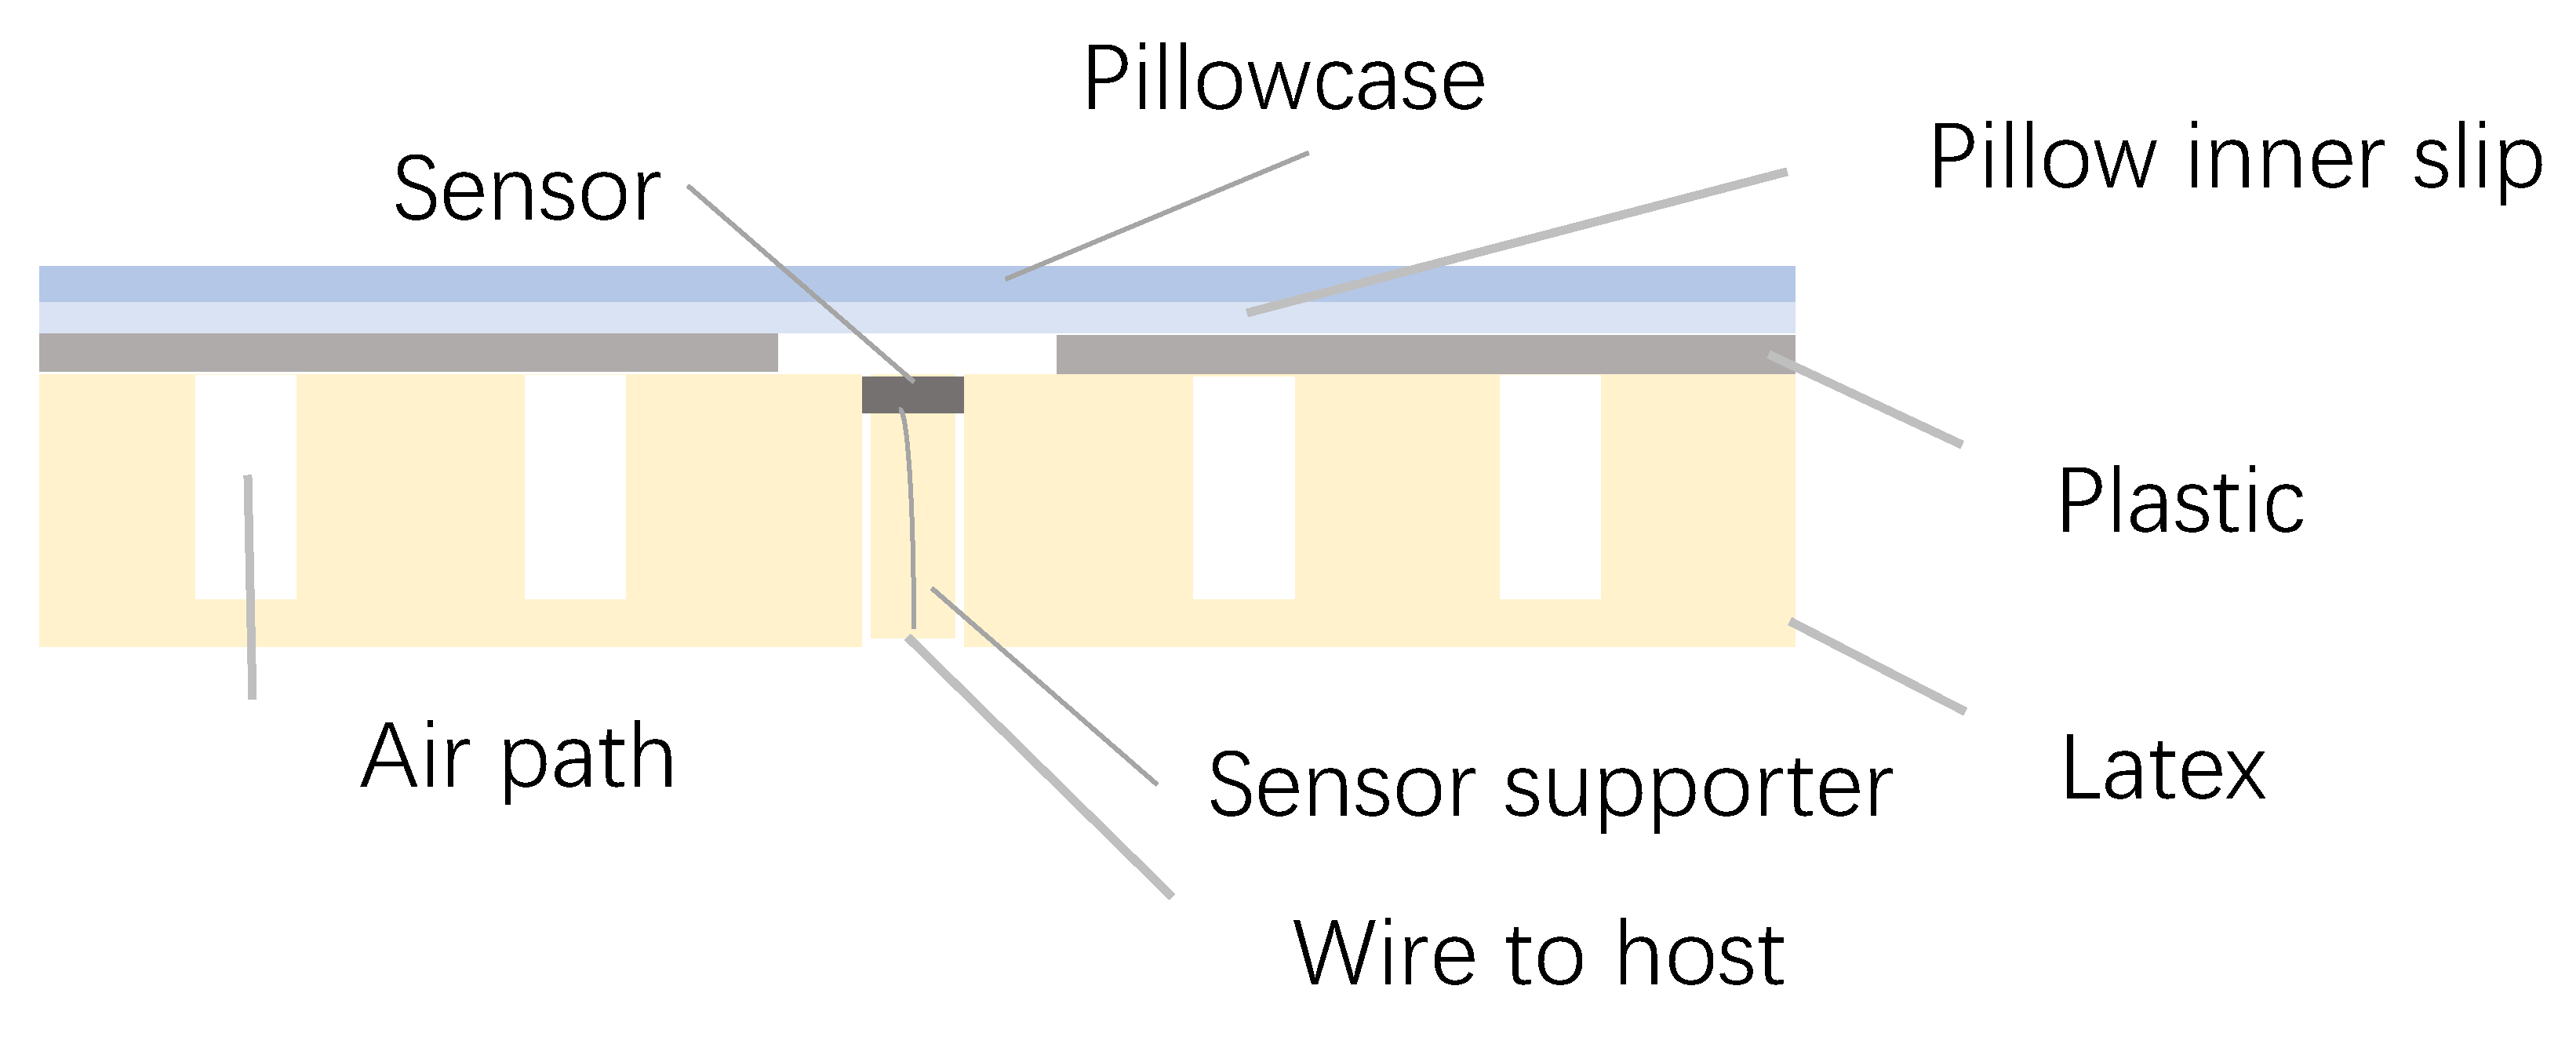
When assembling the pillow, we take heat transfer into account, but there is no intention to form the heat flux channel. Small air bubbles are left in the latex when the rubber is formed, which make the latex pillow springy and good at dispersing heat and moisture. The chosen latex pillow has pinholes on the surface for cooling, with its sectional diagram shown in Figure 4.
Three temperature sensors are embedded in the pinholes of the pillow’s surface layer, with a sensor support made by the same latex fit for the pinhole, so each of them T could act as T1 in ZHF and DHF.
For ZHF, T1 is Tc when the thermal equilibrium is reached, such that for DHF, Tc is equal to T1, adding a compensation factor related to K so the “Smart Magic Pillow” is equivalent to ZHF. As air bubbles inside the latex are not connected, they cannot form an air path for heat, so the latex pillow accumulates heat from the head.
If the following conditions are met, the temperature T is close to Tc, the first condition is where the position of the head is on one of the sensors, while the other condition is time. If the head stays at a certain place close to one of the temperature sensors for a sufficient period, when T and inside pillow temperature is at the same value, then thermal equilibrium is reached, and Tc is found and recorded by the microcontroller.
For the smart pillow, T is not exactly Tc because the temperature sensor does not come into contact to the skin directly like in ZHF, with insulating factors such as the pillowcase, pillow inner slip and hair in-between.
Beside the conditions of position and time mentioned previously, there are still two possible conditions about hair, one is that the user is bald or has their face on the sensor, then this condition is very close to ZHF.
The other is the normal condition with hair on the pillow, such that the true value of Tc should be obtained by experimental work according to Formula (15), with further simulation presented in the results.
2.3. Force-Pad Element Concept
One of the significant tasks of the Remote Healthcare System is to determine if the user is in bed. In the initial version of the smart pillow without a force-pad, position of the head is found by judging the difference of values from three temperature sensors roughly, so when one of the values is higher and close to 37 °C, the head is near the sensor.
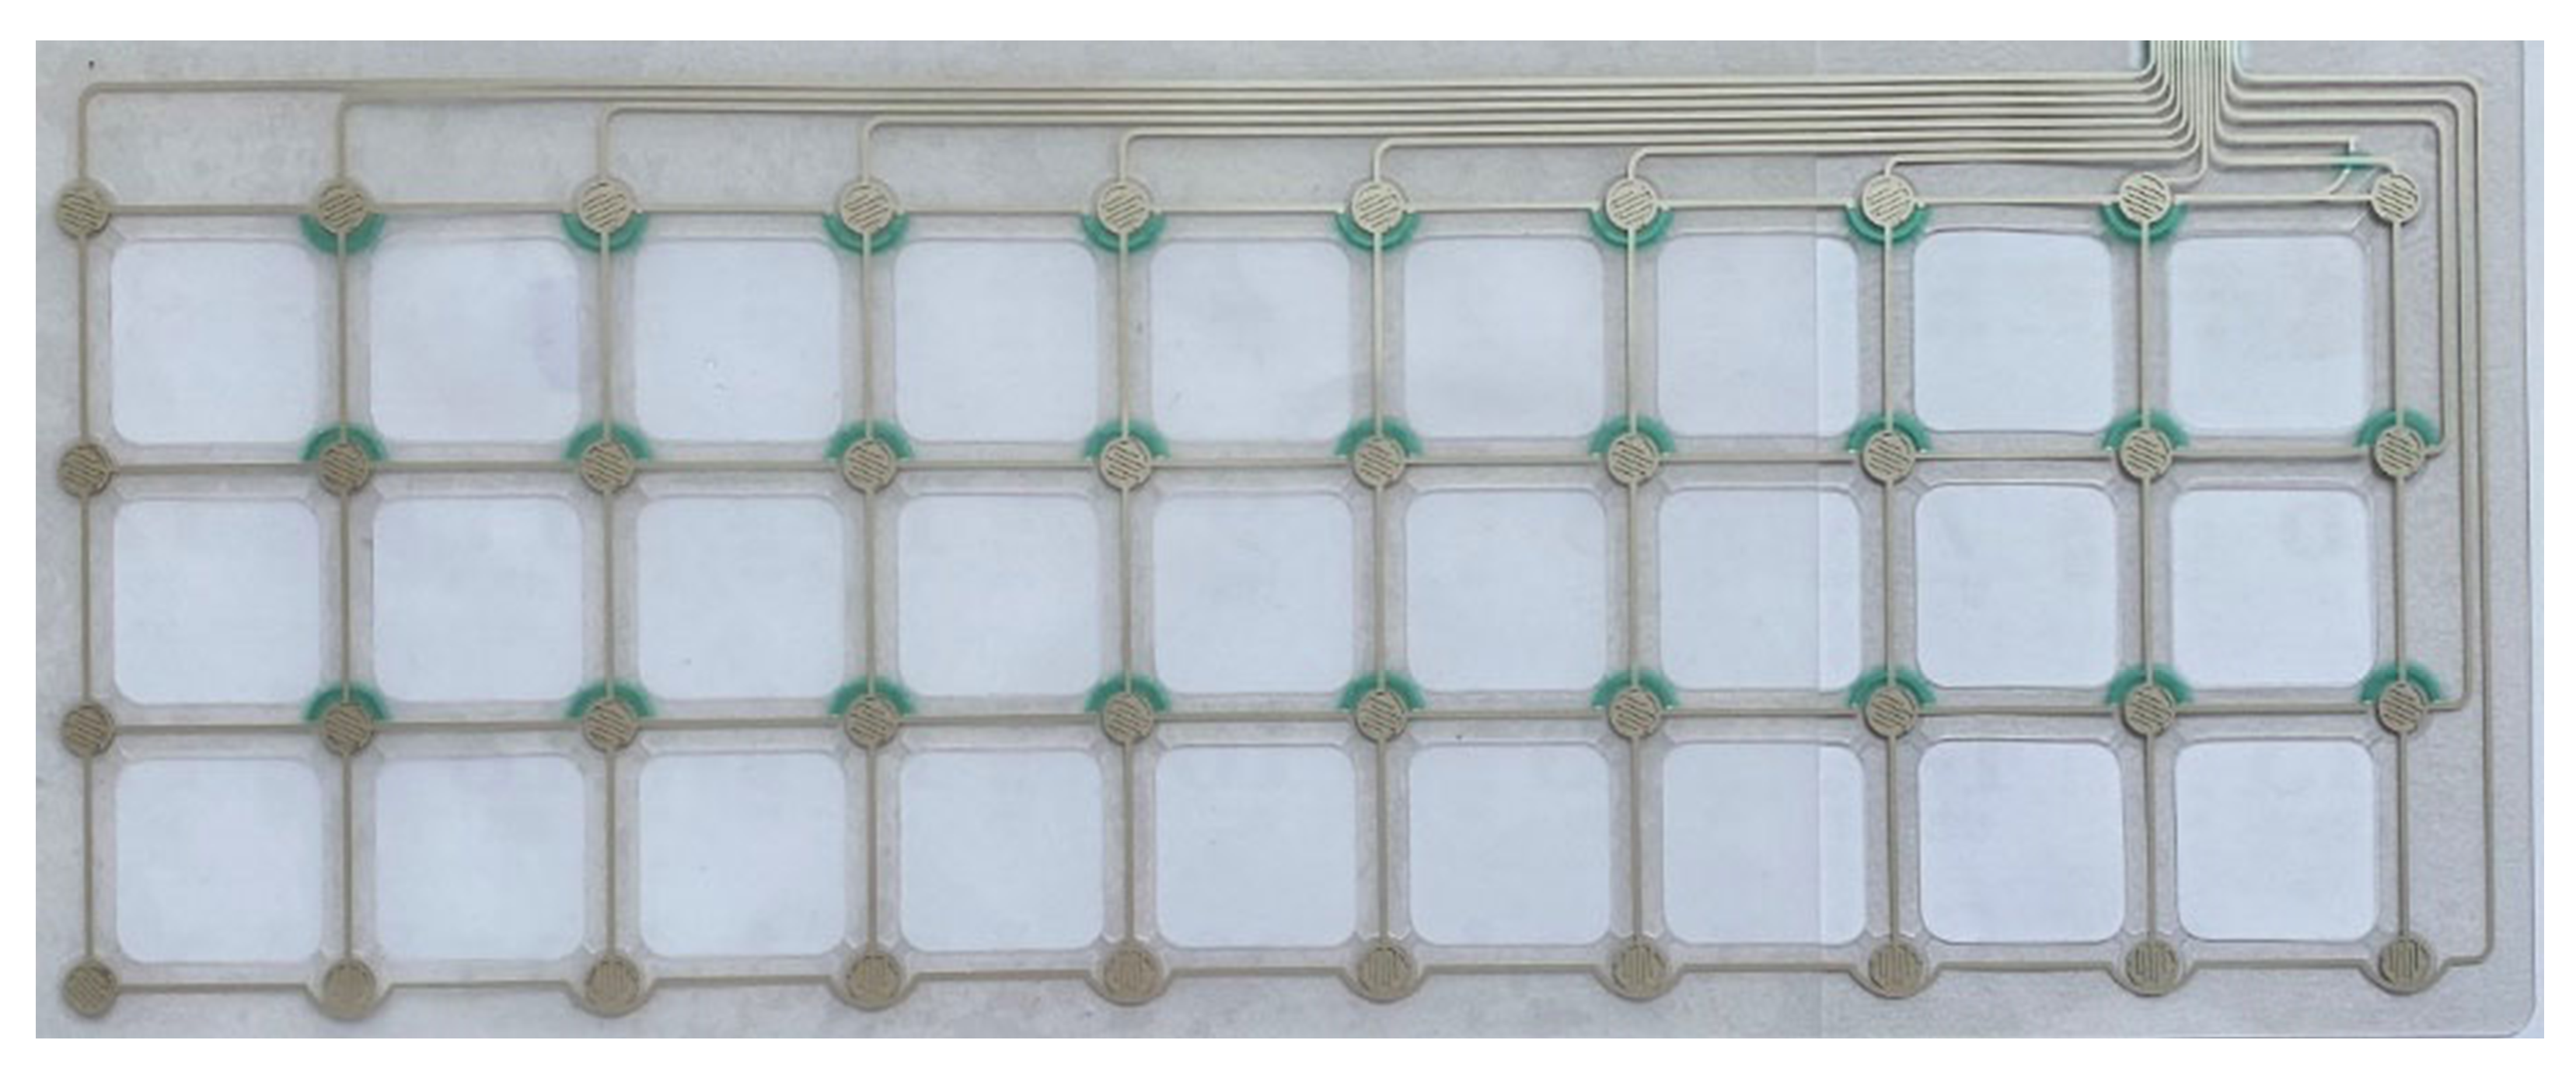
This does not account for conditions where the room temperature is close to 37 °C, such that the position cannot be found. To detect the accurate position and duration of rest, a force-pad is introduced as a pressure sensor for the pillow. The force-pad is a 4 × 10 switch matrix, which is shown in Figure 5.
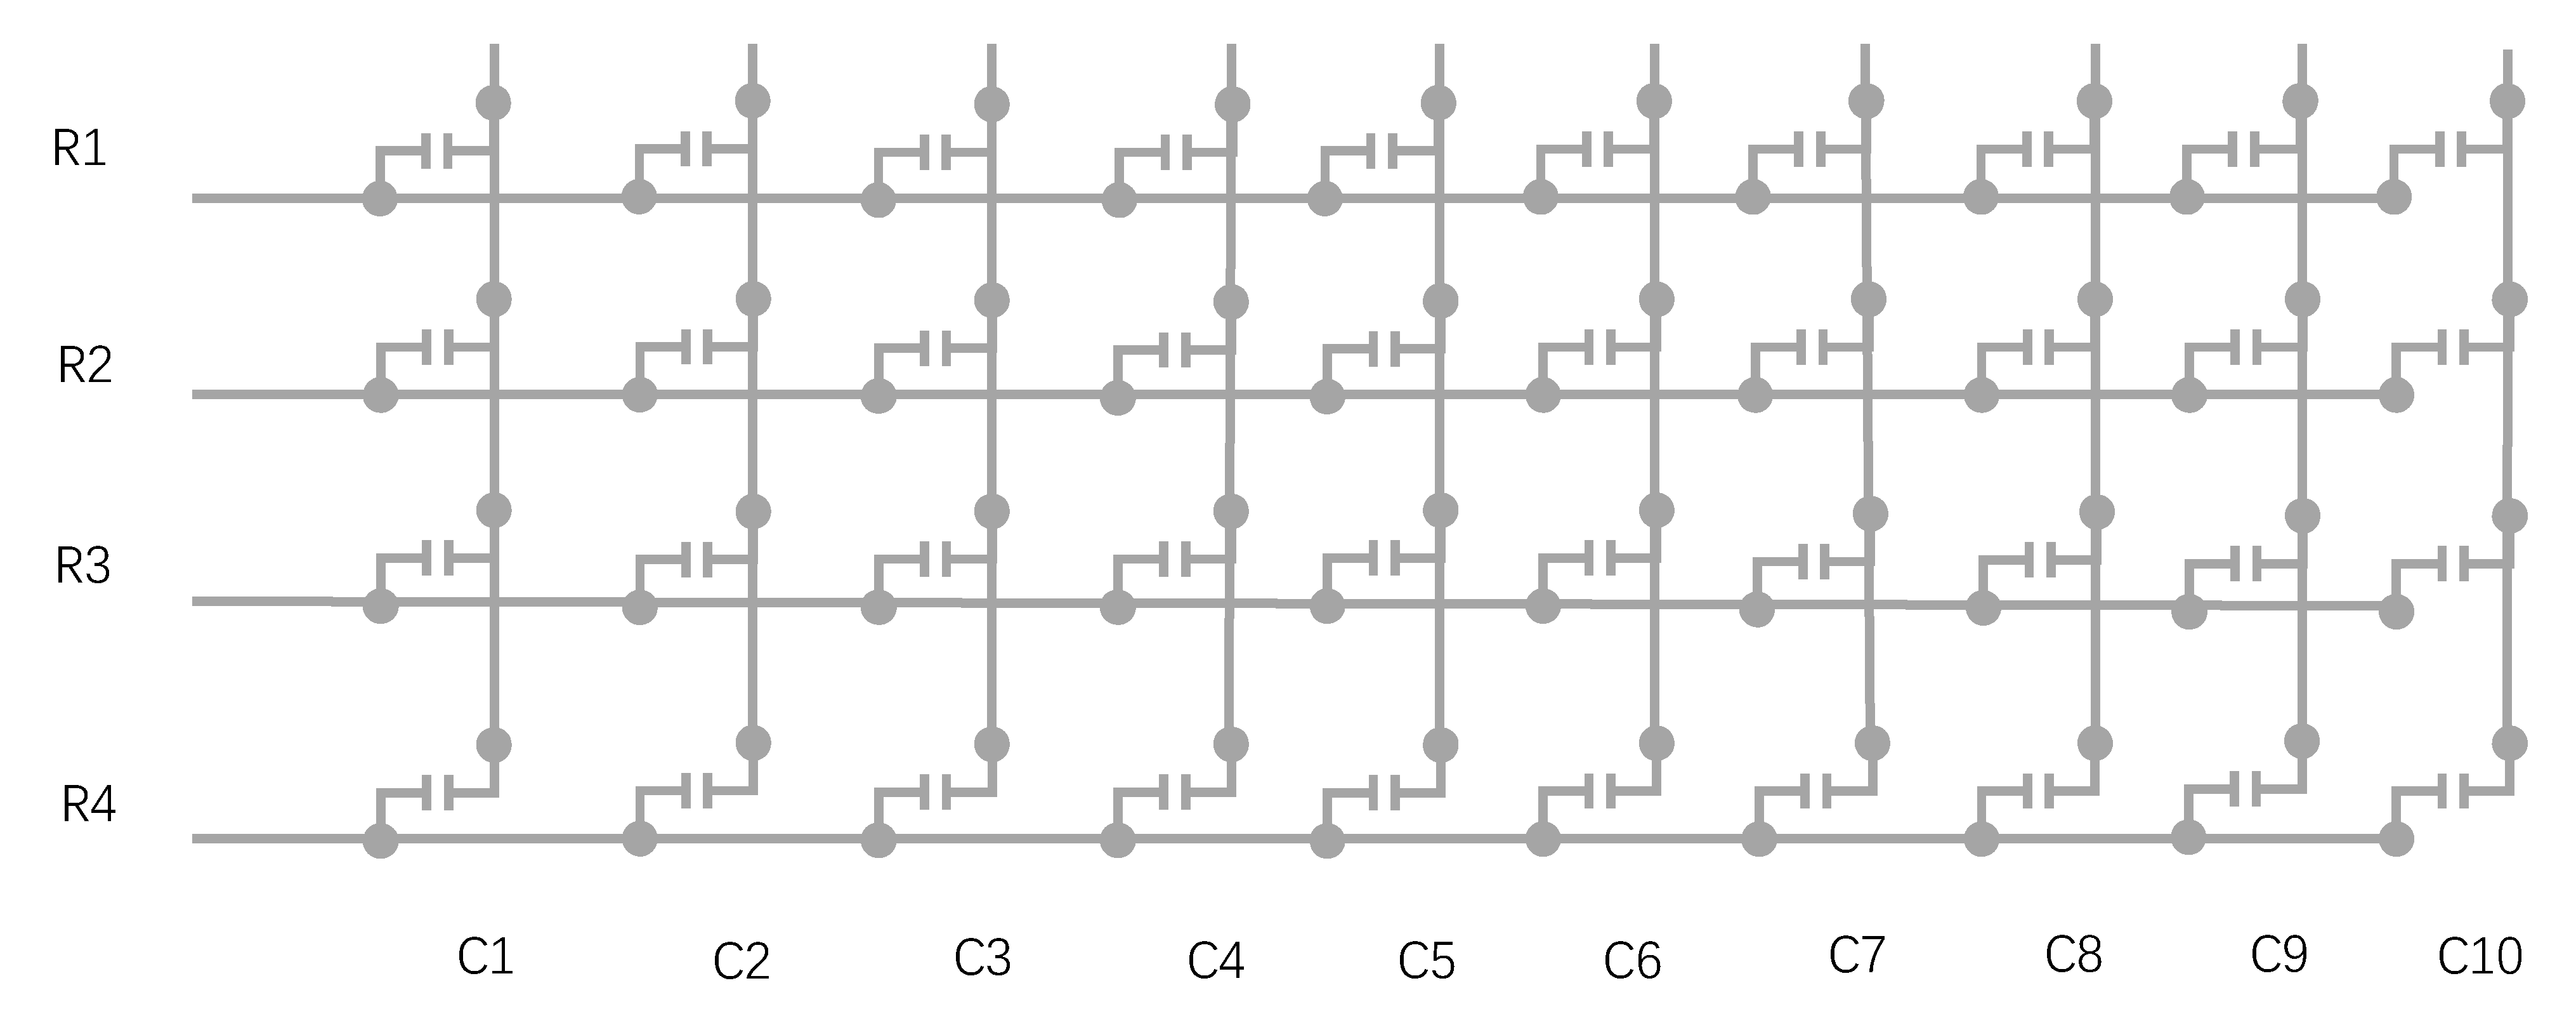
Each node of the matrix is a Force Sensing Resistor (FSR) [22], which is a material whose resistance changes with an applied pressure, so without a force its resistance is very high, and if a force is applied its resistance decreases. The matrix can be presented as a schematic diagram in Figure 6. When a node is under appropriate pressure, its switch is set to on, which can be expressed as 1 in the force-pad, otherwise it is 0. From the distribution of 1 and 0 values, the position of the head in the pillow is specific to each person.
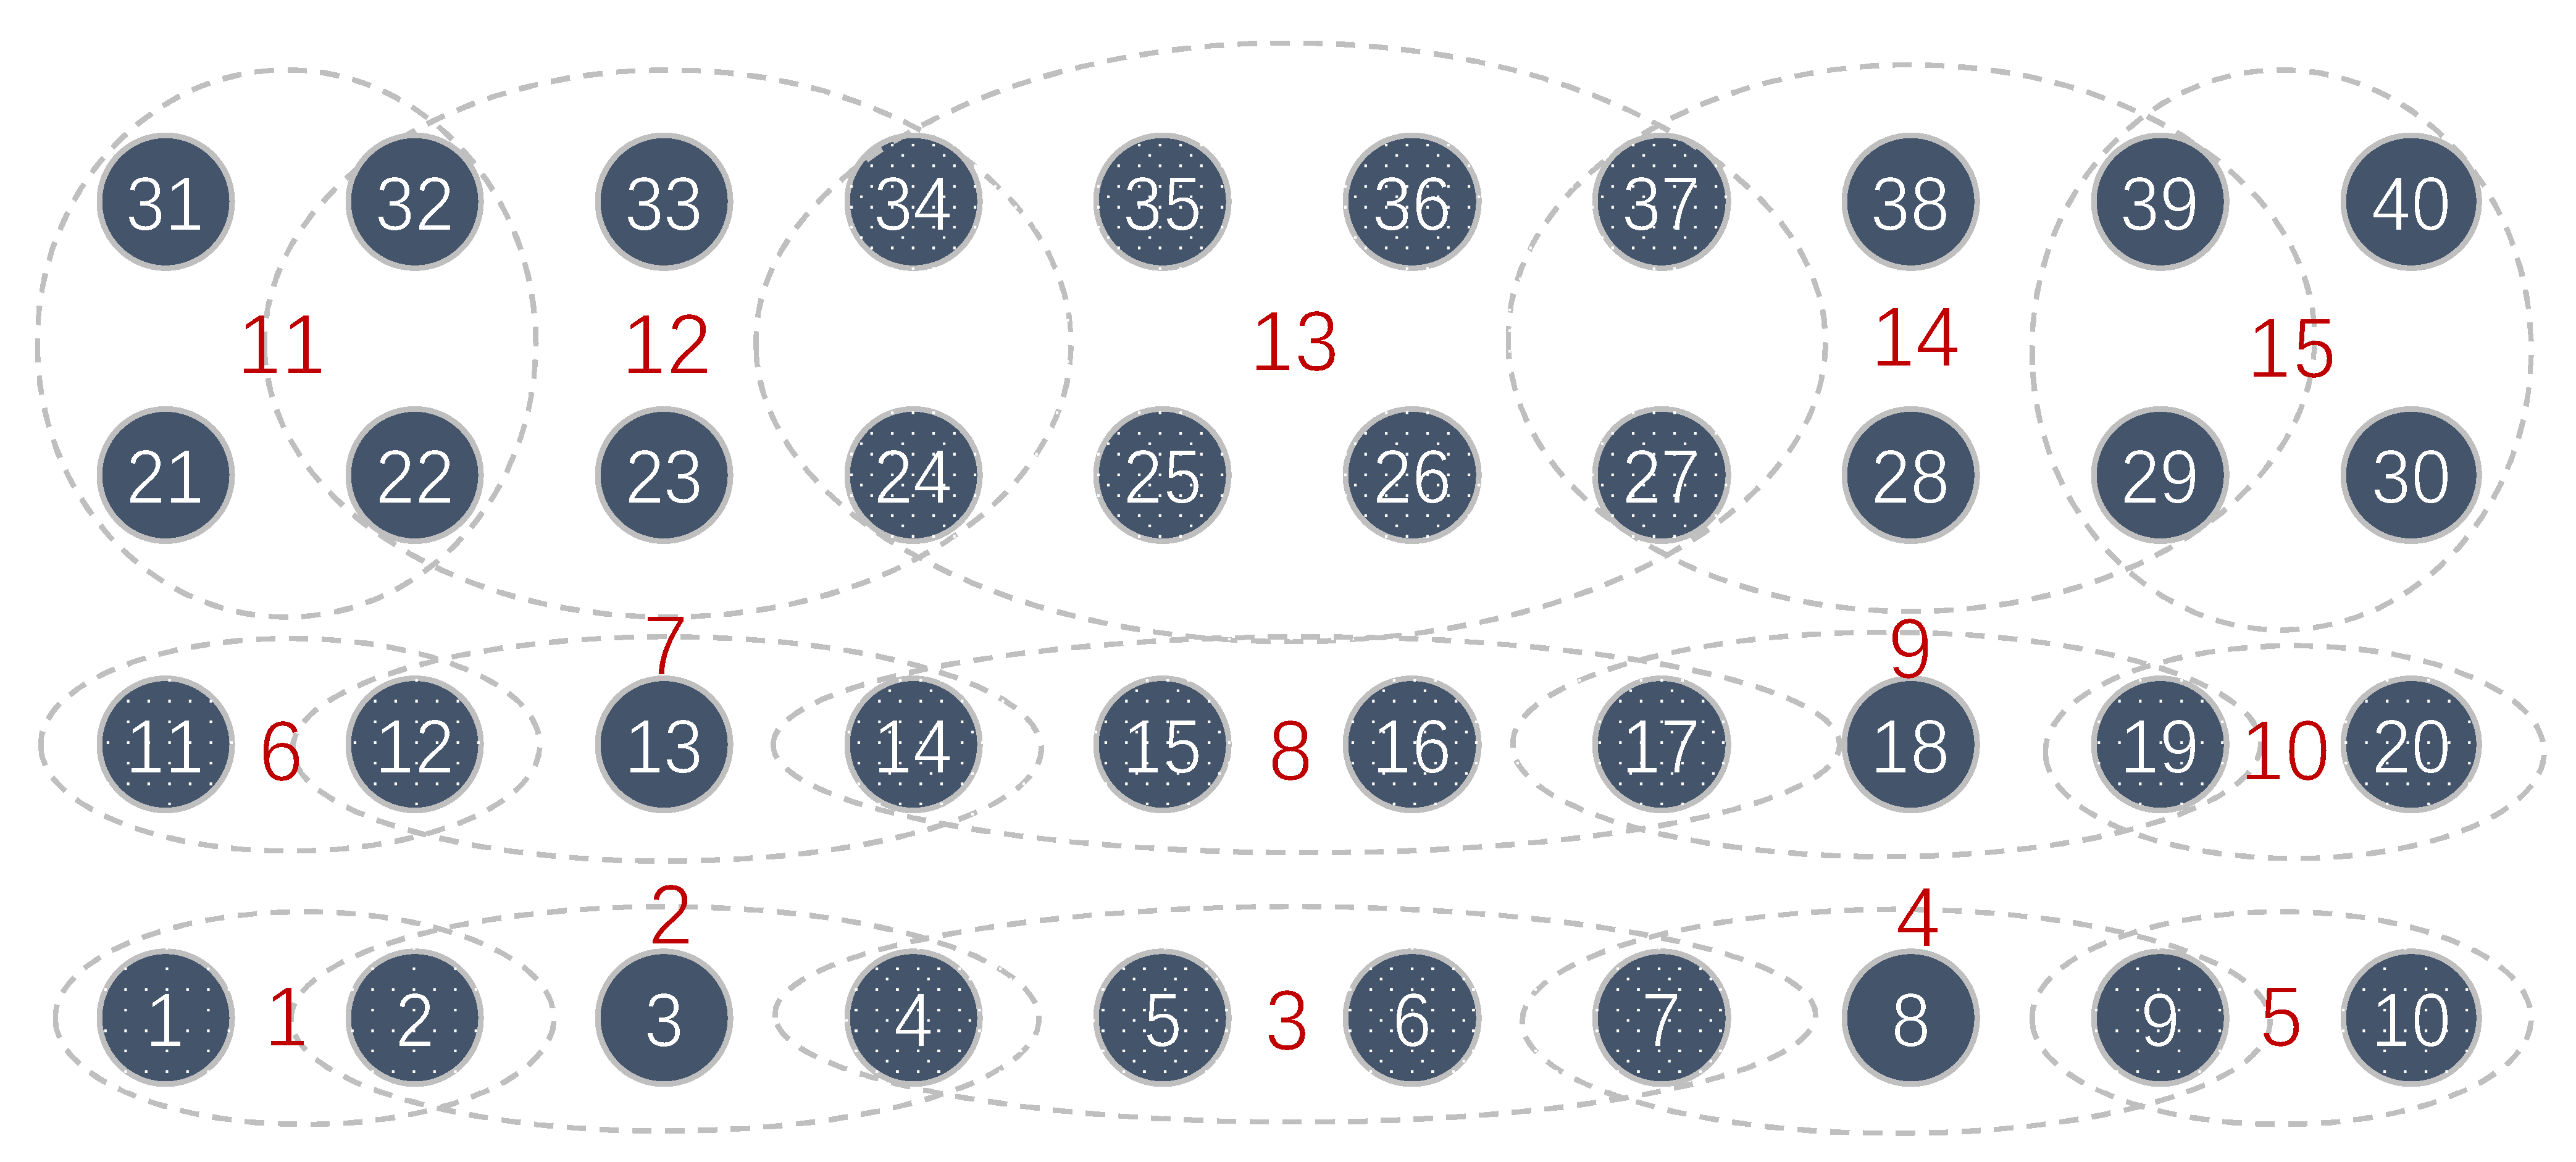
Based on the principle of the force-pad, the physical interface of the force-pad will contain 14 lines, 10 columns and 4 rows, which is connected to the BT host inside the pillow. To integrate the signal from force-pad to the system, the area of the pad is divided and coded accordingly, which is shown in Figure 7.
In total, there are 40 pressure switches on the pad, indexed from 1 to 40 and divided into 15 groups. Grouping is based on the principle that more than one switch could be triggered when the head on the pillow. For example, when switch 31 is under pressure, its neighbors 21, 22 and 32 could be under force as well, so they are grouped into group 11. So, for the same reason, the overlap in such a neighbored group can be expected.
As a result of the group, only 4 bits are necessary to represent a certain group. When grouping, two obvious features are applied, one is that the third and fourth row of sensors in the far end of pillow are integrated into five groups altogether, not like row one or two, as they are integrated into five groups respectively, because the area of row 1 and 2 are the zone of comfort, which implies that the head is more frequently located on this zoned area than the far end of the pillow. The other feature is overlapping where groups share some common sensors, which is because a group of neighbors are typically under force, not just a single sensor. The overlapping principle makes the grouping more reasonable to determine.
For example, without overlapping, if sensors 21, 22 and 31, 32 are grouped into 11, and 23, 24, 33, 34 into group 12, then if 22, 23, 32, 33 are triggered, it will be dilemma to code the group number. So, overlapping can smooth the issue. However, based on the current strategy it could still be problem, so if 21 to 23 and 31 to 33 are triggered, there is the issue of deciding the group segments.
Therefore, there are two principles for the decision of grouping, the first is quality of trigger, then the former group is made as a reference. For the previous sample, the quality of trigger in group 11 and 12 are the same, so the first principle is not applicable. So, if the former group number is 11 or 12, the same number is recorded, otherwise one is chosen randomly as they are neighbors.
In this way, the position of the head is recorded as a group number and every number maps a concrete position in the force-pad, such that it is more specific than the previous method of rough approximate positions of left, middle and right, and instead the existence of pressure is physically sensed to better judge in-bed presence.
2.4. Key Roles in the System Implementation
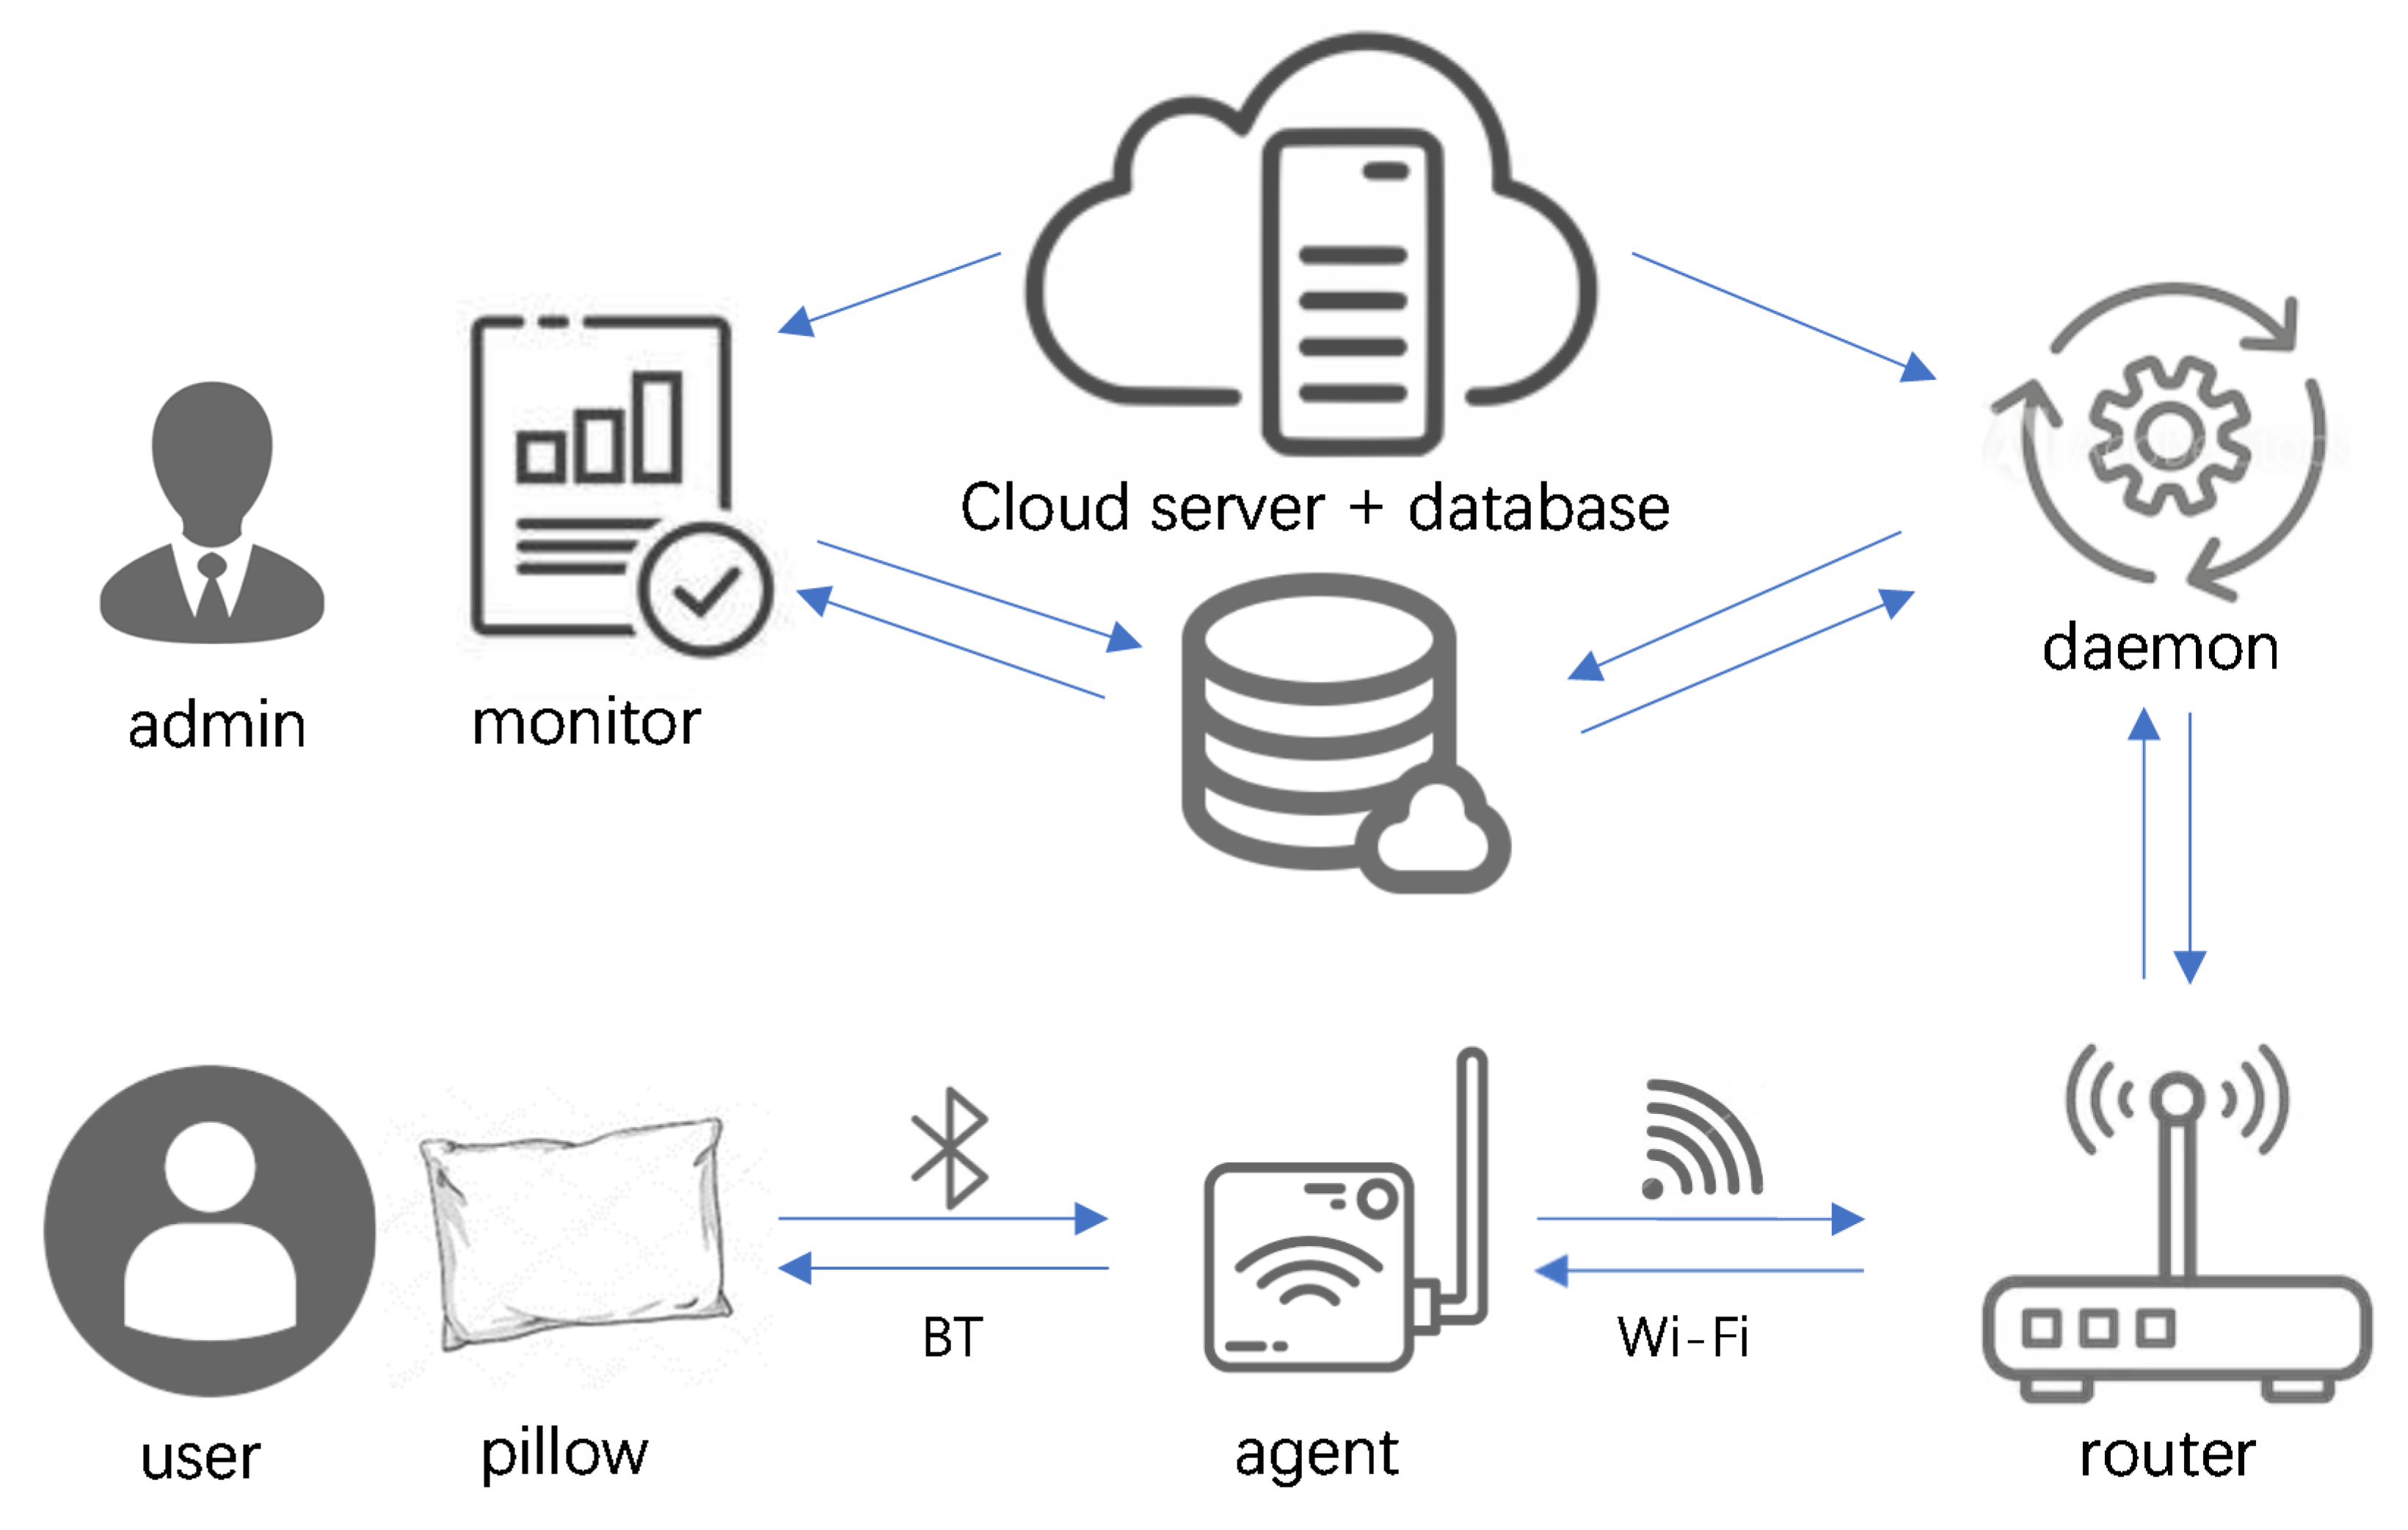
As temperature, humidity and position are determined, all the data are stored in the BT host first, then transferred to cloud server for eventual analysis. All parties of the system and their connections are shown in Figure 8. The upper row is server side, and the lower row is user end, and they are all connected through to the Internet.
There are three key actors in the system being the monitor, daemon, and agent. The former two are pure software implementations and installed in the cloud server. The agent is a user end software device, which is equipped with BT and Wi-Fi for communication. It takes the initiative to connect to the pillow and obtain the raw data, then it contacts the daemon in the cloud server by Wi-Fi, with final permission given to upload the raw data to the daemon in the cloud server.
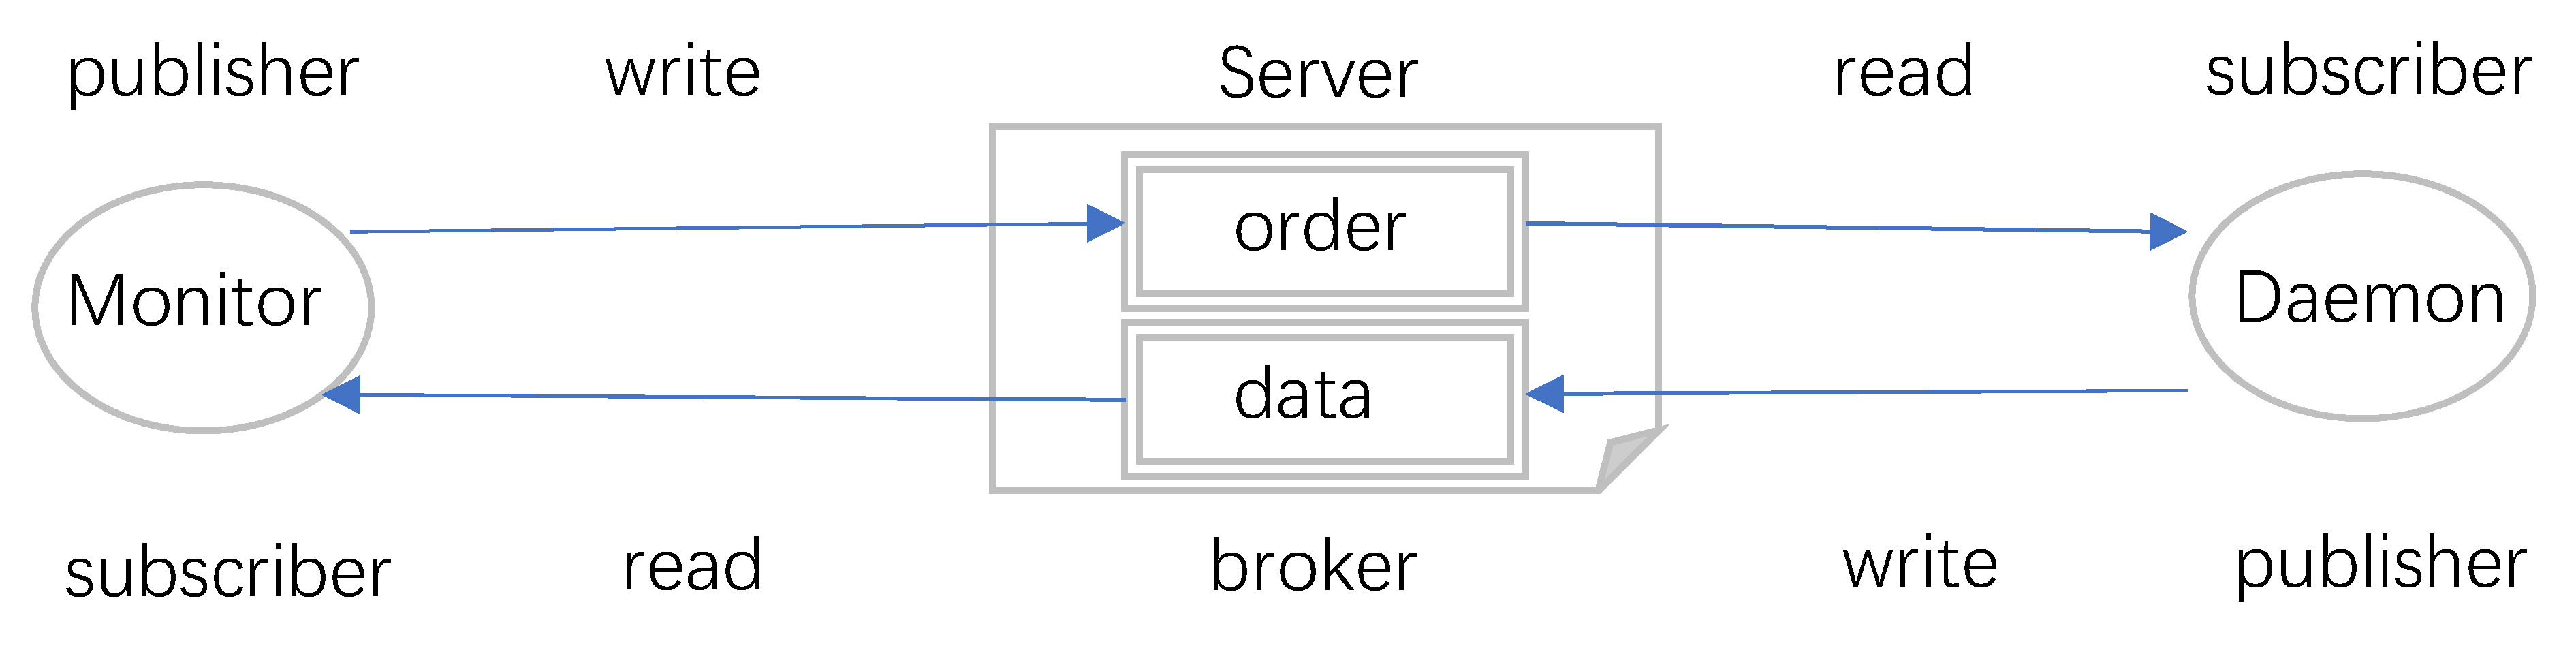
In the cloud side, the daemon and monitor share two significant flags, “Order” and “Data”, which are stored in the database. Their values are “True” or “False”, where “True” means new order or new data, while “False” is the opposite case. The interaction between the monitor and daemon is shown in Figure 9.
The daemon saves the received data in the cloud server’s database and updates the shared flag “Data” to “True” in the database, then checks the “Order” flag, so if it is “True”, then order the agent accordingly. The monitor is a program attached to a monitoring webpage, so when the page is open, the monitor is active, it checks the shared flags, analyzes raw data, and presents the results to the administrator visually, as well as providing a UI for the administrator to control the devices. If some options in the page are triggered by administrator, it updates the corresponding flags in database. For “Data”, the daemon is publisher, and the monitor is subscriber, but for “Order”, the roles are exchanged.
Raw data from the pillow travels via the agent and router and are saved to the cloud database by the daemon process. They are encrypted by a proprietary algorithm in the BT host, not just for security purposes but also to reduce bandwidth. On the Internet they are transferred via HTTPS (Secure Hypertext Transfer Transport Protocol), and they are finally decrypted by the monitor applying the proprietary algorithm. Therefore, the security of the raw data is ensured for best industry practice.
The “Order” flag is designed for proactive monitoring mode, typically, this mode is only applied in the laboratory with the DC power supply connected to the pillow as it drains the battery due to the data refresh rate.
2.5. Proactive Monitoring Practice
In general, the pillow reports the raw data in BT host storage mode, this real-time mode asks the pillow’s MCU to report real-time data for emergency concerns. The healthcare management platform is designed for nursing homes or caregivers who are concerned about the user’s health. With the received data and analyzed system result, they can also control and request data in real time if required.
For instance, if the observer finds that the body temperature of the observed user is unavailable or comparably low, but the status of occupancy is positive, it is possible that something uncertain has happened, such that the observer may want to double check the real-time condition to see if an immediate visit is urgent—such that real-time mode is available for use.
As it is shown in Figure 8, the only way to access data from the pillow is the agent, which connects to pillow by BT and reports data to cloud by Wi-Fi, but since it usually connected via a home router, it cannot be directly accessed externally via the Internet. There are several proven methods to enable direct access, such as port forwarding [23], KeepAlive [24] in TCP/IP, ngrok [25], and so forth. The strength and weakness of these technologies are listed in Table 1.
Many IoT platforms provide communication services for such devices, so generally they employ standard lightweight protocols such as MQTT (Message Queuing Telemetry Transport) [26] to define devices as the publisher or subscriber to exchange messages, achieving the goals of monitoring and control. The unified interface is convenient, but it could potentially complicate the processes.
The system employs a polling method different to those mentioned before, as it builds from the MQTT protocol and adapts it to fit the system’s need. The workflow on “Order” and “Data” can be seen in Figure 9, where the administrator logins into a monitoring page hosted on a cloud server (fixed or mobile infrastructure) and gives an order to retrieve real-time data from a specified device.
The order will set the flag “Order” to “True” in the database attached to the cloud server, this monitor works as a publisher. The agent in Figure 9 connects to the daemon process running in the cloud server on a regular basis. In every connection, the daemon saves new data in existence and checks the same database if any order for the device exists and notifies the device accordingly, with the workflow of the daemon shown in Figure 10.
The daemon is like the subscriber for ”Order”. The frequency that the agent connects to the daemon is based on the near-real-time expectations, too frequent connections will become a burden on the cloud server. Our alternative polling approach avoids the weaknesses of the abovementioned technologies, as it does not compromise the local home network, not dependent on a third-party service and does not occupy resources for a long time, but its weakness is notably that of potential delay.
This real-time mode should just be used in an emergency, as the communication between pillow and agent is on hold, and as the BT host keeps detecting data from sensors, such behavior will cause rapid battery drain. If such a feature is necessary in exceptional circumstances, changing the pillow’s power supply from a lithium cell battery to DC power is an option. In the next section, the simulation and experiment results are presented, and the performance of the improved smart pillow in the measurement of the patient’s core temperature is compared to other methodologies.
3. Results
In this section, the thermal simulation of the smart pillow in normal conditions is shown firstly, along with the CBT distance, then concrete data for one night is provided to verify the theory mentioned before. Development of the temperature and heatmap of the sleeping position are provided, and then the result of this smart pillow is compared with existing methods.
3.1. Thermal Simulation of the Smart Pillow
Energy2D is employed to simulate the heat transfer of head resting in the pillow, a simulation tool developed by Xie [27]. The tool applies the Finite-Difference Time-Domain (FDTD) process and iterative methods to solve the heat equations. Before simulation, the thermal properties of the involved material are shown in Table 2. When person rests on the pillow, the material between the head to the bed is hair, pillowcase, and the pillow, and of course they are all exposed in air. Thermal conductivity K is the main concern. There is no argument about thermal properties of air. For hair, it is traditionally accepted that the thermal conductivity K is 0.37 W/mK [28,29].
The material of the pillow is latex, although it is cellularized rubber, so the K for natural rubber is 0.15, but for latex the engineer toolbox [30] recommends 0.045, it is reasonable as the air inside the rubber works as insulation, so at least it is better than air. On the contrary, the K of cotton is 0.06, but the pillowcase is cotton fabric, since it is not pure cotton, its K is marginally greater with a recommended value of 0.077. Those parameters are set in Energy2D to run the simulation; with the result is shown in Figure 11.
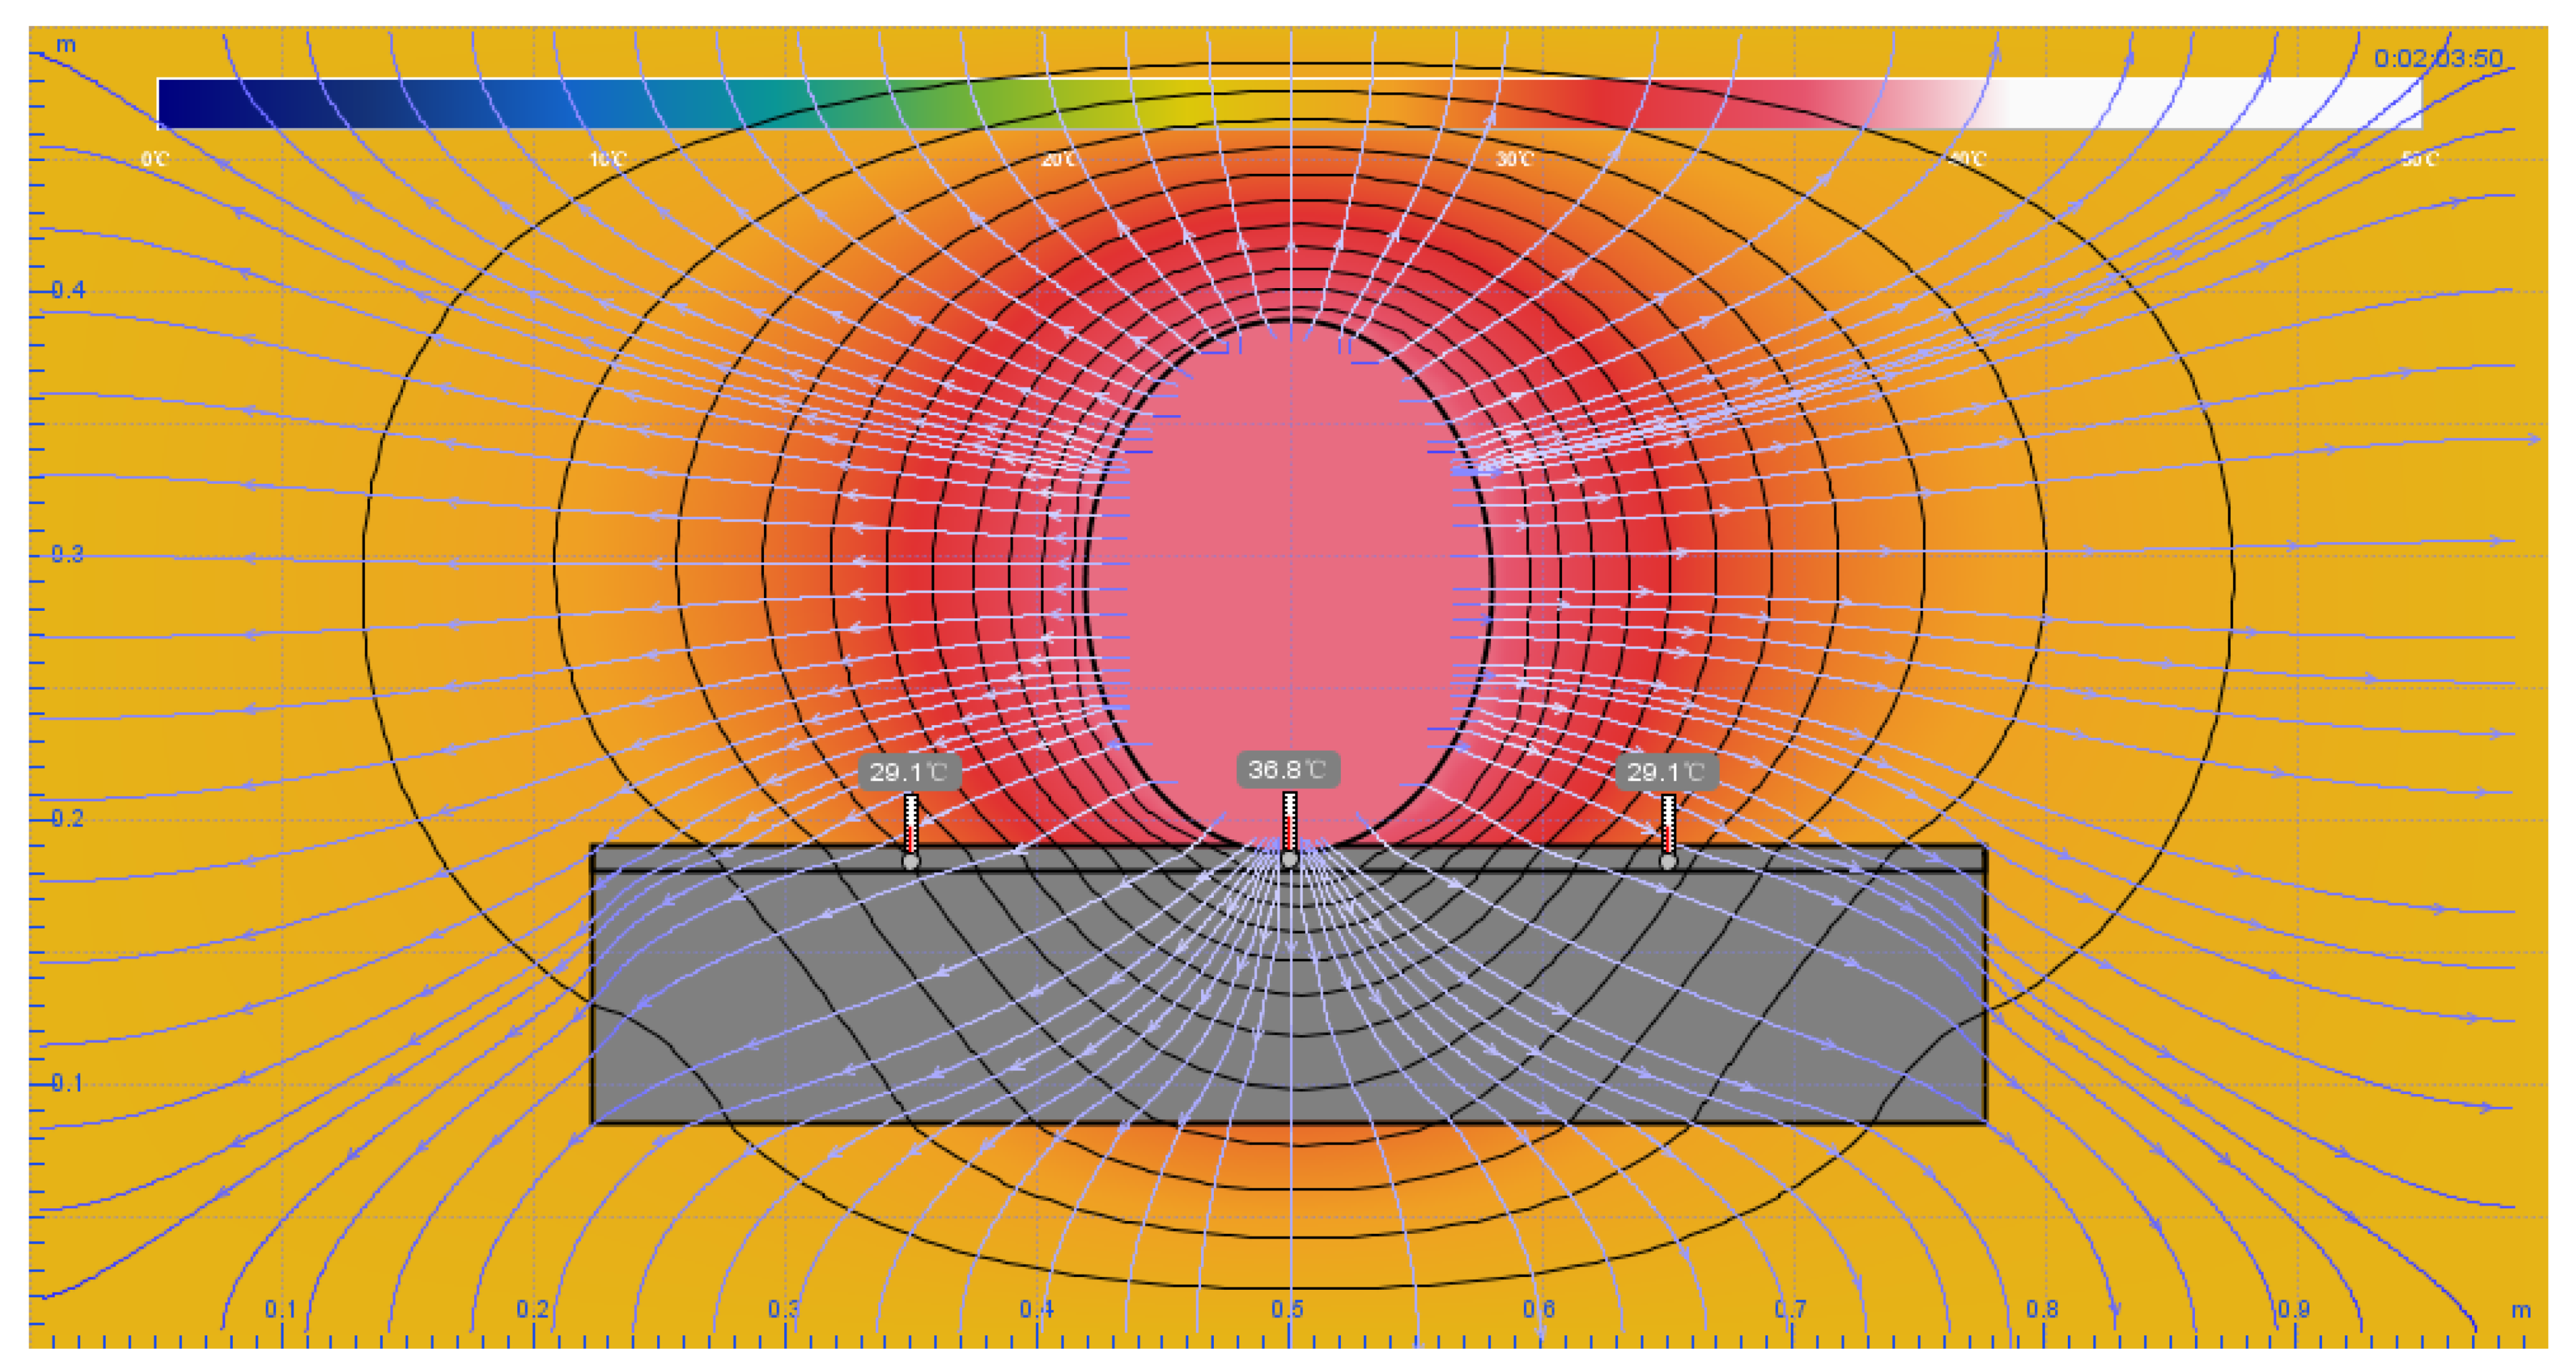
The simulation settings are exactly equivalent to the actual scenario. The size of the testbed is 100 cm × 50 cm, the pillow dimensions are 55 cm (width) by 10 cm (height), the head is modeled as an eclipse with 20 cm height and 15 cm width. Three temperature sensors are distributed on the surface of pillow, with the middle sensor close to the edge of the head to simulate head resting right on the sensor. The head temperature is set to 37 °C as a stable heat source, as this is the simulation of CBT, and the environmental temperature is set to 25 °C.
From the simulation process, it took about 2 min for the middle sensor to reach 36.8 °C, and 5 min to reach 36.9 °C, for this is the maximum level reached. Ideally, the result proves that despite the hair and pillowcase between the skin and the sensor, if the head is right on the sensor and is present for a long enough time, the value of sensor is very close to the CBT.
In the actual experiment, for head resting right on the sensor for more than 10 min, the value is very close to a traditional thermometer measured orally, with their difference being in the margin of 0.1 °C—thus proving that the simulation result and experimental result is generally consistent.
3.2. Sample Data from the Smart Pillow
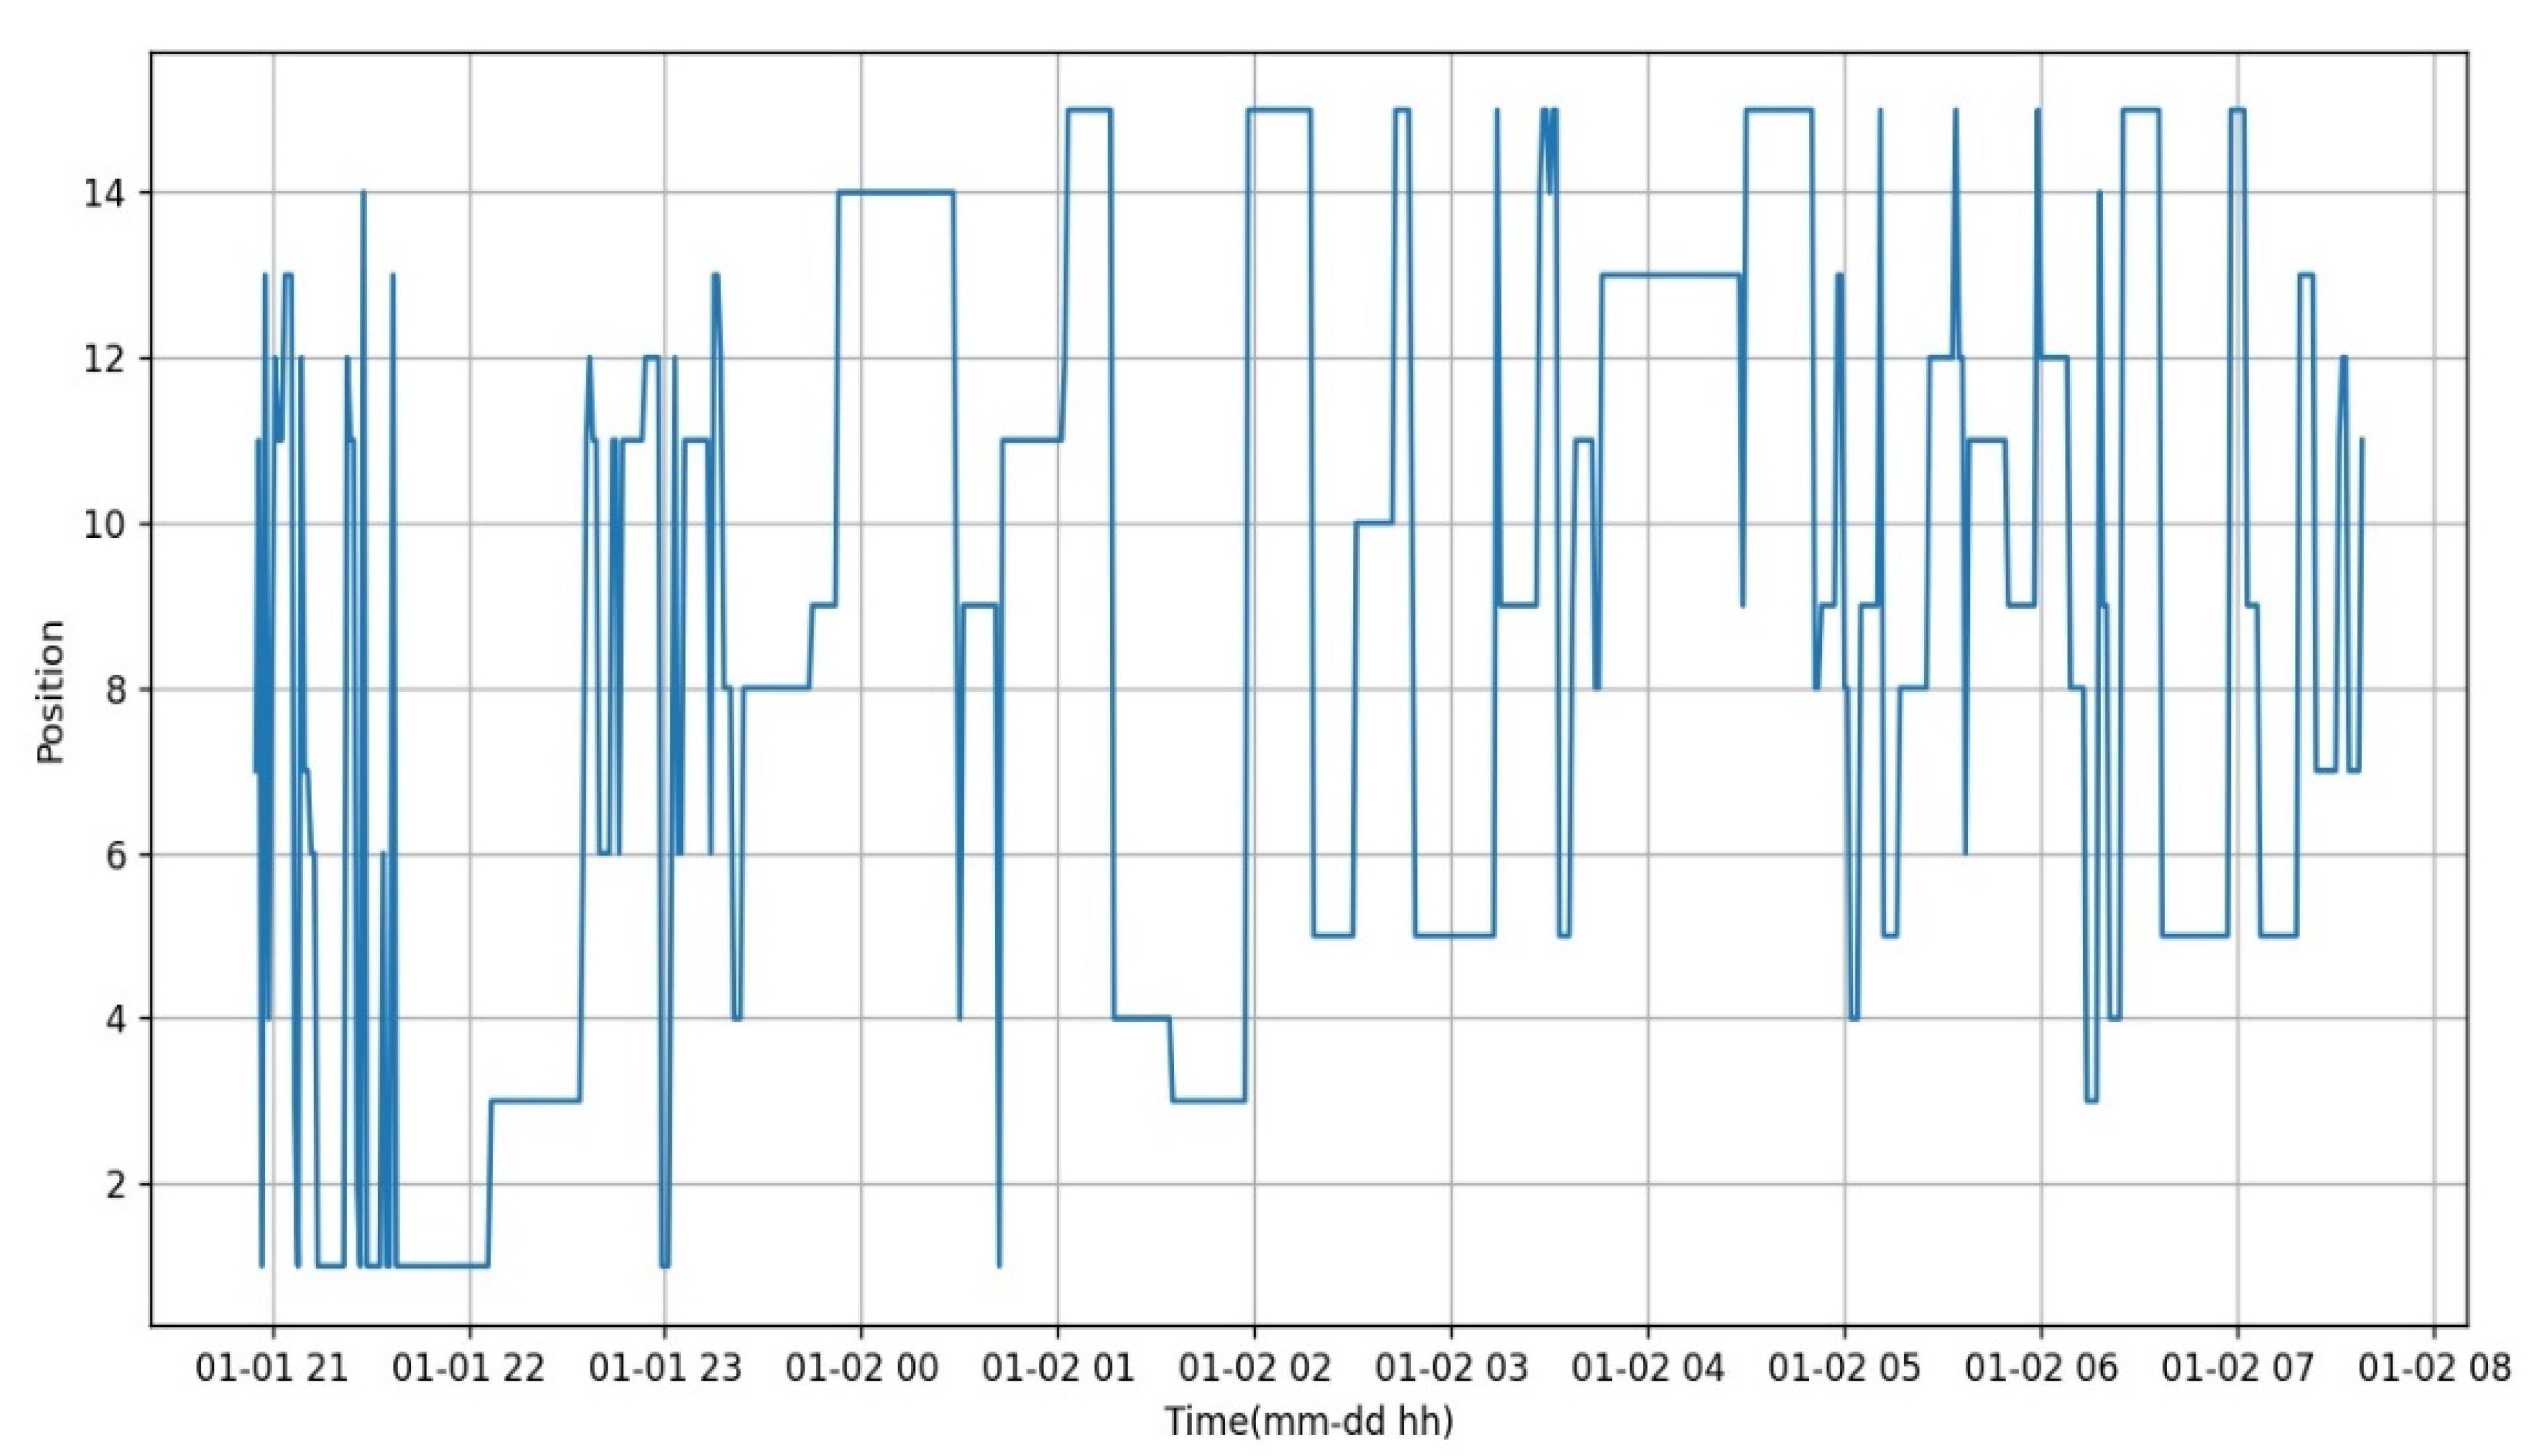
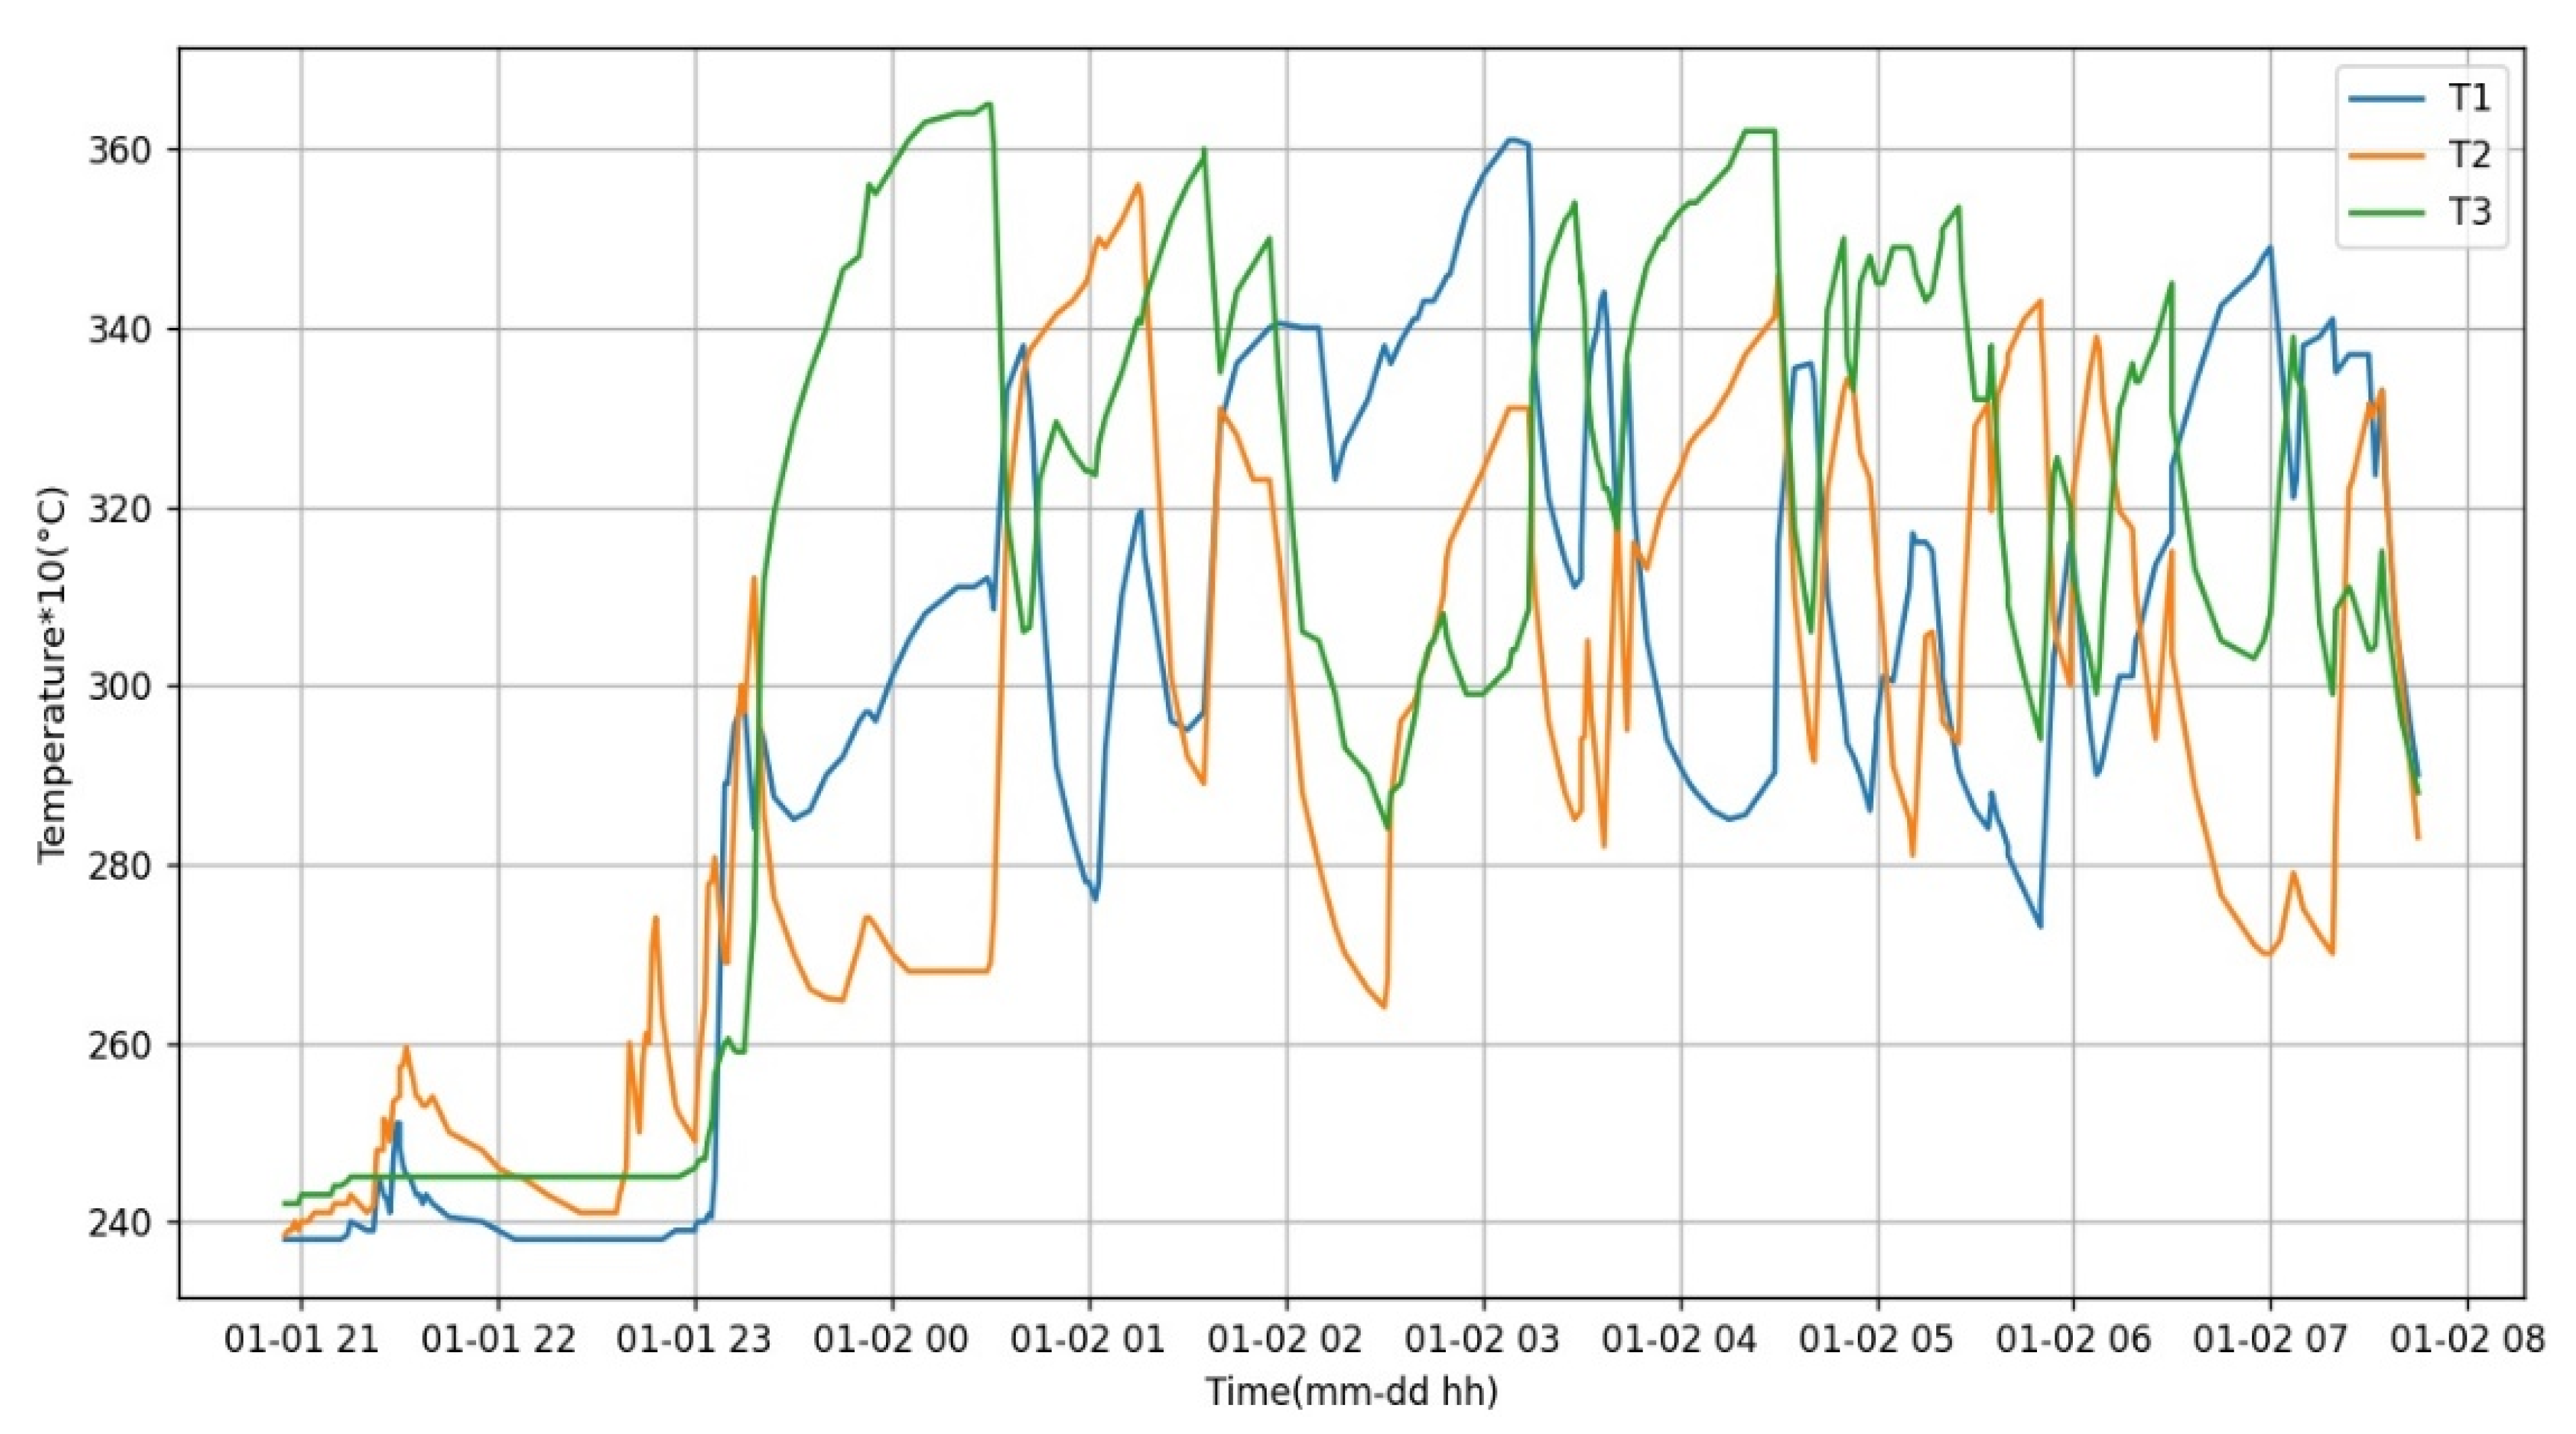
To verify the principle introduced previously, a night data sample was selected randomly from an anonymized user. Figure 12 shows the distribution of the head position from 21:00 to 08:00, and Figure 13 is the temperature value from the three sensors at the exact time. Their x-axis is the same time, for the former the y-axis is group number, and the latter is temperature value multiplied by 10.
The two graphs are analyzed for further assessment. At the beginning of Figure 13, we observe the room temperature is about 24 °C as all three sensors are at a similar value. From 20:45 to about 21:30 in Figure 12, the position changes frequently and the area is wider from row 1 to row 3. However, the head is not directly on the pillow, but rather as if a cushion were put on the pillow and then the user leans on the cushion, so the position under pressure changes as a result. The temperature of the sensors does not change significantly, so this matches the condition that people would do other bedtime activities like reading or watching television before sleeping.
From 22:30, it appears that the pressure focuses on the left side of pillow as the position changes between 6, 11 and 12, and T2 from Figure 3 changes in a non-dramatic manner. From about 23:00, all three sensors increase sharply, so it means the user’s head is on the pillow and rests on position 8 for a long time, where it is in the middle of the pillow, thus where sleep begins.
In the following hour, the head position changes slightly from 8 to 9 through to 14, thus the user’s head slips to the upper right, so T3 is in the middle that reaches a peak measurement of 36.5 °C. This is the closest value of CBT, and T1 which is on the right side of Figure 3, that increases and T2 declines. At about 00:40, T2 values rebound when the head rests on position 1 and 11 for about 20 min.
After that, T2 has lesser chance to record measurements as the user is prone to sleeping on the right side of the pillow. In the following 6 h, the head shifts between the middle to the right repeatedly and just rests on position 11 for a small period. The user wakes up at about 07:30 because at the time, three sensors start dropping measurements continually without fluctuation, and the position values are no longer recorded.
The longest time at one position spans 40 min at around 04:00 at position 13, so it is at the upper middle, but the middle sensor locates at the bottom middle, so the value of the sensor is unable to reach the peak measurement. As a similar situation happens at about 03:00 at position 5, the duration is too short to reach and surpass the peak measurement as well. Figure 14 is the heat map of rest-on time (minutes) versus the user group from the previous sample’s nightly data. Darker shading means a longer time in the area. It is observed which area is the user’s favorite spot—this can help with analyzing the user’s sleeping habit if permission is given.
One unexpected observation is that the position 2 with only a minute of rest time, the result could relate to the previous preferred principle, which is for two areas with the same number of pressure sensors being triggered, such that the previous position is preferred. For example, in Figure 7, if sensors 3, 4, 5 are triggered, 3 and 4 belongs to area 2, 4 and 5 for area 3, so if the previous position is 3, the new position is still 3, and user usually starts to sleep at the middle, where it is at position 3 or 8.
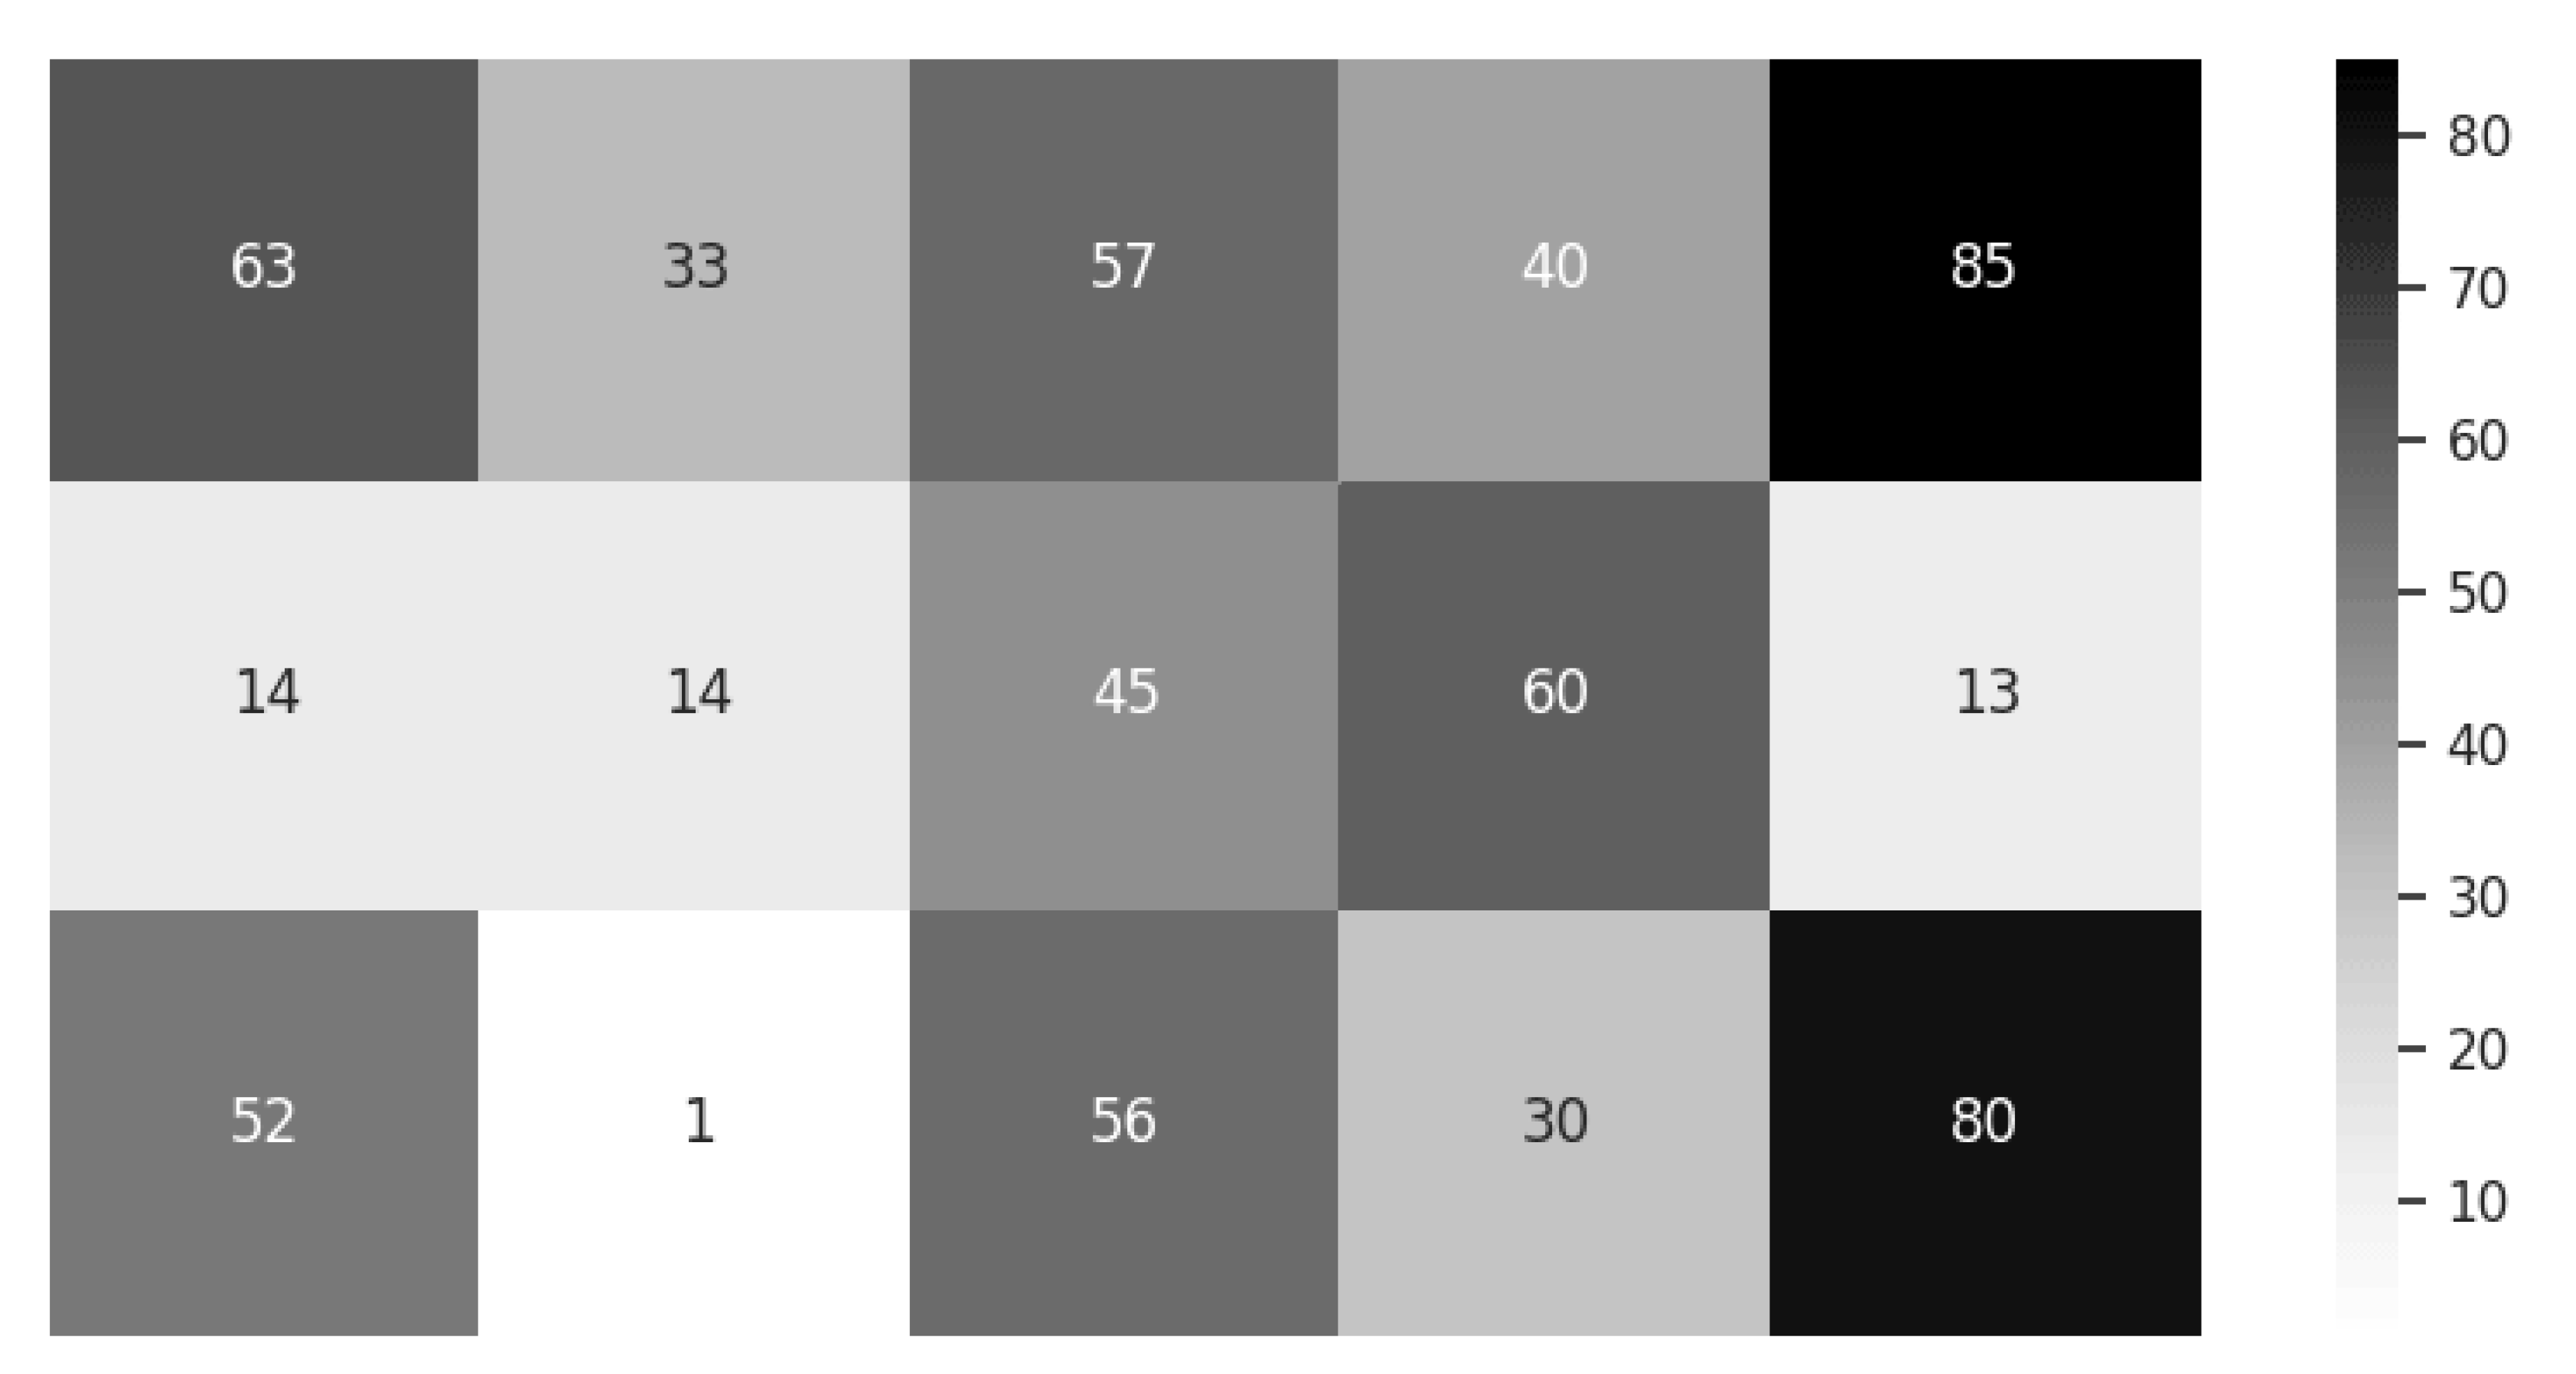
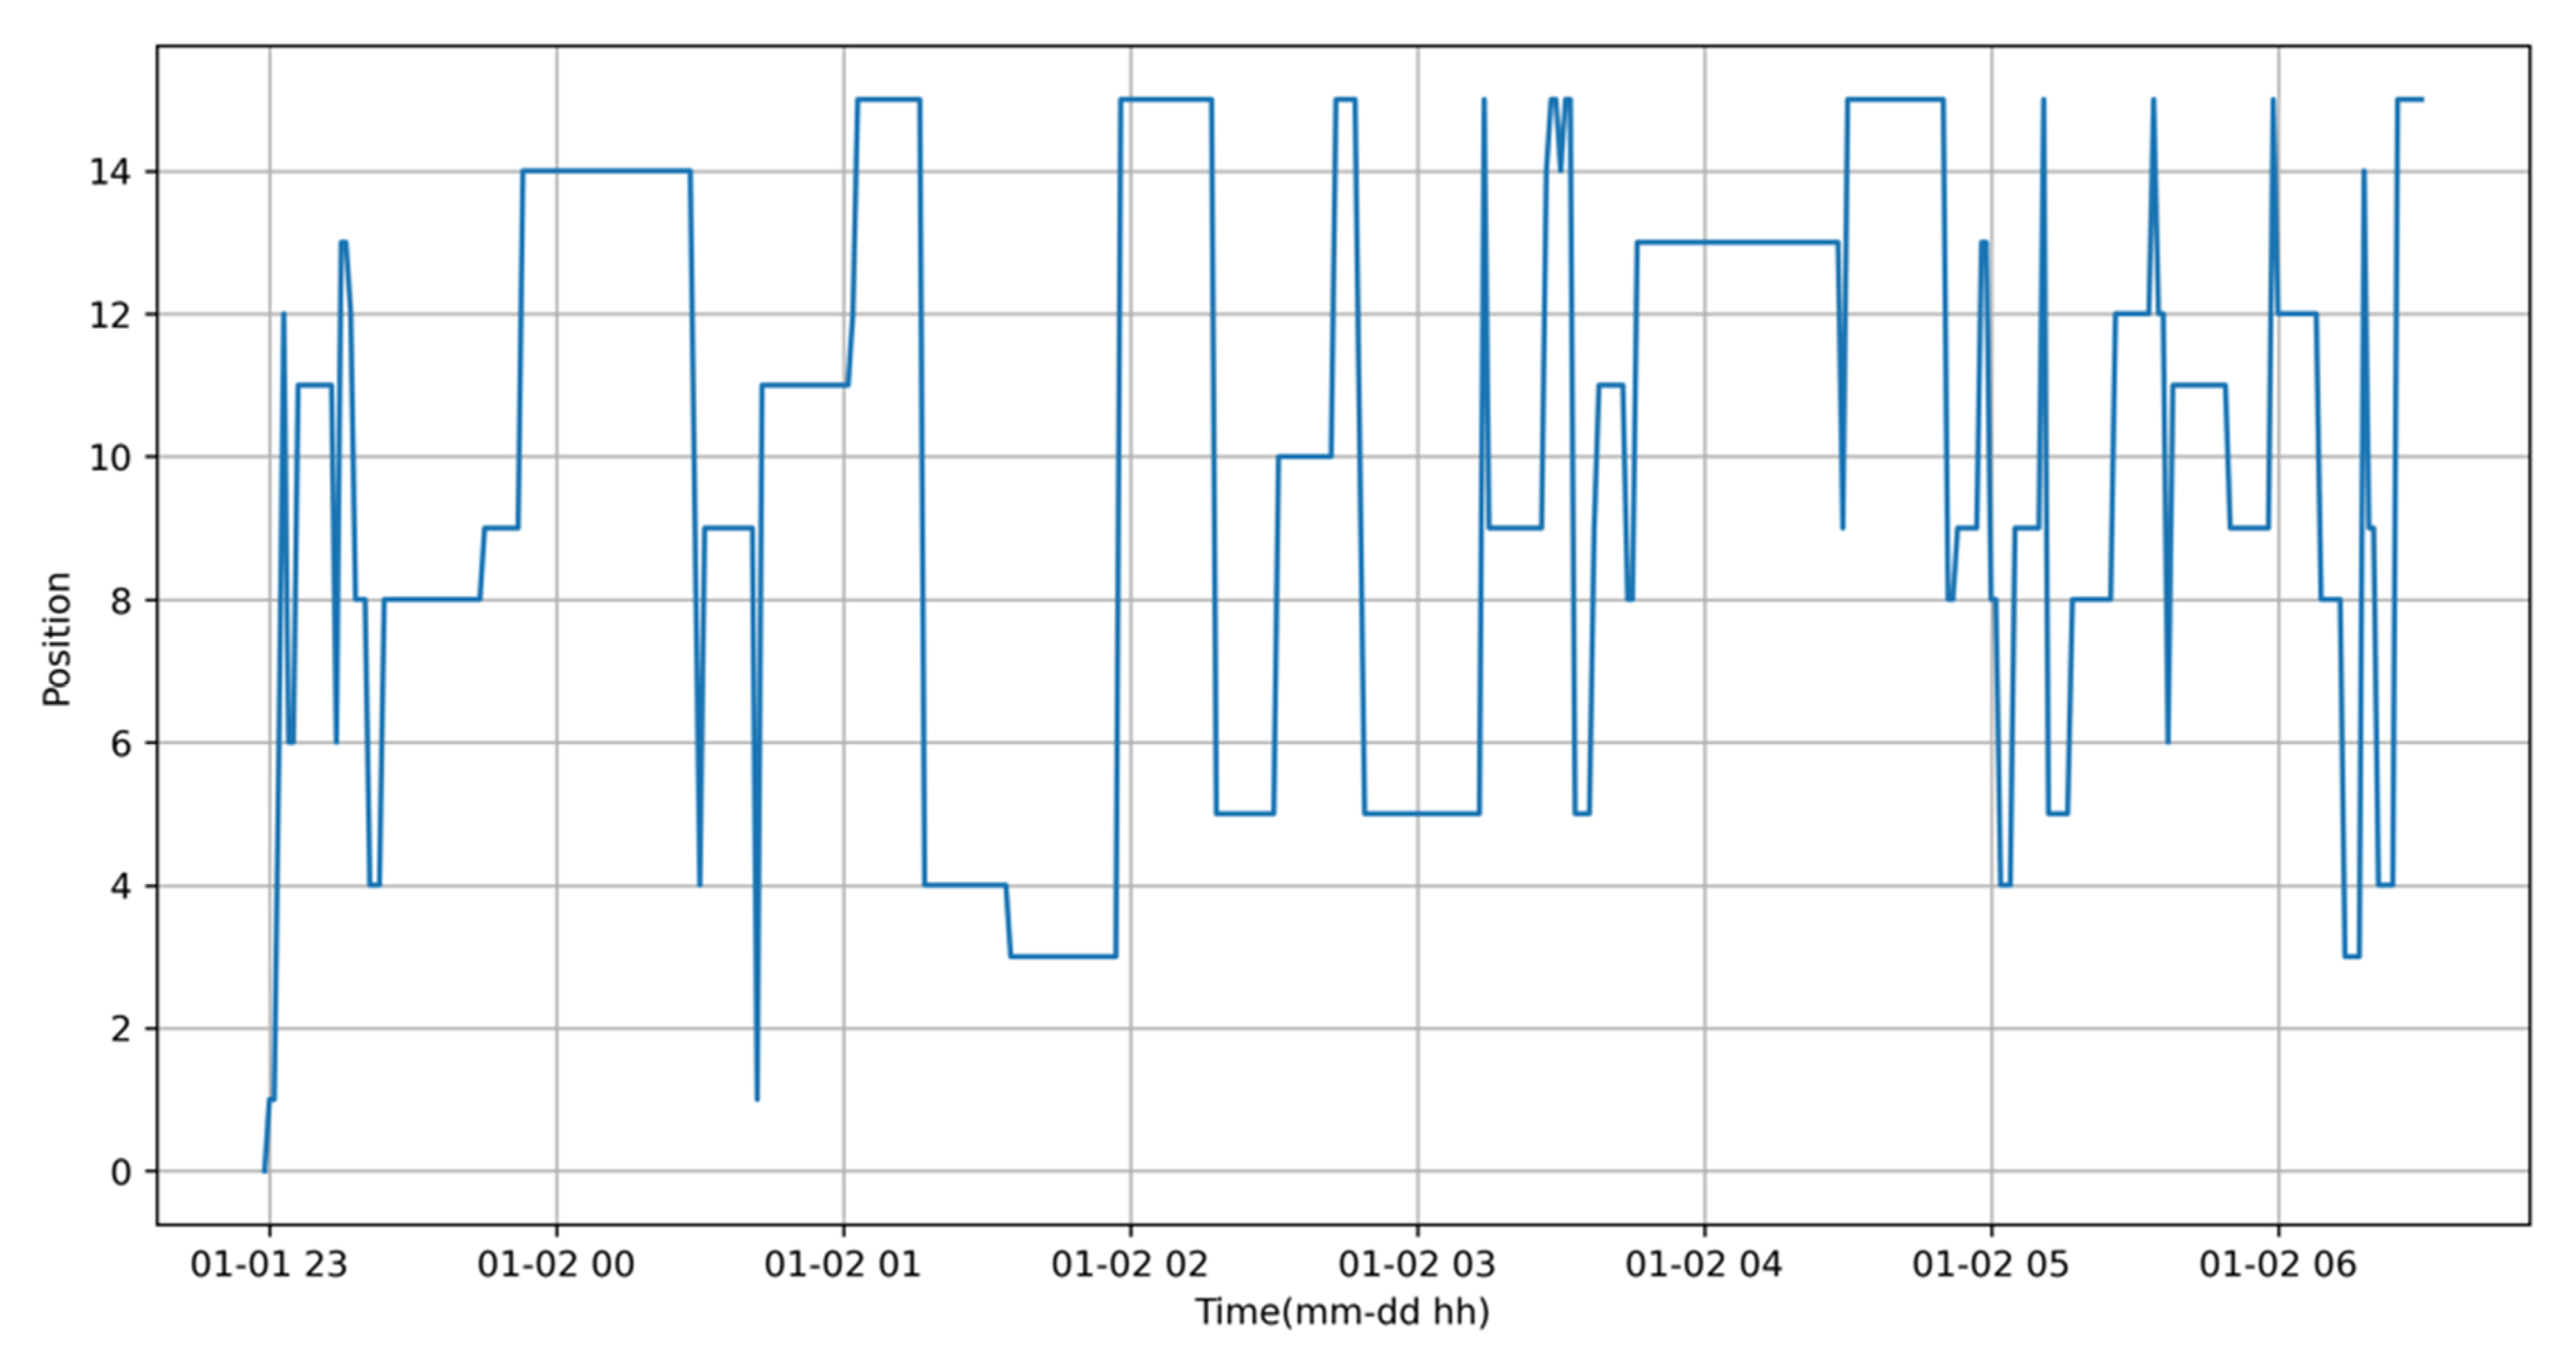
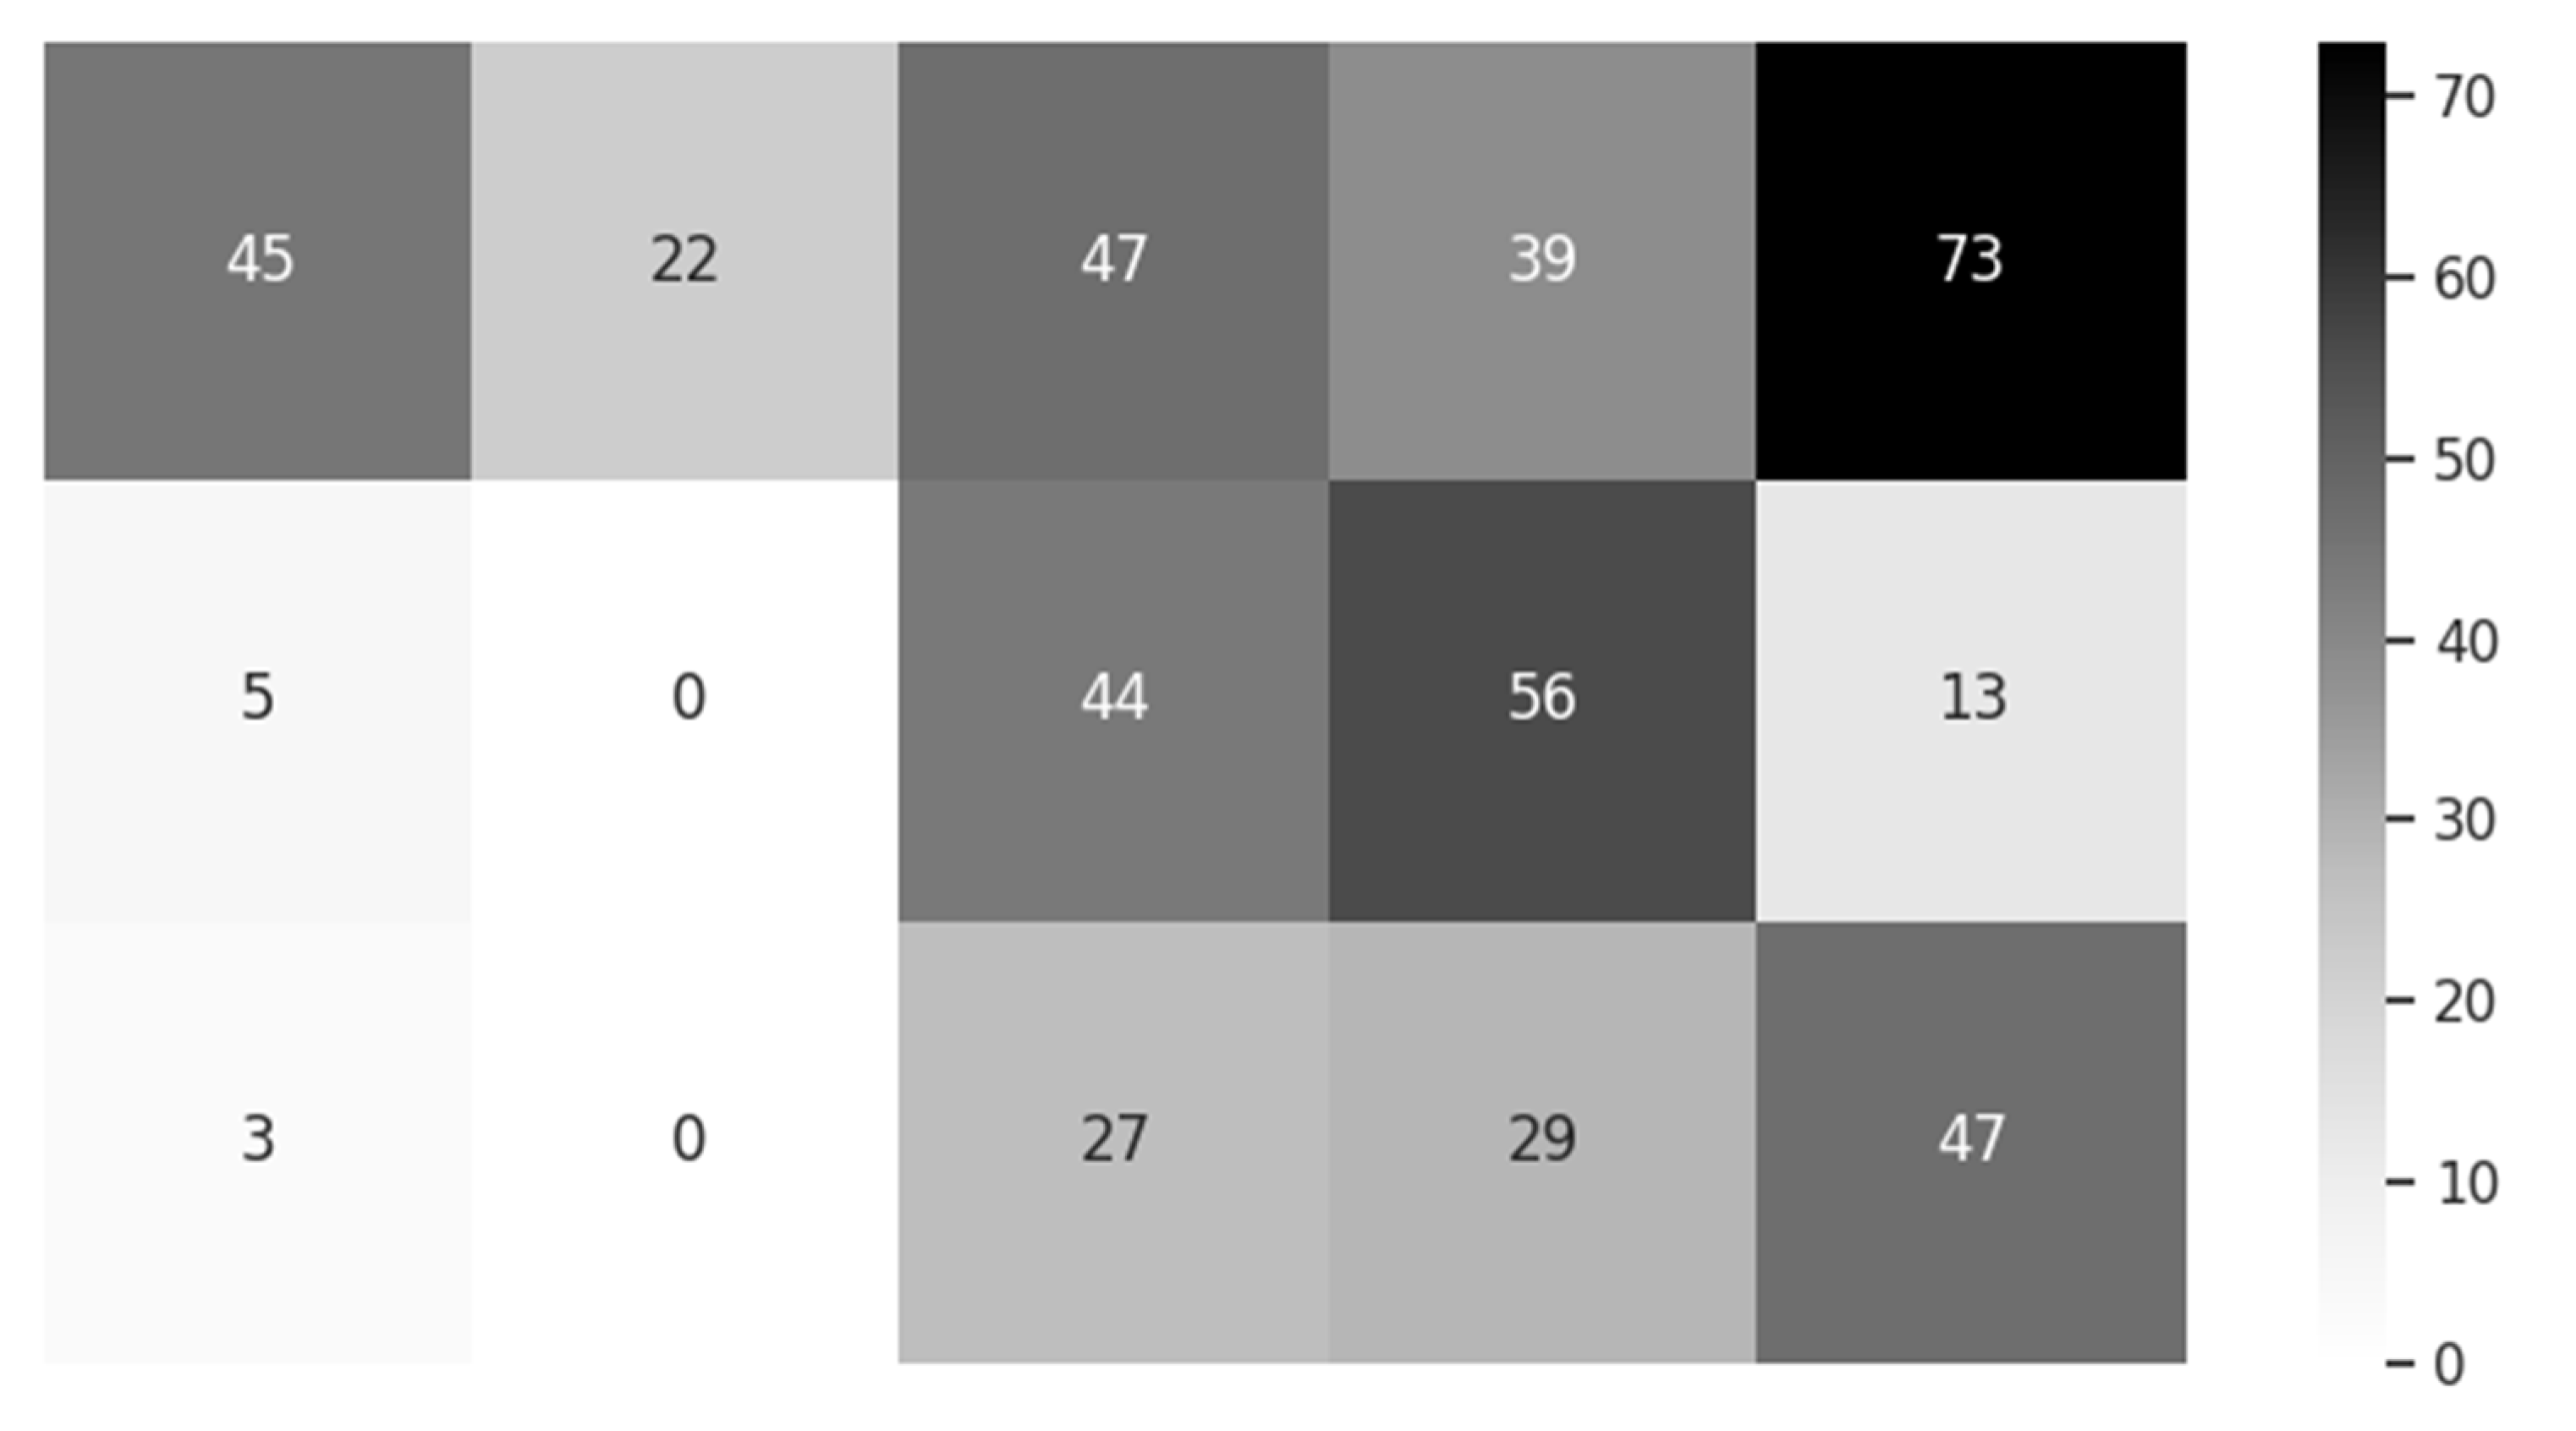
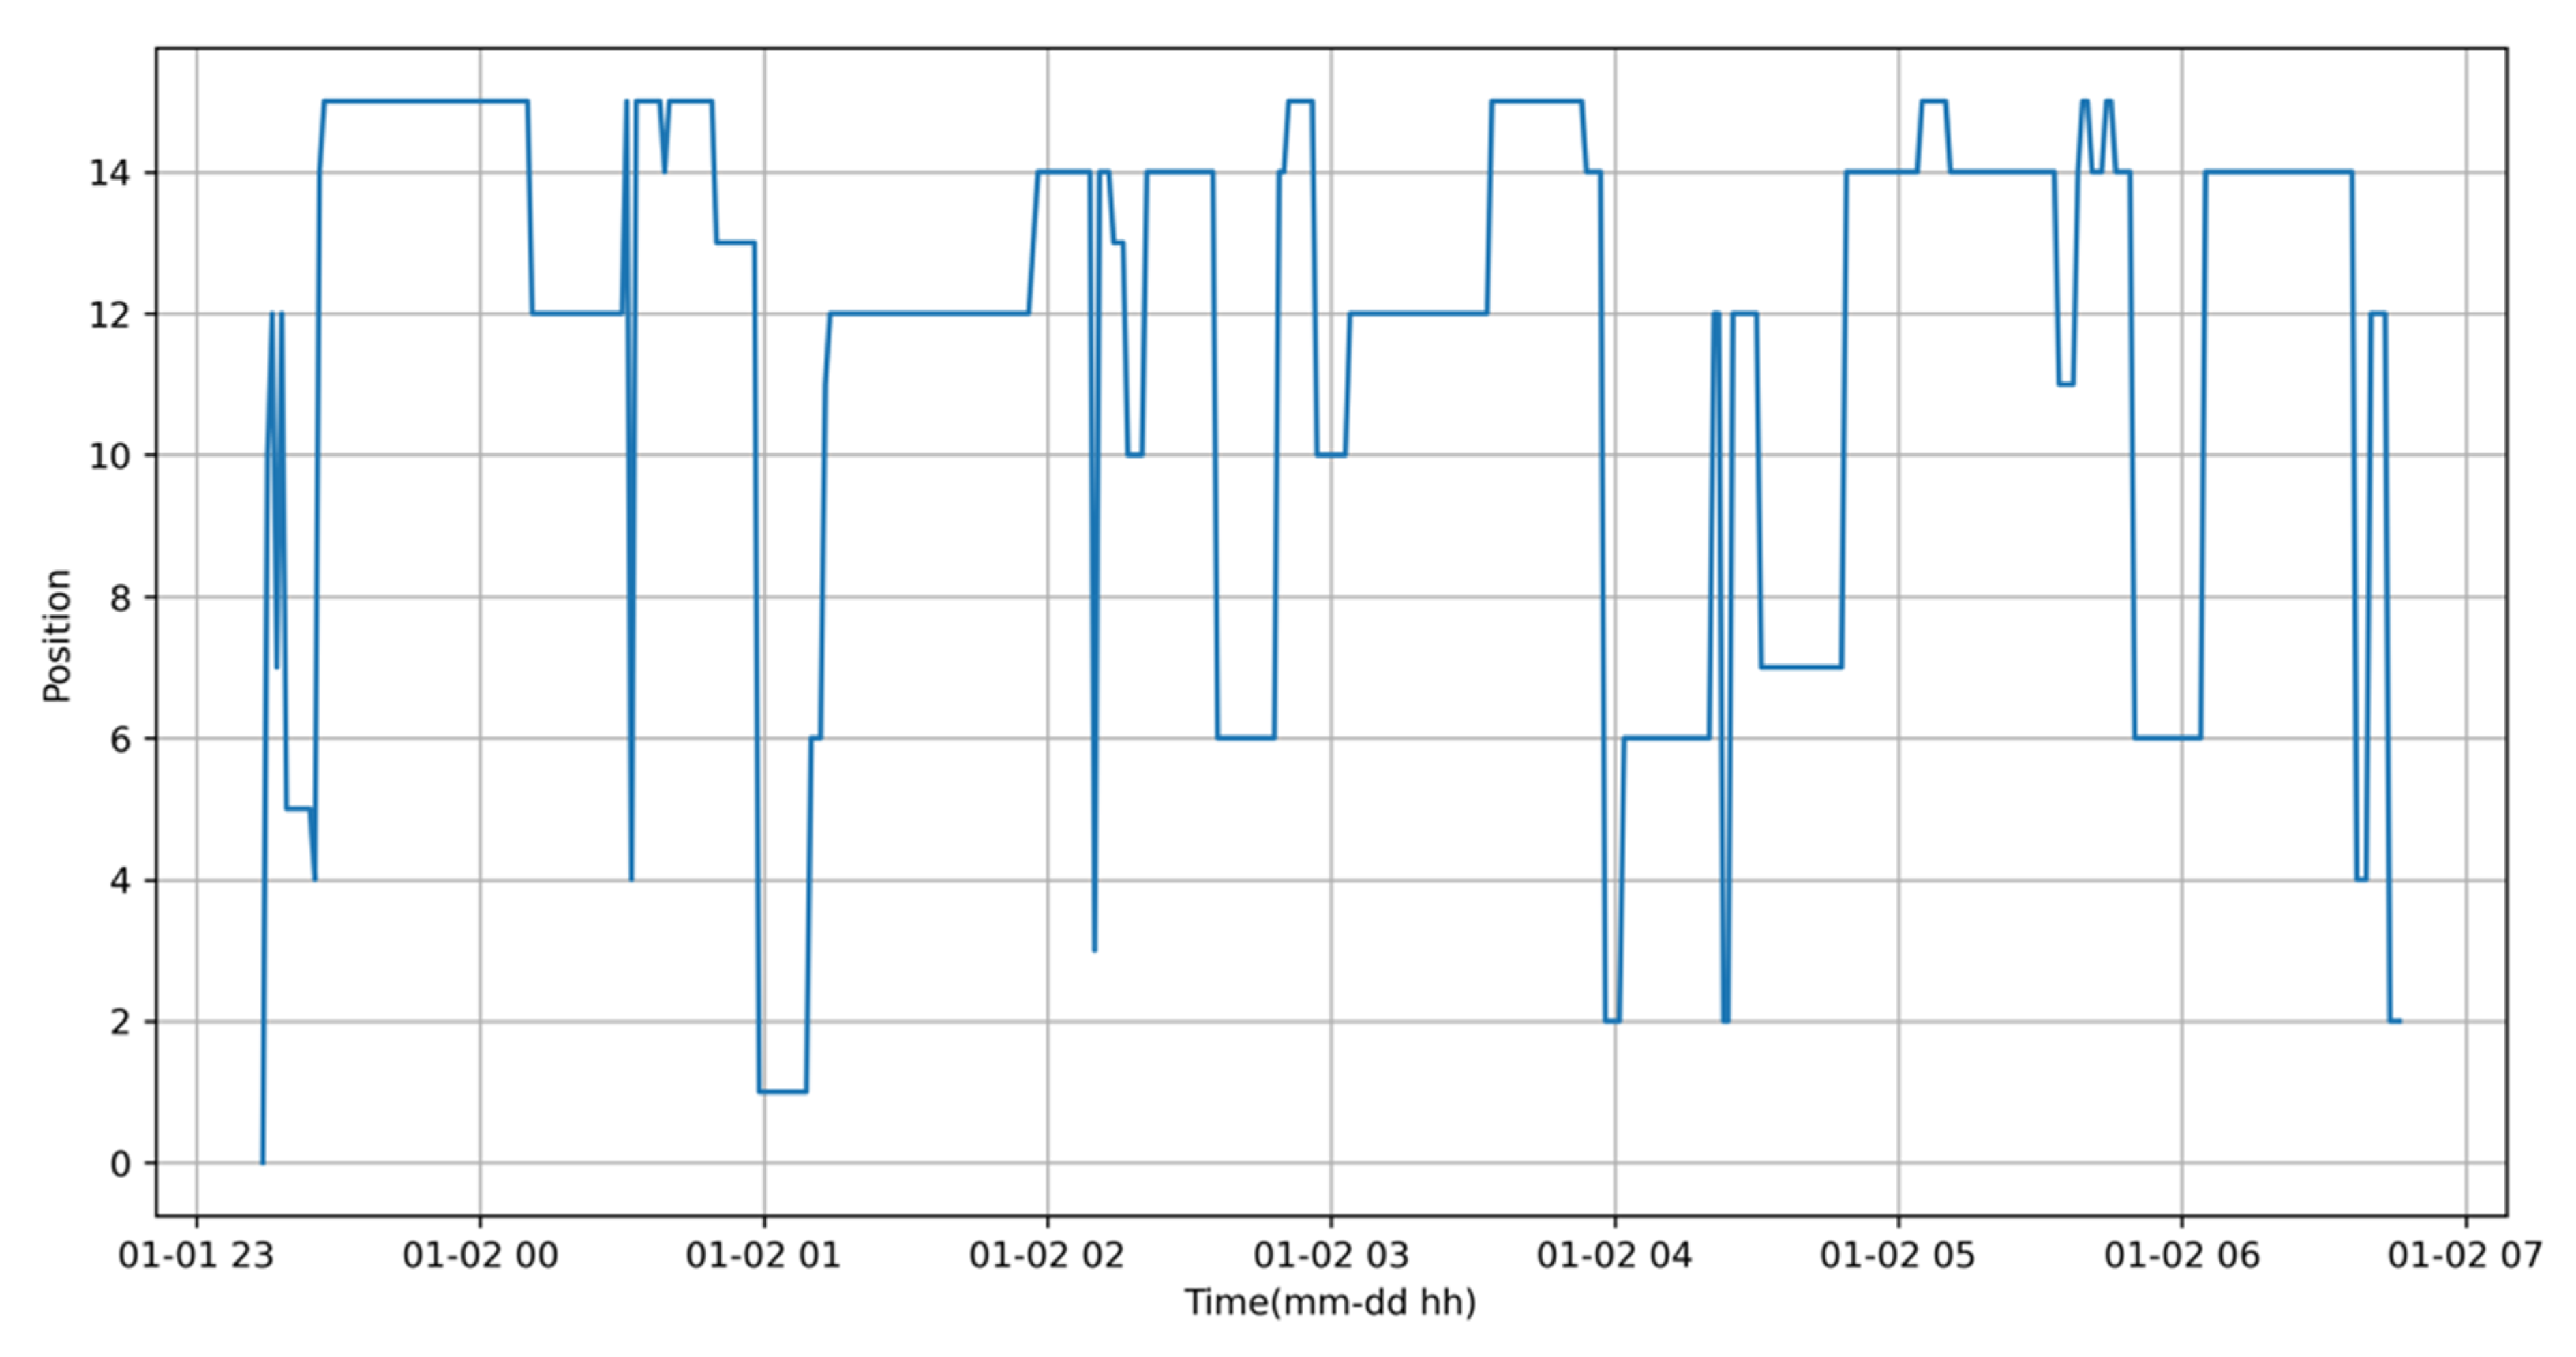
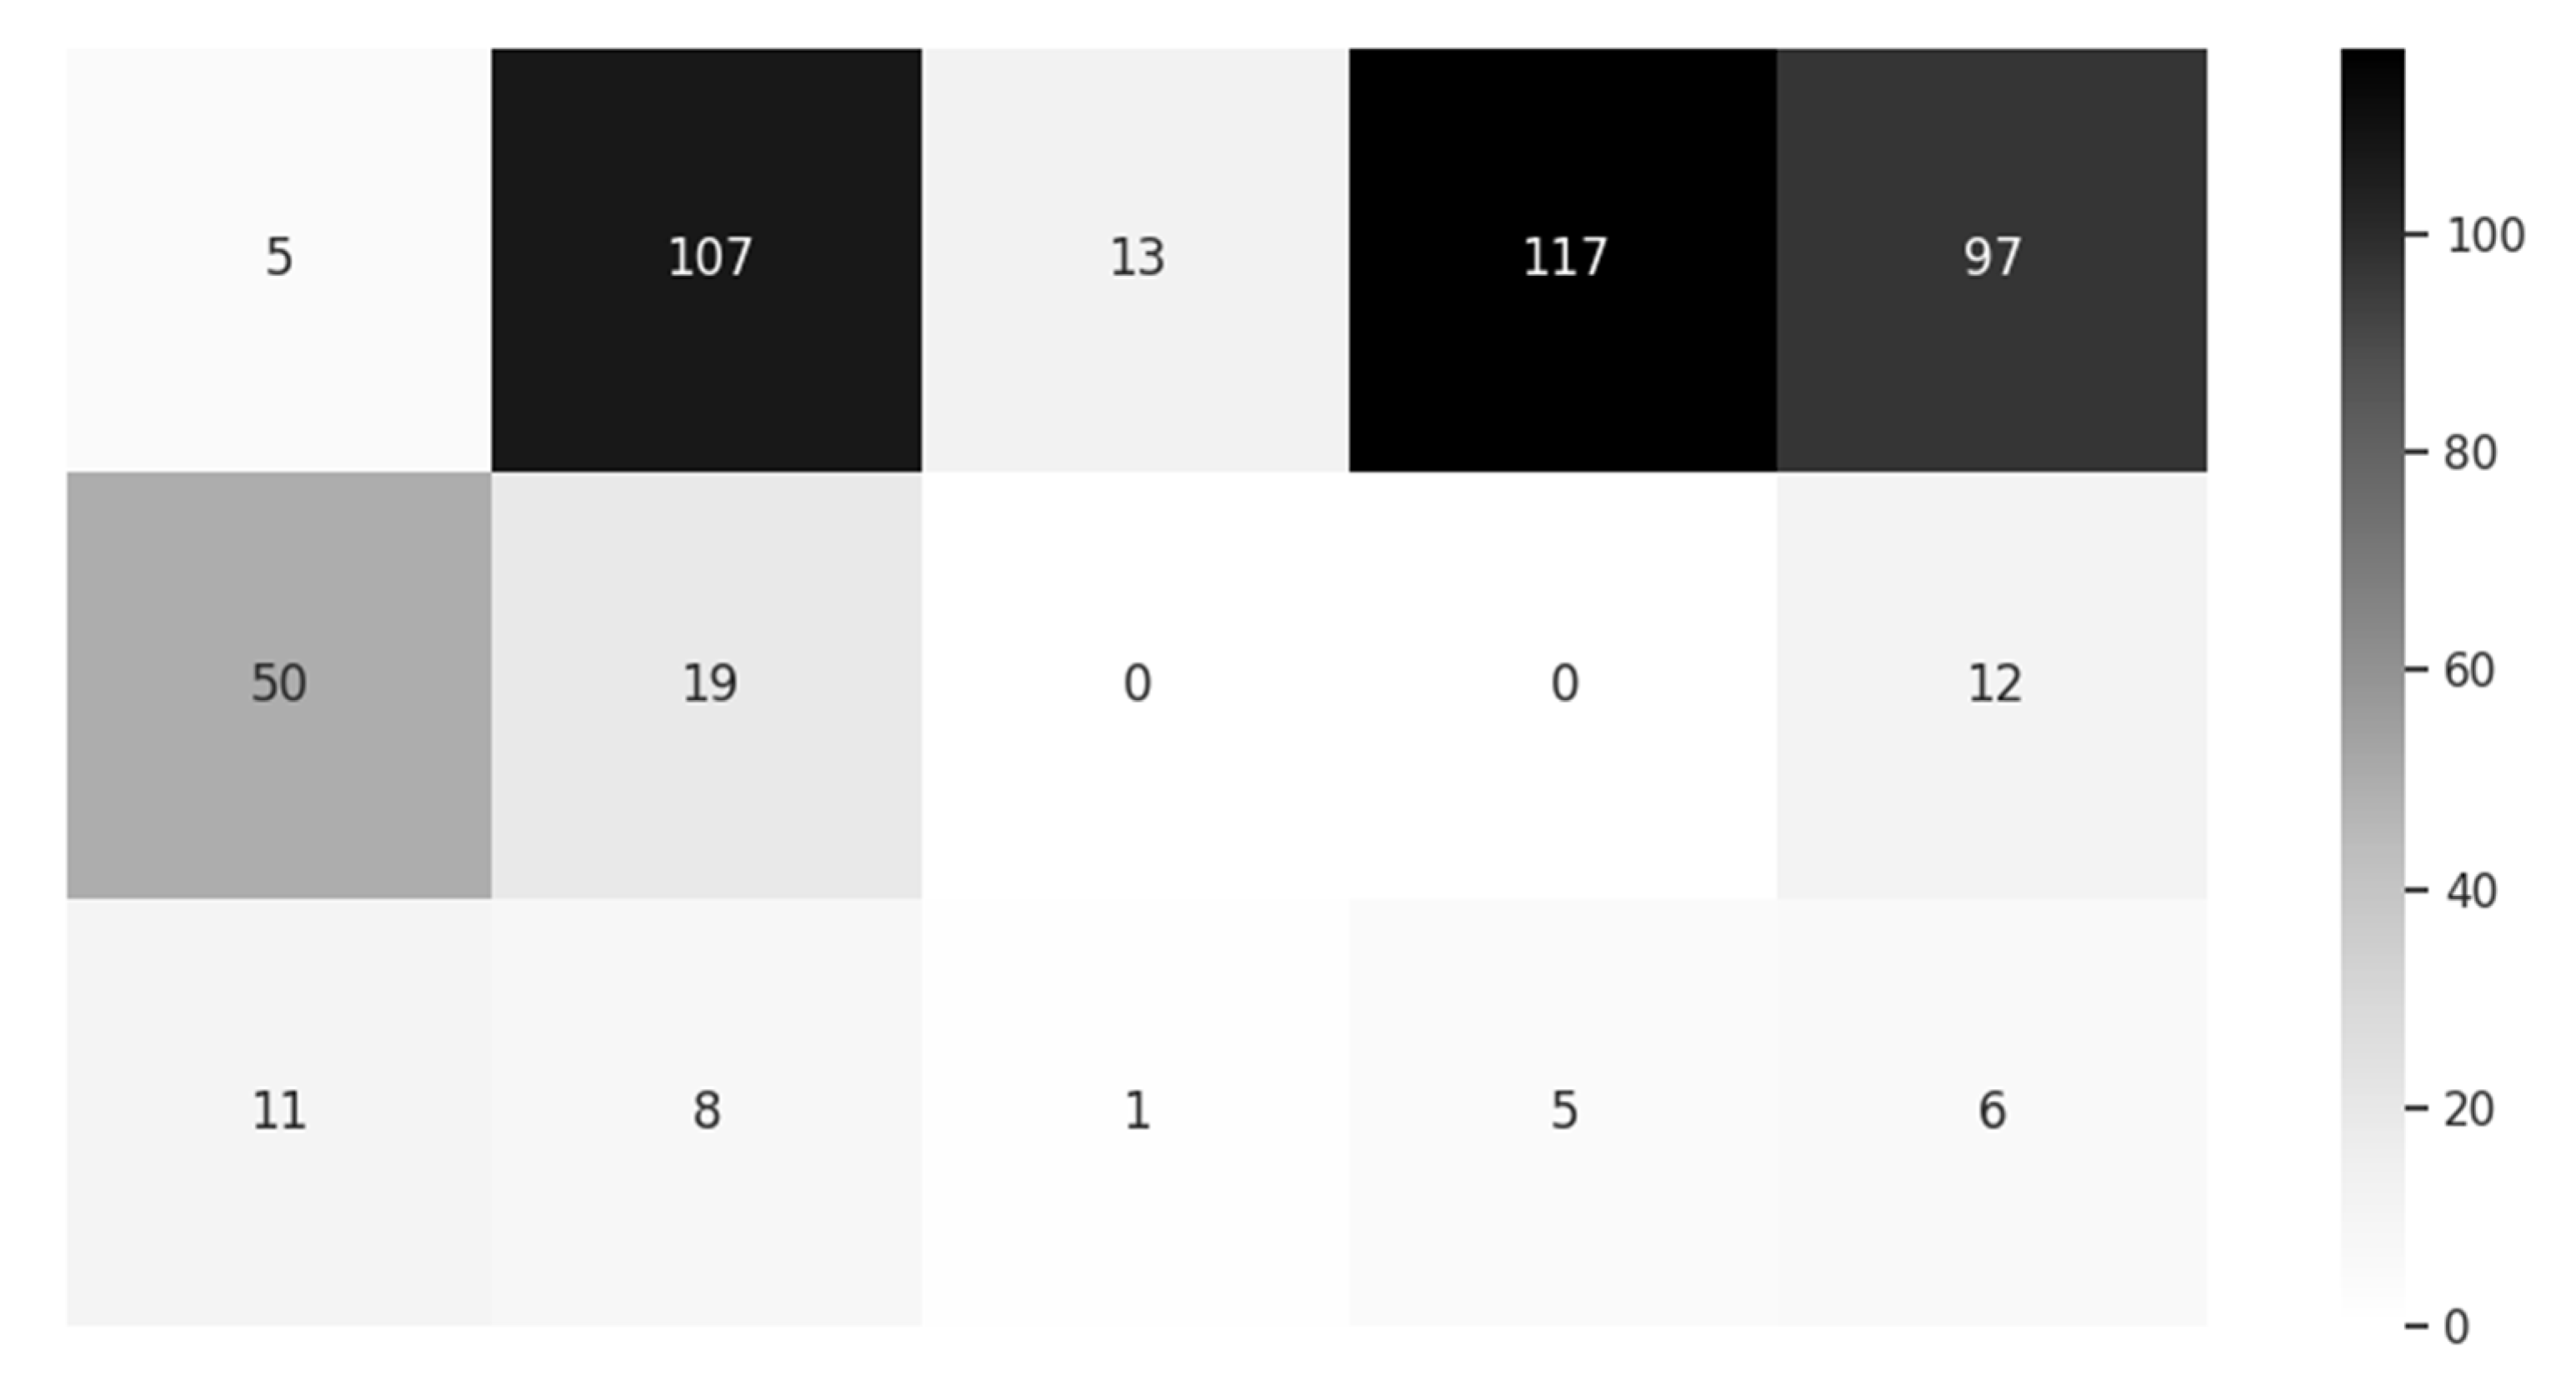
For observing the sleeping habit of various users, we first took part of the sleeping time (from 23:00 to 6:30) data from the sample, in total about 450 min, named user1, the change of position in time series is presented in Figure 15 and statistics of the position and heatmap is presented in Figure 16. Refreshed sleeping data in the same time section of the other user, named user2, is presented in Figure 17 and Figure 18, respectively. From the heatmaps, the difference of sleeping habit is obvious, first, the maximum minutes of a single position, for user1 it is 73, for user2 it is 117; concerning the distribution of minutes, for user1, there are 7 positions around 39 to 73, for user2, there are 3 positions around 97 to 117.
As the minutes for position is less than 13, for user1 is 5, user2 is 10 instead, this proves that user1 sleeps on the pillow more evenly than user2, so technically the standard deviation (σ) of user1 is 21.79 and user2 is 40.36; and from the heatmap data we can observe that user1 prefers the pillow’s upright side while user2 prefers sleeping in the pillow’s far end.
3.3. Comparision with ZHF and DHF Approaches
Technically, the “Smart Magic Pillow” is incomparable with ZHF and DFH as both have a CBT in each period, but the pillow only has a CBT when position and time requirements are met. Since the principle is similar, the evaluated comparison is shown in Table 3.
Firstly, ZHF requires a heater, so this is its biggest weakness, not only because of its energy demands, but also because it must connect to mains power—making it less flexible and uncomfortable for the user. The advantage for ZHF from the use of a heater is its initial response time being lesser than DHF, so with the help from a heater, it can reach thermal balance faster.
For DHF, it needs a longer initial response time, so without a heater, thermal equilibrium for heat flux takes more than 20 min. It means the user must wait at least 20 min for a relatively accurate reading from DHF.
Accuracy is significant for measurement. There is no absolute error consideration as factors such as attached position, ambient temperature, different products and so forth could affect the test result. From the works of various researchers [6,8,31], the error of ZHF is about 0.3 to 0.4 °C and DHF is 0.1 to 0.5 °C.
The possible error area of DHF is wider except for the previously mentioned factors, so the distances between sensors in both the horizontal and vertical axes matter, such that it decides the size of DHF and results in a degree of comfort as it is physically taped to the human body.
The smart pillow is not qualified as a thermometer as it cannot guarantee a reading. Only if both two conditions are met: firstly, if the head rests right on a sensor—fortunately, the area of head, including cervical vertebra, is relatively large, and three sensors increase the occurrence of the condition; secondly is time, as the head must rest on the sensor for more than 10 min.
From the simulation work in Figure 11, only two minutes for the sensor reaching 36.8 °C is within an ideal environment, but in the actual experiment, even 5 min is not enough as it is influenced by ambient temperature and the material of pillowcase, so 10 min is required to pick up the temperature reported every 5 min. From Figure 12 and Figure 13 there are three temperatures that qualify for CBT. If there is a qualified CBT, which is satisfied in one night, it is more accurate and more comfortable as the measurement is determined without any user awareness.
In next section, the Remote Healthcare System with the Smart Magic Pillow will be concluded, including what was achieved and the parts that need improvement, and then future research directions are considered.
4. Conclusions
In conclusion, assessment from the simulation and actual nightly data are presented, with the CBT from the Smart Magic Pillow compared with other methods—leading to a conclusive result that the Smart Magic Pillow can be a significant part of the Remote Healthcare System. Raw data from the sensors, including the three temperature sensors, humidity sensor and the pressure sensor, are encoded by a proprietary algorithm for data security and integrity from the BT host.
The encrypted and compressed zip data is reported to an agent by BT and transferred to the cloud server via HTTPS to the external Internet. The server program named “monitor” will recover the raw data by decryption and decompression by employing the proprietary algorithm and render the data to the administrator in a visual manner. If the administrator finds that the pillow is occupied for a period, but the sensed temperature is far from CBT, he or she might request real-time data from the pillow to confirm the observation and take necessary countermeasures to help the user.
If CBT from the pillow is determined to be relatively accurate, it is one key index of success for the system, while another is the accuracy in determining the user’s in-bed position. From Figure 12 and Figure 13, at the beginning the position changes dramatically, but the temperatures do not change significantly. Thus, one can only estimate the user is lying on a cushion, but it is less certain when there is a heavy cushion on the pillow. At least one area is always under pressure, but temperatures are constant—so this can result in the conclusion that is of concern to the user.
There are still ways to distinguish this cushion from the person. First, the cushion is not a heat source, but the person is, so the process of heat change is different, and the division of areas is designed for person, so the cushion could trigger more than one area. The cushion is just an example, as there are other things such as a computer, mobile phone, quilt, book, or other such items that could cause a similar situation but observing the change of temperatures in a section will help. With enough training data, a Machine Learning algorithm can be employed to identify the situation automatically.
The proactive monitoring mode is applied if observers believe it is an urgent situation, but it is not real-time, so the order must wait for the ”hello” message from the agent, which is explained in Figure 10. The interval for the agent saying “hello” to the cloud daemon will determine the level of real time responsiveness.
If the interval is small, the agent does not just occupy the available network resources, but also jeopardizes the service in the cloud server because the daemon services agents unnecessarily—leading to a distributed denial of service. A reasonable interval is set to the agents by the daemon according to resource utilization such as CPU, memory, bandwidth and so forth of the server, and the total number of clients.
The system is designed to be remote and contactless as key features to meet the requirement of the COVID-19 pandemic—but even afterwards, it will be practical for the elderly living in rural and remote areas. It will form a part of the solution of healthcare in country areas. Inclusive of improving the accuracy of measurement and judgement, future research will need to enhance the function of agent. Notably, any BT host can report data to the agent, so other sensors can be added to the system. For instance, the incorporation of a CO2 detector, when connected to the BT host, can add beneficial diagnostic information to the end user.
Additionally, data can flow in a bidirectional manner to control various equipment. As an example, an infrared remote-control blaster controlled by BT can activate various household electrical appliances such as an air conditioner, humidifier, or alarm. A communication paging function is also feasible, as anything related to health can be integrated into the system and interact with the cloud server instantaneously.
Further Work
In the future, at least two directions can extend the system. One is to employ more test objects to build a larger experimental pool once privacy concerns are considered, so we can find patterns of sleeping habits and more information about the patient—in so far that a sufficient data pool meets the requirements of machine learning. It is envisaged that an initial sample of thirty patients will be tested over a period of a month to gather more data, as well as the removal of personally identifiable information from the dataset to ensure privacy concerns are sufficiently addressed.
The other is connection of more equipment as the groundwork has been laid for a secure and stable system, so it is convenient to link more devices equipped with various sensors to the system by Bluetooth technology. This would improve the overall usability of the platform and make it more flexible for enhanced patient monitoring tasks, such as automatic data synchronization to supported smart watches, along with other novel biometric monitoring techniques.
Author Contributions
S.L. designed and developed the concept, simulation implementation, data analysis, and documented the results. C.C. provided conceptual and theoretical guidance, referencing and critical commentary. Both authors made substantial contributions in the writing and revising of the publication. All authors have read and agreed to the published version of the manuscript.
Funding
This research received no external funding.
Institutional Review Board Statement
Not applicable.
Informed Consent Statement
Consent was obtained from all subjects involved in the study.
Data Availability Statement
Data available on request due to privacy restrictions.
Conflicts of Interest
The authors declare no conflict of interest.
References
- Fox, R.H.; Solman, A.J.; Isaacs, R.; Fry, A.J.; Macdonald, I.C. A New Method for Monitoring Deep Body Temperature from the Skin Surface. Clin. Sci. Mol. Med. 1973, 44, 81–86. [Google Scholar] [CrossRef] [PubMed] [Green Version]
- Gunga, H.-C.; Sandsund, M.; Reinertsen, R.E.; Sattler, F.; Koch, J. A non-invasive device to continuously determine heat strain in humans. J. Therm. Biol. 2008, 33, 297–307. [Google Scholar] [CrossRef]
- Eshraghi, Y.; Nasr, V.; Parra-Sanchez, I.; Van Duren, A.; Botham, M.; Santoscoy, T.; Sessler, D.I. An Evaluation of a Zero-Heat-Flux Cutaneous Thermometer in Cardiac Surgical Patients. Anesth. Analg. 2014, 119, 543–549. [Google Scholar] [CrossRef] [PubMed] [Green Version]
- 3M. SpotOn Temperature Monitoring System Model 370 Operator Manual; 3M: St. Paul, MN, USA, 2020; pp. 1–13. [Google Scholar]
- Yamakage, M.; Namiki, A. Deep temperature monitoring using a zero-heat-flow method. J. Anesth. 2003, 17, 108–115. [Google Scholar] [CrossRef] [PubMed]
- Mazgaoker, S.; Ketko, I.; Yanovich, R.; Heled, Y.; Epstein, Y.; Savyon, M.; Itay, K.; Ran, Y.; Yuval, H.; Yoram, E. Measuring core body temperature with a non-invasive sensor. J. Therm. Biol. 2017, 66, 17–20. [Google Scholar] [CrossRef] [PubMed]
- Draeger Temperature Monitoring System. Available online: https://www.draeger.com/de_de/Hospital/Products/Accessories-and-Consumables/Patient-Monitoring-Accessories/Tcore-Temperature-Monitoring-System (accessed on 24 November 2020).
- Kitamura, K.-I.; Zhu, X.; Chen, W.; Nemoto, T. Development of a new method for the noninvasive measurement of deep body temperature without a heater. Med. Eng. Phys. 2010, 32, 1–6. [Google Scholar] [CrossRef] [PubMed]
- Feng, J.; Zhou, C.; He, C.; Li, Y.; Ye, X. Development of an improved wearable device for core body temperature monitoring based on the dual heat flux principle. Physiol. Meas. 2017, 38, 652–668. [Google Scholar] [CrossRef] [PubMed]
- Song, C.; Zeng, P.; Wang, Z.; Zhao, H.; Yu, H. Wearable Continuous Body Temperature Measurement Using Multiple Artificial Neural Networks. IEEE Trans. Ind. Inform. 2018, 14, 4395–4406. [Google Scholar] [CrossRef]
- Huang, M.; Tamura, T.; Tang, Z.; Chen, W.; Kanaya, S. Structural Optimization of a Wearable Deep Body Thermometer: From Theoretical Simulation to Experimental Verification. J. Sens. 2015, 2016, 1–7. [Google Scholar] [CrossRef] [Green Version]
- Tamura, T.; Huang, M.; Togawa, T. Body Temperature, Heat Flow, and Evaporation. In Seamless Healthcare Monitoring; Tamura, T., Chen, W., Eds.; Springer: Berlin/Heidelberg, Germany, 2018. [Google Scholar]
- Al-Khafajiy, M.; Baker, T.; Chalmers, C.; Asim, M.; Kolivand, H.; Fahim, M.; Waraich, A. Remote health monitoring of elderly through wearable sensors. Multimed. Tools Appl. 2019, 78, 24681–24706. [Google Scholar] [CrossRef] [Green Version]
- Ghayvat, H.; Awais, M.; Pandya, S.; Ren, H.; Akbarzadeh, S.; Mukhopadhyay, S.C.; Chen, C.; Gope, P.; Chouhan, A.; Chen, W. Smart Aging System: Uncovering the Hidden Wellness Parameter for Well-Being Monitoring and Anomaly Detection. Sensors 2019, 19, 766. [Google Scholar] [CrossRef] [PubMed] [Green Version]
- Shahbazi, Z.; Byun, Y.-C. Towards a Secure Thermal-Energy Aware Routing Protocol in Wireless Body Area Network Based on Blockchain Technology. Sensors 2020, 20, 3604. [Google Scholar] [CrossRef] [PubMed]
- Majumder, S.; Mondal, T.K.; Deen, M.J. Wearable Sensors for Remote Health Monitoring. Sensors 2017, 17, 130. [Google Scholar] [CrossRef] [PubMed]
- Li, S.; Chiu, C. A Smart Pillow for Health Sensing System Based on Temperature and Humidity Sensors. Sensors 2018, 18, 3664. [Google Scholar] [CrossRef] [PubMed] [Green Version]
- Li, S. Prediction of body temperature from smart pillow by machine learning. In Proceedings of the 2019 IEEE International Conference on Mechatronics and Automation (ICMA), Tianjin, China, 4–7 August 2019; pp. 421–426. [Google Scholar]
- Bergman, T.L.; Lavine, A.S.; Incropera, F.P. Fundamentals of Heat and Mass Transfer, 7th ed.; John Wiley & Sons: Hoboken, NJ, USA, 2011. [Google Scholar]
- Filipoiu, F.; Bogdan, A.; Cârstea, I. Computer-aided analysis of the heat transfer in skin tissue. In Proceedings of the 3rd WSEAS International Conference on Finite Differences—Finite Elements—Finite Volumes—Boundary Elements; World Scientific and Engineering Academy and Society (WSEAS): Stevens Point, WI, USA; pp. 53–59.
- Pompei, F. Ambient and Perfusion Normalized Temperature Detector. U.S. Patent US6056435, 2 May 2000. [Google Scholar]
- Sadun, A.S.; Jalani, J.; Sukor, J.A. Force Sensing Resistor (FSR): A Brief Overview and the Low-Cost Sensor for Active Compliance Control. Proc. SPIE 2016, 1001. [Google Scholar] [CrossRef]
- Port Forwarding Definition. PC Magazine. Available online: https://www.pcmag.com/encyclopedia_term/0,1237,t=port+forwarding&i=49509,00.asp (accessed on 25 November 2020).
- TCP Keepalive Mechanism. Available online: https://tldp.org/HOWTO/TCP-Keepalive-HOWTO/overview.html (accessed on 25 November 2020).
- ngrok Network Inspector. Available online: https://ngrok.com (accessed on 25 November 2020).
- MQTT Protocol Specifications. Available online: https://mqtt.org/ (accessed on 25 November 2020).
- Xie, C. Interactive Heat Transfer Simulations for Everyone. Phys. Teach. 2012, 50, 237–240. [Google Scholar] [CrossRef] [Green Version]
- Petrovicova, E.; Kamath, Y.K. Heat transfer in human hair. Int. J. Cosmet. Sci. 2019, 41, 387–390. [Google Scholar] [CrossRef] [PubMed]
- Incropera, F.P.; DeWitt, D.P. Fundamentals of Heat and Mass Transfer, 2nd ed.; John Wiley and Sons: New York, NY, USA, 1985. [Google Scholar]
- Engineering Toolbox, Thermal Conductivity of Selected Materials and Gases. Available online: https://www.engineeringtoolbox.com/thermal-conductivity-d_429.html (accessed on 24 November 2020).
- Teunissen, L.P.J.; Klewer, J.; De Haan, A.; De Koning, J.J.; Daanen, H.A.M. Non-invasive continuous core temperature measurement by zero heat flux. Physiol. Meas. 2011, 32, 559–570. [Google Scholar] [CrossRef] [PubMed]
Figure 1.
The diagram of ZHF, with the sensor with the silicone rubber and under the heater.

Figure 2.
The diagram of DHF, with the copper material situated around the rubber sponge.

Figure 3.
The diagram of the “Smart Magic Pillow”.

Figure 4.
The sectional diagram of the “Smart Magic Pillow”.

Figure 5.
Picture of the force-pad from RoxiFSR Inc., Changzhou, China (http://www.roxifsr.com/productinfo/1018397.html).
Figure 5.
Picture of the force-pad from RoxiFSR Inc., Changzhou, China (http://www.roxifsr.com/productinfo/1018397.html).

Figure 6.
The schematic diagram of the force-pad.

Figure 7.
The area code of the force-pad.

Figure 8.
The connection of all parties in the Remote Healthcare System.

Figure 9.
Interaction between the monitor and daemon.

Figure 10.
The data flow of the daemon responding to agent call.

Figure 11.
Simulation of the thermal distribution of the pillow.

Figure 12.
The distribution of the head position for a user.

Figure 13.
The measurement of temperature for the smart pillow.

Figure 14.
The heatmap of rest time (minutes) in nightly groupings.

Figure 15.
The distribution of the head position for user1.

Figure 16.
The heatmap of rest time (minutes) in nightly groupings (user1).

Figure 17.
The distribution of the head position for user2.

Figure 18.
The heatmap of rest time (minutes) in nightly groupings (user2).


Table 1.
Proven technologies that can meet direct connectivity.
| Name | Strength | Weakness |
|---|---|---|
| Port Forwarding | Common in routers | Security concerns, Use of public IP |
| KeepAlive | Persistent connection | Occupation of system resources |
| ngrok | Security tunnel, Inherent safer | Reliance on third party technology |
| Polling | Avoids most weaknesses | Persistent delay, Risk of potential race conditions |
Table 2.
Properties of materials related in the pillow experiment.
| Material Name | K (W/m·°C) | ρ (kg/m3) | C (J/kg·°C) |
|---|---|---|---|
| Hair | 0.37 | 1300 | 10,000 |
| Air | 0.026 | 1.17 | 1007 |
| Cellularized Rubber | 0.045 | 100 | - |
| Cotton Pillowcase | 0.077 | 245 | 1300 |
Table 3.
Proven Non-invasive Technologies for Temperature Measurement.
| Parameter | ZHF Method | DHF Method | Smart Magic Pillow |
|---|---|---|---|
| Heater | Yes | No | No |
| Initial Response | 10 min [8] | 20 min | Uncertain |
| Accuracy | 0.3–0.4 °C | 0.1–0.5 °C | 0.2 °C |
| Comfort | Low | Mild | High |
Publisher’s Note: MDPI stays neutral with regard to jurisdictional claims in published maps and institutional affiliations. |
© 2021 by the authors. Licensee MDPI, Basel, Switzerland. This article is an open access article distributed under the terms and conditions of the Creative Commons Attribution (CC BY) license (http://creativecommons.org/licenses/by/4.0/).
Share and Cite
MDPI and ACS Style
Li, S.; Chiu, C. Improved Smart Pillow for Remote Health Care System. J. Sens. Actuator Netw. 2021, 10, 9. https://0-doi-org.brum.beds.ac.uk/10.3390/jsan10010009
AMA Style
Li S, Chiu C. Improved Smart Pillow for Remote Health Care System. Journal of Sensor and Actuator Networks. 2021; 10(1):9. https://0-doi-org.brum.beds.ac.uk/10.3390/jsan10010009
Chicago/Turabian StyleLi, Songsheng, and Christopher Chiu. 2021. "Improved Smart Pillow for Remote Health Care System" Journal of Sensor and Actuator Networks 10, no. 1: 9. https://0-doi-org.brum.beds.ac.uk/10.3390/jsan10010009
Note that from the first issue of 2016, this journal uses article numbers instead of page numbers. See further details here.