1. Introduction
Knowing the location of people inside a building is very useful for many different scenarios (smart buildings, energy efficiency, emergency situations, obtaining patterns of movement, etc.). However, recently, capacity control in indoor spaces has become critical in the current situation in which we are living in, due to the pandemic. Being able to know, in an accurate way and in real time, the number of people who are inside a room is a relevant issue at present. In this work, we propose a new solution for this real problem in the university environment.
Indoor occupancy detection is a well-known problem that has been studied since the 1990s from different approaches as technology has evolved, with the first solutions using infrared sensors [
1], and more recent ones using radio frequency identification (RFID) [
2], near-field Communication (NFC) [
3] or Wi-Fi technologies [
4,
5]. Among them, the most studied are Wi-Fi technologies, mainly because no additional hardware is needed for their use. However, the main drawback that it presents is that the signal strength of a wireless device may change over time, making it difficult to operate. In addition, a high battery consumption is required in the user’s mobile phone because it needs to frequently scan the Wi-Fi signal. Other solutions combining hardware devices and algorithms for localization and tracking can be found in [
6,
7].
With respect to the other, more recent technologies, RFID [
2] has the disadvantage of requiring the installation of antennas, as well as receivers in user devices. On the other hand, the main drawback/difficulty of NFC [
3] is the need to be very close (<20 cm) to the NFC tags for them to work properly.
More recently, Bluetooth Low Energy (BLE) technology [
8] has also been used for both location and occupancy detection. This technology presents numerous advantages compared to the previous ones; it is included on most smartphones, is low-cost, has easy installation, low energy consumption, and therefore, requires only basic maintenance, is non-intrusive and has high performance. Some authors [
9] have used beacon systems for detecting the presence of people in different zones of a building but without an accurate people count by area. In particular, beacons are used for presence detection in smart homes. Other researchers [
10,
11] use beacons for indoor tracking. In [
10], the authors propose an architecture for a working environment composed of a few receivers in a fixed location and BLE tags for the employee. The main drawback of their solution is that employees could forget to carry their identification tag. In [
11], beacons are used for knowing the location of patients in an emergency zone in a hospital. In none of these studies is a control of the capacity of the rooms carried out. Moreover, precision is not critical for them, an approximate location by zones being acceptable.
Some approaches that use BLE technology for counting people indoors can also be found in the literature [
12,
13,
14]. Conte et al. [
12], pioneers in contributing solutions to count people based on BLE, require additional hardware (Ardunio) and do not use standard beacons. The authors in [
13,
14] are focused on finding out building occupancy for energy reduction, so precision is not important. We have also previously worked with BLE to calculate the level of occupancy in indoors spaces [
15]; in this work, we used triangulation algorithms to determine if a person was inside the classroom. In this case, strict capacity control was not so important; therefore, it was permissible to accept a small error of accuracy, which is not allowed in our use case now. This is why these algorithms do not have enough precision to be used in the control of the capacity of a classroom in COVID times. Our goal is to improve accuracy using a model based on artificial intelligence and machine learning techniques.
Using artificial intelligence and machine learning techniques for indoor location problems is not a new approach. There are several studies [
16,
17,
18] based on the combination of this type of technique together with the Wi-Fi signal for indoor location. Regarding the combination of BLE and machine learning, there was a recent study in which it was used for presence control, with the aim of use in emergency situations [
19]; in [
20], machine learning techniques are used to recognize patterns and occupancy profiles of office spaces, while in [
21], they are used to recognize movement patterns to optimize energy consumption. Our proposal is completely different from these, since in none of them is capacity control performed; moreover, for us, the accuracy of the model is a critical factor. Specifically, the model is not allowed to undercount. In those found in the bibliography, as they have different goals, this characteristic is not so important.
Therefore, our contributions in this research work are summarized as follows: (1) We have not found any approach in the literature that solves the problem of not exceeding the capacity in an indoor space using BLE together with machine learning techniques. (2) In addition, the model obtained ensures that it never counts less people than those in the laboratory. This is critical for COVID capacity control. We have not found any other research work in which this accuracy was achieved, nor has it been used for this recent problem.
We propose our work with a view to finding a system that is able to detect if the COVID capacity of a classroom is exceeded. This detection must be performed automatically and in real time. In this paper, we suggest and study three different prediction models using machine learning techniques—specifically, logistic regression, decision trees and artificial neural networks. In our case, the model will only be valid if the precision is high, and it counts, without error, all the people in the classroom. That is, we must ensure that the capacity is never exceeded. Therefore, it could be accepted that in some cases, it counts more people, but never less.
The paper is structured as follows. The next section describes our experiment and the different models obtained;
Section 3 shows the results, while
Section 4 draws the conclusions.
2. Materials and Methods
The main goal of this work is to control classroom COVID-19 capacity, in an automatic and very accurate way, to ensure it is not exceeded. In order to manage it, we use BLE technology and several machine learning techniques such as logistic regression, decision trees and artificial neural networks.
The experiment consists of determining if these techniques can be used for the purpose of indoor positioning, as well as making a decision on which of the proposed ML techniques achieves the intended goal of controlling the COVID capacity of a classroom, without exceeding it.
The model should be able to predict whether a person is inside a classroom from the distance information collected from the beacons placed in the faculty. In order to carry out the experiment, the laboratory with the highest student demand in the Faculty of Computer Science of the Pontifical University of Salamanca was chosen. Due to the characteristics of this laboratory (equipment, natural light, furniture), it is the one preferred by the students.
2.1. Data Gathering
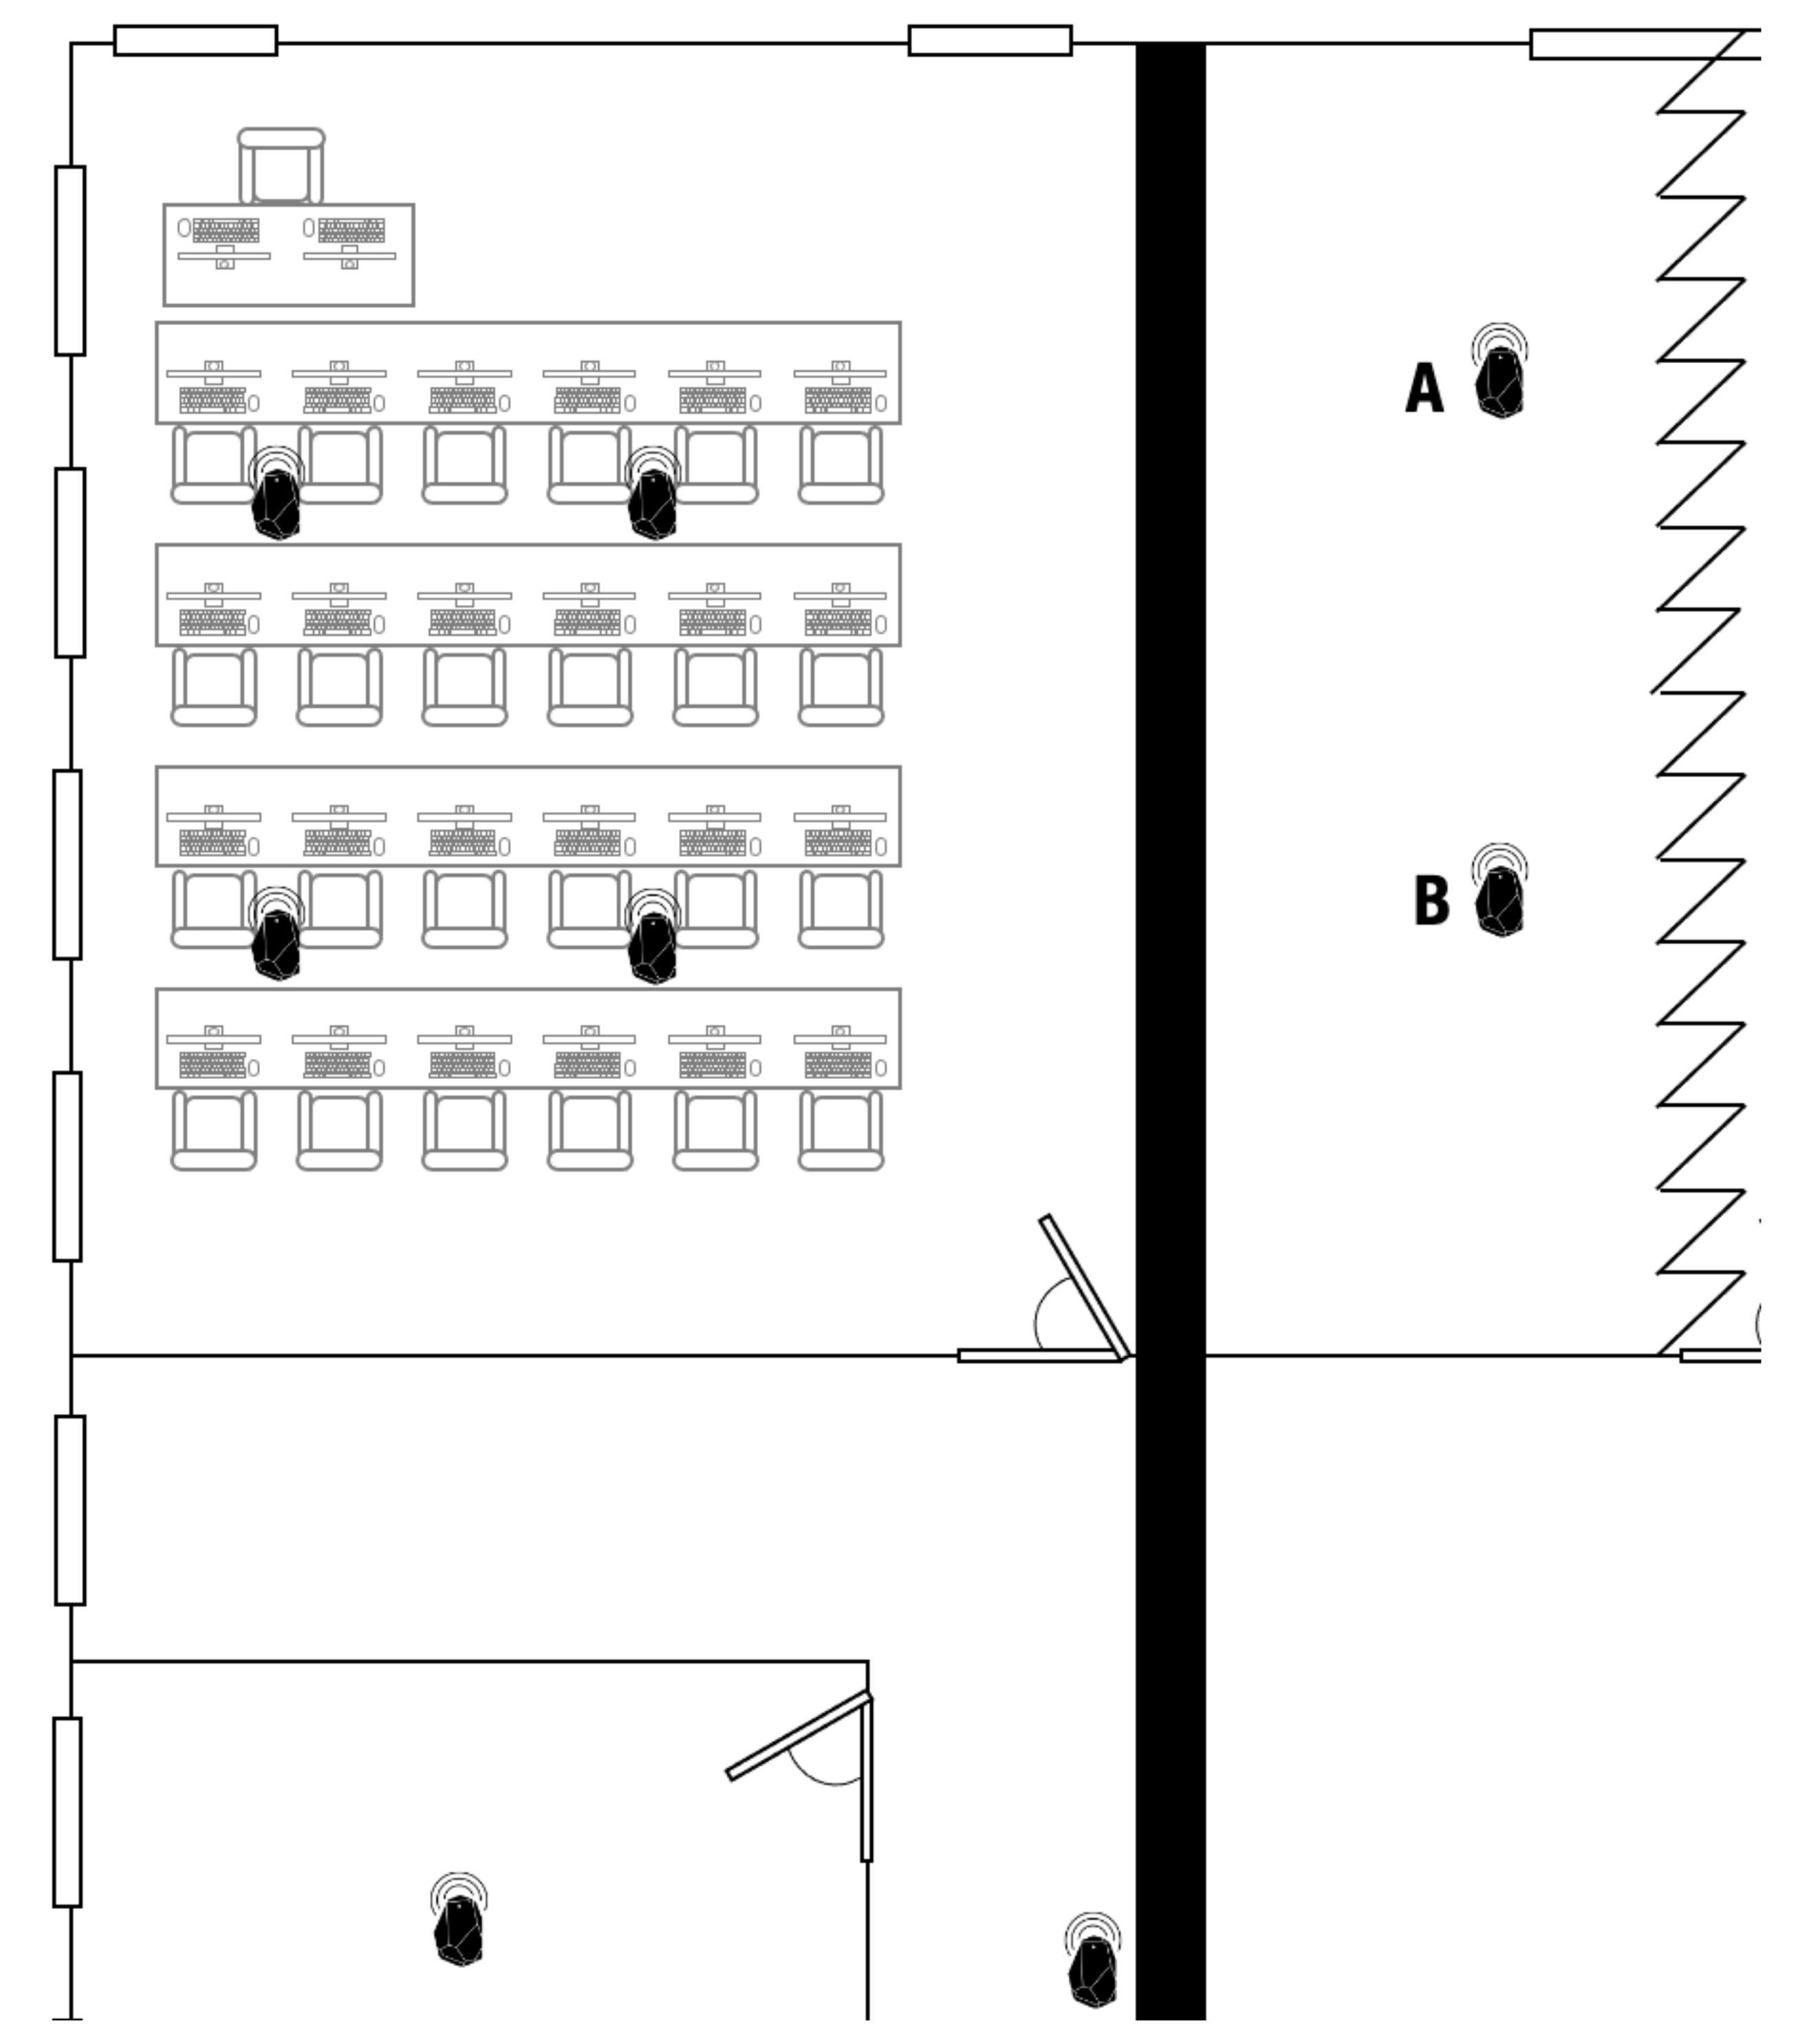
The first step in the study was data collection, which was used for obtaining the model. The beacons were strategically positioned in the laboratory in a way that they covered all of the seats of the room as shown in
Figure 1. For the placement of the beacons, the classroom was divided into four quadrants, discarding part of the side aisle and the back. The students use only the part of the classroom where the tables and computers are located. The beacons were placed so that this area was covered. Initial detection tests were carried out in all the classroom stations, with good results in the placement of the beacons. Moreover, some beacons were also placed in adjoining laboratories and classrooms so that information collected from these beacons could also be used in the model. Data gathering was performed by a mobile application that registered the distance of each of the detected beacons from the mobile. For beacons that were not detected by the mobile app, the value that was registered was a distance of 99 m; therefore, this value denotes that the beacon is too far to be perceived.
In this first phase, beacon distances were obtained by searching both laboratory and adjacent areas. Measures were gathered taking into consideration all possible environmental contexts. For instance, some measures were obtained with computers off, and others were obtained with computers on, in order to take into account the possible interferences with other signals produced when these computers are on. Data were collected by mobile devices—some of them were Android and others were iOS. In total, 488 measures were specifically registered. Part of them (298) corresponded to measures taken inside the laboratory and others (190) outside (adjoining laboratories and corridors). All information and data collected were exported to an Excel file for processing.
Before carrying out data processing, a cleaning pre-phase was performed. Specifically, some data were deleted due to the observation that beacons placed in the adjacent laboratory (A and B beacons,
Figure 1) were not detected from any point of the laboratory used for the experiment, nor from any other point in the corridors. That is why all data corresponding to these undetected beacons were deleted. This situation is produced, on the one hand, due to the high width of the wall that separates the adjoining laboratory from other dependencies, and on the other hand, because of the material with which this wall is built. This material is called Villamayor stone and the wall has a half meter of width; therefore, the signal sent out by the beacons cannot pass through this kind of wall. It should be pointed out that the historical building, where the Faculty of Computer Science is University is placed, started its construction in the beginning of the XVII century, and ended in the middle of the XVIII century; the wall where some beacons were located is one of the original walls built for isolating the building from cold and heat, and this is the main reason for the thickness of this wall.
2.2. Choosing Training and Test Data
From the previous data collection process, 80% of them are randomly selected to train the model and 20% to test the model. Repeated cross-validation is used to validate the model. This technique allows the quality of the dataset to be interpreted and the understand of whether the model is susceptible to data variations. The ROC metric (area under the curve) is used as a metric for this validation.
Both training and test data were picked in a random way using the R Studio tool for this task [
22]—specifically, the createDataPartition from the caret (classification and regression training) library developed by Kuhn in 2016 [
23]. The same training and testing sets were used for all the evaluated models, in order for all of them to be considered under the same conditions.
2.3. Obtained Prediction Models
In order to obtain the prediction model, three different approaches are proposed: a logistic regression model, a model based on a decision trees model and an artificial neural network. All of them are obtained by the R Studio tool and the Caret package. This package has a set of functions available that allows different classification and regression methods to be applied by employing a unify code; this fact makes its use and understanding easier.
As an endogenous variable of the model, the dentro (inside) variable is used. This variable can take two possible values, yes and no, denoting whether the person is inside or outside the laboratory, respectively. This dichotomous variable became a factor for utilization in different models. As exogenous variables, the distance measures from the mobile to each detected beacon are used, and the 99 m value is for beacons that are not discovered by the mobile. Therefore, there are not missed data in our model.
The hyperparameter optimization method used is the grid search method. This used method automatically creates a grid of tuning parameters and performs an exhaustive search over a subset of the hyperparameter space of a learning algorithm. A grid search algorithm must be guided by a performance metric—in our case, by cross-validation on the training set. This method is a computationally expensive option but guaranteed to find the best combination in the specified grid.
2.3.1. Logistic Regression Model
Firstly, a generalized lineal regression model is used; in particular, a logistic regression model is used for the prediction. This model is a regression method that allows the estimation of the probability of a binary qualitative variable based on quantitative variables. In spite of the fact that it is a regression method, one of its main applications is binary classification, such as how it is applied in this experiment. In this case, error evaluation is carried out by means of repeated cross-validation and as a metric, the area below the ROC curve. An ROC curve (receiver operating characteristic curve) is a graph showing the performance of a classification model at all classification thresholds. This curve plots two parameters: true positive rate and false positive rate. On the other hand, AUC stands for “Area under the ROC Curve” and measures the entire two-dimensional area underneath the entire ROC curve (integral calculus from (0,0) to (1,1)).
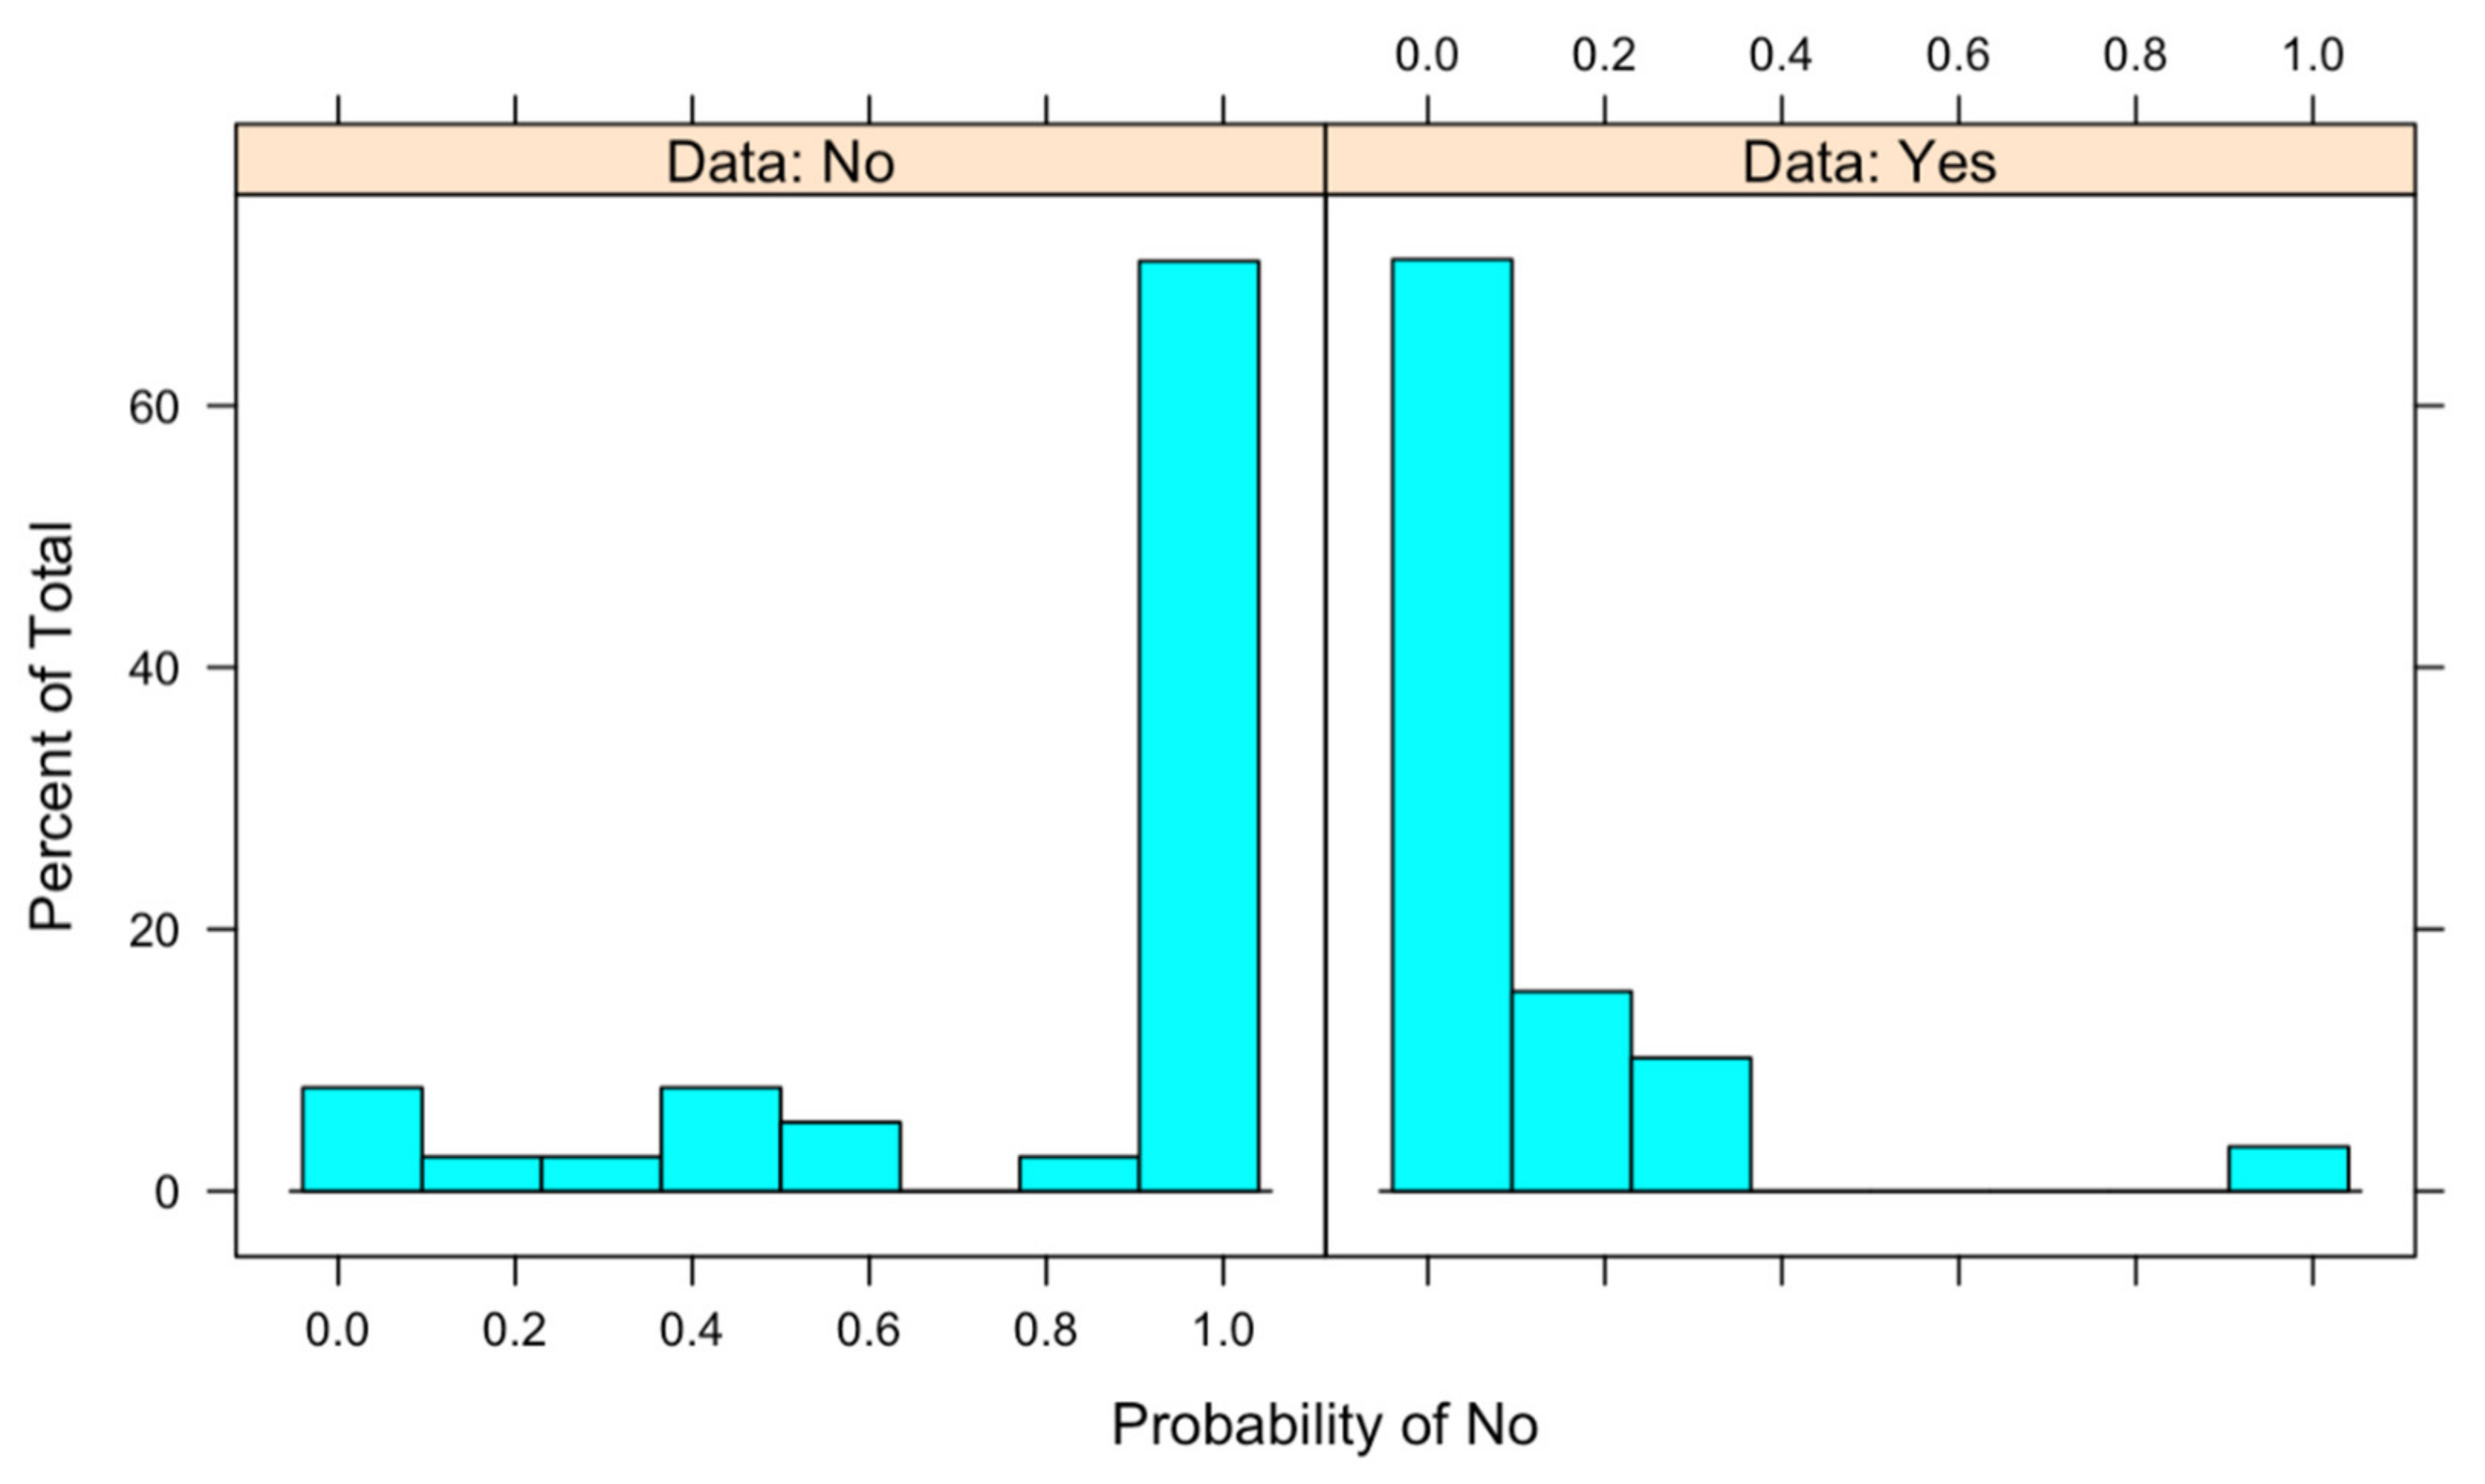
With the calculated model, the predictions about both test data and probabilities are obtained, obtaining the chart in
Figure 2. As we can observe in the chart, the model is suitable; moreover, the chart shows that the error probability of the model detecting No being Yes is higher than the opposite.
The obtained data of the probabilities are confirmed by observing the data of Sensitivity and Specificity, taking into consideration that ‘Positive’ Class: No. Considering that,
Sensitivity = ∑ True positive/∑ Actual positive;
Specificity = ∑ True negative/∑ Actual negative.
In these data, it is noted that the Sensitivity is far below the Specificity; that is, the capacity of our estimator to correctly detect people that are inside the laboratory is much better than for correctly detecting those that are not inside the laboratory.
Sensitivity: 0.7895;
Specificity: 0.9661.
The area under the ROC curve is also obtained in order to make a model comparison (
Figure 3). In this case, a value of 0.9429 is obtained.
2.3.2. Decision Trees
The second model used for predicting was Random Forest-type decision trees, which is a non-parametric supervised technique. As is known, this predictive technique uses a set of individual decision trees, each of them trained with a slightly different sampling produced by bootstrapping. The prediction of a new observation is obtained by adding predictions of individual trees that form the model. The evaluation of errors is realized by repeated cross-validation and the area under ROC curve is employed as a metric.
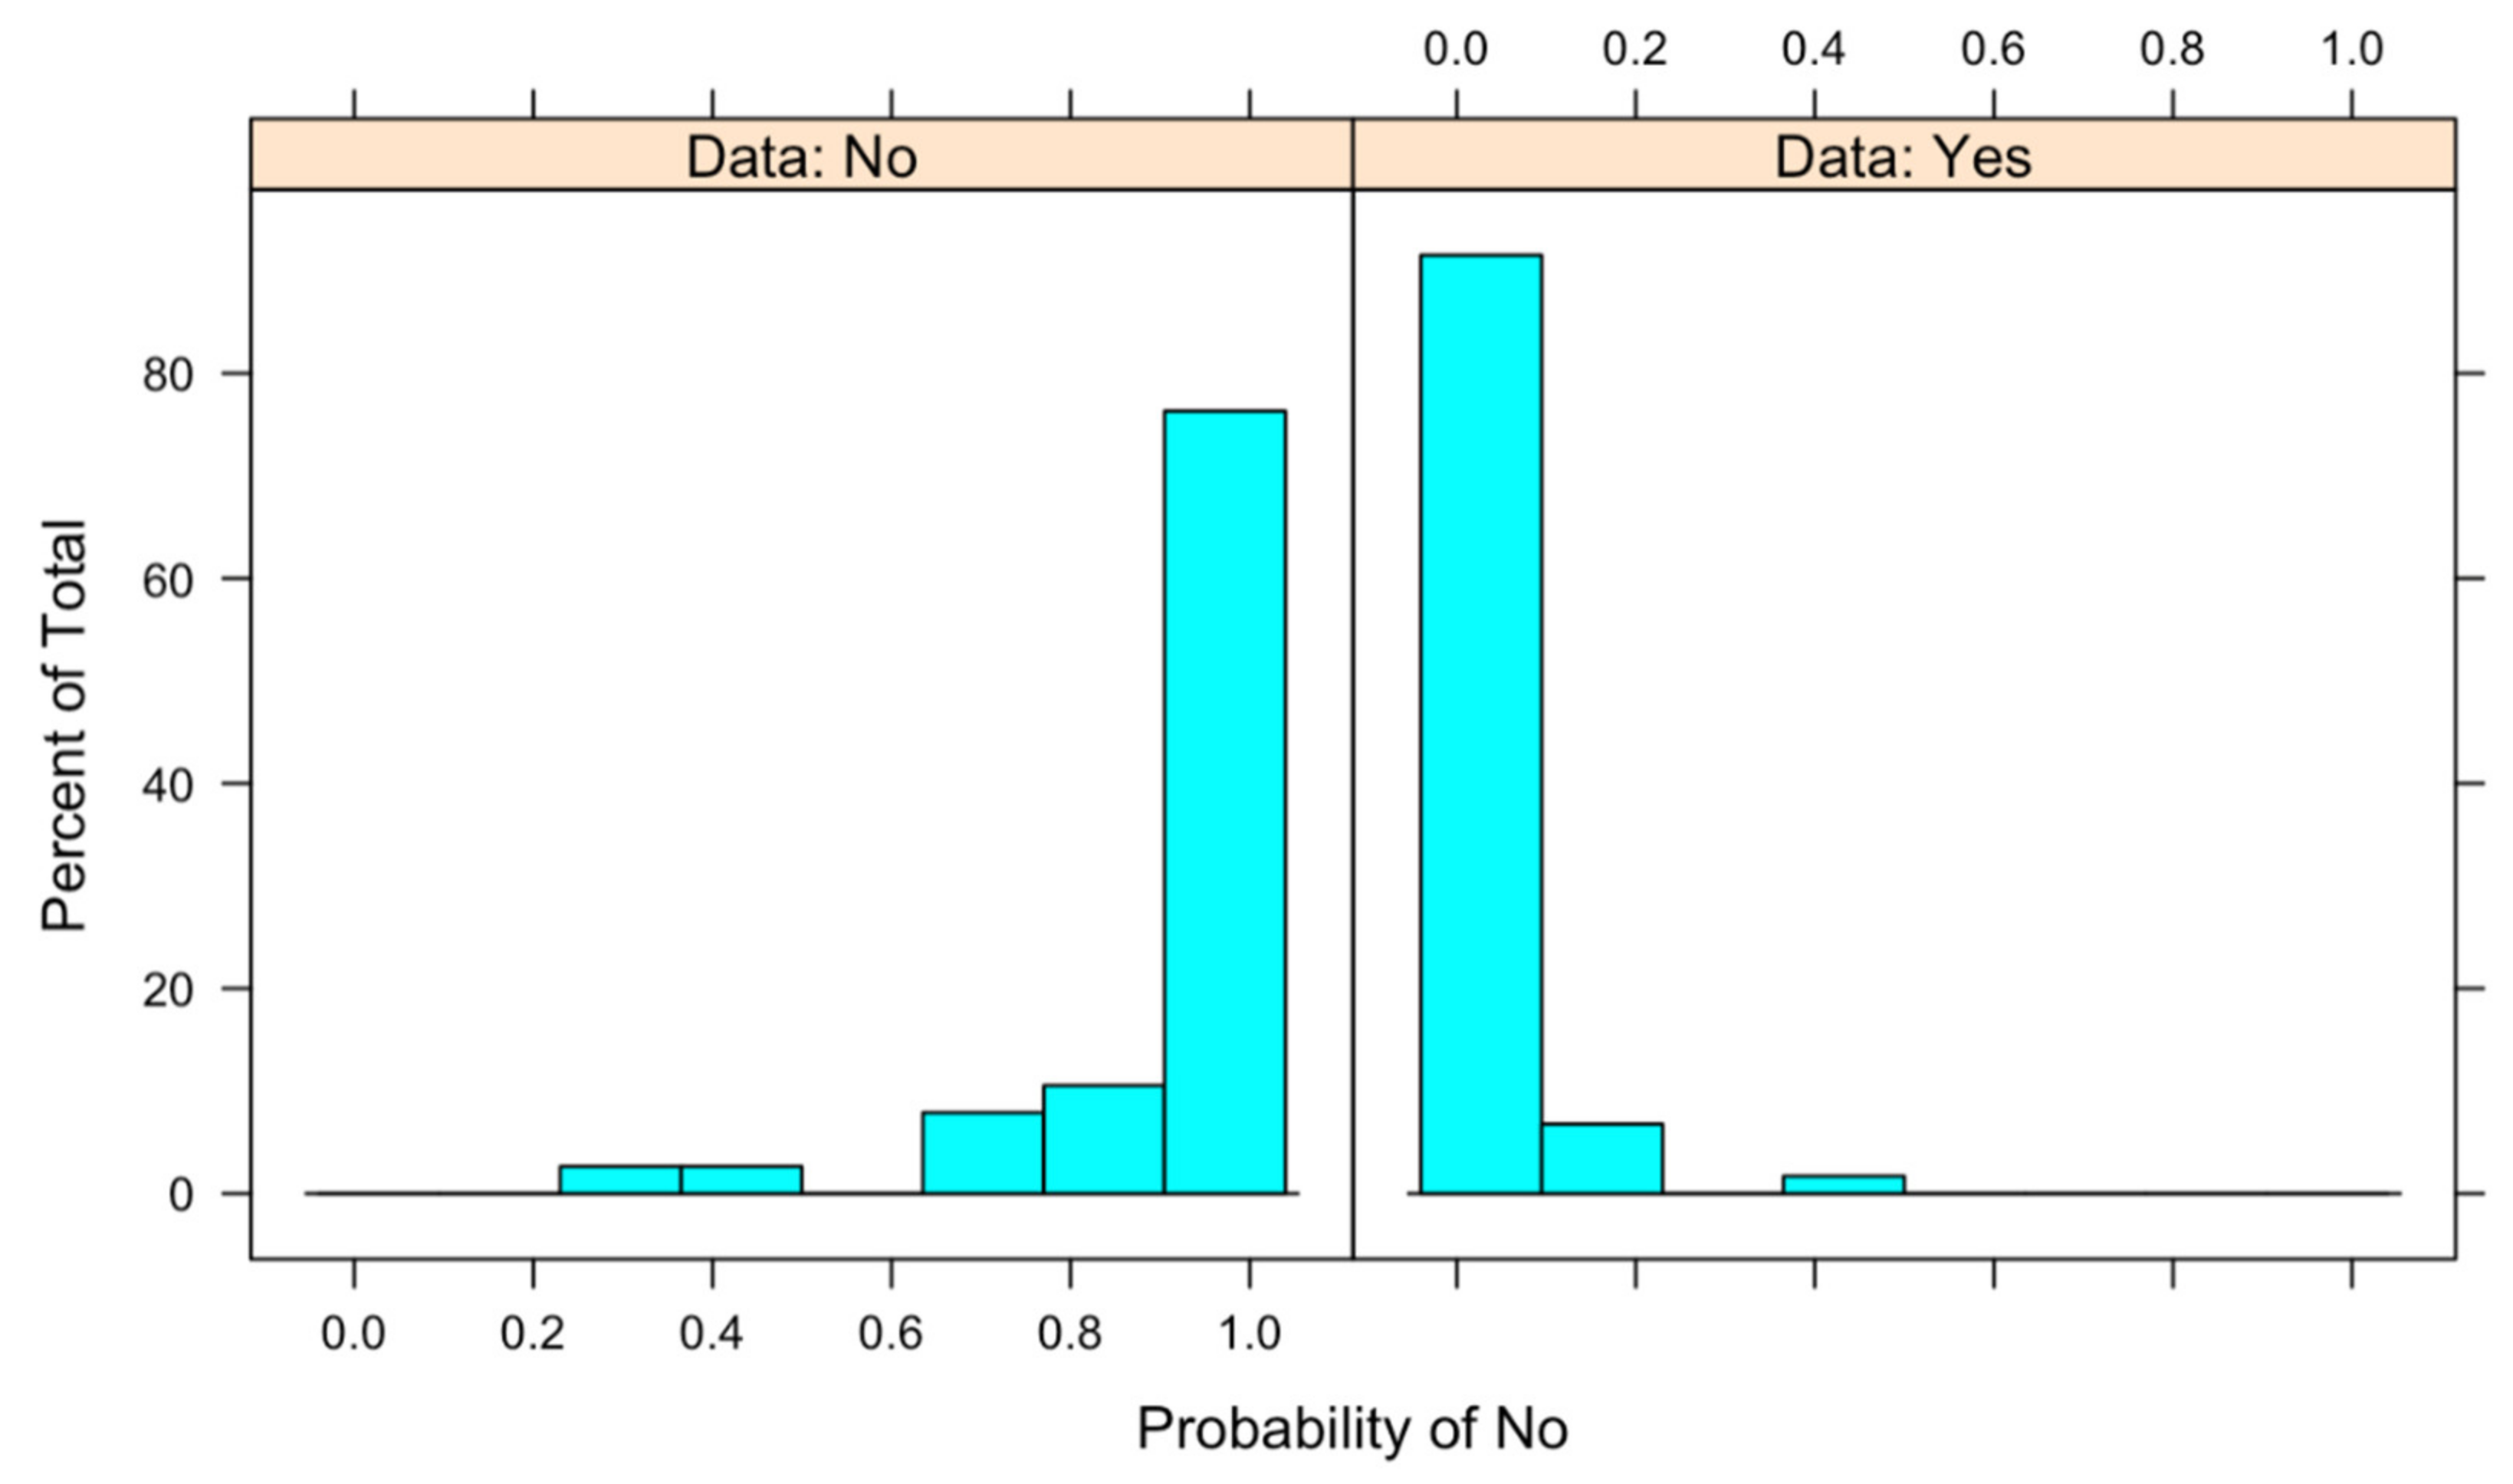
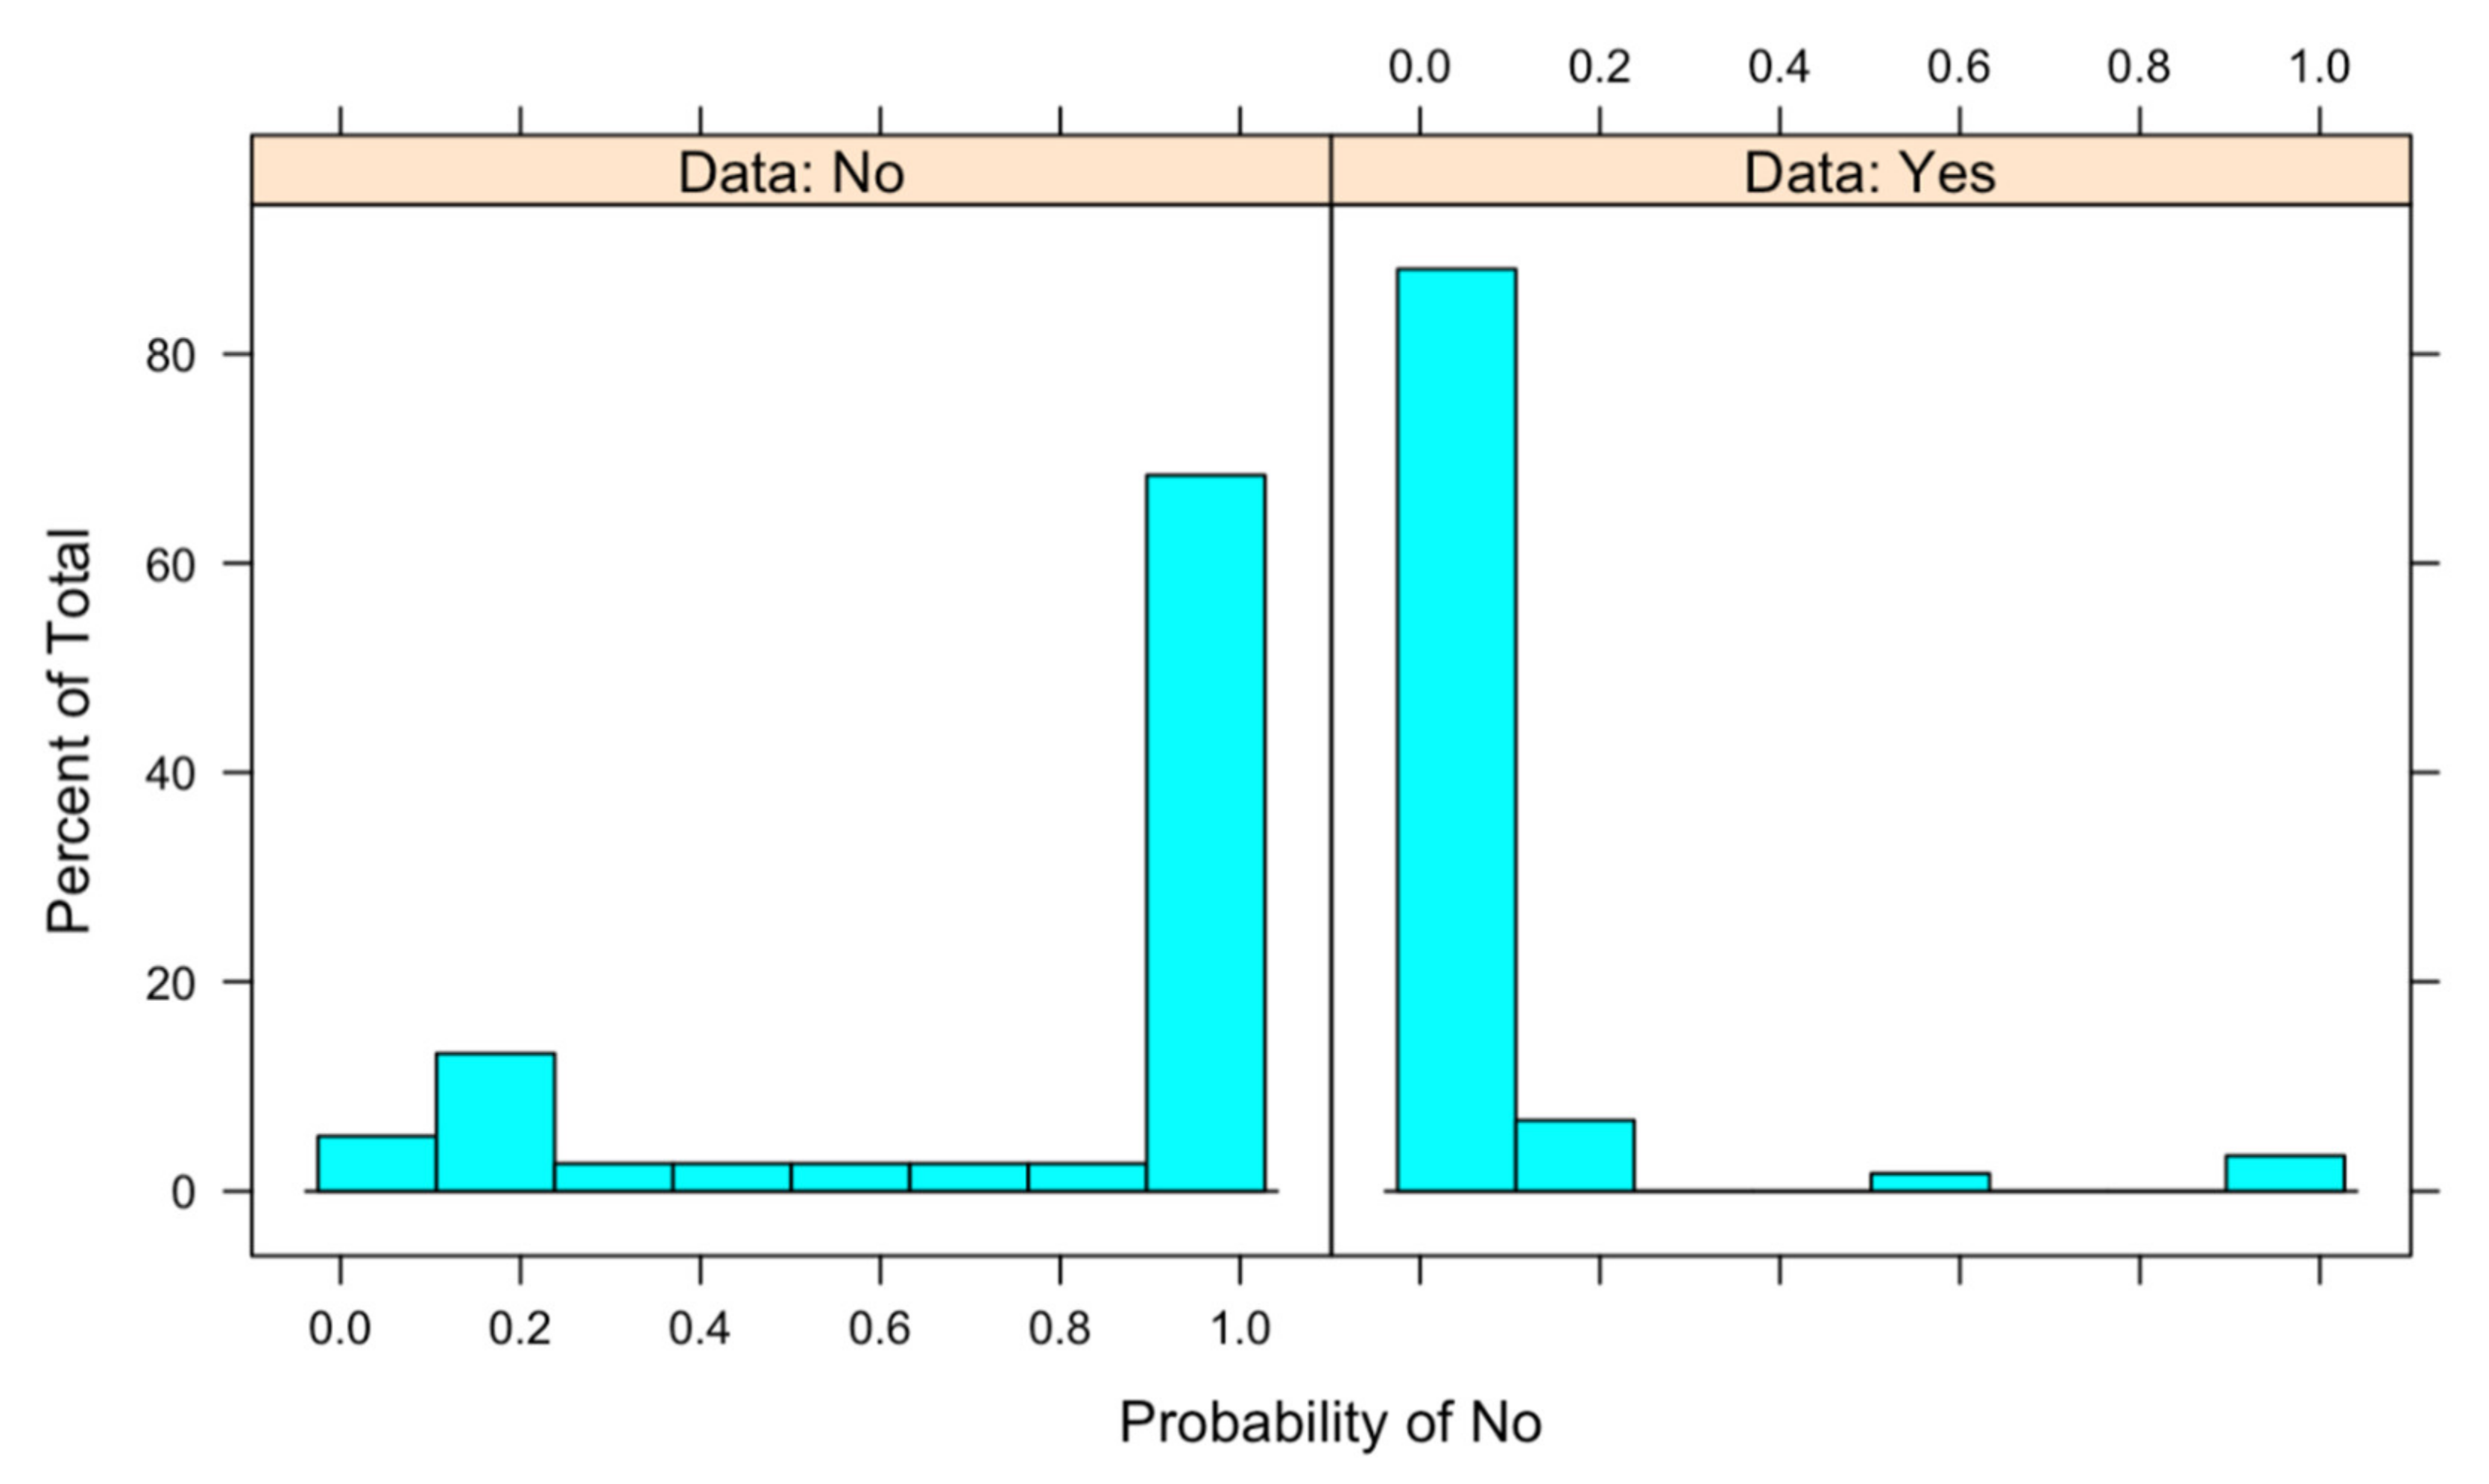
The predictions of the testing data are obtained through the calculated model. Additionally, a graph concerning how the probabilities are distributed is obtained, which is shown in the next chart (
Figure 4). In this figure, we can observe a probabilities histogram with better quality than the one generated by the logistic regression model.
Bearing in mind values of Sensitivity and Specificity, we can say that with this model, the Sensitivity is much higher than that obtained with the previous model, so the detection of those that are not inside the laboratory improves over the previous one. For the Specificity, a result of 1 is obtained; therefore, all cases that are inside the laboratory are detected correctly.
Sensitivity: 0.9474;
Specificity: 1.0000.
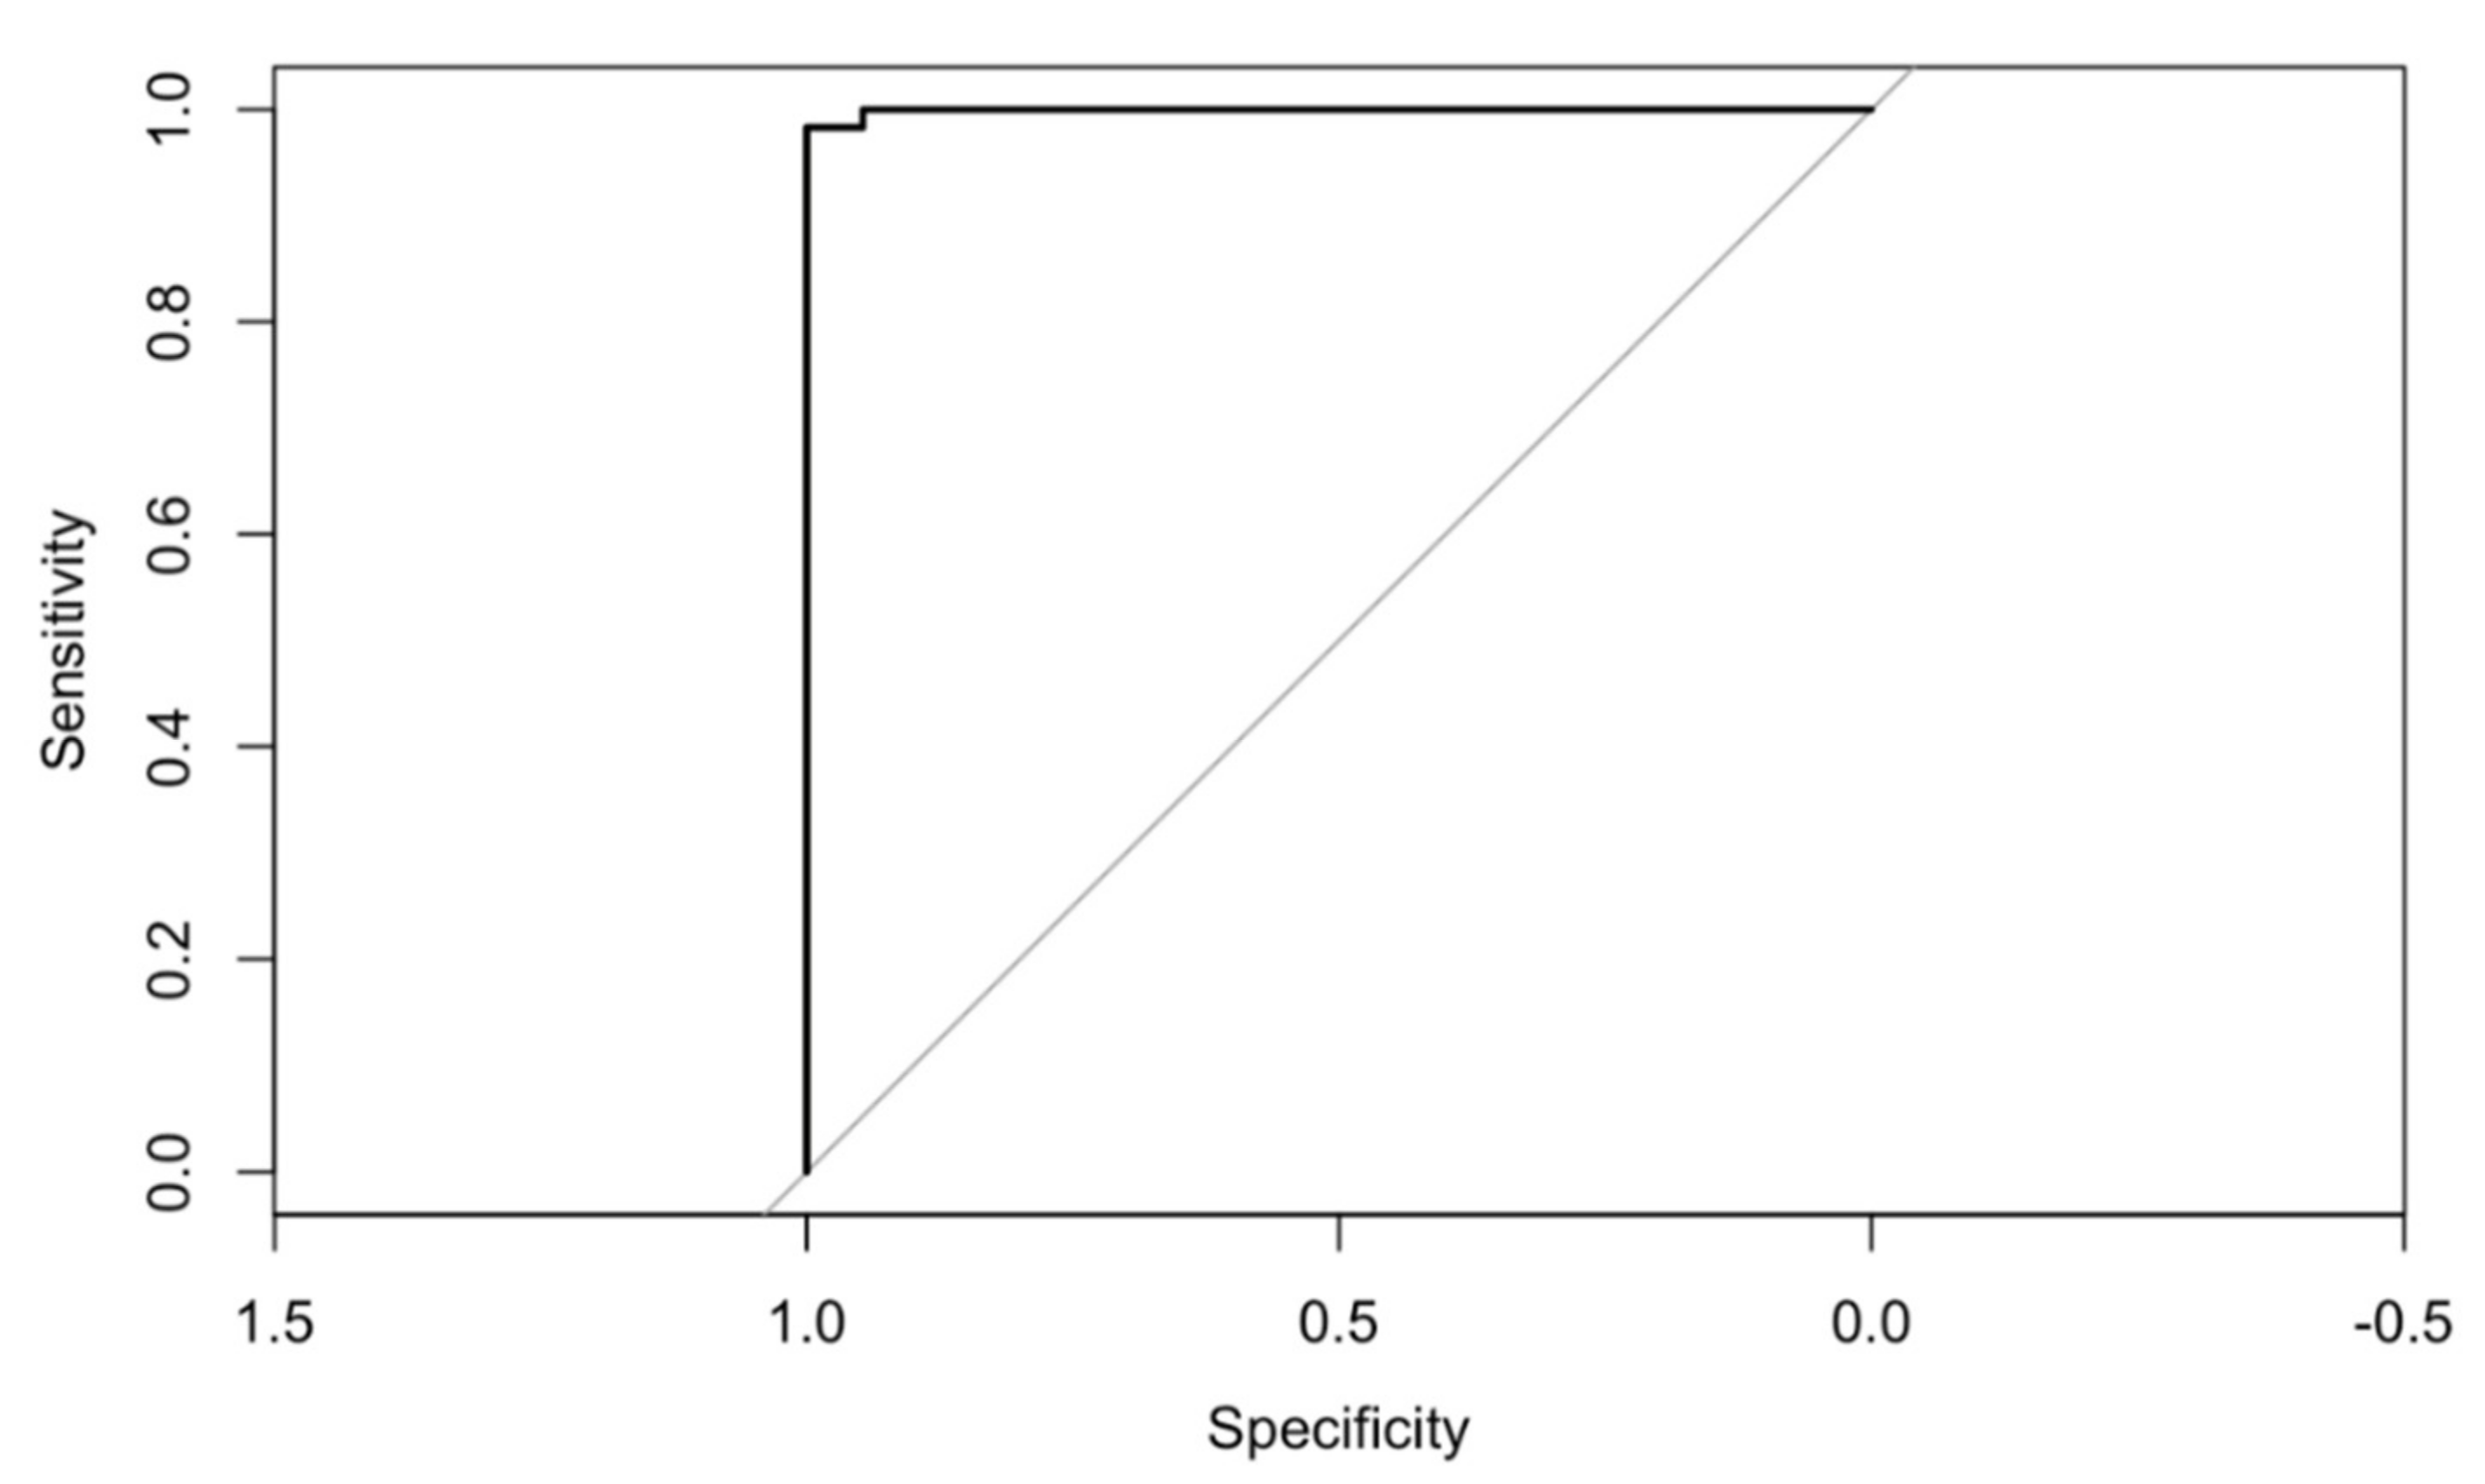
Regarding the ROC curve that is obtained for this model, its chart can be seen in
Figure 5, the value under the curve being 0.9991.
2.3.3. Artificial Neural Network
Finally, a predictive model using Artificial Neural Network techniques is calculated. Artificial Neural Network is an information processing system with a structure inspired by biological neural networks. These techniques work with artificial neurons that are combined to make up the network. In this network, a set of inputs produces an output, and this output depends on the different activated neurons of the network. The Radial Basis Neural Network was selected among other types of neural networks. This network is based on a multilayer network with forward connections that use functions of radial base as neuron activation functions. In order to evaluate the errors, repeated cross-validation is applied and the area below the ROC curve is also used as a metric.
Once the model is obtained, extractions of the predictions and probabilities about testing and training are performed.
Figure 6 shows the probabilities distribution histogram for this new model, in which we can again observe that the model works better in the case when people are inside the laboratory.
Regarding this model and Sensitivity and Specificity metrics, it can be observed that Sensitivity is still substantially lower than Specificity, obtaining worse data than those produced in the previous model.
Sensitivity: 0.7632;
Specificity: 0.9492.
Finally, the area under the ROC curve obtained in this case is 0.9759, having the following graph for the ROC curve (
Figure 7).
3. Results
The results obtained from the different models can be compared by obtaining the confusion matrix resulting from the validation of the model’s performance for each of them. The confusion matrix reflects the real cases (is it inside or outside the classroom) in the columns and in the rows, the model’s prediction of where it is found. In each cell of the matrix is the number of cases found when validating the model, the percentage of that case per row and the percentage of that case with respect to the total number of cases. The last column contains the number of total rows and the last row contains the number of total columns. The main diagonal reflects the model’s successes, while the secondary diagonal reflects the errors.
The three confusion matrices for each of the models obtained are shown below (
Table 1,
Table 2 and
Table 3).
The confusion matrix shows that our model is correct (success rate) in 89.7% of cases (58.8 + 30.9). The most frequent error is 8.2% and corresponds to the case in which it is not found inside the laboratory although it is predicted to be. The case with the highest success rate is no/no—it is not in the classroom and was predicted as such—with 93.8%.
The data of the confusion matrix of the Random Forest model (
Table 2) show that the success rate of the model is very high—97.7%. However, what is really important is that the model does not produce false negatives (the number of yes/no cases is 0), an essential condition for its validity in our case study.
Finally, if we analyze the data of the confusion matrix of the model using neural networks, we find that the success rate is 87.6, the lowest of the three. Furthermore, the percentage of false negatives is also the highest, making this model the worst approximation for our case.
4. Discussion and Conclusions
This paper presents a complete experiment in which Bluetooth Low Energy technology is used plus several prediction models based on machine learning techniques, such as artificial neural networks, regression models and decision trees (random forest) that are able to predict and monitor the COVID-19 capacity in classrooms in a university environment.
If we make a comparison of the three models, we can conclude that the model with the best fit for prediction is the Random Forest model. This is the best model for all the parameters studied: probability distribution, sensitivity and specificity, results of the confusion matrix and the area under the ROC curve (very close to 1). The data with which we performed the study were not balanced; this fact could have made the tree models perform better than the rest.
The confusion matrix for this model (Random Forest) presents only two prediction errors. Both errors occurred when people were outside the laboratory, but the model said they were inside. This type of error is considered insignificant, on the one hand, because the percentage error is very small, and on the other hand, because this error is not important for our purpose. When this error occurs, the system tells us that there are more people inside the laboratory than there are actually inside, but this fact is not critical in our case. The main objective is that the laboratory does not exceed the capacity limit in COVID-19 times.
In any case, we analyzed the two cases in which the model made erroneous predictions, finding that this fact occurred when the person was very close to the laboratory, i.e., when they were right next to the door in the hallway. It should be taken into account that the application running on each mobile phone periodically sends the distance to the detected beacons, so if the person in the corridor is finally entering or leaving the laboratory, the occupancy data will be correctly updated in the system at the next measurement.
The three explained models show that control using these prediction techniques is possible, obtaining satisfactory results in all cases. Nevertheless, the model obtained using the Random Forest algorithm stands out above the rest. This model is the only one among the three proposed models that is able to guarantee that the classroom COVID-19 capacity is never exceeded due to the model never counting less people than are actually inside. The obtained model using Random Forest is the only one that achieves both conditions. Additionally, it is the model with the best results in accuracy terms so that it is the model chosen and used for the system of counting.
The results obtained from the experiment show that by combining BLE technology and predictive models based on automatic learning, such as Random Forest, it is possible to control the capacity of enclosed spaces with high accuracy. This automatic control makes it possible to know and monitor the number of people inside enclosed spaces, a relevant issue in times of pandemics where a solution is required.
The high accuracy in our experiment is one of the contributions of the work. There are research papers that use a combination of BLE and machine learning techniques [
19,
20,
21] but, on the one hand, the purpose of the studies is different from ours. In these studies, the aim is either to detect presence without counting [
19] or machine learning techniques are used to detect movement or occupancy patterns [
20,
21]. Additionally, on the other hand, in none of them is the accuracy of the model critical, not allowing the error of undercounting. In addition, the use case in a university environment and adapted to the COVID-19 situation we are living in is also a contribution to highlight.
In future work, our aim is, on the one hand, to implement this system in the classroom or laboratory for which the prediction model was obtained and to analyze the results obtained in real time. On the other hand, we aim to extend the system to the rest of the Faculty’s classrooms, especially in classrooms where capacity control is a challenge to be solved.
Finally, this system has been implemented in a specific university context, but it could be extrapolated to other contexts where strict capacity control is required.


 ,
, 


