
A Survey of Outlier Detection Techniques in IoT: Review and Classification


IRIMAS, University of Haute-Alsace, 68000 Colmar, France
*
Author to whom correspondence should be addressed.
J. Sens. Actuator Netw. 2022, 11(1), 4; https://0-doi-org.brum.beds.ac.uk/10.3390/jsan11010004
Submission received: 28 November 2021
/
Revised: 21 December 2021
/
Accepted: 29 December 2021
/
Published: 4 January 2022
(This article belongs to the Special Issue Journal of Sensor and Actuator Networks: 10th Year Anniversary)
Abstract
:The Internet of Things (IoT) is a fact today where a high number of nodes are used for various applications. From small home networks to large-scale networks, the aim is the same: transmitting data from the sensors to the base station. However, these data are susceptible to different factors that may affect the collected data efficiency or the network functioning, and therefore the desired quality of service (QoS). In this context, one of the main issues requiring more research and adapted solutions is the outlier detection problem. The challenge is to detect outliers and classify them as either errors to be ignored, or important events requiring actions to prevent further service degradation. In this paper, we propose a comprehensive literature review of recent outlier detection techniques used in the IoTs context. First, we provide the fundamentals of outlier detection while discussing the different sources of an outlier, the existing approaches, how we can evaluate an outlier detection technique, and the challenges facing designing such techniques. Second, comparison and discussion of the most recent outlier detection techniques are presented and classified into seven main categories, which are: statistical-based, clustering-based, nearest neighbour-based, classification-based, artificial intelligent-based, spectral decomposition-based, and hybrid-based. For each category, available techniques are discussed, while highlighting the advantages and disadvantages of each of them. The related works for each of them are presented. Finally, a comparative study for these techniques is provided.
1. Introduction
The IoT can be seen as a collection of technologies that work together and provide Internet-based services and applications. With the aid of electronic devices connected to physical objects, heterogeneous sensors can collect data for process control [1]. The IoT involves many resource-constrained nodes that are deployed to sense, collect, and transfer data to a base station or a data center. In such a way, the appropriate decision can be taken in a controlled environment. IoT is utilized in various sectors, including environment monitoring, medical, agriculture, disaster warning, smart city, and manufacturing. However, the collected data in the real world are vulnerable to outliers, which are data samples that are considerably different from normal data. In IoT, an outlier may occur due to inherent characteristics of the sensor device itself, or because of the harsh environment where the nodes are deployed. Data quality could be affected by a sensor failure, noise, malfunction, missing or duplicated data values, etc. These outliers can also concern the exchanged network information relative to the network operation (i.e., sending and receiving messages). So, it is essential to detect these outliers before any in-network processing, like fusion or aggregated data, to limit the propagation of these incorrect data and conserve the collected data’s effectiveness to perform a suitable decision. To ensure network QoS, the IoTs must detect the outliers and take the necessary action to eliminate the degradation of the service. Moreover, IoT comes with the aspect of a high number of heterogeneous embedded devices that generate big data, which makes the outlier detection more complex against such massive data [2]. Furthermore, with the significant advancements in artificial intelligence (AI) techniques, anomaly tracking has also addressed a new trend in data collection and maintaining a high degree of confidentiality for the transmitted data. The power of the AI will have additional resources to protect vulnerable networks and data from faulty components. Subsequently, AI can then analyse network activities effectively, deduce a pattern, and identify all sorts of deviations or irregularities in its collected data. With such an approach, it is much easier to identify network anomalies quickly.
Outlier detection in IoTs and networks is widely used in a variety of real-world applications, as shown in Figure 1. For example, the Internet of Medical Things (IoMT) [3] is used widely in the healthcare domain. It monitors patients’ health continuously and gives remote assistance and alarms in time of any modifications in defined conditions [4]. Furthermore, in the industrial domain, sensors are built into machines to monitor resource management, as well as there being many variables, such as temperature, humidity, and pressure to detect events and trigger suitable alarms [5]. Another example is the Manufacturing Internet of Things (MIoT) [6] for analysing industrial big data in real-time. Moreover, in the agriculture domain, sensors are deployed in a harsh environment to monitor and collect many variables like temperature and humidity in real-time [7]. In the security domain, the outliers or abnormal values may be an attack that would threaten the network security [8]. In smart city applications, outlier detection techniques can be used in many situations, like monitoring water quality. It provides real-time information and warnings to control water pollution [9]. In the financial domain, it is crucial to monitor the audit logs for the financial transactions stored in a database, then to report and verify the abnormal behaviour detected in data [10].
Therefore, studying the outlier detection approaches of sensing data in IoTs is both scientifically and practically valuable. The aim of this work is to provide a comprehensive literature review of previous and current outlier detection techniques used in IoT. Our methodology to establish this review is as follows:
- We select papers between 2010 and 2021 (80 papers) from the leading scientific online databases (MDPI, Science Direct, SpringerLink, IEEE Explorer, ACM Digital Library, etc.). Moreover, we consider some required and original papers before 2010 (13 papers). The papers are selected based on the following research keywords: outlier detection, outlier classification, anomaly detection, anomaly classification, WSN, IoT.
- We take the most relevant articles that focus on the outlier detection techniques in WSN/IoT.
- We take the most relevant articles that focus on the classification of outlier detection techniques in WSN/IoT.
The main contribution of this paper can be summarized as follows:
- The fundamentals of outlier detection in IoT are provided while discussing the different sources of an outlier, the approaches that can be adopted, and how we can evaluate an outlier detection technique.
- A summary of the challenges that can face the design of an outlier detection solution for IoT is provided.
- A comparison and discussion of the more recent outlier detection techniques are presented and classified while:
- –
- The main seven categories of outlier detection techniques are highlighted by showing the advantages and the disadvantages of each of them.
- –
- The related works of each category are presented.
- –
- The study of the spatial-temporal correlation for outlier detection techniques in IoT is provided.
The rest of the paper is organized as follows: In Section 2, the fundamentals of outlier detection in IoT are defined. In Section 2.5, the main challenges of outlier detection in IoT are discussed. In Section 3, the outlier detection techniques for IoT with the recent related works are classified and discussed. In addition, comparison tables of the different techniques are provided. In Section 4, a comparative study of the classified techniques is summarized. In Section 5, the conclusion is provided while discussing some future works.
2. Outlier Detection Fundamentals in IoT Context
In this section, we will provide some definitions of an outlier in wireless sensor networks (WSN) and IoT and differentiate the three types of outlier sources. Then, we will talk about the outlier detection approach, and finally, we will talk about how we can evaluate outlier detection techniques.
Firstly, let us give some common definitions of an outlier. In WSNs, outliers can be defined as: “measurements that vary considerably from the typical pattern of sensed data” [11]. In the context of IoTs “an outlier is data value that is considerably different from other data values, or does not correspond to the predicted normal behaviour, or conforms well to a defined abnormal behaviour” [12]. Another definition is provided by [13] where spatial-temporal outliers are defined as “a spatial-temporal data value whose non-spatial attribute values are considerably different from those of other spatially and temporally referenced data values in its spatial or/and temporal neighbours”.
2.1. Sources of an Outlier in IoT
There are three sources of an outlier in data collected in IoT and therefore three corresponding outlier detection techniques [1]. These sources are error and noise, events, and malicious attack, as summarized in Figure 2 and described below:
- Error and noiseThe sensors are generally deployed in a harsh environment so that they are exposed to interference such as noise. An error means noisy data measurement or data that come from a faulty node. This means values that differ greatly from the true state of the phenomenon being measured. Outliers resulting from errors are more likely to occur often, while outliers resulting from events appear to have a very low probability of occurrence [14]. Normally, the error values are represented as a random change and are greatly different from other data. These errors may affect the gathered data quality, and thus must be detected. In addition, if they are faulty or noisy data, they will be corrected or discarded to keep the energy of the sensor.
- EventWe can talk about an event while finding the data values that represent a change in the real environment state, compared to the predefined normal behaviour. Events may occur due to a gradual or sudden change in the real environment, as a temperature change caused by air pollution, forest fire, chemical spill, flood, earthquake, volcanic, etc. It is very important to distinguish between errors and events, because faulty sensors may give false events, so it is difficult to differentiate them. Thus, the outlier detection techniques need to depend on the reality that noisy measured data values and sensor failures are likely to be randomly unrelated to each other. Meanwhile, event measurements are likely to be geographically correlated [15]. As marked in [16], an event is a “succession of outliers or erroneous data values in data streaming”. So, the events must be detected and treated because they have important information.
- Malicious attackThe third source of an outlier is the malicious attacks, which can be defined as a security threat to the network. There are many types of attacks on the sensor node. The attacked node will behave as a normal node and give unreliable data values in the network. This will affect the whole functionality and the performance of the system. These attacks must be treated in the intrusion detection techniques, which are out of the scope of this paper.
Besides, it is possible to group outliers into three groups as the following:
- Point outliers: an individual data value that is deviated from the standard data values pattern. Those forms of outliers can easily be recognized.
- Contextual outliers: a data value that deviate from the standard pattern in a particular context.
- Collective outliers: a group of related data values which deviate from the whole data set.
2.2. Outlier Detection Approach
This subsection will discuss different existing approaches adopted to design an outlier detection solution. As summarized in Figure 3, these approaches allow defining if an outlier detection is for errors, events, or both, and if it is a centralized/distributed, online/offline, supervised/unsupervised solution. Furthermore, it considers whether the solution concerns one or many data-collected attributes, while considering the correlation between these attributes.
- Outlier detection and event detectionFrom Figure 2, we could notice that event detection is part of outlier detection, but there are some differences between them in the IoT context. These differences can be listed as follows:
- When detecting outliers, there is no previous knowledge of trigger conditions or semantic of any event. Meanwhile, there is a trigger condition or specific event semantic provided by the central node in detecting events.
- Detecting outliers need to compare sensor data values with each other. Meanwhile, detecting events need to compare sensor data values with the trigger condition or predefined pattern.
- Detecting outliers need to avoid classifying normal data as outliers to maintain a high detection rate (DR) and low false alarm rate (FAR). Meanwhile, detecting events need to avoid considering the erroneous data values that conform to the predefined state or condition of the event to affect the detection’s reliability.
- The sensor nodes must report an event once it happened to the base station node on time.
- Distributed detection and centralized detectionDistributed outlier detection techniques detect outliers at the sensor node. Meanwhile, centralized outlier detection techniques identify outliers at the parent node, cluster head, or base station. With the distributed method, the transfer of raw sensor data values can be reduced, allowing one not to broadcast the entire data to the base station. Besides, the node deals with its data values and sends only some parameters, which leads to using network resources, such as power and bandwidth, in a highly efficient way. However, distributed outlier detection accuracy might not be as good as centralized detection, due to a lack of appropriate sensor data for modelling purposes [17].
- Online and offline detectionThe online detection detects outliers in real-time or near real-time. Meanwhile, offline detection detects outliers after collecting a massive amount of sensed data values from the sensors. The offline detection is not suitable for WSN because the distributed streaming data require online processing.
- Supervised and unsupervised detectionThe supervised techniques characterize all the outliers and the non-outliers depending on the model built using the pre-labelled data in the training phase. These pre-labelled data mean the need for specific predefined data in the training phase to create a normal or abnormal data model before detecting outliers. These supervised techniques may be helpful for intrusion detection applications. However, it is crucial to notice that these pre-labelled data are not easy to obtain or unavailable in many real-life IoT applications. In addition to the enormous online streaming data coming, the supervised model may be valid for specific time instances, but invalid for other time instances. The unsupervised techniques do not require pre-labelled data, but they utilize specialized metrics to identify outliers. For example, some techniques use distance measures, while others use a familiar statistical distribution model.
- Multivariate Data and univariateIn the univariate data, the data value has a single attribute, whereas, in the multivariate data, the sensor data value has many attributes. Thus, we have an outlier if the data value has abnormal values in its attributes. The outlier detection technique must be able to deal with the multivariate data and consider their correlations. It must also consider the complexity of computations of these multivariate data. Otherwise, the technique will not be suitable for IoT applications.
- Correlation of DataIn sensor data, two types of correlations can exist:
- Correlation between data attributes.
- Correlation between the observations of the sensor node itself and its neighbouring node observations.
The sensor data attributes are generally correlated; for example, the correlation between temperature and height. On the other hand, in densely deployed WSNs, these collected data appear to be correlated temporally and spatially. The spatial correlation indicates that data values obtained from geographically adjacent nodes appear to be quite close. The temporal correlation indicates that consecutive sensor measurements collected from a single node appear to give similarity in a time interval.
2.3. Sensor Failure Detection Strategies in IoT
As described in Section 2.1, an outlier can be due to a faulty node. There are three main strategies to identify sensor failure, as showed in Figure 4:
- Network-level strategy: with this strategy, the aim is to monitor the data at the network level to detect any failure in the sensors. The Markov models can be used to characterize the behaviour of the normal and the abnormal sensors, where the sensors can monitor each other in the IoT situation.
- Homogeneous strategy: the aim here is to use many spatially correlated similar sensors to detect any abnormal sensor behaviours. We use the Auto-Regressive Integrated Moving Average (ARIMA) time-series model [18], which compares the data value measured by the sensor with predicted measured.
- Heterogeneous strategy: the aim here is to group different sensors to detect the sensor’s failure by classifying the sensors data values output. The Outlier Detection Module (ODM) proposed in [1] is an example of a heterogeneous strategy in IoTs, where the heterogeneous sensors are connected to this module and to a microcontroller, and they send their sensed data values to both. The microcontroller will monitor the data received from the sensors while running the multi-agent deep reinforcement learning-based and distributed outlier detection on the module to identify the outliers.
2.4. Evaluation of Outlier Detection Techniques in IoTs
Outlier detection for IoT aims to detect outliers and differentiate with high detection rate (DR) and low false alarm rate (FAR) between errors and events. The efficient outlier detection technique must respect the IoT resource constraint devices, such as the computational cost, memory usage, and communication overhead. The DR is the percentage of abnormal data values that are considered as outliers correctly. The FAR is the percentage of normal data values that are considered as outliers incorrectly. Another way to measure the efficiency of an outlier detection technique is to use the receiver operating characteristic (ROC) curve [16,17,19], which is a two-dimensional graph that represents the trade-off between the DR and the FAR. Figure 5 shows a generic illustration of how to interpret this curve by different fictional approaches. The efficient technique is the one that has high detection rate and low false alarm rate with a large area under the curve (AUC). From Figure 5, we can say that approach 1 (ideal approach) realizes the best performance compared to other ones.
There are other ways to evaluate an outlier detection technique, such as the computational cost, memory and storage usage, battery usage, etc.
2.5. Outlier Detection Challenges in IoT Context
Developing an effective outlier detection technique is more difficult due to the IoT context and the sensor data nature. The IoT ecosystem encompasses the traditional WSN, which allows more analysis and processing of the collected data [20]. However, as shown in Figure 6, there are numerous challenges encountered while designing an outlier detection system for IoT.
- Taking into consideration contextual information, which includes the spatial-temporal correlations of sensed data values and the external context of data [21].
- The majority of the existing techniques are for univariate data. Meanwhile, they should consider the multivariate data where each data value has many attributes.
- The outlier detection technique in IoTs must consider how reducing the consumption of the available resources such as memory, energy, and communication bandwidth.
- Due to the nature of sensor devices, they are subjected to failure, missing, duplicated data or may be affected by noise. So, it is crucial to detect outliers and distinguish between errors, events, and malicious attacks, while not losing important events by considering them as errors.
- Because of the lack of previous knowledge about data distribution, the outlier detection technique should be non-parametric.
- The prelabeled data is not always available or not easy to obtain, so the outlier detection technique should be unsupervised.
- Sensors are susceptible to environmental changes such as humidity and temperature. In addition, they are also vulnerable to dynamic network topology changes, communication failures, and the non-stationary of streaming data.
- It is essential to process data as soon as possible to take the necessary decision. So, detecting outliers should be in a distributed manner or fog computing manner. As a result, unnecessary communications will be reduced, which will lead to low energy consumption and extend the network lifetime.
- Another challenge facing the design of an outlier technique is to be an online one. Offline detection can be applied to the past recorded collected data. Meanwhile, the online detection runs on data as they arrive in real-time, so that outliers can be detected directly, which will reduce the detection time. Thus, the outlier detection technique should operate online to deal with distributed real-time streaming data (or near real-time) applications. We notice that some techniques start to work offline to build the right model to work after in an online manner. The techniques which work totally in an offline mode are not suitable for sensor data.
- Because of the large amount of coming streaming data values, it is efficient and easier for analysis to deal with data using incremental windows instead of dealing with the whole data set.
- Because of the large number of sensor nodes deployed in the environment, the outlier detection technique in IoT needs to scale well to process a considerable amount of coming streaming data values in an online manner.
- The different types of malicious attacks add a significant challenge to the design of outlier detection techniques in IoT.
- Each technique is suitable for a specific application and it may not be possible to reuse it in other domains. Thus, the outlier detection technique should be generalized to be easily reused and deployed for many applications.
- Another challenge is to make the appropriate choice of threshold, sliding windows size, the neighbourhood threshold, and the cluster radius during the design of the outlier technique.
- They should be simple to implement, with low computational cost and high energy efficiency.
3. Outlier Detection Techniques in IoT
In the literature, many related works are proposed for classifying outlier detection techniques. For example, authors in [11] classify the techniques based on application domains, problem characteristics, and different research domains; for example, statistics, data mining, machine learning, etc. In [17], authors classify outlier detection techniques in a taxonomy suitable for WSN as the following: statistical, nearest neighbour, clustering, classification, and spectral decomposition. In [1,22], authors present a classification for outlier detection techniques in WSN, which is like the one presented in [17], but they add the artificial intelligence-based category. In [23,24,25], authors present a taxonomy of machine learning techniques for outlier detection in IoTs. They classified the existing techniques into four categories: clustering, classification, dimensionality reduction, and hybrid algorithms. In [26], the authors proposed a global classification review about the progress of outlier detection techniques. They provide the performance, the pros, the cons, and the challenges which face these techniques. However, it is a general survey about outlier detection techniques and not specified for IoTs or WSN.
In addition to the classification of the outlier detection techniques, authors in [27] proposed a methodology for outlier detection in IoT through a systematic analysis of the data set based on five stages. The first stage is to define a scenario of generating a labelled dataset using mathematical modelling on a real IoT system. Then, in the second stage, the aim is to capture data packets and inject anomalous packets by modifying some of them. The third stage is to reinsert these packets into the network. After that, the fourth stage concern sniffing the data to study, analyse and generate a model to show the behaviour of outliers in the network. Finally, we must apply a machine learning algorithm such as K nearest neighbours (KNN), support vector machine (SVM), linear discriminant analysis (LDA), tree-based methods, or logistic regression to analyse and detect anomalies.
From all listed surveys, we can say that none of them discuss all the outlier detection techniques categories. Some surveys concentrate on some categories while occulting others. So, there is a need for a global classification that includes all categories. In addition, compared to existing surveys, we have added more recent works that present new techniques. In Table 1, we highlight the importance of our survey compared to already existing ones. So, as shown in Figure 7, we adopt a classification of the outlier detection techniques in IoTs context into seven main categories that could cover all previous works in the literature. These categories are statistical-based, clustering-based, nearest neighbour-based, classification-based, artificial intelligence-based, spectral decomposition-based, and hybrid-based. In what follows, we will describe each category while discussing some recent works belonging to it.
3.1. Statistical-Based Techniques
From the first techniques for outlier detection problems, we find those based on the statistical approaches. These techniques assume or estimate a statistical model (probability distribution) that captures the data distribution and test how data values match the model. A data value is considered as an outlier if the probability generated by this model is very low. The statistical-based techniques are divided into two sub-categories [17]:
- Parametric techniques: include methods with knowing data distribution, which means that data is generated from a well-known model, for example, a normal distribution model. In this case, the distribution parameters are estimated based on available data. When a data value is highly different from the data model, it is considered an outlier.
- Non-parametric techniques: include methods with no known data distribution, which means that they are depending on a distance measure between the new data value and the statistical model. Then, define a threshold on this distance value to decide if the observed value is an outlier or not. In these techniques, it is not easy to define or to choose this threshold.
The histogram and the kernel function are the most commonly used approaches in this category. The Histogram technique [28] includes counting and estimating the occurrence rate of different data values by calculating the possible occurrence of a data value. Furthermore, the histogram technique includes comparing the test data value with histogram categories to check if it corresponds to one of them. Kernel functions [29] calculate the probability distribution function (PDF) for the normal data values. If the new data value has a low PDF, then it is considered as an outlier. In what follows, we present a brief discussion of some recent works that match this category.
In [30], authors proposed a distributed fault detection (DFD) algorithm for WSN, where each sensor node cooperates with its neighbours to send and receive data to detect and identify the faulty nodes. This technique is called the neighbouring coordination technique. After that, a statistical z-test will analyse collected data at each node to decide on its soft outliers and predict those of its neighbours. This test uses a normal distribution, and its accuracy is high if more data are collected. As a result, they have less communication overhead, with high DR and low FAR.
In [31], authors proposed a distributed methodology for outlier detection in real-time series WSN. It considers the spatial-temporal correlation to identify data values’ normality and to distinguish between errors and events. Each node detects temporal outliers based on the Autoregressive and Moving Average (ARMA) prediction model. Then, it communicates with its neighbours to see if those detected outliers are also spatially outliers. This methodology is called temporal and spatial real data-based outlier detection (TSOD), and it has some unavoidable communication overhead.
In [32], authors proposed an online and distributed approach for estimating outliers in hierarchical WSN based on a histogram, with no need for a verification procedure to identify outliers. They prove through a theoretical study that the error of a new estimate is minimal. Their approach is efficient and has low complexity.
In [33], authors proposed an approximation adaptive kernel density estimator (AKDE) approach. They calculate the PDF based on the kernel density estimation (KDE) method for online outlier detection in data streams. They prove that their algorithm is better than KDE.
In [34], authors proposed an online adaptive algorithm based on the ARMA model, which can detect and replace outliers dynamically. In addition, this algorithm can achieve the demand of the real-time radar’s healthcare application. Their algorithm can analyze the correlation of neighbourhood information to model them using ARMA. Their model has speed modelling and predicting on comparison with SVM and neural networks.
In [35], authors proposed an IoT architecture for detecting errors and events based on four statistical models. Their models depend on the spatial-temporal correlation. They use the Classification and Regression Trees (CART) model to divide the data, and build a prediction model of each partition. Then, they have a decision tree as a result of this classification. They also consider the prediction error for correct classification. After that, they use the Random Forest (RF) model to obtain multiple trees. The Gradient Boosting Machine (GBM) is also used as another classification and regression model. Finally, the Linear Discriminant Analysis (LDA) model is also used as a linear classifier that distinguishes between classes based on features or parameters.
In conclusion, we can say that the statistical techniques perform well if the distribution model is rightly defined and there is no need for the data used in building the model. As we mentioned before, this previous knowledge of data distribution is not always available or not easy to obtain. The outliers with temporal correlation in the data set can be detected using statistical techniques. The change in data distribution will reduce this correlation and help detect outliers in streaming data. The parametric techniques are not suitable for the sensor data of IoTs applications. The non-parametric techniques are not efficient to work with multivariate data because it is computationally very costly.
3.2. Clustering-Based Outlier Detection Techniques
Clustering techniques are frequently used in the data mining field. These techniques group similar data values into clusters with similar behaviour. Data values are considered as outliers if they do not belong to clusters or if their clusters are much smaller than other clusters. The identification of outliers depends on the assumption that normal values belong to a large cluster. Meanwhile, outliers belong to small clusters or do not belong to any cluster. These techniques use metrics to measure the similarity between the data values (for example, the Euclidean distance). Moreover, they use inter-/intra-cluster distance thresholds and the cluster width. These parameters are not easy to choose and must be correctly selected to have efficient results. The clustering techniques gather similar data values into clusters and merge some clusters to reduce the communication cost. In what follows, we present a brief discussion of some recent works that match this category.
In [36], authors proposed an unsupervised approach for outlier detection and clustering (ODC) based on a modified K-means algorithm. They consider a data value as an outlier if the average distance is p times far from its centroid. Then they remove the outlier data values from the data set to enhance the clustering process.
In [37], authors proposed an outlier detection algorithm for IoT based on big data processing and k-means algorithm. Their approach uses the Hadoop framework and MapReduce to deal with distributed big data and use the Mahout machine learning library. They also extend the middleware LinkSmart of IoT architecture. They implement and integrate their algorithm with this middleware which is a part of the Hydra middleware project [38].
In [39], authors proposed a new algorithm based on the Density-Based Spatial Clustering of Applications with Noise (DBSCAN) clustering algorithm. They implement their modified algorithm of DBSCAN using SCALA programming language over Apache Spark. Their algorithm also uses a Resilient Distributed Dataset, which is called RDD-DBSCAN. Their distributed algorithm can deal with two-dimensional data set. It overcomes the limitation of the normal DBSCAN and MapReduce model in dealing with massive data set.
In [40], authors proposed two algorithms for outlier detection and removal using an outlier score. The first one is distance-based, which operates with the Euclidean distance to determine data value similarity. The second one is cluster-based, which operates with the k-means and Euclidean distance. They use two outlier scores, F-score and likelihood ratio, to evaluate clusters quality and remove outliers. They utilize the health care dataset founded in the statistical computing project R. They prove that the second algorithm has better accuracy than the first one when choosing the correct outlier score.
In [41], authors proposed an online approach for density-based outlier detection on big data. This approach includes two steps and is based on computing the Local Outlier Factor (LOF) [42]. During the first step, the Grid-Based Partitioning (GBP) algorithm divides the data into grides and allocates them to the distributed nodes in the network. In the second phase, the Distributed LOF Computing algorithm (DLC) detects density outliers in parallel. Their algorithm can overcome the high complexity when dealing with a high dimensional data set, and it is efficient to save the network resources.
In [43], authors proposed a new outlier detection method in the time series data set. Their approach combines DBSCAN and a soft sensor modelling process to solve the problem of choosing DBSCAN input parameters. It also uses the training errors and the testing errors to adjust these parameters. Their method has better performance than the traditional DBSCAN.
In [44], authors proposed a new distributed outlier detection algorithm for WSN based on clustering and segment-based manner. Their algorithm uses the Kullback–Leibler (KL) divergence and kernel density function. This algorithm detects the outliers which remain for a long period in the network. It reduces the communication overhead but still suffers from the computational cost of the high dimensional data.
In [45], authors proposed a new fog computing outlier detection method in IoT. Their method overcomes the high latency of multi-hop transmission of centralized approaches and the high energy consumption of the distributed ones. All data values directly go to the fog nods to detect outliers. They proposed two algorithms, the Ellipsoidal Neighbourhood Outlier Factor (ENOF), which is based on LOF, and the hyperellipsoidal clustering algorithm (HyCARCE). The first one detects outliers with high efficiency and low cost of computation. The second one solves the problem of prior knowledge of cluster parameters by choosing them automatically.
In [46], authors proposed a new process for outlier detection in WSN based on the DBSCAN algorithm. They use two modules; the first one for parameter computations such as the minimum radius of accepted cluster threshold (Eps), and the second for class identification in a spatial-temporal dataset. Their method gives better accuracy for detecting outliers with small FAR compared to [31].
In [47], the authors proposed an algorithm for outlier detection based on clustering in real big data. Their algorithm decreases the compactness of clusters while increasing separation from each other based on the distances between their centroids. Their algorithm detects outliers with higher accuracy than the k-means algorithm for different multivariate real datasets.
In [48], authors proposed an algorithm for outlier detection based on k-means clustering and outlier removal (KMOR). Their algorithm creates an additional cluster to group all the outliers inside naturally during the clustering phase. The extended k-means algorithm can cluster the data and detect outliers simultaneously, with good performance better than the ODC algorithm in [36].
In [49], authors proposed a solution for anomaly detection in IoT smart city applications. Their approach was based on fog computing and used the Low Power Wide Area Network (LPWAN) technologies. They use Antwerp’s City of Things testbed to develop and evaluate their solution. They find a similar performance of Birch clustering and robust covariance (RC) techniques with fog computing.
In [50], authors proposed a new model for outlier detection in IoT big data. Their model is based on DBSCAN and uses a multi-dimensional resilient distributed dataset (NRDD-DBSCAN). They proved that their model is suitable for IoT applications in comparison with the normal DBSCAN algorithm. They also confirmed that their model is better than the RDD-DBSCAN [39] in dealing with multi-dimensional data set.
In conclusion, we can say that these techniques do not require any previous knowledge of data distribution. They are suitable for increment data, since new data values can be added to clusters and tested for outliers after learning the clusters. Furthermore, the testing phase is fast because the number of clusters is a small constant that needs to be compared with each test data value. Finally, determining the distance between two data values in a multivariate data set adds significant computational overheads.
3.3. Nearest Neighbour-Based Techniques
These techniques are frequently used in data mining and machine learning to evaluate a data value concerning its KNN. They use many well-known distance notions to calculate the distance (similarity measure) between two data values. If a data value is placed far from its neighbours, it is declared as an outlier. There are many examples of these distance notions, such as:
- Euclidean distance, which is suitable for univariate data.
- Mahalanobis distance (MD), which is suitable for multivariate data.
- Hamming distance.
In what follows, we present a brief discussion of some recent works that match this category.
In [51], authors proposed a neighbour-based algorithm for incremental outlier detection in streaming data. Their algorithm is based on the property of the sliding window, which is called “predictability”. It is applied to the expired data values, to discover which data value may become an outlier or not. Their algorithm achieves minimal CPU and memory costs.
In [52], authors proposed a Micro Cluster-Based Continuous Outlier Detection (MCOD) algorithm in continuous data streams. Their algorithm is based on the sliding window and micro cluster to decrease the number of distance calculations. They consider that the data values are grouped in a micro-cluster. Its radius is the half radius of the containing cluster, and these values could not be outliers. Their techniques minimize the storage cost, and they are faster and have good flexibility in comparison with [51].
In [53], authors propose a framework called KNN-LEAP for outlier detection in streaming data. Their framework is based on the minimum search of neighbours and the priority of processing the data values on their arrival time. They consider that the data values received later are more important than data values received earlier. Their framework could reduce the CPU consumption and the space cost in comparison with the work presented in [52].
In [54], authors present an evaluation of their method for unsupervised outlier detection in WSN data based on the KNN algorithm. This approach is called data nearest for outlier detection (DNOD). The algorithm analyzes the learning data collected from sensors. It uses the neighbourhood data without considering the parameters of KNN to distinguish the abnormal from the normal values. They prove that the DNOD algorithm has fair DR, good accuracy, and low FAR.
In [55], authors proposed an algorithm for outlier detection. It determines the outlier score, which is called the Relative Density-Based Outlier Score (RDOS). Their algorithm uses the KDE method to estimate the density distribution of each node locally, based on modified KNN of the node. They try to test many neighbourhood methods such as KNN, reverse nearest neighbour, and shared nearest neighbour. Their approach gives better performance than LOF [42].
In [56], authors proposed a distributed online unsupervised anomaly detection in sensors data. It is based on local neighbourhood information fusion. Using many real-life datasets, they study and evaluate the neighbourhood size and spatial-temporal correlation on their approach. They prove that their system improves outlier detection under the assumption of data correlation.
In [57], authors proposed a novel Grid-based Approximate Average Outlier Detection (GAAOD) framework based on the KNN algorithm in IoT streaming data. Firstly, they used a self-adapted grid index file based on a sliding window to manage streaming data by filtering data values that are not outliers. After that, they used the min-heap algorithm, which is based on the index file, to calculate the approximate distances between data values and their KNN. Finally, they use the k-skyband method to maintain the data values which become outliers in the window. Their framework solves the problem of the proper selection of distance threshold, with low computational cost and better performance in comparison with the KNN-LEAP algorithm [53].
In conclusion, we can say that the nearest neighbour techniques need a distance metric to express data similarity. These techniques do not assume any previous knowledge of data distribution. Furthermore, they are straightforward and could be applied to different data types, but they have high computational costs while computing the distance measure in a multivariate dataset. These techniques have the problem of choosing the appropriate input parameters. Thus, the incorrect choice of the threshold will give a high false-negative rate of outlier detection.
3.4. Classification-Based Techniques
The classification-based techniques define a classification model (classifier) by using some data values as training values. The classification comprises two phases: the training phase, in which a classifier learns from the values in the available data set, and the testing phase, in which the data values are classified into normal or abnormal (outlier) groups. Additionally, new training is needed for the new arrival data values. In what follows, we present a brief discussion of some recent works that match this category.
In [58], authors proposed an adaptive online One-Class Support Vector Machine (OCSVM) outlier detection algorithm for WSN. They consider the spatial-temporal correlation between sensor’s data values. Their algorithm has better accuracy and a low FAR compared to earlier algorithms for WSN.
In [59], authors proposed two approaches: the first one is Centered Hyperellipsoidal Support Vector Machine (CESVM). The second one is a distributed hyperellipsoidal one class Quarter-Sphere Support Vector Machine (QS-SVM) for WSN. The two approaches have high DR and accuracy rates for different real-life and synthetic datasets. The QS-SVM extends the SVM to be an unsupervised learning algorithm. It has less communication overhead and a comparable accuracy compared with the CESVM centralized approach.
In [60], authors proposed an approach for outlier detection in WSN based on Spatial-Temporal-Attribute one class Quarter-Sphere Support Vector Machine (STA-QS-SVM). They did not only consider the spatial-temporal correlation between sensor nodes, but they also used the attributes correlation of sensor nodes to detect errors and events. Their approach has better performance than QS-SVM [59] and ST-QS-SVM approaches. This performance increases as the number of attributes increases, since this will affect the training quality of SVM. As a result, this will increase the DR and decrease the FAR.
In [61], the authors proposed two online techniques based on hyperellipsoidal OCSVM for outlier detection in WSN. They consider the spatial-temporal correlation and the correlation of data attributes to detect outliers. They update the hyper-ellipsoid SVM model to overcome the problem of FAR, and have good outliers identification. Their algorithms give better DR and FAR than the other SVM models.
In [62], authors present a new outlier score scheme named Hyperellipsoidal Neighbourhood Outlier Factor (ENOF). They also proposed a distributed mechanism for outlier detection and scoring the outliers in WSN, based on ENOF with multiple hyperellipsoidal clusters. This mechanism is suitable for networks with constrained resources such as WSN and IoT. Their approach has better performance than the centralized mechanism.
In [63], authors proposed an Adaptive Distributed Outlier Detection (ADOD) approach for WSN. Their proposal is based on probabilistic inference on Bayesian networks. It enhances the classification accuracy, execution time, and communication cost.
In [64], authors proposed a Distributed Bayesian Algorithm (DBA) for fault detection in WSN. They use the Bayesian networks to calculate the fault probability by exchanging the data values between the neighbouring nodes. After that, this probability will be adjusted. If the fault probability of the sensor node exceeds a certain level of probability threshold, they consider this node a faulty node. Their approach has better performance than the originally distributed fault detection (DFD) discussed in [65] with low FAR and high DR.
In [66], authors proposed an online outlier detection algorithm based on Least Squares One-Class Support Vector Machine (LS-OC-SVM) classifiers. These classifiers detect outliers in large power grid streaming sensor data. They implement their algorithm using the IEEE 14 bus test system and prove that it has low computation cost and memory usage.
In [67], authors proposed a new threshold-free error detection (TED) approach for industrial wireless sensor networks (IWSN). They get rid of the selection of the correct predefined threshold. In addition, they use the temporal correlation between the data values of the sensor node and the spatial correlation between the neighbouring nodes. This approach is based on two phases; the first is the training phase, and the second is the diagnosis phase to build the OCSVM model. This model is transferred to the base station to detect outliers. Their approach improves the DR and reduces the FAR.
In [68], authors proposed an algorithm for outlier detection in IoT big data. Their method is based on the One-Class Support Tucker Machine (OCSTuM) algorithm. They also proposed another Genetic Algorithm (GA-OCSTuM) for parameters optimization and selection of features and to solve the problem of the time-consuming iterative method. These two algorithms extend the OCSVM to solve the problem of high dimensional data. The previous vector-based algorithms with big data may destroy the correlations and the structural information among data and thus may have low DR and loss of some outliers. Their algorithms have better DR, but they have higher execution times than the previous ones due to the iterative steps of the algorithm.
In [69], authors proposed a Distributed Outlier Detection algorithm (DODS) in WSN, based on considering the temporal correlation of data values. They achieve their approach using a Bayesian classifier in an interesting region (IR). Their algorithm is energy efficient, and it reduces the communications between neighbours, while achieving higher DR and lower FAR compared to [70,71].
In conclusion, we can say that most of these techniques are unsupervised, which means that they do not need previous knowledge of labelled training data. Moreover, they do not have an explicit statistical model or estimated parameters. These techniques have optimal detection of outliers, but their computation cost is greater than that of statistical and clustering techniques.
3.5. Artificial Intelligence Techniques
Artificial intelligence techniques are the recent approaches for the identification of outliers in IoTs. Neural networks (NN) and fuzzy logic are examples of these techniques. They are based on decision-making theories. The NN is a logical model that provides a global overview and makes decisions using the entire data set. The fuzzy logic is a technique used to distinguish between the normal data values using distinction values such as (yes/no, right/wrong), which can be helpful in outlier detection issues. In what follows, we present a brief discussion of some recent works that match this category.
In [72], authors proposed an algorithm for Fault Detection and Isolation (FDI) in WSN using the Fuzzy Knowledge-based Control (FKBC). Their algorithm detects faulty communications between nodes using a clustering framework. The cluster heads exchange the challenge-response messages with nodes to see if they are faulty or healthy. Their algorithm also adopts the Bayesian approach to observe and estimate the reputations of nodes in the network.
In [73], authors proposed a Heterogeneous Fault Diagnosis (HFD) protocol for WSN. It includes three phases: a clustering, fault detection, and fault classification. Their protocol is based on a time-out mechanism for complex faulty node detection. It is also based on a statistical method called the Analysis of Variance (ANOVA) test for soft faulty detection. The classification phase compares the data values of faulty sensors with the data values of normal sensors and classifies them based on the Probabilistic Neural Network (PNN). Their approach performs better than the DSFD algorithm according to [74].
In [75], the authors proposed a two-part algorithm. The first part is a Distributed Anomaly Detection Autoencoder on Sensor node (DADA-S). The second part runs in IoT Cloud (DADA-C) for detecting outliers in WSN or, more broadly, in IoT. They used an autoencoder neural network which is a deep learning model. The detection process is distributed on the sensors directly without communicating with other sensors or turning back to the cloud. Thus, the communications, computations cost, training tasks are transferred via the cluster head and reduced in the IoT cloud with low overheads on sensors. In addition, Their algorithm uses the feature of unsupervised learning of the auto-encoder neural networks. Thus it could be adaptive to dynamic changes in the environment, and achieve high DR and low FAR.
In [24], authors present the advantages and the disadvantages of some ML approaches for WSN. They concentrate on Bayesian algorithms which are supervised machine learning algorithms, and can be used to calculate the missing data values and detect outliers in WSN. They suggest using the Bayesian Belief Network for classification, which compares the data value behaviour characteristics with other data values. Furthermore, they use the COMIS (Component Oriented Middleware for Sensor network) to solve the problem of big data sensors.
In [76], authors present a distributed soft fault detection scheme for non-linear stochastic systems based on IT2 T-S fuzzy models filters for WSN. They assess the performance of the Lyapunov functional approach of the fault detection system. Their approach can reduce the computational cost with fewer decision variables.
In [20], authors propose an algorithm that used three input fuzzy inference systems (FIS) with 27 developed fuzzy rules which help in decision making. Their algorithm detects sensor hardware faults such as battery, transmitter, and receiver circuit errors in IoT. The conditions of these hardware elements are measured and used as input to the FIS system. Their approach gives high accuracy and low FAR compared to the Faulty Detection WSN (FDWSN) approach [77].
In [78], authors proposed a Distributed Fuzzy Logic-Based Faulty Node Detection (DFLFND) algorithm for heterogeneous WSNs. Their scheme used the spatial-temporal correlation and can detect and isolate faulty nodes and discover interesting events. Each node has a fuzzy logic controller (FLC) to weight its sensed data values with the data values of its neighbours. The nodes use a voting algorithm based on weights to detect the faulty node. If the neighbouring nodes have sensed data values that are different from the data values of the tester node, it is considered as a faulty node and goes to sleepy mode.
In [79], authors proposed a distributed green fault detection scheme for IoT-enabled WSN based on a vague set, which is a further generalization of a fuzzy set. It depends on interval-based membership instead of point-based membership. So, this vague set has more power to detect the vagueness data. Their algorithm diagnoses sensor fault, battery fault, receiver fault, transmitter fault, and microcontroller fault. They prove that this model achieves better detection accuracy and low FAR than DFD [30], DSFD [74] HFD [73], and DFLFND [78].
In [80], authors investigate the prediction-based and the pattern recognition-based outlier detection techniques. These techniques are for IoT cloud-based indoor climate control vertical plant walls systems. They prove that the autoencoder neural network is better than other methods in detecting point outliers. They also confirm that the long short-term memory encoder-decoder (LSTM-ED) is better at detecting contextual outliers.
In conclusion, we can say that techniques based on artificial intelligence could work with fragmented, noisy, or limited data, and they are capable of generalizing with such data. They hardly build the model because of the need for more fine-tuning before working in real applications. When adding new data or rules, there is no need for further training for the system. They are rule-based techniques, so for example, when dealing with the spatial-temporal correlation of data, this will increase the number of rules needed. As a result, it will not be suitable for the resource-constrained sensors. The rules number will add more computational cost, consume more memory, and finally affect the DR.
3.6. Spectral Decomposition Techniques
In these techniques, the principal component analysis (PCA) is used to simplify and reduce the dimensions of the data set. It generates a new uncorrelated subset of data (components) which reserves the maximum variance to find the normal behaviour of data before detecting outliers. The data values that are not well reconstructed or deviated from the variability of the top few principal components are considered as outliers. In what follows, we present a brief discussion of some recent works that match this category.
In [81], authors develop an online outlier detection model for WSN. It is based on measuring the variation of sensor data values using the principal components space. This technique is distributed over the network, and it achieves high DR and low energy consumption.
In [82,83,84], the authors proposed a new outlier detection technique based on kernel principal component analysis (KPCA). They use the MD for outlier detection in WSN and compare it with a predefined threshold to separate the outlier values from the normal ones instead of comparing with the reconstruction error (RE). The outlier value is a measured data value that deviates from the principal subspace of the normal data. If the MD is more significant than their specific threshold, they consider the data value as an outlier; elsewhere, it is a normal data value. They prove that this approach (KPCA-MD) is better than the KPCA with a training set (KPCA-RE) and OCSVM algorithms regarding the accuracy rate and FAR.
In conclusion, we can say that PCA-based techniques can be used with a vast amount of data with multiple attributes. It is not easy to find suitable components that capture the regular data pattern and need high computational cost.
3.7. Hybrid Techniques
The hybrid techniques are coming to combine more than one solution to overcome the disadvantages of previous solutions. By this merging, we can obtain good results, as we will see in the following works.
In [85], authors proposed a distributed approach for outlier detection in WSN based on fixed-width clustering algorithm and KNN. They reduced the communication overhead and balanced the load by clustering the data values locally at each node. Then, the clusters summary of each node is sent to the parent node to merge similar clusters based on the cluster width. They repeat this until reaching the main station, which will detect the outliers by calculating the inter-cluster distance using the KNN parameters. Their distributed algorithm has better performance than the centralized algorithm.
In [86], authors proposed a hybrid outlier detection technique named SVM-KNN for WSN. Their approach is based on SVM and KNN. The SVM benefits from the spatial-temporal correlation between sensor nodes. However, this will add more overhead to the training phase. Thus, the KNN reduces the training samples scale to optimize and reduce the training time in SVM. Then they use a kernel function to map the samples into the future space. Their technique has good performance and reduces the overhead of the spatial-temporal correlation in large scale data set.
In [70], authors proposed a hybrid cluster-based and nearest neighbour-based approach for outlier detection in WSN. However, they consider the advantage of spatial-temporal correlation to classify the outliers and distinguish between errors and events. Their experimental results have higher accuracy and DR for identifying outliers and interesting events than [71]; which is an event detection method based on a distributed collaboration among neighbour nodes.
In [87], authors propose a new algorithm for anomaly prediction in data streams based on PCA, information entropy theory, and support vector regression. The data feature and the entropy feature matrixes are generated from a sliding window, then the PCA analyses and treats the matrixes. Finally, the support vector regression model will predict anomalies by comparing components and newly coming data values.
In [88], authors proposed a Recursive PCA (R-PCA) algorithm based on k-means clustering for outlier detection in IoT systems. The clustered data is gathered and sent to the cluster heads where the R-PCA will be applied considering the spatial correlation and the dynamic changes in IoT data. For these changes, the parameters of R-PCA are updated recursively. This algorithm gives better performance than PCA regarding the FAR and the low power consumption. However, both use the Gaussian distribution of noisy data, which will affect the detection of outliers in big data.
In [89], authors present an algorithm to detect outliers in WSN, based on DBSCAN and SVM named HSE. Their algorithm tries to solve the problems of selecting the input parameters of the DBSCAN algorithm by considering the advantages of coefficient correlations (CC) and enhancing the accuracy detection by using the SVM. They perform the algorithm after selecting the suitable DBSCAN input parameters. So, the clusters with high density are considered normal, and those with low density are judged abnormal and thus labelled. Finally, the SVM will be trained from the normal data to classify and separate the outlier data values from the normal data values.
In [90], authors proposed an algorithm for fault detection in WSN. It uses SVM to classify sensor data values and detect faults based on statistical learning. The SVM is executed at the cluster head or the sink node based on a kernel decision function to detect faulty nodes. So, their technique, like the cloud technique, is suitable for resource-constrained sensors. It differs from other techniques such as (Bayes, HMM and SODSEN), where the algorithm runs on both cluster head and sensors.
In [91], authors proposed an approach for detecting abnormal data values in smart homes IoT devices. It is based on statistics and machine learning techniques. In their process, they sniff and collect the sensed traffic data, which is exchanged between sensor IoT devices and the gateways. Then, they try to classify these data into different behavioural templates according to a set of features predefined statistically. These templates will be used later to detect the anomalies that deviate from the expected behaviour according to a specific threshold. The selection of a bad threshold can affect the rate of FAR.
In [92], authors propose a scalable outlier detection approach for IoT time-series data. Their method works on passing the time series data into a noise filter, then performing two steps. The first step is offline and starts by using the PCA to reduce the recorded time series data dimensions. Then, it uses hierarchical clustering to find the clusters and the correlated sensors data values. The second step starts offline by segmenting the time series data into segments to minimize the data distribution effect. Then, it uses the ARIMA model for time series data analysis to build the Long Short-Term Memory (LSTM) neural network trained from known data set. Also, they use the statistical analysis M-estimator, and the result is entered in the outlier detector module to detect outliers in an online manner.
In [93], the authors proposed a new anomaly detection algorithm based on deep learning techniques. They perform their approach on their proposed Industrial IoT (IIoT) framework called Stack4Things (S4T). Firstly, they used the data gathered from the sensors by the S4T for training the algorithm by using two neural networks autoencoders. The two autoencoders are responsible of first dimension reduction, they attempt to learn an efficient encoding of the input data, and the resulting data will be stored in a specific layer, called code layer. Secondly, they use PCA to reduce data dimensions better and and transform them to get the few principal components. Finally, they use the k-means clustering to detect the outliers as their distance from the centroids.
In conclusion, we can say that these hybrid techniques can take advantage of two or more techniques to achieve the requirements of an optimal outlier detection technique. The merging of different operations may increase the computational cost and consume the sensor resources.
4. Comparative Study of Outlier Detection Techniques in IoT
In what follows, we provide a summarizing comparative table for each category. In each table, we compare works that present techniques belonging to the same category. For each work, we mention the year of the publication, the keywords contribution, the nature of data used by the algorithm, the adopted approach as discussed in Section 2.2, and finally, which application type the work is suitable for (IoT, WSN, streaming data, etc.). In all tables, we note by ’-’ the fact that the used approach is not well mentioned or defined in the concerned work.
We can see from Table 2 that all listed works share some same approaches like being online (except the last one), dealing with univariate data and focusing on outlier detection.
We can see from Table 3 that all listed works share some same approaches, like being unsupervised and focusing on outlier detection.
We can see from Table 4 that all listed works share some of the same approaches, like being unsupervised and focusing on outlier detection.
We can see from Table 5 that all listed works share some same approaches like focusing on outlier detection. Furthermore, all of them are suitable for WSNs or IoTs applications.
From Table 6, we can see that all listed works share some same approaches like dealing with univariate data (except the third one) and focusing on outlier detection. Moreover, all of them are suitable for WSNs or IoTs applications.
Both works listed in Table 7 share some of the same approaches, like being unsupervised and focusing on outlier detection. Moreover, both of them are suitable for WSNs applications.
We can see from Table 8 that all listed works share some same approaches like being focusing on outlier detection. Moreover, all of them are suitable for WSNs or IoTs applications.
Summary of Outlier Detection Techniques
Table 9 summarizes the discussed outlier detection techniques categories, while highlighting the advantages and disadvantages of each one:
5. Conclusions
Outlier detection is a significant issue in IoT. With the actual growth in IoT use in different applications, traditional data analysis methods are inefficient. Therefore, IoT needs creative energy-efficient solutions for outlier detection that overcome specific limitations and constraints. Many outlier detection strategies for IoT have been proposed in recent years. In this paper, we highlight the outlier detection fundamentals while discussing the different sources of an outlier, the existing approaches, how we can evaluate an outlier detection technique, and the challenges facing designing such techniques. After that, we provide a comprehensive literature review of the existing outlier detection techniques used in IoTs and their classification. We adopt a classification based on seven main categories that cover all previous works in the literature while highlighting the advantages and disadvantages of each of them. Then we discuss and compare works according to their detection efficiency, energy consumption, and communication overhead.
Author Contributions
Conceptualization, M.A.S., I.B., A.A. and P.L.; methodology, M.A.S., I.B., A.A. and P.L.; validation, M.A.S., I.B., A.A. and P.L.; formal analysis, M.A.S., I.B., A.A. and P.L.; investigation, M.A.S., I.B., A.A. and P.L.; data curation, M.A.S., I.B., A.A. and P.L.; writing—original draft preparation, M.A.S., I.B., A.A. and P.L.; writing—review and editing, M.A.S., I.B., A.A. and P.L.; supervision, M.A.S., I.B., A.A. and P.L.; All authors have read and agreed to the published version of the manuscript.
Funding
This research received no external funding.
Institutional Review Board Statement
Not applicable.
Informed Consent Statement
Not applicable.
Data Availability Statement
Not applicable.
Conflicts of Interest
The authors declare no conflict of interest.
References
- Gaddam, A.; Wilkin, T.; Angelova, M.; Gaddam, J. Detecting sensor faults, anomalies and outliers in the internet of things: A survey on the challenges and solutions. Electronics 2020, 9, 511. [Google Scholar] [CrossRef] [Green Version]
- Leppänen, R.F.; Hämäläinen, T. Network Anomaly Detection in Wireless Sensor Networks: A Review. In Internet of Things, Smart Spaces, and Next Generation Networks and Systems; Galinina, O., Andreev, S., Balandin, S., Koucheryavy, Y., Eds.; Springer International Publishing: Cham, Switzerland, 2019; pp. 196–207. [Google Scholar]
- Joyia, G.J.; Liaqat, R.M.; Farooq, A.; Rehman, S. Internet of medical things (IOMT): Applications, benefits and future challenges in healthcare domain. J. Commun. 2017, 12, 240–247. [Google Scholar] [CrossRef] [Green Version]
- Amendola, S.; Lodato, R.; Manzari, S.; Occhiuzzi, C.; Marrocco, G. RFID technology for IoT-based personal healthcare in smart spaces. IEEE Internet Things J. 2014, 1, 144–152. [Google Scholar] [CrossRef]
- Perera, C.; Liu, C.H.; Jayawardena, S.; Chen, M. A Survey on Internet of Things from Industrial Market Perspective. IEEE Access 2015, 2, 1660–1679. [Google Scholar] [CrossRef]
- Dai, H.N.; Wang, H.; Xu, G.; Wan, J.; Imran, M. Big data analytics for manufacturing internet of things: Opportunities, challenges and enabling technologies. Enterp. Inf. Syst. 2020, 14, 1279–1303. [Google Scholar] [CrossRef] [Green Version]
- Baranwal, T.; Nitika; Pateriya, P.K. Development of IoT based smart security and monitoring devices for agriculture. In Proceedings of the 2016 6th International Conference—Cloud System and Big Data Engineering (Confluence), Noida, India, 14–15 January 2016; pp. 597–602. [Google Scholar] [CrossRef]
- Baskaran, S.B.M. Internet of things security. J. ICT Stand. 2019, 7, 21–39. [Google Scholar] [CrossRef]
- Ayadi, A.; Ghorbel, O.; BenSalah, M.S.; Abid, M. Spatio-temporal correlations for damages identification and localization in water pipeline systems based on WSNs. Comput. Netw. 2020, 171, 107134. [Google Scholar] [CrossRef]
- Kanhere, P.; Khanuja, H.K. A methodology for outlier detection in audit logs for financial transactions. In Proceedings of the 1st International Conference on Computing, Communication, Control and Automation, ICCUBEA’15, Pune, India, 26–27 February 2015; pp. 837–840. [Google Scholar] [CrossRef]
- Chandola, V.; Banerjee, A.; Kumar, V. Anomaly detection: A survey. ACM Comput. Surv. (CSUR) 2009, 41, 1–58. [Google Scholar] [CrossRef]
- Castillo, A.; Thierer, A.D. Projecting the Growth and Economic Impact of the Internet of Things. SSRN Electron. J. 2015. [Google Scholar] [CrossRef] [Green Version]
- Branch, J.W.; Giannella, C.; Szymanski, B.; Wolff, R.; Kargupta, H. In-network outlier detection in wireless sensor networks. Knowl. Inf. Syst. 2013, 34, 23–54. [Google Scholar] [CrossRef] [Green Version]
- Martincic, F.; Schwiebert, L. Distributed event detection in sensor networks. In Proceedings of the International Conference on Systems and Networks Communications (ICSNC 2006), Tahiti, French Polynesia, 29 October–3 November 2006; p. 43. [Google Scholar] [CrossRef]
- Krishnamachari, B.; Iyengar, S. Distributed Bayesian algorithms for fault-tolerant event region detection in wireless sensor networks. IEEE Trans. Comput. 2004, 53, 241–250. [Google Scholar] [CrossRef]
- Shahid, N.; Naqvi, I.H.; Qaisar, S.B. Characteristics and classification of outlier detection techniques for wireless sensor networks in harsh environments: A survey. Artif. Intell. Rev. 2012, 43, 193–228. [Google Scholar] [CrossRef]
- Zhang, Y.; Meratnia, N.; Havinga, P. Outlier detection techniques for wireless sensor networks: A survey. IEEE Commun. Surv. Tutor. 2010, 12, 159–170. [Google Scholar] [CrossRef] [Green Version]
- Ding, M.; Chen, D.; Xing, K.; Cheng, X. Localized fault-tolerant event boundary detection in sensor networks. In Proceedings of the IEEE 24th Annual Joint Conference of the IEEE Computer and Communications Societies, Miami, FL, USA, 13–17 March 2005; Volume 2, pp. 902–913. [Google Scholar] [CrossRef] [Green Version]
- Lazarevic, A.; Ertoz, L.; Kumar, V.; Ozgur, A.; Srivastava, J. A Comparative Study of Anomaly Detection Schemes in Network Intrusion Detection. In Proceedings of the 2003 SIAM International Conference on Data Mining, San Francisco, CA, USA, 1–3 May 2003; pp. 25–36. [Google Scholar] [CrossRef] [Green Version]
- Ganesh Kumar, D.; Insozhan, N.; Parthasarathy, V. Recognition of faulty node detection using fuzzy logic in iot. Int. J. Sci. Technol. Res. 2019, 8, 1112–1116. [Google Scholar]
- Cook, A.A.; Misirli, G.; Fan, Z. Anomaly Detection for IoT Time-Series Data: A Survey. IEEE Internet Things J. 2020, 7, 6481–6494. [Google Scholar] [CrossRef]
- Ayadi, A.; Ghorbel, O.; Obeid, A.M.; Abid, M. Outlier detection approaches for wireless sensor networks: A survey. Comput. Netw. 2017, 129, 319–333. [Google Scholar] [CrossRef]
- Jiang, J.; Han, G.; Liu, L.; Shu, L.; Guizani, M. Outlier detection approaches based on machine learning in the internet-of-things. IEEE Wirel. Commun. 2020, 27, 53–59. [Google Scholar] [CrossRef]
- Kumar Dwivedi, R.; Pandey, S.; Kumar, R. A Study on Machine Learning Approaches for Outlier Detection in Wireless Sensor Network. In Proceedings of the 8th International Conference Confluence 2018 on Cloud Computing, Data Science and Engineering (Confluence), Noida, India, 11–12 January 2018; pp. 189–192. [Google Scholar] [CrossRef]
- Ghosh, N.; Maity, K.; Paul, R.; Maity, S. Outlier detection in sensor data using machine learning techniques for IoT framework and wireless sensor networks: A brief study. In Proceedings of the 2019 International Conference on Applied Machine Learning (ICAML’19), Bhubaneswar, India, 25–26 May 2019; pp. 187–190. [Google Scholar] [CrossRef]
- Wang, H.; Bah, M.J.; Hammad, M. Progress in Outlier Detection Techniques: A Survey. IEEE Access 2019, 7, 107964–108000. [Google Scholar] [CrossRef]
- Morales, L.V.V.; López-Vizcaíno, M.; Iglesias, D.F.; Díaz, V.M.C. Anomaly Detection in IoT: Methods, Techniques and Tools. Proceedings 2019, 21, 4. [Google Scholar] [CrossRef] [Green Version]
- Sheng, B.; Li, Q.; Mao, W.; Jin, W. Outlier detection in sensor networks. In Proceedings of the International Symposium on Mobile Ad Hoc Networking and Computing (MobiHoc), Montreal QC Canada, 9–14 September 2007; pp. 219–228. [Google Scholar] [CrossRef] [Green Version]
- Palpanas, T.; Papadopoulos, D.; Kalogeraki, V.; Gunopulos, D. Distributed deviation detection in sensor networks. ACM Sigmod Rec. 2003, 32, 77–82. [Google Scholar] [CrossRef]
- Panda, M.; Khilar, P.M. Distributed soft fault detection algorithm in wireless sensor networks using statistical test. In Proceedings of the 2012 2nd IEEE International Conference on Parallel, Distributed and Grid Computing (PDGC 2012), lSolan, India, 6–8 December 2012; pp. 195–198. [Google Scholar] [CrossRef]
- Zhang, Y.; Hamm, N.A.; Meratnia, N.; Stein, A.; van de Voort, M.; Havinga, P.J. Statistics-based outlier detection for wireless sensor networks. Int. J. Geogr. Inf. Sci. 2012, 26, 1373–1392. [Google Scholar] [CrossRef]
- Xie, M.; Hu, J.; Tian, B. Histogram-based online anomaly detection in hierarchical wireless sensor networks. In Proceedings of the 11th IEEE International Conference on Trust, Security and Privacy in Computing and Communications, TrustCom-2012—11th IEEE International Conference on Ubiquitous Computing and Communications, IUCC-2012, Liverpool, UK, 25–27 June 2012; pp. 751–759. [Google Scholar] [CrossRef]
- Boedihardjo, A.P.; Lu, C.T.; Chen, F. Fast adaptive kernel density estimator for data streams. Knowl. Inf. Syst. 2015, 42, 285–317. [Google Scholar] [CrossRef]
- Lv, Y. An Adaptive Real-time Outlier Detection Algorithm Based on ARMA Model for Radar’s Health Monitoring. In Proceedings of the 2015 IEEE AUTOTESTCON, National Harbor, MD, USA, 2–5 November 2015. [Google Scholar]
- Nesa, N.; Ghosh, T.; Banerjee, I. Outlier detection in sensed data using statistical learning models for IoT. In Proceedings of the IEEE Wireless Communications and Networking Conference, WCNC, Barcelona, Spain, 15–18 April 2018; pp. 1–6. [Google Scholar] [CrossRef]
- Ahmed, M.; Mahmood, A.N. A novel approach for outlier detection and clustering improvement. In Proceedings of the 2013 IEEE 8th Conference on Industrial Electronics and Applications, ICIEA 2013, Melbourne, VIC, Australia, 19–21 June 2013; pp. 577–582. [Google Scholar] [CrossRef]
- Souza, A.M.; Amazonas, J.R. An outlier detect algorithm using big data processing and Internet of Things architecture. Procedia Comput. Sci. 2015, 52, 1010–1015. [Google Scholar] [CrossRef] [Green Version]
- Hydra Technology Project—In-JeT ApS. Available online: https://www.in-jet.eu/portfolio-items/hydra/ (accessed on 20 December 2021).
- Cordova, I.; Moh, T.S. DBSCAN on Resilient Distributed Datasets. In Proceedings of the 2015 International Conference on High Performance Computing and Simulation, HPCS 2015, Amsterdam, The Netherlands, 20–24 July 2015; pp. 531–540. [Google Scholar] [CrossRef]
- Christy, A.; Gandhi, M.G.; Vaithyasubramanian, S. Cluster based outlier detection algorithm for healthcare data. Procedia Comput. Sci. 2015, 50, 209–215. [Google Scholar] [CrossRef] [Green Version]
- Bai, M.; Wang, X.; Xin, J.; Wang, G. An efficient algorithm for distributed density-based outlier detection on big data. Neurocomputing 2016, 181, 19–28. [Google Scholar] [CrossRef]
- Breunig, M.M.; Kriegel, H.P.; Ng, R.T.; Sander, J. LOF: Identifying Density-Based Local Outliers. Int. J. Gynecol. Obstet. 2009, 107, S93. [Google Scholar]
- Tian, H.X.; Liu, X.J.; Han, M. An outliers detection method of time series data for soft sensor modeling. In Proceedings of the 28th Chinese Control and Decision Conference, CCDC 2016, Yinchuan, China, 28–30 May 2016; pp. 3918–3922. [Google Scholar] [CrossRef]
- Xie, M.; Hu, J.; Guo, S.; Zomaya, A.Y. Distributed Segment-based Anomaly Detection with Kullback-Leibler Divergence in Wireless Sensor Networks. IEEE Trans. Inf. Forensics Secur. 2016, 12, 101–110. [Google Scholar] [CrossRef]
- Lyu, L.; Jin, J.; Rajasegarar, S.; He, X.; Palaniswami, M. Fog-empowered anomaly detection in IoT using hyperellipsoidal clustering. IEEE Internet Things J. 2017, 4, 1174–1184. [Google Scholar] [CrossRef]
- Abid, A.; Kachouri, A.; Mahfoudhi, A. Outlier detection for wireless sensor networks using density-based clustering approach. IET Wirel. Sens. Syst. 2017, 7, 83–90. [Google Scholar] [CrossRef]
- Alguliyev, R.; Aliguliyev, R.; Sukhostat, L. Anomaly detection in Big data based on clustering. Stat. Optim. Inf. Comput. 2017, 5, 325–340. [Google Scholar] [CrossRef]
- Gan, G.; Ng, M.K.P. K-Means Clustering with Outlier Removal. Pattern Recognit. Lett. 2017, 90, 8–14. [Google Scholar] [CrossRef]
- Santos, J.; Leroux, P.; Wauters, T.; Volckaert, B.; De Turck, F. Anomaly detection for Smart City applications over 5G low power wide area networks. In Proceedings of the IEEE/IFIP Network Operations and Management Symposium: Cognitive Management in a Cyber World, NOMS 2018, Taipei, Taiwan, 23–27 April 2018; pp. 1–9. [Google Scholar] [CrossRef] [Green Version]
- Ghallab, H.; Fahmy, H.; Nasr, M. Detection outliers on internet of things using big data technology. Egypt. Inform. J. 2020, 21, 131–138. [Google Scholar] [CrossRef]
- Yang, D.; Rundensteiner, E.A.; Ward, M.O. Neighbor-based pattern detection for windows over streaming data. In Proceedings of the 12th International Conference on Extending Database Technology: Advances in Database Technology, EDBT’09, Petersburg, Russia, 24–26 March 2009; pp. 529–540. [Google Scholar] [CrossRef] [Green Version]
- Kontaki, M.; Gounaris, A.; Papadopoulos, A.N.; Tsichlas, K.; Manolopoulos, Y. Continuous monitoring of distance-based outliers over data streams. In Proceedings of the International Conference on Data Engineering, Hannover, Germany, 11–16 April 2011; pp. 135–146. [Google Scholar] [CrossRef]
- Cao, L.; Yang, D.; Wang, Q.; Yu, Y.; Wang, J.; Rundensteiner, E.A. Scalable distance-based outlier detection over high-volume data streams. In Proceedings of the International Conference on Data Engineering, Chicago, IL, USA, 31 March–4 April 2014; pp. 76–87. [Google Scholar] [CrossRef]
- Abid, A.; Kachouri, A.; Mahfoudhi, A. Anomaly detection through outlier and neighborhood data in Wireless Sensor Networks. In Proceedings of the 2nd International Conference on Advanced Technologies for Signal and Image Processing, ATSIP 2016, Monastir, Tunisia, 21–23 March 2016; pp. 26–30. [Google Scholar] [CrossRef]
- Tang, B.; He, H. A local density-based approach for outlier detection. Neurocomputing 2017, 241, 171–180. [Google Scholar] [CrossRef] [Green Version]
- Bosman, H.H.W.J.; Hwj, H.; Iacca, G.; Tejada, A.; Wörtche, H.J.; Liotta, A. Spatial anomaly detection in sensor networks using neighborhood information. Inf. Fusion 2017, 33, 41–56. [Google Scholar] [CrossRef] [Green Version]
- Zhu, R.; Ji, X.; Yu, D.; Tan, Z.; Zhao, L.; Li, J.; Xia, X. KNN-Based Approximate Outlier Detection Algorithm over IoT Streaming Data. IEEE Access 2020, 8, 42749–42759. [Google Scholar] [CrossRef]
- Zhang, Y.; Meratnia, N.; Havinga, P. Adaptive and online one-class support vector machine-based outlier detection techniques for wireless sensor networks. In Proceedings of the International Conference on Advanced Information Networking and Applications, AINA, Bradford, UK, 26–29 May 2009; pp. 990–995. [Google Scholar] [CrossRef] [Green Version]
- Rajasegarar, S.; Leckie, C.; Bezdek, J.C.; Palaniswami, M. Centered hyperspherical and hyperellipsoidal one-class support vector machines for anomaly detection in sensor networks. IEEE Trans. Inf. Forensics Secur. 2010, 5, 518–533. [Google Scholar] [CrossRef]
- Shahid, N.; Naqvi, I.H.; Qaisar, S.B. Quarter-sphere SVM: Attribute and spatio-temporal correlations based outlier & event detection in wireless sensor networks. In Proceedings of the IEEE Wireless Communications and Networking Conference, WCNC, Paris, France, 1–4 April 2012; pp. 2048–2053. [Google Scholar] [CrossRef]
- Zhang, Y.; Meratnia, N.; Havinga, P.J. Distributed online outlier detection in wireless sensor networks using ellipsoidal support vector machine. Ad Hoc Netw. 2013, 11, 1062–1074. [Google Scholar] [CrossRef]
- Rajasegarar, S.; Gluhak, A.; Ali Imran, M.; Nati, M.; Moshtaghi, M.; Leckie, C.; Palaniswami, M. Ellipsoidal neighbourhood outlier factor for distributed anomaly detection in resource constrained networks. Pattern Recognit. 2014, 47, 2867–2879. [Google Scholar] [CrossRef]
- De Paola, A.; Gaglio, S.; Re, G.L.; Milazzo, F.; Ortolani, M. Adaptive distributed outlier detection for WSNs. IEEE Trans. Cybern. 2015, 45, 902–913. [Google Scholar] [CrossRef] [PubMed]
- Yuan, H.; Zhao, X.; Yu, L. A Distributed Bayesian Algorithm for Data Fault Detection in Wireless Sensor Networks. In Proceedings of the 2015 International Conference on Information Networking (ICOIN), Siem Reap, Cambodia, 12–14 January 2015; pp. 63–68. [Google Scholar]
- Chen, J.; Kher, S.; Somani, A. Distributed fault detection of wireless sensor networks. In Proceedings of the 2006 Workshop on Dependability Issues in Wireless Ad Hoc Networks and Sensor Networks, Los Angeles, CA, USA, 26 September 2006; Volume 2006, pp. 65–71. [Google Scholar] [CrossRef]
- Uddin, M.S.; Kuh, A. Online least-squares one-class support vector machine for outlier detection in power grid data. In Proceedings of the ICASSP, IEEE International Conference on Acoustics, Speech and Signal Processing—Proceedings, Shanghai, China, 20–25 March 2016; pp. 2628–2632. [Google Scholar] [CrossRef]
- Gao, J.; Wang, J.; Zhong, P.; Wang, H. On threshold-free error detection for industrial wireless sensor networks. IEEE Trans. Ind. Inform. 2018, 14, 2199–2209. [Google Scholar] [CrossRef]
- Deng, X.; Jiang, P.; Peng, X.; Mi, C. An intelligent outlier detection method with one class support tucker machine and genetic algorithm toward big sensor data in internet of things. IEEE Trans. Ind. Electron. 2019, 66, 4672–4683. [Google Scholar] [CrossRef]
- Titouna, C.; Naït-Abdesselam, F.; Khokhar, A. DODS: A Distributed Outlier Detection Scheme for Wireless Sensor Networks. Comput. Netw. 2019, 161, 93–101. [Google Scholar] [CrossRef]
- Fawzy, A.; Mokhtar, H.M.; Hegazy, O. Outliers detection and classification in wireless sensor networks. Egypt. Inform. J. 2013, 14, 157–164. [Google Scholar] [CrossRef] [Green Version]
- Shih, K.P.; Wang, S.S.; Yang, P.H.; Chang, C.C. CollECT: Collaborative Event deteCtion and Tracking in Wireless Heterogeneous Sensor Networks. In Proceedings of the 11th IEEE Symposium on Computers and Communications (ISCC’06), Cagliari, Italy, 26–29 June 2006; pp. 1–6. [Google Scholar]
- Chang, S.H.; Huang, T.S. A fuzzy knowledge based fault tolerance algorithm in wireless sensor networks. In Proceedings of the 26th IEEE International Conference on Advanced Information Networking and Applications Workshops, WAINA 2012, Fukuoka, Japan, 26–29 March 2012; pp. 891–896. [Google Scholar] [CrossRef]
- Swain, R.R.; Khilar, P.M.; Bhoi, S.K. Heterogeneous fault diagnosis for wireless sensor networks. Ad Hoc Netw. 2018, 69, 15–37. [Google Scholar] [CrossRef]
- Panda, M.; Khilar, P.M. Distributed self fault diagnosis algorithm for large scale wireless sensor networks using modified three sigma edit test. Ad Hoc Netw. 2015, 25, 170–184. [Google Scholar] [CrossRef]
- Luo, T.; Nagarajany, S.G. Distributed anomaly detection using autoencoder neural networks in WSN for IoT. In Proceedings of the IEEE International Conference on Communications, Kansas City, MO, USA, 20–24 May 2018. [Google Scholar] [CrossRef] [Green Version]
- Gao, Y.; Xiao, F.; Liu, J.; Wang, R. Distributed Soft Fault Detection for Interval Type-2 Fuzzy-Model-Based Stochastic Systems with Wireless Sensor Networks. IEEE Trans. Ind. Inform. 2019, 15, 334–347. [Google Scholar] [CrossRef]
- Arthi, M.; Arulmozhivarman, P. A Flexible and Cost-Effective Heterogeneous Network Deployment Scheme for Beyond 4G. Arab. J. Sci. Eng. 2016, 41, 5093–5109. [Google Scholar] [CrossRef]
- Masdari, M.; Özdemir, S. Towards Coverage-Aware Fuzzy Logic-Based Faulty Node Detection in Heterogeneous Wireless Sensor Networks. Wirel. Pers. Commun. 2020, 111, 581–610. [Google Scholar] [CrossRef]
- Chanak, P. Green fault detection scheme for IoT-enabled wireless sensor networks. Int. J. Commun. Syst. 2020, 33, e4611. [Google Scholar] [CrossRef]
- Liu, Y.; Pang, Z.; Karlsson, M.; Gong, S. Anomaly detection based on machine learning in IoT-based vertical plant wall for indoor climate control. Build. Environ. 2020, 183, 107212. [Google Scholar] [CrossRef]
- Rassam, M.A.; Zainal, A.; Maarof, M.A. An Efficient Distributed Anomaly Detection Model for Wireless Sensor Networks. AASRI Procedia 2013, 5, 9–14. [Google Scholar] [CrossRef]
- Ghorbel, O.; Abid, M.; Snoussi, H. Kernel principal subspace based outlier detection method in wireless sensor networks. In Proceedings of the 2014 IEEE 28th International Conference on Advanced Information Networking and Applications Workshops, IEEE WAINA 2014, Victoria, BC, Canada, 13–16 May 2014; pp. 737–742. [Google Scholar] [CrossRef]
- Ghorbel, O.; Abid, M.; Snoussi, H. Improved KPCA for outlier detection in Wireless Sensor Networks. In Proceedings of the 2014 1st International Conference on Advanced Technologies for Signal and Image Processing, ATSIP 2014, Sousse, Tunisia, 17–19 March 2014; pp. 507–511. [Google Scholar] [CrossRef]
- Ghorbel, O.; Ayedi, W.; Snoussi, H.; Abid, M. Fast and efficient outlier detection method in wireless sensor networks. IEEE Sens. J. 2015, 15, 3403–3411. [Google Scholar] [CrossRef]
- Rajasegarar, S.; Leckie, C.; Palaniswami, M.; Bezdek, J.C. Distributed anomaly detection in wireless sensor networks. In Proceedings of the 2006 10th IEEE Singapore International Conference on Communication Systems, Singapore, 30 October–1 November 2006. [Google Scholar] [CrossRef]
- Xu, S.; Hu, C.; Wang, L.; Zhang, G. Support Vector Machines based on K Nearest WSNs. In Proceedings of the 2012 8th International Conference on Wireless Communications, Networking and Mobile Computing (WiCOM), Shanghai, China, 21–23 September 2012; pp. 12–15. [Google Scholar]
- Hong, D.; Zhao, D.; Zhang, Y. The Entropy and PCA Based Anomaly Prediction in Data Streams. Procedia Comput. Sci. 2016, 96, 139–146. [Google Scholar] [CrossRef] [Green Version]
- Yu, T.; Wang, X.; Shami, A. Recursive Principal Component Analysis-Based Data Outlier Detection and Sensor Data Aggregation in IoT Systems. IEEE Internet Things J. 2017, 4, 2207–2216. [Google Scholar] [CrossRef]
- Saeedi Emadi, H.; Mazinani, S.M. A novel anomaly detection algorithm using DBSCAN and SVM in wireless sensor networks. Wirel. Pers. Commun. 2018, 98, 2025–2035. [Google Scholar] [CrossRef]
- Zidi, S.; Moulahi, T.; Alaya, B. Fault detection in wireless sensor networks through SVM classifier. IEEE Sens. J. 2018, 18, 340–347. [Google Scholar] [CrossRef]
- Spanos, G.; Giannoutakis, K.M.; Votis, K.; Tzovaras, D. Combining statistical and machine learning techniques in IoT anomaly detection for smart homes. In Proceedings of the IEEE International Workshop on Computer Aided Modeling and Design of Communication Links and Networks, CAMAD, Limassol, Cyprus, 11–13 September 2019; pp. 1–6. [Google Scholar] [CrossRef]
- Shukla, R.M.; Sengupta, S. Scalable and Robust Outlier Detector using Hierarchical Clustering and Long Short-Term Memory (LSTM) Neural Network for the Internet of Things. Internet Things 2020, 9, 100167. [Google Scholar] [CrossRef]
- De Vita, F.; Bruneo, D.; Das, S.K. A novel data collection framework for telemetry and anomaly detection in industrial iot systems. In Proceedings of the 5th ACM/IEEE Conference on Internet of Things Design and Implementation, IoTDI 2020, Sydney, NSW, Australia, 21–24 April 2020; pp. 245–251. [Google Scholar] [CrossRef]
Figure 1.
Applications area of outlier detection in IoTs.

Figure 2.
Sources of outliers in IoTs and corresponded detection techniques.

Figure 3.
Outlier Detection Approach in IoTs.

Figure 4.
Outlier detection strategies in IoTs.

Figure 5.
ROC curves examples for generic outlier detection approaches.

Figure 6.
Outlier detection challenges in IoTs.

Figure 7.
Outlier detection techniques for IoTs.


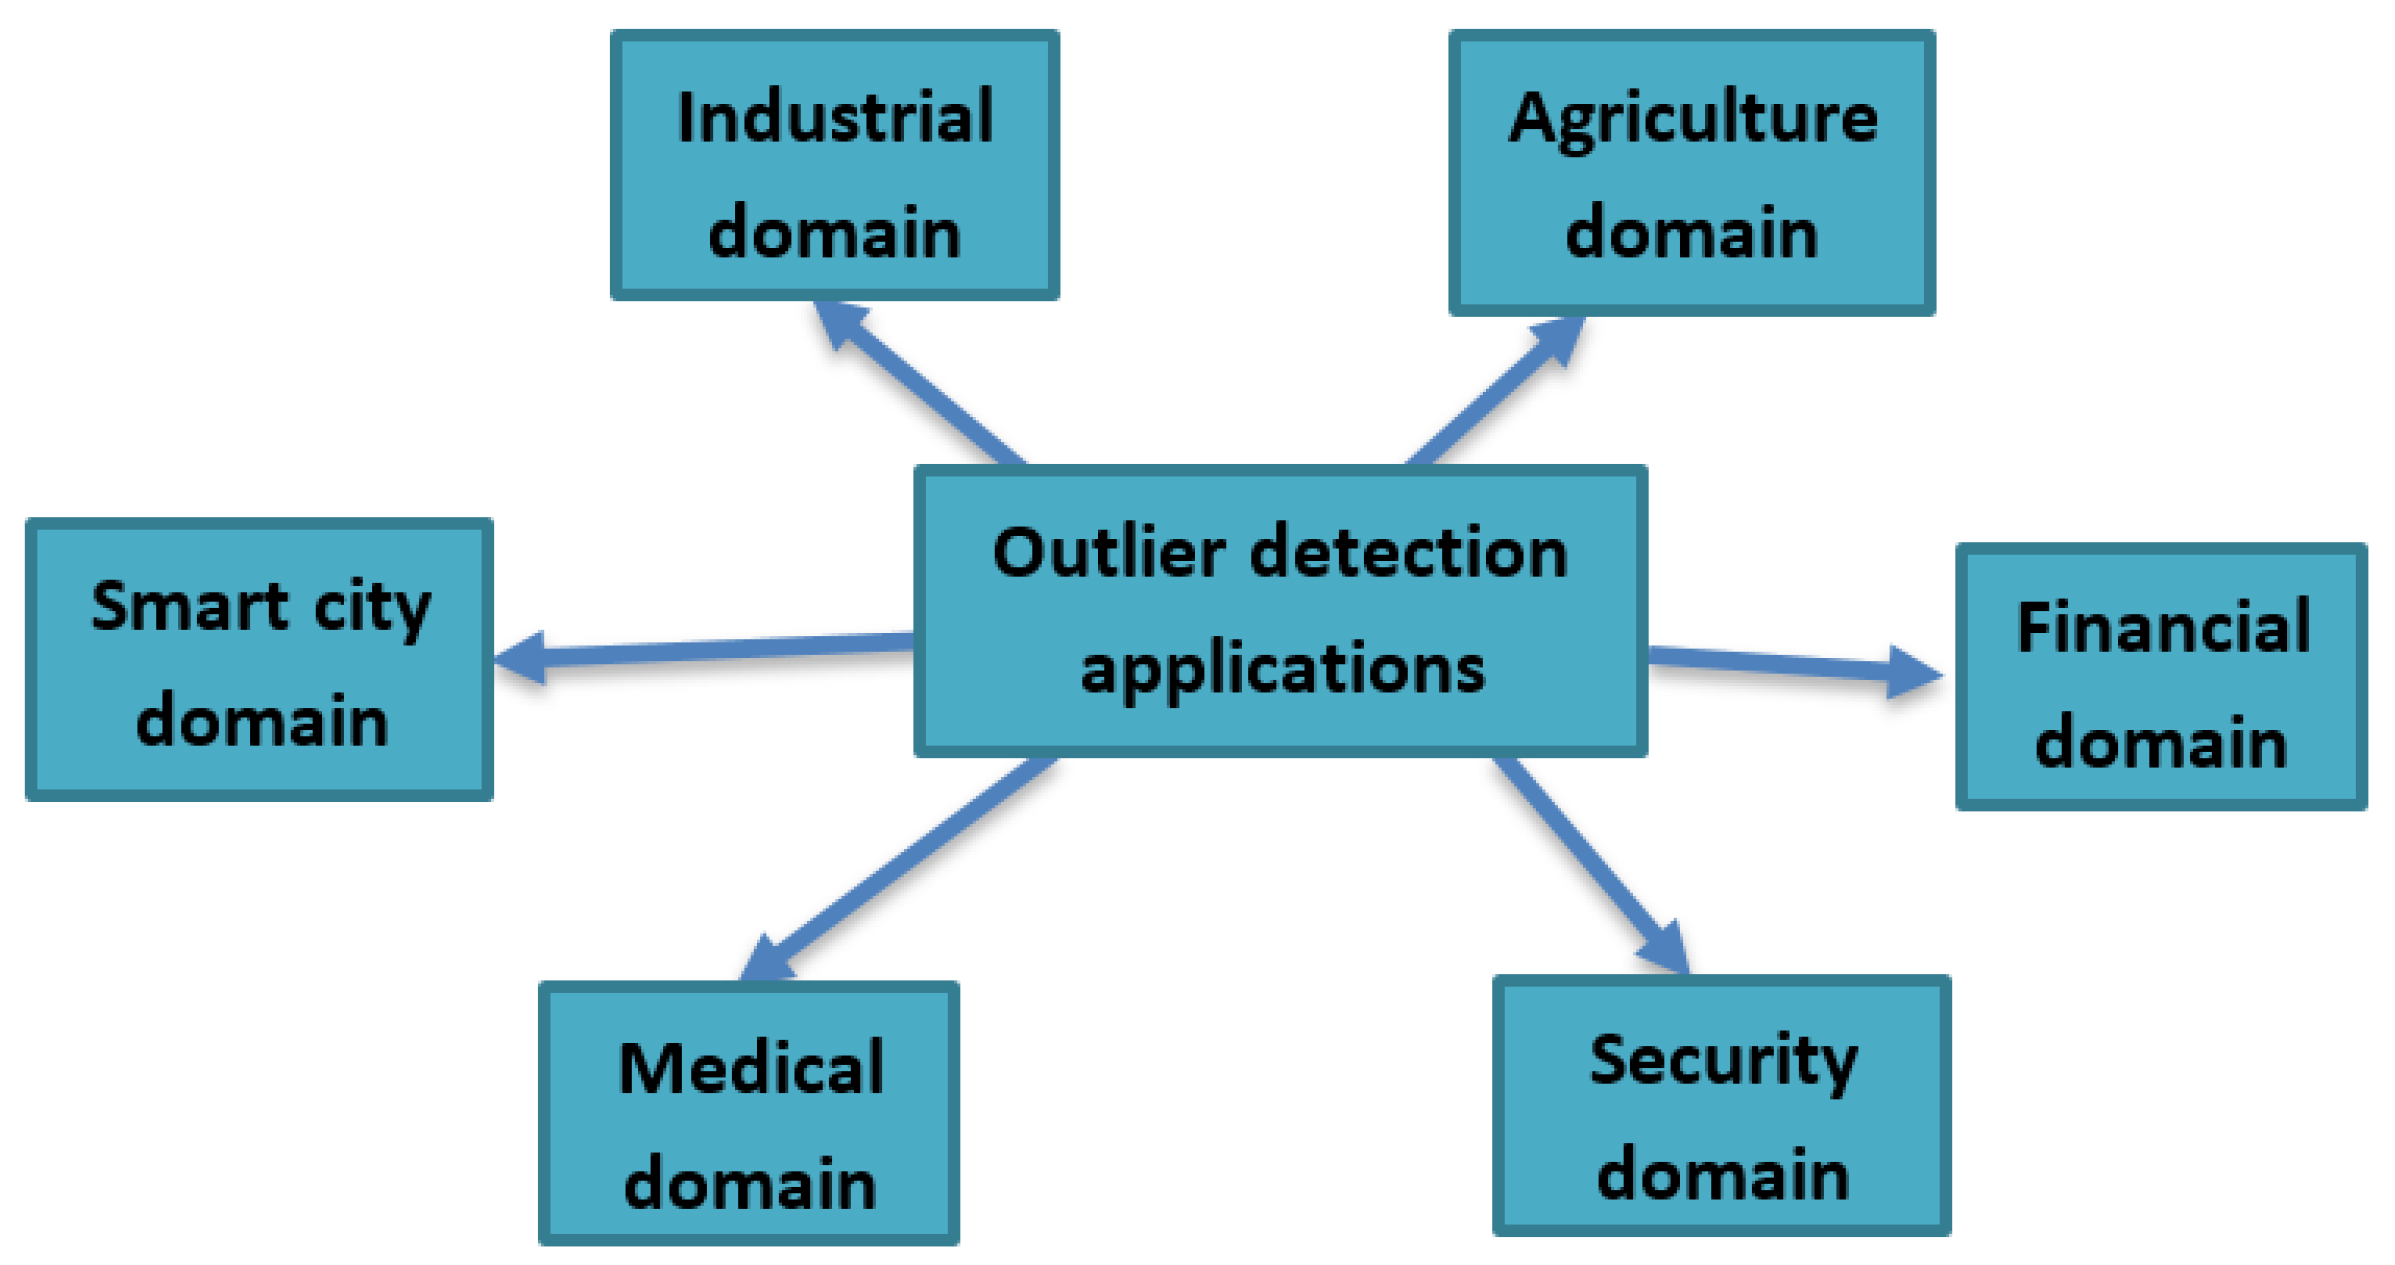
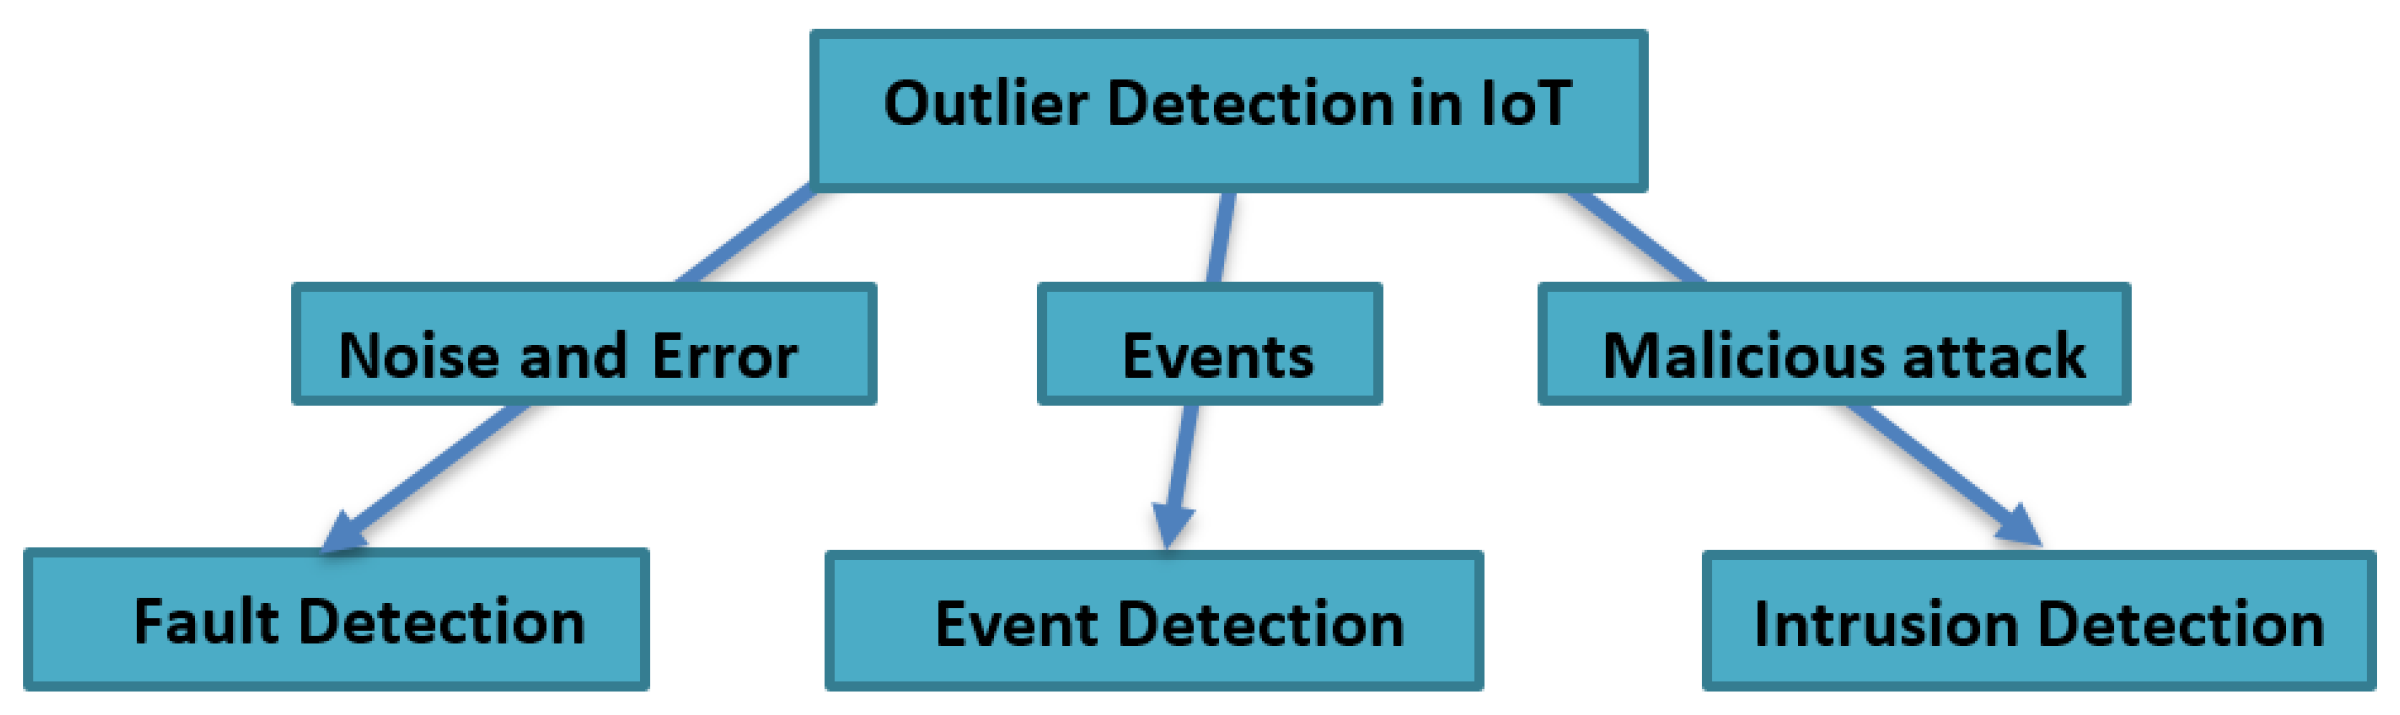
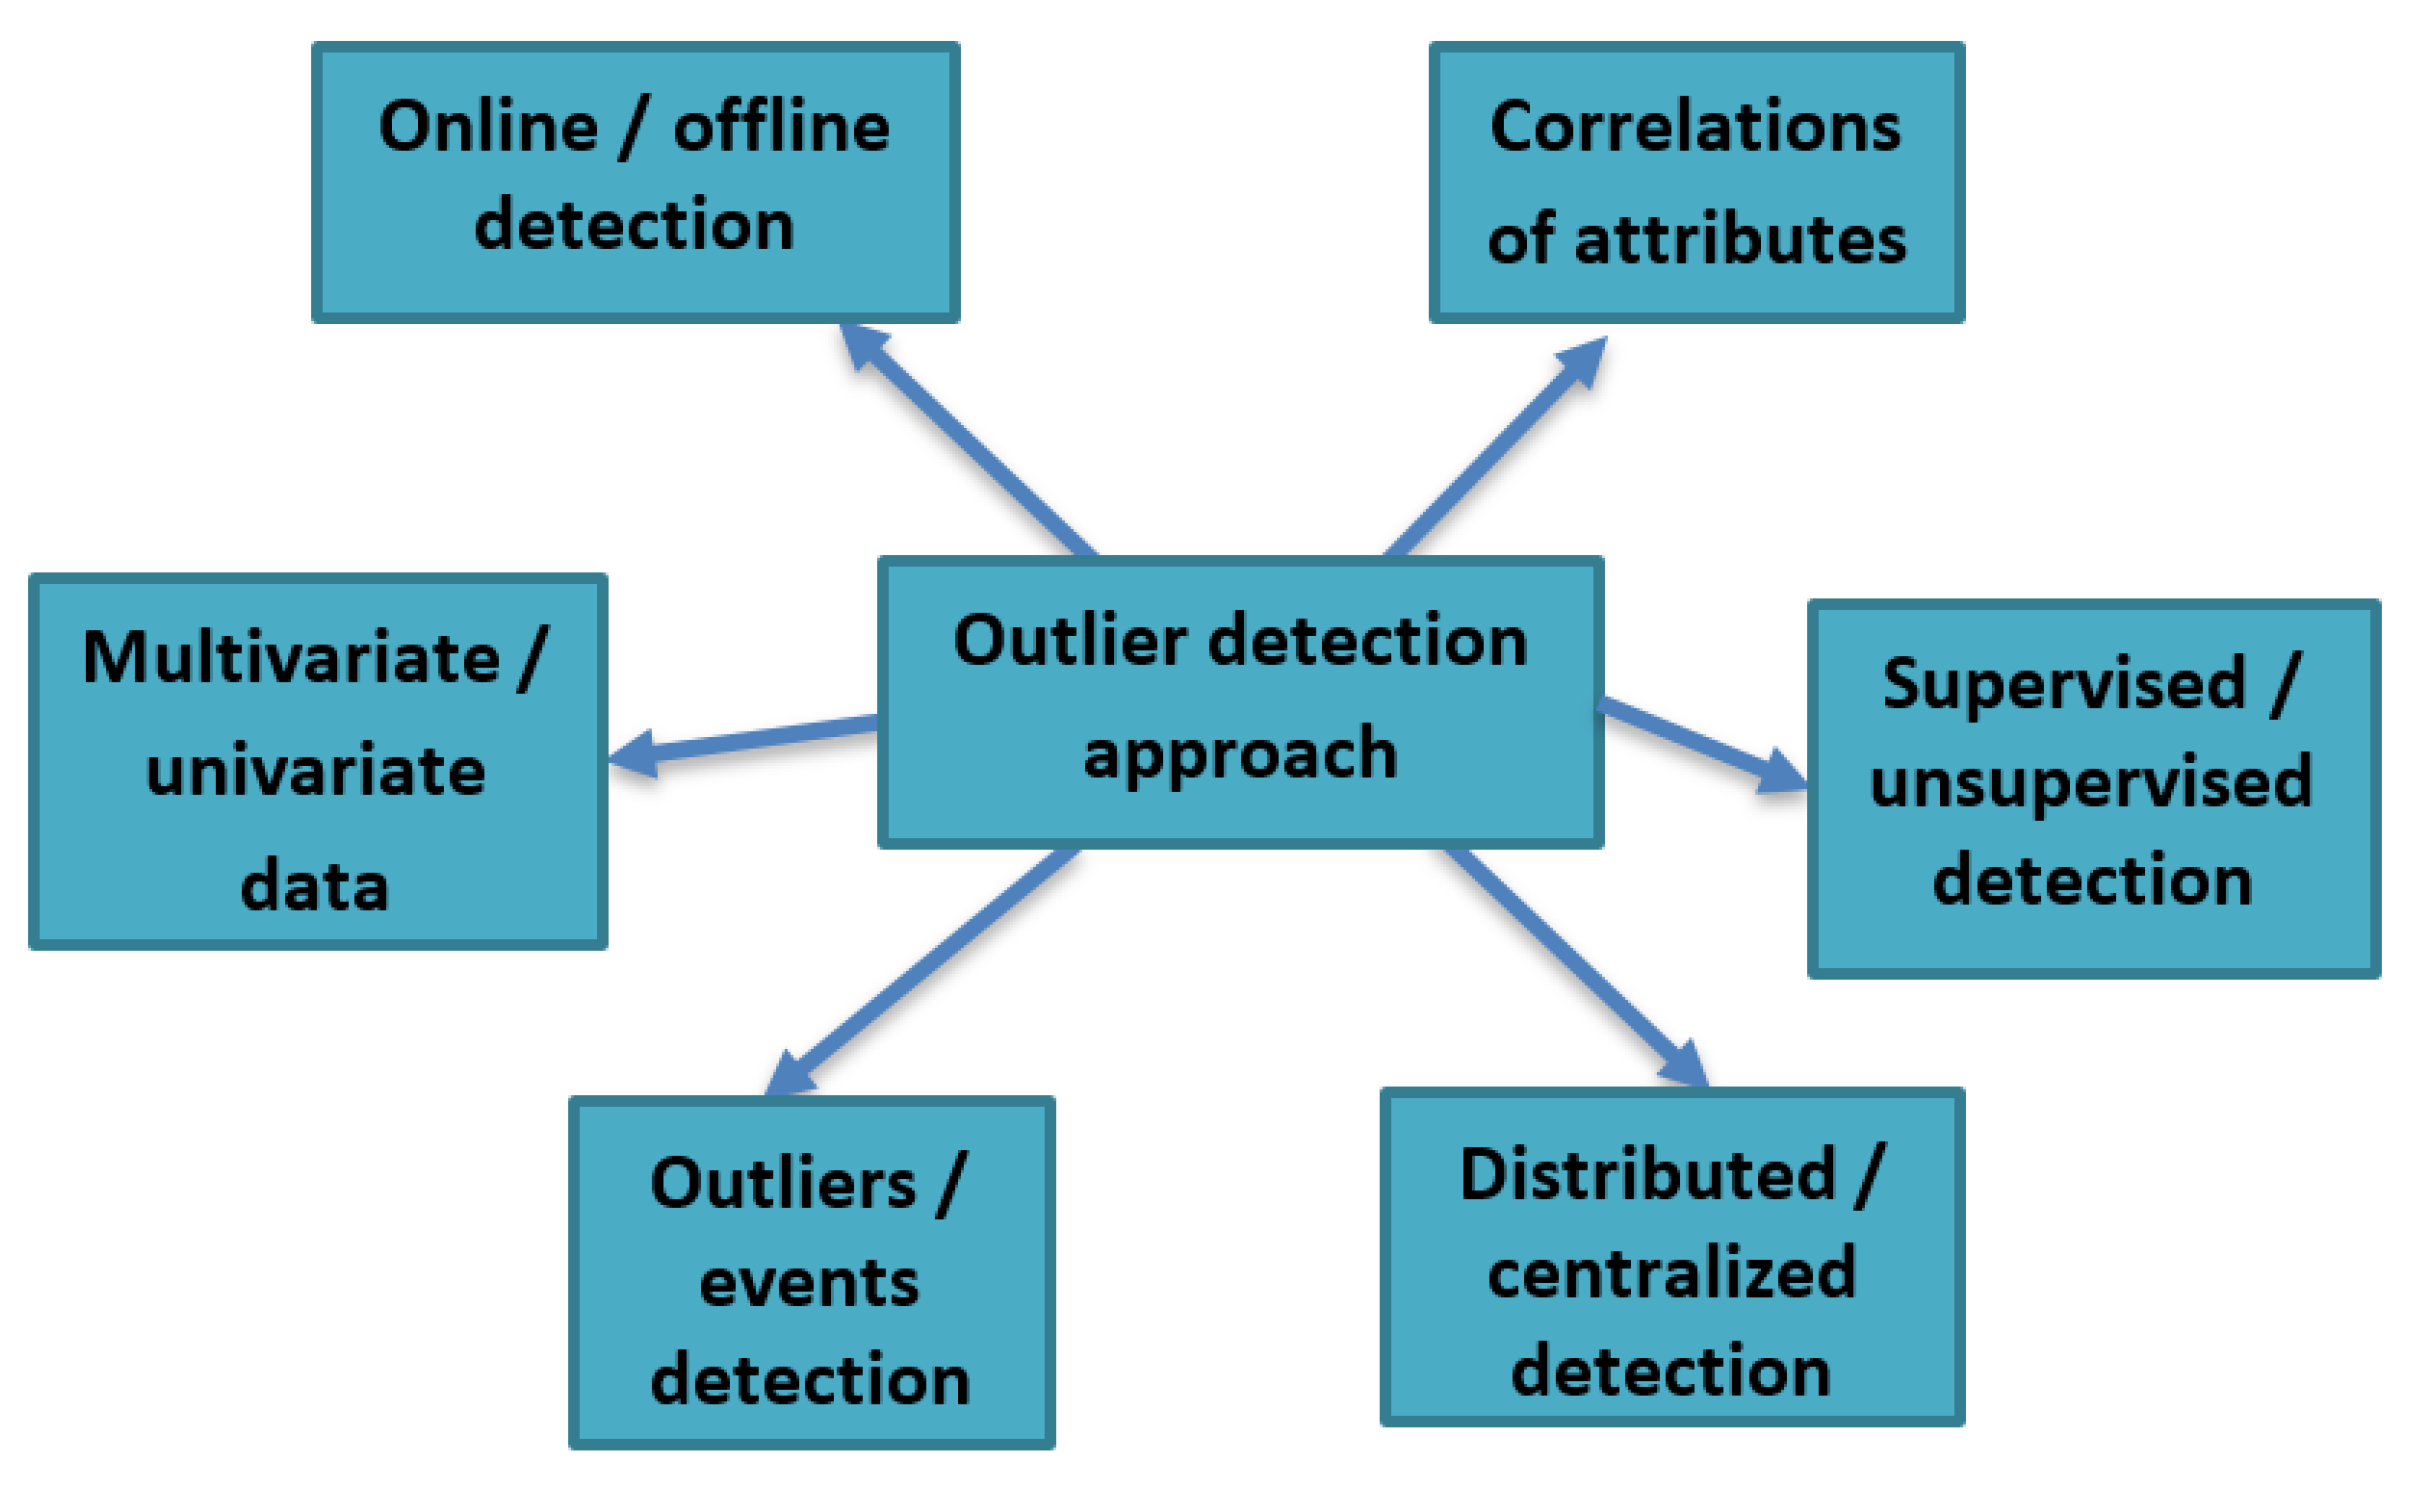
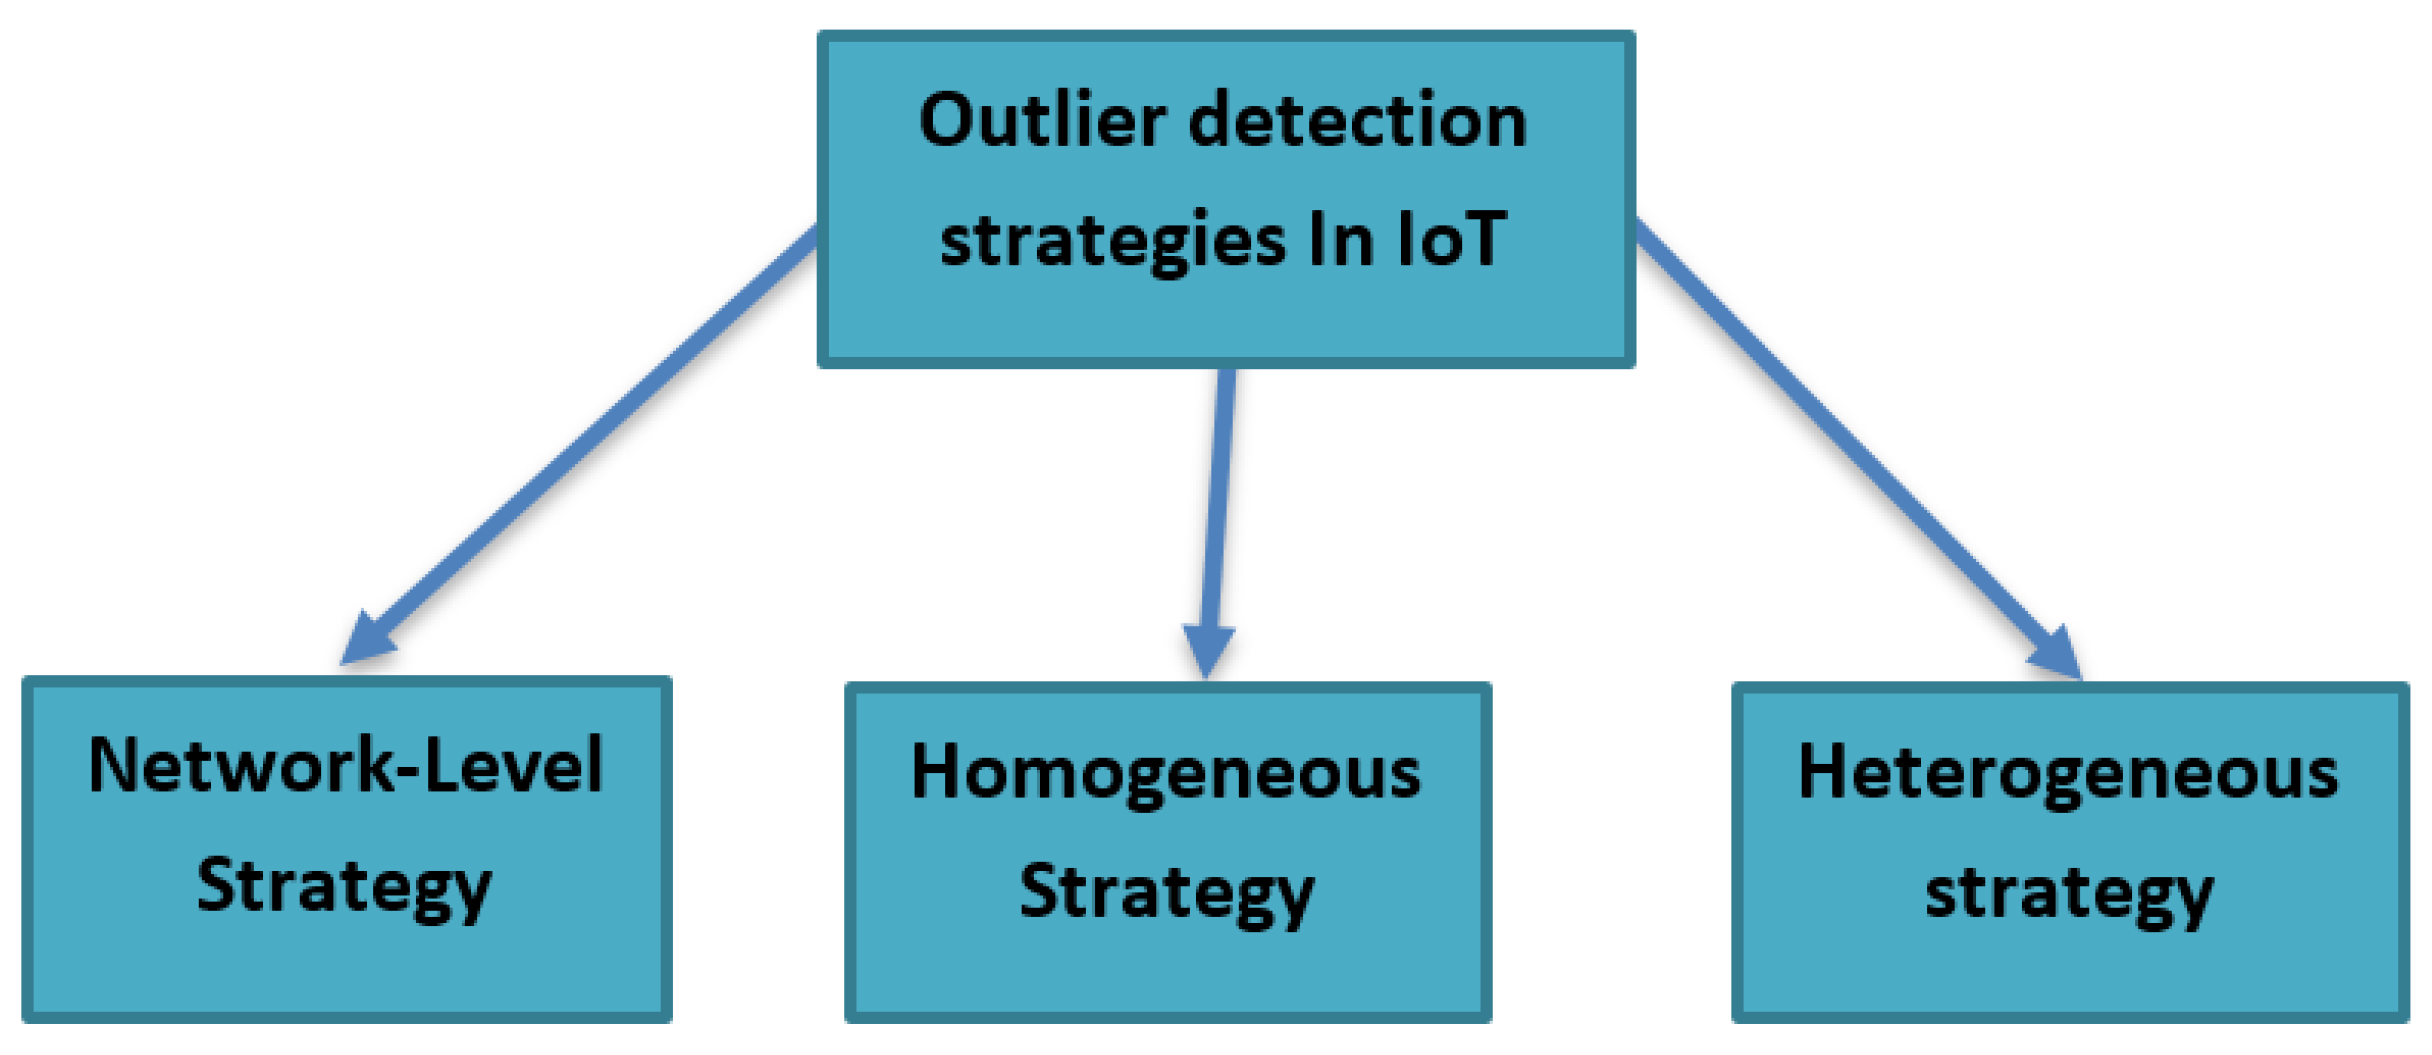
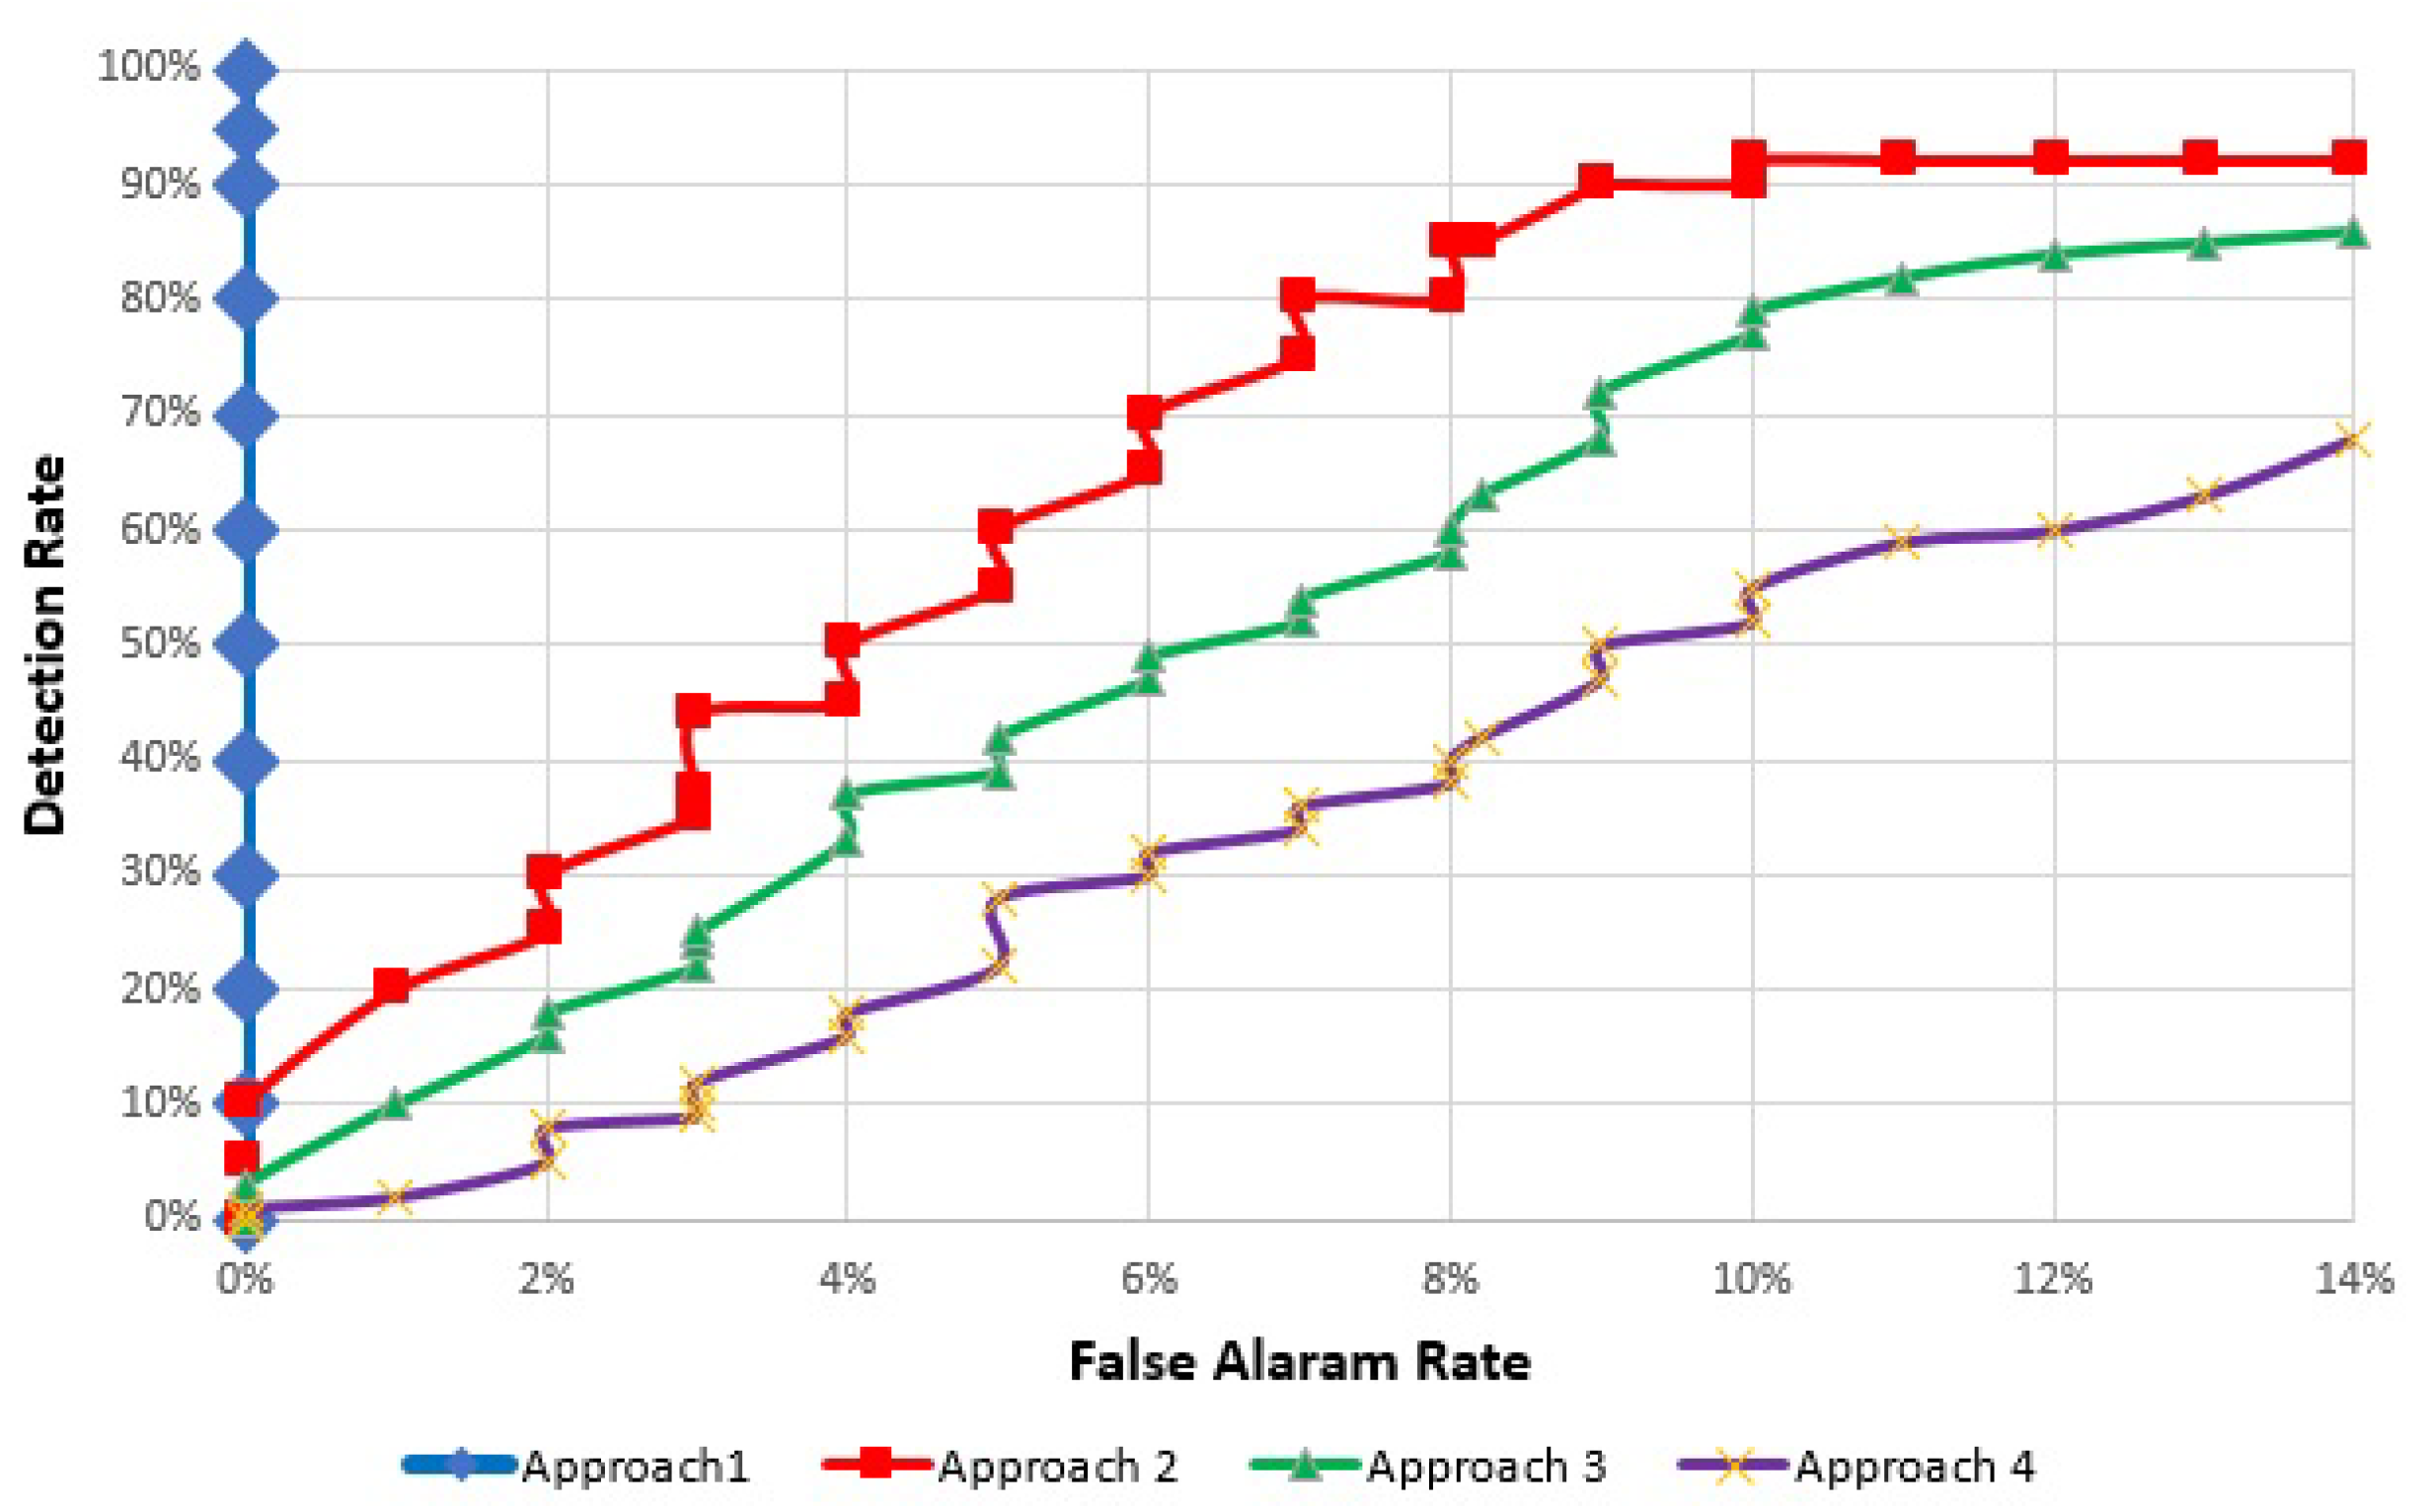
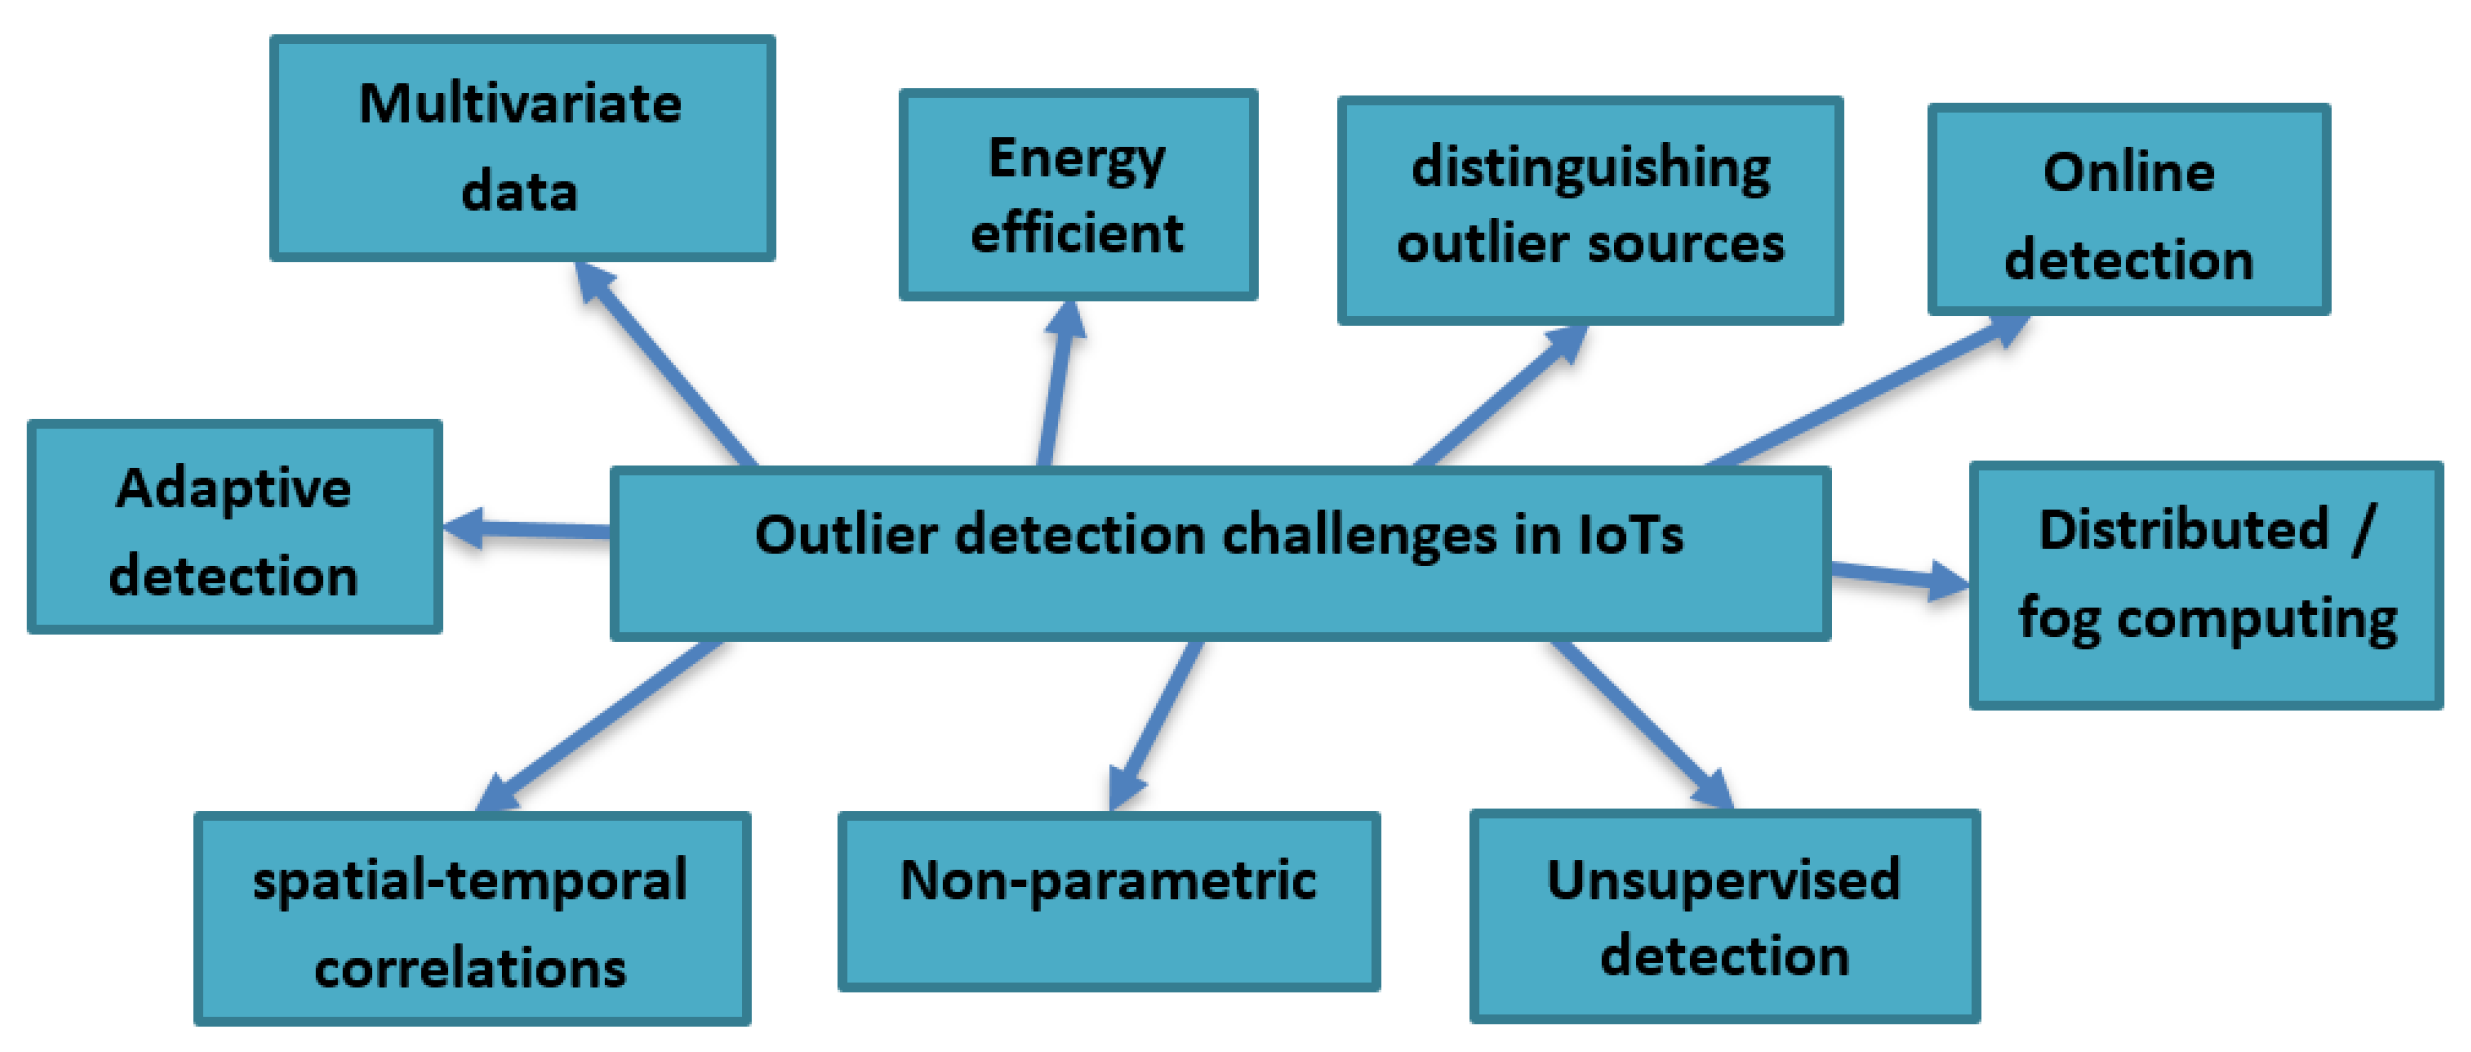
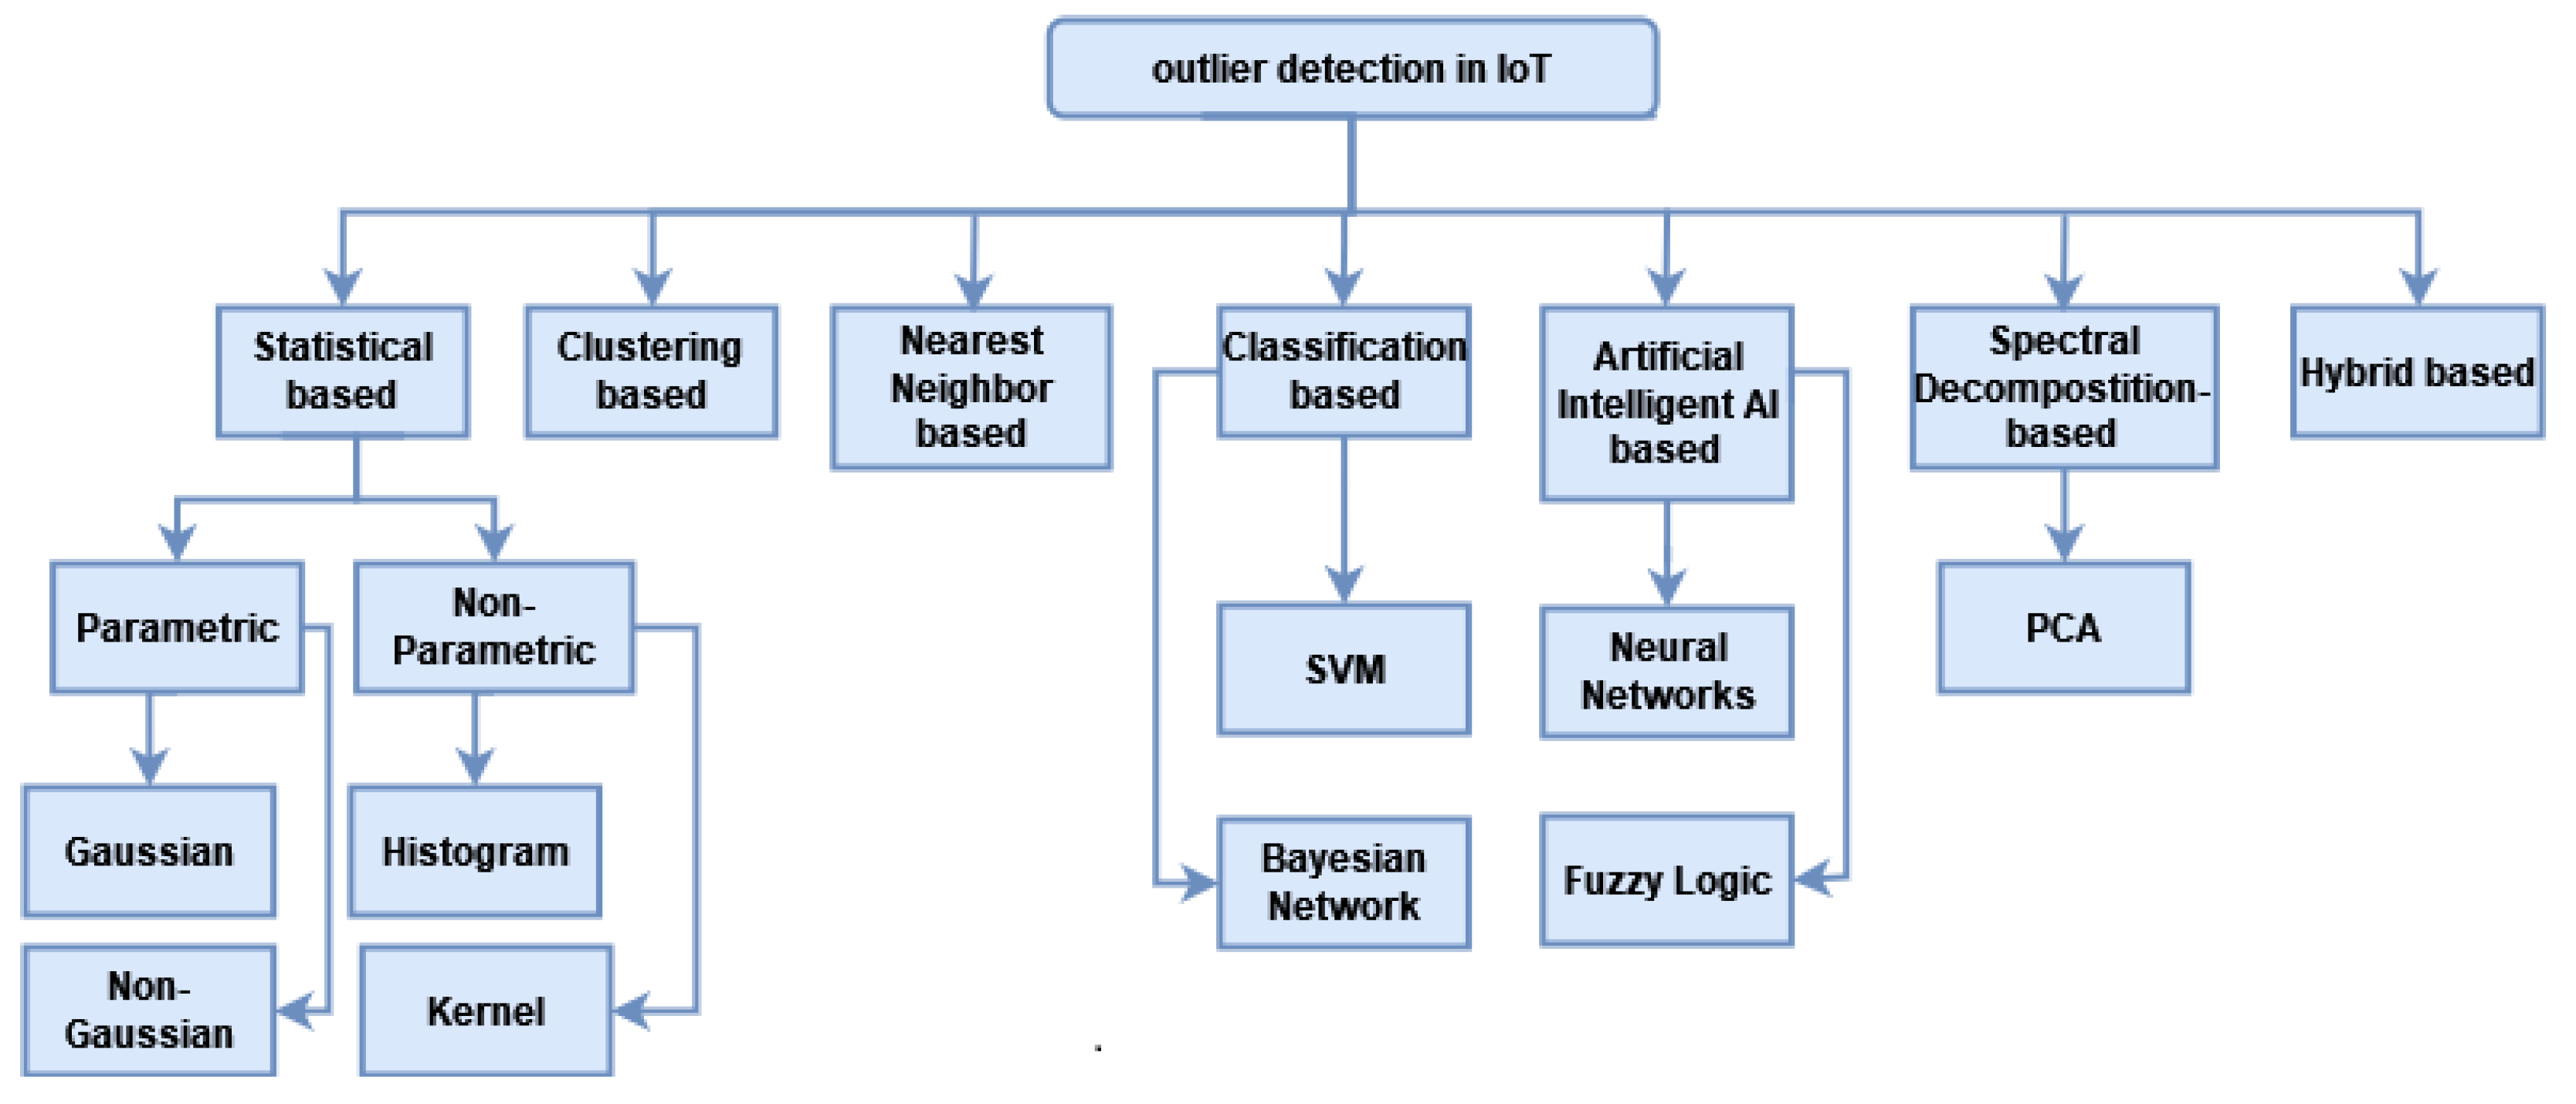
Table 1.
Comparative table of our survey versus already existing ones.
| Surveys | Categories Number | Technique Type | Outlier Detection for WSN | Outlier Detection for IoT | Outlier Detection for General Fields | Comparative Study of All Categories | Pros/Cons | Related Works Discussion |
|---|---|---|---|---|---|---|---|---|
| Our Work | 7 | all | ✓ | ✓ | - | ✓ | ✓ | ✓ |
| [1] 2020 | 5 | partially | - | ✓ | - | - | partially | partially |
| [11] 2009 | 6 | partially | - | - | ✓ | - | ✓ | ✓ |
| [17] 2010 | 5 | partially | ✓ | - | - | partially | partially | partially |
| [22] 2017 | 6 | all | ✓ | - | - | partially | ✓ | ✓ |
| [23] 2020 | 4 | machine learning | - | ✓ | - | partially | partially | partially |
| [24] 2018 | 4 | machine learning | ✓ | - | - | partially | partially | ✓ |
| [25] 2019 | 5 | machine learning | ✓ | ✓ | - | partially | - | partially |
| [26] 2019 | 6 | outlier detection progress | - | - | ✓ | partially | ✓ | ✓ |
Table 2.
Comparative Table of Statistical Based Techniques.
| Work and Year | Contribution Key Words | Nature of Data | Approach | Suitable for | ||||||||||
|---|---|---|---|---|---|---|---|---|---|---|---|---|---|---|
| Online | Offline | Distributed | Centralized | Univariate | Multivariate | Supervised | Unsupervised | Correlation S/T | Outlier Detection | Event Detection | ||||
| [30] 2012 | z-test, neighbouring coordination | Simulation | ✓ | x | ✓ | x | ✓ | x | x | ✓ | x | ✓ | x | WSN |
| [31] 2012 | TSOD, ARMA model | Experiments on real data | ✓ | x | ✓ | x | ✓ | x | ✓ | x | ✓ | ✓ | ✓ | WSN |
| [32] 2012 | Histogram | Experiments on real data | ✓ | x | ✓ | x | ✓ | x | x | ✓ | x | ✓ | x | WSN |
| [33] 2015 | AKDE–kernel, PDF | Experiments on real and synthetic data | ✓ | x | - | - | ✓ | x | x | ✓ | x | ✓ | x | Streaming data |
| [34] 2015 | ARMA model | radar’s health observations | ✓ | x | x | ✓ | ✓ | x | ✓ | x | x | ✓ | x | - |
| [35] 2018 | 4 Statistical models: CART, RF, GBM, LDA | Simulation on real collected data | x | ✓ | x | ✓ | ✓ | x | ✓ | × | ✓ | ✓ | ✓ | IoT |
Table 3.
Comparative Table of Clustering Based Techniques.
| Work and Year | Contribution Key Words | Nature of Data | Approach | Suitable for | ||||||||||
|---|---|---|---|---|---|---|---|---|---|---|---|---|---|---|
| Online | Offline | Distributed | Centralized | Univariate | Multivariate | Supervised | Unsupervised | Correlation S/T | Outlier Detection | Event Detection | ||||
| [36] 2013 | K-means | Experiments on real and synthetic data | - | - | - | - | x | ✓ | x | ✓ | x | ✓ | x | - |
| [37] 2015 | K-means, Bigdata, Hadoop, Mahout, MapReduce | Implement on Real data | x | ✓ | - | - | - | - | x | ✓ | x | ✓ | x | IoT Big Data |
| [40] 2015 | Cluster-based K-means, Distance-based, Euclidean distance | Simulation on R | x | ✓ | - | - | ✓ | x | x | ✓ | x | ✓ | x | - |
| [39] 2015 | RDD-DBSCAN | Synthetic data set | - | - | ✓ | x | ✓ | x | x | ✓ | x | ✓ | x | - |
| [41] 2016 | Clustering LOF | Experiments on real data | ✓ | x | ✓ | x | x | ✓ | x | ✓ | x | ✓ | x | Big Data |
| [43] 2016 | DBSCAN, Soft sensor modeling | Experiments on real data | - | - | - | - | ✓ | x | x | ✓ | x | ✓ | x | Time Series Data |
| [44] 2016 | KL divergence, Kernel density function | Experiments on real data | ✓ | x | ✓ | x | x | ✓ | x | ✓ | x | ✓ | x | WSN |
| [46] 2017 | DBSCAN | Experiments on real and synthetic data | ✓ | x | ✓ | - | ✓ | x | x | ✓ | x | ✓ | x | WSN |
| [45] 2017 | Clustering, ENOF, Fog computing | Experiments on real and synthetic data | ✓ | x | x | x | x | ✓ | x | ✓ | x | ✓ | x | IoT |
| [47] 2017 | Clustering | Experiments on real and synthetic data | - | - | - | - | x | ✓ | x | ✓ | x | ✓ | x | Big Data |
| [48] 2017 | K-means, KMOR | Experiments on real and synthetic data | - | - | - | - | x | ✓ | x | ✓ | x | ✓ | x | - |
| [49] 2018 | Birch Clustering, RC, Fog computing, Air quality monitoring | Antwerp’s City of Things testbed | - | - | x | x | x | ✓ | x | ✓ | x | ✓ | x | IoT |
| [50] 2020 | NRDD-DBSCAN | synthetic data set | - | - | ✓ | x | x | ✓ | x | ✓ | x | ✓ | x | IoT |
Table 4.
Comparative Table of KNN Based Techniques.
| Work and Year | Contribution Key Words | Nature of Data | Approach | Suitable for | ||||||||||
|---|---|---|---|---|---|---|---|---|---|---|---|---|---|---|
| Online | Offline | Distributed | Centralized | Univariate | Multivariate | Supervised | Unsupervised | Correlation S/T | Outlier Detection | Event Detection | ||||
| [51] 2009 | neighbour-based sliding window, monitoring | Experiments on real and synthetic data | - | - | - | - | x | ✓ | x | ✓ | x | ✓ | x | Streaming Data |
| [52] 2011 | MCOD Sliding window | Experiments on real and synthetic data | - | - | - | - | ✓ | x | x | ✓ | x | ✓ | x | Streaming Data |
| [53] 2014 | KNN-LEAP | Experiments on real streaming datasets | - | - | - | - | x | ✓ | x | ✓ | x | ✓ | x | Streaming Data |
| [54] 2016 | DNOD | Experiments on real and synthetic data | x | ✓ | - | - | ✓ | x | x | ✓ | x | ✓ | x | WSN |
| [55] 2017 | RDOS, KDE | Experiments on real and synthetic data | - | - | - | - | ✓ | x | x | ✓ | x | ✓ | x | - |
| [56] 2017 | neighbourhood information | Experiments on real data | ✓ | x | ✓ | x | x | ✓ | x | ✓ | ✓ | ✓ | ✓ | WSN |
| [57] 2020 | GAAOD, neighbour-based | Experiments on real data | - | - | - | - | x | ✓ | x | ✓ | x | ✓ | x | IoT |
Table 5.
Comparative Table of Classification Based Techniques.
| Work and Year | Contribution Key Words | Nature of Data | Approach | Suitable for | ||||||||||
|---|---|---|---|---|---|---|---|---|---|---|---|---|---|---|
| Online | Offline | Distributed | Centralized | Univariate | Multivariate | Supervised | Unsupervised | Correlation S/T | Outlier Detection | Event Detection | ||||
| [58] 2009 | OCSVM | Experiments on real and synthetic data | ✓ | x | ✓ | x | - | - | x | ✓ | ✓ | ✓ | x | WSN |
| [59] 2010 | QSSVM | Experiments on real and synthetic data | x | ✓ | ✓ | x | x | ✓ | x | ✓ | x | ✓ | x | WSN |
| [60] 2012 | STA-QS-SVM | Experiments on synthetic data | ✓ | x | ✓ | x | x | ✓ | x | ✓ | ✓ | ✓ | ✓ | WSN |
| [61] 2013 | hyper-ellipsoid OCSVM | Experiments on real and synthetic data | ✓ | x | ✓ | x | x | ✓ | x | ✓ | ✓ | ✓ | x | WSN |
| [62] 2014 | ENOF | Experiments on real and synthetic data | - | - | ✓ | x | x | ✓ | - | - | x | ✓ | x | WSN |
| [63] 2015 | Bayesian | Experiments on real and synthetic data | ✓ | x | ✓ | x | - | - | ✓ | x | - | ✓ | x | WSN |
| [64] 2015 | Bayesian | Simulation | - | - | ✓ | x | ✓ | x | ✓ | x | x | ✓ | x | WSN |
| [66] 2016 | LS-OC-SVM | Experiments on two dimensions synthetic data | ✓ | x | - | - | ✓ | x | x | ✓ | x | ✓ | x | Power Grid Sensor Data |
| [67] 2018 | TED-OCSVM, Monitoring | Experiments on real data and simulation data | x | ✓ | x | ✓ | - | - | ✓ | x | ✓ | ✓ | x | IWSN |
| [68] 2019 | OCSTuM, GA-OCSTuM | Experiments on real data | x | ✓ | x | ✓ | x | ✓ | x | ✓ | x | ✓ | x | IoT Big Data |
| [69] 2019 | DODS, Bayesian classifier | Experiments on real and synthetic data | x | ✓ | ✓ | x | ✓ | x | ✓ | x | T | ✓ | x | WSN |
Table 6.
Comparative Table of AI Based Techniques.
| Work and Year | Contribution Key Words | Nature of Data | Approach | Suitable for | ||||||||||
|---|---|---|---|---|---|---|---|---|---|---|---|---|---|---|
| Online | Offline | Distributed | Centralized | Univariate | Multivariate | Supervised | Unsupervised | Correlation S/T | Outlier Detection | Event Detection | ||||
| [72] 2012 | FKBC, clustering framework | Simulation | - | - | x | ✓ | ✓ | x | - | - | x | ✓ | x | WSN |
| [73] 2017 | HFD, PNN | Simulation and testbed experiments | x | ✓ | x | ✓ | ✓ | x | - | - | x | ✓ | × | WSN |
| [24] 2018 | Bayesian Belief Network, COMIS | Simulation | - | - | - | - | - | - | ✓ | x | x | ✓ | x | WSN |
| [75] 2018 | Autoencoder Neural Network | Experiments on WSN testbed | - | - | ✓ | x | ✓ | x | x | ✓ | x | ✓ | x | IoT-WSN |
| [76] 2019 | IT2 T-S fuzzy models | Simulation on truck-trailer system | - | - | ✓ | x | ✓ | x | - | - | x | ✓ | x | WSN |
| [20] 2019 | FIS, fuzzy rules | Simulation | - | - | x | ✓ | ✓ | x | - | - | x | ✓ | x | IoT-WSN |
| [78] 2020 | DFLFND, FLC | Simulation | - | - | ✓ | x | ✓ | x | - | - | ✓ | ✓ | ✓ | WSN |
| [79] 2020 | Vague set Fuzzy logic | Simulation | - | - | ✓ | x | ✓ | x | - | - | x | ✓ | x | IoT-WSN |
| [80] 2020 | Autoencoder, LSTM | Simulation | ✓ | x | - | - | ✓ | x | x | ✓ | x | ✓ | x | IoT |
Table 7.
Comparative Table of PCA-Based Techniques.
| Work and Year | Contribution Key Words | Nature of Data | Approach | Suitable for | ||||||||||
|---|---|---|---|---|---|---|---|---|---|---|---|---|---|---|
| Online | Offline | Distributed | Centralized | Univariate | Multivariate | Supervised | Unsupervised | Correlation S/T | Outlier Detection | Event Detection | ||||
| [81] 2013 | PCA | Experiments on real data | ✓ | x | ✓ | x | ✓ | x | x | ✓ | x | ✓ | x | WSN |
| [84] 2015 | KPCA, MD, RE | Experimental on real data | x | ✓ | x | ✓ | x | ✓ | x | ✓ | x | ✓ | x | WSN |
Table 8.
Comparative Table of Hybrid-Based Techniques.
| Work and Year | Contribution Key Words | Nature of Data | Approach | Suitable for | ||||||||||
|---|---|---|---|---|---|---|---|---|---|---|---|---|---|---|
| Online | Offline | Distributed | Centralized | Univariate | Multivariate | Supervised | Unsupervised | Correlation S/T | Outlier Detection | Event Detection | ||||
| [85] 2006 | DAD, K-NN, Clustering | Simulation based on real data | x | ✓ | ✓ | x | x | ✓ | x | ✓ | T | ✓ | x | WSN |
| [86] 2012 | KNN, SVM, Incident monitoring | Experiments on real data | x | ✓ | x | ✓ | x | ✓ | x | ✓ | ✓ | ✓ | x | WSN |
| [70] 2013 | K-NN, Clustering | Experiments on real data | x | ✓ | ✓ | x | ✓ | x | x | ✓ | ✓ | ✓ | ✓ | WSN |
| [87] 2016 | PCA, information entropy theory support vector regression | Experiments on real data | x | ✓ | - | - | x | ✓ | ✓ | x | x | ✓ | x | Streaming data |
| [88] 2017 | RPCA, K-means | Experiments on real data | - | ✓ | x | ✓ | x | ✓ | x | ✓ | S | ✓ | x | IoT |
| [90] 2018 | Statistical learning, SVM based on Kernel function | Experiments on real data | - | - | x | ✓ | x | ✓ | ✓ | x | x | ✓ | x | WSN |
| [89] 2018 | DBSCAN, SVM | Experiments on real data | x | ✓ | x | ✓ | x | ✓ | x | ✓ | x | ✓ | × | WSN |
| [91] 2019 | statistic, machine learning | Real smart home dataset | - | - | x | ✓ | - | - | ✓ | x | x | ✓ | x | IoT |
| [92] 2020 | Hierarchical clustering, LSTM Neural Network, M-estimators | Experiments on real data | (Step 2) | (Step 1) | x | ✓ | ✓ | x | x | ✓ | x | ✓ | x | IoT |
| [93] 2020 | Deep learning, Neural Networks, PCA, K-means | Industrial S4T framework created data and synthetic data | - | - | x | ✓ | ✓ | x | x | ✓ | x | ✓ | x | IoT |
Table 9.
Comparative Table of Pros and Cons of Outlier Detection Techniques.
| Technique | Pros | Cons |
|---|---|---|
| Statistical Based |
|
|
| Clustering Based |
|
|
| Nearest neighbour Based |
|
|
| Classification Based |
|
|
| Artificial Intelligent Based |
|
|
| PCA Based |
|
|
| Hybrid Based |
|
|
Publisher’s Note: MDPI stays neutral with regard to jurisdictional claims in published maps and institutional affiliations. |
© 2022 by the authors. Licensee MDPI, Basel, Switzerland. This article is an open access article distributed under the terms and conditions of the Creative Commons Attribution (CC BY) license (https://creativecommons.org/licenses/by/4.0/).
Share and Cite
MDPI and ACS Style
Samara, M.A.; Bennis, I.; Abouaissa, A.; Lorenz, P. A Survey of Outlier Detection Techniques in IoT: Review and Classification. J. Sens. Actuator Netw. 2022, 11, 4. https://0-doi-org.brum.beds.ac.uk/10.3390/jsan11010004
AMA Style
Samara MA, Bennis I, Abouaissa A, Lorenz P. A Survey of Outlier Detection Techniques in IoT: Review and Classification. Journal of Sensor and Actuator Networks. 2022; 11(1):4. https://0-doi-org.brum.beds.ac.uk/10.3390/jsan11010004
Chicago/Turabian StyleSamara, Mustafa Al, Ismail Bennis, Abdelhafid Abouaissa, and Pascal Lorenz. 2022. "A Survey of Outlier Detection Techniques in IoT: Review and Classification" Journal of Sensor and Actuator Networks 11, no. 1: 4. https://0-doi-org.brum.beds.ac.uk/10.3390/jsan11010004
Note that from the first issue of 2016, this journal uses article numbers instead of page numbers. See further details here.