Article

Portable IoT Body Temperature Screening System to Combat the Adverse Effects of COVID-19

by
Kisheen Rao Gsangaya
1,
Sami Salama Hussen Hajjaj
1,2,*,
Mohamed Thariq Hameed Sultan
3,4,5,*,
Farah Syazwani Shahar
3 and
Ain Umaira Md Shah
3
1
Centre for Advanced Mechatronics and Robotics (CaMaRo), Putrajaya Campus, Universiti Tenaga Nasional (UNITEN), Jalan Ikram-Uniten, Kajang 43000, Selangor Darul Ehsan, Malaysia
2
Institute of Informatics and Computing in Energy (IICE), Putrajaya Campus, Universiti Tenaga Nasional (UNITEN), Jalan Ikram-Uniten, Kajang 43000, Selangor Darul Ehsan, Malaysia
3
Department of Aerospace, Faculty of Engineering, Universiti Putra Malaysia, Serdang 43400, Selangor Darul Ehsan, Malaysia
4
Laboratory of Biocomposite Technology, Institute of Tropical Forestry and Forest Products (INTROP), Universiti Putra Malaysia, Serdang 43400, Selangor Darul Ehsan, Malaysia
5
Prime Minister’s Department, Aerospace Malaysia Innovation Centre (944751-A), MIGHT Partnership Hub, Jalan Impact, Cyberjaya 63000, Selangor Darul Ehsan, Malaysia
*
Authors to whom correspondence should be addressed.
J. Sens. Actuator Netw. 2022, 11(2), 22; https://0-doi-org.brum.beds.ac.uk/10.3390/jsan11020022
Submission received: 12 March 2022 / Revised: 3 April 2022 / Accepted: 6 April 2022 / Published: 21 April 2022

Abstract

:
In managing the COVID-19 pandemic, the Malaysian government enforced mandatory body temperature screening as a rudimentary form of infection detection at the entry points of establishments and public transportation. However, previous iterations of IoT body temperature screening systems were bulky, fragile, expensive, and designed for personal use instead of the screening of many people. Therefore, a standalone, portable, and rugged IoT-enabled body temperature screening system for detecting elevated temperatures was developed in this research work. This system uses a proximity sensor to detect subjects and determine their body temperature using a non-contact temperature sensor. Body temperature data is displayed on the device and uploaded over a Wi-Fi network to a cloud server for data storage and analysis. From the cloud server, body temperature information is retrieved and displayed on the Blynk IoT client dashboard for remote monitoring. The device also provides alerts for body temperatures above 37.5 °C. The prototype system performed impressively during the assessment. Body temperature readings were impressively accurate compared to a medical-grade non-contact thermometer, with an average variance of less than 1%. Additionally, the system was highly reliable, with a 100% IoT data broadcast success rate.

1. Introduction

The coronavirus disease (COVID-19) pandemic is the defining global health crisis of recent times and the greatest threat humanity has faced of late. COVID-19 is an infectious disease caused by the SARS-CoV-2 virus [1]. The virus spreads via respiratory droplets from an infected person or by touching a contaminated surface. Symptoms range from high fever or chills, runny nose and cough, shortness of breath or difficulty breathing, fatigue and body aches, vomiting and diarrhoea, as well as loss of taste or smell. Persons at the greatest risk of developing severe complications include adults over the age of 60 and those with underlying medical conditions or a weakened immune system [2].
Since its emergence in Asia in late 2019, the virus has spread to every corner of the globe, killing millions and infecting many more. As it stands, the global death toll resulting from the virus is 5.5 million from over 300 million reported infections [3]. In fact, experts warn that up to 70% of the world’s population will be infected with the virus by the end of the pandemic [4]. In addition to being an international health crisis, the pandemic is also an unprecedented socio-economic crisis. The pandemic has wreaked havoc on the social, economic, and political spheres of even the most developed countries, such as the United States, Italy, Spain, and the United Kingdom. The deep scars inflicted by the wrath of the virus will undoubtedly linger for many years to come [5].
In Malaysia, the worst effects of the pandemic have been somewhat alleviated by the introduction of the movement control order (MCO) announced by the government. The partial lockdown has succeeded in drastically reducing the infection rate and fatalities in the country. In fact, the global health community has lauded Malaysia’s response and efforts in managing and controlling the COVID-19 pandemic as one of the most successful in the world during the first phase of infections [6].
However, despite sustained efforts from the government to curb the spread of the virus, the country has seen a rapid rise in the number of daily infections in recent months, breaching the five-figure mark in daily new cases in early July and reaching a peak of around 20,000 new daily cases by the end of August. This worrying issue has been further exacerbated by the emergence of newer and highly contagious variants such as Delta and Omicron [7].
Fortunately, the number of new daily infections has seen a steady decline over the past couple of months, thanks in no small part to the high vaccination rate of the Malaysian population [8]. However, as witnessed from the rising number of worldwide infection cases each day, the war on COVID-19 is far from over. The government has once again stressed the significance of practicing new normal measures such as social distancing guidelines, the mandatory use of facemasks in public, and strict standard operating procedures (SOP) for eateries, retail outlets, and businesses while reopening the economic sector through the recovery MCO [9].
The most basic SOP set by the Malaysian government is body temperature screening and contact-tracing via the MySejahtera mobile application. For instance, when entering a restaurant, shopping mall, business premise, or even when using public transportation, members of the public must test their body temperature before scanning the QR code at the specific location with MySejahtera. Since one of the most common symptoms of COVID-19 is a fever, body temperature screening can provide a quick and rudimentary assessment to determine if a person might have COVID-19 [10]. Failure to practice these measures could result in hefty fines [11].
However, the current method of body temperature screening at most public spaces employs security guards to personally scan individual visitors using non-contact thermometers [12]. This approach not only results in high manpower requirements and labor costs to screen a large number of people daily but also increases the risk of transmission and spread of COVID-19 due to close contact. Additionally, these simple thermometers only provide a live reading and not historical data, which could help cross-reference visitors for contact-tracing purposes.
As COVID-19 is the first global pandemic to arise in the digital age, many advanced technologies and platforms have been employed to curb the spread of the virus. Researchers have attempted to develop Internet of Things (IoT)-enabled smart thermometers for this exact purpose. However, previous iterations of IoT body temperature screening systems have been plagued with issues that have hindered widespread adoption. These issues are listed below:
  • Robustness: These devices are bulky and fragile due to the lack of an enclosure to safeguard their internal components [13].
  • Costs and maintenance: As these systems are integrated into existing infrastructure, such as smart doors for monitoring body temperature and facemask detection, they can be expensive to deploy and maintain [14].
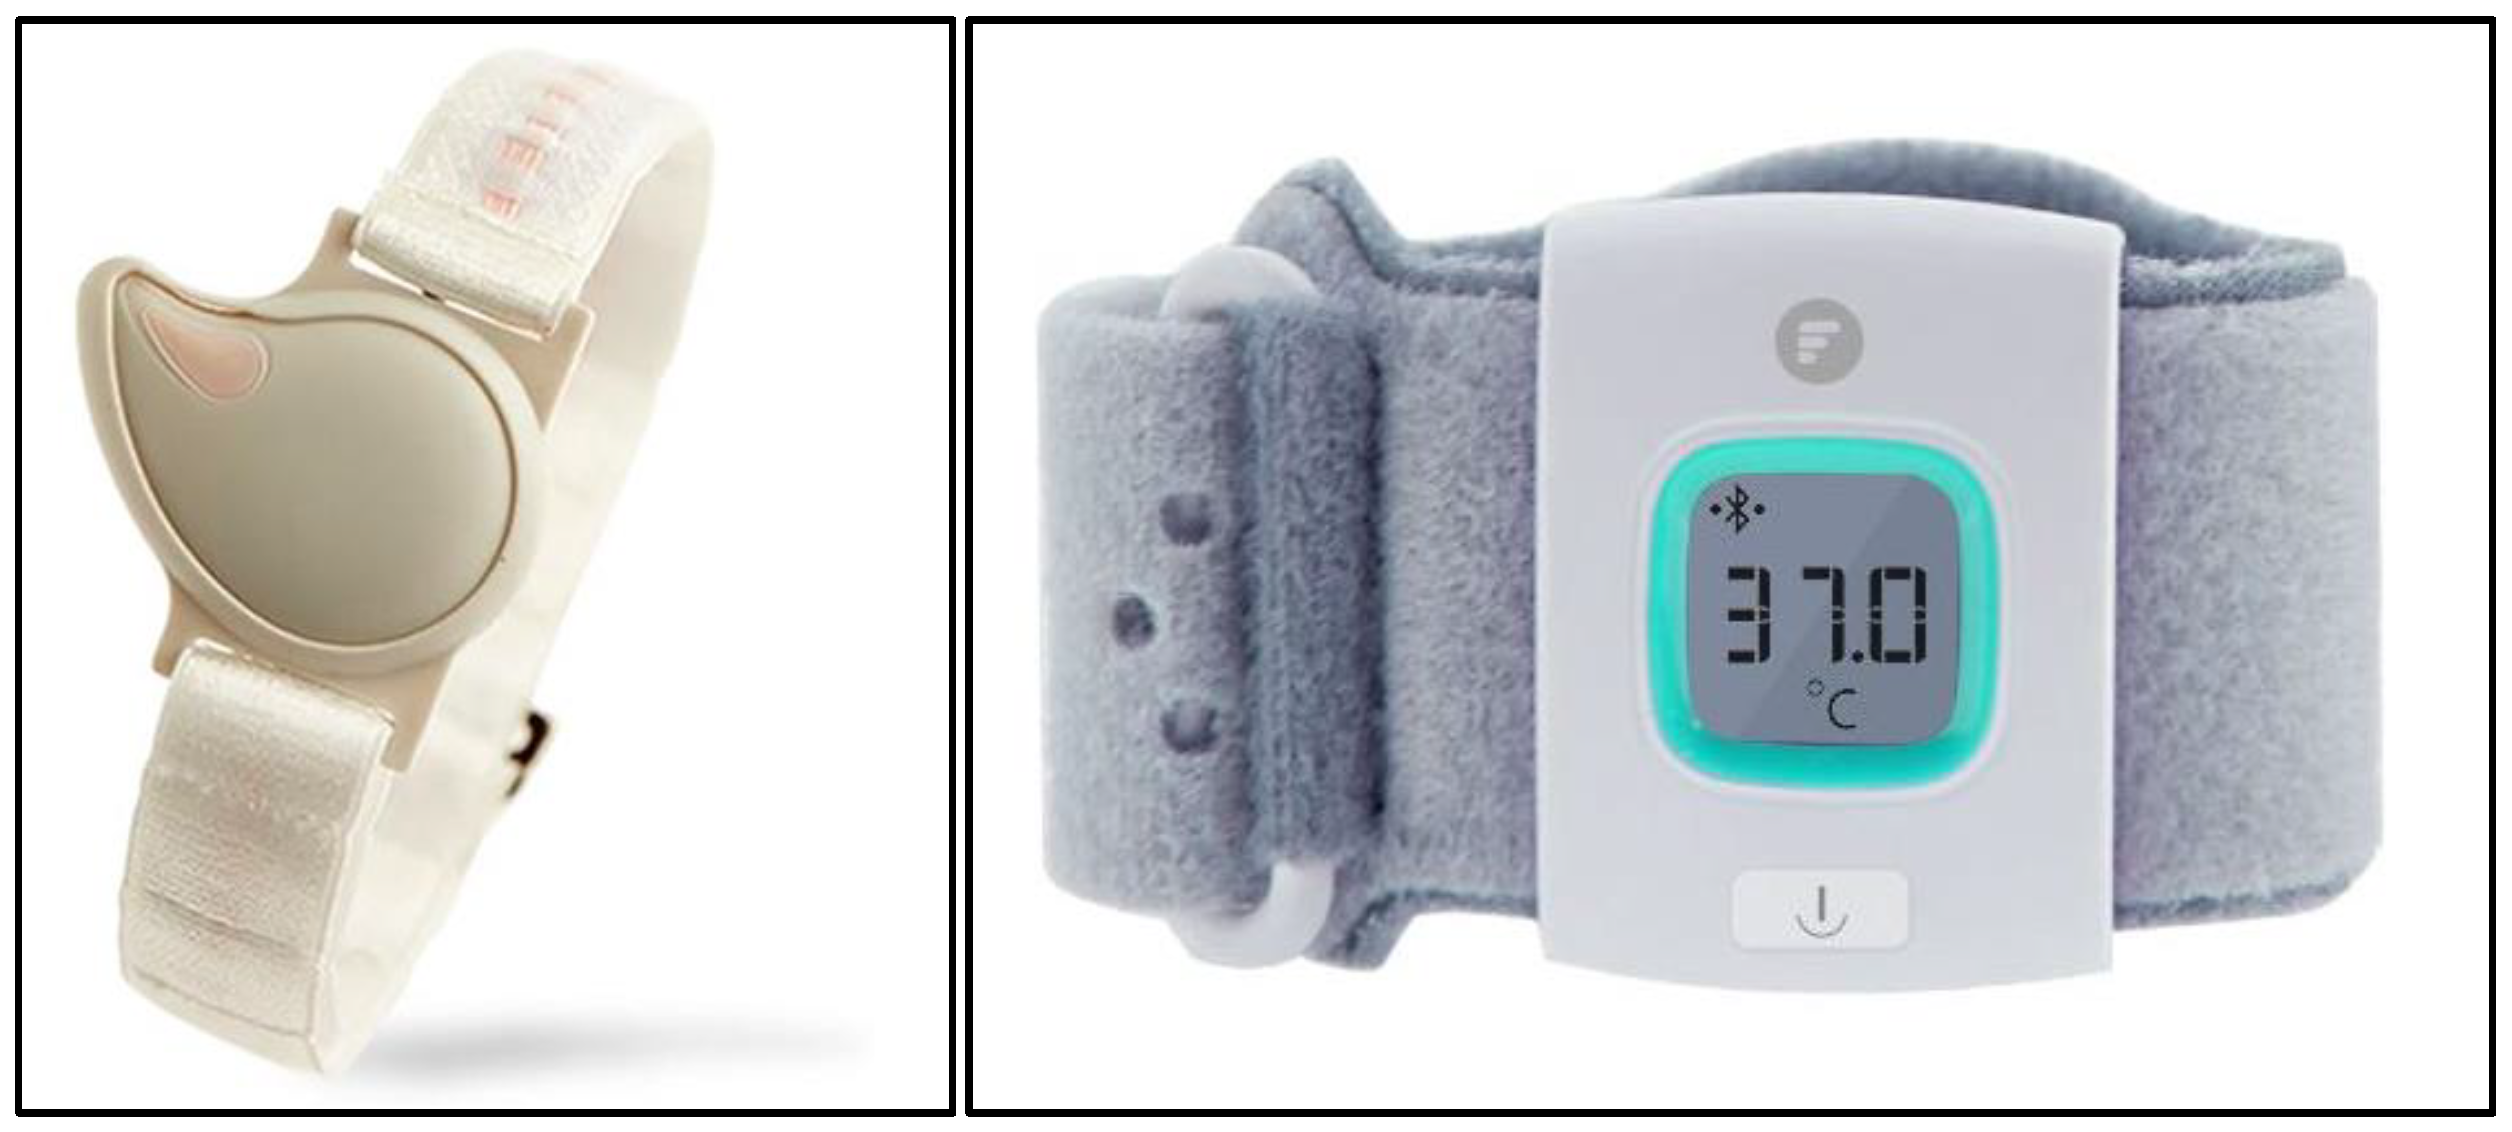
  • Designed for personal use: Based on Figure 1, most IoT-enabled body temperature assessment devices, such as Tempdrop, iFever, and iSense, are designed for personal use and are typically worn on the wrist. Thus, they cannot be used for real-time body temperature screening of a large number of people [15].
As such, there exists a need for a rugged, low-cost, standalone body temperature assessment device to detect elevated body temperature, which could strongly indicate possible instances of COVID-19 infection. This work presents a portable IoT-enabled body temperature screening system that quickly and accurately assesses the body temperature of a large number of people. The plug-n-play device can be fixed in place at individual entry points of establishments or even on public transportation and moving vehicles such as trains and buses, where visitors and passengers can quickly scan their temperature before entering the premises or vehicle.

2. Materials and Methods

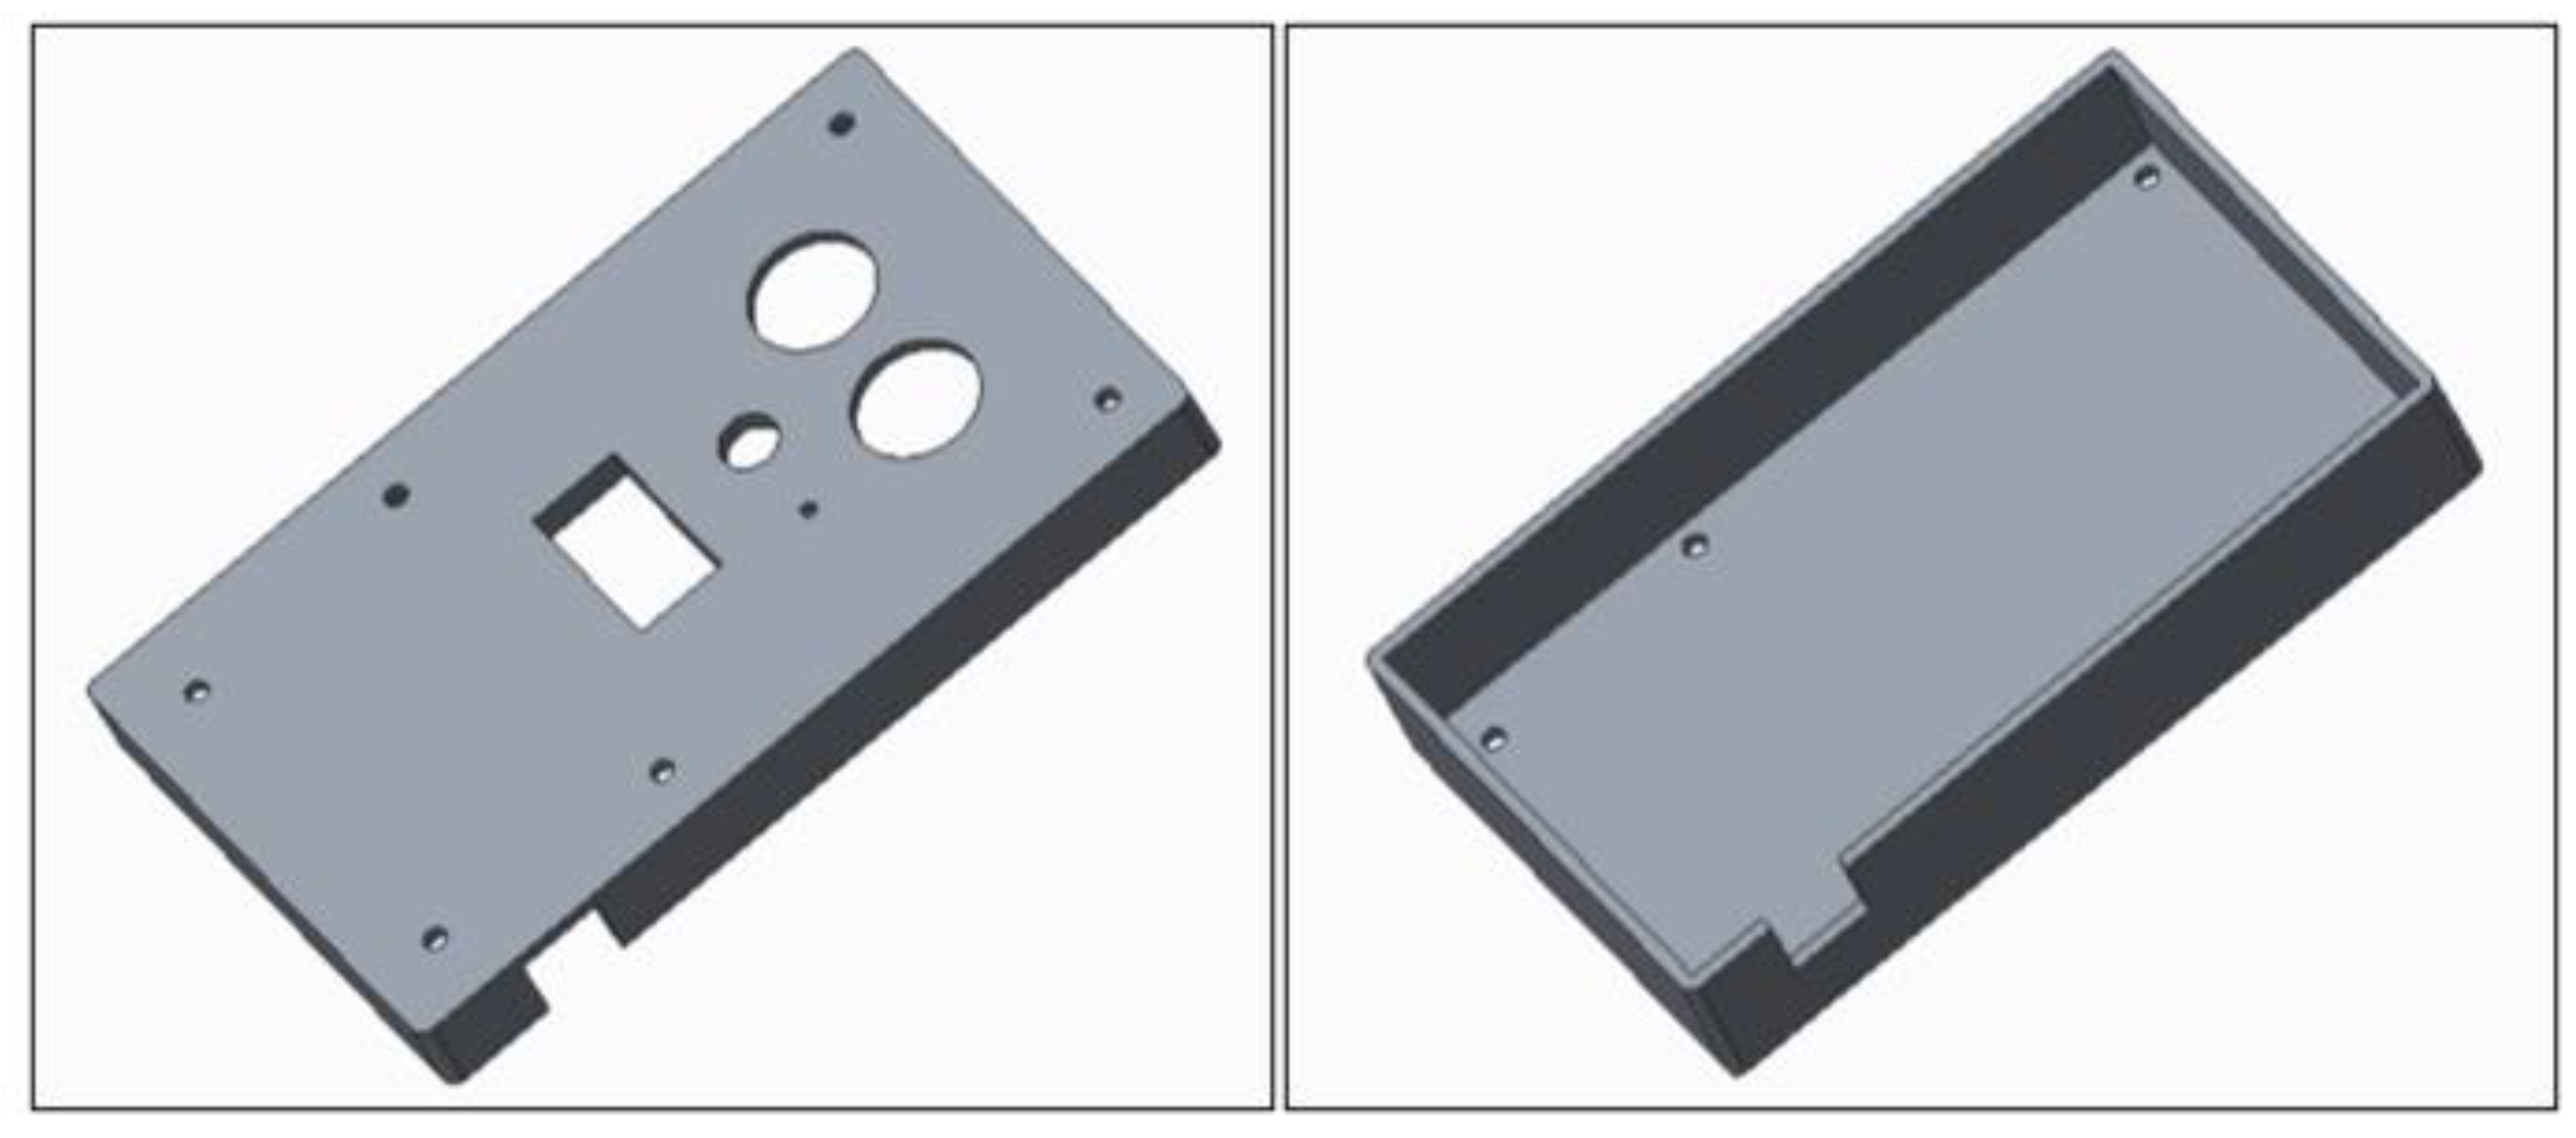
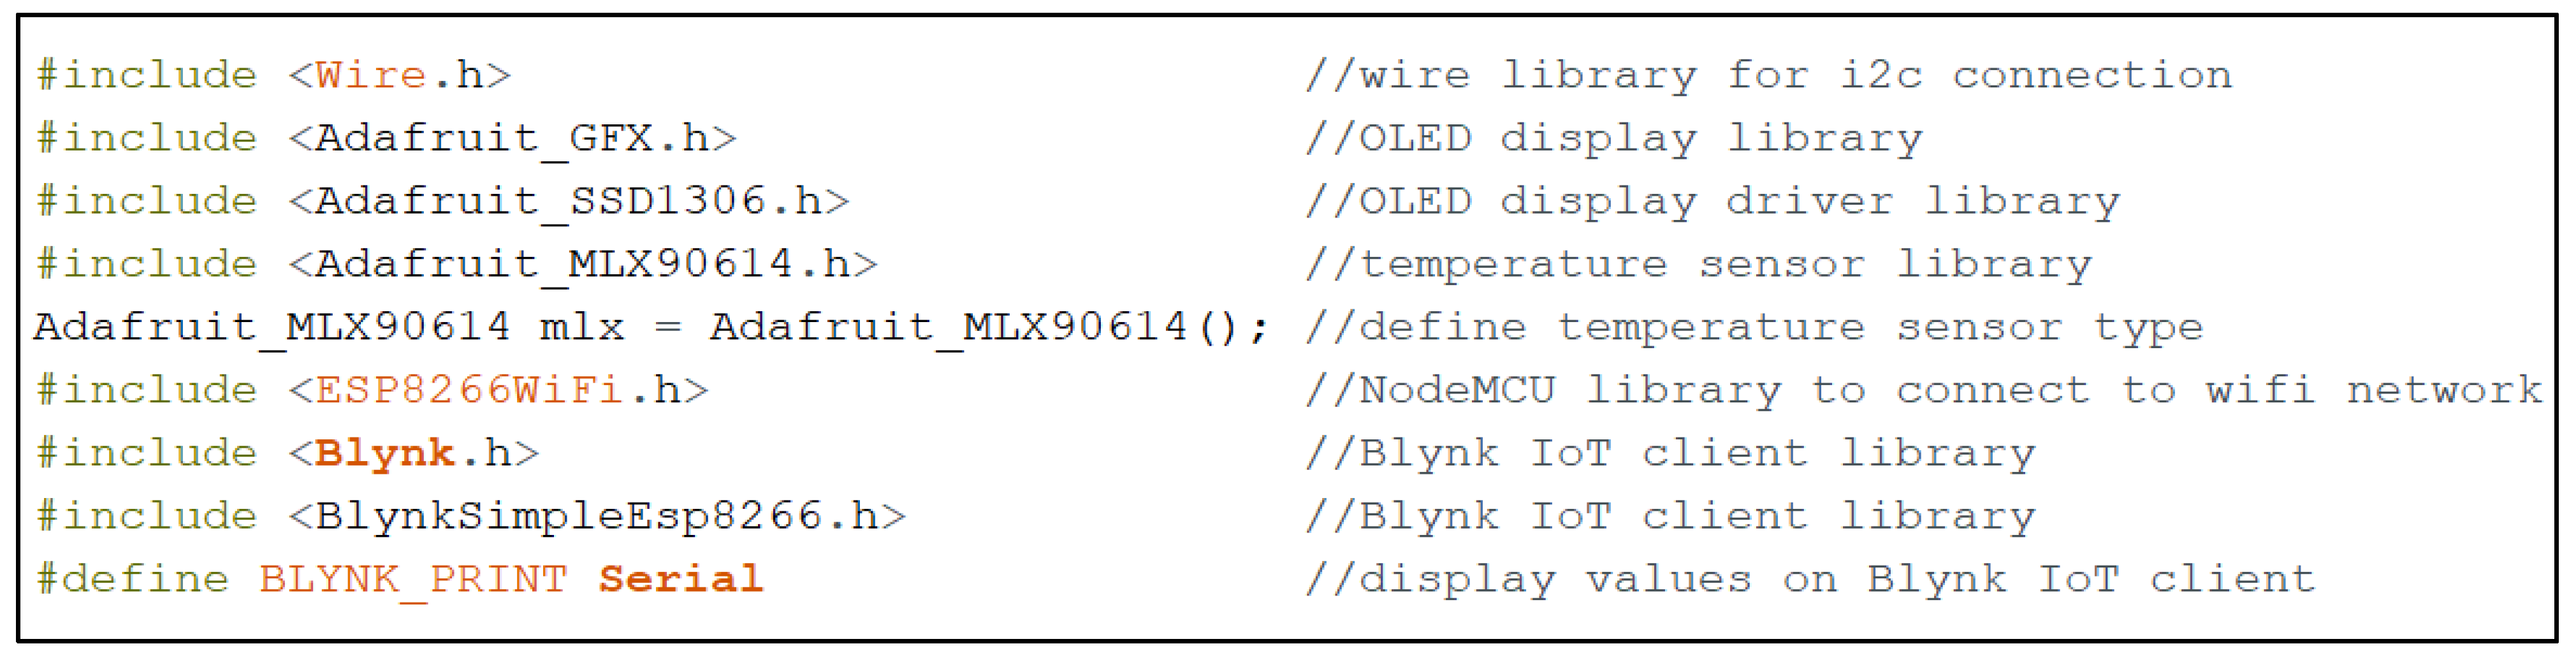
2.1. Description and Components of the System

This research focuses on developing a system to assess the body temperature of visitors quickly and accurately at entry points of establishments and public transportation in order to detect the possibility of COVID-19 infection. As presented in Figure 2, the workflow of the prototype system begins by retrieving the proximity sensor readings.
The proximity sensor, the HC-SR04 ultrasonic sensor, detects the distance to an object using sonar. The transmitter emits a high frequency 40 kHz ultrasonic pulse that reflects off the object and bounces back to the receiver. Sound travels at about 29.412 µs/cm [16]. To measure the distance the sound has travelled we use the formula Distance = (Time × Speed of Sound)/2. The value is divided by 2 as the sound has to travel back and forth. For example, if it takes 100 µs for the ultrasonic sound to travel, then the distance is ((100 µs/2)/29.412 µs/cm), or about 1.7 cm. There is a concern that the ultrasonic pulse could cause nausea, headache, and discomfort to subjects. However, prior literature has shown that short exposure to ultrasonic frequency does not lead to significant adverse effects in the general population [17].
When the proximity sensor detects the subject’s forehead at a maximum distance of 2 cm away, the temperature sensor is triggered, and the subject’s body temperature is measured. A time lapse of 5 s between proximity sensor detection and temperature sensor activation is included to provide leeway for subjects to place their forehead, ideally in front of the sensor for accurate body temperature measurement. Two types of sensors are typically utilised for body temperature measurements—namely, a thermal vision camera or a non-contact infrared (IR) thermometer. An MLX90614 IR non-contact thermometer was preferred for this application to keep development costs to a minimum.
The sensor uses the Stefan–Boltzmann Law to calculate the temperature of an object by measuring the amount of IR energy emitted from it. According to this principle, the IR energy emitted by an object is directly proportional to the fourth power of the temperature of the object [18]. To measure the temperature of an object we use the formula Temperature4 = IR energy/(Emissivity × Stefan-Boltzmann Constant). For example, the human body emits an average of 510 W/m2 IR energy and has an emissivity of 0.98 [19,20]. Knowing that the Stefan–Boltzmann Constant is 5.67 × 10⁻⁸ Wm−2K−4, we can calculate the average body temperature 4√ 510 W/m2/(0.98 × 5.67 × 10−8 Wm−2K−4), or about 310 K ≈ 37 °C.
The MLX90614 is a small and low-cost sensor with a temperature measurement range of −70 °C to 380 °C, an accuracy of 0.1 °C, and a measurement distance of 2 to 5 cm. Thus, by ensuring that the temperature sensor is triggered only when the subject is 2 cm away from the proximity sensor, the accuracy of body temperature readings can be improved, and false readings eliminated.
As shown in Figure 3, the information captured by the sensors is processed by a microcontroller. In addition to displaying the sensor readings via a 0.96-inch, 128 × 64 resolution Organic Light-Emitting Diode (OLED) display, the microcontroller also provides alerts in the form of a beeping buzzer when an individual with an elevated body temperature or fever above 37.5 °C is detected. Based on these alerts, building management or security personnel can take follow-up action such as barring the individual from entering the premises.
In addition, the microcontroller also broadcasts the body temperature data over a Wi-Fi network to a cloud server for data storage and analysis. For this research work, a low-cost NodeMCU microcontroller was selected. Featuring an integrated ESP8266 Wi-Fi module, this open-source, Arduino-based development board is specifically targeted for IoT applications and supports seamless connectivity to wireless networks without requiring external peripherals. Additionally, the compact dimension of the microcontroller enhances device portability.
From the cloud server, the Blynk IoT client dashboard retrieves and displays body temperature information for remote monitoring. A free, open-source IoT client available for iOS and Android devices, Blynk, enables the monitoring and control of hardware projects through graphical interfaces. User-friendly widgets facilitate the visualisation of sensor data, control and manage multiple devices and remote equipment, and also set alerts and notifications.
Additionally, one common issue with the IoT framework is data security. As the device will be broadcasting sensitive health information to the cloud server, it is vital that this information cannot be accessed or intercepted by unauthorised persons. Fortunately, the Blynk IoT platform includes built-in encryption for safe and secure data transfer to the cloud server.
For this work, the Blynk IoT client is used to visualise a live view of visitor body temperature along with the timestamp in a bar chart widget. Consequently, users, including building management, security personnel, and healthcare officials, can access this information from anywhere, at any time, and on any supported device. This data can also be downloaded in terms of a CSV file to cross-reference visitor body temperature and an accompanying timestamp for improved contract-tracing.
In addition to simply displaying visitor body temperature, data analytics performed with this information could be vital in determining trends and forecasting COVID-19 hotspots. The goal is for these devices to become sufficiently widespread to act as a meaningful early detection, warning, and response system for the healthcare sector.
Thousands of units of the prototype body temperature screening system placed in hundreds of locations and establishments all over the country would collect a massive amount of anonymous health data, which could offer invaluable insights into the current and into future pandemics. The ability to track fever levels across the country in real-time could be a crucial piece of information for both the public at large and for decision makers in the healthcare sector and government.
The temperature readings and basic demographic information could offer guidance into whether an area is seeing unusual fever levels. This real-time data allows healthcare officials to track COVID-19 clusters across the country, so that the government can be better prepared to mobilise resources in the right places at the right times. Furthermore, this aggregated data could also be displayed on a health map to provide the public with a way to make more informed decisions about their health.
Additionally, by applying predictive models to the data, future COVID-19 outbreaks—or any other pandemic for that matter—could be forecasted by relying on data collected over several years. By subtracting the norm against a current spike in illness, the predictive model would be able to determine anomalies, which could be correlated to potential outbreaks.

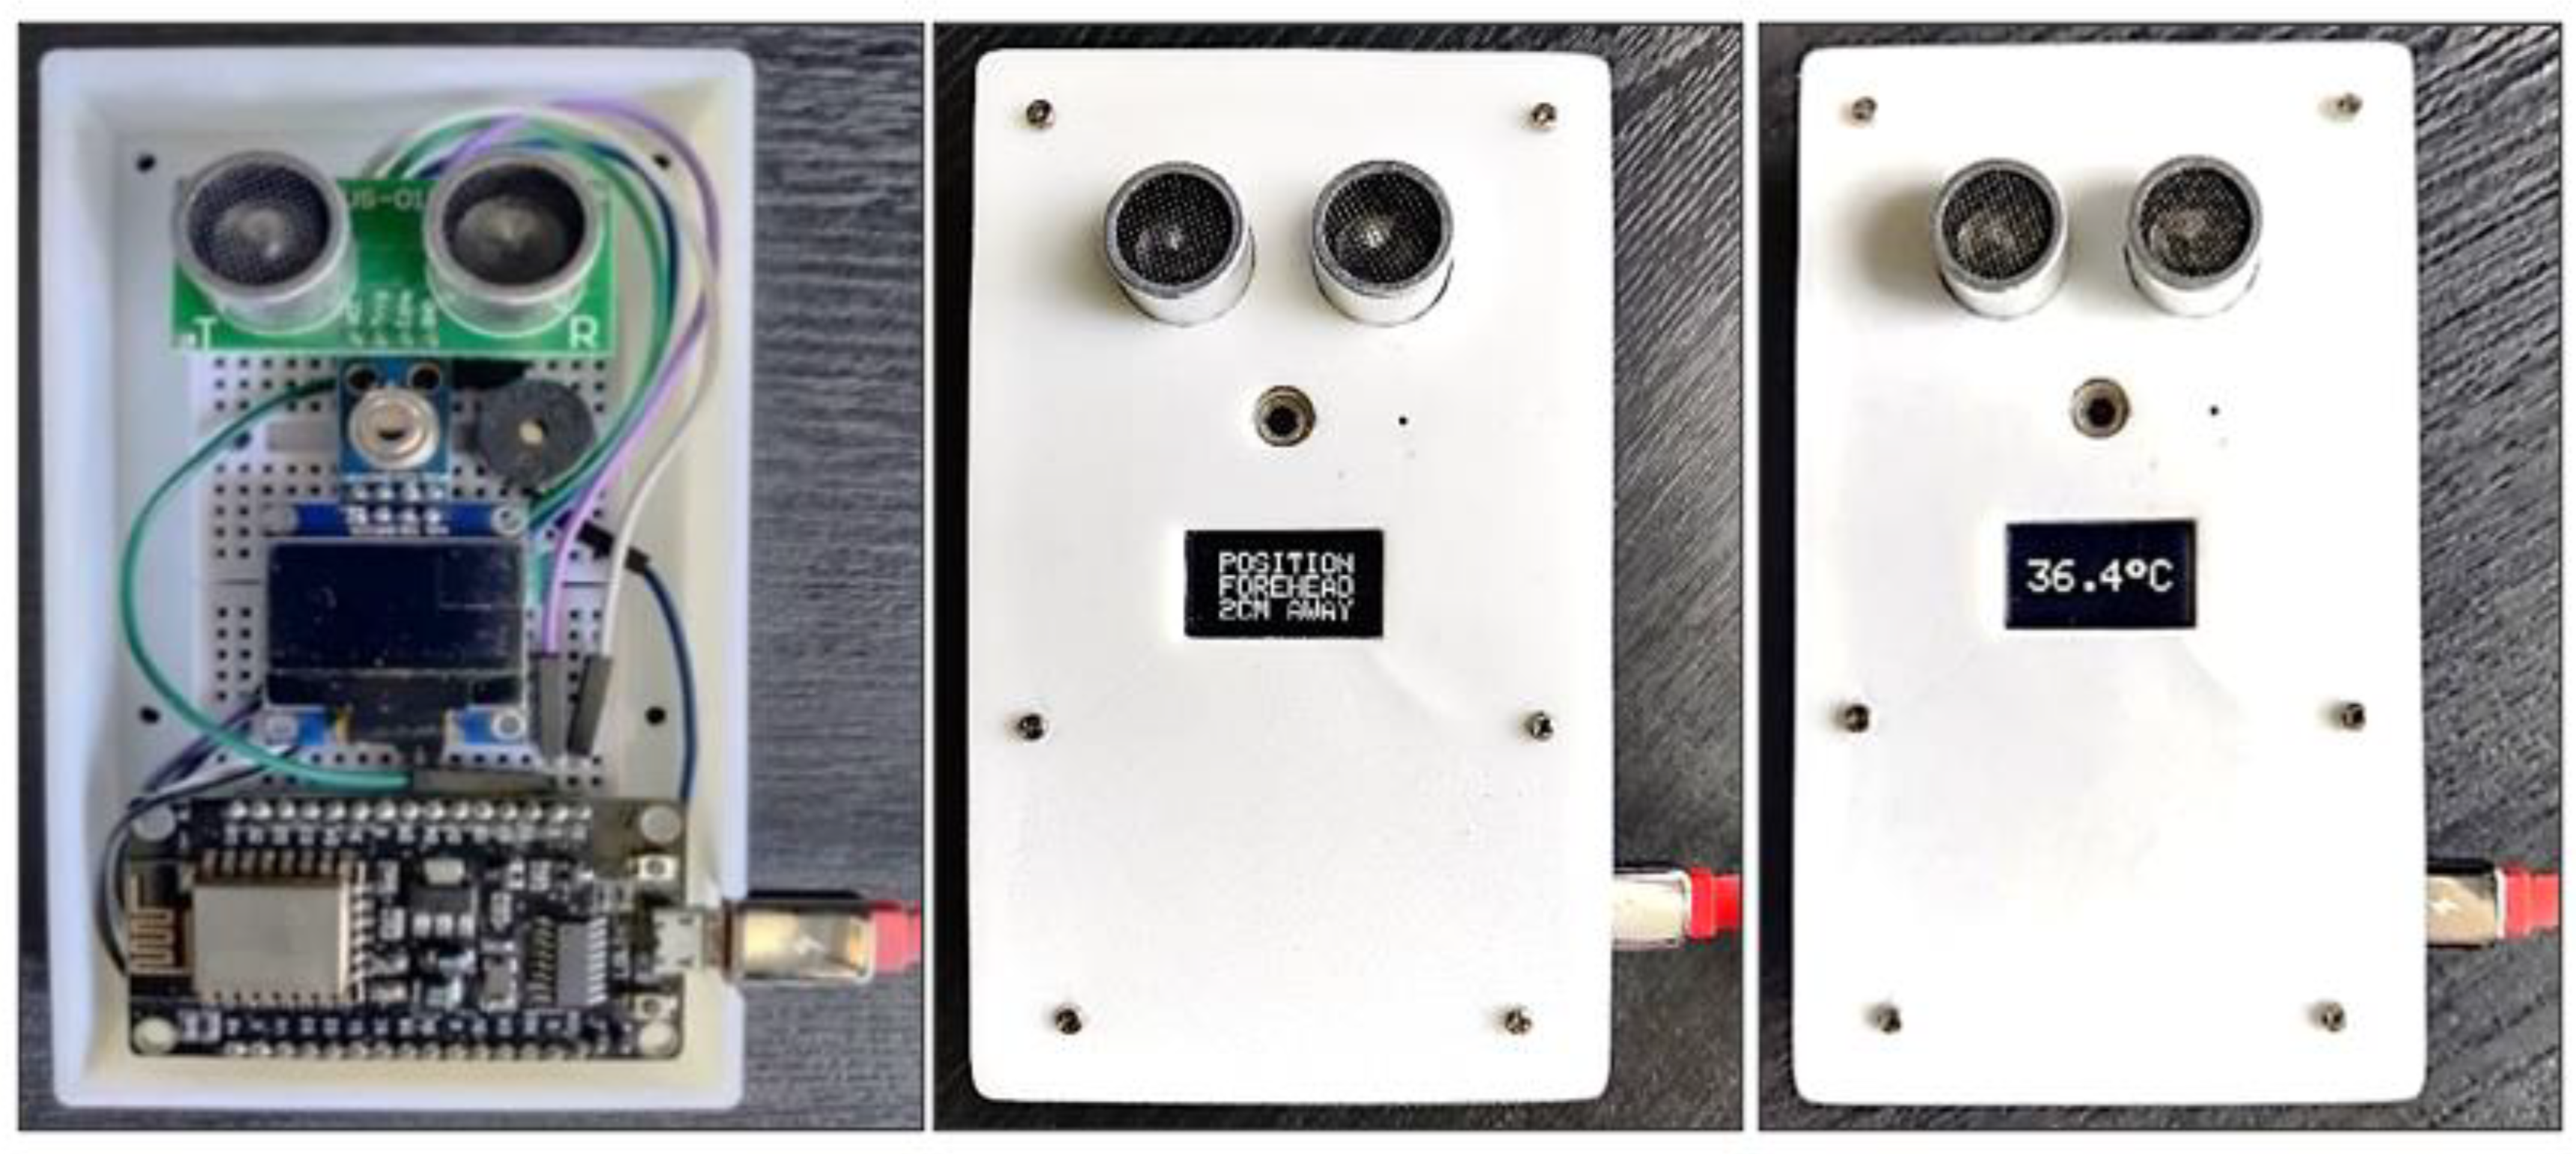
2.2. Assembly of the System

The first phase of development for the body temperature screening system was interfacing the sensors with the microcontroller. The NodeMCU board is powered via micro-USB and consists of 16 general-purpose input–output (GPIO) digital pins and one analogue pin for the connection of supplementary peripherals such as sensors and actuators. The Inter-integrated circuit (I2C), Serial Peripheral Interface (SPI), and Universal Asynchronous Reception and Transmission (UART) are some of the serial communication protocols supported by the board [21].
The HC-SR04 is a digital ultrasonic sensor, and the connection is straightforward, with the TRIGGER and ECHO pins connected to pins D5 and D6, respectively. Based on Figure 4, both the MLX90614 non-contact temperature sensor and the OLED display communicate with the microcontroller via the I2C protocol, which is a simple, bidirectional synchronous serial bus. I2C requires only two wires—a serial clock line (SCL) for synchronising transmission and a serial data (SDA) line through which bits of data are sent or received—to transmit information between devices connected to the bus.
The master device generates a clock to open the slave device to initiate the bus transfer of data. The relationship between the transmitting and receiving master and slave devices on the bus depends on the direction of data transfer at the time and is not constant. In this case, the MLX90614 sensor acts as the master, transmitting temperature data to the OLED display and the microcontroller for further processing. The SCL and SDA pins on both these components are connected to pins D1 and D2.
The master sends each slave a 10-bit address and a read/write bit to the slave it wants to communicate with, which the slave then compares with its own. The slave leaves the SDA line high if the addresses do not match. Alternately, the slave returns an acknowledgement (ACK) bit, which switches the SDA line to low for one bit if the address matches. The data frame master is then sent or received by the master. The receiving device returns another ACK bit to the sender to acknowledge successful transmission after each data frame has been transferred. Finally, the master sends a stop signal to the slave by switching the SCL to high before switching the SDA to high to stop the data transmission [22].
Lastly, the signal pin on the buzzer is connected to pin D7. The active buzzer will sound as soon as it is energised with a DC voltage. However, since the frequency is fixed, it can only produce a continuous or pulsed audio signal [23]. With all components interfaced to the system, the next step was to design a custom rugged enclosure to protect the fragile electronic parts from the elements, whether indoors or outdoors. With the dimensions of the components measured, computer-aided design (CAD) software—CREO Parametric—was utilised to model the case.
Based on Figure 5, the case is comprised of upper and lower parts that are screwed together to hold all components in place. This design was selected so that the case could be easily taken apart to replace or upgrade the internal components such as the sensors and microcontroller. These components typically have an average lifespan of around 3 years in hot climates and up to 10 years in colder climates [24]. This lifespan was deemed sufficient for the prototype stage, while production-ready units could utilize industrial-grade sensors instead, which have a much longer lifespan of up to 20 years.
Relevant cut-outs to ensure the functionality of all components were included in the top part of the enclosure. The CAD model was then 3D-printed (Anet A8 Plus), using a Fabbxible 1.75 mm polylactic acid (PLA) filament, an environmentally friendly plant-based plastic that is highly durable and waterproof [25]. Transmission of wireless network signals to the microcontroller is also possible through PLA material. The components were then assembled into the case, as presented in Figure 6.
Next, the Arduino IDE programming interface was utilised to develop and upload the custom code—necessary to capture body temperature data via sensors and broadcast the information to the cloud—to the NodeMCU microcontroller. Based on Figure 7, the initial step in programming the script to obtain body temperature information was to install and include the applicable libraries—namely, the Wire library for the I2C connection, the OLED display library, the MLX90614 library, and the Blynk library. The Wi-Fi SSID and password for connection to the wireless network was added, along with the custom Blynk authorisation key to upload data to the cloud server.
The script for capturing distance values was added, while the body temperature readings are retrieved via library functions, as shown in Figure 8. This data is then uploaded to the Blynk IoT client. Next, the script to display temperature values via the OLED display was added along with the high-temperature warning script for the buzzer. Lastly, the Blynk IoT client application widgets were configured to display relevant information to users, as presented in Figure 9.

3. Results and Discussion

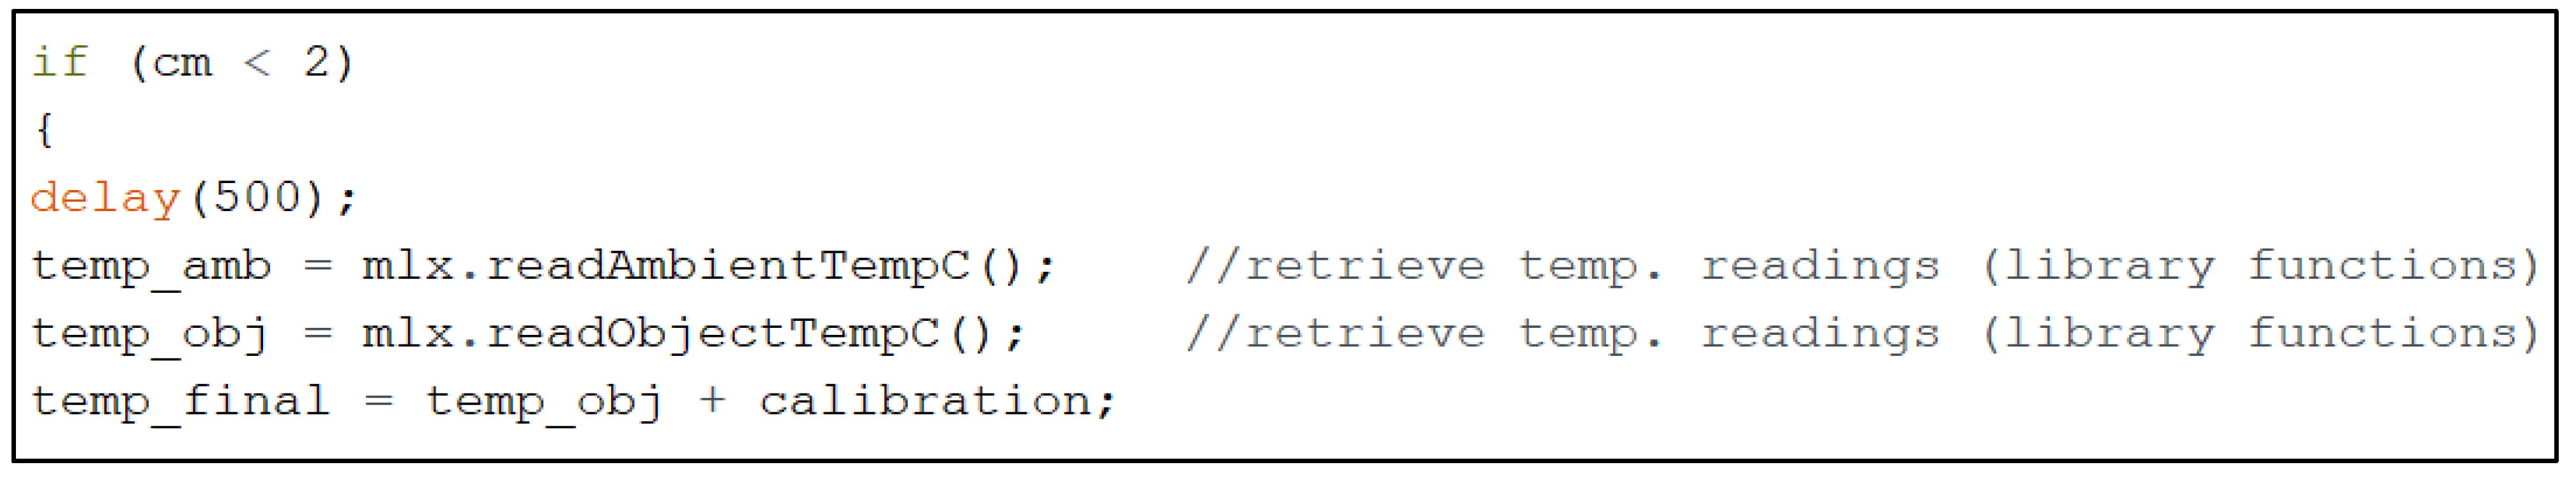
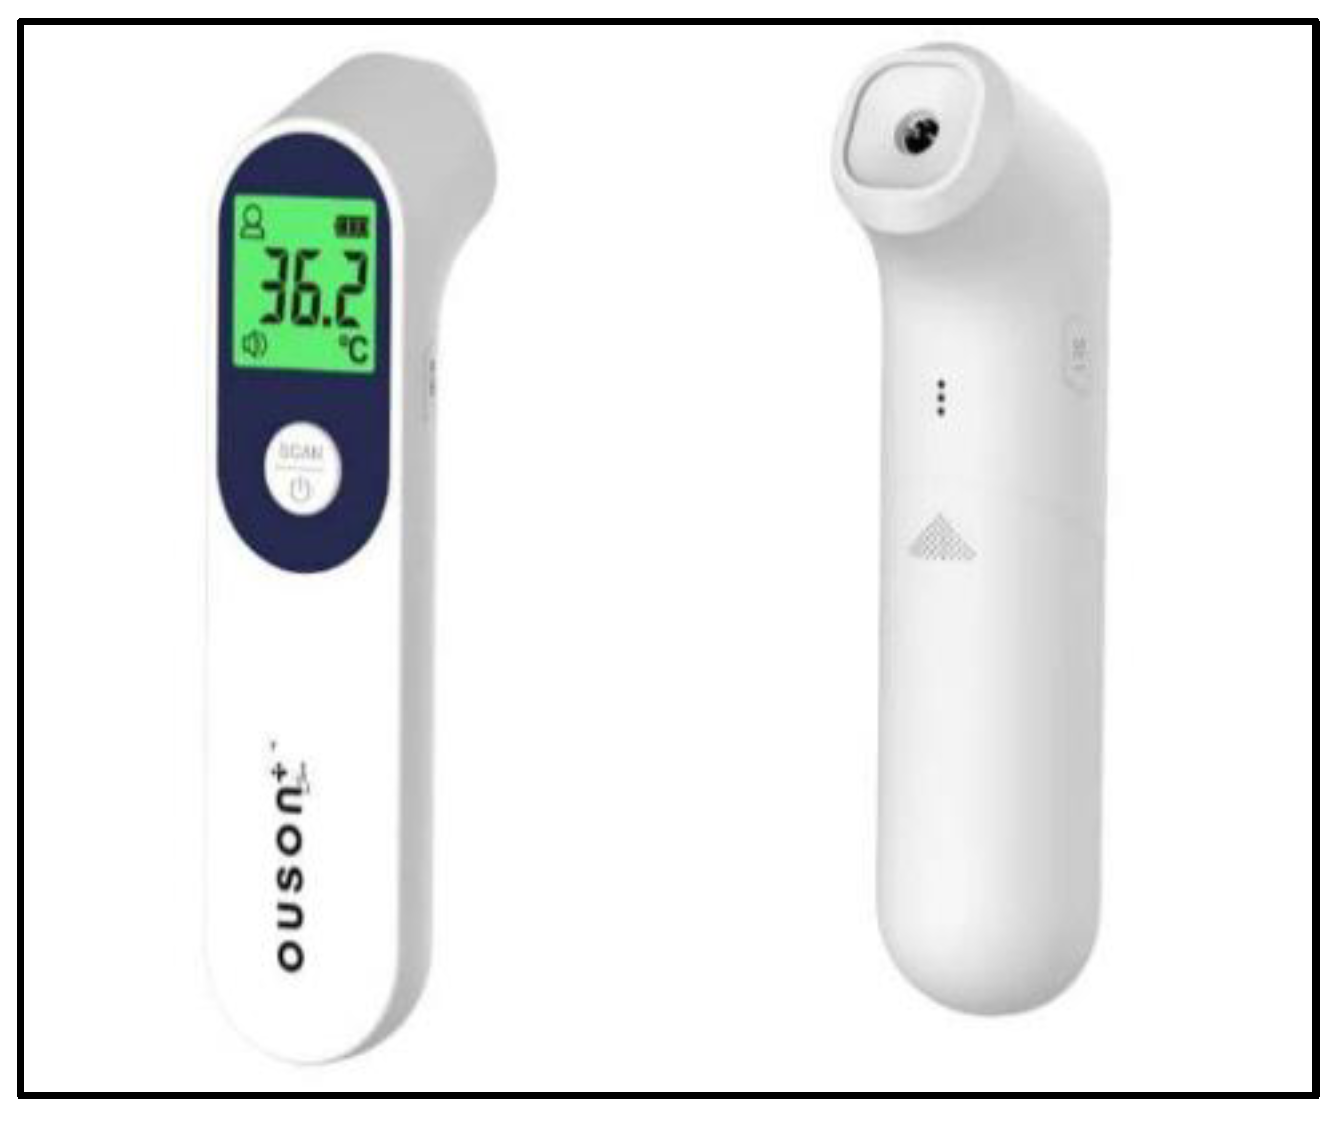
3.1. Sensor Performance Assessment

For sensor performance assessment, body temperature readings retrieved by the prototype system were compared to medical-grade standalone sensors—in this case, a non-contact thermometer, as shown in Figure 10, for the evaluation of device accuracy and reliability. It should be noted that values retrieved by the prototype system are defined as test readings, while base readings are the values obtained by the standalone thermometer. A total of five body temperature readings were recorded over the course of five days from 10 test subjects, by recording one reading every day for a grand total of 50 readings, as tabulated in Table 1.
In order to measure body temperature, the readings for both the prototype system and standalone thermometer were taken in a controlled environment with room temperatures of 30 °C, 2 cm away from the forehead, as recommended by the government-set SOP. The non-contact thermometer acted as the benchmark for body temperature readings. Accordingly, the percentage difference was calculated based on the variance of readings obtained by the prototype system. This evaluation served as a testament to the accuracy and precision of the sensors in the prototype system and verified if the device was fit for use in medical applications.
From Table 2, it was observed that the prototype system had a marginally higher average body temperature reading bias, at 36.06 °C, 36.08 °C, 36.17 °C, 36.33 °C, and 36.20 °C, compared to the standalone thermometer with readings of 35.79 °C, 35.82 °C, 35.90 °C, 36.10 °C, and 35.96 °C. This led to a percentage difference of 0.75%, 0.73%, 0.75%, 0.64%, and 0.68% over the five-day test period. Thus, from the results of this assessment, it can be said that the prototype system was especially accurate when compared to off-the-shelf sensors, with an average variance of less than 1% between temperature readings throughout the test period.
However, this result is to be expected, as both the prototype system and standalone thermometer utilise the same temperature measurement method—in this case, a non-contact IR temperature sensor. Furthermore, this assessment also proves that the device enclosure has minimal impact on sensor performance. Therefore, with regards to the preliminary evaluation, the prototype device is highly suited for mass body temperature screening as the system is precise and accurate.

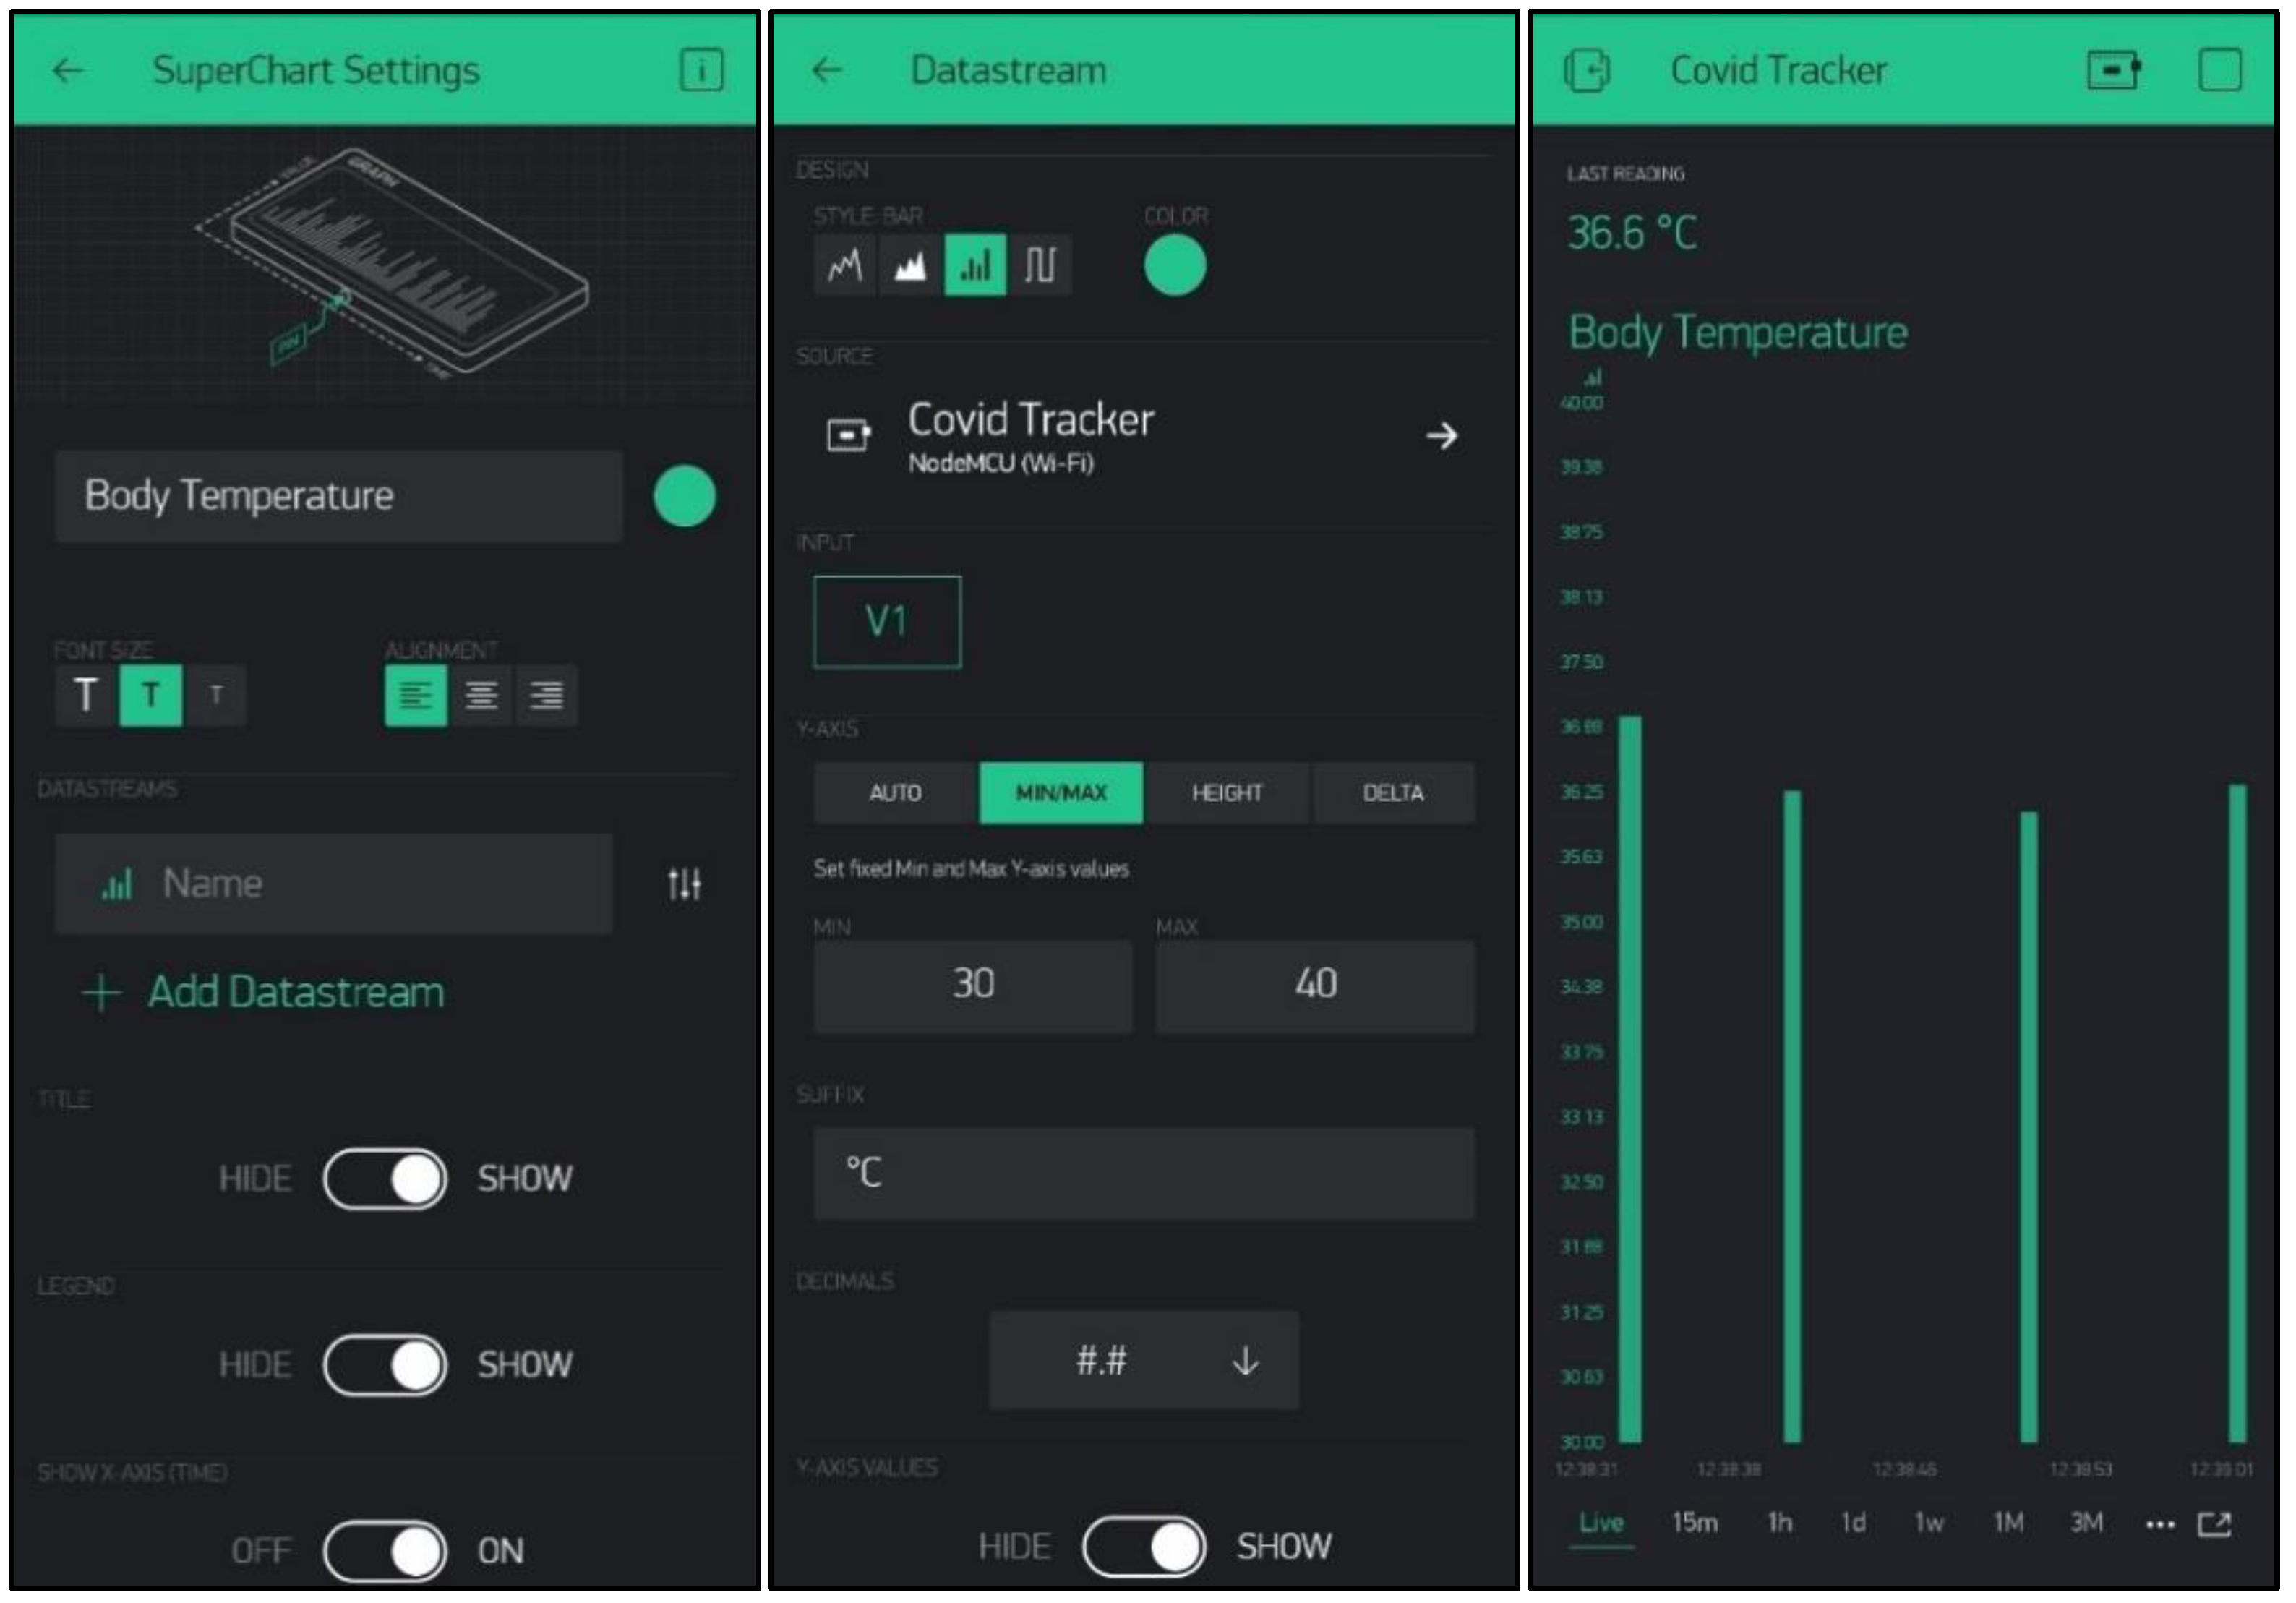
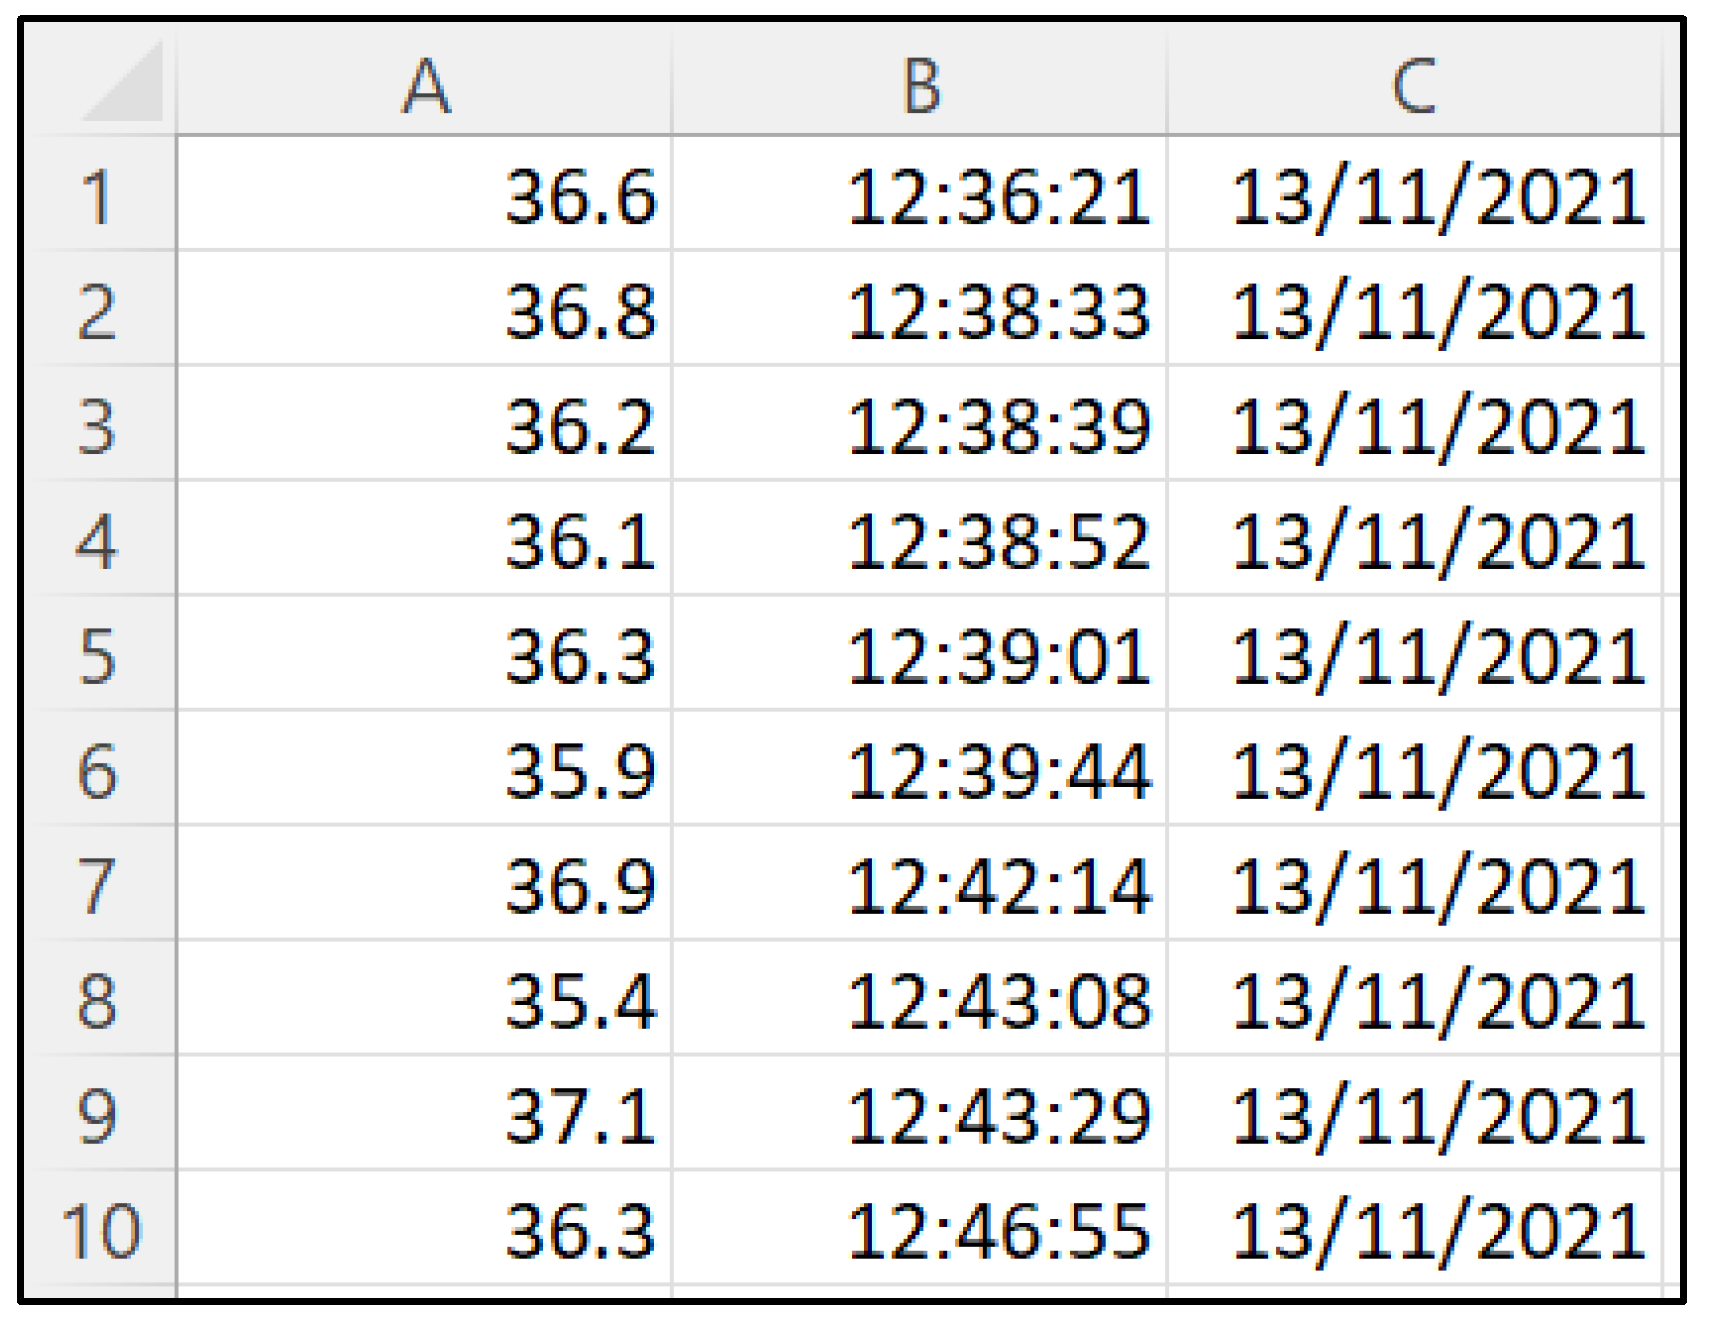
3.2. IoT Client Reliability Assessment

Next, the reliability of the prototype system to broadcast visitor body temperature data to the cloud server and subsequently display the values on the IoT client dashboard was assessed. In this evaluation, the prototype system was placed in the office lobby of a local turnkey solutions provider, herein referred to as Company X. The establishment consists of 28 employees coming into work and an average of around 10 business guests daily.
Employees and guests were requested to scan their body temperature using the prototype system only once before entering the premises. If they were to leave and return to the establishment, visitors were not required to rescan their body temperature, to prevent duplicate readings for each day. The number of daily visitors and the check-in times were manually recorded over the course of 10 days. This value was cross-referenced with the body temperature information and timestamp generated by the IoT client in terms of a CSV file, as shown in Figure 11.
If the CSV file had lower body temperature readings than the manual count, it would indicate a data broadcast failure, wherein the visitor information was not uploaded and saved in the cloud server. It is vital that the prototype system has a high data broadcast success rate, as an unreliable system would defeat the purpose of having IoT functionality in the first place.
The results in Table 3 showed that the prototype system could successfully upload and save visitor body temperature information via the IoT client at all times throughout the test period. Furthermore, the visitor count and the number of readings displayed via the CSV file were tallied at the end of each day, with no data broadcast failures detected. As such, the system had an impressive 100% success rate in uploading body temperature data to the IoT client, displaying the values through the dashboard, and saving the information in the cloud server. Therefore, the prototype system is indeed highly reliable, with minimal risk of failure during everyday use.

4. Conclusions

The aim of this research work was to develop a body temperature screening system for detecting elevated temperatures that could indicate COVID-19 infection among visitors quickly and accurately, as per the government SOPs. The rugged, portable, and plug-n-play ready device can be placed at entry points of establishments and public transportation.
The prototype system uses a proximity sensor to detect subjects and then determines their body temperature using a non-contact temperature sensor. Body temperature data is displayed on the device and uploaded over a Wi-Fi network to a cloud server for data storage and analysis. Body temperature information is retrieved from the cloud server and displayed via dashboard widgets on the Blynk IoT client for remote monitoring. The device also provides alerts when a body temperature above 37.5 °C is detected.
Users, including building management, security personnel, and healthcare officials, can access this information for improved contract-tracing, determining trends, and forecasting COVID-19 hotspots. The system could act as a meaningful early detection, warning, and response system for the healthcare sector so that the government can be better prepared to mobilise resources in the right places at the right times.
Evaluation of the prototype system demonstrated that it could function as anticipated. Body temperature readings were impressively accurate when compared to a standalone non-contact thermometer, with an average variance of less than 1%. Additionally, the system was highly reliable, with a 100% IoT data broadcast success rate.
While this research has been a success, there are recommendations identified for future work. Long-term field testing of 3 to 6 months with a minimum of 20 participants should be carried out to further determine device performance, accuracy, and reliability.

Author Contributions

Writing—original draft preparation, K.R.G. and S.S.H.H.; writing—review and editing, M.T.H.S., F.S.S. and A.U.M.S.; supervision, S.S.H.H. All authors have read and agreed to the published version of the manuscript.

Funding

This research was funded by the BOLD Refresh Fund, UNITEN, Project ID: J510050002-2021097. The APC was funded by Ministry of Higher Education, Malaysia, through the Fundamental Research Grant Scheme FGRS/1/2019/STG07/UPM/02/2, grant number 5540320.

Institutional Review Board Statement

Not applicable.

Informed Consent Statement

Informed consent was obtained from all subjects involved in the study.

Data Availability Statement

Not applicable.

Acknowledgments

The authors would like to thank the Innovation & Research Management Centre (iRMC), the Institute of Informatics and Computing in Energy (IICE), UNITEN, Department of Aerospace Engineering, Faculty of Engineering, Universiti Putra Malaysia and Laboratory of Bio-composite Technology, Institute of Tropical Forestry and Forest Product (INTROP), Universiti Putra Malaysia (HICOE) for their continued support of this work and the activities that led to its development.

Conflicts of Interest

The authors declare no conflict of interest.

References

  1. Cleveland Clinic. Coronavirus, COVID-19. Cleveland Clinic Organization. 2021. Available online: https://my.clevelandcliniic.org/health/diseases/21214-coronavirus-covid-19 (accessed on 30 November 2021).
  2. World Health Organization. Coronavirus Disease (COVID-19): How Is It Transmitted? WHO International. 2021. Available online: https://www.who.int/news-room/questions-and-answers/item/coronavirus-disease-covid-19-how-is-it-transmitted (accessed on 30 November 2021).
  3. Worldometer. COVID-19 Coronavirus Pandemic. Worldometer. 2022. Available online: https://www.worldometers.info/coronavirus/ (accessed on 30 November 2021).
  4. Axelrod, J. Coronavirus May Infect up to 70% of World’s Population, Expert Warns. CBS News. 2020. Available online: https://www.cbsnews.com/news/coronavirus-infection-outbreak-worldwide-virus-expert-warning-today-2020-03-02/ (accessed on 30 November 2021).
  5. Nicola, M.; Alsafi, Z.; Sohrabi, C.; Kerwan, A.; Jabir, A. The Socio-Economic Implications of the Coronavirus Pandemic (COVID-19): A Review. Int. J. Surg. 2020, 78, 185–193. [Google Scholar] [CrossRef] [PubMed]
  6. Umaira, A.; Syafiqah, M.S.; Safria, N.A.; Thevadas, R.; Sultan, M.T.H. COVID-19 Outbreak in Malaysia: Actions Taken by the Malaysian Government. Int. J. Infect. Dis. 2020, 97, 108–116. [Google Scholar]
  7. Salim, S. Khairy: Omicron Could Drive Malaysia’s COVID-19 Daily Cases Past 30,000 by End-March if Unchecked. The Edge Markets. 2022. Available online: https://www.theedgemarkets.com/article/khairy-malaysias-daily-covid19-cases-could-exceed-30000-endmarch-due-omicron-variant (accessed on 30 November 2021).
  8. Azmawati, N.; Maizuliana, H.; Dzulkhairi, M.; Ithnin, M.; Ilina, C. Knowledge, Acceptance and Perception on COVID-19 Vaccine Among Malaysians: A Web-Based Survey. PLoS ONE 2021, 16, e0256110. [Google Scholar]
  9. Ministry of Health. Official FAQ Related to COVID-19 by the Ministry of Health Malaysia. KKM Malaysia. 2020. Available online: https://covid-19.moh.gov.my/faqsop/faq-covid-19-kkm (accessed on 30 November 2021).
  10. Demah, B.; Ekremet, K.; Haidallah, A.R.; Mumuni, K.; Addai, J. Performance of COVID-19 Associated Symptoms and Temperature Checking as a Screening Tool for SARS-CoV-2 Infection. PLoS ONE 2021, 16, e0257450. [Google Scholar]
  11. Yong, S.S.; Sia, J. COVID-19 and Social Wellbeing in Malaysia: A Case Study. Curr. Psychol. 2021, 1–15. [Google Scholar] [CrossRef] [PubMed]
  12. Aziz, N.A.; Othman, J.; Lugova, H.; Suleiman, A. Malaysia’s Approach in Handling COVID-19 Onslaught: Report on the Movement Control Order (MCO) and Targeted Screening to Reduce Community Infection Rate and Impact on Public Health and Economy. J. Infect. Public Health 2020, 13, 1823–1829. [Google Scholar] [CrossRef] [PubMed]
  13. Swapna, B. IoT-Enabled Non-Contact-Based Infrared Thermometer for Temperature Recording of a Person. In Handbook of Research on Innovations and Applications of AI, IoT, and Cognitive Technologies; IGI Global: Hershey, PA, USA, 2021. [Google Scholar]
  14. Varshini, B.; Pasha, S.D.; Suhail, M.; Madhumitha, V.; Sasi, A. IoT-Enabled Smart Doors for Monitoring Body Temperature and Face Mask Detection. Glob. Transit. Proc. 2021, 2, 246–254. [Google Scholar] [CrossRef]
  15. Nasajpour, M.; Pouriyeh, S.; Parizi, R.M.; Dorodchi, M.; Valero, M.; Arabnia, H.R. Internet of Things for Current COVID-19 and Future Pandemics: An Exploratory Study. J. Healthc. Inform. Res. 2020, 4, 325–364. [Google Scholar] [CrossRef] [PubMed]
  16. Hajjaj, S.S.H.; Gsangaya, K.R. The Internet of Mechanical Things: The IoT Framework for Mechanical Engineers, 1st ed.; CRC Press, Taylor and Francis Group: Boca Raton, FL, USA, 2022. [Google Scholar]
  17. Wieringen, A.; Glorieux, C. Assessment of Short-Term Exposure to an Ultrasonic Rodent Repellent Device. J. Acoust. Soc. Am. 2018, 144, 2501. [Google Scholar] [CrossRef] [PubMed]
  18. Gong, L. Introduction to MLX90614—What Is MLX90614. SeeedStudio. 2020. Available online: https://www.seeedstudio.com/blog/2020/09/30/introduction-to-mlx90614/ (accessed on 30 November 2021).
  19. Mithras Technology AG. Can Human Body Heat Provide the World with Energy? Mithras Technology AG. 2022. Available online: https://mithras.tech/2019/04/17/can-human-body-heat-provide-the-world-with-energy/ (accessed on 11 March 2022).
  20. Charlton, M.; Stanley, S.A.; Whitman, Z.; Wenn, V.; Coats, T.J. The Effect of Constitutive Pigmentation on the Measured Emissivity of Human Skin. PLoS ONE 2020, 15, e0241843. [Google Scholar] [CrossRef] [PubMed]
  21. Last Minute Engineers. Insight into ESP8266 NodeMCU Features and Using It with Arduino IDE. Last Minute Engineers. 2020. Available online: https://lastminuteengineers.com/esp8266-nodemcu-arduino-tutorial/ (accessed on 30 November 2021).
  22. Ida, Y. UART vs. I2C vs. SPI–Communication Protocols and Uses. SeeedStudio. 2019. Available online: https://www.seeedstudio.com/blog/2019/09/25/uart-vs-i2c-vs-spi-communication-protocols-and-uses/ (accessed on 30 November 2021).
  23. Brown, R. Passive vs. Active Buzzer: The Differences. NerdTechy. 2020. Available online: https://nerdytechy.com/active-vs-passive-buzzer/ (accessed on 30 November 2021).
  24. Arduino Forum. Arduino Circuit Lifespan? Arduino Forum. 2016. Available online: https://forum.arduino.cc/t/arduino-circuit-lifespan/360703/3 (accessed on 11 March 2022).
  25. Gsangaya, K.R.; Hajjaj, S.S.H.; Sultan, M.T.H.; Hua, L.S. Portable, Wireless, and Effective Internet of Things-based Sensors for Precision Agriculture. Int. J. Environ. Sci. Technol. 2020, 17, 3901–3916. [Google Scholar] [CrossRef]
Figure 1. Wearable body temperature assessment devices.
Jsan 11 00022 g001
Figure 2. Workflow of IoT body temperature screening system.
Jsan 11 00022 g002
Figure 3. Block diagram of IoT body temperature screening system.
Jsan 11 00022 g003
Figure 4. Schematic diagram of the body temperature screening system.
Jsan 11 00022 g004
Figure 5. Enclosure CAD model for the body temperature screening system.
Jsan 11 00022 g005
Figure 6. Assembly of the body temperature screening system.
Jsan 11 00022 g006
Figure 7. Including the relevant libraries in the Arduino sketch.
Jsan 11 00022 g007
Figure 8. Library functions to retrieve body temperature readings.
Jsan 11 00022 g008
Figure 9. Configuring and displaying body temperature data on the Blynk IoT client dashboard.
Jsan 11 00022 g009
Figure 10. Non-contact thermometer.
Jsan 11 00022 g010
Figure 11. Body temperature information saved in the cloud server and displayed via CSV file.
Jsan 11 00022 g011
Table 1. Body temperature readings.
SubjectTemperature (°C)
Day 1Day 2Day 3Day 4Day 5
TestBaseTestBaseTestBaseTestBaseTestBase
135.935.736.135.835.835.736.436.136.636.4
236.235.935.835.636.336.135.935.835.835.6
335.835.536.336.036.736.336.636.336.235.9
435.635.335.435.236.536.236.035.836.336.1
536.936.736.536.236.636.336.135.835.735.4
636.836.536.736.636.736.636.536.435.935.7
735.735.435.535.335.335.037.036.736.836.6
836.035.835.935.635.935.636.336.036.135.9
935.435.136.135.835.835.436.636.436.035.7
1036.336.036.536.136.135.835.935.736.636.3
Table 2. Comparison of test and base readings.
Temperature (°C)
Day 1Day 2Day 3Day 4Day 5
TestBaseTestBaseTestBaseTestBaseTestBase
Average36.0635.7936.0835.8236.1735.9036.3336.1036.2035.96
Variance0.75%0.73%0.75%0.64%0.68%
Table 3. Evaluation of IoT client reliability.
DayVisitor CountTotal No. of
IoT Client Readings
Data Broadcast Failures DetectedData Broadcast Success Rate
137370100%
235350100%
329290100%
432320100%
539390100%
636360100%
733330100%
830300100%
933330100%
1038380100%
Publisher’s Note: MDPI stays neutral with regard to jurisdictional claims in published maps and institutional affiliations.

