
Optimization of Pico-eNB Tx Power and the Effects of Picocell Range Expansion in Multiband HetNet

Department of Information and Communications Engineering, Kogakuin University, Tokyo 163-8677, Japan
*
Author to whom correspondence should be addressed.
J. Sens. Actuator Netw. 2022, 11(2), 27; https://0-doi-org.brum.beds.ac.uk/10.3390/jsan11020027
Submission received: 23 April 2022
/
Revised: 26 May 2022
/
Accepted: 27 May 2022
/
Published: 1 June 2022
(This article belongs to the Special Issue Journal of Sensor and Actuator Networks: 10th Year Anniversary)
Abstract
:The use of heterogeneous networks (HetNets) that combine macrocells and picocells in the same coverage is effective in increasing system capacity and improving user throughput. The use of high carrier frequency bands is also expected to help achieving higher data rates because it promises vast amounts of signal bandwidth. Therefore, multiband HetNets with picocells operating at high carrier frequency bands have attracted significant attention with the aim of increasing system capacity and achieving a high user throughput in fifth-generation mobile systems and beyond. In HetNet deployments, a picocell range expansion (CRE) technique that virtually expands the picocell coverage is well known to allow more user equipment (UE) to access the picocell providing a fixed cell selection offset (CSO) for all UE. Thus far, there has not been sufficient research on optimizing the transmission (Tx) power of pico-evolved node Bs (eNBs) operating at high carrier frequency bands in multiband HetNets. In addition, the effects of CRE in multiband HetNets have not been clarified. In this paper, we first investigated the optimal Tx power of pico-eNB in a multiband HetNet combining macrocells operating at 2 GHz and picocells operating at 4.5 GHz band with a wider signal bandwidth using system-level computer simulations. Then, from the user throughput perspective, we investigated the effects of CRE providing a positive CSO for UE using two pico-eNB Tx powers close to the optimal value. Using these results, we discussed how to choose the pico-eNB Tx power when CRE was activated and validated the design method for a multiband HetNet.
1. Introduction
Fifth-generation (5G) mobile systems have been launched and are gradually used worldwide. The primary objectives of 5G are to increase system capacity and improve data rates, which is referred to as enhanced mobile broadband (eMBB), and to establish ultra-reliable low latency communication (URLLC) while providing massive machine-type communication (mMTC) based on the Internet of Things (IoT) [1,2,3,4,5,6,7]. Two types of 5G mobile systems have been approved by the 3rd Generation Partnership Project (3GPP) standards body. One type of these is called 5G New Radio (NR) with non-standalone (NSA) operation (5G NR NSA), which enables 5G NR deployments using existing fourth-generation (4G) mobile systems. The other is called 5G NR with standalone (SA) operation (5G NR SA), and provides a complete 5G NR with a 5G core network. The initial phase of 5G NR NSA focuses on eMBB using both 5G NR and 4G. The 5G NR SA focuses on URLLC and mMTC, although mMTC has already been developed using 3GPP Release 13 low-power wide-area technology.
From a network-density perspective, approaches based on a small-cell strategy and heterogeneous networks (HetNets) are important for increasing system capacity and/or for improving data rates. HetNets are a promising technique for increasing system capacity and are expected to meet the requirements for large amounts of mobile data traffic, in which picocells with low-power evolved Node Bs (eNBs) are installed within the same coverage of a macrocell with high-power eNB [8,9,10,11,12,13,14]. Resource allocation and user equipment (UE) association are an essential issue in HetNets. In [15], a resource allocation algorithm based on automatic differentiation is proposed to solve the problems of frequency reusing, resource allocation, and user association jointly. In [16], mobility-based proactive resource scheduling strategy utilizing the predicted information of UE mobility, network residual frequency bandwidth is investigated while maintaining QoS requirements. Traffic offloading in HetNets also has important research issues. In [17], a new traffic offloading scheme that combines big data and machine learning is proposed for 5G as well as device-to-device communications.
From the perspective of coexisting network coverage, 5G NR NSA has the same configuration as that of HetNets. The use of high carrier frequency bands is expected to achieve higher data rates because it promises a vast amount of signal bandwidth. Therefore, multiband HetNets with picocells operating at high carrier frequency bands have attracted significant attention with the aim of increasing the system capacity and/or achieving higher data rates in 5G mobile systems and beyond [18,19,20,21,22,23,24,25,26]. For example, the use of millimeter wave (mmWave) bands has attracted a lot of attention to increase the system capacity and/or achieve a higher data rate. Furthermore, massive multiple-input and multiple-output (MIMO) and mmWave technologies provide vital means to significantly enhance the spectral efficiency and improve transmission performance for 5G HetNets [21]. In [27], an MIMO antenna for 5G mmWave applications with wideband and high gain is demonstrated. In [28], a 5G MIMO antenna covering 28 GHz bands integrated with 4G is investigated and demonstrated to enhance high gain and isolation. In [29,30], a multiband HetNet using three-sector picocells with three-dimensional beamforming operating at a 28 GHz band is proposed, and the average and 5-percentile user throughput were clarified using system-level computer simulations.
For HetNets, it is important for UE to determine whether communication with macro- or pico-eNBs provides better access, which is referred to as cell selection. Another important issue in HetNet deployment is to ensure that the picocells serve enough UE. The UE is normally connected to a cell with a stronger downlink reference-signal received power (RSRP) or with a higher signal-to-interference plus noise ratio (SINR). Therefore, the connection ratio of macro-eNBs is greater than that of pico-eNBs because the transmission power is larger. One way to increase the connection ratio of pico-eNBs is the cell range expansion (CRE) technique, which can virtually expand the picocell coverage using a positive cell selection offset (CSO) for the downlink RSRP from the picocell [31,32]. In a normal case without CRE, cell selection is carried out for UE based on a comparison between the downlink RSRPs from the macrocell and picocell. With CRE, a positive CSO is added to the downlink RSRP from the picocell to expand the coverage served by the picocell. In this case, the CRE can allow more UE to access the picocell. However, the CRE technique has one drawback in that the downlink RSRP of the UE, which is forcibly served by the picocell located in the CRE zone, is lower because the downlink RSRP from the macrocell is in reality higher than that from the picocell. Consequently, the user throughput of the UE served by the picocell in the CRE zone may deteriorate.
A higher-order modulation scheme is a promising technique to increase the data rate within a limited bandwidth. As specified by 3GPP Release 8, 4G mobile systems first applied quadrature phase shift keying (QPSK), 16-quadrature amplitude modulation (QAM), and 64-QAM for symbol modulation of orthogonal frequency division multiplexing (OFDM). Then, 256-QAM was added to the modulation and coding scheme (MCS) of 3GPP Release 12. In 3GPP Release 15 for 5G, 1024-QAM was added to the MCS. Nevertheless, the application areas and/or conditions for these post-64-QAM schemes are currently very limited [33,34,35,36,37]. Furthermore, OFDM-based 4096-QAM has been investigated using link-level simulations for 5G and beyond [38,39].
In [12], adaptive control CRE technique was proposed in singleband HetNet using 2 GHz band; however, the pico-eNB transmission (Tx) power was fixed. In [26], the throughput of singleband HetNet using 4 GHz without CRE technique was investigated on the condition of a given pico-eNB Tx power. In [29], sectorized picocell architecture for multiband HetNet using 2 and 28 GHz bands was proposed; however, the pico-eNB Tx power was fixed and CRE technique was not considered. In [40], fundamental research on optimizing the pico-eNB Tx power was carried out in multiband HetNet using 2 and 4.5 GHz bands; however, CRE technique was not considered. Thus, there is no research on evaluating the performance of multiband HetNet from the viewpoint of both pico-eNB Tx power optimization and CRE activation. That is, how to optimize the pico-eNB Tx power has not been investigated when the CRE is activated in multiband HetNet.
On the basis of this background, this paper investigates the relationship between optimal pico-eNB Tx power and a CSO used in CRE technique from the user throughput perspective. We first investigate the optimal Tx power of a pico-eNB in a multiband HetNet combined with macrocells operating at a 2 GHz band and picocells with a wide signal bandwidth operating at a 4.5 GHz band with a new multipath fading channel model. Specifically, we clarify the average and 5-percentile user throughput as a function of pico-eNB Tx power using system-level computer simulations. Then, we investigate the effects of CRE providing a positive CSO for UE given two pico-eNB Tx powers close to the optimal Tx power. Here, we show the average and 5-percentile user throughput as a function of CSO for the two pico-eNB Tx powers. Furthermore, we analyze the use rates of modulation methods including 256- and 1024-QAM in the MCS as a function of the pico-eNB Tx power.
This paper is organized as follows: In Section 2, we introduce a multiband HetNet combined with a macrocell operating at 2.0 GHz and picocells with a wide bandwidth operating at 4.5 GHz. In Section 3, we describe the HetNet model and MCS index including 1024-QAM used in system-level computer simulations. In Section 4, we demonstrate the average and 5-percentile user throughput as a function of pico-eNB Tx power to determine the optimal Tx power. In Section 5, we investigate the average and 5-percentile user throughput as a function of CSO to clarify the effects of CRE. Finally, we conclude our work in Section 6.
2. System Overview
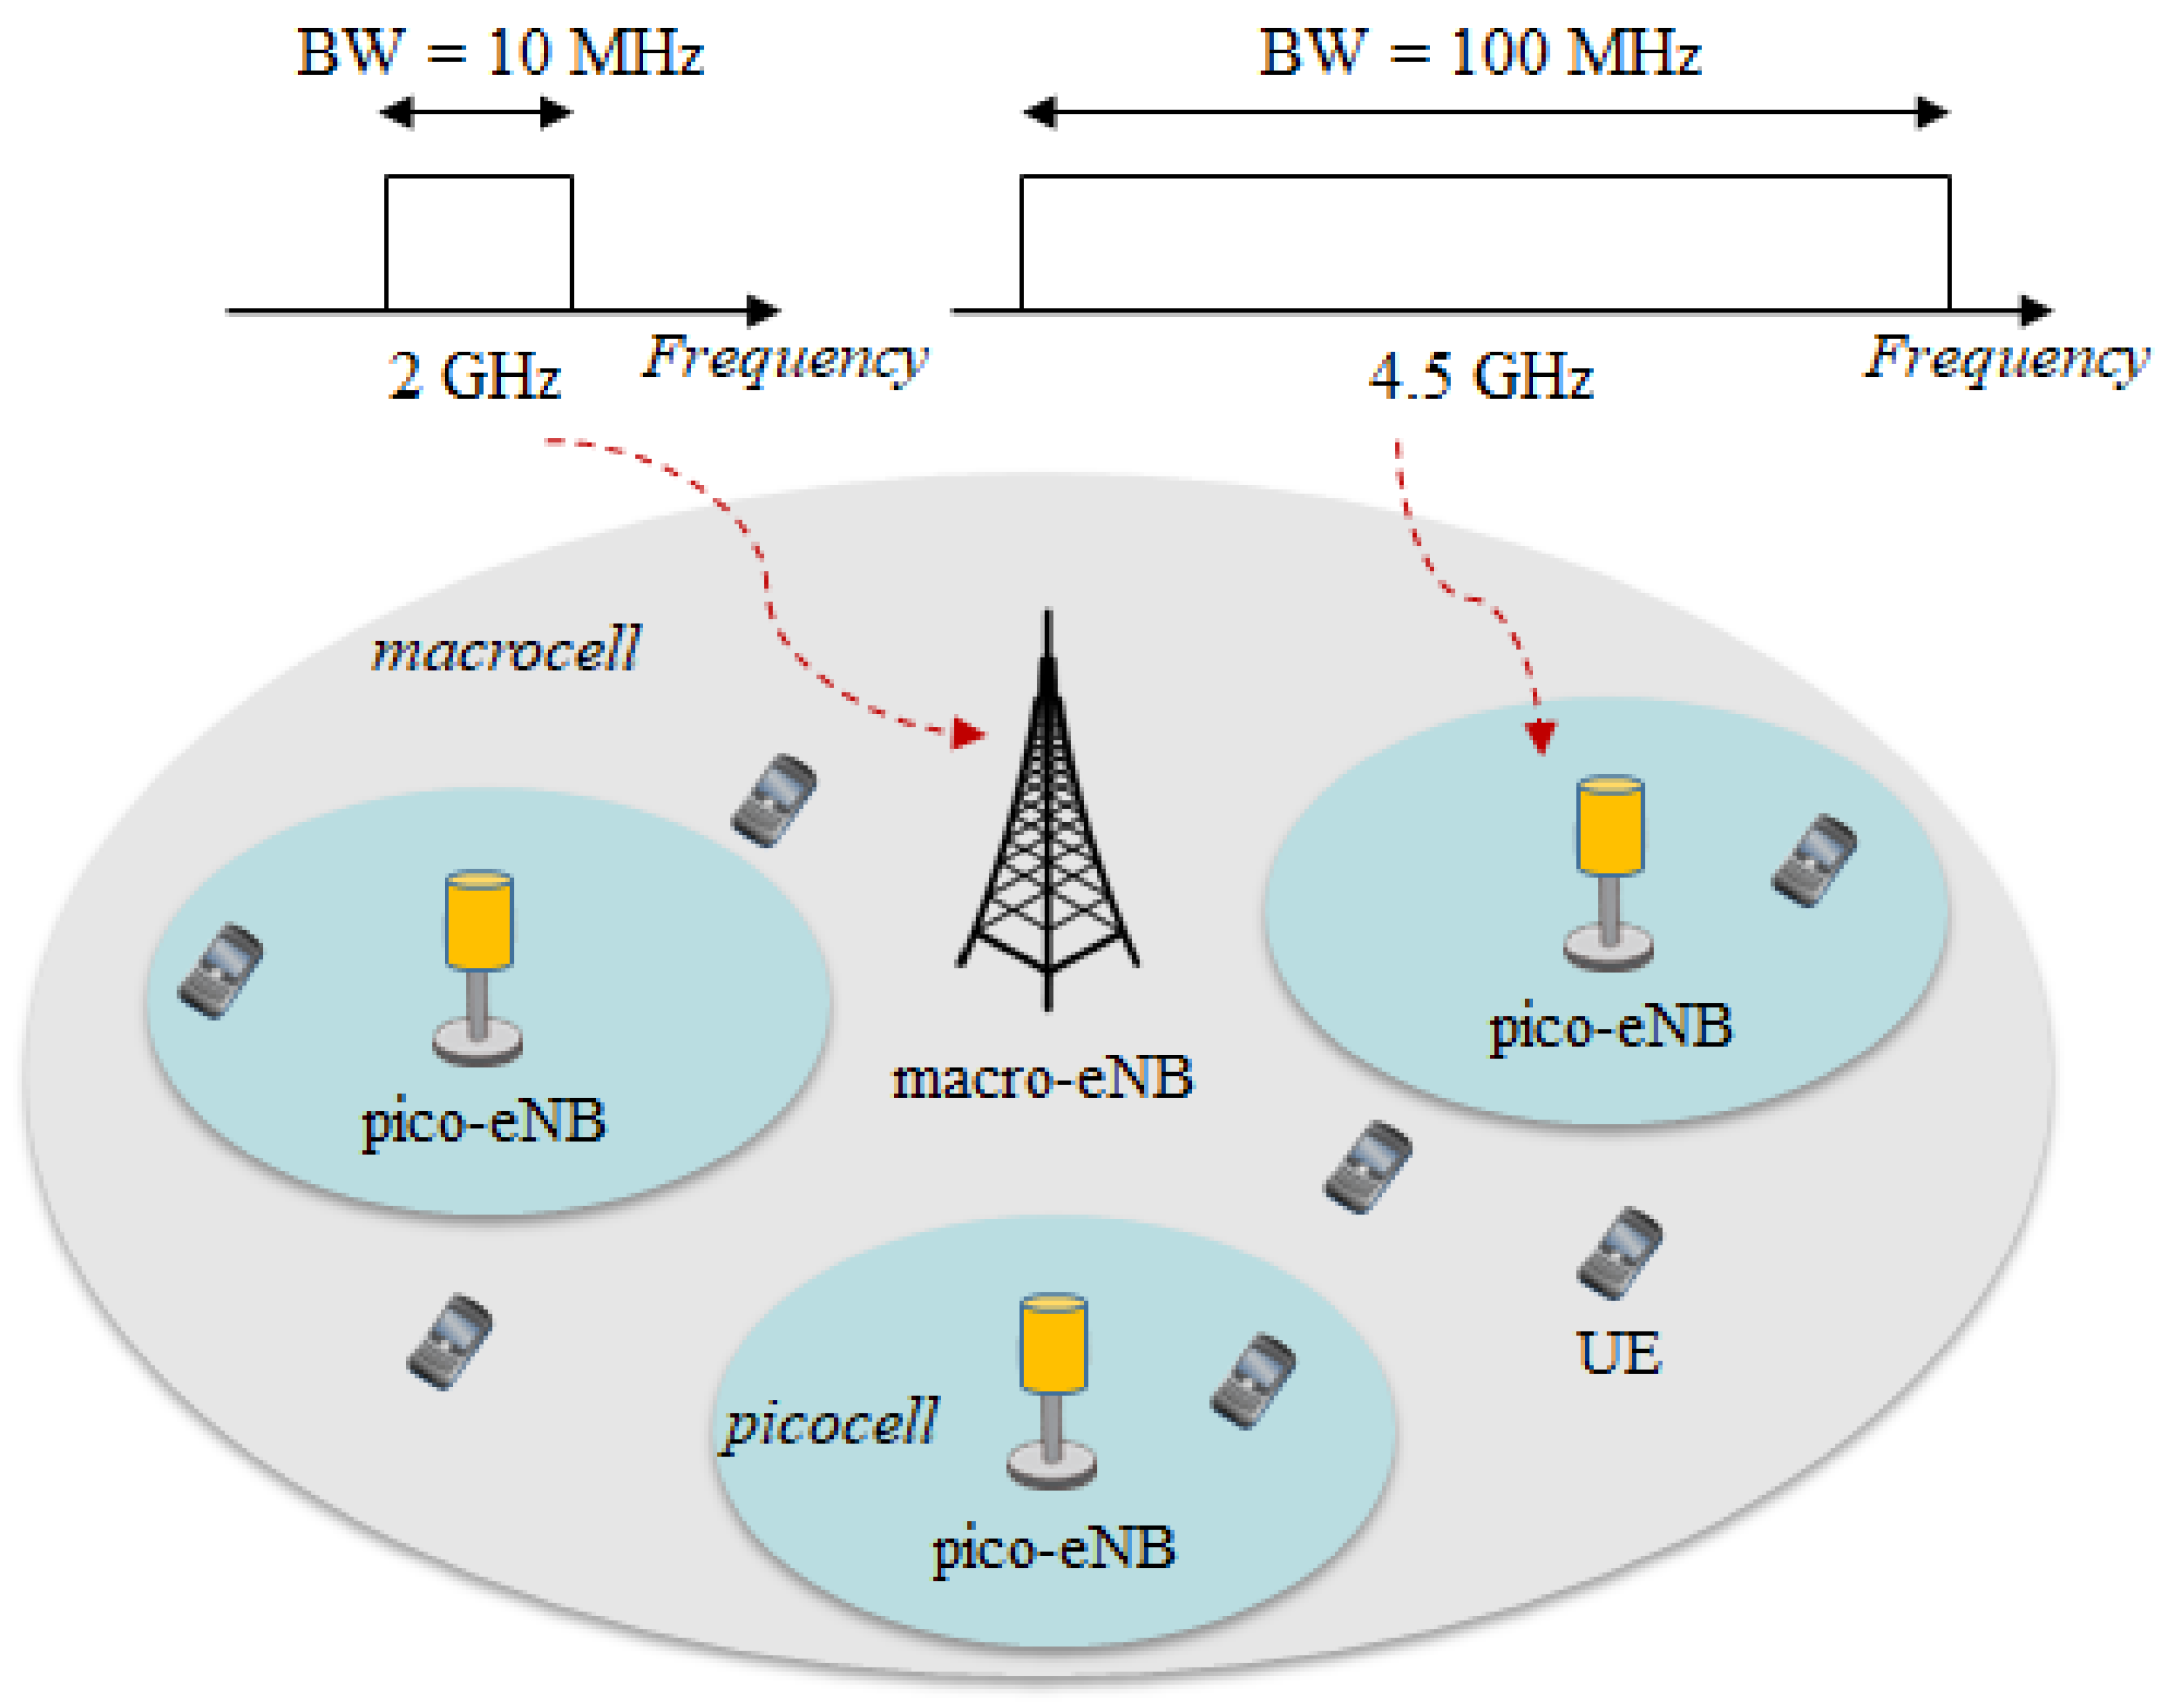
Figure 1 shows a multiband HetNet combining macrocells operating at a 2.0 GHz band and picocells covered by a low-power pico-eNB operating at a 4.5 GHz band. In this paper, we assume that the signal bandwidth of pico-eNBs is 10 times wider than that of a macro-eNB. We also assume that the macrocells comprise three sectors and a couple of picocells are distributed in each macro-sector.
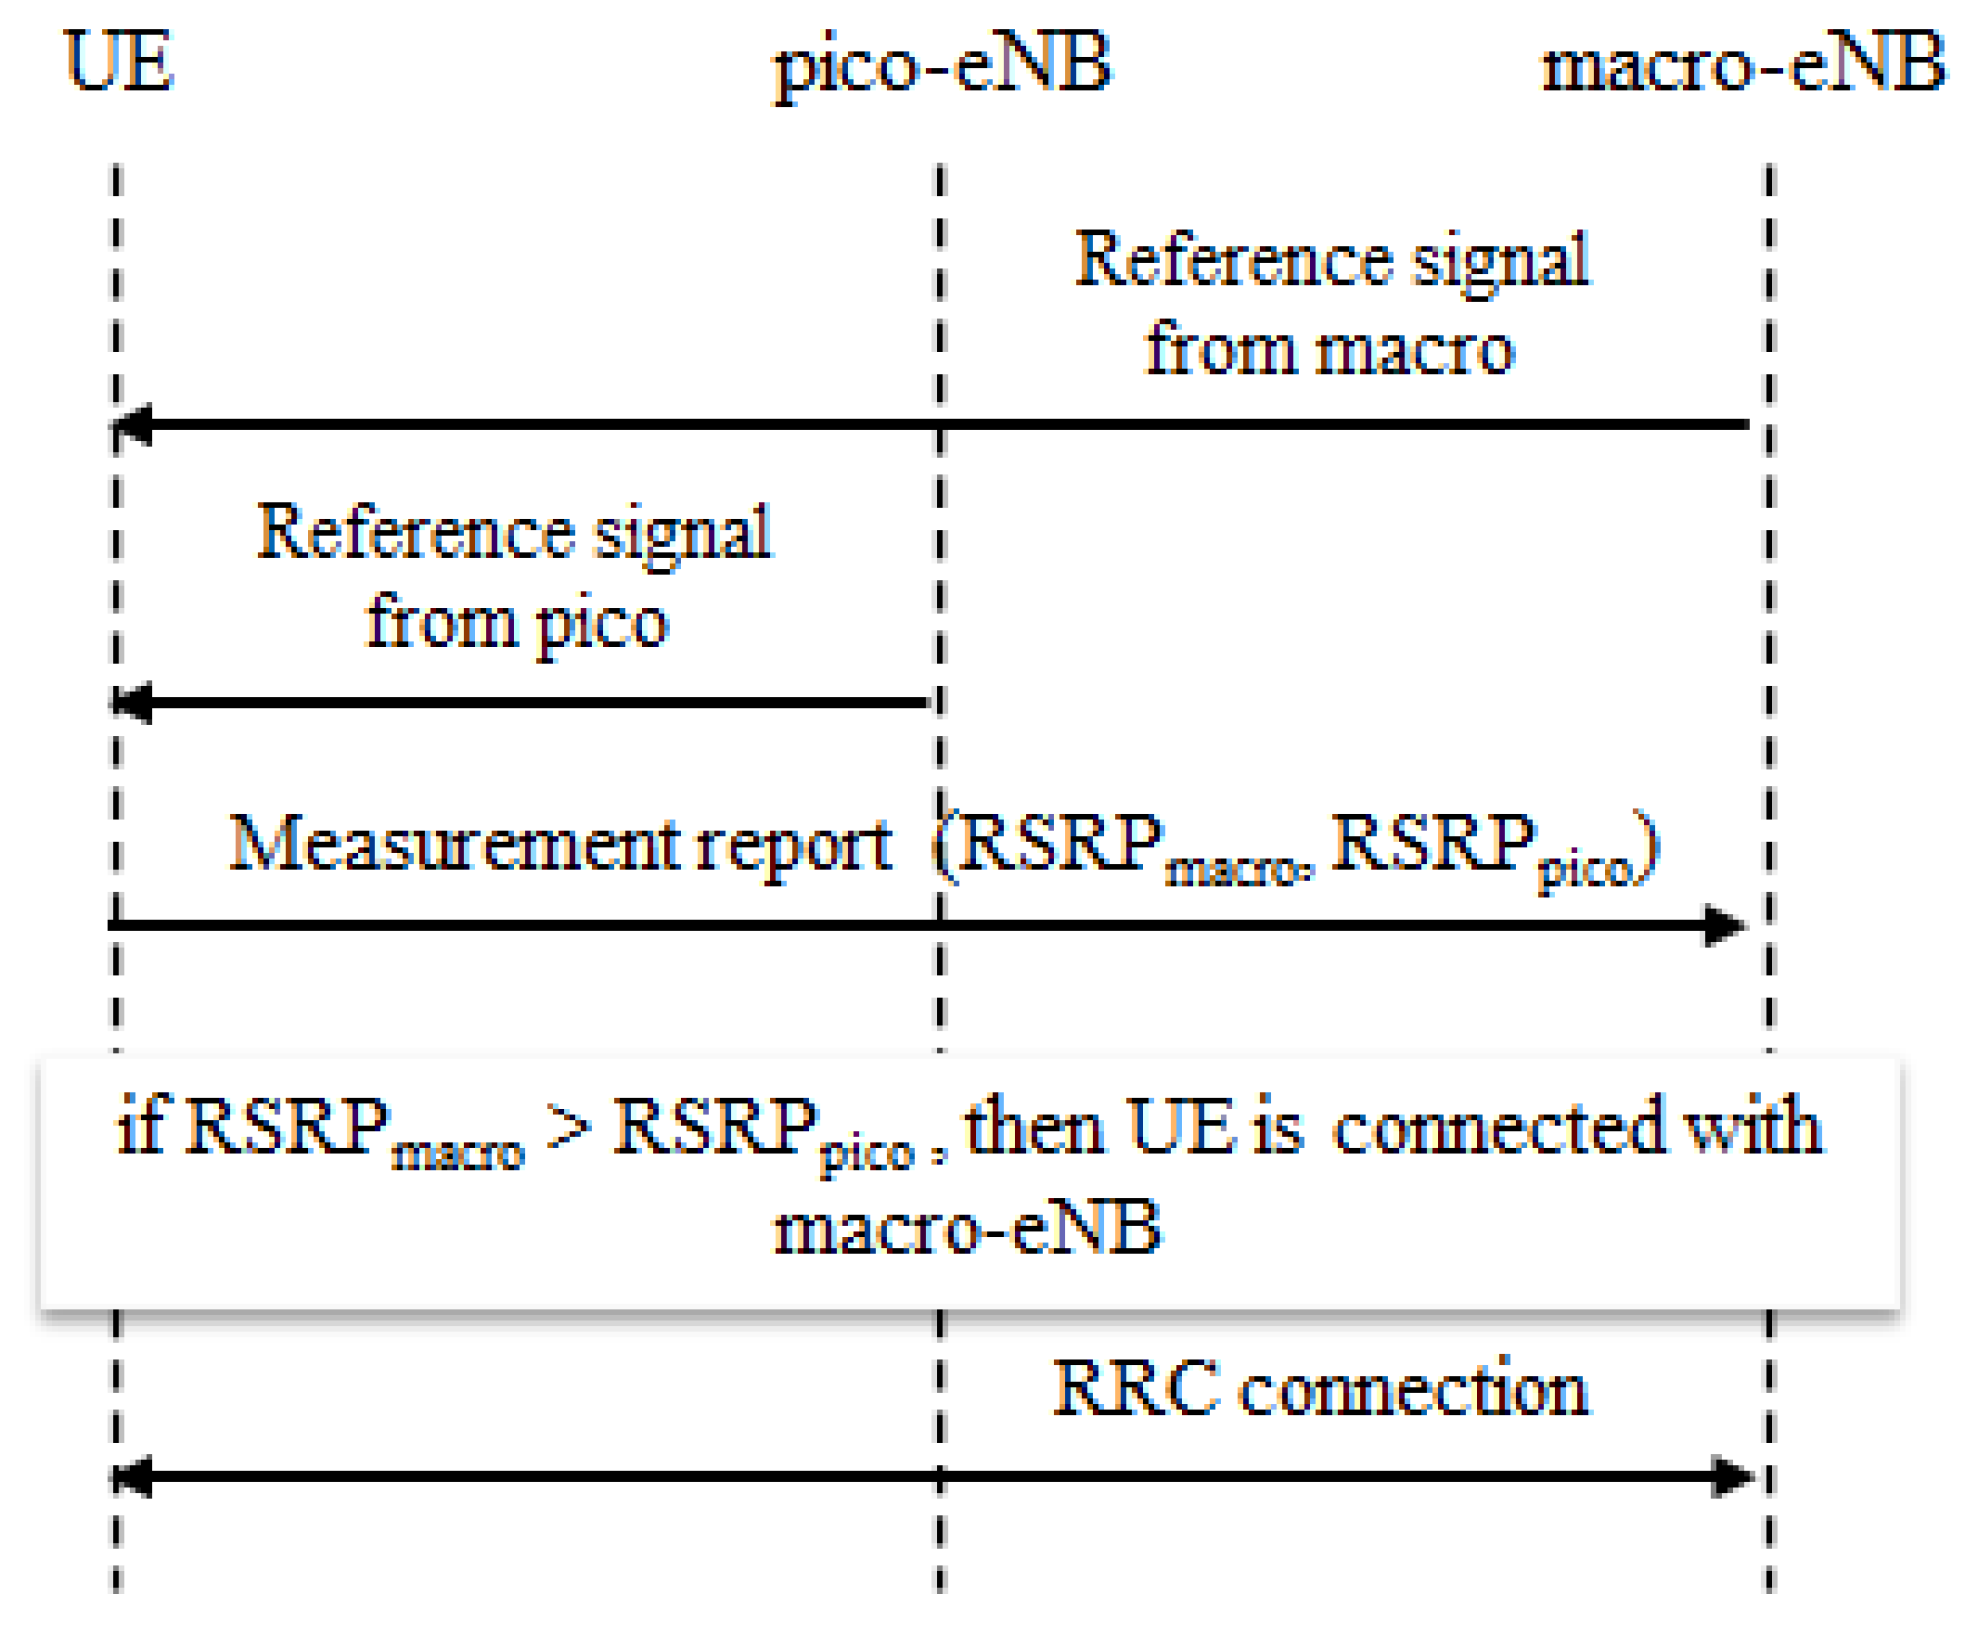
In HetNets, the cell selection procedure which allows the UE to camp onto a cell is executed by measuring a downlink reference signal from macro- and pico-eNBs. For example, cell selection can be based on the downlink RSRP, as shown in Figure 2. The UE first receives reference signals from both macro- and pico-eNBs (i.e., RSRPmacro and RSRPpico). Then the UE replies with the measurement reports including RSRP macro and RSRPpico to a macro-eNB. If the RSRPmacro is larger than RSRPpico, the UE is connected with the macro-eNB and a radio resource control (RRC) connection is established between the UE and the macro-eNB. In 3GPP, the RSRP is defined as the average power of the resource blocks that carry the cell-specific reference signals.
In a typical case, the transmission power of macro-eNBs is larger than that of pico-eNBs. If the carrier frequency of macro-eNBs is the same as that of pico-eNB (i.e., in the case of a singleband HetNet), interference between macro- and pico-eNBs, as well as among pico-eNBs, should be avoided. By contrast, if the carrier frequency of macro-eNBs is different from that of pico-eNB (i.e., in the case of a multiband HetNet), interference among pico-eNBs should mainly be avoided. Either way, the transmission power of pico-eNBs can never be larger than that of macro-eNBs. Therefore, the amount of UE connected with macro-eNBs is greater than what is possible with pico-eNBs as the transmission power of macro-eNBs is larger than that of pico-eNBs. However, for the UE in HetNets, when macro-eNBs lack radio resources, some UE can be connected with pico-eNBs, even though the RSRPmacro is larger than RSRPpico. This traffic offload from macrocells to picocells will be more significant when the traffic in the macrocell increases drastically.
3. HetNet Model and Simulation Conditions
3.1. Multiband HetNet Model and Simulation Setup
We investigate the average and 5-percentile user throughput of a multiband HetNet using system-level computer simulations. The system-level simulations are sufficient for evaluating user throughput for mobile networks, and contribute significantly to the requirements at early stages of development and hardware implementation.
The parameters of the HetNet model used in the simulations are listed in Table 1. The carrier frequencies used in the macro- and pico-eNB are 2.0 and 4.5 GHz, respectively. The signal bandwidth for each macro-sector is 10 MHz, and the bandwidth for each picocell is 100 MHz. The number of picocells distributed in each macro-sector is fixed to 4, and the number of UE installations in each macro-sector is assumed to be 30, which is usually used in 3GPP simulation assumptions [41,42].
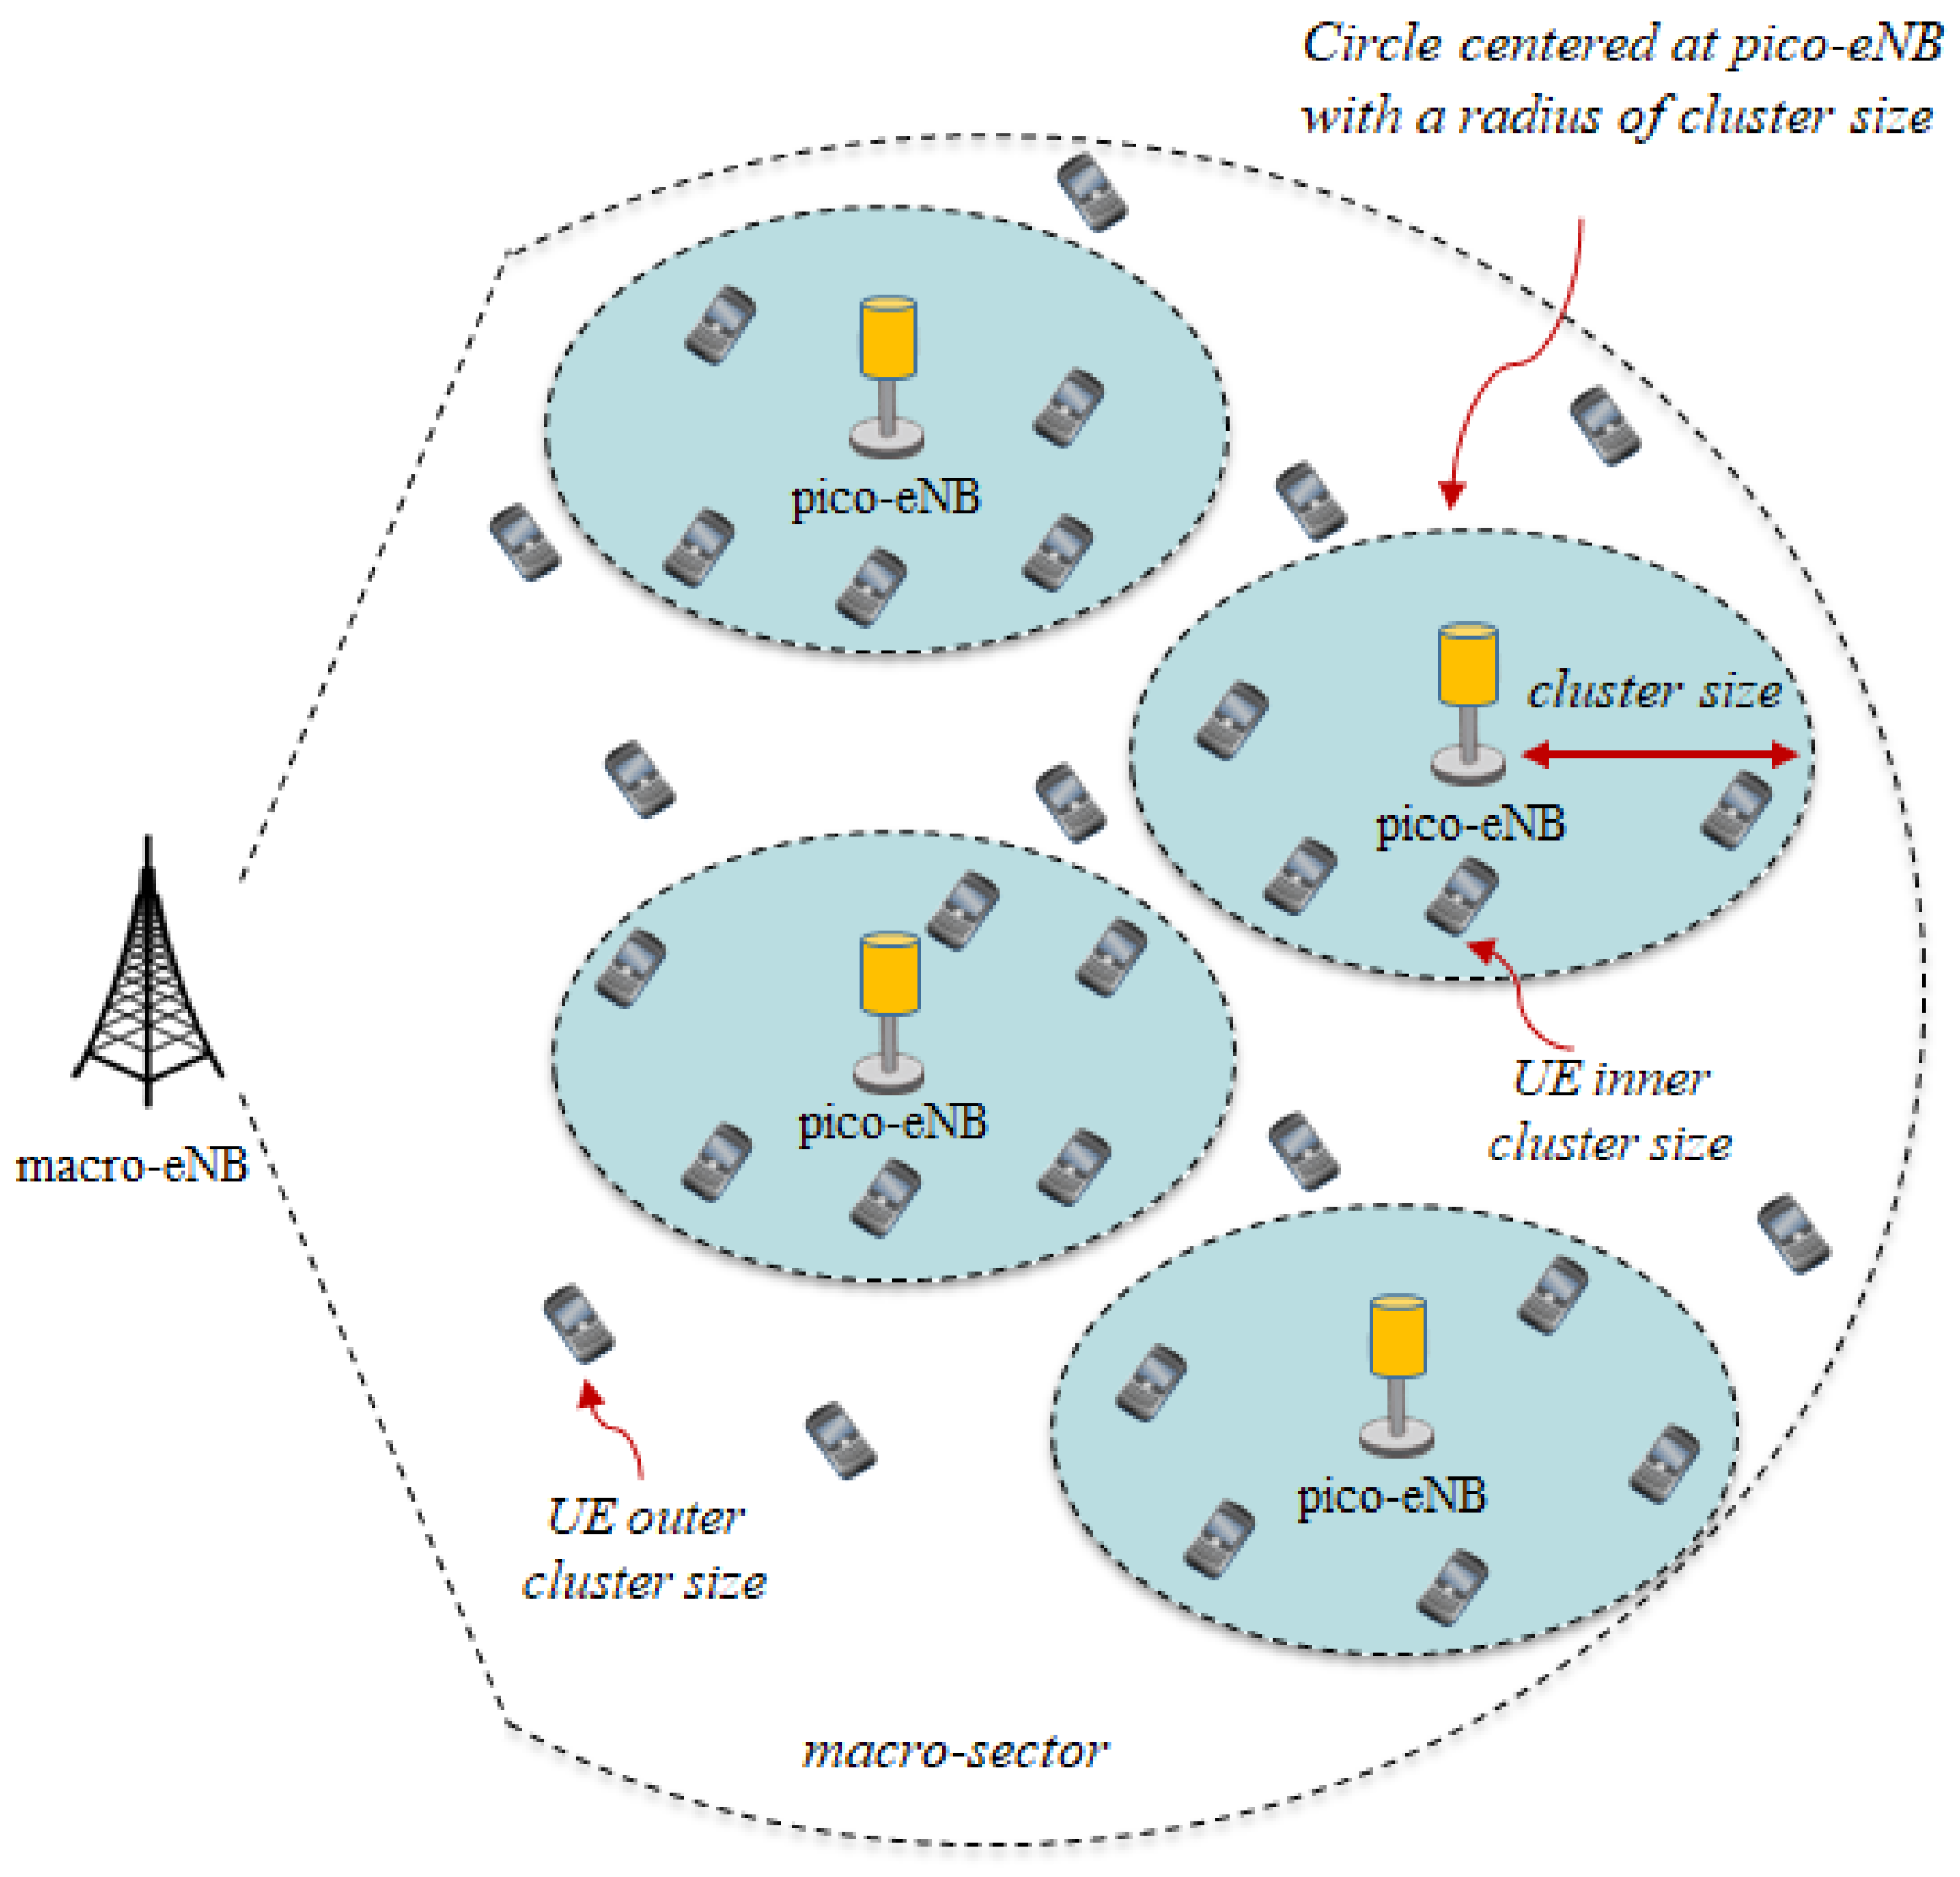
The UE layout is important for executing system-level computer simulations because large amounts of UE should be distributed in the HetNet to evaluate the user throughput. Figure 3 shows the definition of cluster size for the UE layout, which comprises the radius of a circle centered at each pico-eNB. When the UE layout is based on the form of the cluster distribution near the pico-eNBs, the ratio of the UE cluster distribution is defined as the ratio of the number of UE within a circle of a specific radius (cluster size) to the number of UE outside a circle [41,43].
Figure 3 shows an example of a two-thirds (2/3) UE cluster distribution. Assuming that the number of UE in the macro-sector is 30, 20 pieces of UE are distributed within the circle centered at pico-eNBs; the remaining 10 pieces of UE are distributed outside the circle. The Tx power of pico-eNBs varies from 28 to 46 dBm, whereas that of macro-eNBs is fixed at 46 dBm. The path-loss model and other assumptions are obtained from [44].
3.2. MCS Indexes Incorporating 1024-QAM and Fading Channel Model
MCS is used as the link adaptation to determine the data rate in the downlink which depends on the channel link quality between pico-eNBs and the UE. The MCS defines the number of useful data bits that can be transmitted, which depends on the channel link quality between eNBs and UE. The channel link quality is estimated based on the channel quality indicator which is reported by the UE using the uplink control channels. In the simulations, 25 types of MCS indexes incorporating 1024-QAM are defined in the downlink as listed in Table 2 [30]. Macro-eNBs and pico-eNBs can choose the best MCS index based on the channel link quality. The lowest and highest modulation schemes are QPSK and 1024-QAM, respectively. The MCS index incorporating a high QAM is assigned to the UE with better channel link quality, whereas QPSK is always assigned to the UE with worse channel link quality. Multipath fading channels are formed by a tapped delay line (TDL) with a specific delay and gain. Table 3 shows the TDL model used in the simulation, which provides Rayleigh fading with a delay spread of 30 ns [45]. The TDL model is used in both the macrocells and picocells.
4. Optimization of Pico-eNB Tx Power
4.1. User Throughput Versus Pico-eNB Tx Power
In this section, we investigate the user throughput as a function of pico-eNB Tx power to determine the optimal pico-eNB Tx power using system-level computer simulations on the parameters provided in Table 1.
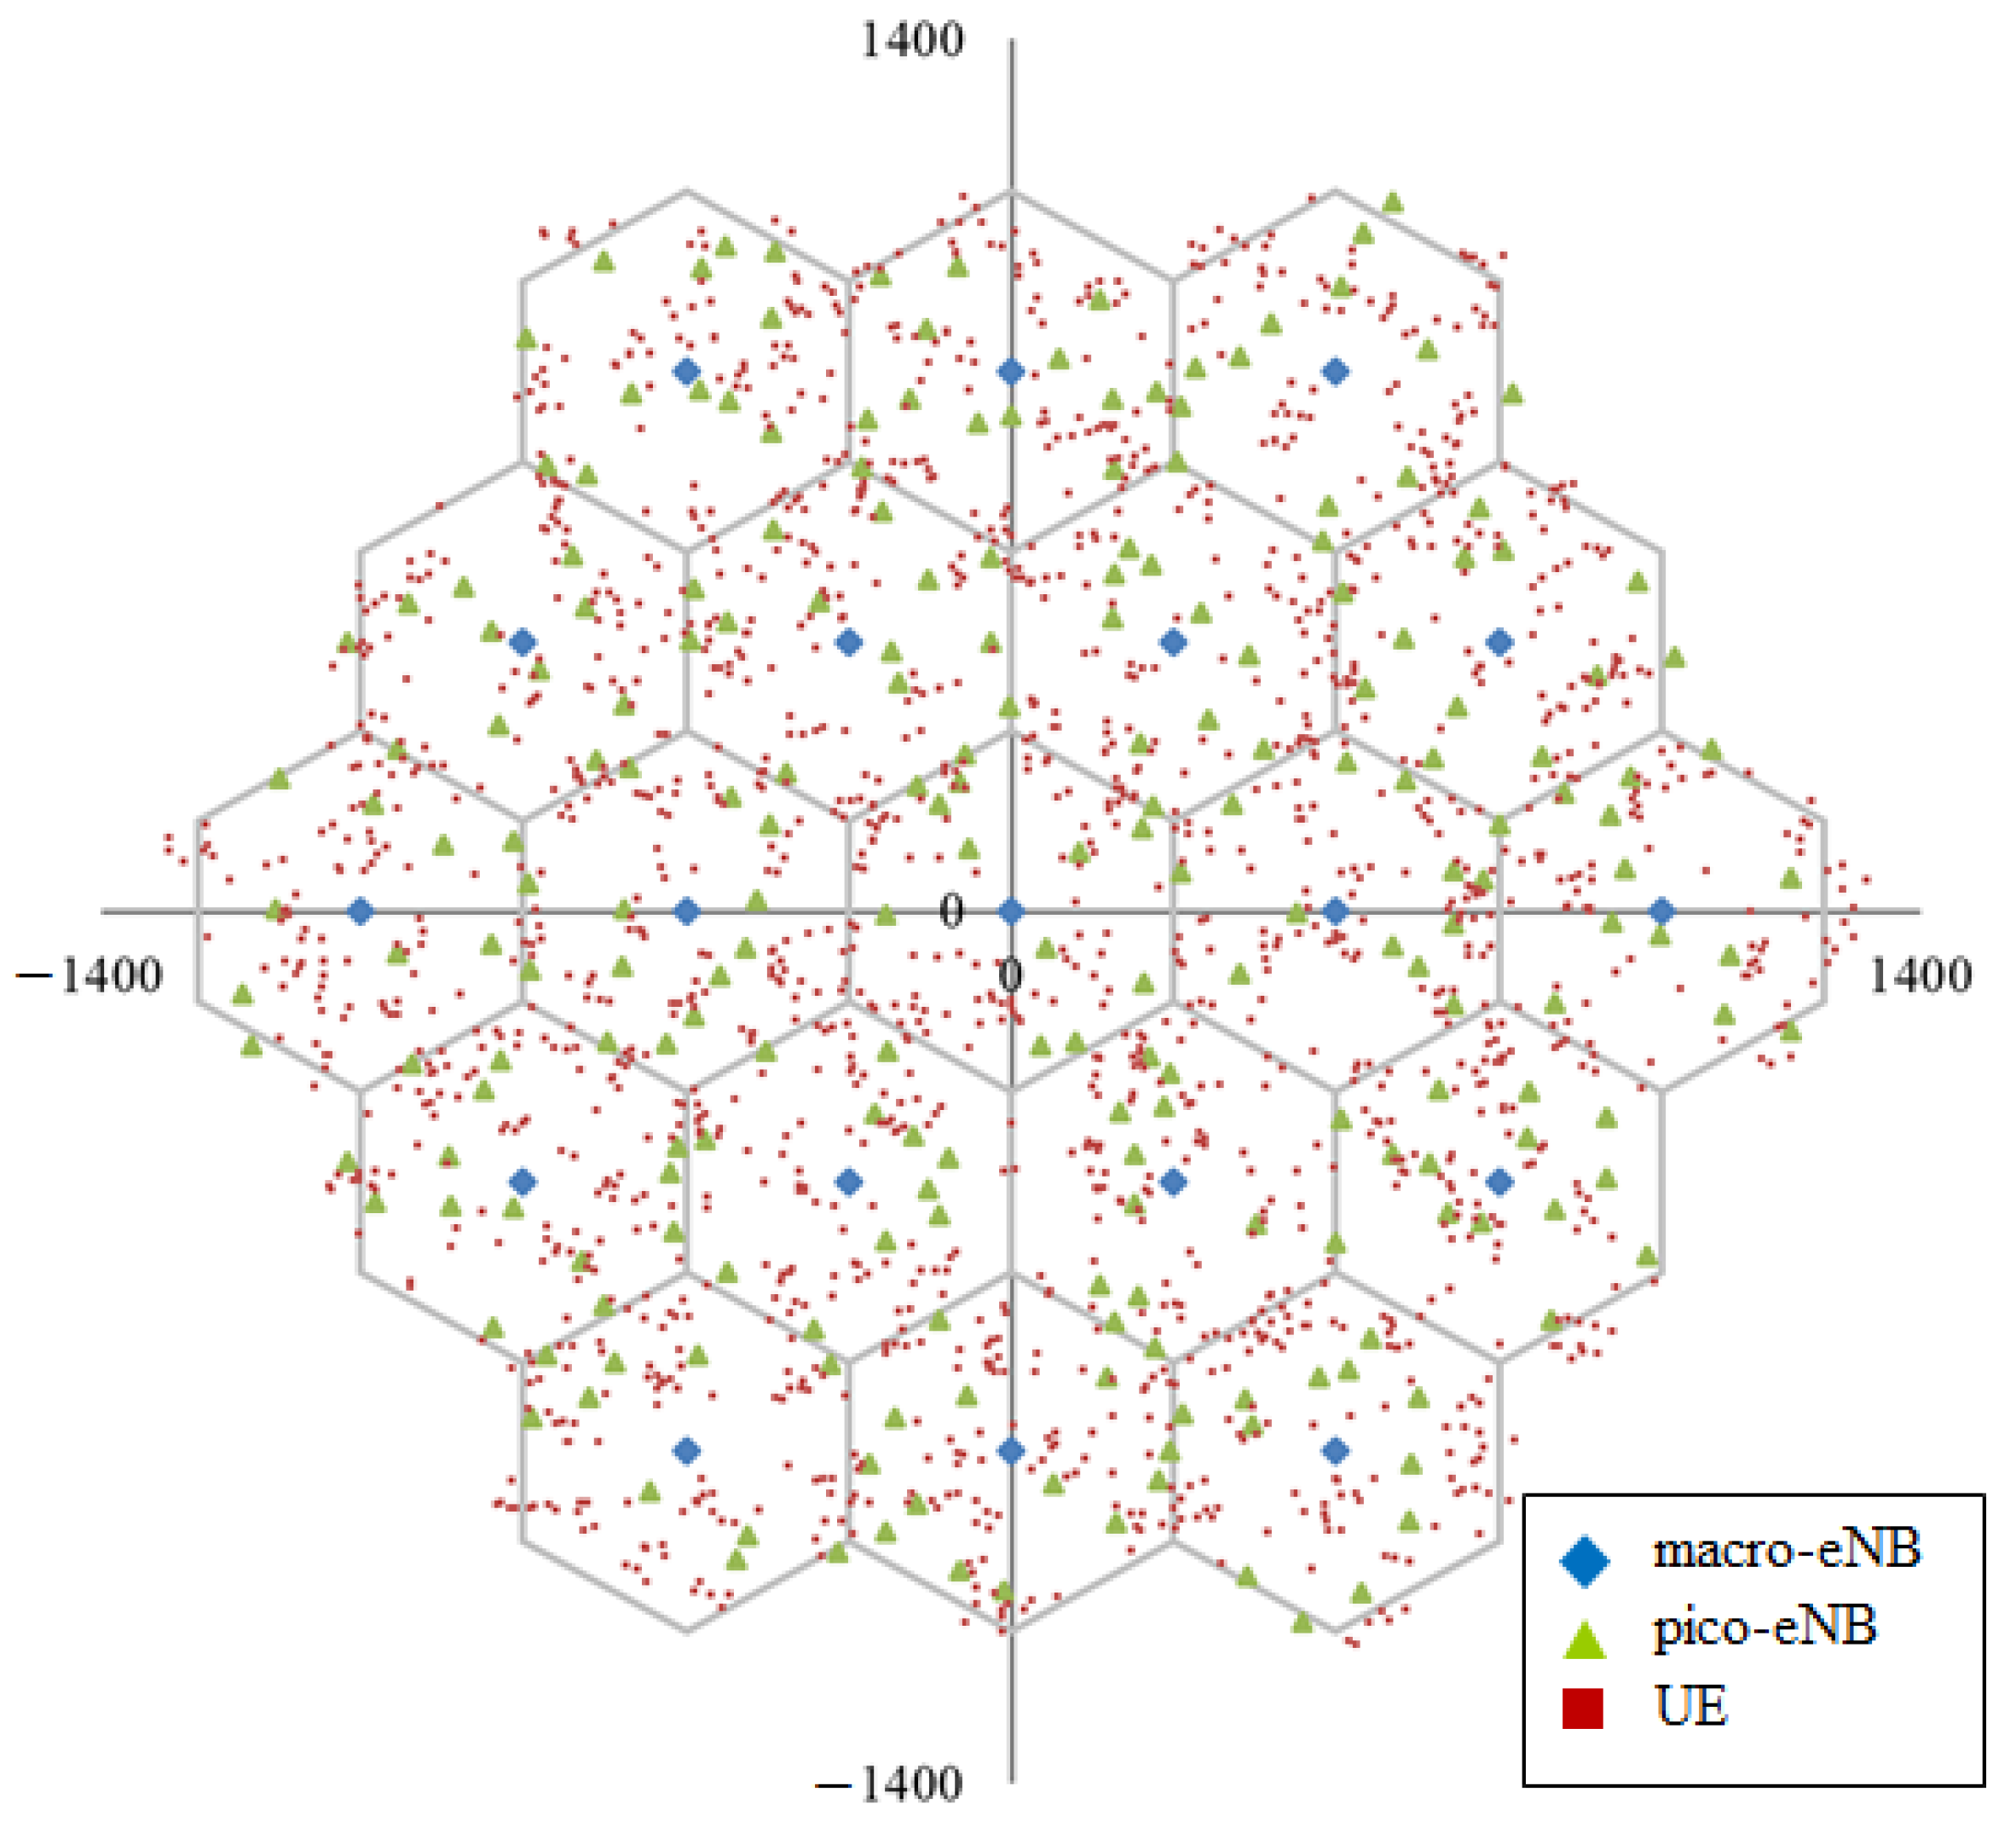
Figure 4 shows the simulation outputs of macro- and pico-eNBs as well as the UE distribution in 19 macrocells at a given instant for a cluster size of 40 m, where the blue diamonds, green triangles, and red squares show the macro-eNBs, pico-eNBs, and UE, respectively.
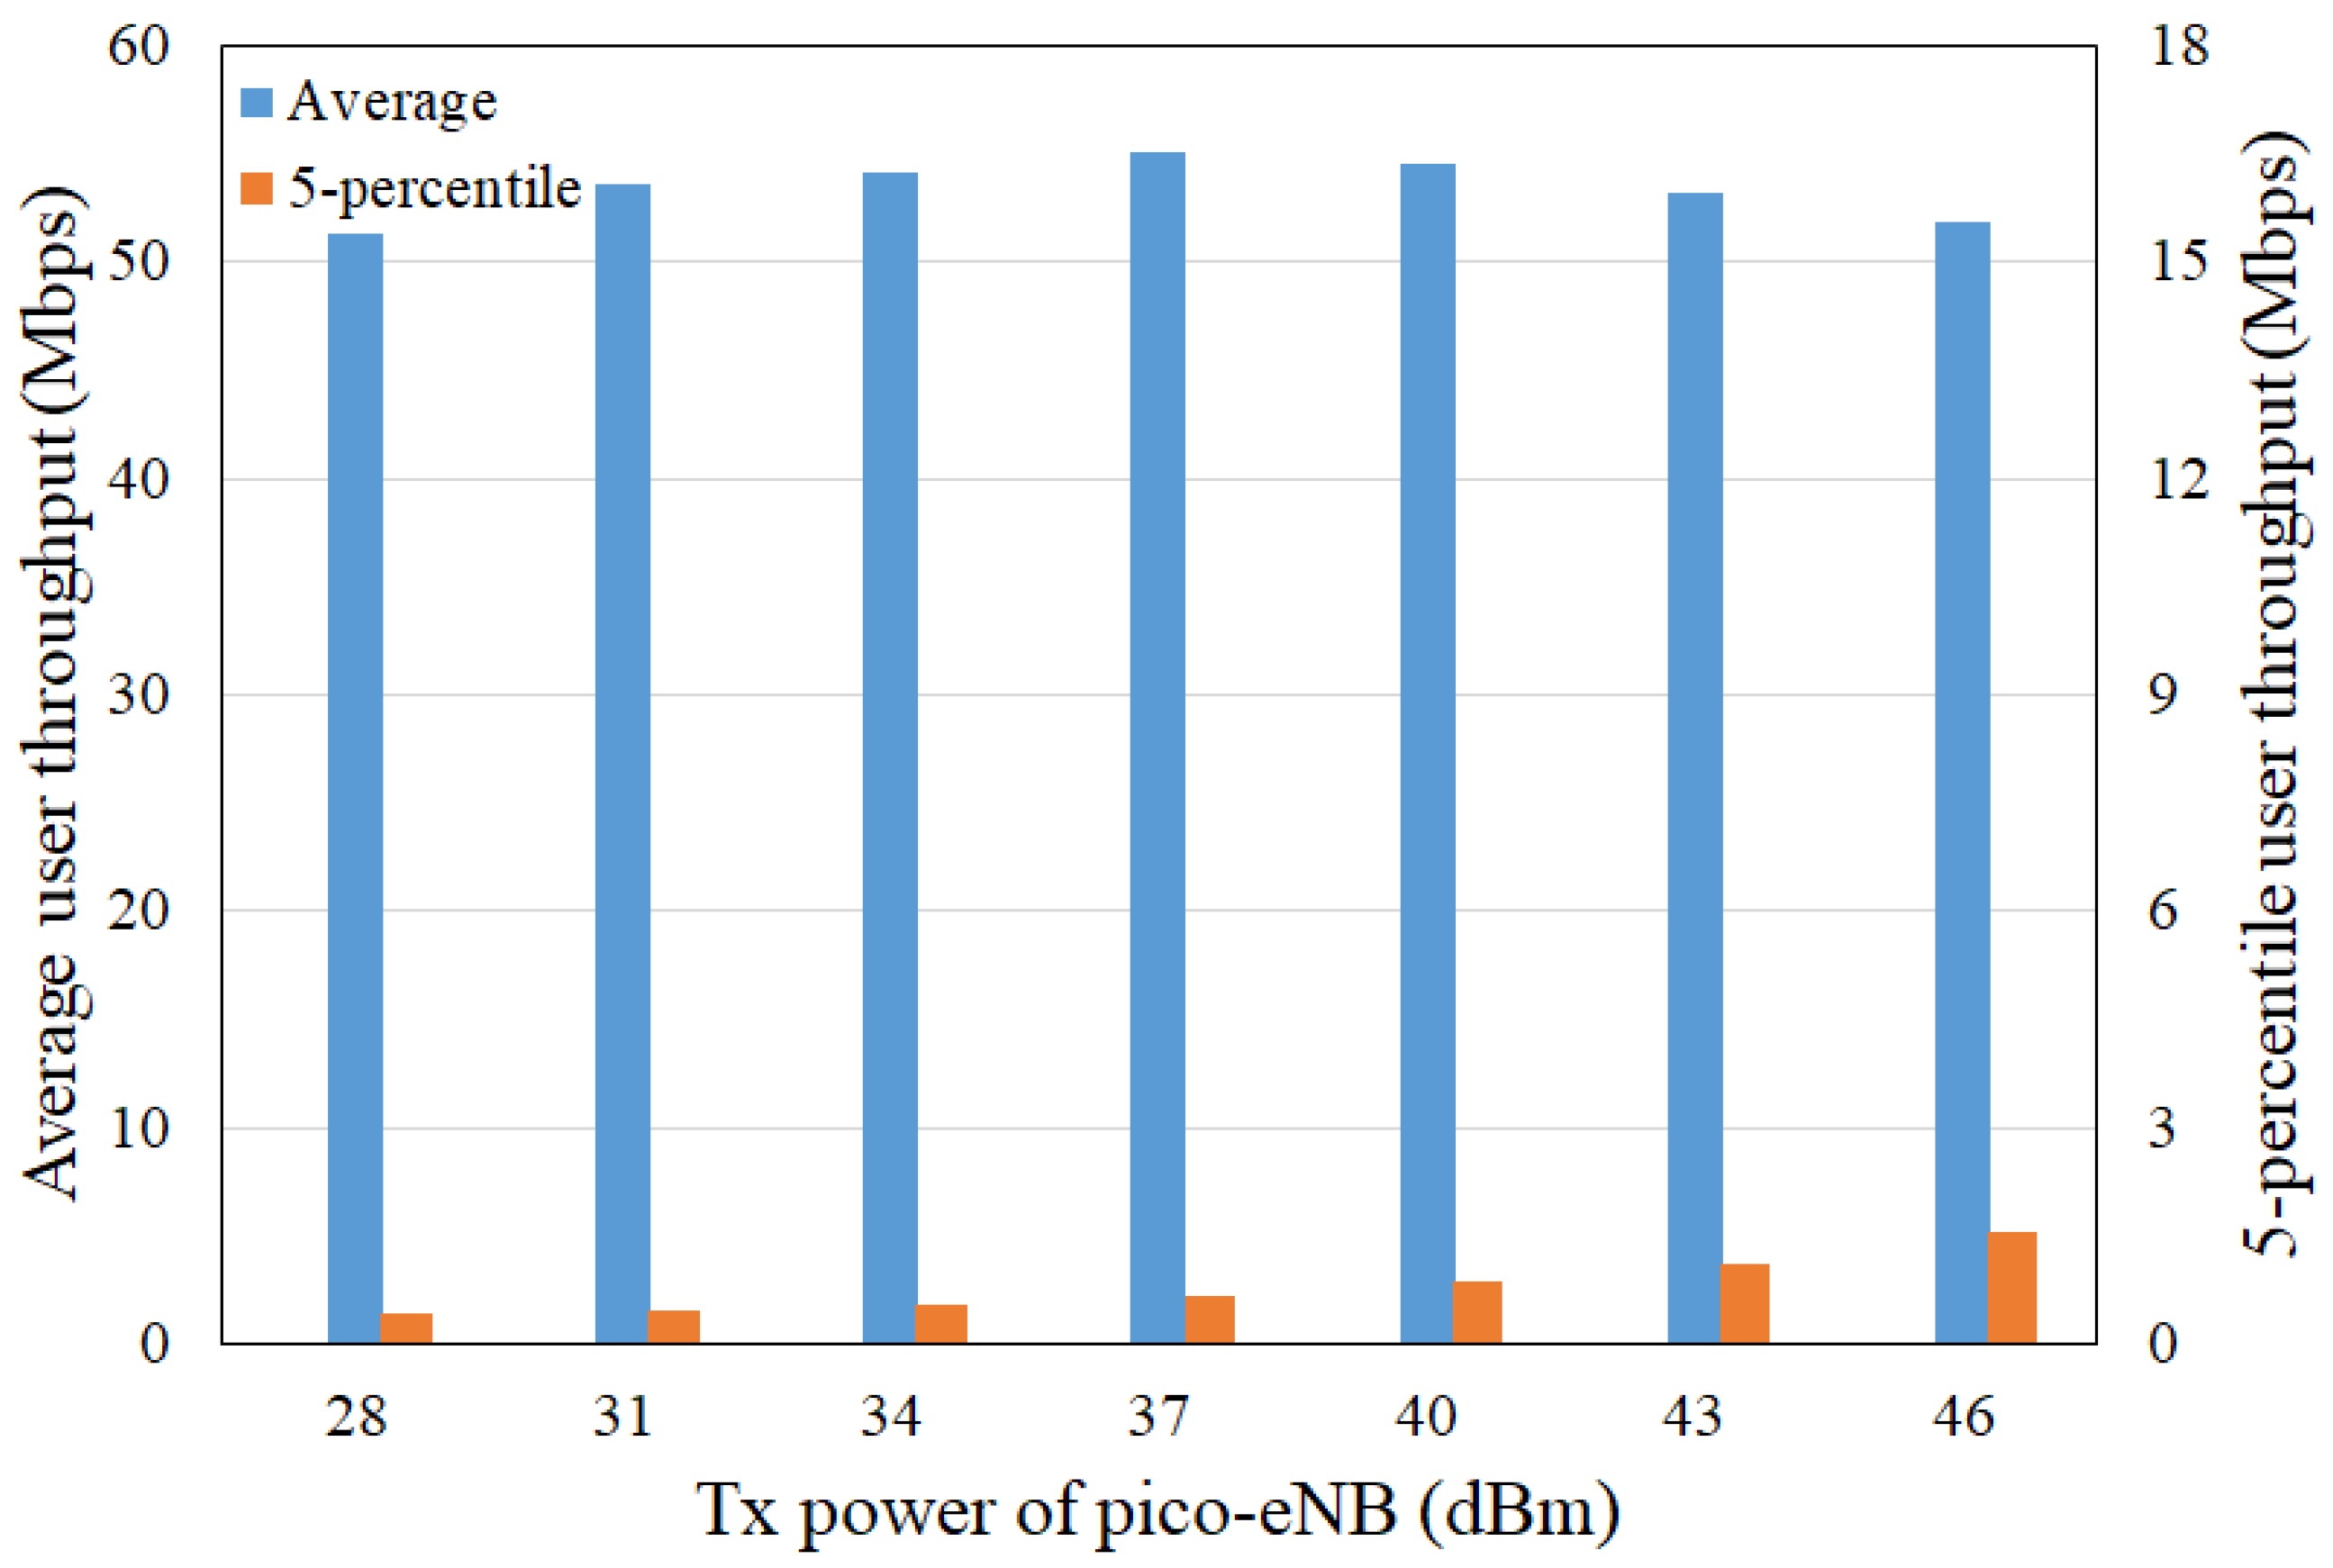
Figure 5 shows the average and 5-percentile user throughput as a function of pico-eNB Tx power, where the blue bars and orange bars show the average user throughput and the 5-percentile user throughput, respectively. The average user throughput increases as the Tx power increases up to approximately 37 dBm. However, Tx powers greater than 37 dBm slightly degrades the average user throughput. A wider signal bandwidth (i.e., large number of resource blocks for pico-eNBs) could be effectively used up to a Tx power of 37 dBm. However, efficiency is reduced for Tx powers greater than 37 dBm because the interference among pico-eNBs increases. For example, a Tx power of 37 dBm was able to improve the average user throughput by approximately 12% compared with that for a Tx power of 31 dBm. The 5-percentile user throughput increases as the Tx power increases. Here, the 5-percentile user throughput is defined as the 5th percentile point of the cumulative distribution function (CDF) of the user throughput. On the basis of these results, it was shown that a pico-eNB Tx power of 37 dBm was able to provide the best performance if the average user throughput was given priority.
Figure 6 shows the CDF of the downlink effective SINR for all UE as a function of the three pico-eNB Tx powers, i.e., 28 (blue line), 37 (gray line), and 46 (red line) dBm. This is used to verify the results obtained in Figure 5. The SINR for the pico-eNB Tx power of 37 dBm provides the best performance among the three.
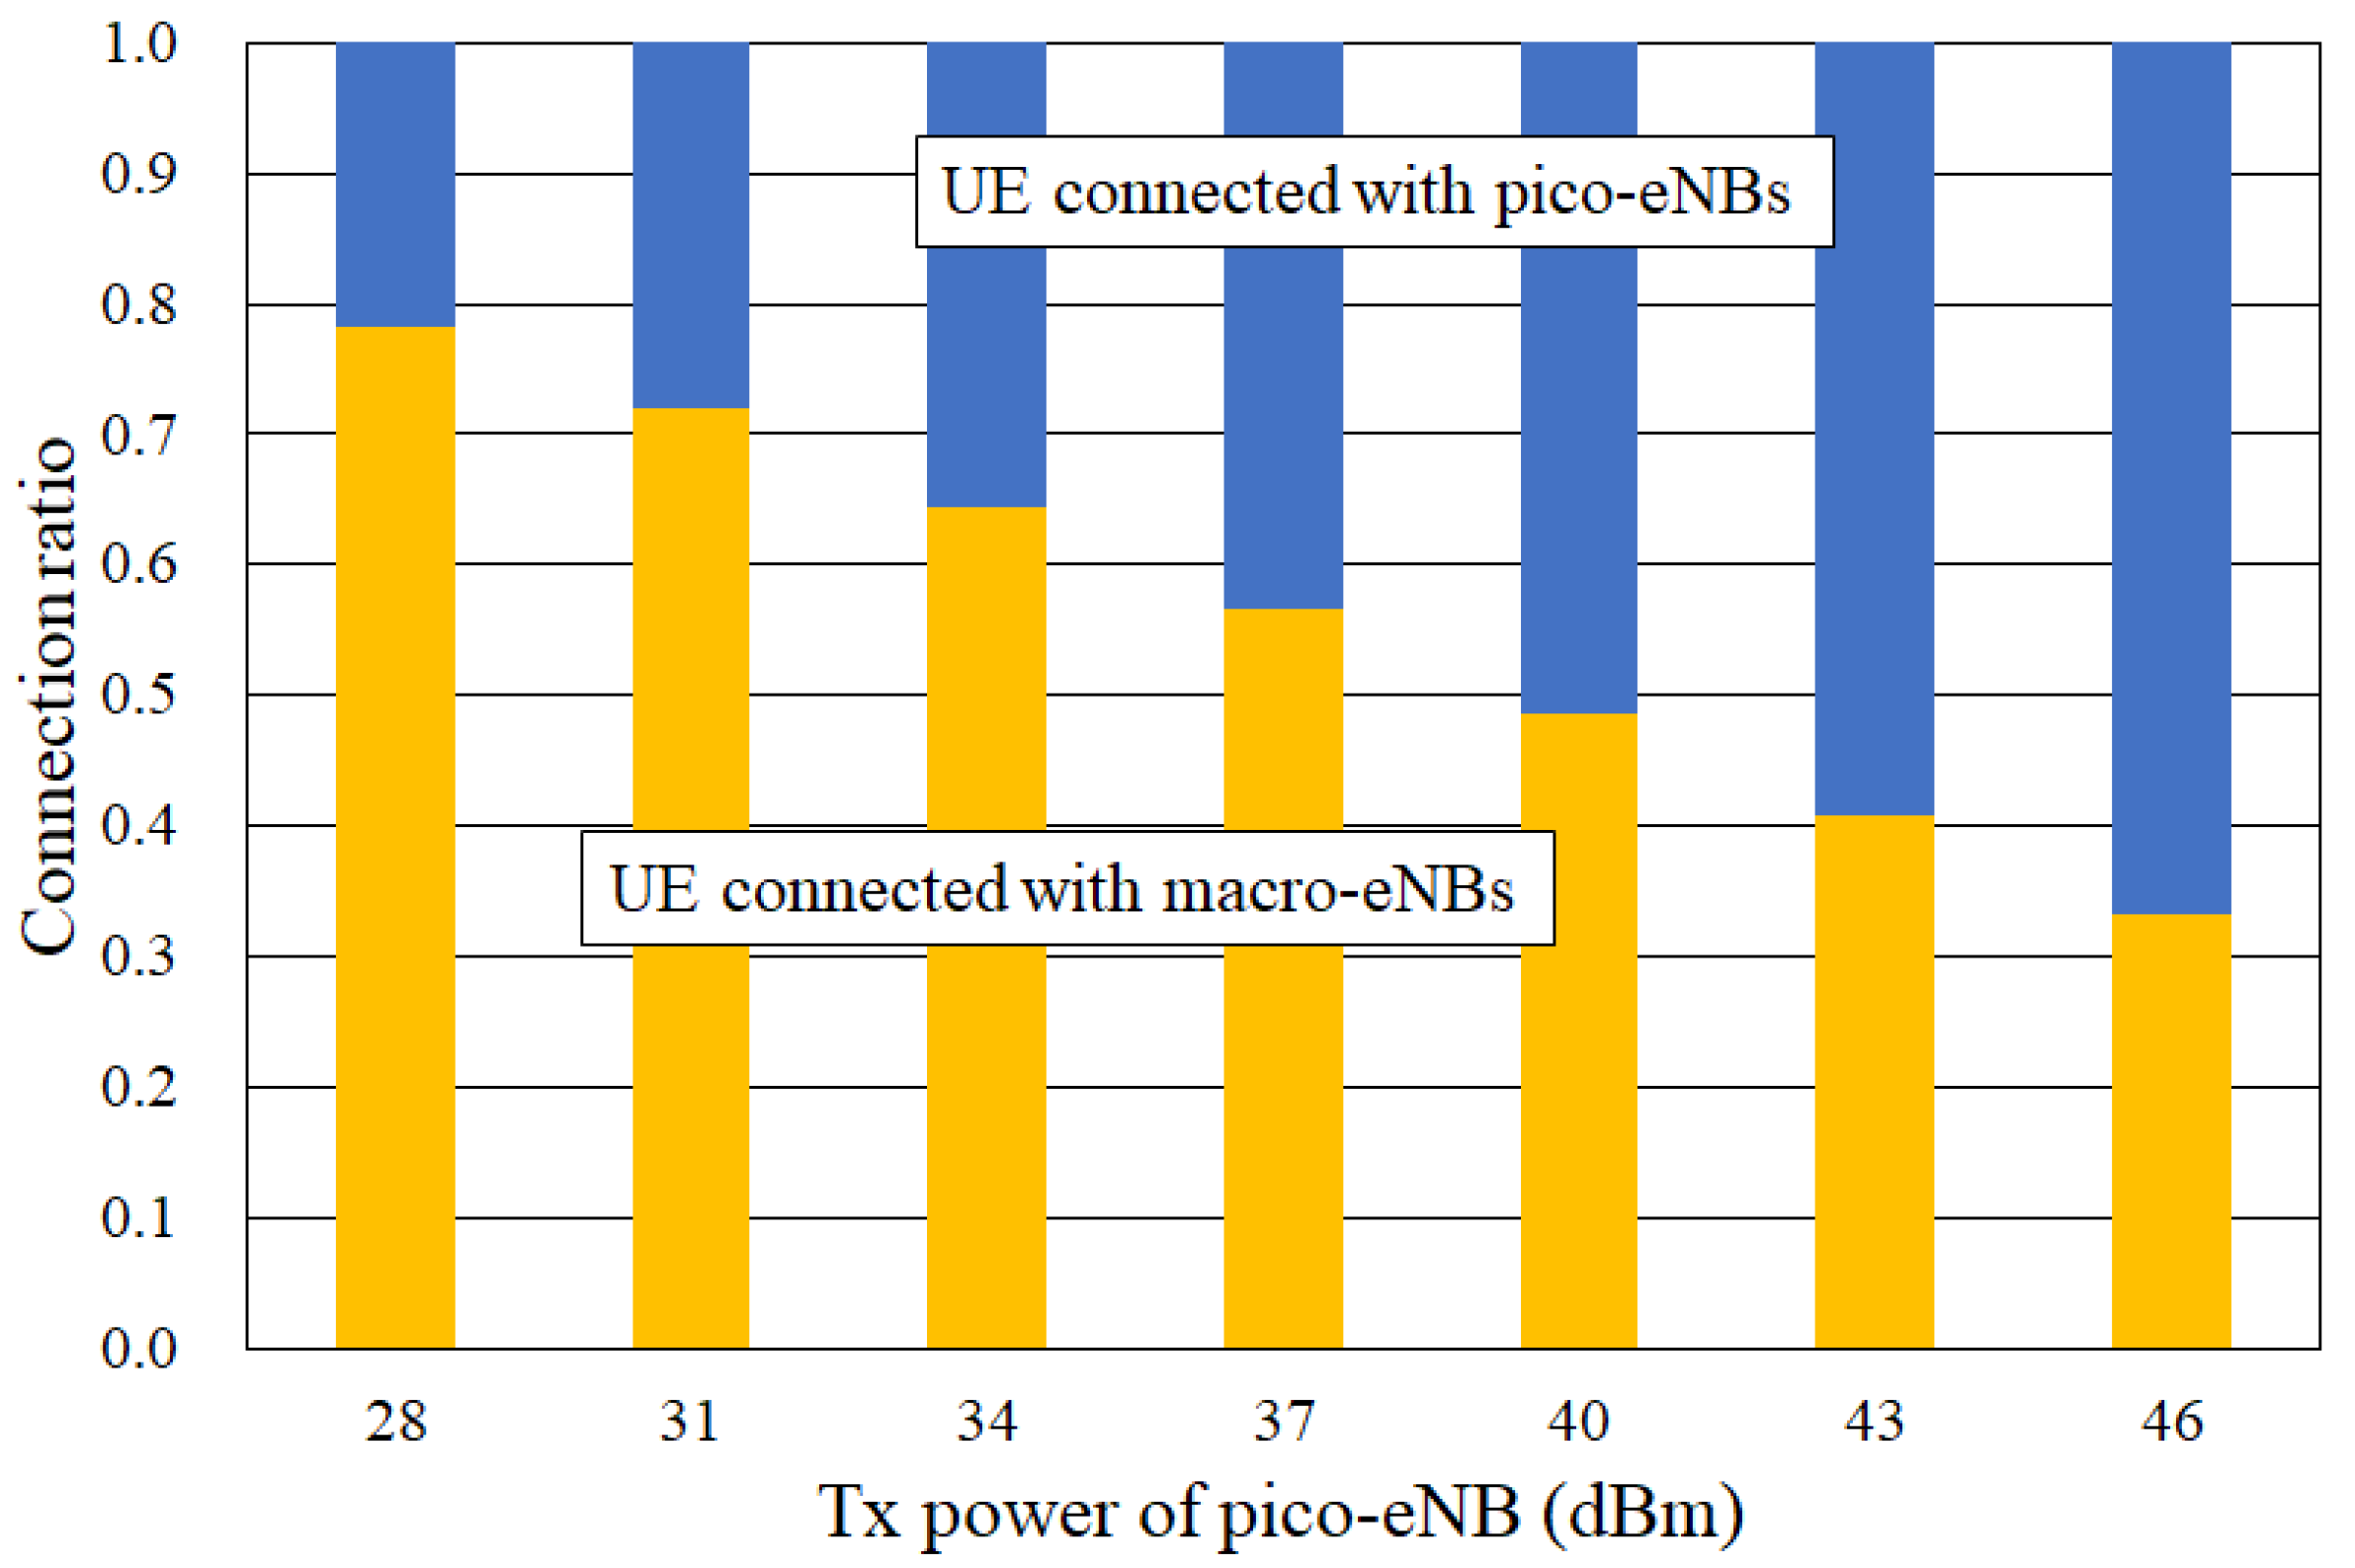
Figure 7 shows the connection ratio of UE as a function of the pico-eNB Tx power, where the blue and the yellow bars show the ratios of the UE connected with pico-eNBs and macro-eNBs, respectively. Essentially, the ratio of the UE connected with pico-eNBs increases as the pico-eNB Tx power increases. When the pico-eNB Tx power is 37 dBm, the ratio of the UE connected with a pico-eNB reaches 43%. This means that 735 pieces of UE are connected with pico-eNBs in the 19 macrocells and the rest (975 pieces of UE) are connected with macro-eNBs.
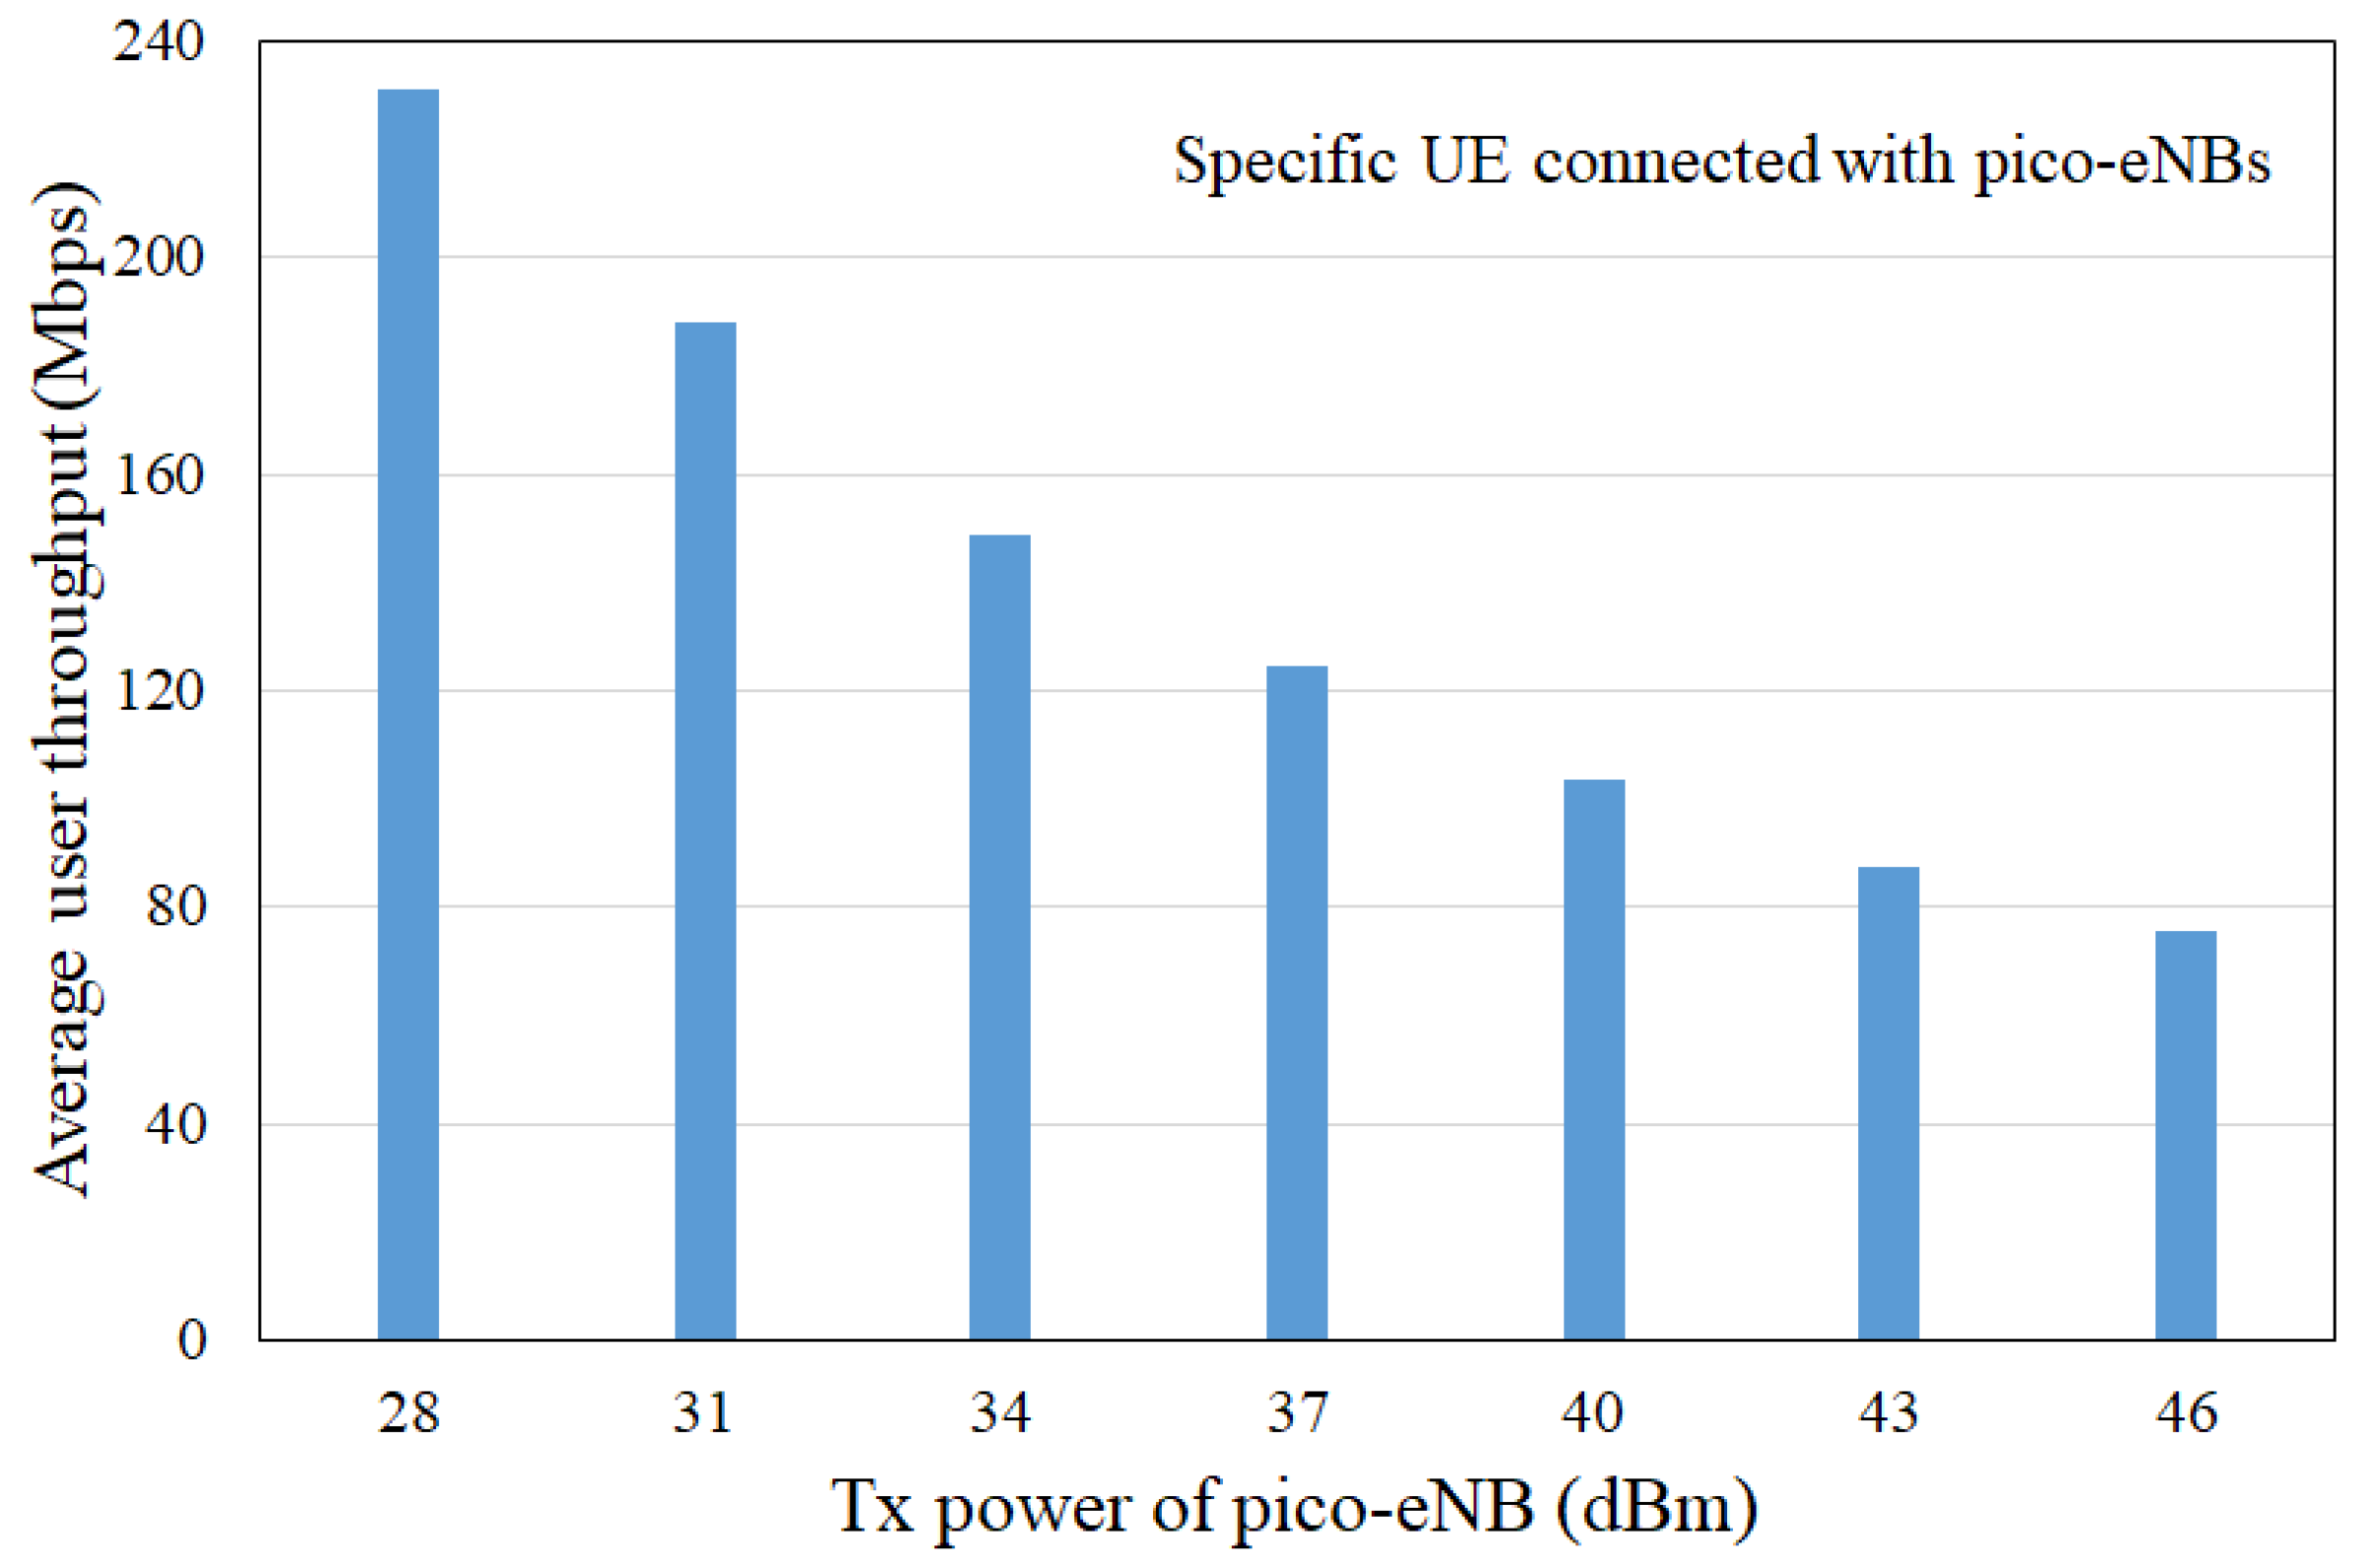
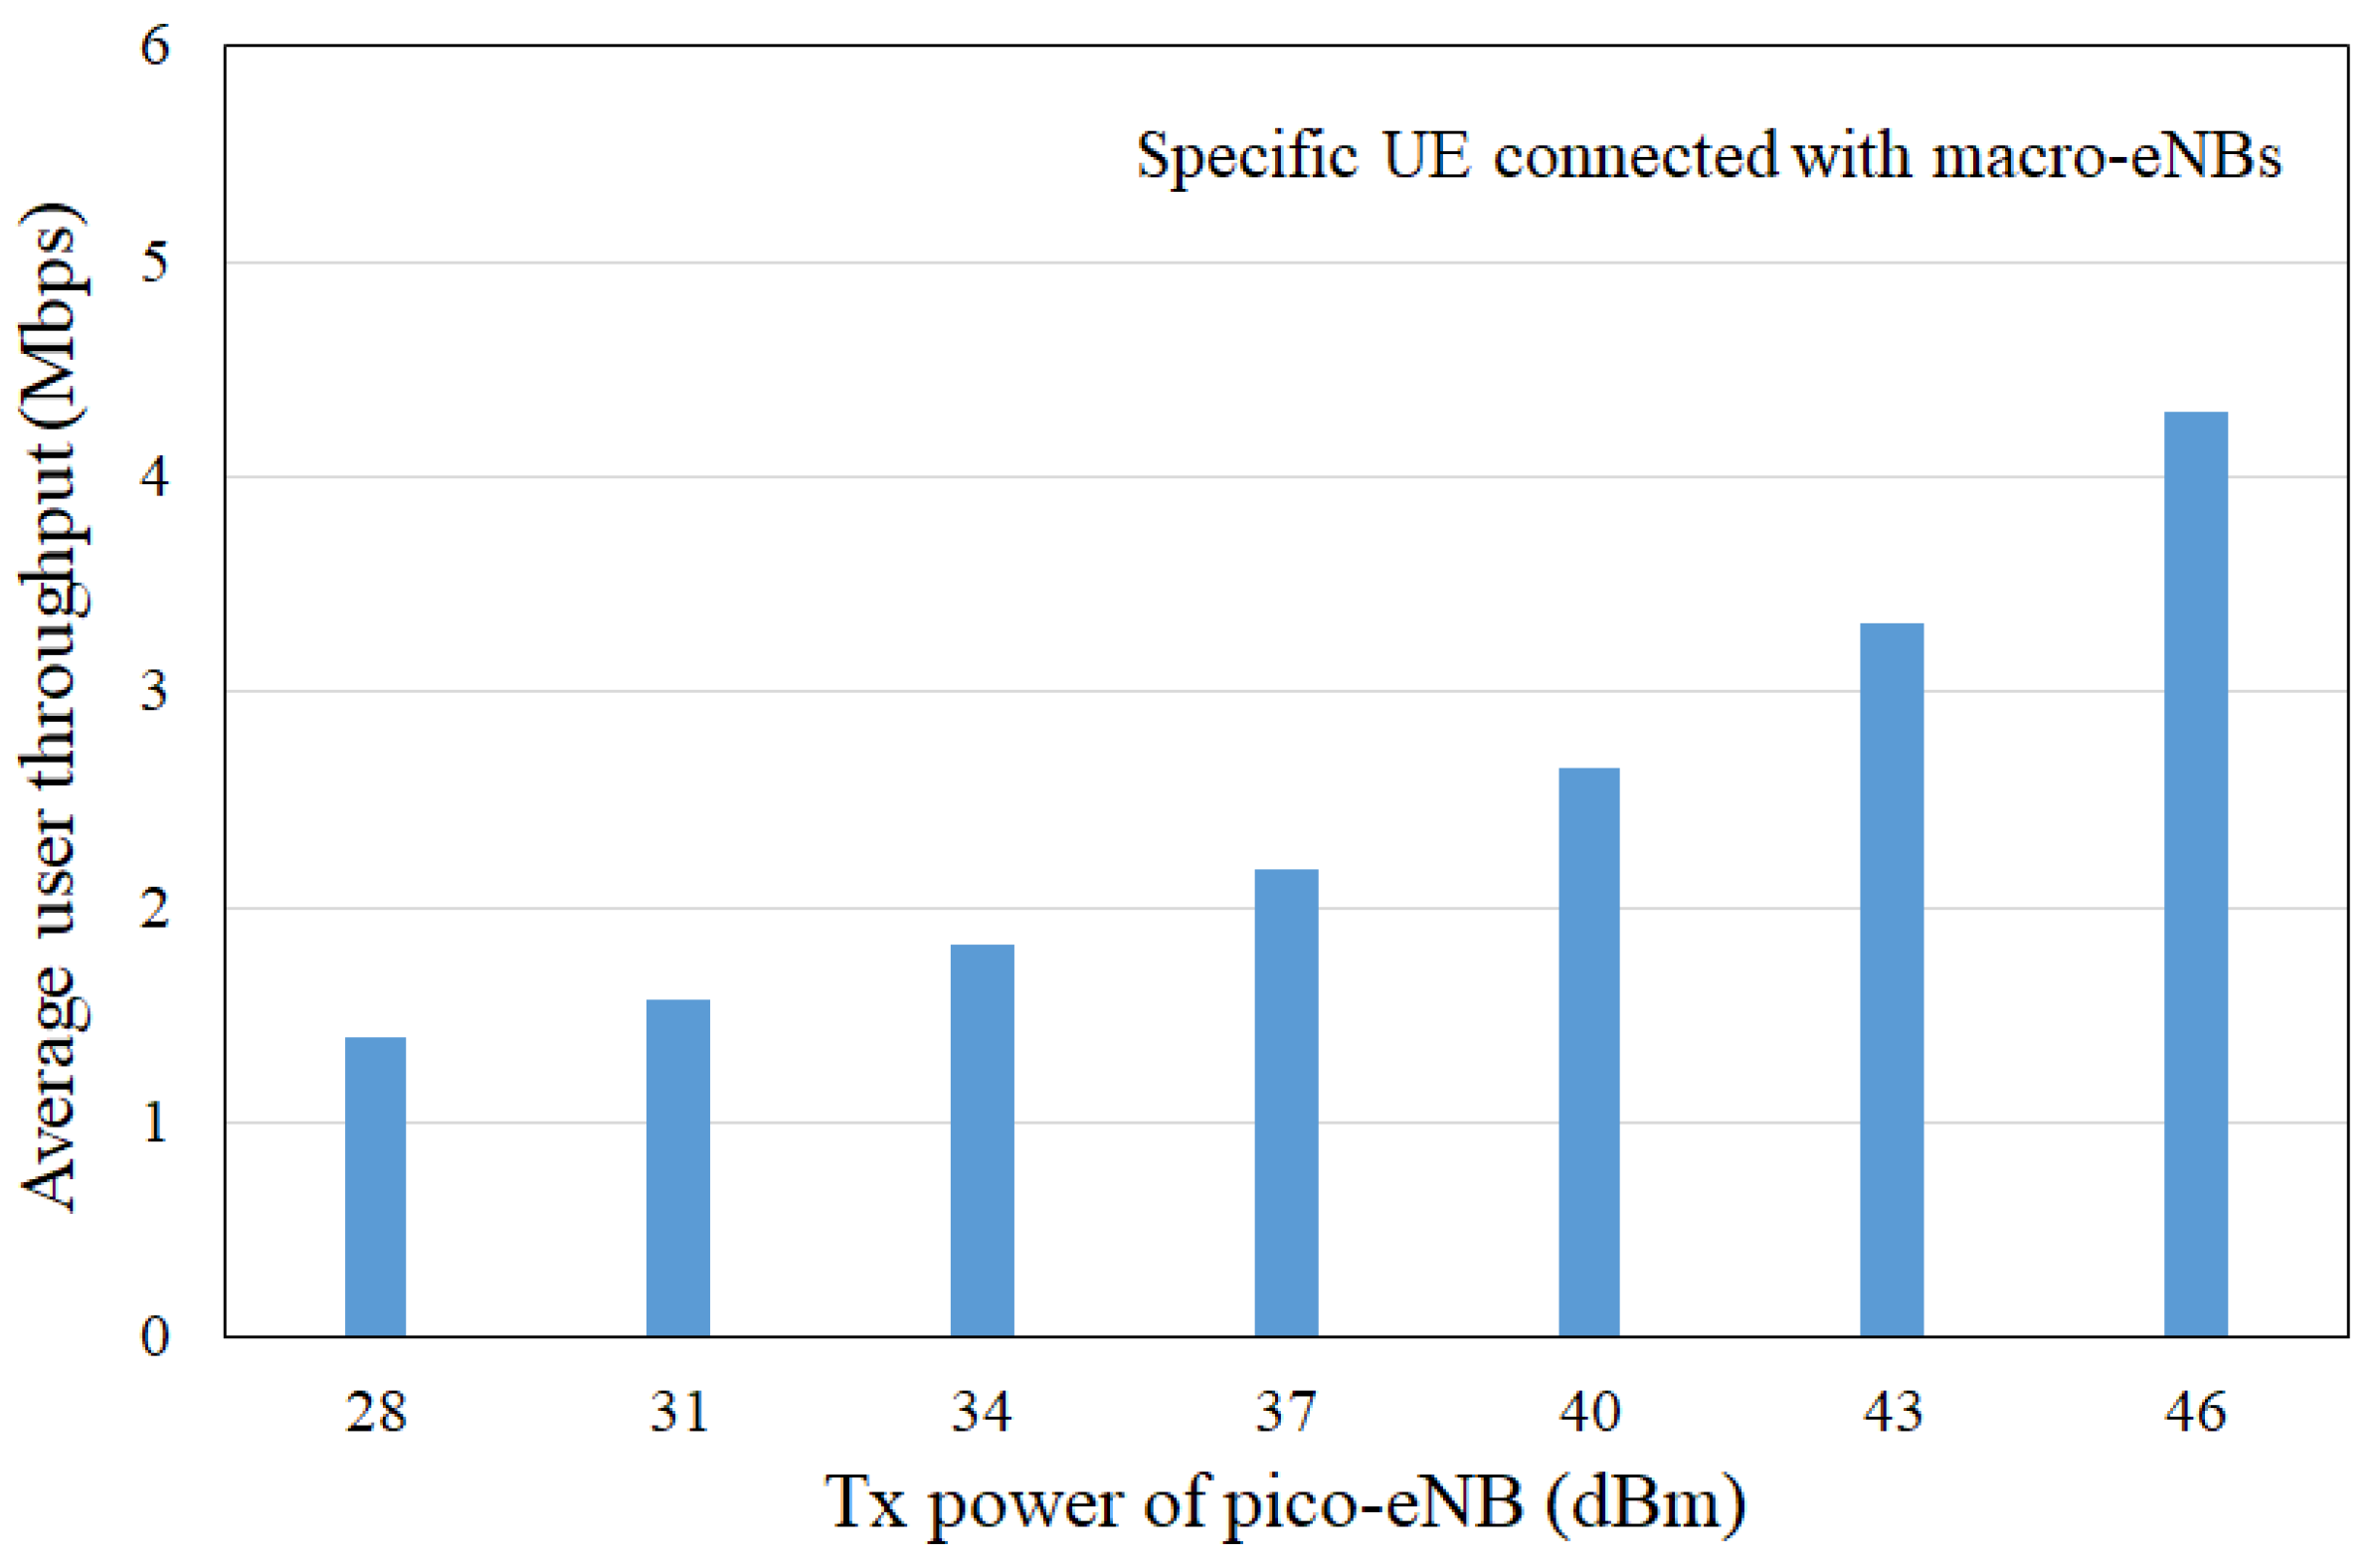
Figure 8 and Figure 9 analyze the average user throughput of all UE obtained in Figure 5. Figure 8 shows the average user throughput of a specific UE connected with pico-eNBs as a function of the pico-eNB Tx power. The average user throughput decreases as the pico-eNB Tx power increases because the number of UE connected with pico-eNBs increases. When the Tx power of pico-eNBs is 37 dBm, the average user throughput is approximately 120 Mbps. The throughput is so high because of the wide signal bandwidth. At the same time, the average user throughput of a specific UE connected with macro-eNBs is less than that of the specific UE connected with pico-NBs, as shown in Figure 9. For example, when the pico-eNB Tx power is 37 dBm, the average user throughput is approximately 2.2 Mbps.
4.2. Analysis of Use Rate of Modulation Methods
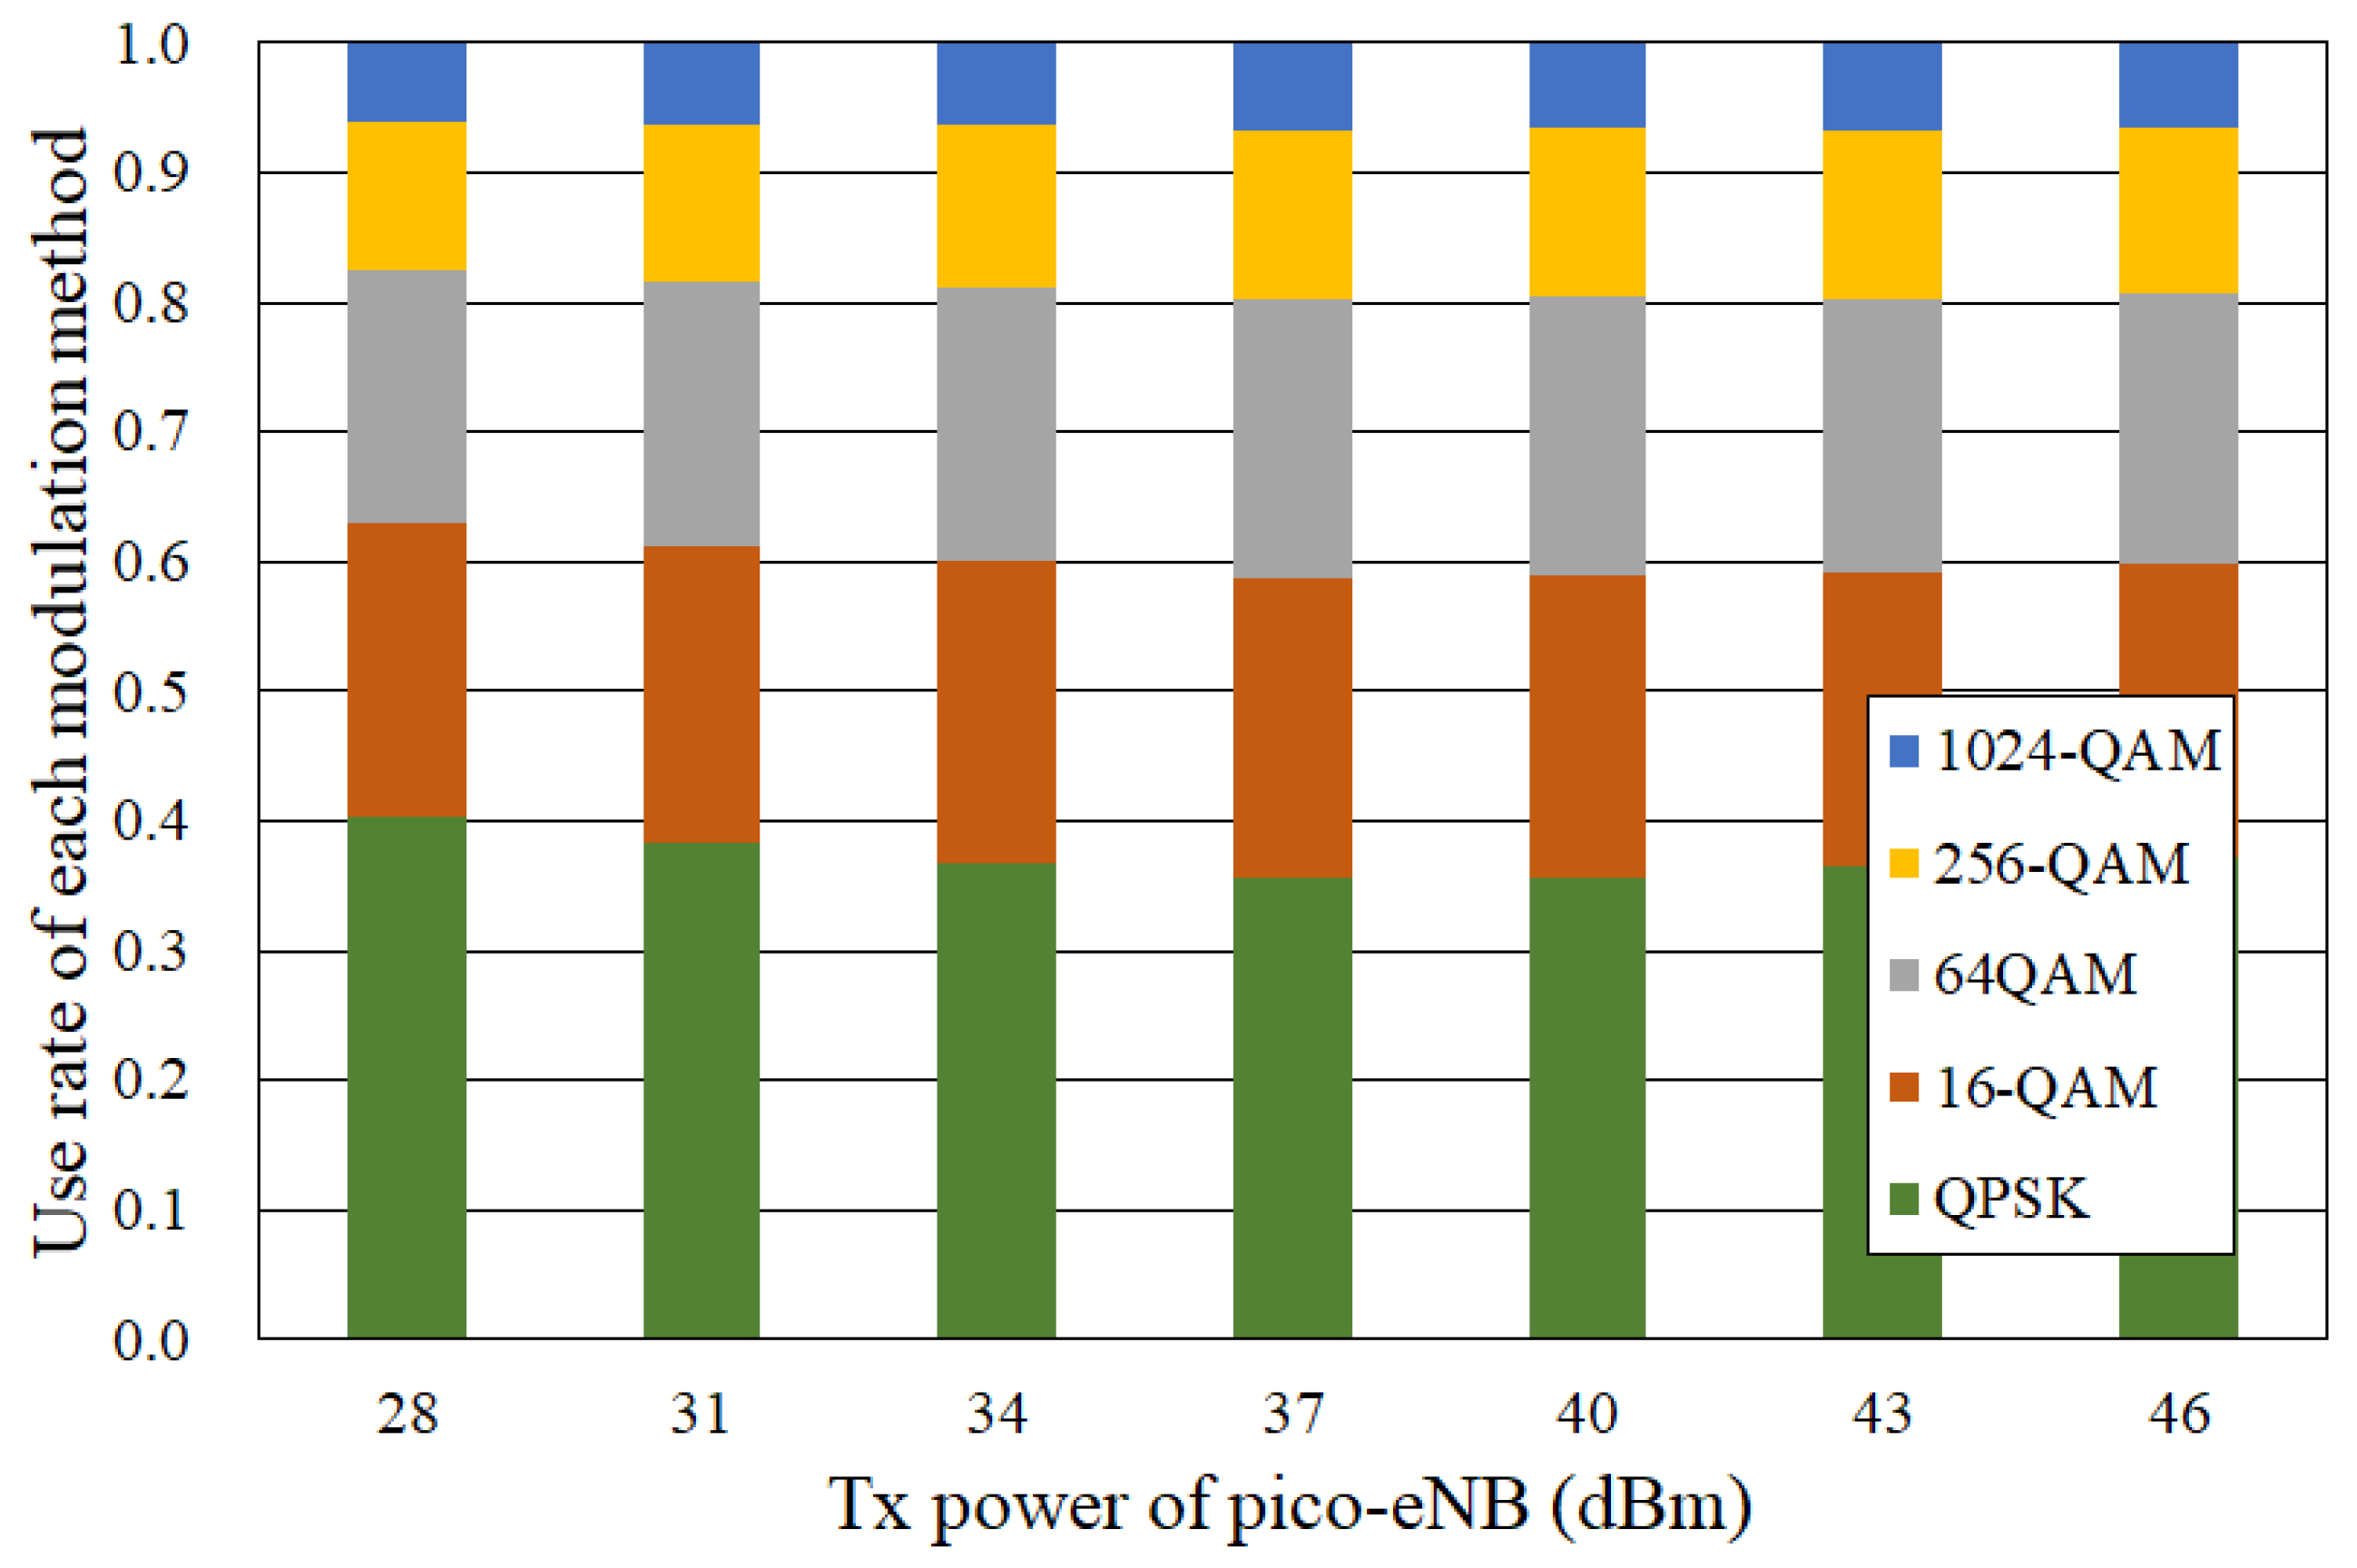
Figure 10 shows an analysis of the use rate of each modulation method used in the downlink MCS as a function of the pico-eNB Tx power. No significant changes occur for the pico-eNB Tx power. However, the use rate of QPSK reaches minimum for a pico-eNB Tx power of 37 dBm. This result can be obviously explained based on the results shown in Figure 6. When the pico-eNB Tx power is 37 dBm, the use rates of both the 256- and 1024-QAM are 21%, although the use rate of QPSK is almost 36%. When the pico-eNB Tx power is 28 dBm, the use rates of both the 256- and 1024-QAM are 18%, and the use rate of QPSK is almost 40%. Accordingly, a pico-eNB Tx power of 37 dBm was able to improve the use rates of higher modulation methods compared with those at powers of 28 and 46 dBm.
5. Effects of CRE
5.1. CRE in HetNet
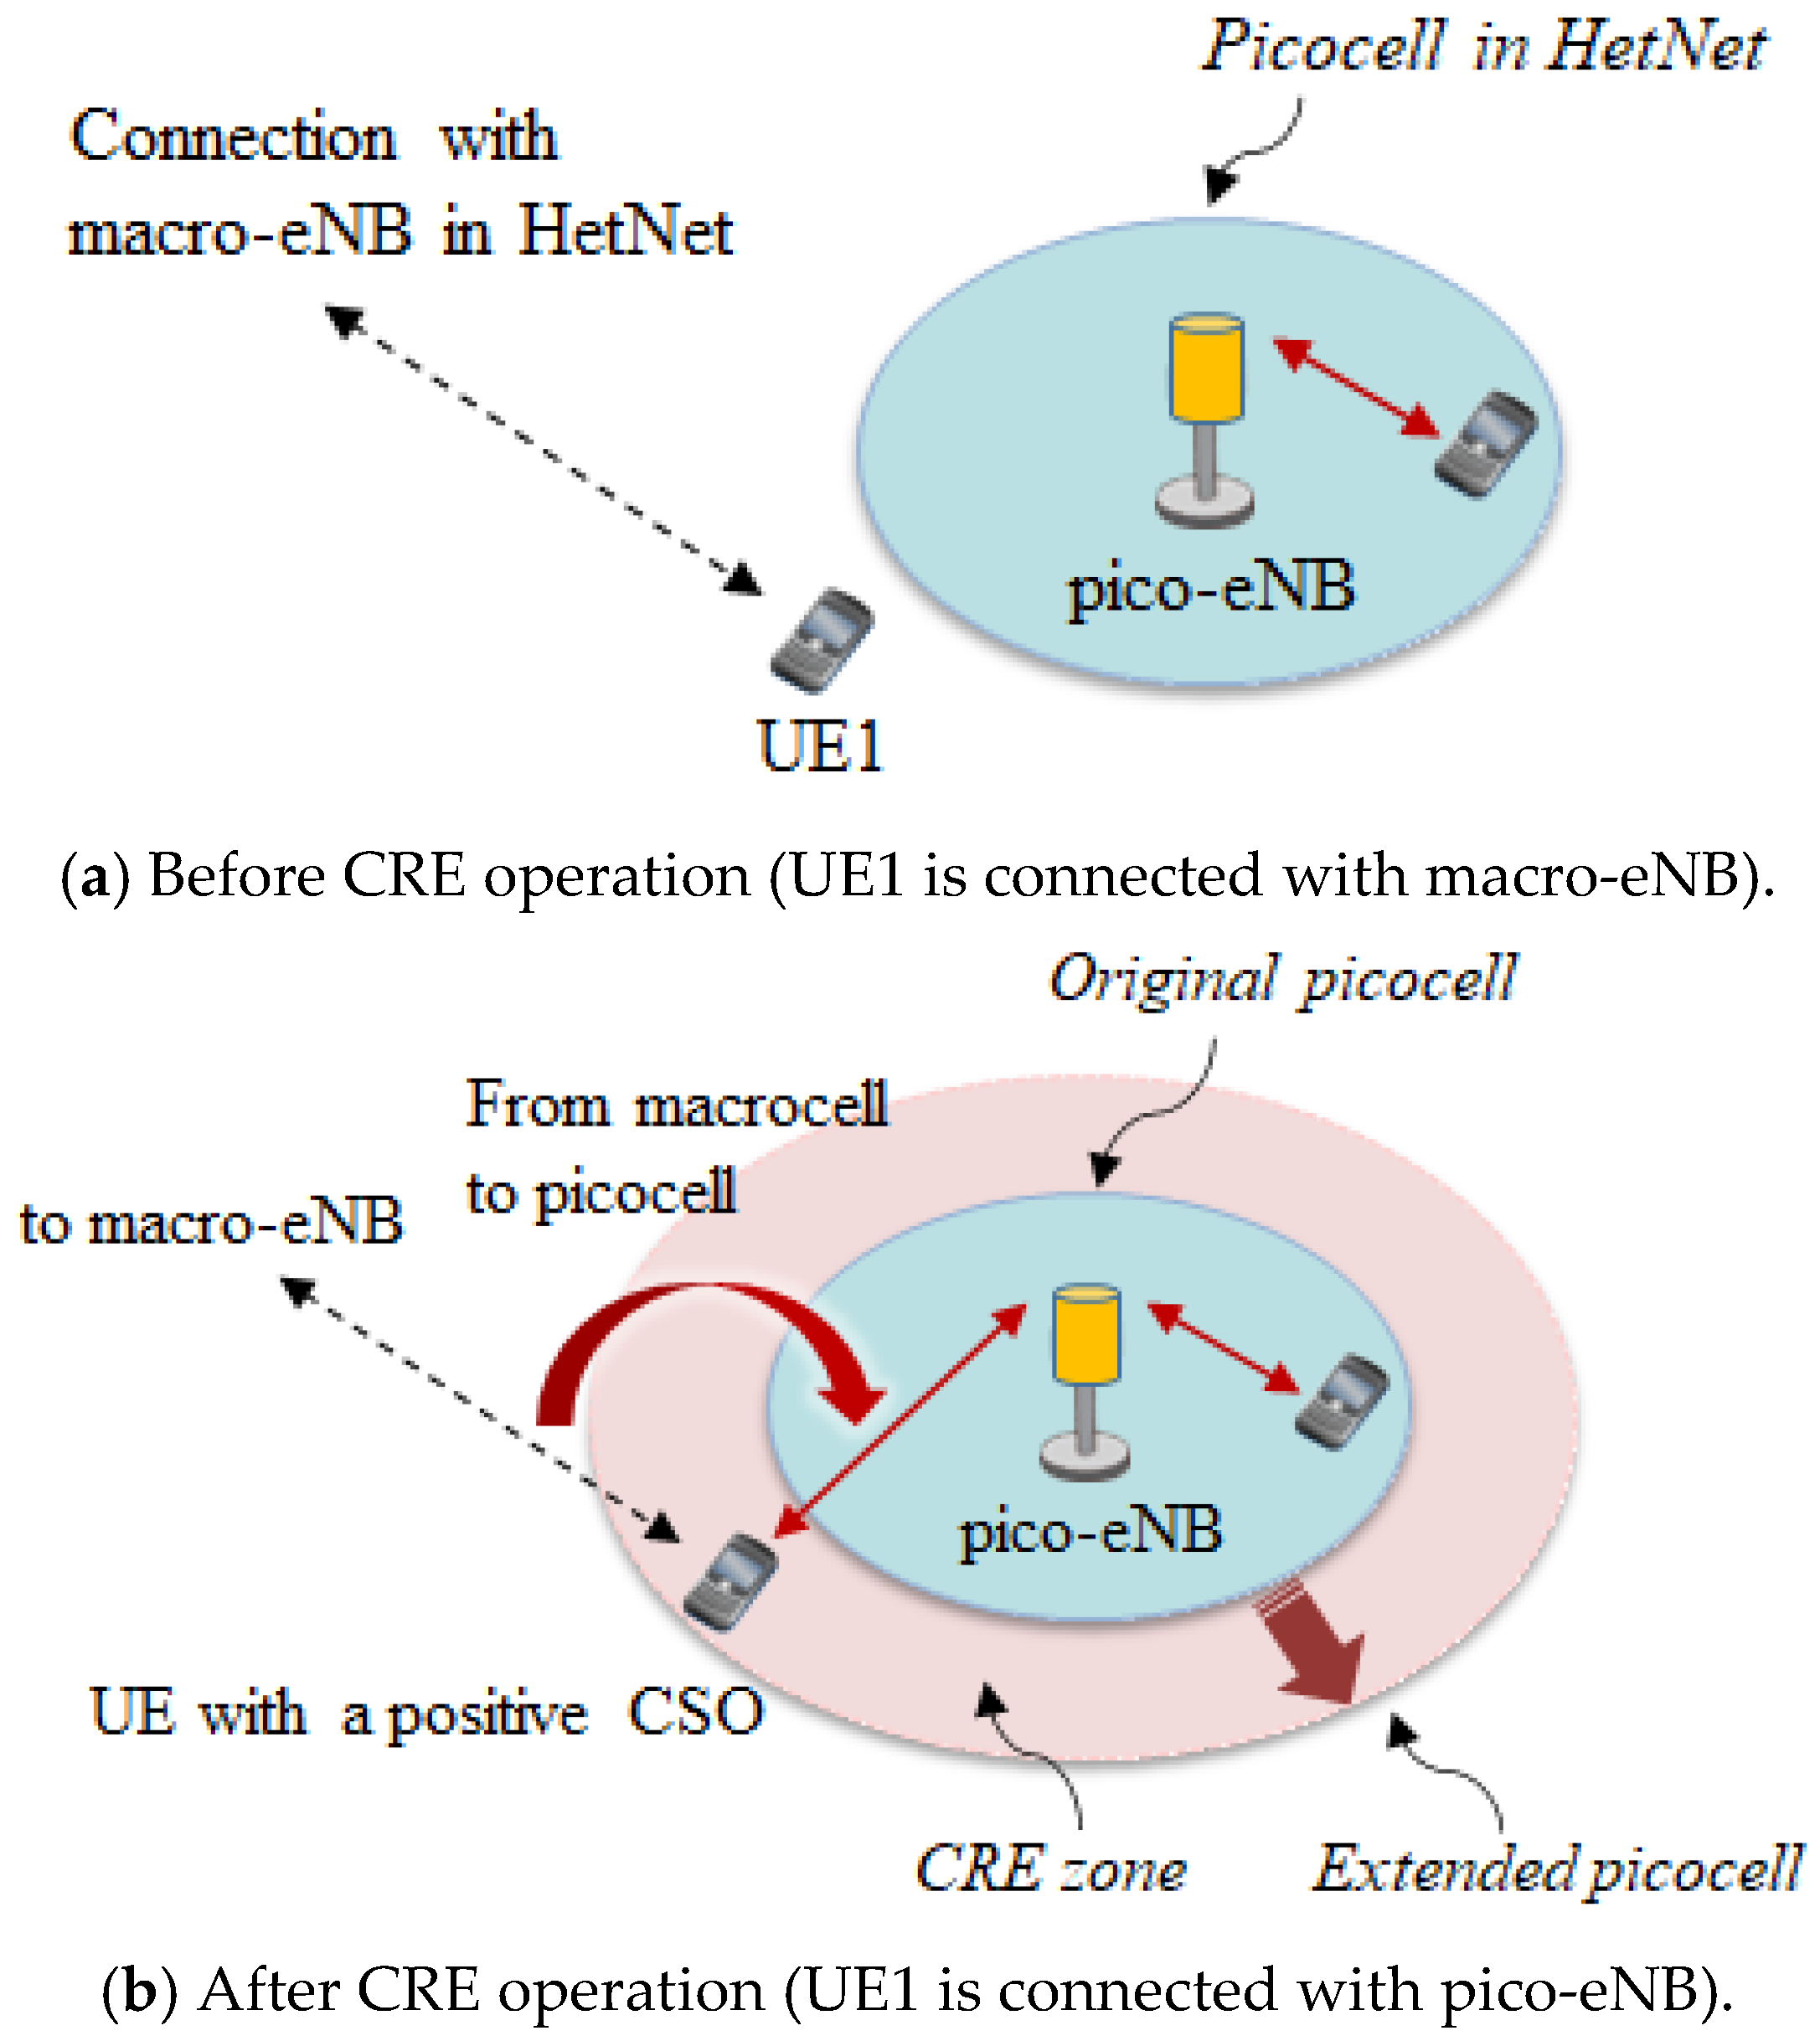
In this section, we investigate the effect of CRE technique using a positive CSO under conditions including pico-eNB Tx powers close to the optimal value. Figure 11 shows the CRE using a positive CSO in a HetNet.
In a normal case without CRE, UE1 outside the picocell is connected with a macrocell, as shown in Figure 11a. With CRE, UE1 with a positive CSO is connected from the macrocell to the extended picocell, as shown in Figure 11b. In this case, the original picocell range appears to be wider, representing an “extended picocell”, for the UE with a positive CSO in the CRE zone. Consequently, the connection point of the UE in the CRE zone should be changed from macro- to pico-eNBs when CRE is activated.
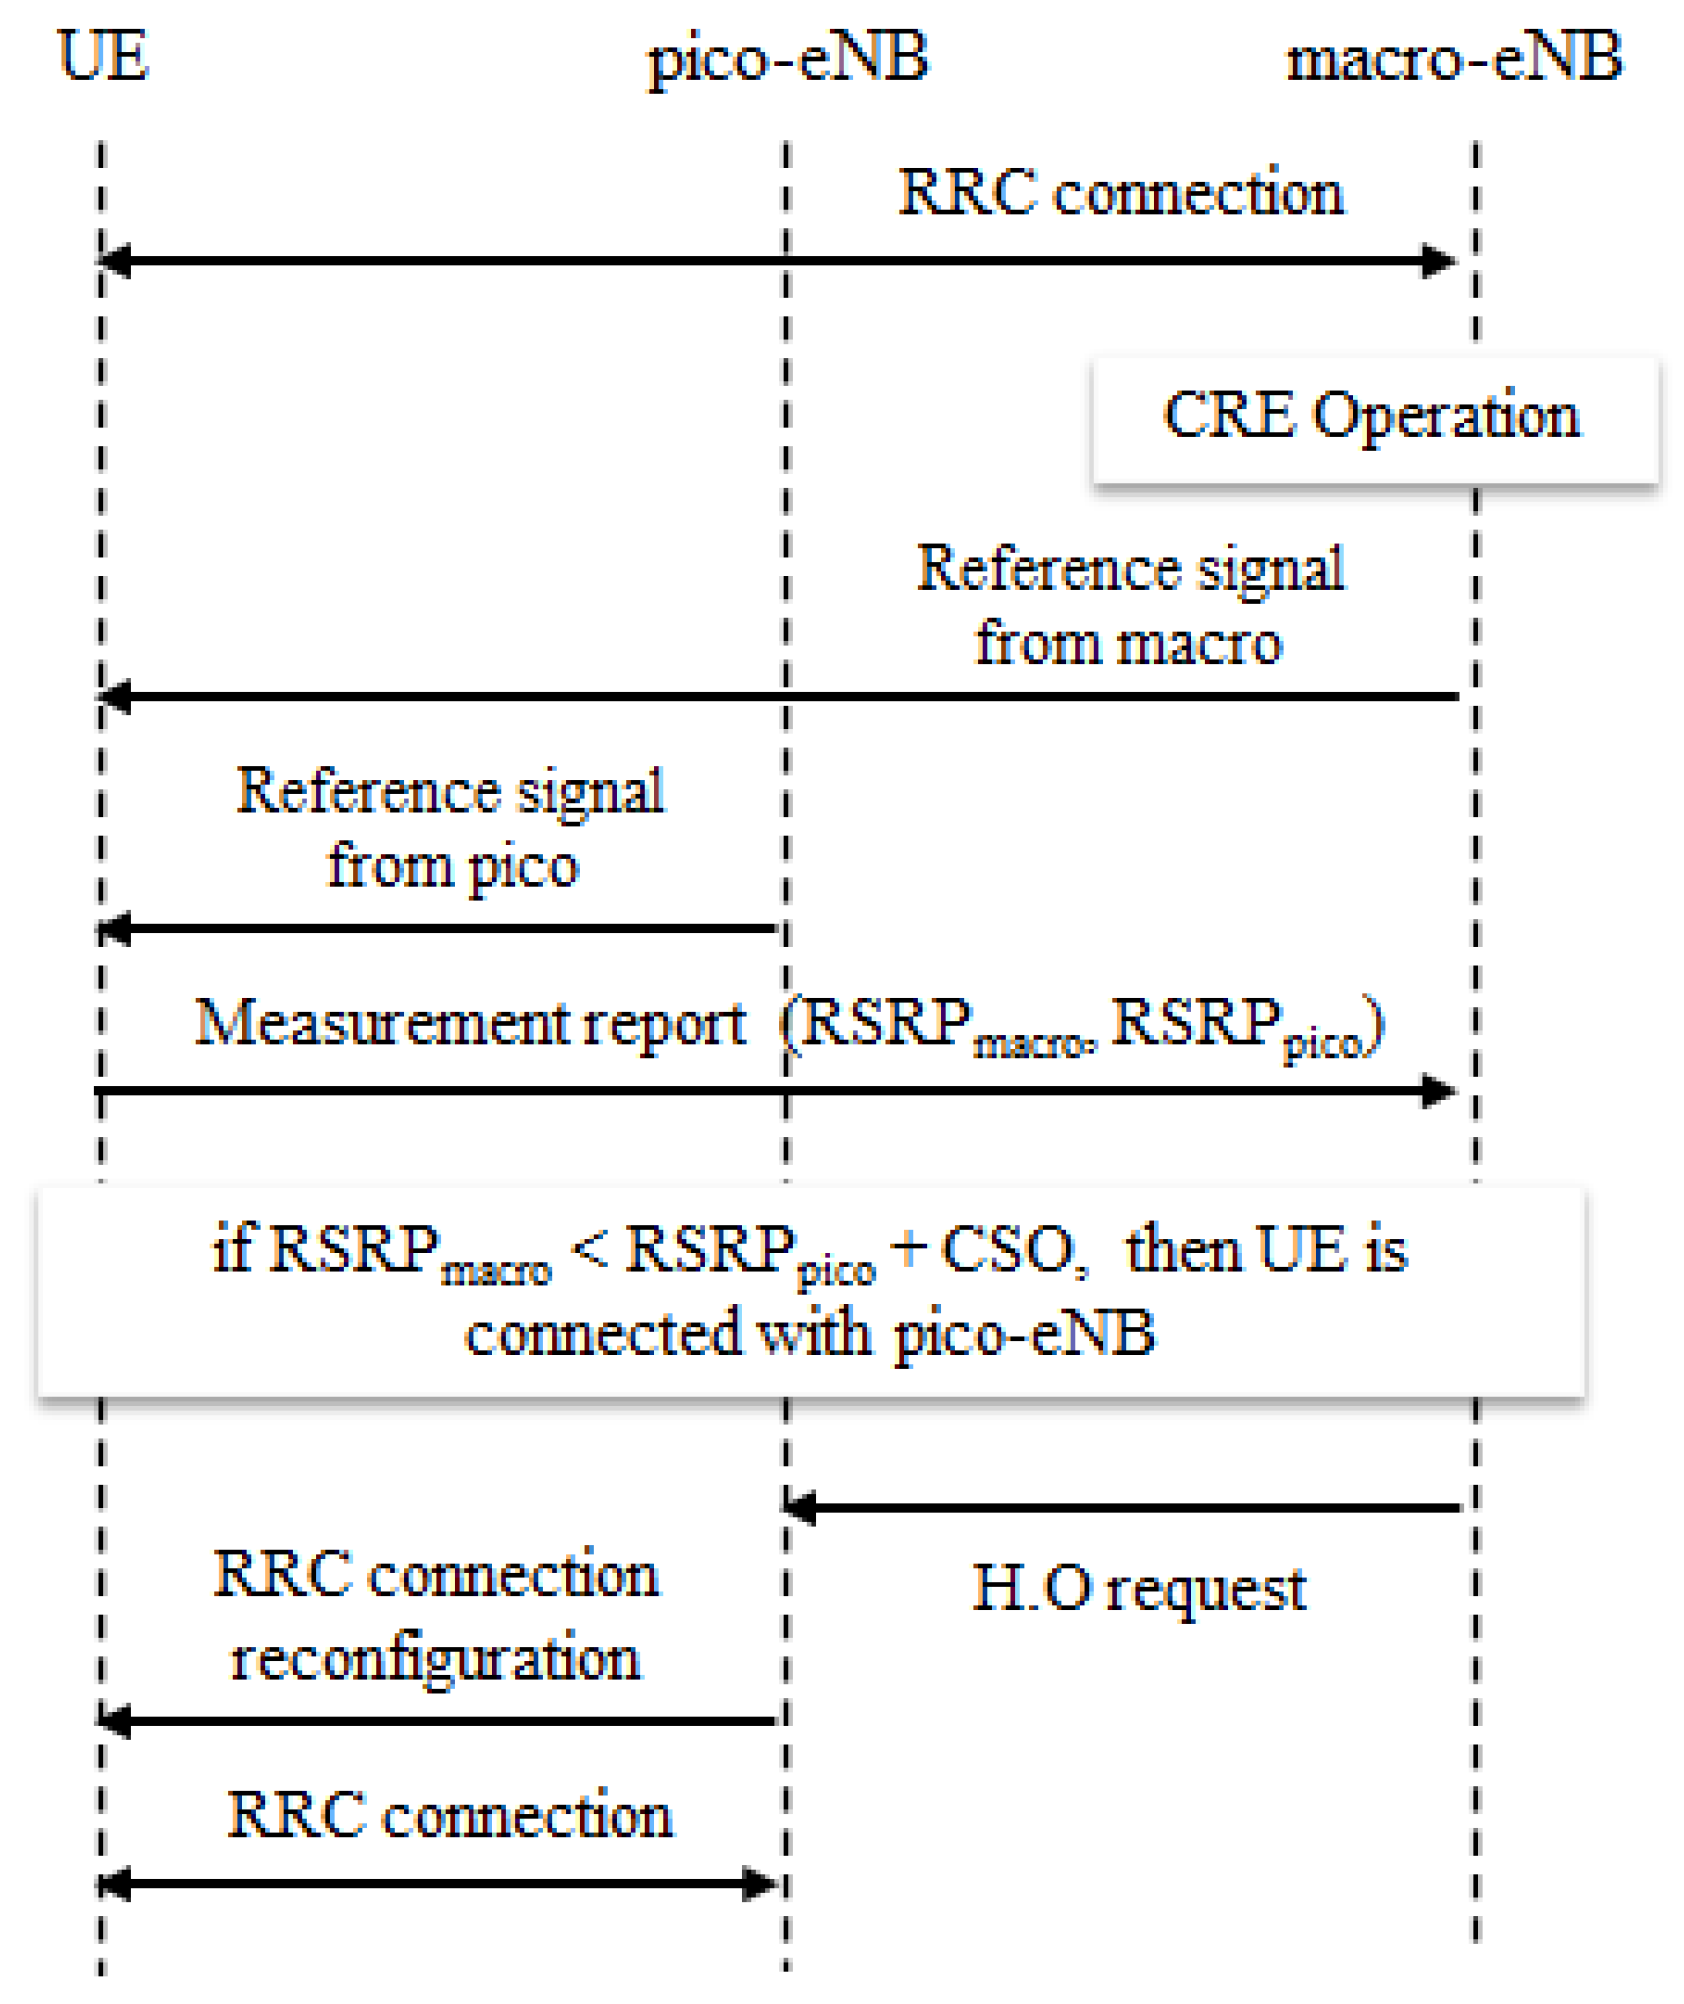
Figure 12 shows the cell selection procedure when CRE is activated in the HetNet. The RRC connection is assumed to be first established between the UE and macro-eNB. Then, according to CRE, the UE creates a positive CSO to the RSRPpico obtained from the RSRP of the picocell. If the combination of the RSRPpico plus the CSO is larger than the RSRPmacro, the connection of the UE is changed to the pico-eNB through a handover procedure and an RRC connection is established between the UE and pico-eNB. In this way, the CRE increases the probability of the UE connecting with pico-eNBs. If CRE does not work, i.e., CSO = 0 dB, the picocell range remains unchanged.
5.2. User Throughput versus CSO
Here, we investigate the effects of CRE under the condition of a pico-eNB Tx power close to the optimal value, according to the results obtained in Figure 5. The parameters used for system-level computer simulations are the same as those listed in Table 1. Figure 13 and Figure 14 show the average and 5-percentile user throughput as a function of CSO for two types of pico-eNB Tx power.
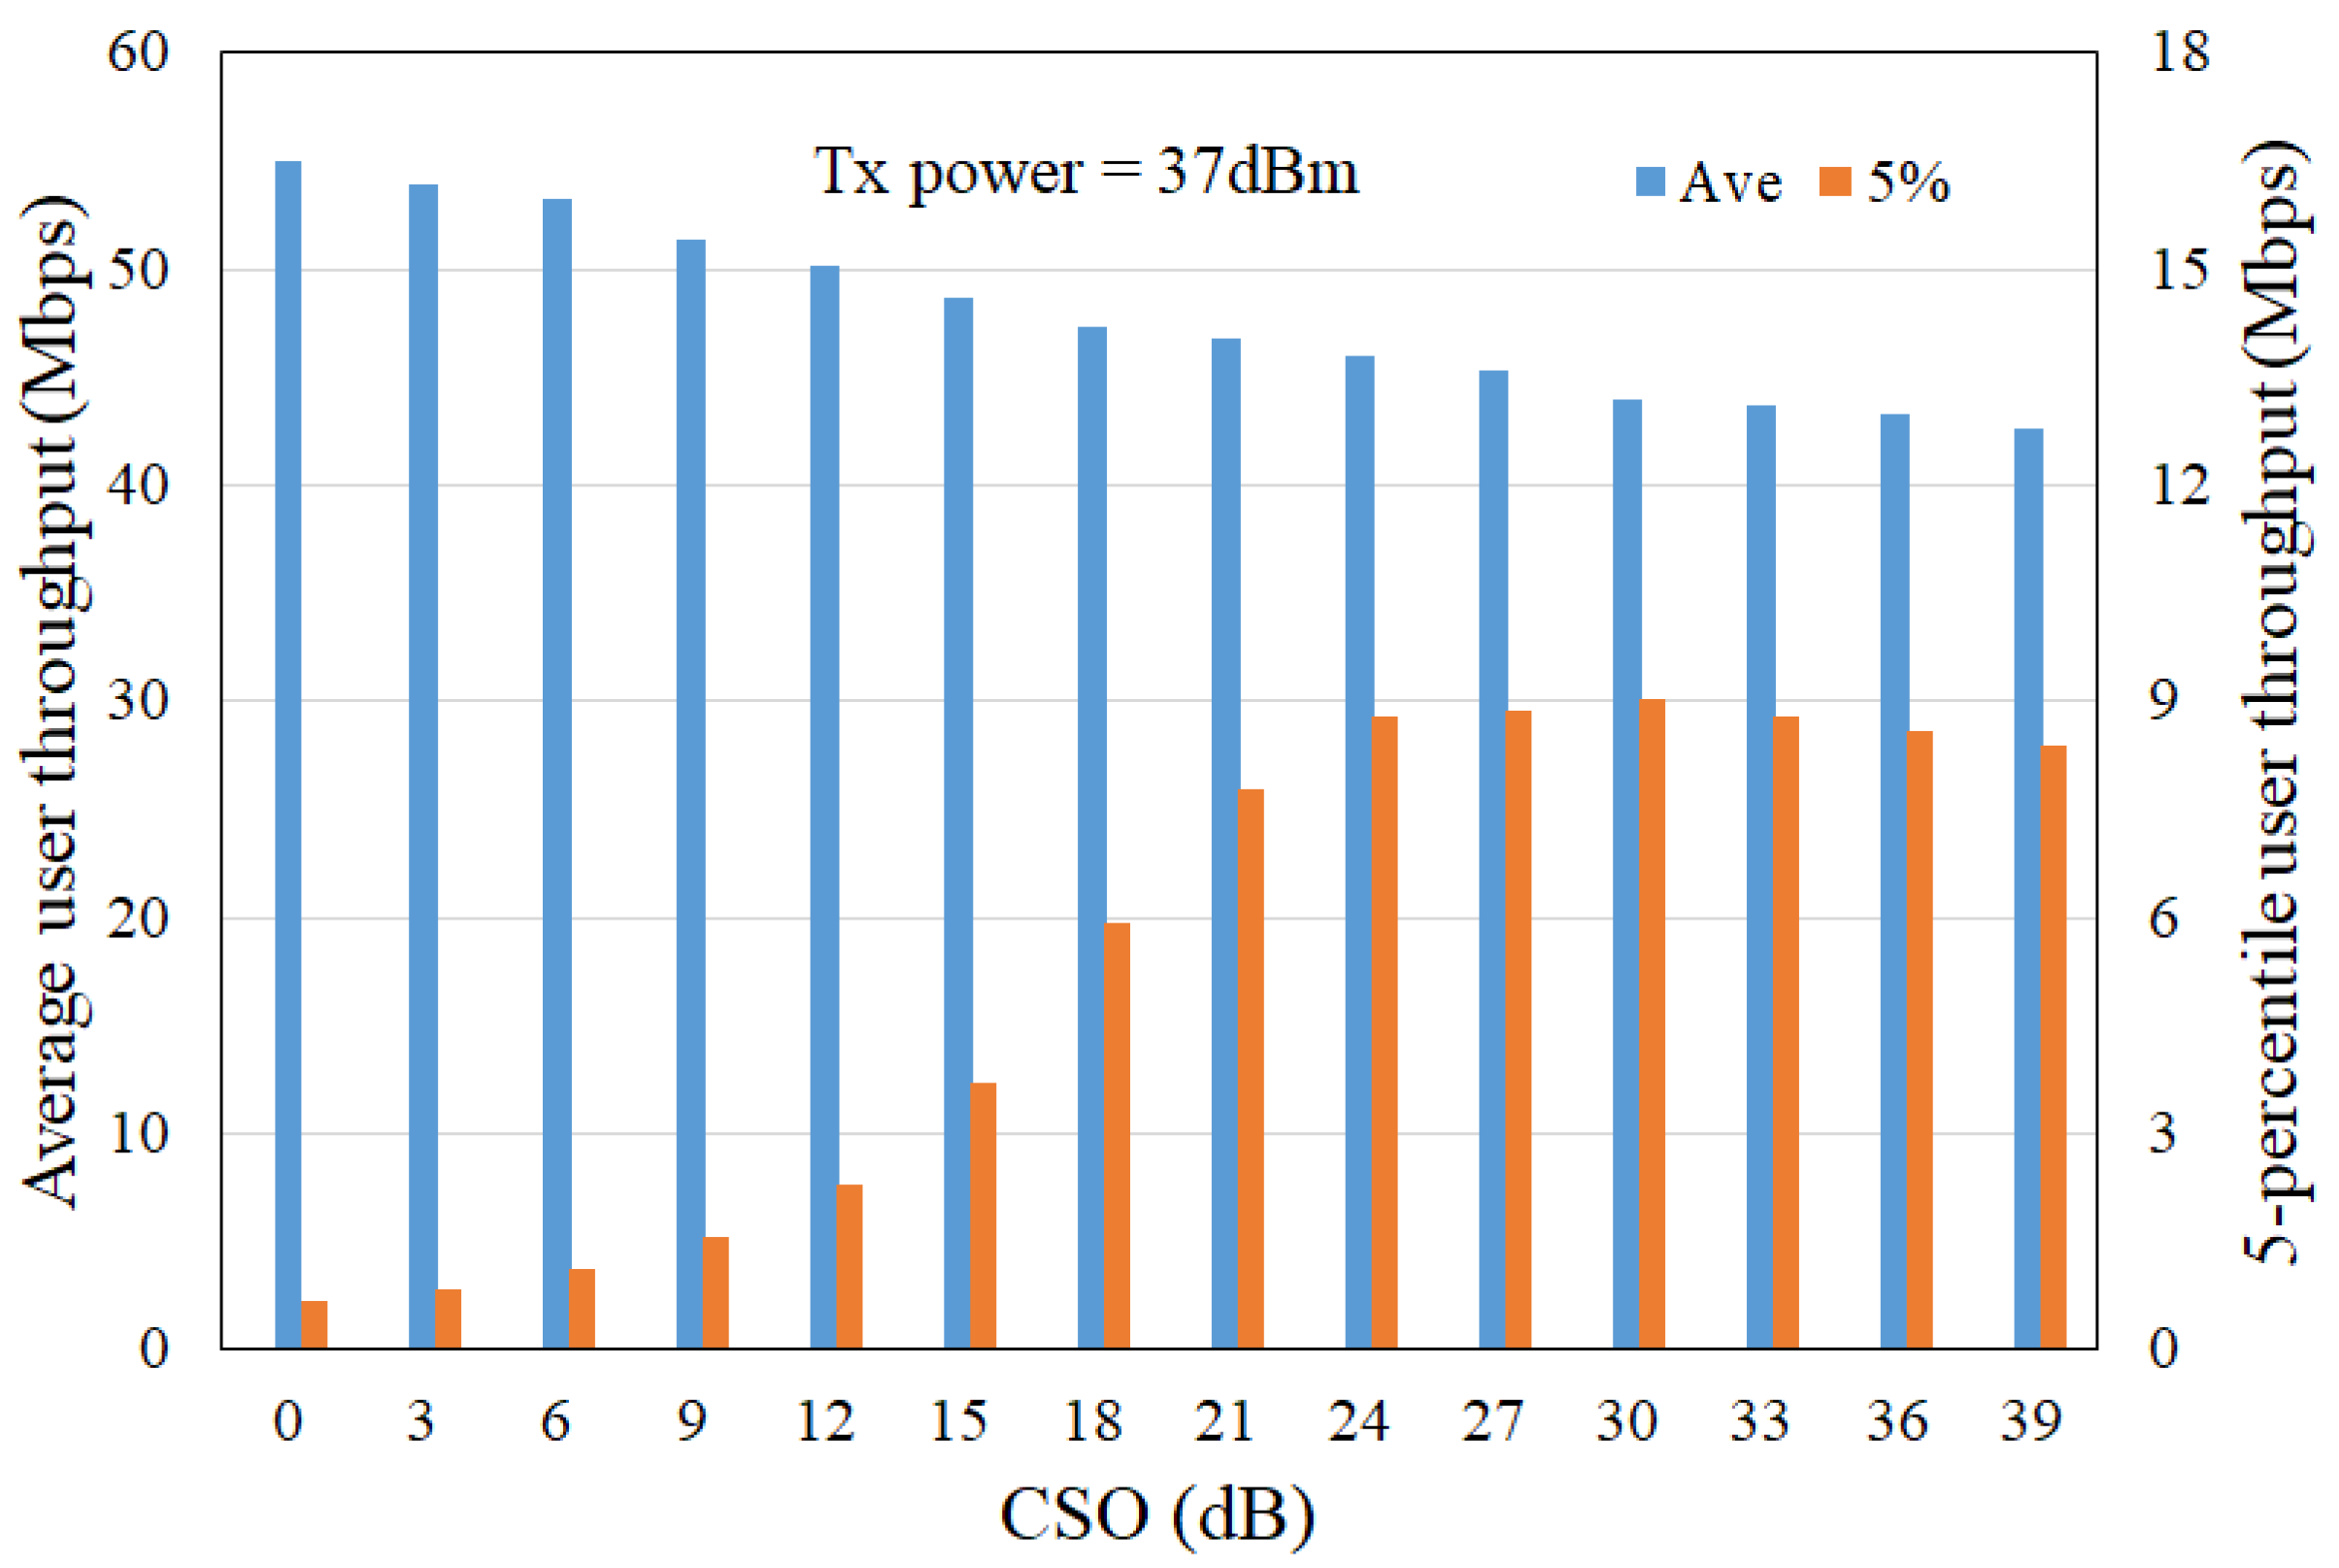
Figure 13 shows the average and 5-percentile user throughput as a function of CSO when the pico-eNB Tx power is 37 dBm. The average user throughput gradually decreases as the CSO increases, whereas the 5-percentile user throughput increases up to a CSO of approximately 30 dB. The reason for the decrease in average user throughput is that the increased UE connected with pico-eNBs by the CRE share the radio resources of pico-eNBs. At the same time, the reason for the increase in 5-percentile user throughput is that the 5-percentile UE is changed from the UE connected with macro-eNBs to the UE connected with pico-eNBs.
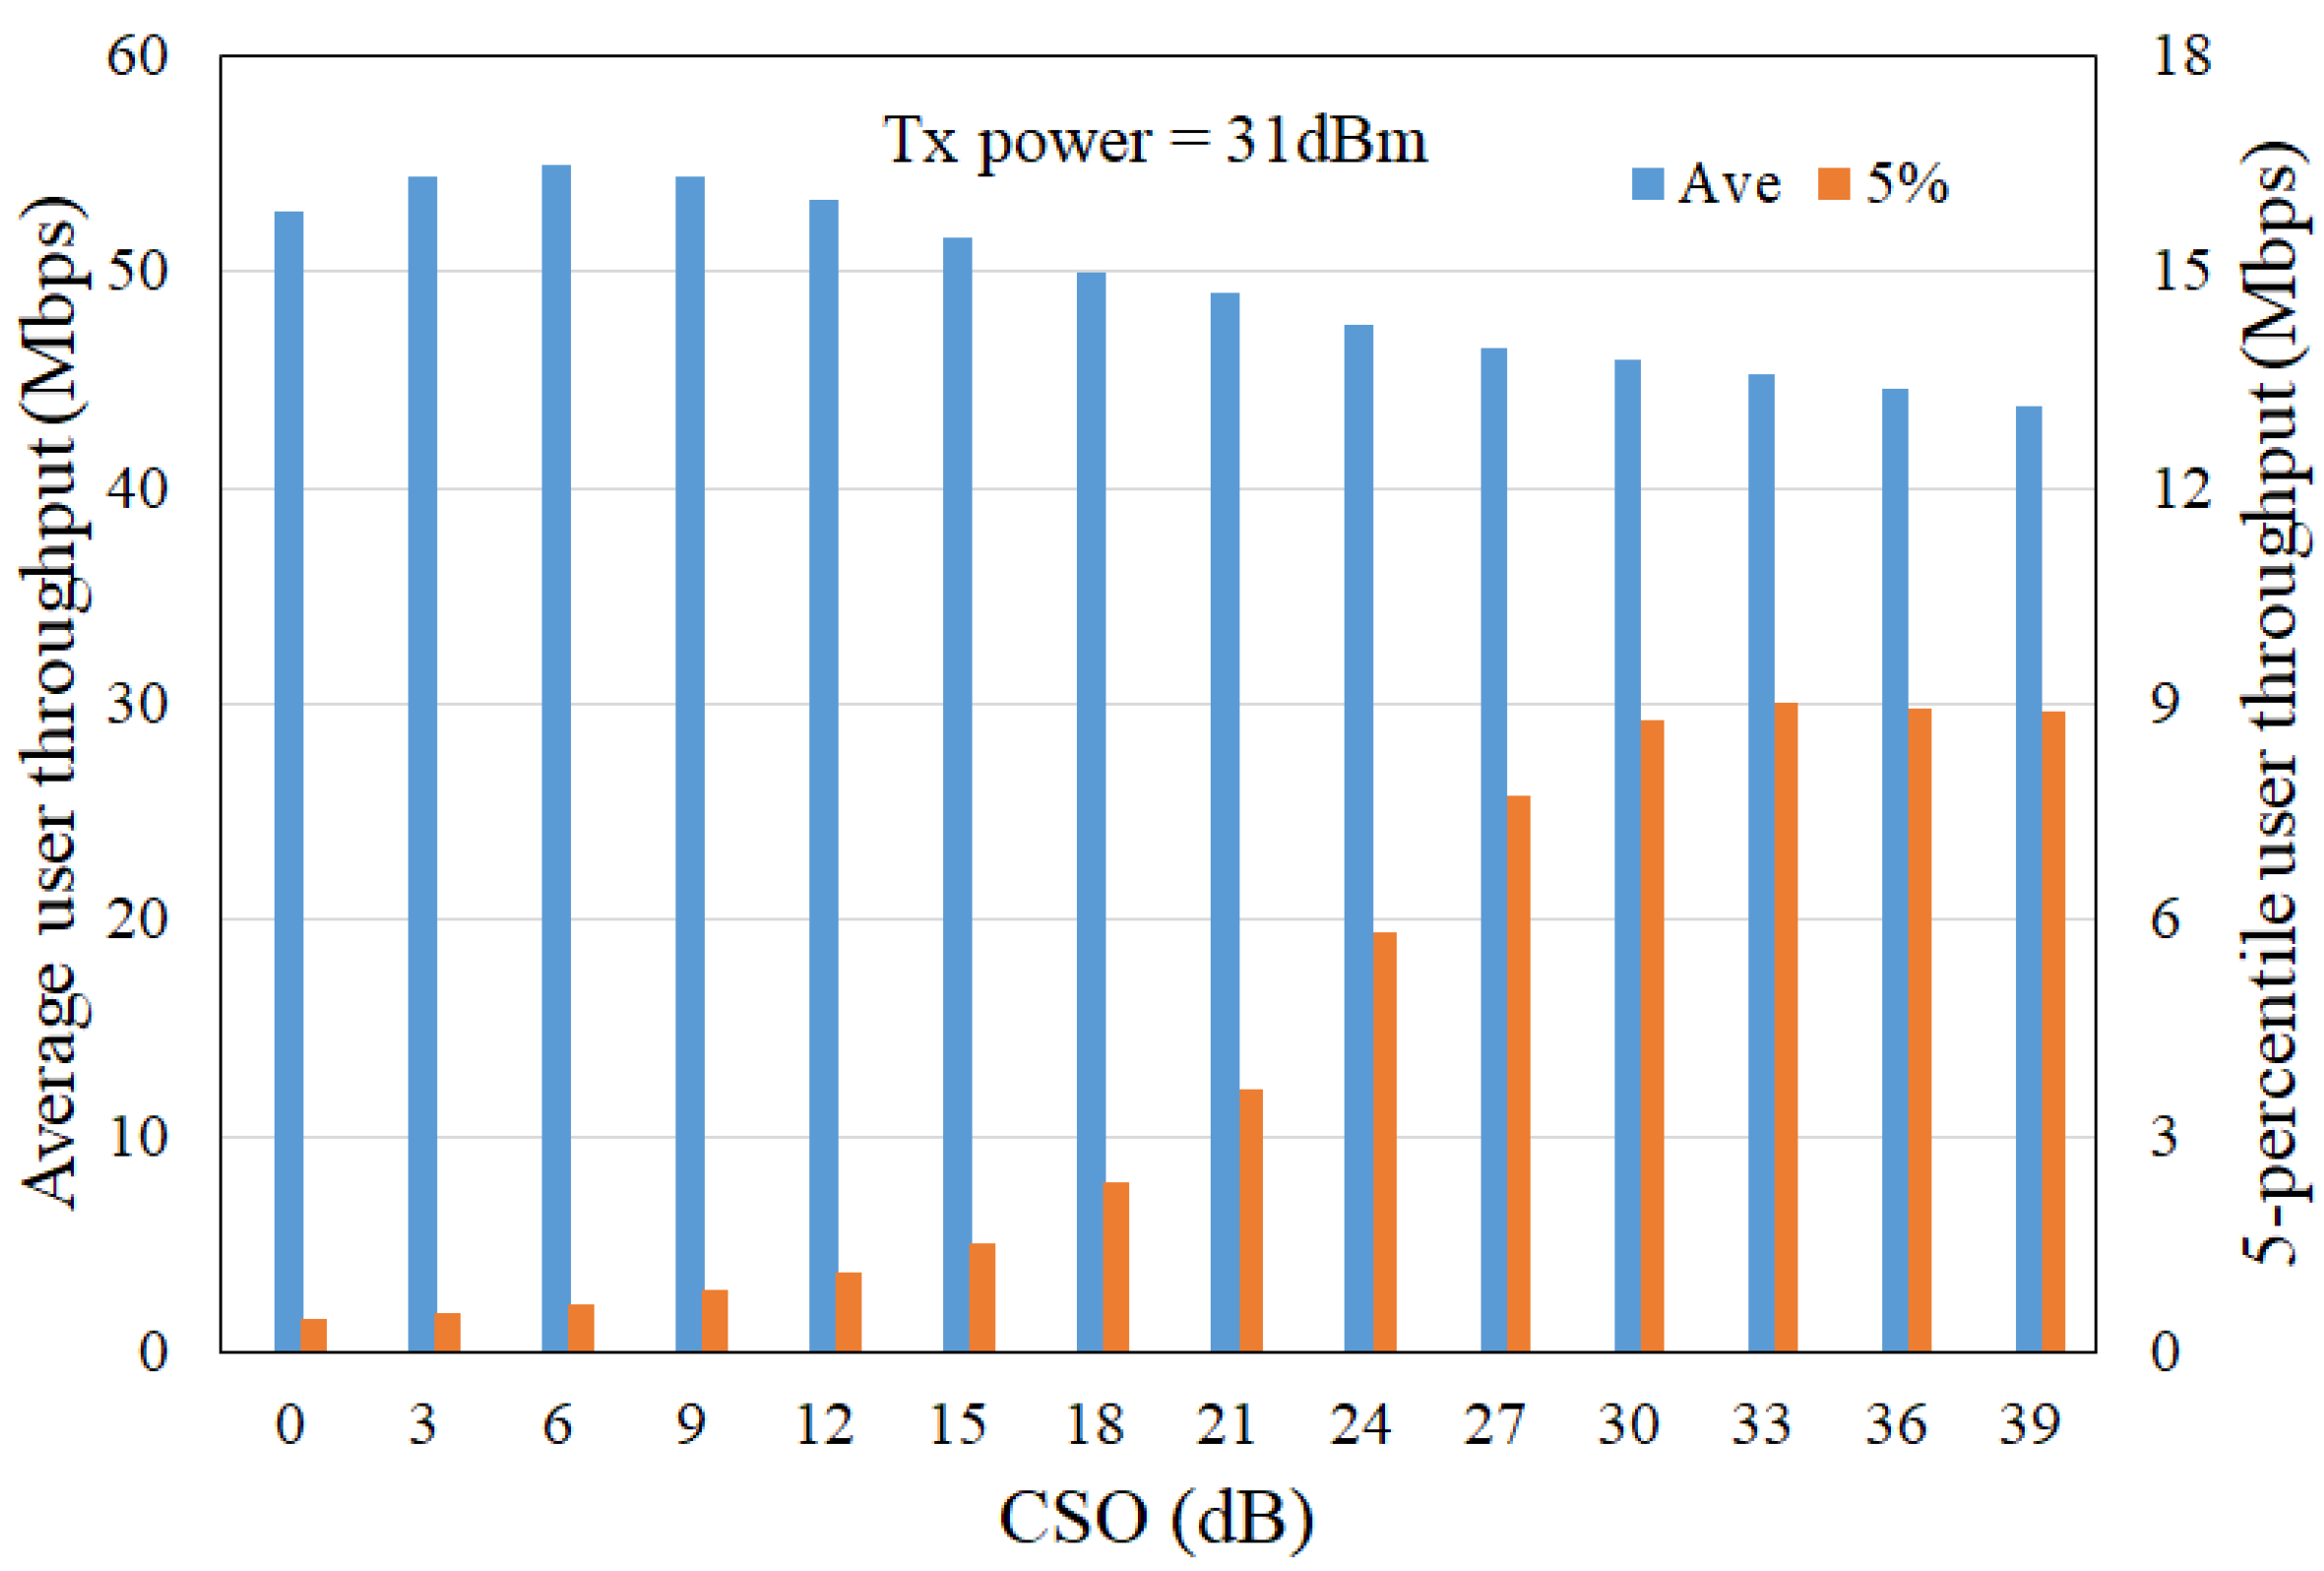
Figure 14 shows the average and 5-percentile user throughput as a function of CSO when the pico-eNB Tx power is 31 dBm. The average user throughput here increases as the CSO increases up to 6 dB, and then decreases as the CSO passes 9 dB. The average user throughput for a pico-eNB Tx power of 31 dBm and CSO of 6 dB is almost the same as that obtained with a pico-eNB Tx power of 37 dBm and a CSO of 0 dB. The performance behavior of 5-percentile user throughput is similar to the result obtained in Figure 13. From an average user throughput perspective, the CSO of 6 dB can provide the best performance when the pico-eNB Tx power is 31 dBm. On the basis of these results, it was determined that CRE did not work when the pico-eNB Tx power was 37 dBm, and a CSO of 6 dB in the CRE could improve the average user throughput when the pico-eNB Tx power was 31 dBm. Therefore, for the operational procedure of HetNet, the pico-eNB Tx power, which is typically fixed to 37 dBm, should be reduced to 31 dBm for CRE activation. This will lead to savings in power consumption while maintaining the average user throughput.
6. Conclusions
In this paper, we first investigated the optimal Tx power for pico-eNBs in a multiband HetNet combining macrocells operating at a 2 GHz band and picocells with a 10 times wider signal bandwidth operating at a 4.5 GHz band. Specifically, we presented the average and 5-percentile user throughput as a function of the pico-eNB Tx power using system-level computer simulations. It was observed that the average user throughput increased as the Tx power increased up to approximately 37 dBm. However, Tx powers greater than 37 dBm slightly degraded the average user throughput. Consequently, it was concluded that a pico-eNB Tx power of 37 dBm was able to provide the best performance from the average user throughput perspective, under the HetNet model as shown in Table 1. Furthermore, we analyzed the use rate of each modulation method used in the downlink MCS incorporating 1024-QAM as a function of pico-eNB Tx power. The use rates of both 256- and 1024-QAM were at a maximum when the pico-eNB Tx power was 37 dBm, although the use rate difference for the pico-eNB Tx power was very small. Then, we described the effects of picocell range expansion (CRE) technique using a positive CSO for two pico-eNB Tx powers close to the optimal value. We demonstrated the average and 5-percentile user throughput as a function of CSO for two pico-eNB Tx powers close to the optimal Tx power (i.e., 31 and 37 dBm). When the CRE was activated, it was shown that a CSO of 6 dB was able to provide the best performance when the pico-eNB Tx power was 31 dBm. When the pico-eNB Tx power was 37 dBm, the CRE did not work and that it had no effect on improving the average user throughput. In other words, the average user throughput for a pico-eNB Tx power of 31 dBm and CSO of 6 dB was almost the same as that obtained with a pico-eNB Tx power of 37 dBm and a CSO of 0 dB. Consequently, it was clarified that the CRE technique could reduce the pico-eNB Tx power in multiband HetNet. This will lead to saving the power consumption of pico-eNBs while maintaining the average user throughput.
Author Contributions
Conceptualization, H.O. and T.Y.; Investigation, T.Y. and H.O.; Data curation, T.Y. and K.Y.; Writing—original draft preparation, H.O.; Writing—review and editing, H.O. and T.Y.; Visualization, T.Y. and K.Y.; Supervision, H.O.; Project administration, H.O.; Funding acquisition, H.O. All authors have read and agreed to the published version of the manuscript.
Funding
This research was funded by JSPS KAKENHI Grant Number JP21K11874, Grant-in-Aid for Scientific Research (C).
Institutional Review Board Statement
Not applicable.
Informed Consent Statement
Not applicable.
Data Availability Statement
Not applicable.
Acknowledgments
The authors would like to thank A. Yoneyama who is a graduate of Kogakuin University for her contributions to construct system-level computer simulations.
Conflicts of Interest
The authors declare no conflict of interest.
References
- 3GPP TR 38.801; Radio access architecture and /. ETSI: Sophia Antipolis, France, March 2016; Release 14.
- 3GPP TS 23.501; System architecture for the 5G system. ETSI: Sophia Antipolis, France, June 2018; Release 15.
- Soldani, D.; Manzalini, A. Horizon 2020 and beyond: On the 5G operating system for a truly digital society. IEEE Veh. Technol.Mag. 2015, 10, 32–42. [Google Scholar] [CrossRef]
- Nakamura, T.; Benjebbour, A.; Kishiyama, Y.; Suyama, S.; Imai, T. 5G radio access: Requirements, concept and experimental trials. IEICE Trans. Commun. 2015, 98, 1397–1406. [Google Scholar] [CrossRef] [Green Version]
- Shafi, M.; Molish, A.F.; Smith, P.J.; Haustein, T.; Zhu, P.; De Silva, P.; Tufvesson, F.; Benjebbour, A.; Wunder, G. 5G: A tutorial overview of standards, trials, challenges, deployment, and practice. IEEE J. Sel. Areas Commun. 2017, 35, 1201–1221. [Google Scholar] [CrossRef]
- Okumura, Y.; Suyama, S.; Mashino, J.; Muraoka, K. Recent activities of 5G experimental trials on massive MIMO technologies and 5G system trials toward new service creation. IEICE Trans. Commun. 2019, 102, 1352–1362. [Google Scholar] [CrossRef] [Green Version]
- 3GPP TS 38.101-4; 5G NR User equipment radio transmission and reception; Performance requirements. iTeh, Inc.: San Francisco, CA, USA, September 2019; Release 15.
- Ghosh, A.; Ratasuk, R.; Mondai, B.; Mangalvedhe, N.; Thomas, T. LTE-advanced: Next-generation wireless broadband technology. IEEE Wirel. Commun. 2010, 17, 10–22. [Google Scholar] [CrossRef]
- Ishii, H.; Kishiyama, Y.; Takahashi, H. A novel architecture for LTE-B: C-plane/U-plane split and phantom cell concept. In Proceedings of the 2012 IEEE Globecom Workshops, Anaheim, CA, USA, 3–7 December 2012; pp. 624–630. [Google Scholar] [CrossRef]
- Kikuchi, K.; Otsuka, H. Proposal of adaptive control CRE in heterogeneous networks. In Proceedings of the 2012 IEEE 23rd International Symposium on Personal, Indoor and Mobile Radio Communications—(PIMRC), Sydney, NSW, Australia, 9–12 September 2012; pp. 910–914. [Google Scholar] [CrossRef]
- Dahlman, E.; Dimou, K.; Parkvall, S.; Tullberg, H. Future wireless access small cells and heterogeneous deployments. In Proceedings of the ICT 2013, Casablanca, Morocco, 6–8 May 2013. [Google Scholar] [CrossRef]
- Kikuchi, K.; Otsuka, H. Parameter optimization for adaptive control CRE in HetNet. In Proceedings of the 2013 IEEE 24th Annual International Symposium on Personal, Indoor, and Mobile Radio Communications (PIMRC), London, UK, 8–11 September 2013; pp. 3334–3338. [Google Scholar] [CrossRef]
- Maria, A.D.; Panno, D. A radio resource management scheme in future ultra-dense phantom networks. In Proceedings of the 2017 IEEE 13th International Conference on Wireless and Mobile Computing, Networking and Communications (WiMob), Rome, Italy, 9–11 October 2017; pp. 1–6. [Google Scholar] [CrossRef]
- Chandra, K.; Marcano, A.S.; Mumtaz, S.; Prasad, R.V.; Christiansen, H.L. Unveiling capacity gains in ultradense networks. IEEE Veh. Tech.Mag. 2018, 13, 64–83. [Google Scholar] [CrossRef]
- Zhang, Z.; Li, H. Automatic Differentiation Based Resource Allocation Algorithm for Heterogeneous Networks. In Proceedings of the 2019 11th International Conference on Wireless Communications and Signal Processing (WCSP), Xi’an, China, 23–25 October 2019. [Google Scholar] [CrossRef]
- Li, J.; Zhang, X.; Wang, S.; Yi, W. Proactive Resource Scheduling with Time and Frequency Domain Coordination in Heterogeneous Networks. In Proceedings of the 2018 IEEE 29th Annual International Symposium on Personal, Indoor and Mobile Radio Communications (PIMRC), Bologna, Italy, 9–12 September 2018. [Google Scholar] [CrossRef]
- Wang, L.; Yang, C.; Hu, R.Q. Autonomous Traffic Offloading in Heterogeneous Ultra-Dense Networks Using Machine Learning. IEEE Wirel. Commun. 2019, 26, 102–109. [Google Scholar] [CrossRef]
- Pi, Z.; Khan, F. An introduction to millimeter-wave mobile broadband systems. IEEE Commun. Mag. 2011, 49, 101–107. [Google Scholar] [CrossRef]
- Rappaport, T.S.; Sun, S.; Mayzus, R.; Zhao, H.; Azar, Y.; Wang, K.; Wong, G.N.; Schulz, J.K.; Samimi, M.; Gutierrez, F. Millimeter wave mobile communications for 5g cellular: It will work! IEEE Access 2013, 1, 335–349. [Google Scholar] [CrossRef]
- Baldemair, R.; Irnich, T.; Balachandran, K.; Dahlman, E.; Mildh, G.; Selen, Y.; Parkvall, S.; Meyer, M.; Osserian, A. Ultra-dense networks in millimeter-wave frequencies. IEEE Commun. Mag. 2015, 53, 202–208. [Google Scholar] [CrossRef]
- Bogale, T.E.; Le, L.B. Massive MIMO and mmWave for 5G Wireless HetNet: Potential Benefits and Challenges. IEEE Veh. Technol. Mag. 2016, 11, 64–75. [Google Scholar] [CrossRef]
- Xiao, M.; Mumtaz, S.; Huang, Y.; Dai, L.; Li, Y.; Matthaiou, M.; Karagiannidis, G.; Bjornson, E.; Yang, K.; Chih-Lin, I.; et al. Millimeter Wave Communications for Future Mobile Networks. IEEE J. Sel. Areas Commun. 2017, 35, 1909–1935. [Google Scholar] [CrossRef] [Green Version]
- Gopalam, S.; Hanly, S.V.; Whiting, P. Distributed User Association and Resource Allocation Algorithms for Three Tier HetNets. IEEE Trans. Wirel. Commun. 2020, 19, 7913–7926. [Google Scholar] [CrossRef]
- Makhanbet, M.; Lv, T.; Orynbet, M.; Suleimenov, B. A Fully Distributed and Clustered Learning of Power Control in User-Centric Ultra-Dense HetNets. IEEE Trans. Veh. Technol. 2020, 69, 11529–11543. [Google Scholar] [CrossRef]
- Kim, S. Heterogeneous Network Bandwidth Control Scheme for the Hybrid OMA-NOMA System Platform. IEEE Access 2020, 8, 83414–83424. [Google Scholar] [CrossRef]
- Qi, X.; Khattak, S.; Zaib, A.; Khan, I. Energy Efficient Resource Allocation for 5G Heterogeneous Networks Using Genetic Algorithm. IEEE Access 2021, 9, 160510–160520. [Google Scholar] [CrossRef]
- Khalid, M.; Naqvi, S.I.; Hussain, N.; Rahman, M.; Fawad; Mirjavadi, S.S.; Khan, M.J.; Amin, Y. 4-Port MIMO Antenna with Defected Ground Structure for 5G Millimeter Wave Applications. Electronics 2020, 9, 71. [Google Scholar] [CrossRef] [Green Version]
- Naqvi, S.I.; Hussain, N.; Iqbal, A.; Rahman, M.; Forsat, M.; Mirjavadi, S.S.; Amin, Y. Integrated LTE and Millimeter-Wave 5G MIMO Antenna System for 4G/5G Wireless Terminals. Sensors 2020, 20, 3926. [Google Scholar] [CrossRef]
- Kemmochi, F.; Omura, Y.; Otsuka, H. Throughput performance of multiband HetNets using sectorized picocells with 3D beamforming at 28 GHz band. In Proceedings of the 2021 IEEE 93rd Vehicular Technology Conference (VTC2021-Spring), Helsinki, Finland, 25–28 April 2021. MACC-VIII. [Google Scholar] [CrossRef]
- Nishimura, S.; Suyama, S.; Asai, T.; Otsuka, H. Throughput performance of HetNets using sectorized picocells with 3D beamforming at 28 GHz band in multipath fading channels. In Proceedings of the 2021 IEEE VTS 17th Asia Pacific Wireless Communications Symposium (APWCS), Osaka, Japan, 30–31 August 2021; pp. S3–S10. [Google Scholar] [CrossRef]
- 3GPP TSG RAN WG1; Potential performance of range expansion in macro-pico deployment (R1–104355). Kyocera: Osaka, Japan, August 2010.
- 3GPP TSG-RAN; Range expansion for efficient support of heterogeneous networks. Qualcomm Europe: San Diego, CA, USA, October 2010.
- 3GPP TR 36.783; Evolved Universal Terrestrial Radio Access (E-UTRA); Introduction of 1024 Quadrature Amplitude Modulation (QAM) in LTE downlink. 3GPP, April 2017; Release 15.
- Mu, Q.; Liu, L.; Chen, L.; Jiang, Y. CQI table design to support 256 QAM in small cell environment. In Proceedings of the 2013 International Conference on Wireless Communications and Signal Processing, Hangzhou, China, 24–26 October 2013; pp. 1–5. [Google Scholar] [CrossRef]
- Nakamura, M.; Otsuka, H. New Entry of OFDM using 256- and 1024-QAM in MCS Operation. In Proceedings of the APWCS, Singapore, 19–21 August 2015; pp. RS2–RS4. [Google Scholar]
- Abdullahi, J.M.M.A.; Cao, A. A low complexity 256QAM soft demapper for 5G mobile system. In Proceedings of the 2016 European Conference on Networks and Communications (EuCNC), Athens, Greece, 27–30 June 2016; pp. 1–6. [Google Scholar] [CrossRef]
- Tian, R.; Senda, K.; Ota, T.; Otsuka, H. Transmission performance of OFDM-based 1024-QAM in multipath fading conditions. IEICE Commun. Express 2018, 7, 272–277. [Google Scholar] [CrossRef]
- Tian, R.; Senda, K.; Otsuka, H. BER Performance of OFDM-based 4096-QAM using soft decision Viterbi decoding in multipath fading. In Proceedings of the 2018 IEEE World Symposium on Communication Engineering (WSCE), Singapore, 28–30 December 2018. session 3. [Google Scholar] [CrossRef]
- Otsuka, H.; Tian, R.; Senda, K. Transmission Performance of an OFDM-Based Higher-Order Modulation Scheme in Multipath Fading Channels. J. Sens. Actuator Netw. 2019, 8, 19. [Google Scholar] [CrossRef] [Green Version]
- Yoneyama, A.; Kemmochi, F.; Otsuka, H. Pico-eNB Tx power optimization for multiband HetNets with MCS Incorporating 1024-QAM. In Proceedings of the 2021 International Conference on Information Networking (ICOIN), Jeju Island, Korea, 13–16 January 2021. O-8-5. [Google Scholar] [CrossRef]
- 3GPP TR 36.873; Study on 3D Channel Model for LTE. Release 12 3GPP RAN #63 March 2014; 3GPP: Provence, France, 2014.
- Nardini, G.; Stea, G.; Sabella, D. Simu5G: A System-level Simulator for 5G Networks. Simultech 2020, 68–80. [Google Scholar] [CrossRef]
- Olaifa, J.O.; Arifler, D. Using system-level simulation to evaluate downlink throughput performance in LTE-A networks with clustered user deployments. In Proceedings of the 2016 1st International Workshop on Link- and System Level Simulations (IWSLS), Vienna, Austria, 1 July 2016. [Google Scholar] [CrossRef]
- ITU Report M.2135-1; Guidelines for evaluation of radio interface technologies for IMT-Advanced. ITU: Geneva, Switzerland, December 2009.
- 3GPP TR 38.901; Study on channel model for frequencies from 0.5 to 100 GHz. iTeh, Inc.: San Francisco, CA, USA, March 2017; Release 14.
Figure 1.
Multiband HetNet combining macrocell operating at 2.0 GHz and picocells with a wide bandwidth operating at 4.5 GHz.
Figure 1.
Multiband HetNet combining macrocell operating at 2.0 GHz and picocells with a wide bandwidth operating at 4.5 GHz.

Figure 2.
Cell selection procedure based on RSRP in HetNet.

Figure 3.
Definition of cluster size for UE layout around pico-eNBs.

Figure 4.
Simulation output of macro- and pico-eNBs layouts as well as UE distribution at a given instant.
Figure 4.
Simulation output of macro- and pico-eNBs layouts as well as UE distribution at a given instant.

Figure 5.
Average and 5-percentile user throughput as a function of pico-eNB Tx power.

Figure 6.
CDF of downlink effective SINR as a function of three pico-eNB Tx powers.

Figure 7.
Connection ratio of UE as a function of pico-eNB Tx power.

Figure 8.
Average user throughput of specific UE connected with pico-eNBs as a function of pico-eNB Tx power.
Figure 8.
Average user throughput of specific UE connected with pico-eNBs as a function of pico-eNB Tx power.

Figure 9.
Average user throughput of specific UE connected with macro-eNBs as a function of pico-eNB Tx power.
Figure 9.
Average user throughput of specific UE connected with macro-eNBs as a function of pico-eNB Tx power.

Figure 10.
Analysis of use rate of modulation method used in downlink MCS as a function of pico-eNB Tx power.
Figure 10.
Analysis of use rate of modulation method used in downlink MCS as a function of pico-eNB Tx power.

Figure 11.
A CRE using a positive CSO in HetNet.

Figure 12.
Cell selection procedure using CRE operation in HetNet.

Figure 13.
Average and 5-percentile user throughput as a function of CSO for pico-eNB Tx power of 37 dBm.
Figure 13.
Average and 5-percentile user throughput as a function of CSO for pico-eNB Tx power of 37 dBm.

Figure 14.
Average and 5-percentile user throughput as a function of CSO for pico-eNB Tx power of 31 dBm.
Figure 14.
Average and 5-percentile user throughput as a function of CSO for pico-eNB Tx power of 31 dBm.


Table 1.
Multiband HetNet model used in the simulation.
| Parameter | Value | |
|---|---|---|
| Macro-eNB | Pico-eNB | |
| Cell layout | Hexagonal grid, 19 cell sites 3 sectors per site | 4 picos per sector |
| Carrier frequency | 2.0 GHz | 4.5 GHz |
| System bandwidth | 10 MHz | 100 MHz |
| Cell radius (ISD) | 289 m (500 m) | – |
| Tx antenna height | 32 m | 10 m |
| Tx power | 46 dBm | from 28 to 45 dBm |
| Tx antenna gain | 14 dBi | 5 dBi |
| Tx antenna downtilt | 15 deg. | 10 deg. |
| UE distribution | 30 UEs per sector, 2/3 clustered distribution | |
| Scheduling algorithm | Proportional fairness | |
| Link adaptation | QPSK to 1024-QAM (25 MCS indexes) | |
| Traffic model | Full buffer | |
| MIMO | 2 × 2 SU-MIMO | |
Table 2.
25 MCS indexes incorporating 1024-QAM.
| MCS Index | Modulation | Coding Rate | Efficiency (bps/Hz) |
|---|---|---|---|
| 1 | QPSK | 1/13 | 0.152 |
| 2 | 1/9 | 0.234 | |
| 3 | 1/5 | 0.377 | |
| 4 | 1/3 | 0.667 | |
| 5 | 2/5 | 0.800 | |
| 6 | 1/2 | 1.000 | |
| 7 | 3/5 | 1.200 | |
| 8 | 2/3 | 1.333 | |
| 9 | 3/4 | 1.500 | |
| 10 | 16-QAM | 1/2 | 2.000 |
| 11 | 3/5 | 2.400 | |
| 12 | 2/3 | 2.667 | |
| 13 | 3/4 | 3.000 | |
| 14 | 64-QAM | 9/16 | 3.375 |
| 15 | 2/3 | 4.000 | |
| 16 | 3/4 | 4.500 | |
| 17 | 5/6 | 5.000 | |
| 18 | 11/12 | 5.500 | |
| 19 | 256-QAM | 7/10 | 5.600 |
| 20 | 3/4 | 6.000 | |
| 21 | 5/6 | 6.667 | |
| 22 | 11/12 | 7.333 | |
| 23 | 1024-QAM | 3/4 | 7.500 |
| 24 | 5/6 | 8.333 | |
| 25 | 11/12 | 9.167 |
Table 3.
TDL model used in macrocells and picocells.
| Gain (dB) | Delay (ns) |
|---|---|
| −15.5 | 0 |
| 0.0 | 10 |
| −5.1 | 15 |
| −5.1 | 20 |
| −9.6 | 25 |
| −8.2 | 50 |
| −13.1 | 65 |
| −11.5 | 75 |
| −11.0 | 105 |
| −16.2 | 135 |
| −16.6 | 150 |
Publisher’s Note: MDPI stays neutral with regard to jurisdictional claims in published maps and institutional affiliations. |
© 2022 by the authors. Licensee MDPI, Basel, Switzerland. This article is an open access article distributed under the terms and conditions of the Creative Commons Attribution (CC BY) license (https://creativecommons.org/licenses/by/4.0/).
Share and Cite
MDPI and ACS Style
Yasaka, T.; Yoda, K.; Otsuka, H. Optimization of Pico-eNB Tx Power and the Effects of Picocell Range Expansion in Multiband HetNet. J. Sens. Actuator Netw. 2022, 11, 27. https://0-doi-org.brum.beds.ac.uk/10.3390/jsan11020027
AMA Style
Yasaka T, Yoda K, Otsuka H. Optimization of Pico-eNB Tx Power and the Effects of Picocell Range Expansion in Multiband HetNet. Journal of Sensor and Actuator Networks. 2022; 11(2):27. https://0-doi-org.brum.beds.ac.uk/10.3390/jsan11020027
Chicago/Turabian StyleYasaka, Takumi, Kentaro Yoda, and Hiroyuki Otsuka. 2022. "Optimization of Pico-eNB Tx Power and the Effects of Picocell Range Expansion in Multiband HetNet" Journal of Sensor and Actuator Networks 11, no. 2: 27. https://0-doi-org.brum.beds.ac.uk/10.3390/jsan11020027
Note that from the first issue of 2016, this journal uses article numbers instead of page numbers. See further details here.