
The Impact of COVID-19 on Airfares—A Machine Learning Counterfactual Analysis

Institute of Air Transport and Airport Research, German Aerospace Center (DLR e.V.), 51147 Cologne, Germany
Econometrics 2022, 10(1), 8; https://0-doi-org.brum.beds.ac.uk/10.3390/econometrics10010008
Submission received: 15 November 2021
/
Revised: 7 February 2022
/
Accepted: 11 February 2022
/
Published: 16 February 2022
(This article belongs to the Special Issue Health Econometrics)
Abstract
:This paper studies the performance of machine learning predictions for the counterfactual analysis of air transport. It is motivated by the dynamic and universally regulated international air transport market, where ex post policy evaluations usually lack counterfactual control scenarios. As an empirical example, this paper studies the impact of the COVID-19 pandemic on airfares in 2020 as the difference between predicted and actual airfares. Airfares are important from a policy makers’ perspective, as air transport is crucial for mobility. From a methodological point of view, airfares are also of particular interest given their dynamic character, which makes them challenging for prediction. This paper adopts a novel multi-step prediction technique with walk-forward validation to increase the transparency of the model’s predictive quality. For the analysis, the universe of worldwide airline bookings is combined with detailed airline information. The results show that machine learning with walk-forward validation is powerful for the counterfactual analysis of airfares.
1. Introduction
The International Civil Aviation Organization (ICAO) establishes universal aviation standards for the international airline industry. Therefore, counterfactual scenarios frequently do not exist (Spence et al. 2015). As a result, standard program evaluation methods comparing treated and untreated units, such as difference in differences, regression discontinuity design and synthetic control methods, cannot be applied (Angrist and Pischke 2008; Athey and Imbens 2017). In comparison to traditional econometric models—focused on the in-sample estimation of parameters—machine learning algorithms (ML) are optimized to predict the value of the outcome variable out of the sample (Mullainathan and Spiess 2017). Therefore, ML predictions can be used as counterfactual control scenarios for ex post evaluation, if trained on pre-reform data.
This paper investigates the performance of ML for predicting counterfactual control scenarios under universal policy shifts. As an empirical example, the paper analyzes the impact of the COVID-19 policy regime shifts on airfares at airline level. Studying airfares is of particular interest. Air transport is crucial for mobility—especially for long travel distances and regions with limited road and rail connectivity. It has become even more important as air transport connectivity has decreased in many parts of the world due to COVID-19, reducing the choices of passengers (Sun et al. 2020). By a combination of demand and supply shocks, the COVID-19 pandemic policy responses caused the most significant decrease in global air transport passenger traffic in history, probably affecting airfares. Without governmental support, many airlines would have gone bankrupt in 2020 due to the high capital costs of airlines (Abate et al. 2020). From a methodological point of view, airfares are challenging. Airfare pricing has a complex structure with sophisticated rules and mathematical models and does not follow a clear trend which makes airfares hard to predict (Narangajavana et al. 2014; Stavins 2001). The effect of COVID-19 on airfares is not as obvious as in the case of air traffic.
This paper develops a universal prediction model with as few assumptions about the structure of the data as possible, to ensure usability for different reform scenarios. For prediction, it makes use of forest-based algorithms which are non-parametric and can be applied to mixed-type data (Breiman 2001). Given the time-series character of the datasets, a multi-step forecasting with walk-forward validation was applied, making the model empirically traceable. The model was trained on historic airfares and forecast airline-specific airfares on a yearly basis. At the end of each year, the actual airfares were included in the training dataset and the forecasting for the next year was conducted. This revealed the prediction error at any point in the observation period. The impact of the COVID-19 policy shift is the deviation between the ML-predicted airfares for 2020 trained on pre-COVID-19 data and the actual prices in 2020. The underlying assumption is the neglectable predication error before 2020. To meet this requirement, the model was trained with extensive information about other influencing factors on airfares. Two main sources of data were used for training the model. The universe of airfares at air-carrier level were collected from the Sabre Market Intelligence. For detailed yearly information on air carriers, the ICAO Data Plus dataset was used. The ICAO dataset is characterized by extensive information and a large share of missing values. Therefore, missing data was imputed with random forest algorithms (RF) and features were selected by recursive feature elimination. The results of the paper show that the ML model significantly outperformed traditional econometric models in establishing counterfactual control scenarios. The prediction error of the ML model was neglectable over the whole observation period, revealing its suitability for predicting counterfactual control scenarios for the evaluation of universal policies. Airfares in 2020 would have been significantly higher in the absence of COVID-19.
This paper adds to two major strands of the literature. Researchers have incorporated ML to improve model pricing. Among them, regression models, such as linear regression, support vector machines and RF are frequently used (Narangajavana et al. 2014). However, linear regressions failed to deliver sufficient accuracy, since the underlying assumptions are frequently not met. Time-series modeling such as autoregressive-integrated moving average have been found to perform very well in case of strong trends or seasonal components (Ariyo et al. 2014). If unobservable components are dominant, these models are challenged, whereas ML usually outperforms in such a scenario (Bao et al. 2017).
The other strand of the literature uses ML predictions as counterfactual control scenarios to evaluate universal reforms (Abrell et al. 2019; Burlig et al. 2020). Estimating treatment effects in reference to an unobserved counterfactual is an old idea (Rubin 1974). However, access to high-dimensional data and progress in ML algorithms have greatly improved prediction accuracy (Varian 2014). In contrast to the existing literature, this paper focuses on the airline industry. Other papers using this method have studied energy markets (Burlig et al. 2020) or the impact of COVID-19 on international trade (Duenas et al. 2021).
This paper’s further contribution is a multi-step forecasting approach with walk-forward validation that has not been used in the corresponding literature so far. This procedure is of importance by revealing that the deviation between post-reform observed and predicted values is not caused by a measurement error. Other papers, such as (Duenas et al. 2021) or (Abrell et al. 2019; Burlig et al. 2020), do not reveal their models’ performance over a long period. Furthermore, this paper combines detailed data sources by matching the universe of ticket fares and detailed official air carrier information in order to receive such a high level of data dimensionality that has not been used in the literature so far (Abrell et al. 2019; Burlig et al. 2020; Liberman et al. 2018; Souza 2019).
2. Institutional Background and Data
2.1. The Universal COVID-19 Policy Response
By a combination of demand and supply shocks, the COVID-19 pandemic has led to the most significant decrease in global air transport passenger traffic in history. In 2020, the number of global passengers and passenger flight kilometers decreased by about 64 percent (Europe Airport Council International 2020). The demand shock has been caused by global travel restrictions, border closures and rules for physical distancing. The predominant demand drivers—business and tourism—have been blocked. An additional drop in demand has been caused by income losses of both private companies and private households due to containment measures. The risk of infection unsettled potential travelers. This paper does not disentangle between policy-driven demand shocks and demand shocks as a fear of infection. On the supply side, governmental directives such as national entry bans cut down the number of operated routes and flights significantly. Policy changes have been universal for the international airline industry. This paper does not disentangle the impact of each COVID-19 policy. Instead, it shows how all global COVID-19 policies together have affected worldwide airfares on average. It does not discuss every policy in detail.
2.2. Airfares and Airline Information
Two main data sources are used for this study, ICAO Data Plus and the Sabre Market Intelligence. The ICAO Data Plus is a high-dimensional multivariate dataset. It provides information on finance, employment and equipment at air carrier level on a yearly basis. This large set of information allows one to train the airfare prediction model on important confounding factors, such as fluctuating oil prices. The statistical data collected by ICAO are reported by the national Civil Aviation Authorities of its Member States. Airfares for origin–destination connections at the monthly carrier level are provided by the Sabre Market Intelligence database. This database uses validated raw bookings from global distribution systems, such as Sabre, Travelport and Amadeus, as its main source of data, combined and adjusted with data from external sources and with estimations for direct bookings and charter operations. Outputs of the Sabre database include monthly average airfares and passenger numbers, among others (Maertens 2018). Airline names differ between Sabre and ICAO Data Plus. To address this problem, edit distance was used to calculate the proximity of matches in airline names. Edit distance is the number of primordial operations necessary to translate the airline name into an accurate match. The remaining dataset consisted of 2612 unit-by-year observations and more than 100 features between 2002 and 2020.
For the analysis on airfares, this paper focused on base fares. Base fares are prices of airline tickets before fees, taxes and any surcharges are added—which may bias the results. Figure 1a shows the average base fare over time. It does not reveal any seasonality or continuous trend. Prices fluctuate between 2002 and 2013 and drop afterwards. The COVID-19 pandemic in 2020 does not seem to have had a significant impact on base fares. Furthermore, Figure 1b does not show large heterogeneity of the base-fare distribution across time. If any, the distribution becomes more compressed over time. Given this information, it is possible to conclude that COVID-19 had minor implications for airfare developments. However, without a counterfactual scenario, this interpretation can be misleading.
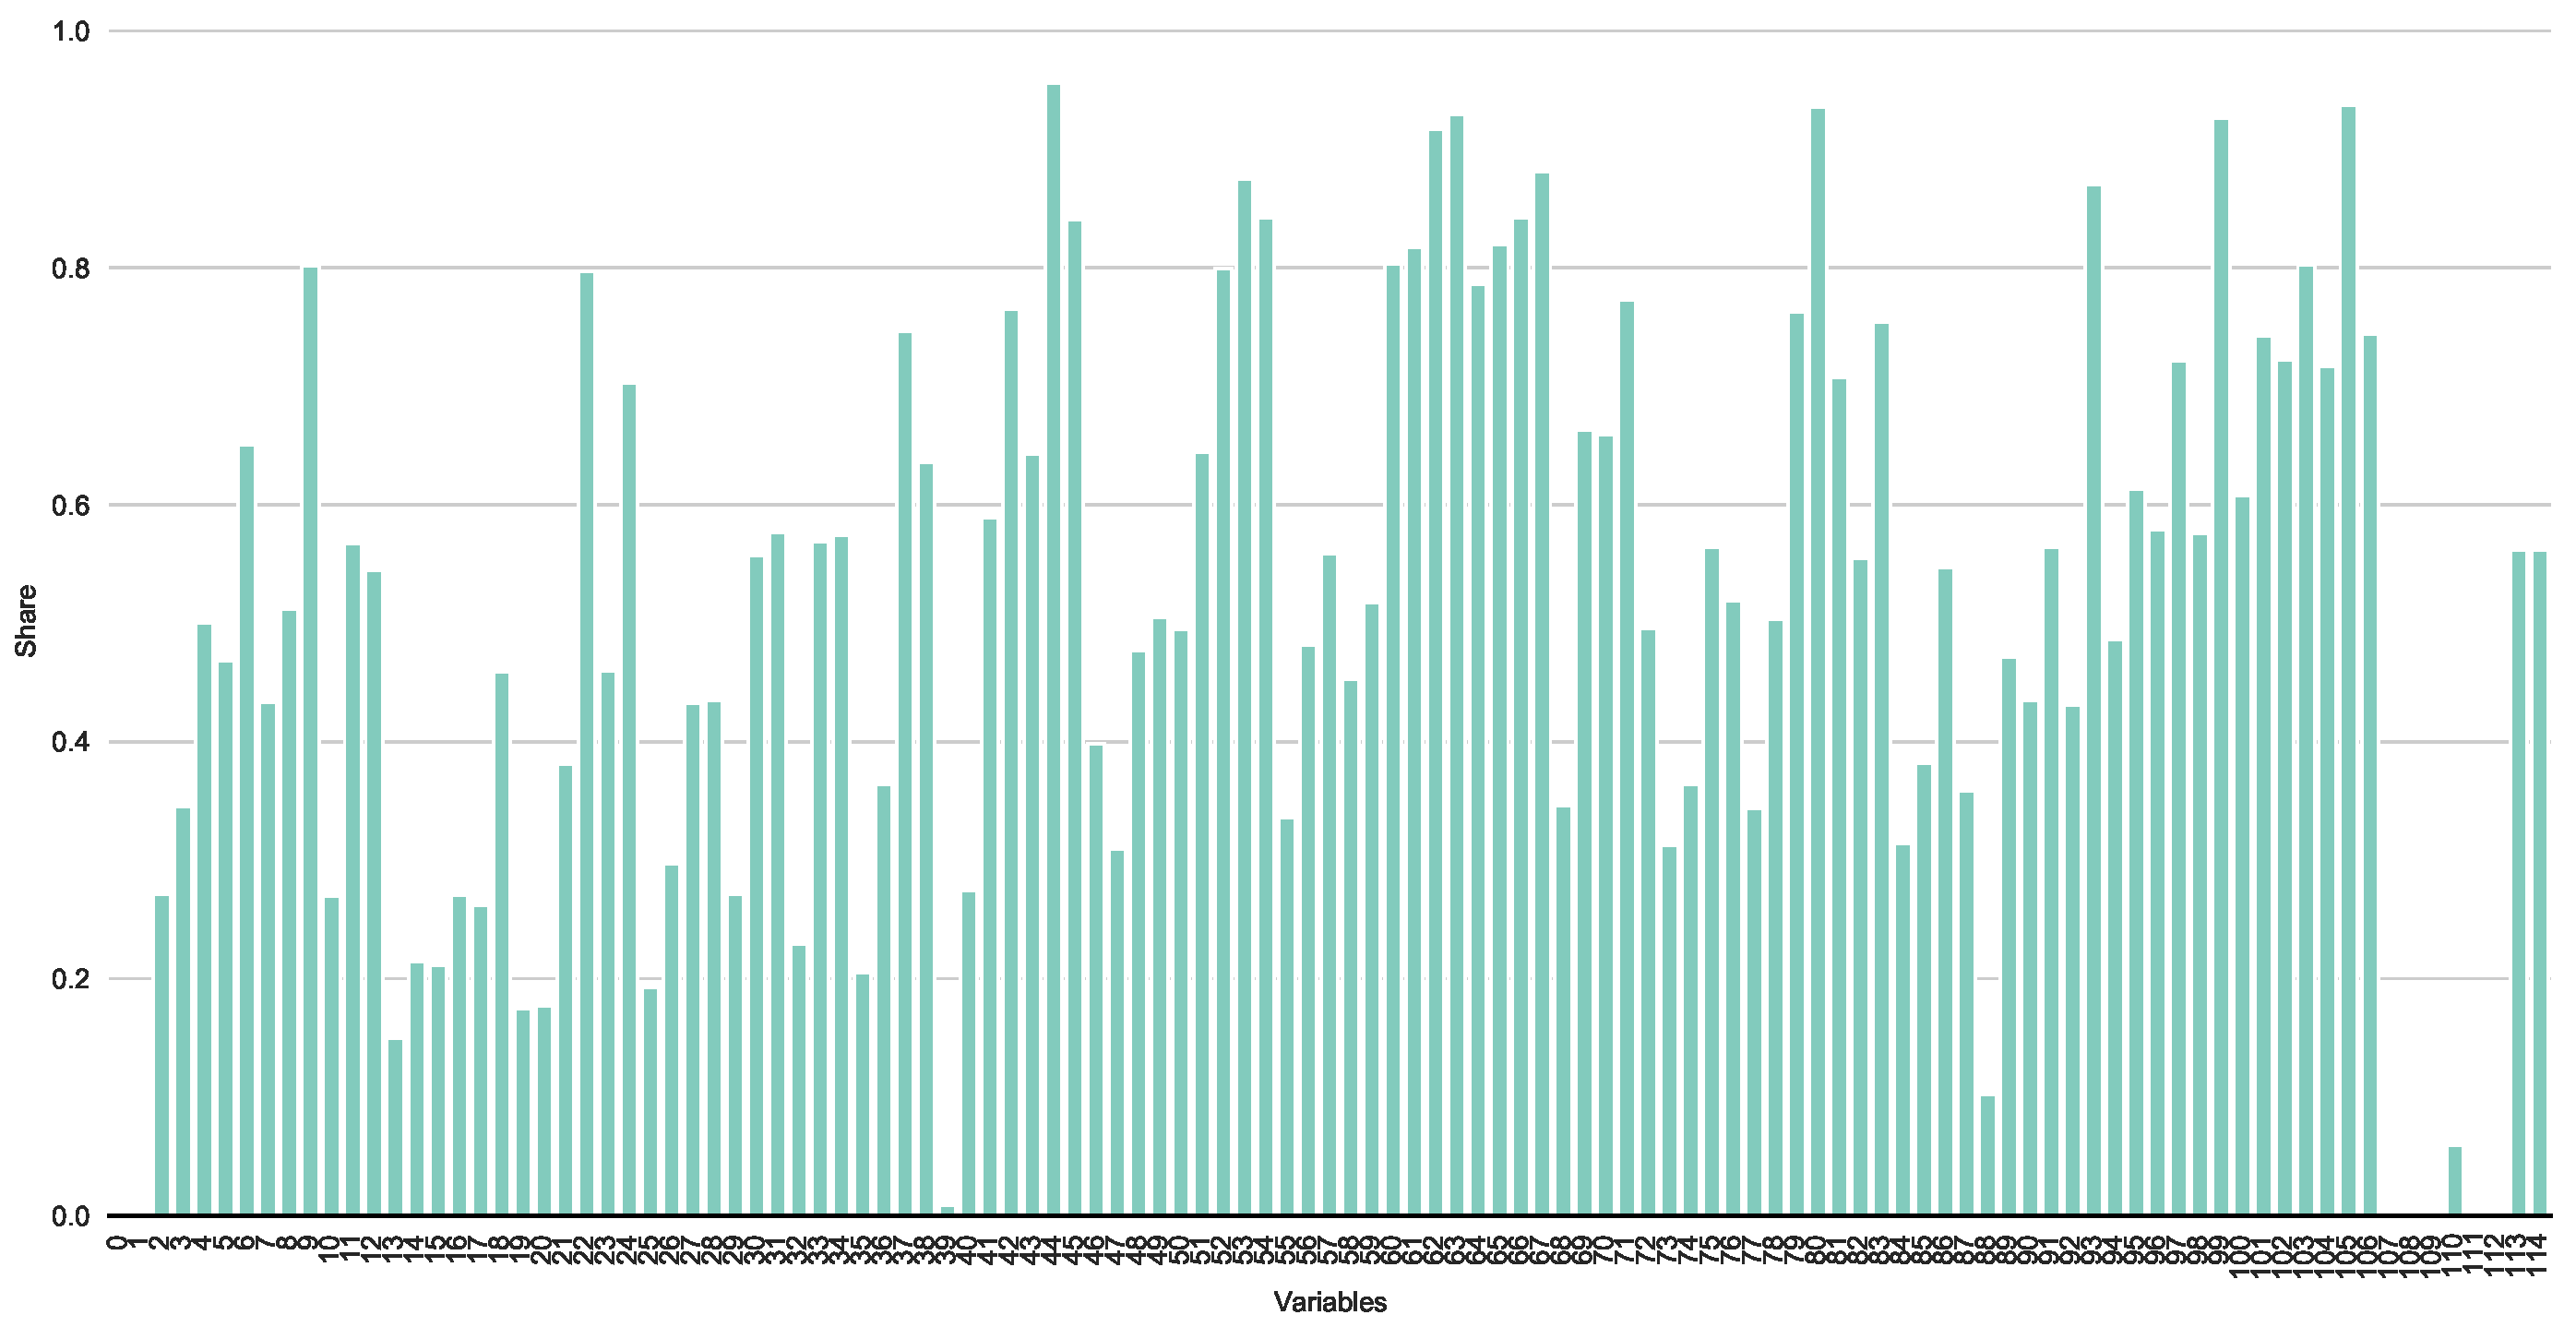
ML depends on a complete data set. However, ICAO Data Plus is highly incomplete. Figure 2 reveals the share of missing values per feature. The majority has a share of more than 20 percent, many even more than 60 percent. Missing value imputation offers a solution to this problem, even for a large share of missing variables as long as the data include complex interactions or non-linear relations between features of unequal scales and different types Stekhoven and Buehlmann (2012). ICAO Data Plus is high-dimensional with heterogeneous features.
2.3. Imputation and Feature Selection
Based on Stekhoven and Buehlmann (2012), this paper confronted the missing data problem using an iterative imputation approach. A random forest was trained on observed values, predicted the missing values and proceeded iteratively. The iterative process starts with the feature containing the least missing values and proceeds step-wise to those with more missing values. For the analysis, features were included with missing values of up to 70 percent. This is a relatively high threshold. Additionally, outliers with a deviation of three standard deviations of the median were imputed in the same way.
Following Guyon et al. (2002), recursive feature elimination was performed to select predictive features by recursively considering smaller and smaller sets of features. The model was trained on the initial set of features and the feature importance was obtained. The least important features were dropped. This procedure was repeated until a pre-defined number of eleven features was reached. In order to account for over-fitting—resulting from the relatively small training dataset—the number of features was restricted to eleven. Given the time-series structure of the dataset, imputations were performed separately for each time period.
2.4. Counterfactual Prediction and Walk-Forward Validation
Policy evaluation in air transport is challenged by uniform treatments across the entire population. Thus, estimations on the impact of a policy intervention cannot rely on an untreated control group. To overcome the missing data problem, this paper made use of a predicted outcome for a counterfactual level of the treatment. This implies that the prediction error is independent of the treatment. Consequently, this allowed us to estimate the treatment effect as the difference between the observed outcomes and the predicted values of counterfactual outcomes.
A prediction model was developed which handled input data flexibly, with as few assumptions about the structure of the data as possible. For prediction, the paper makes use of forest-based algorithms, which are non-parametric and can be applied to mixed-type data, where numeric, nominal or ordinal features coexist (Breiman 2001). In particular, the paper makes use of the gradient tree boosting algorithm XGboost1. A gradient boosting algorithm sequentially combines decision trees in a way that each new decision tree fits to the residuals from the previous step, so that the model improves. The final model aggregates the results from each step (Chen and Guestrin 2016).
Given the time-series character of the dataset, multi-step forecasting with walk-forward validation was applied. This made the model empirically traceable. It revealed the prediction error at any point in the observation period and guaranteed high transparency of the model performance. This differs from (Abrell et al. 2019; Burlig et al. 2020), who used ML predictions as counterfactual control scenarios to evaluate universal reforms but did not show the model performance over time.
Using this method, the model was trained on historic base fares and forecasts airline specific base fares on a yearly basis as follows: As a year passes, the actual base fares are included in the training dataset and forecasting for the next year is conducted. Differences between actual and predicted base fares are visualized on a yearly basis. The better the match between predicated and actual base fares, the better the model and the more complete the training data used. A singular outlier would be driven by year-specific unobservable variables, such as the COVID-19 shock. The model predicted 2020 without COVID-19 effects as it had not “seen” COVID-19 so far in the training data. Consequently, the difference between the predicted and the actual base fares in 2020 was interpreted as the COVID-19 shock on base fares. For a better understanding, this procedure is visualized in Figure 3.
Hyperparameters are key parts of ML which affect the performance and accuracy of a model by controlling the learning process. In this paper, hyperparameters were adjusted for every iterative step in the walk-forward procedure. This procedure is computationally intensive. Following Snoek et al. (2012), this paper used of Bayesian optimization to select hyperparameter values in order to reduce computing time. Hyperparameters were not tried out randomly. The model took into account information on previous hyperparameter combinations when choosing the hyperparameter set to evaluate next. The range of hyperparameters used for Bayesian optimization is shown in Table A1 in the Appendix A.
The root mean square error (RMSE), used to evaluate the model’s performance, is the square root of the mean of the square of all of the errors (see Equation (1)). The RMSE was aggregated for all prediction in the step-wise prediction process to the mean. When calculating the RMSE, 2020 was not included because 2020 was expected to deviate from previous years; therefore, it should not be counted for the valuation of the model performance.
In order to evaluate the performance of the final model, benchmarks models were set up. First, we used a persistence model defined by simply assuming that future values of base fares in t were equal to base fares observed at time . Second, we used OLS by modeling the base fare as a simple linear combination of independent variables. OLS models minimize the deviations between predicted and observed values in the present data, thus optimally adjusting to the training data and over-fitting the test data. Over-fitted models represent particularities of the training sample instead of actual underlying structural relationships. In turn, this leads to low out-of-sample prediction quality.
3. Results
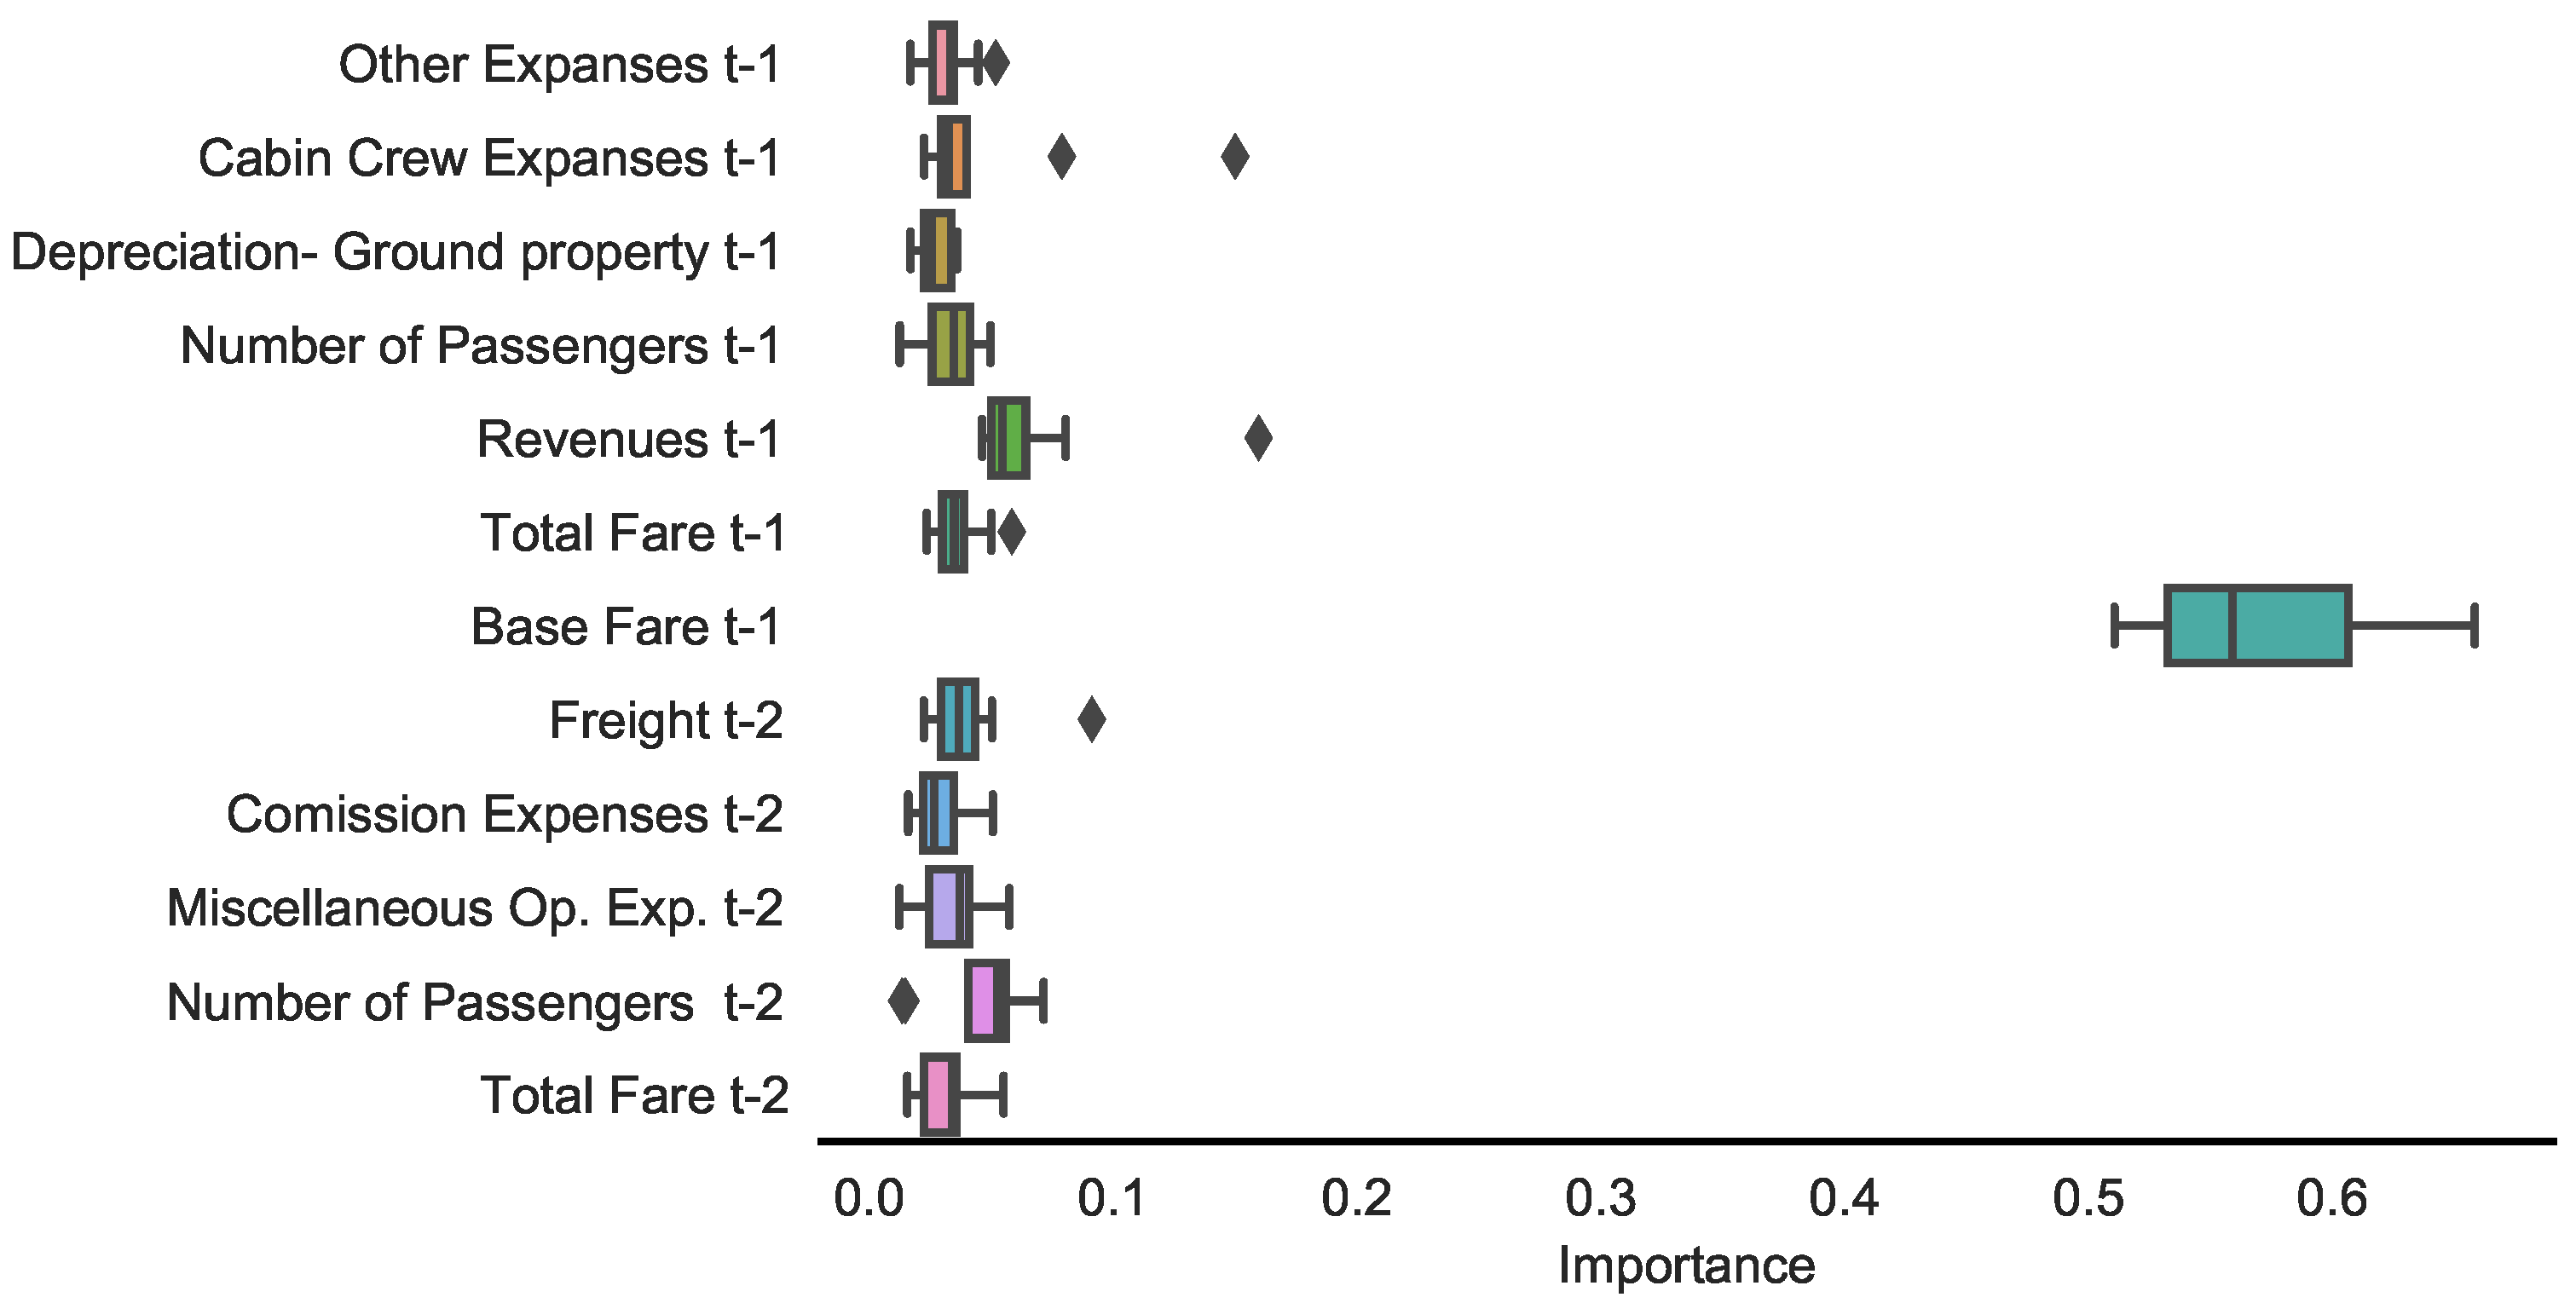
For the analysis, eleven features were pre-selected with the highest feature importance. Figure 4 displays the feature importance, i.e., the importance of a single predictor on the model’s performance relative to the others over the whole step-wise prediction process. The base fare of the previous period is by far the most dominant predictor. In general, other features have equal importance in common. However, as in the case of cabin crew expanses or revenues in , importance can increase significantly for a single year. In this case, features tend to follow a pre-trend because their importance increases in the case of turning local trends in the base fare.
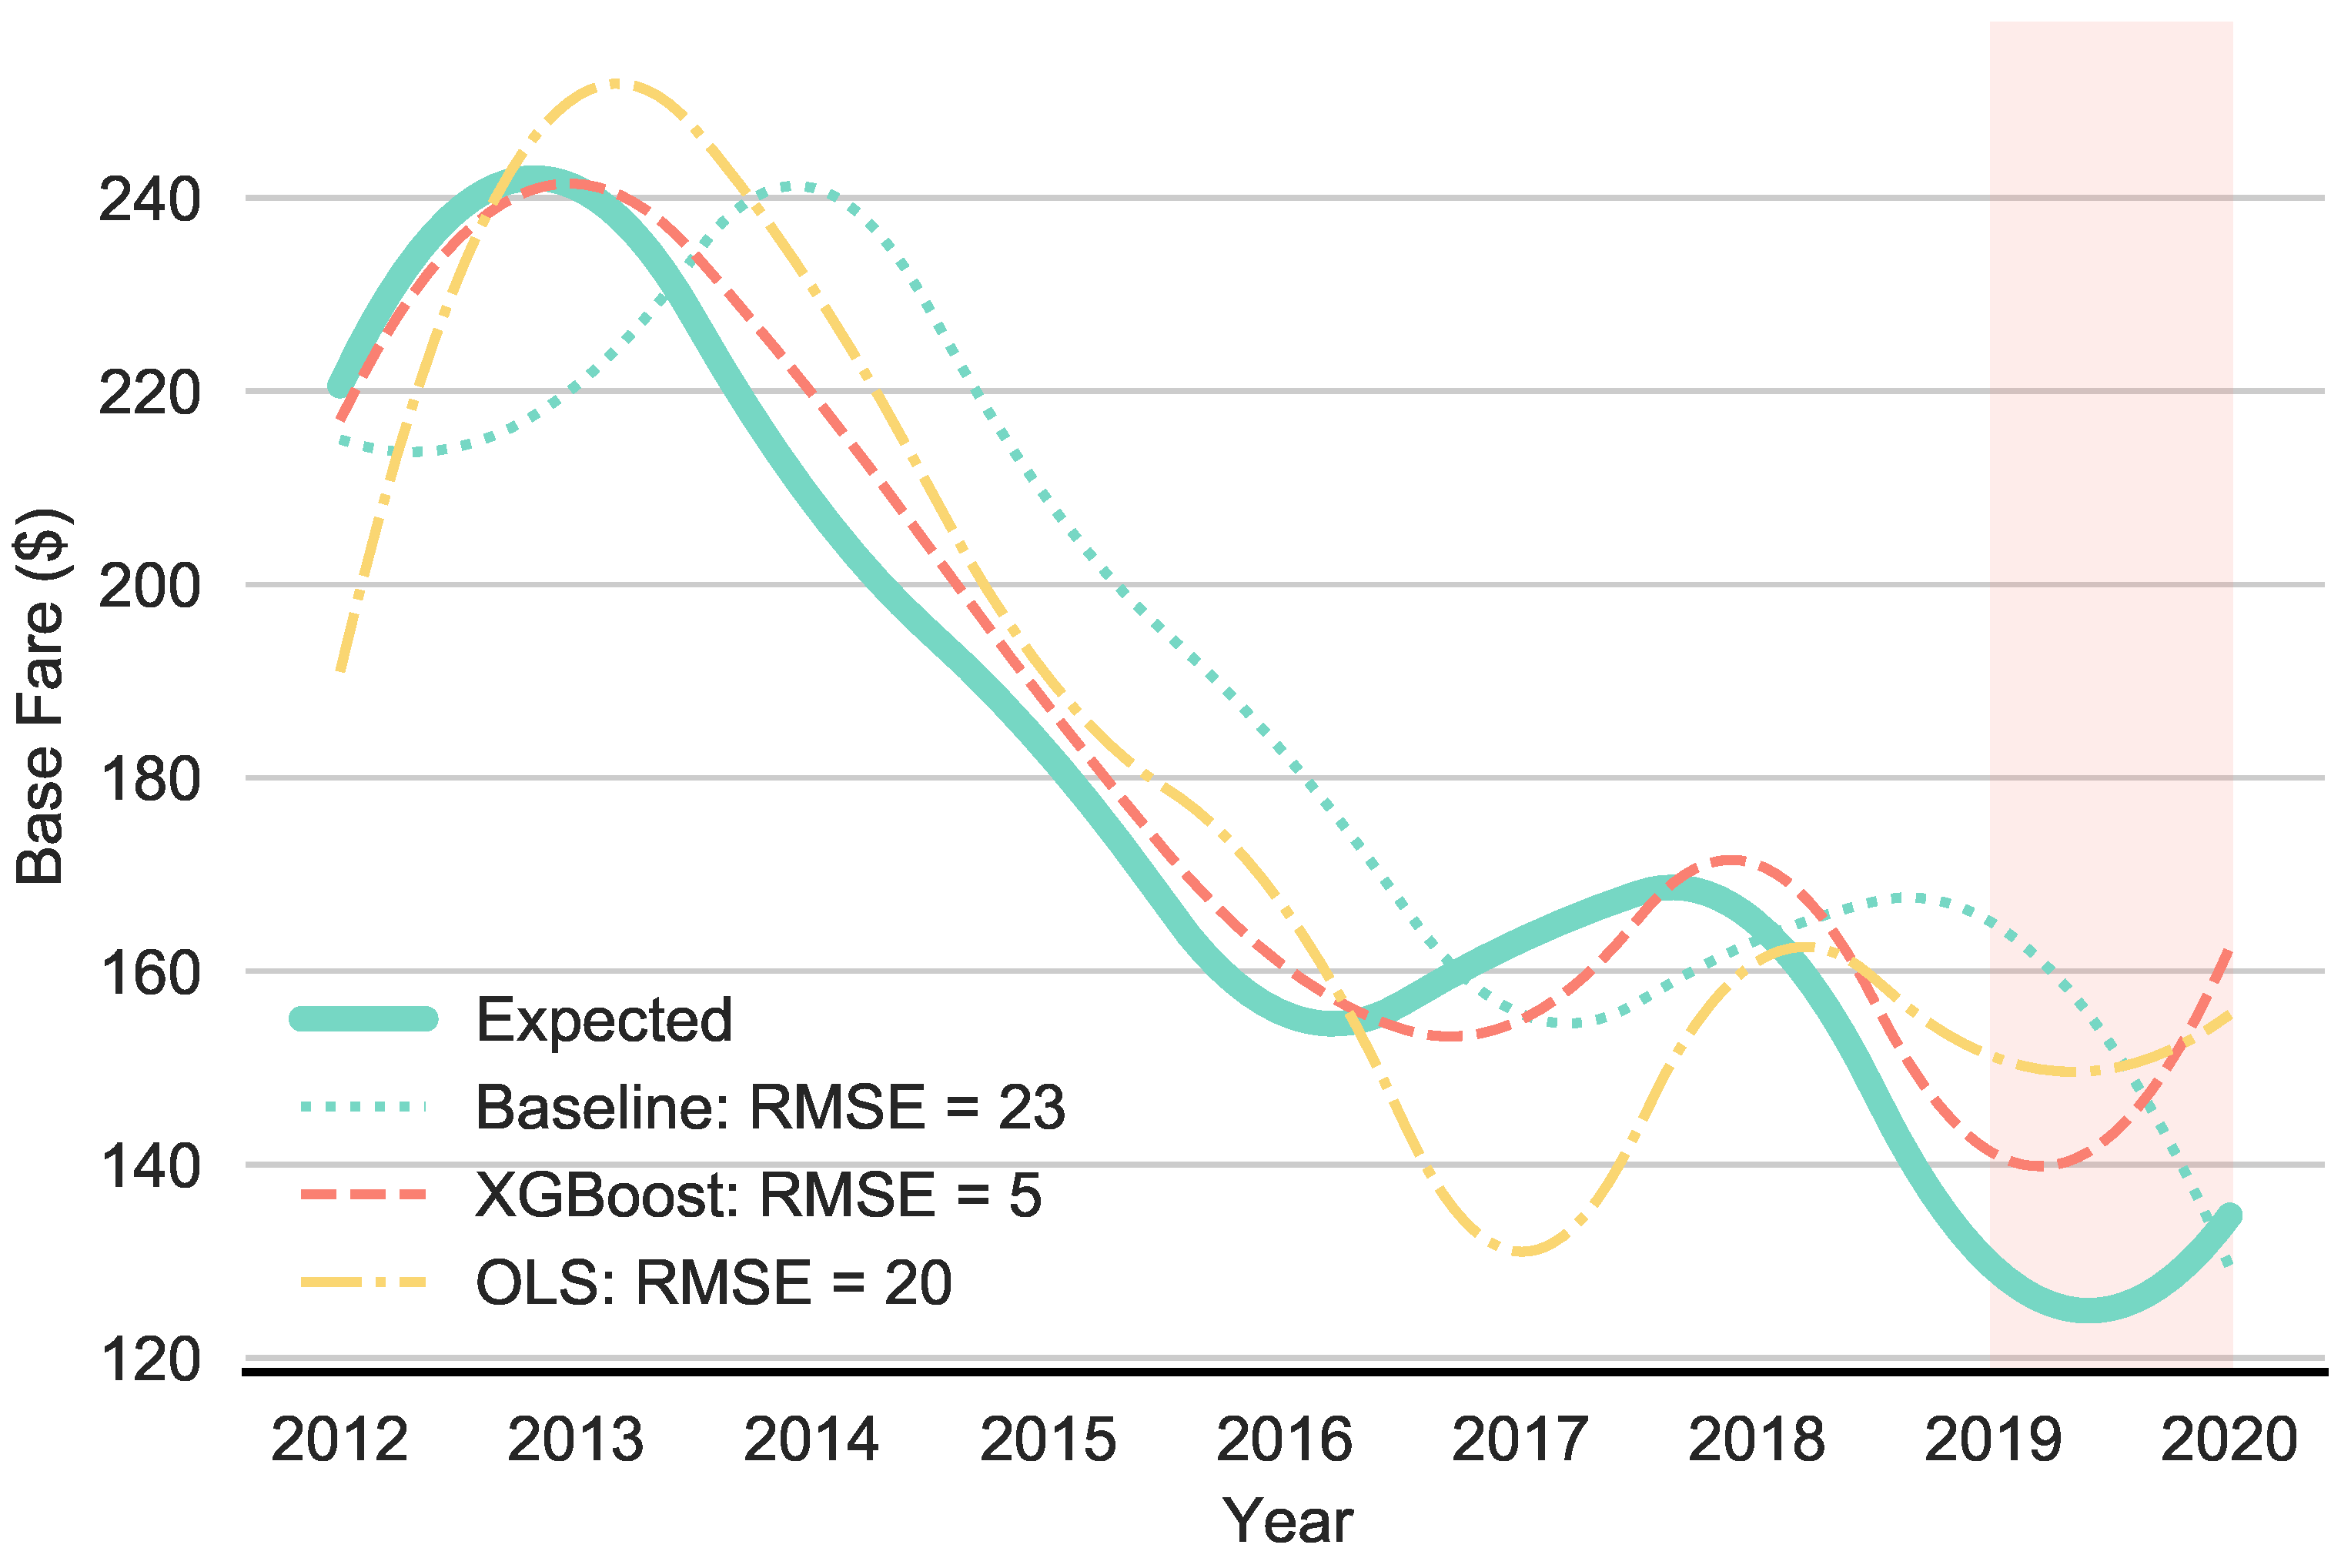
Figure 5 summarizes the main results of this paper. The precise yearly values are shown in Table A2 in the Appendix A. Base fares were calculated at airline level and aggregated to the mean. The solid line represents the observed base fare. The dotted line is the persistence benchmark model predicting the future base fares by the base fares of the previous period. The dash-dotted line represents the predictions of the OLS model. Finally, the dashed line shows the prediction results of the ML model based on gradient boosted forest with eleven features and Bayesian-optimized hyper-parameters. The ML model significantly outperformed the benchmark models over the entire observation period between 2012 and 2019. The mean RMSE of the ML model was five, whereas the RMSE of the persistence model was 24 and 20 for OLS. Airfares ranged, on average, between USD 242 and 134 in this period. These differences in the prediction quality reveal the importance of using ML to construct counterfactual scenarios. Without the use of ML, disentangling the prediction errors from the COVID-19 policy effect would be impossible. In 2020, the deviation between actual and predicted base fares was around USD 25 in case of the ML model. This is more than three times larger than the value in the previous years. Finding significant deviations in predicted and actual base fares only in 2020, thus only in one out of nine observations between 2012 and 2020, reveals that this difference was caused by COVID-19. It can be concluded that airfares in 2020 would have been higher without the COVID-19 pandemic.
4. Conclusions
This paper analyzes the performance of using machine learning predictions for a counterfactual analysis of air transport. As an empirical example, the impact of the COVID-19 policy regime shifts on airfares in 2020 was estimated. Studying the effect on airfares is of particular interest, as air transport is crucial for mobility. To overcome the universal impact of COVID-19, this paper made use of a predicted outcome for a counterfactual level of the treatment. Consequently, it allowed us to estimate the treatment effect as the difference between the observed outcomes and the predicted values.
The prediction models were based on air carrier data from ICAO Data Plus and airfare data from Sabre Market Intelligence. ICAO Data Plus is high-dimensional with heterogeneous features. However, it is characterized by a large amount of missing values. The paper confronted the missing data problem using an iterative imputation approach by training a random forest on observed values, predicting the missing values and proceeding iteratively. To account for the high-dimensional data recursive feature, elimination was performed.
The predictive quality of the models was evaluated by performing multi-step prediction and walk-forward validation. Using walk-forward validation made the model empirically traceable and reveal prediction errors at any point in the observation period. Hyperparameters were adjusted for every iterative step in the walk-forward procedure using Bayesian optimization. The impact of the COVID-19 policy shift was calculated as the deviation in the ML predicted airfares trained on pre-COVID-19 data and the actual airfares in 2020.
The results reveal that the prediction quality was sensitive to the choice of the prediction method. ML significantly outperformed OLS, for example, which would be unsuitable for predicting counterfactual scenarios given its high prediction error. Before 2020, the predication error of the ML model was small. The RMSE of airfares between 2012 and 2019 was only 5, whereas the airfare ranged, on average, between USD 242 and 134 in this period. In 2020, the deviation between actual and predicted airfare was around USD 25, thus more than three times larger than it was in the previous years. This led to the conclusion that airfares seen in 2020 would have been higher in the absence of COVID-19.
More importantly, this paper shows that multi-step prediction based on ML and walk-forward validation is a preferable framework to evaluate predicted counterfactual control scenarios. In contrast to the corresponding literature, this approach increases transparency by showing that high prediction quality is not by chance.
Besides the counterfactual analysis, predictions of airfares can also be used to decide how and when a policy should be implemented in order to ensure mobility. A future use case is the evaluation of the Carbon Offsetting and Reduction Scheme for International Aviation on airfares. The evaluation framework presented in this paper can also be used to construct baseline scenarios for ex ante policy evaluation where the counterfactual scenarios are simulated, for example, by agent-based simulations.
Funding
This research study received no external funding.
Institutional Review Board Statement
Not applicable.
Informed Consent Statement
Not applicable.
Data Availability Statement
Two main data sources are used in this study, ICAO Data Plus and Sabre Market Intelligence.
Conflicts of Interest
The author declares no conflict of interest.
Appendix A

Table A1.
XGBoost hyperparameters.
| From | To | |
|---|---|---|
| Max depth | 1 | 25 |
| Learning rate | 0.01 | 0.10 |
| Min Child Weight | 1 | 10 |
| Alpha | 5 | 70 |
| Lambda | 0.04 | 0.40 |
| Delta | 50 | 160 |
| Gamma | 0 | 1 |
| Number of Trees | 1500 |
Notes: This table shows the range for each hyperparameter used by the Bayesian optimization.
Table A2.
Difference between actual and predicted base fares (USD).
| 2012 | 2013 | 2014 | 2015 | 2016 | 2017 | 2018 | 2019 | 2020 | |
|---|---|---|---|---|---|---|---|---|---|
| Expected | 220.34 | 241.23 | 215.56 | 181.94 | 158.19 | 162.22 | 168.22 | 132.03 | 137.08 |
| Baseline | 218.09 | 220.34 | 241.23 | 215.56 | 181.94 | 158.19 | 162.22 | 168.22 | 123.03 |
| OLS | 192.11 | 243.38 | 242.00 | 183.44 | 170.01 | 132.09 | 163.11 | 150.87 | 155.55 |
| XGBoost | 219.00 | 240.88 | 220.02 | 182.55 | 160.99 | 155.74 | 169.71 | 140.22 | 162.01 |
Notes: This table shows the yearly prediction results for the multi-step prediction process for the gradient boosted forest, the persistence model and the OLS model in comparison to the expected (observed) values.
| 1 | XGBoost is an optimized distributed gradient-boosting framework and free of usage under https://github.com/dmlc/xgboost, (accessed on 7 July 2021). |
References
- Abate, Megersa, Panayotis Christidis, and Alloysius Joko Purwanto. 2020. Government support to airlines in the aftermath of the covid-19 pandemic. Journal of Air Transport Management 89: 101931. [Google Scholar] [CrossRef] [PubMed]
- Abrell, Jan, Mirjam Kosch, and Sebastian Rausch. 2019. How effective was the uk carbon tax?—A machine learning approach to policy evaluation. In A Machine Learning Approach to Policy Evaluation (April 15, 2019). CER-ETH–Center of Economic Research at ETH Zurich Working Paper. Cleveland: International Association for Energy Economics, vol. 19, p. 317. [Google Scholar]
- Angrist, Joshua D., and Jörn-Steffen Pischke. 2008. Mostly Harmless Econometrics. Princeton: Princeton University Press. [Google Scholar]
- Ariyo, Adebiyi A., Adewumi O. Adewumi, and Charles K. Ayo. 2014. Stock price prediction using the arima model. Paper presented at 2014 UKSim-AMSS 16th International Conference on Computer Modelling and Simulation, Cambridge, UK, March 26–28; pp. 106–112. [Google Scholar]
- Athey, Susan, and Guido W. Imbens. 2017. The state of applied econometrics: Causality and policy evaluation. Journal of Economic Perspectives 31: 3–32. [Google Scholar] [CrossRef] [Green Version]
- Bao, Wei, Jun Yue, and Yulei Rao. 2017. A deep learning framework for financial time series using stacked autoencoders and long-short term memory. PLoS ONE 12: e0180944. [Google Scholar] [CrossRef] [PubMed] [Green Version]
- Breiman, Leo. 2001. Random forests. Machine Learning 45: 5–32. [Google Scholar] [CrossRef] [Green Version]
- Burlig, Fiona, Christopher Knittel, David Rapson, Mar Reguant, and Catherine Wolfram. 2020. Machine learning from schools about energy efficiency. Journal of the Association of Environmental and Resource Economists 7: 1181–217. [Google Scholar] [CrossRef]
- Chen, Tianqi, and Carlos Guestrin. 2016. Xgboost: A scalable tree boosting system. Paper presented at 22nd Acm Sigkdd International Conference on Knowledge Discovery and Data Mining, San Francisco, FL, USA, August 13–17; pp. 785–94. [Google Scholar]
- Dueñas, Marco, Víctor Ortiz, Massimo Riccaboni, and Francesco Serti. 2021. Assessing the impact of covid-19 on trade: A machine learning counterfactual analysis. arXiv arXiv:2104.04570. [Google Scholar]
- Europe Airport Council International. 2020. Airport Operators and Service Providers Call for ‘Urgent Supporting Measures’ from European Commission and States: European Aviation Relief Plan & Airports—Joint Industry Letter to European Commission. Available online: https://www.aci-europe.org/media-room/243-aci-europe-asa-aca-etrc-joint-industry-letter-to-european-commission-23-march-2020-european-aviation-relief-plan-airports.html (accessed on 10 October 2021).
- Guyon, Isabelle, Jason Weston, Stephen Barnhill, and Vladimir Vapnik. 2002. Gene selection for cancer classification using support vector machines. Machine Learning 46: 389–422. [Google Scholar] [CrossRef]
- Liberman, Andres, Christopher Neilson, Luis Opazo, and Seth Zimmerman. 2018. The Equilibrium Effects of Information Deletion: Evidence from Consumer Credit Markets. Technical Report. Cambridge: National Bureau of Economic Research. [Google Scholar]
- Maertens, Sven. 2018. A metric to assess the competitive position of airlines and airline groups in the intra-european air transport market. Research in Transportation Economics 72: 65–73. [Google Scholar] [CrossRef]
- Mullainathan, Sendhil, and Jann Spiess. 2017. Machine learning: An applied econometric approach. Journal of Economic Perspectives 31: 87–106. [Google Scholar] [CrossRef] [Green Version]
- Narangajavana, Yeamduan, Fernando J. Garrigos-Simon, Javier Sanchez García, and Santiago Forgas-Coll. 2014. Prices, prices and prices: A study in the airline sector. Tourism Management 41: 28–42. [Google Scholar] [CrossRef]
- Rubin, Donald B. 1974. Estimating causal effects of treatments in randomized and nonrandomized studies. Journal of Educational Psychology 66: 688. [Google Scholar] [CrossRef] [Green Version]
- Snoek, Jasper, Hugo Larochelle, and Ryan P. Adams. 2012. Practical bayesian optimization of machine learning algorithms. Advances in Neural Information Processing Systems 25: 1–9. [Google Scholar]
- Souza, Mateus. 2019. Predictive Counterfactuals for Treatment Effect Heterogeneity in Event Studies with Staggered Adoption. Available online: https://papers.ssrn.com/sol3/papers.cfm?abstract_id=3484635 (accessed on 8 August 2021).
- Spence, Tyler B., Richard O. Fanjoy, Chien-tsung Lu, and Stewart W. Schreckengast. 2015. International standardization compliance in aviation. Journal of Air Transport Management 49: 1–8. [Google Scholar] [CrossRef] [Green Version]
- Stavins, Joanna. 2001. Price discrimination in the airline market: The effect of market concentration. Review of Economics and Statistics 83: 200–2. [Google Scholar] [CrossRef] [Green Version]
- Stekhoven, Daniel J., and Peter Buehlmann. 2012. Missforest-non-parametric missing value imputation for mixed-type data. Bioinformatics 28: 112–18. [Google Scholar] [CrossRef] [PubMed] [Green Version]
- Sun, Xiaoqian, Sebastian Wandelt, and Anming Zhang. 2020. How did covid-19 impact air transportation? A first peek through the lens of complex networks. Journal of Air Transport Management 89: 101928. [Google Scholar] [CrossRef] [PubMed]
- Varian, Hal R. 2014. Big data: New tricks for econometrics. Journal of Economic Perspectives 28: 3–28. [Google Scholar] [CrossRef] [Green Version]
Figure 1.
Distribution of base fares. (a) Average base fare over time. (b) Distribution of average base fare. Notes: The figure on the left shows the yearly average base fare over time. The figure on the right shows the distribution of the base fare at airline level for 2010, 2015 and 2020.
Figure 1.
Distribution of base fares. (a) Average base fare over time. (b) Distribution of average base fare. Notes: The figure on the left shows the yearly average base fare over time. The figure on the right shows the distribution of the base fare at airline level for 2010, 2015 and 2020.

Figure 2.
Share of missing data. Notes: This figure shows the share of missing values per feature in the training dataset.
Figure 2.
Share of missing data. Notes: This figure shows the share of missing values per feature in the training dataset.

Figure 3.
Principal design of the multi-step predication and walk-forward validation. Notes: This figure illustrates the multi-step predication process with walk-forward validation. The deviation between the test results and the observed values in the last period represents the effect of the reform. Own illustration.

Figure 4.
Feature importance. Notes: This figure displays the relative importance of the top predictors of the ML model for the multi-step prediction process between 2012 and 2019.
Figure 4.
Feature importance. Notes: This figure displays the relative importance of the top predictors of the ML model for the multi-step prediction process between 2012 and 2019.

Figure 5.
Main results. Notes: This figure shows the results for the multi-step prediction process for the gradient boosted forest (dashed line), the persistence model (dotted line) and the OLS model (dash–dotted line). The thick line shows the observed average base fare per year.
Figure 5.
Main results. Notes: This figure shows the results for the multi-step prediction process for the gradient boosted forest (dashed line), the persistence model (dotted line) and the OLS model (dash–dotted line). The thick line shows the observed average base fare per year.

Publisher’s Note: MDPI stays neutral with regard to jurisdictional claims in published maps and institutional affiliations. |
© 2022 by the author. Licensee MDPI, Basel, Switzerland. This article is an open access article distributed under the terms and conditions of the Creative Commons Attribution (CC BY) license (https://creativecommons.org/licenses/by/4.0/).
Share and Cite
MDPI and ACS Style
Wozny, F. The Impact of COVID-19 on Airfares—A Machine Learning Counterfactual Analysis. Econometrics 2022, 10, 8. https://0-doi-org.brum.beds.ac.uk/10.3390/econometrics10010008
AMA Style
Wozny F. The Impact of COVID-19 on Airfares—A Machine Learning Counterfactual Analysis. Econometrics. 2022; 10(1):8. https://0-doi-org.brum.beds.ac.uk/10.3390/econometrics10010008
Chicago/Turabian StyleWozny, Florian. 2022. "The Impact of COVID-19 on Airfares—A Machine Learning Counterfactual Analysis" Econometrics 10, no. 1: 8. https://0-doi-org.brum.beds.ac.uk/10.3390/econometrics10010008
Note that from the first issue of 2016, this journal uses article numbers instead of page numbers. See further details here.