Pitfalls of Two-Step Testing for Changes in the Error Variance and Coefficients of a Linear Regression Model


1
Department of Economics, Boston University, Boston, MA 02215, USA
2
Department of Economics, Hitotsubashi University, Kunitachi, Tokyo 186-8601, Japan
*
Author to whom correspondence should be addressed.
Econometrics 2019, 7(2), 22; https://0-doi-org.brum.beds.ac.uk/10.3390/econometrics7020022
Submission received: 20 April 2019
/
Revised: 15 May 2019
/
Accepted: 15 May 2019
/
Published: 21 May 2019
Abstract
:In empirical applications based on linear regression models, structural changes often occur in both the error variance and regression coefficients, possibly at different dates. A commonly applied method is to first test for changes in the coefficients (or in the error variance) and, conditional on the break dates found, test for changes in the variance (or in the coefficients). In this note, we provide evidence that such procedures have poor finite sample properties when the changes in the first step are not correctly accounted for. In doing so, we show that testing for changes in the coefficients (or in the variance) ignoring changes in the variance (or in the coefficients) induces size distortions and loss of power. Our results illustrate a need for a joint approach to test for structural changes in both the coefficients and the variance of the errors. We provide some evidence that the procedures suggested by Perron et al. (2019) provide tests with good size and power.
JEL Classification:
C12; C381. Introduction
In a companion paper, Perron et al. (2019) provided a comprehensive treatment of the problem of testing jointly for structural changes in both the regression coefficients and the variance of the errors in a single equation regression model involving stationary regressors, allowing the break dates for the two components to be different or overlap. Their framework is quite general with assumptions no stronger than those in Qu and Perron (2007). The distribution of the errors can be non-normal and conditional heteroskedasticity is permissible. Extensions to the case with serially correlated errors were also covered. They also provided the required tools to address the following testing problems, among others: (a) Testing for given numbers of changes in regression coefficients and error variance; (b) testing for an unknown number of changes less than a pre-specified maximum; (c) testing for changes in variance (regression coefficients) allowing for a given number of changes in regression coefficients (variance); and (d) a sequential procedure to estimate the number of changes present.
When testing for a change in the error variance, many studies ignore the possibility of changes in coefficients and simply apply standard sup-Wald type tests (e.g., Andrews 1993; Bai and Perron 1998) for changes in the mean of the absolute value of the estimated residuals (e.g., Herrera and Pesavento 2005; Stock and Watson 2002). For the problem of testing for a change in variance only (imposing no change in the regression coefficients), a more appropriate test is the cumulative sum of squares (CUSQ) test of Brown et al. (1975), extended by Deng and Perron (2008a), to allow general conditions on the regressors and the errors (as suggested by Inclán and Tiao 1994, for normally distributed time series). However, this test is adequate only with no change in coefficient. Similarly, when testing for a change in coefficients, most works simply use a similar sup-Wald test applied to the regression coefficients, ignoring the possibility of a variance change. It is often the case that changes in both coefficients and variance occur and the break dates need not be the same. Also, a common two-step method is to first tests for changes in the regression coefficients and conditioning on the break dates found, then test for changes in variance. As will be shown in this note, all three approaches are clearly inappropriate as they suffer from severe size distortions and/or loss of power. Hence, what is needed is a joint approach when changes are suspected in both the coefficients and variance. This was covered in Perron et al. (2019) and we present simulation results showing that their procedures yield tests with good size and power.
In this note, we first assess the finite sample properties of structural change tests in coefficients when changes in the error variance are ignored. We then consider the properties of the CUSQ test which tests for changes in the error variance ignoring possible changes in the coefficients. We also consider the two-step method to test for a change in the error variance. All methods are shown to suffer from important size distortions and/or power losses. We then present evidence that the joint approach of Perron et al. (2019) provides tests with good size and power. Our work is related to that of Pitarakis (2004) and can be viewed as complementary although the tests considered are different. When testing for changes in coefficient, Pitarakis considers the sup-Lagrange Multiplier (LM) test (e.g., Andrews 1993) which is often prone to important conservative size distortions, while we consider the sup-Likelihood Ratio (LR) test. When testing for changes in variance, he also considers some LM-type test, while we focus on the CUSQ, shown to be valid under general conditions by Deng and Perron (2008a). He also considers only the issue of size distortions, while we also present results related to power. Finally, we also consider the properties of the commonly used two-step method discussed above to detect a change in variance. His work contains theoretical results, while we solely focus on limited simulation experiments.
2. Models and Test Statistics
The data generating process (DGP) is a sequence of independent and identically distributed (i.i.d.) normal random variables with mean and variance that can change at a single date. We specify
for , where with the indicator function. To analyze the effect of ignoring a variance break on the size of tests for a change in coefficients (here the mean), we considered . We considered three break dates, and variance change varying between 0 and 10 in steps of 0.05. The sample size was set to T = 100 and 5000 replications were used. The test considered was the standard sup-LR test (see Andrews 1993) for a one-time change in μ occurring at some unknown date. To assess the effect on power, we considered , T = 100, and varying between 0 and 2.
We considered the effect of a change in mean on the size and power of tests for a change in variance that did not take into account the former change, using two testing procedures. One was based on the CUSQ test of Brown et al. (1975) and advocated as a test for a change in variance by Inclán and Tiao (1994), who showed that it is related to the LR test for a change in variance in a sequence of i.i.d. normal random variables (though the equivalence is not exact in finite samples). Deng and Perron (2008a) generalized the conditions under which the test is valid; for example, allowing for mixing type condition on the errors that permit conditional heteroskedasticity. It is defined by
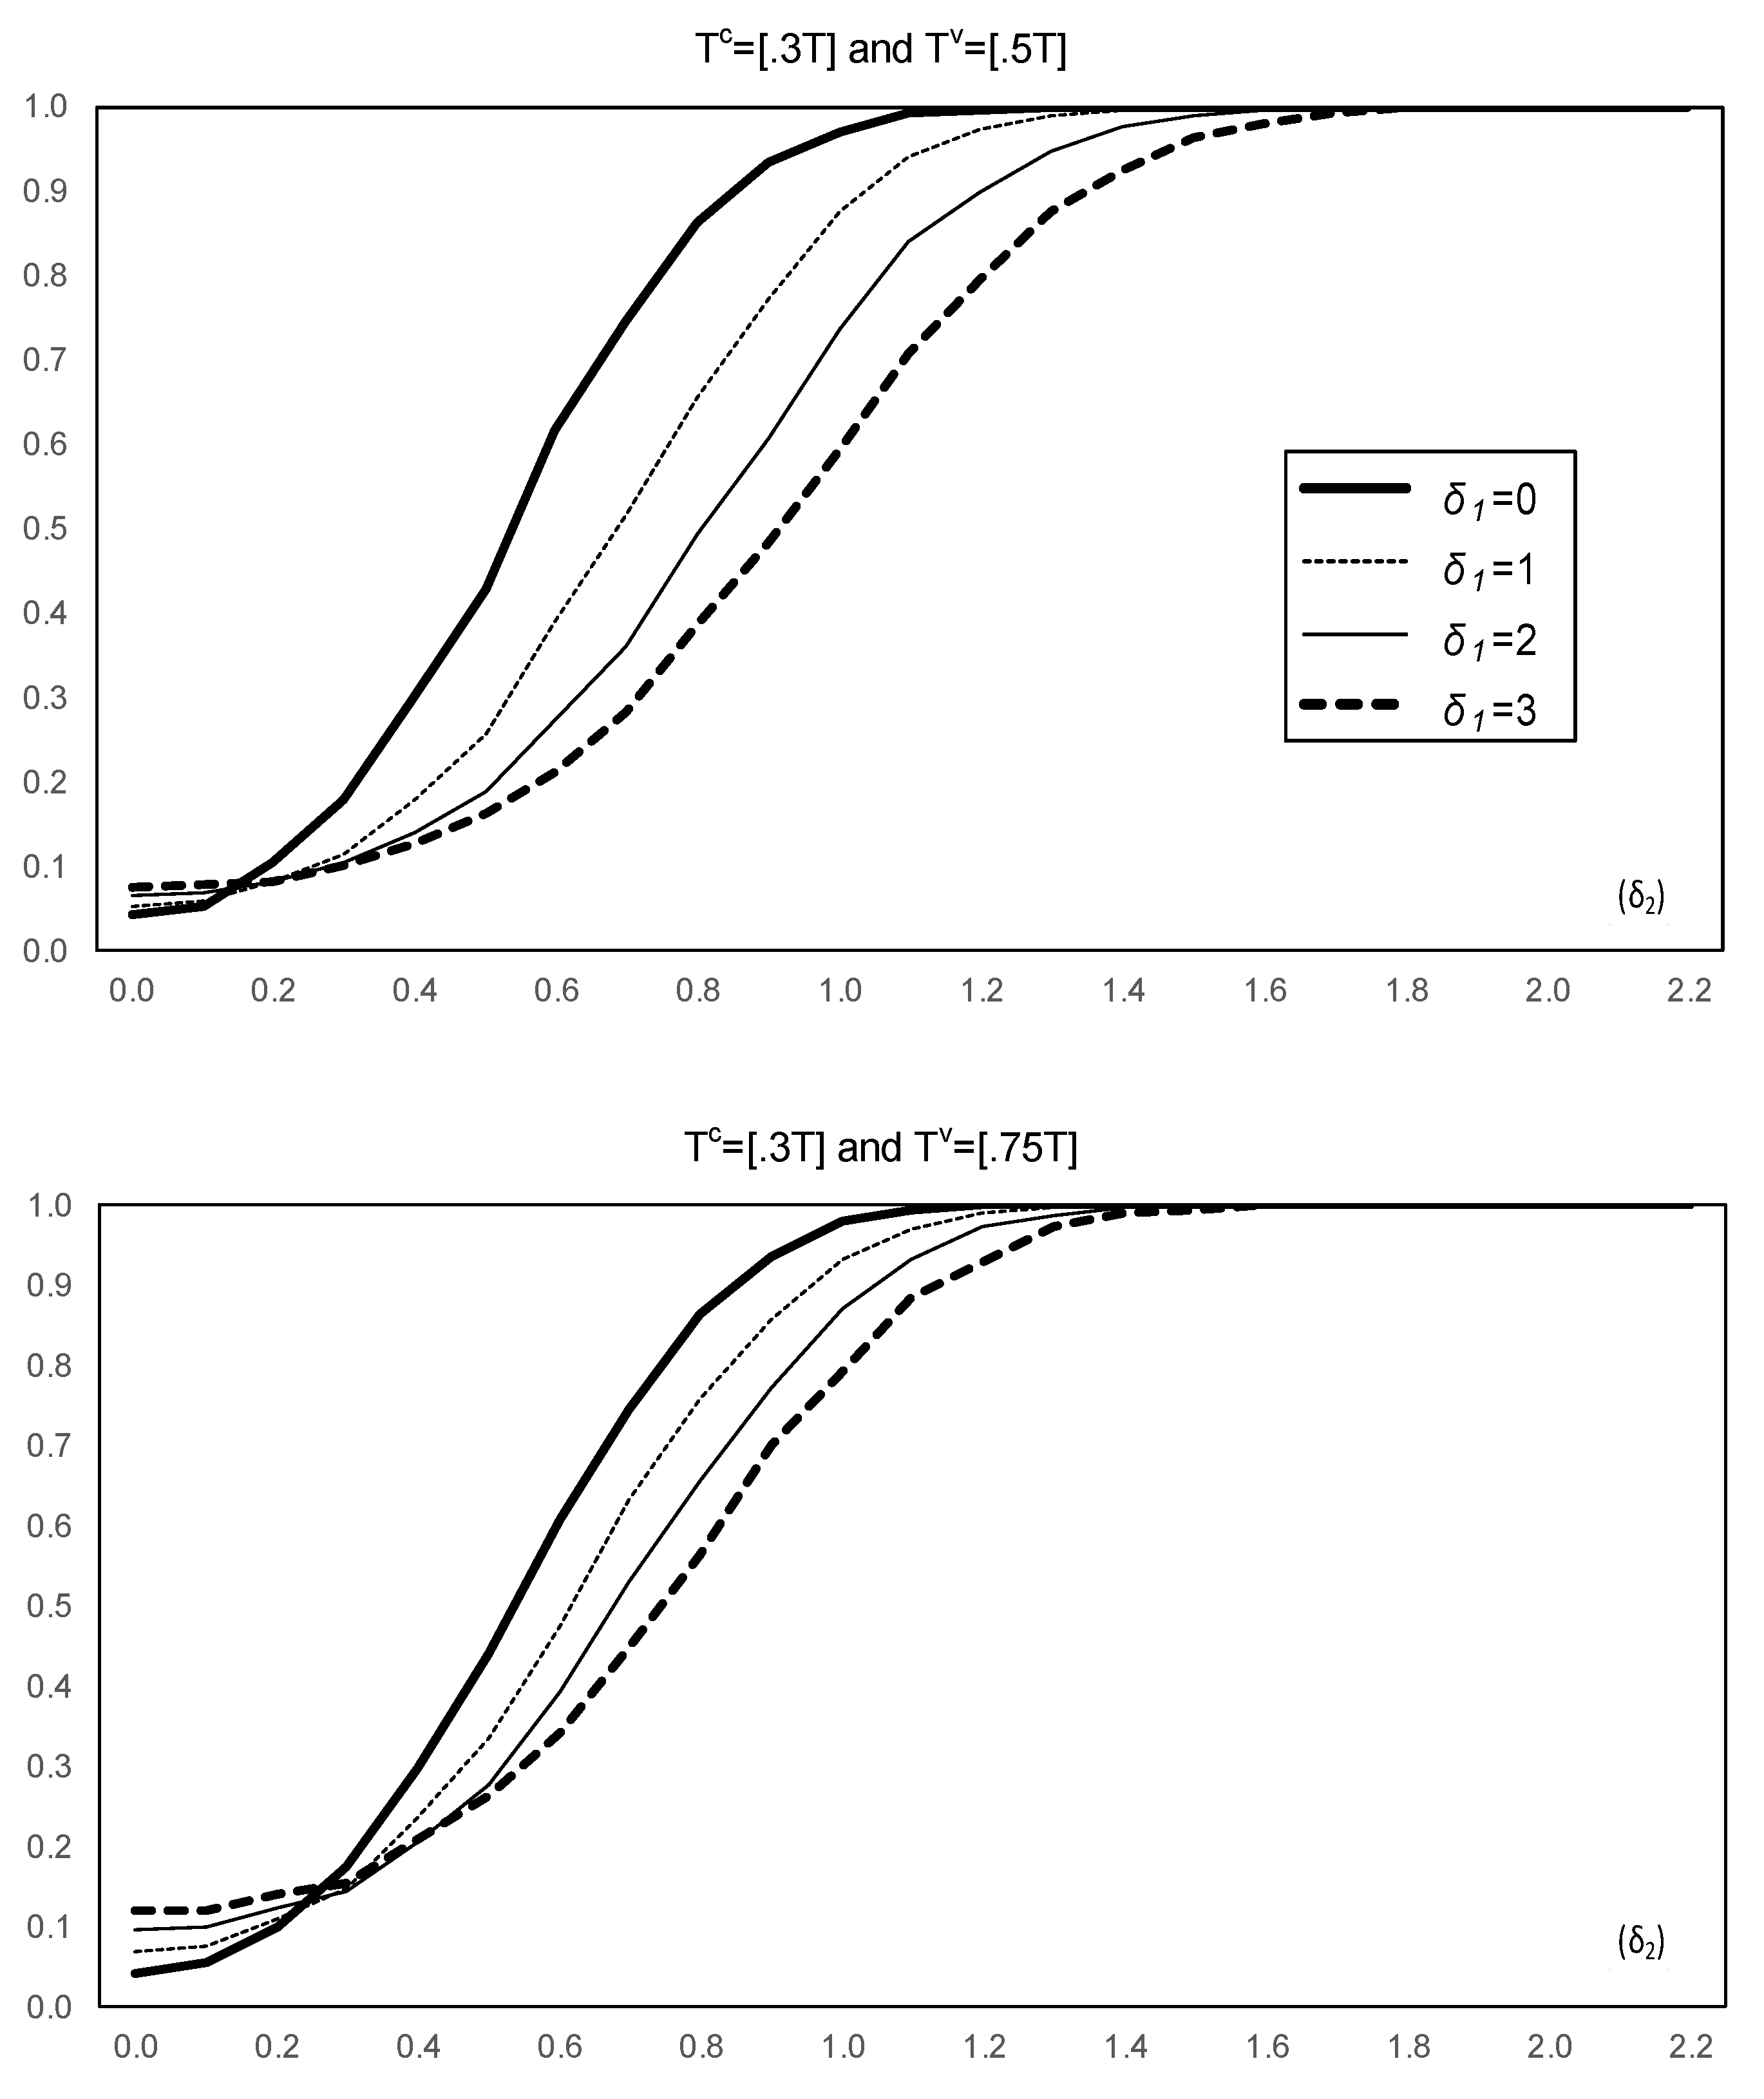
where with the recursive residuals for and the number of regressors (here, ). Here, its limit distribution under the null hypothesis is the supremum (over [0,1]) of a Brownian bridge process. To analyze the size of the test, DGP (1) with was used and we set with varying between 0 and 10. For power, DGP (1) was used again with varying between 0 and 15 and . The second procedure we considered was the two-step method used by Herrera and Pesavento (2005) and Stock and Watson (2002), among others, which applies a test for a change in the mean of the absolute value of the estimated residuals when the latter are obtained allowing for a change in the regression coefficients (here the mean) ignoring the possibility of a break in the error variance. Again, DGP (1) was used to assess the size () and power properties. For size, varied between 0 and 10 and we set , while for power varied between 0 and 3 and we considered two sets of break dates, namely and .
3. Results
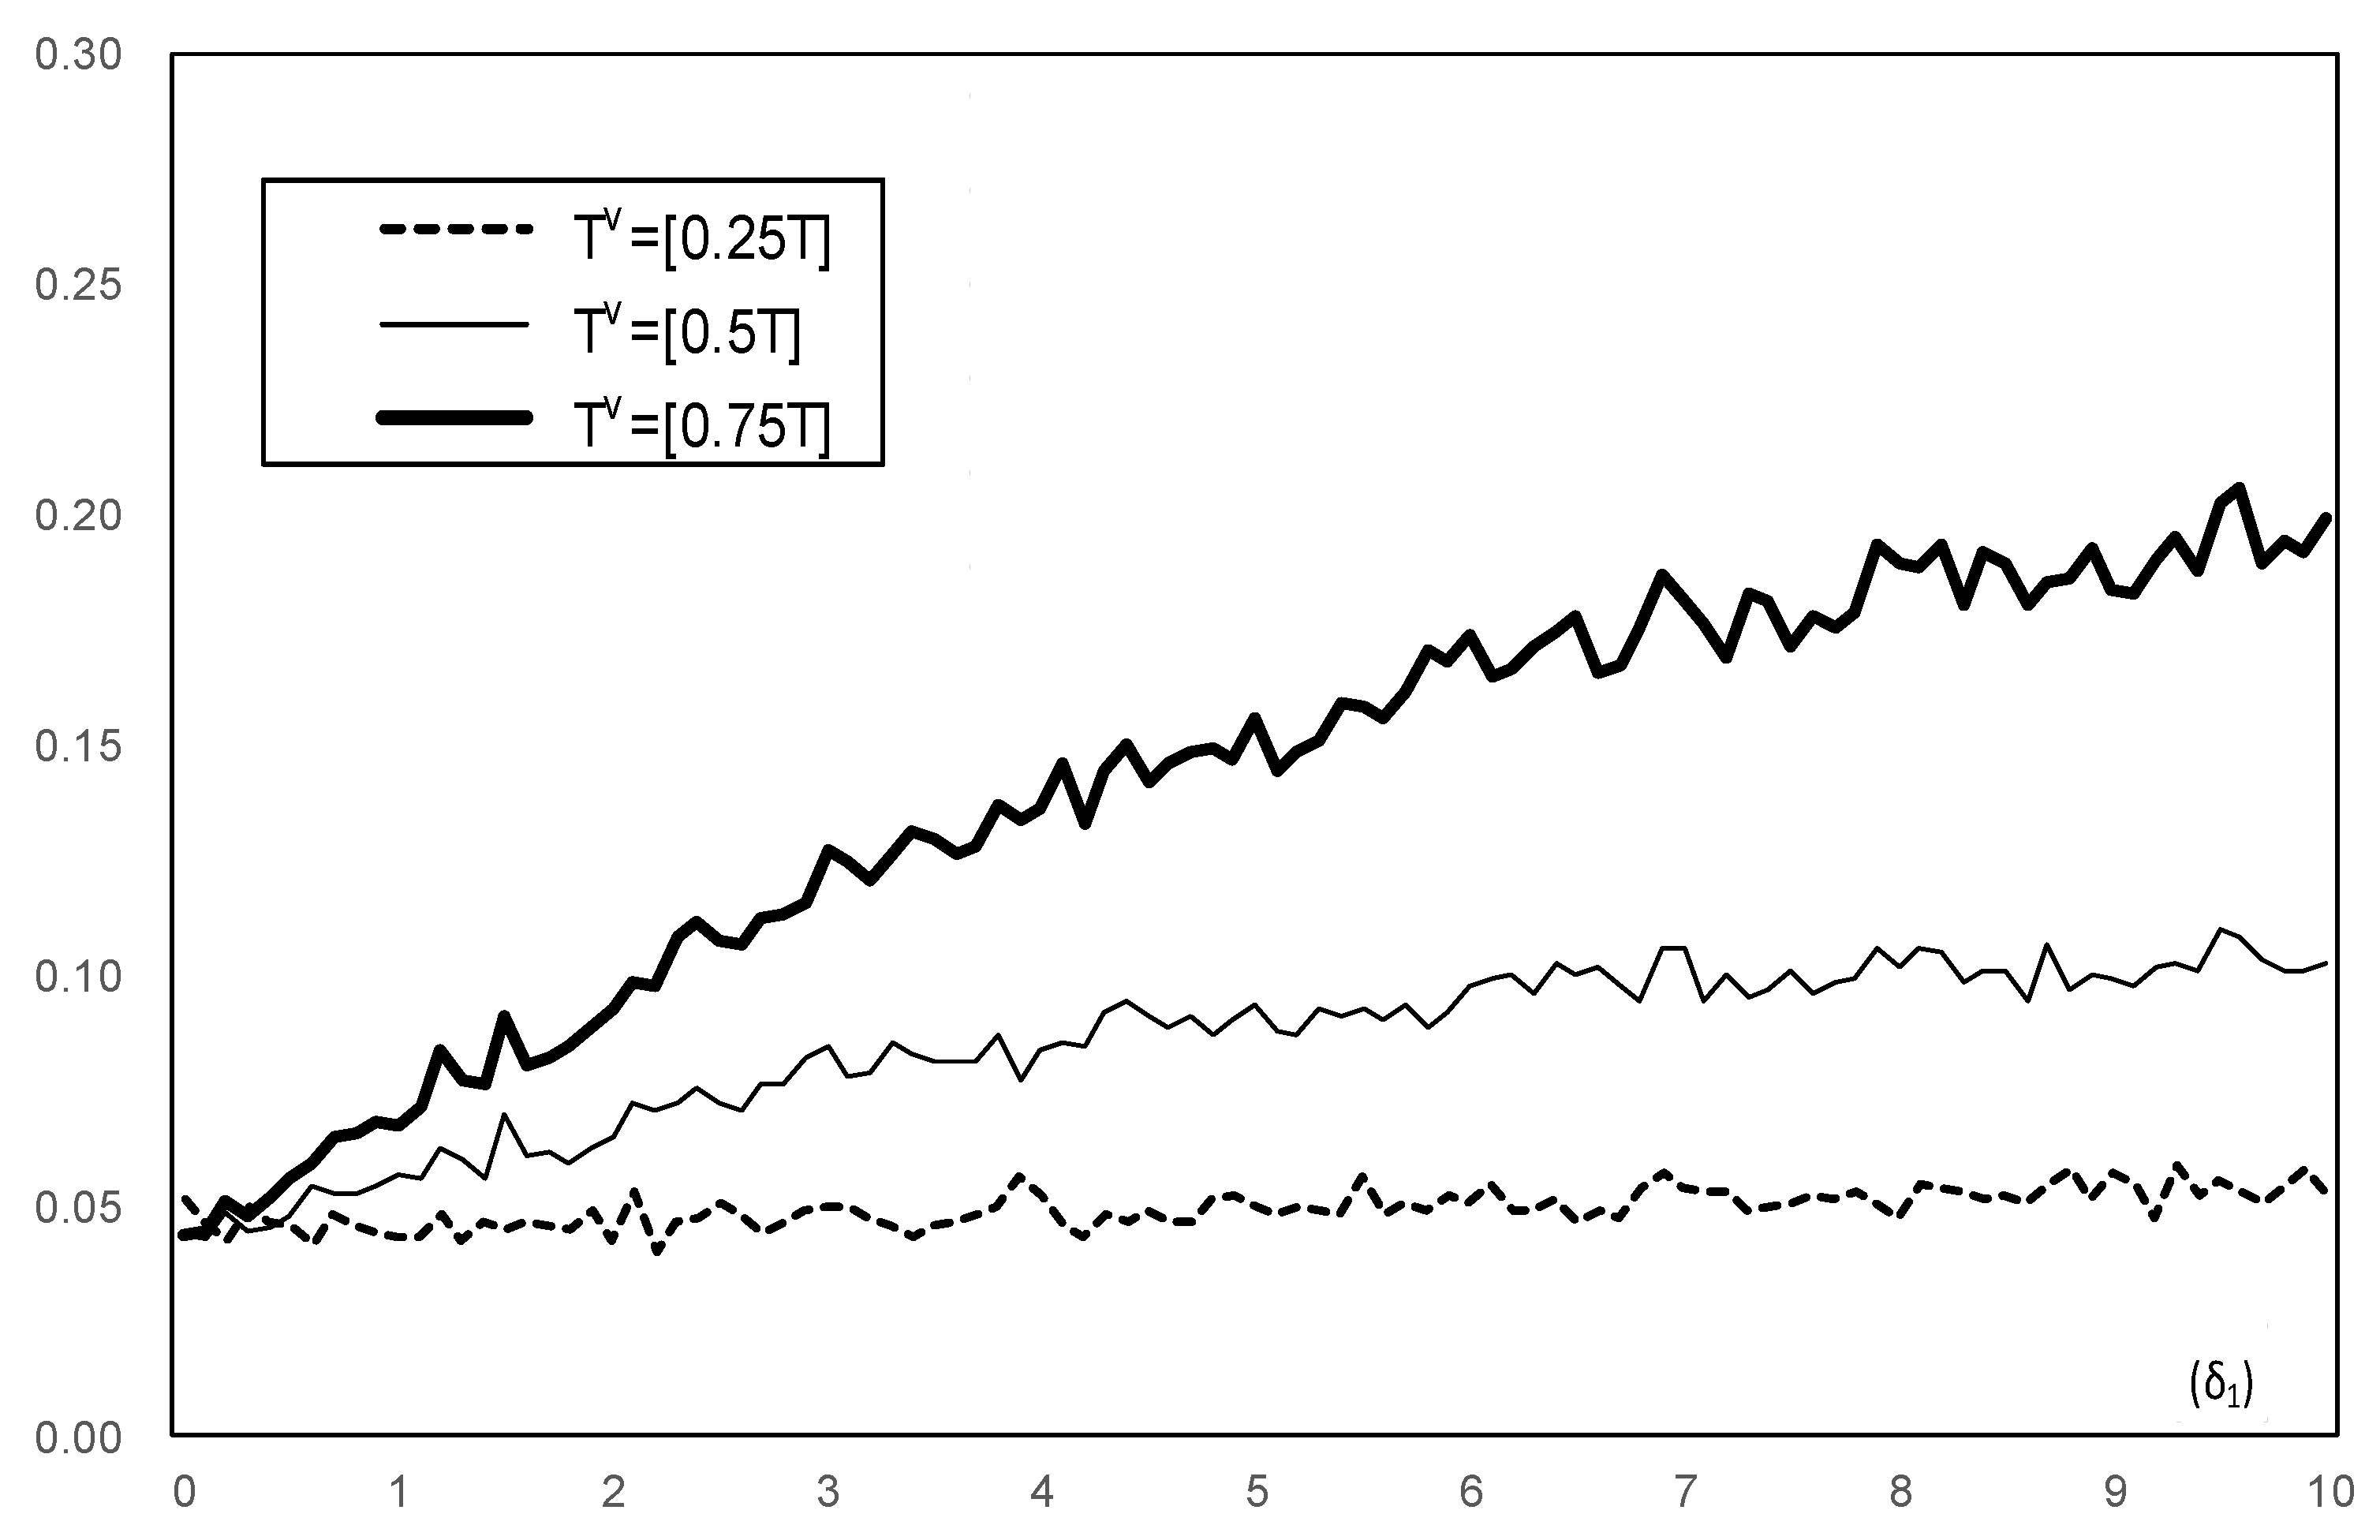
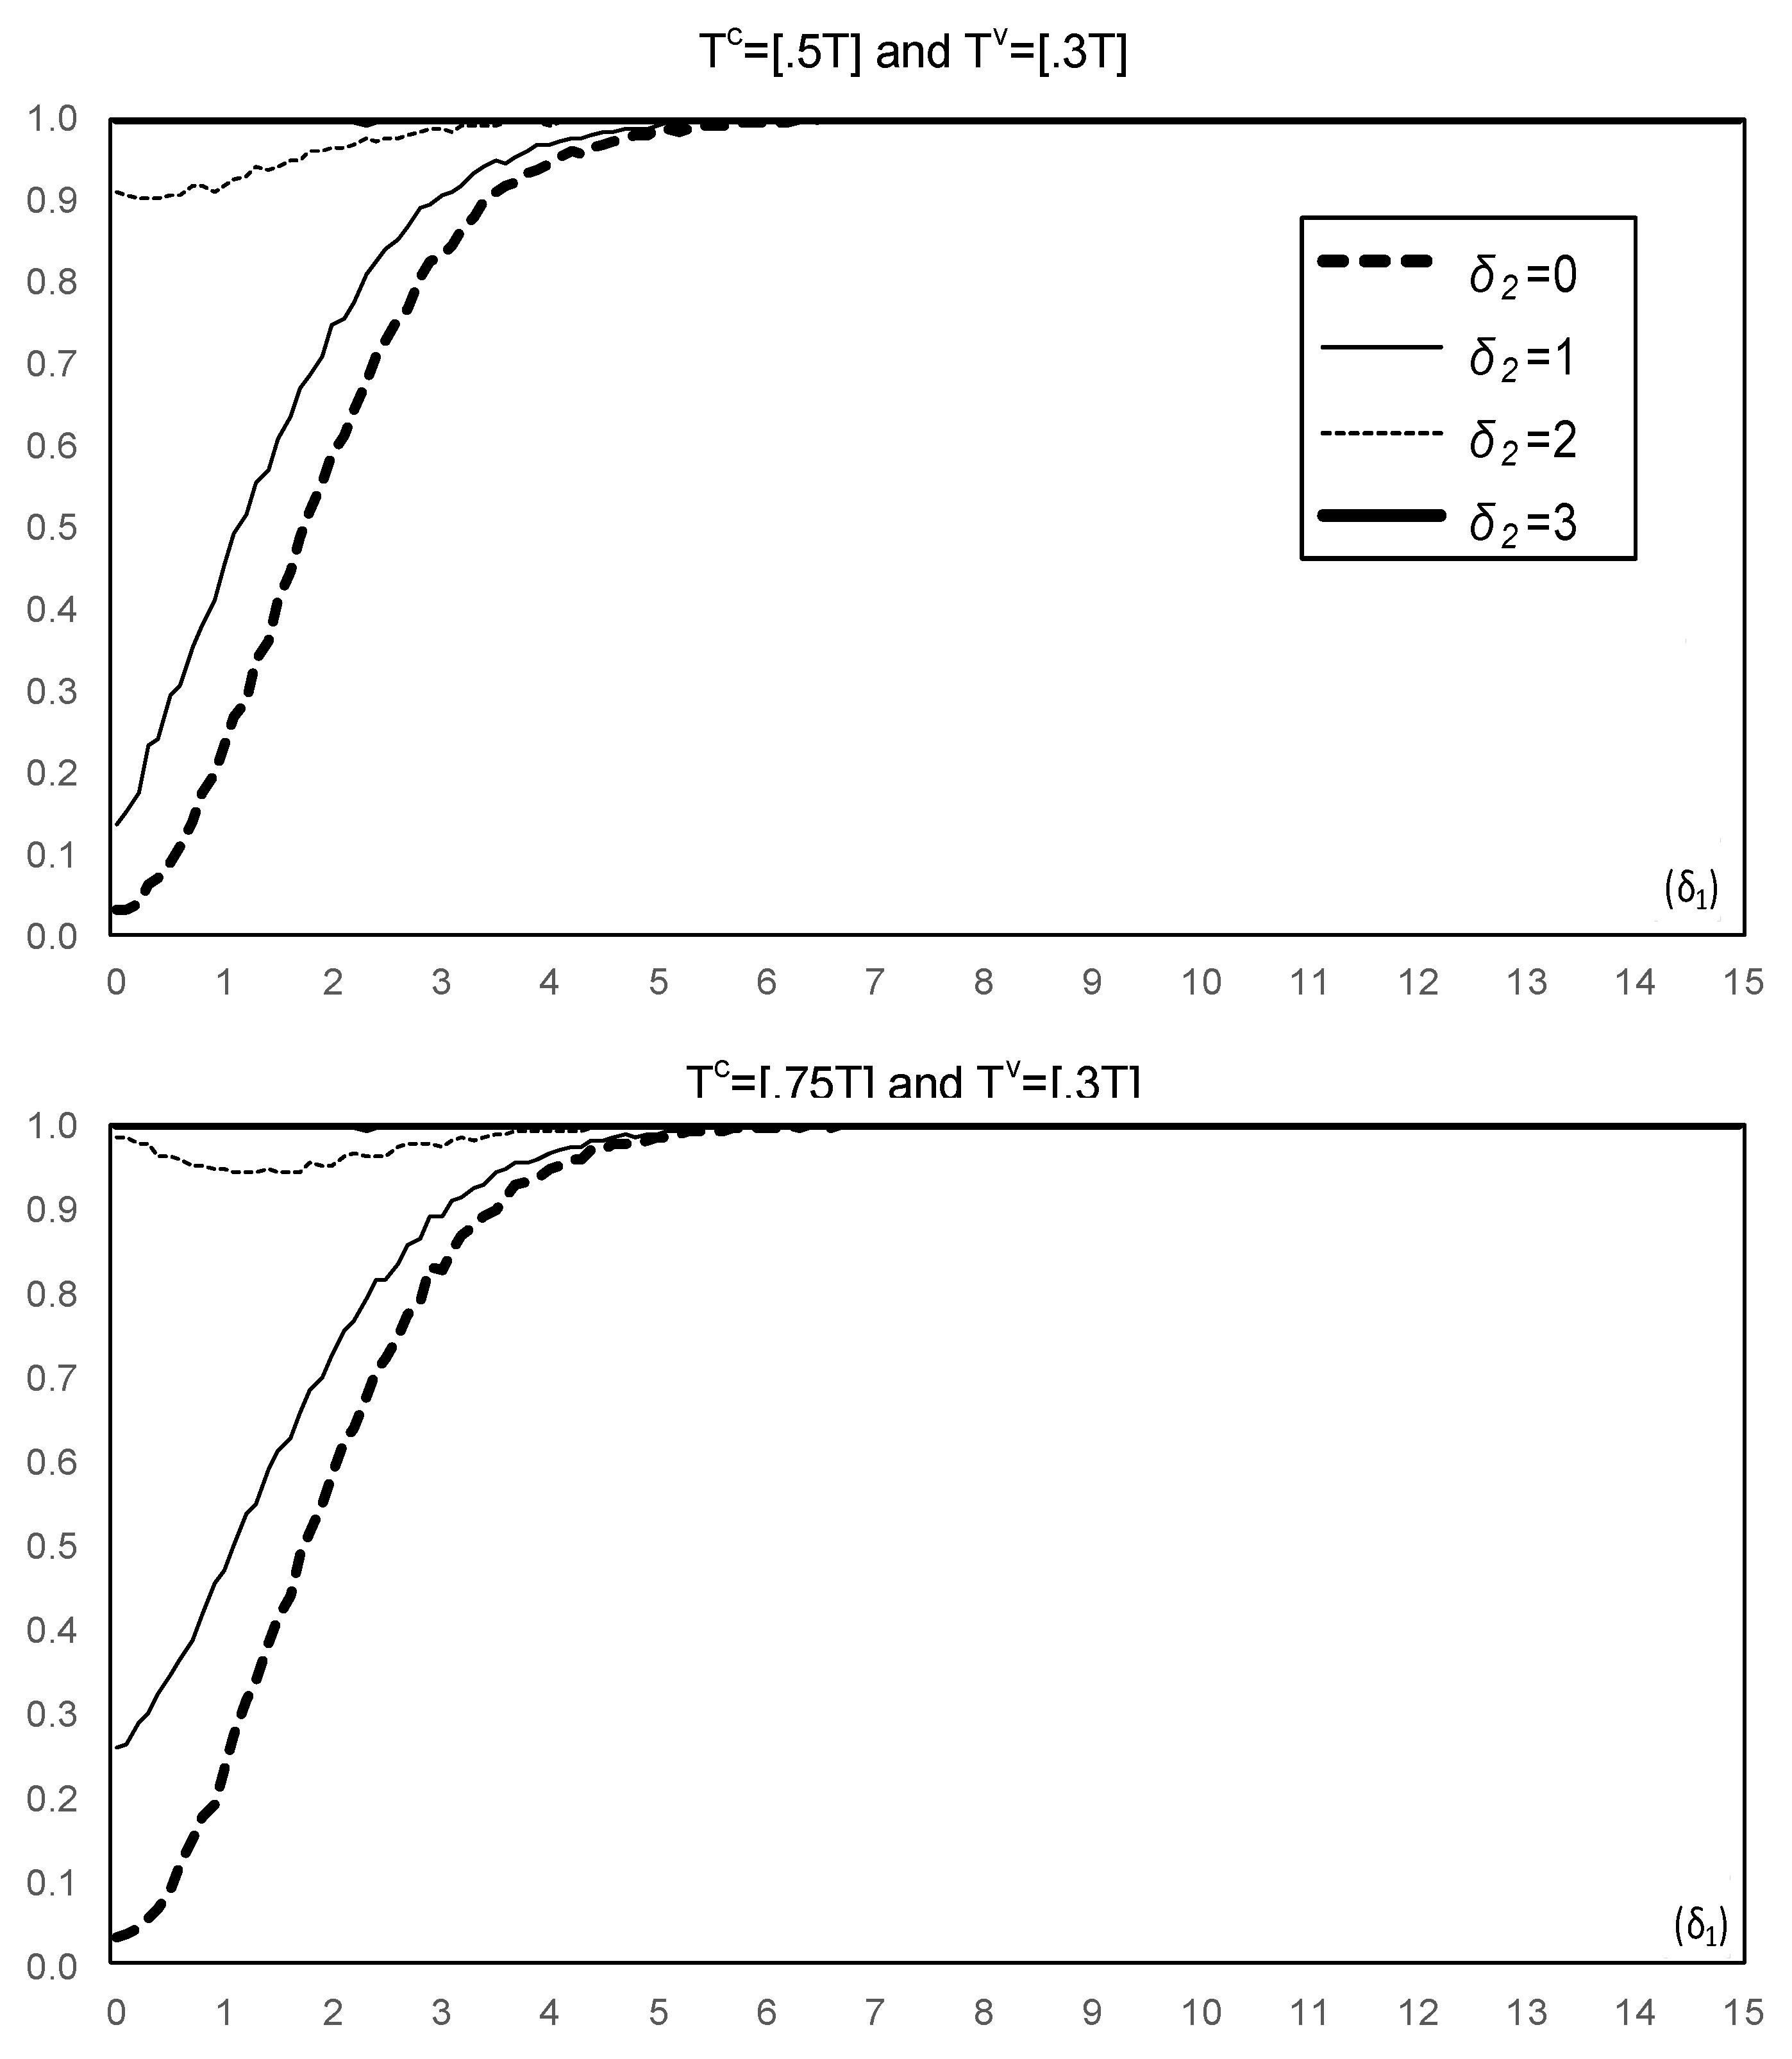
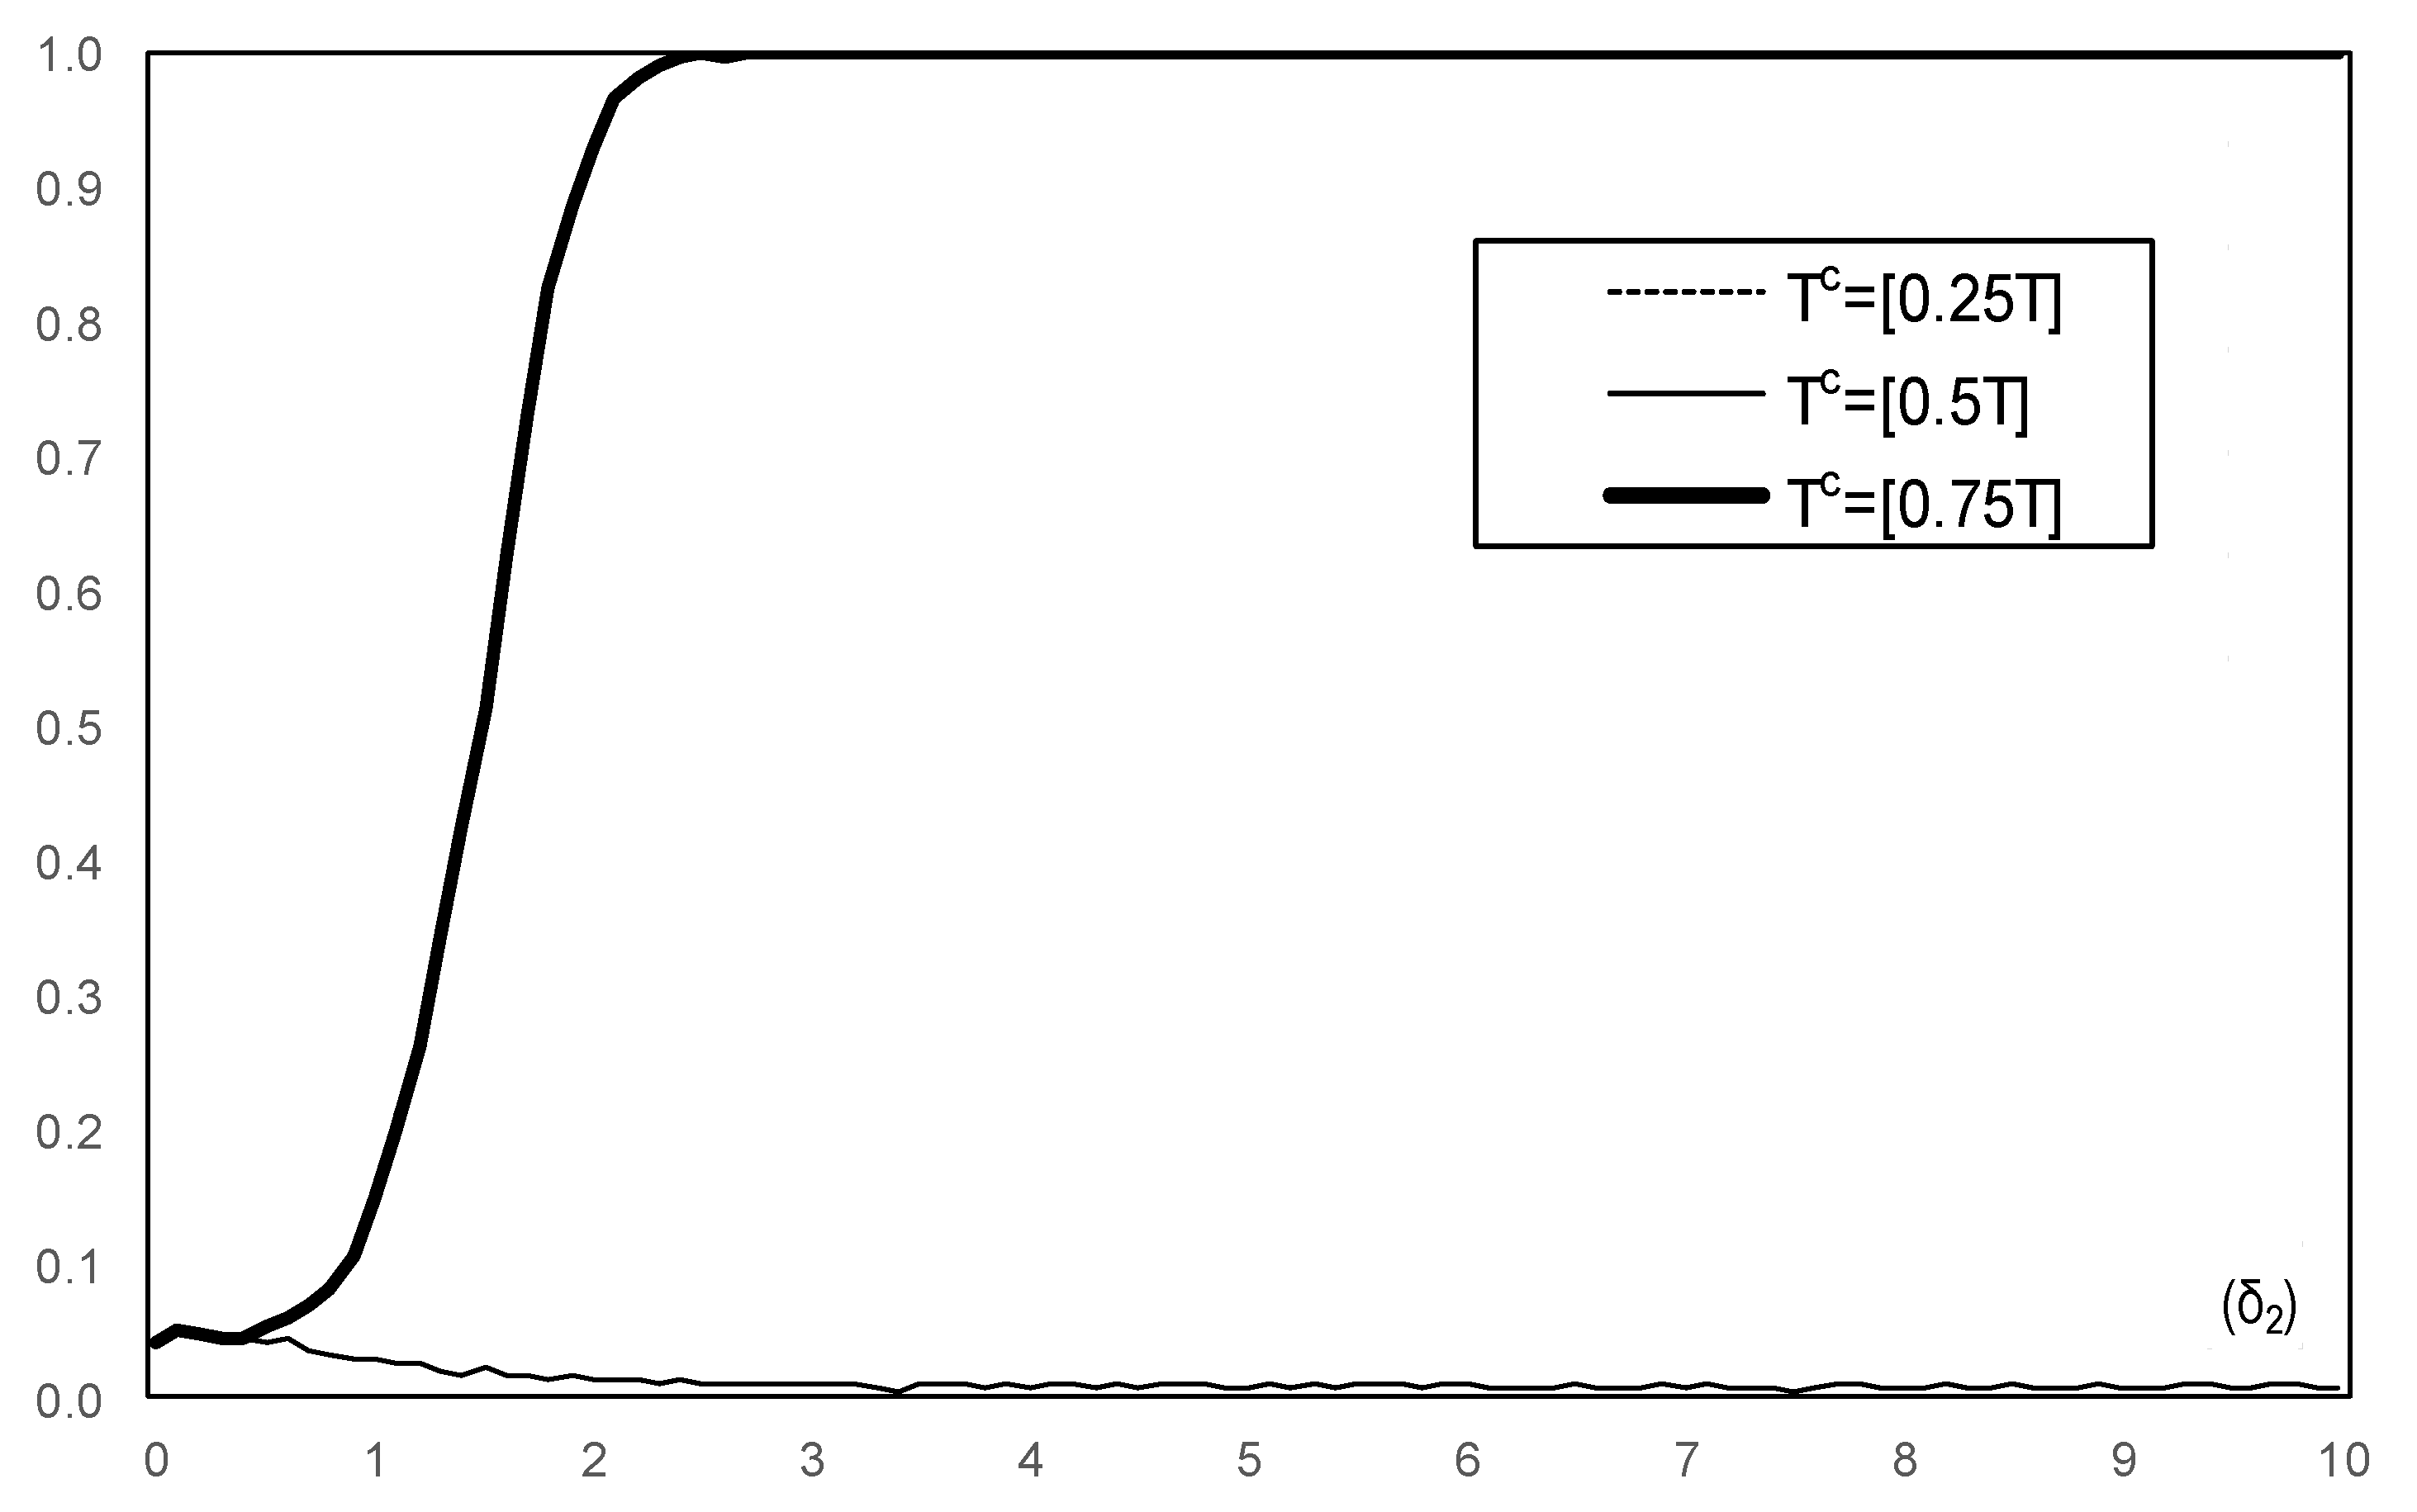
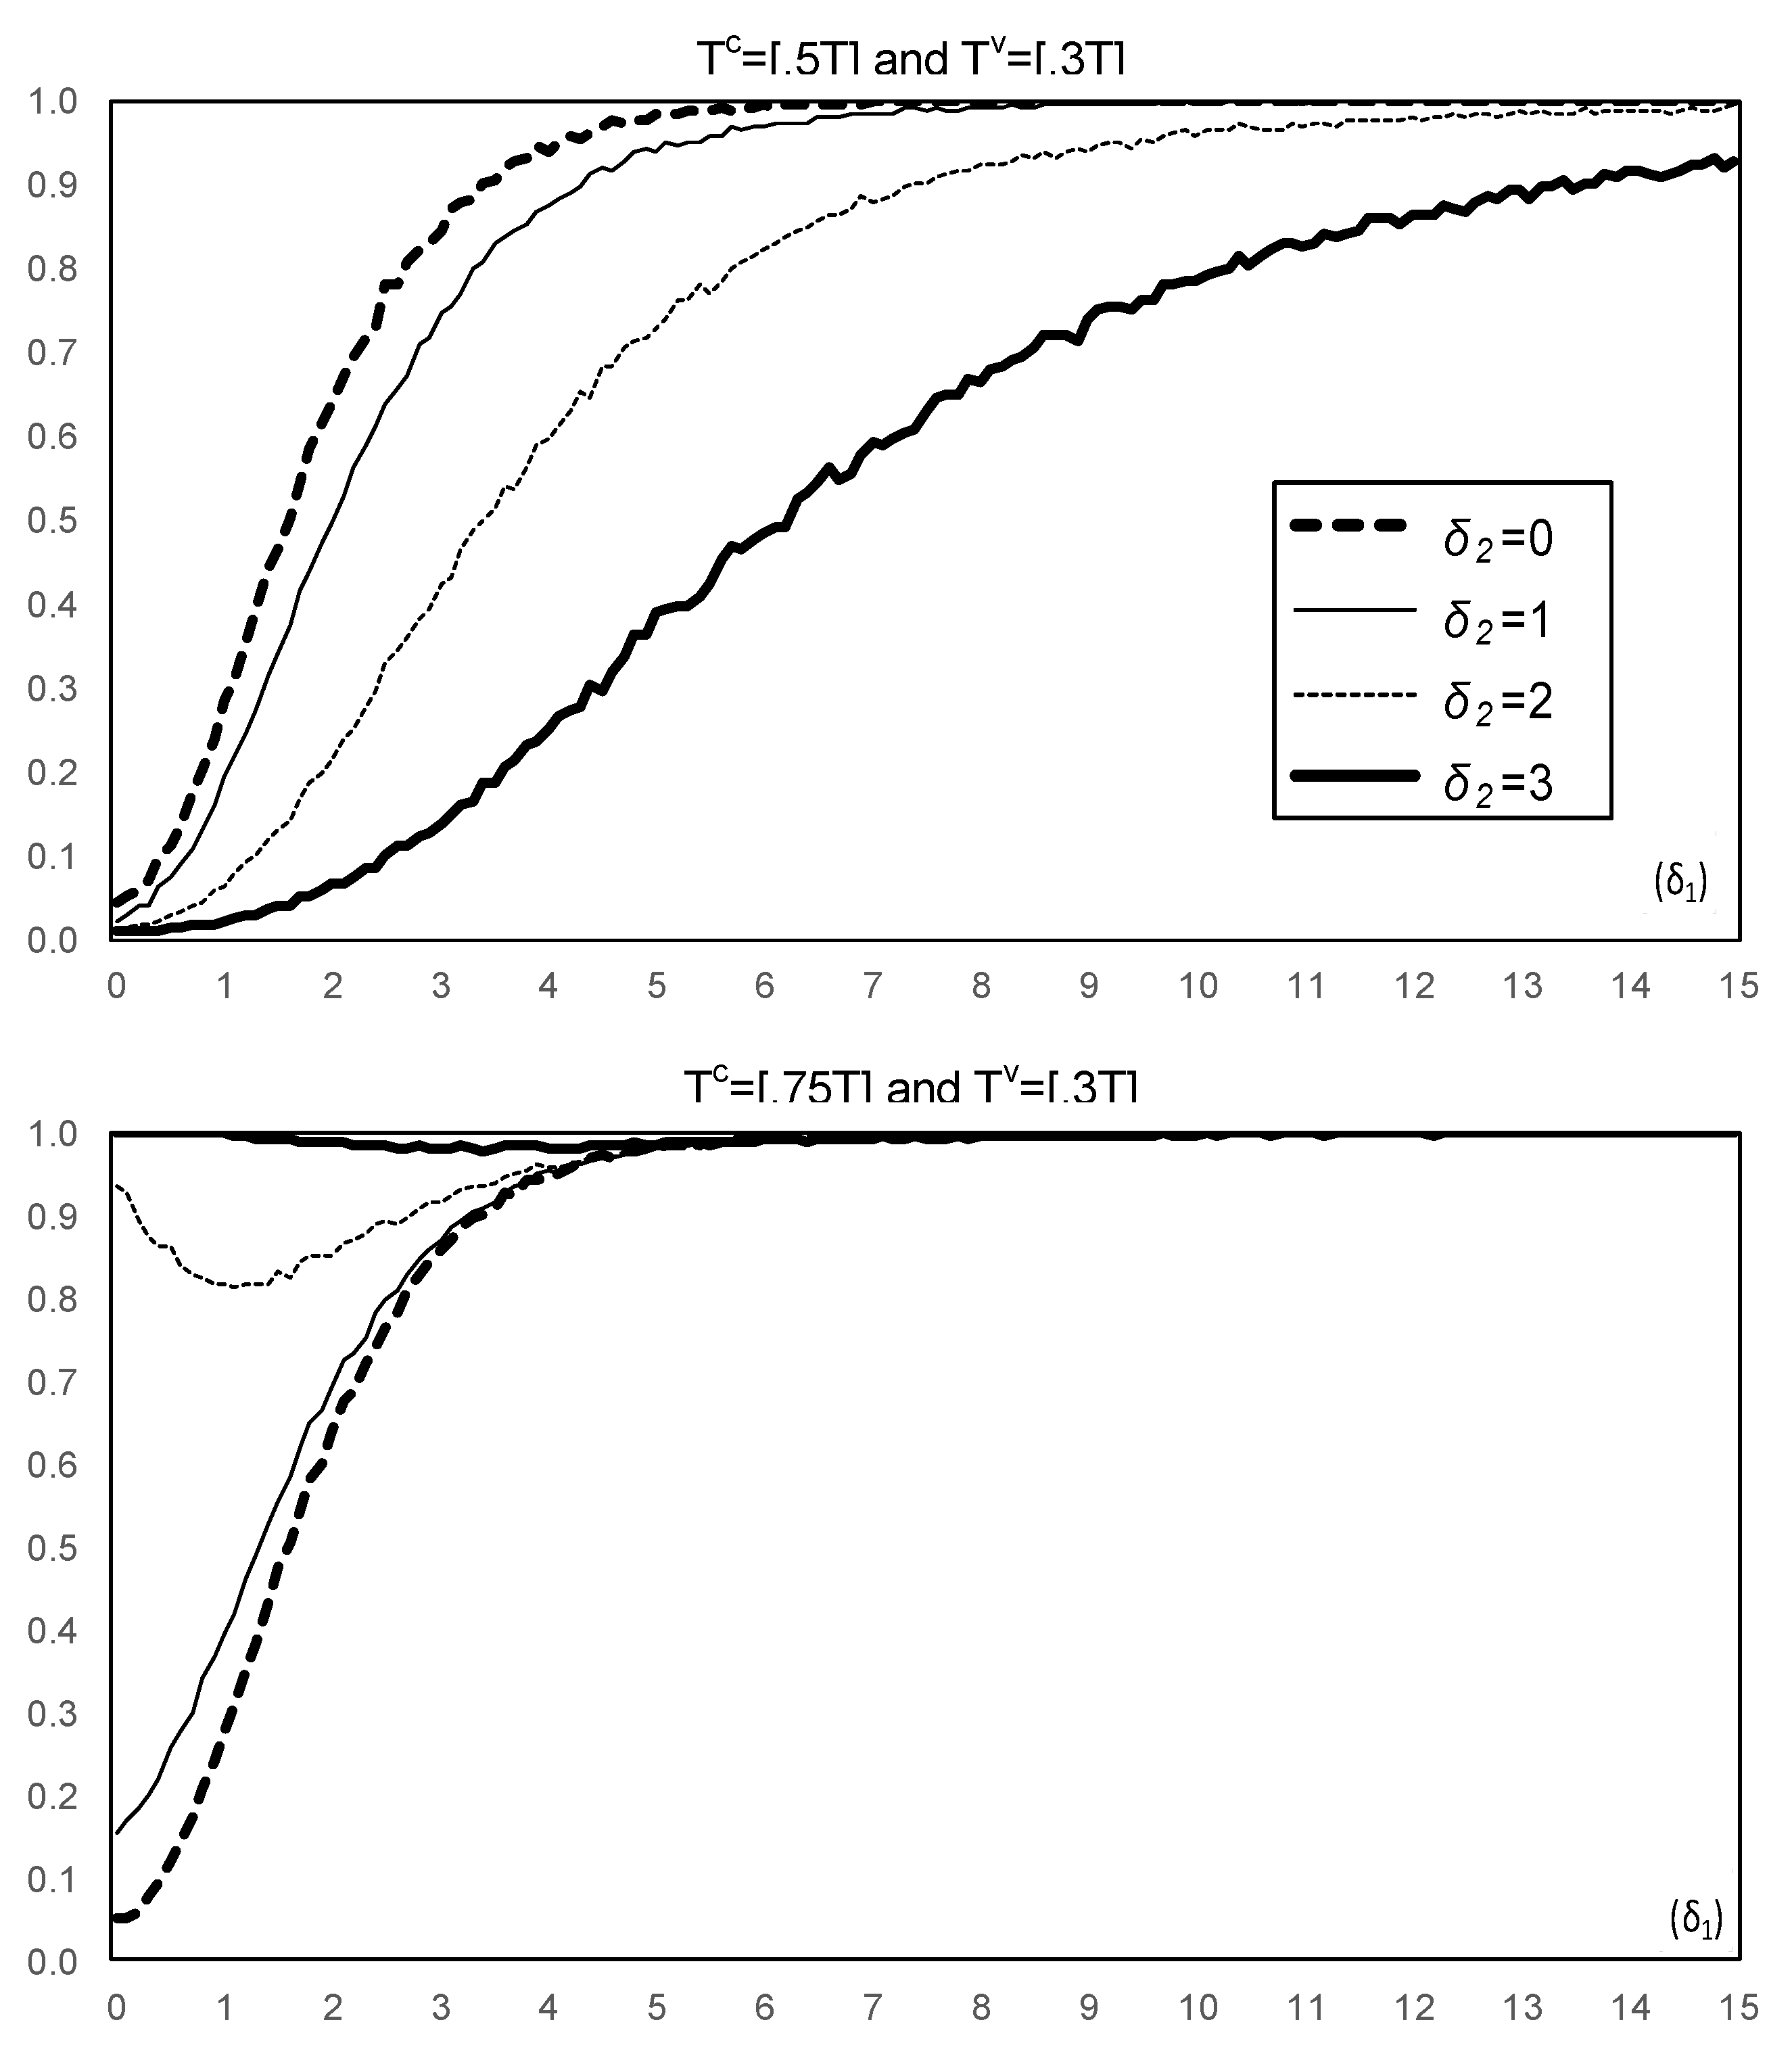
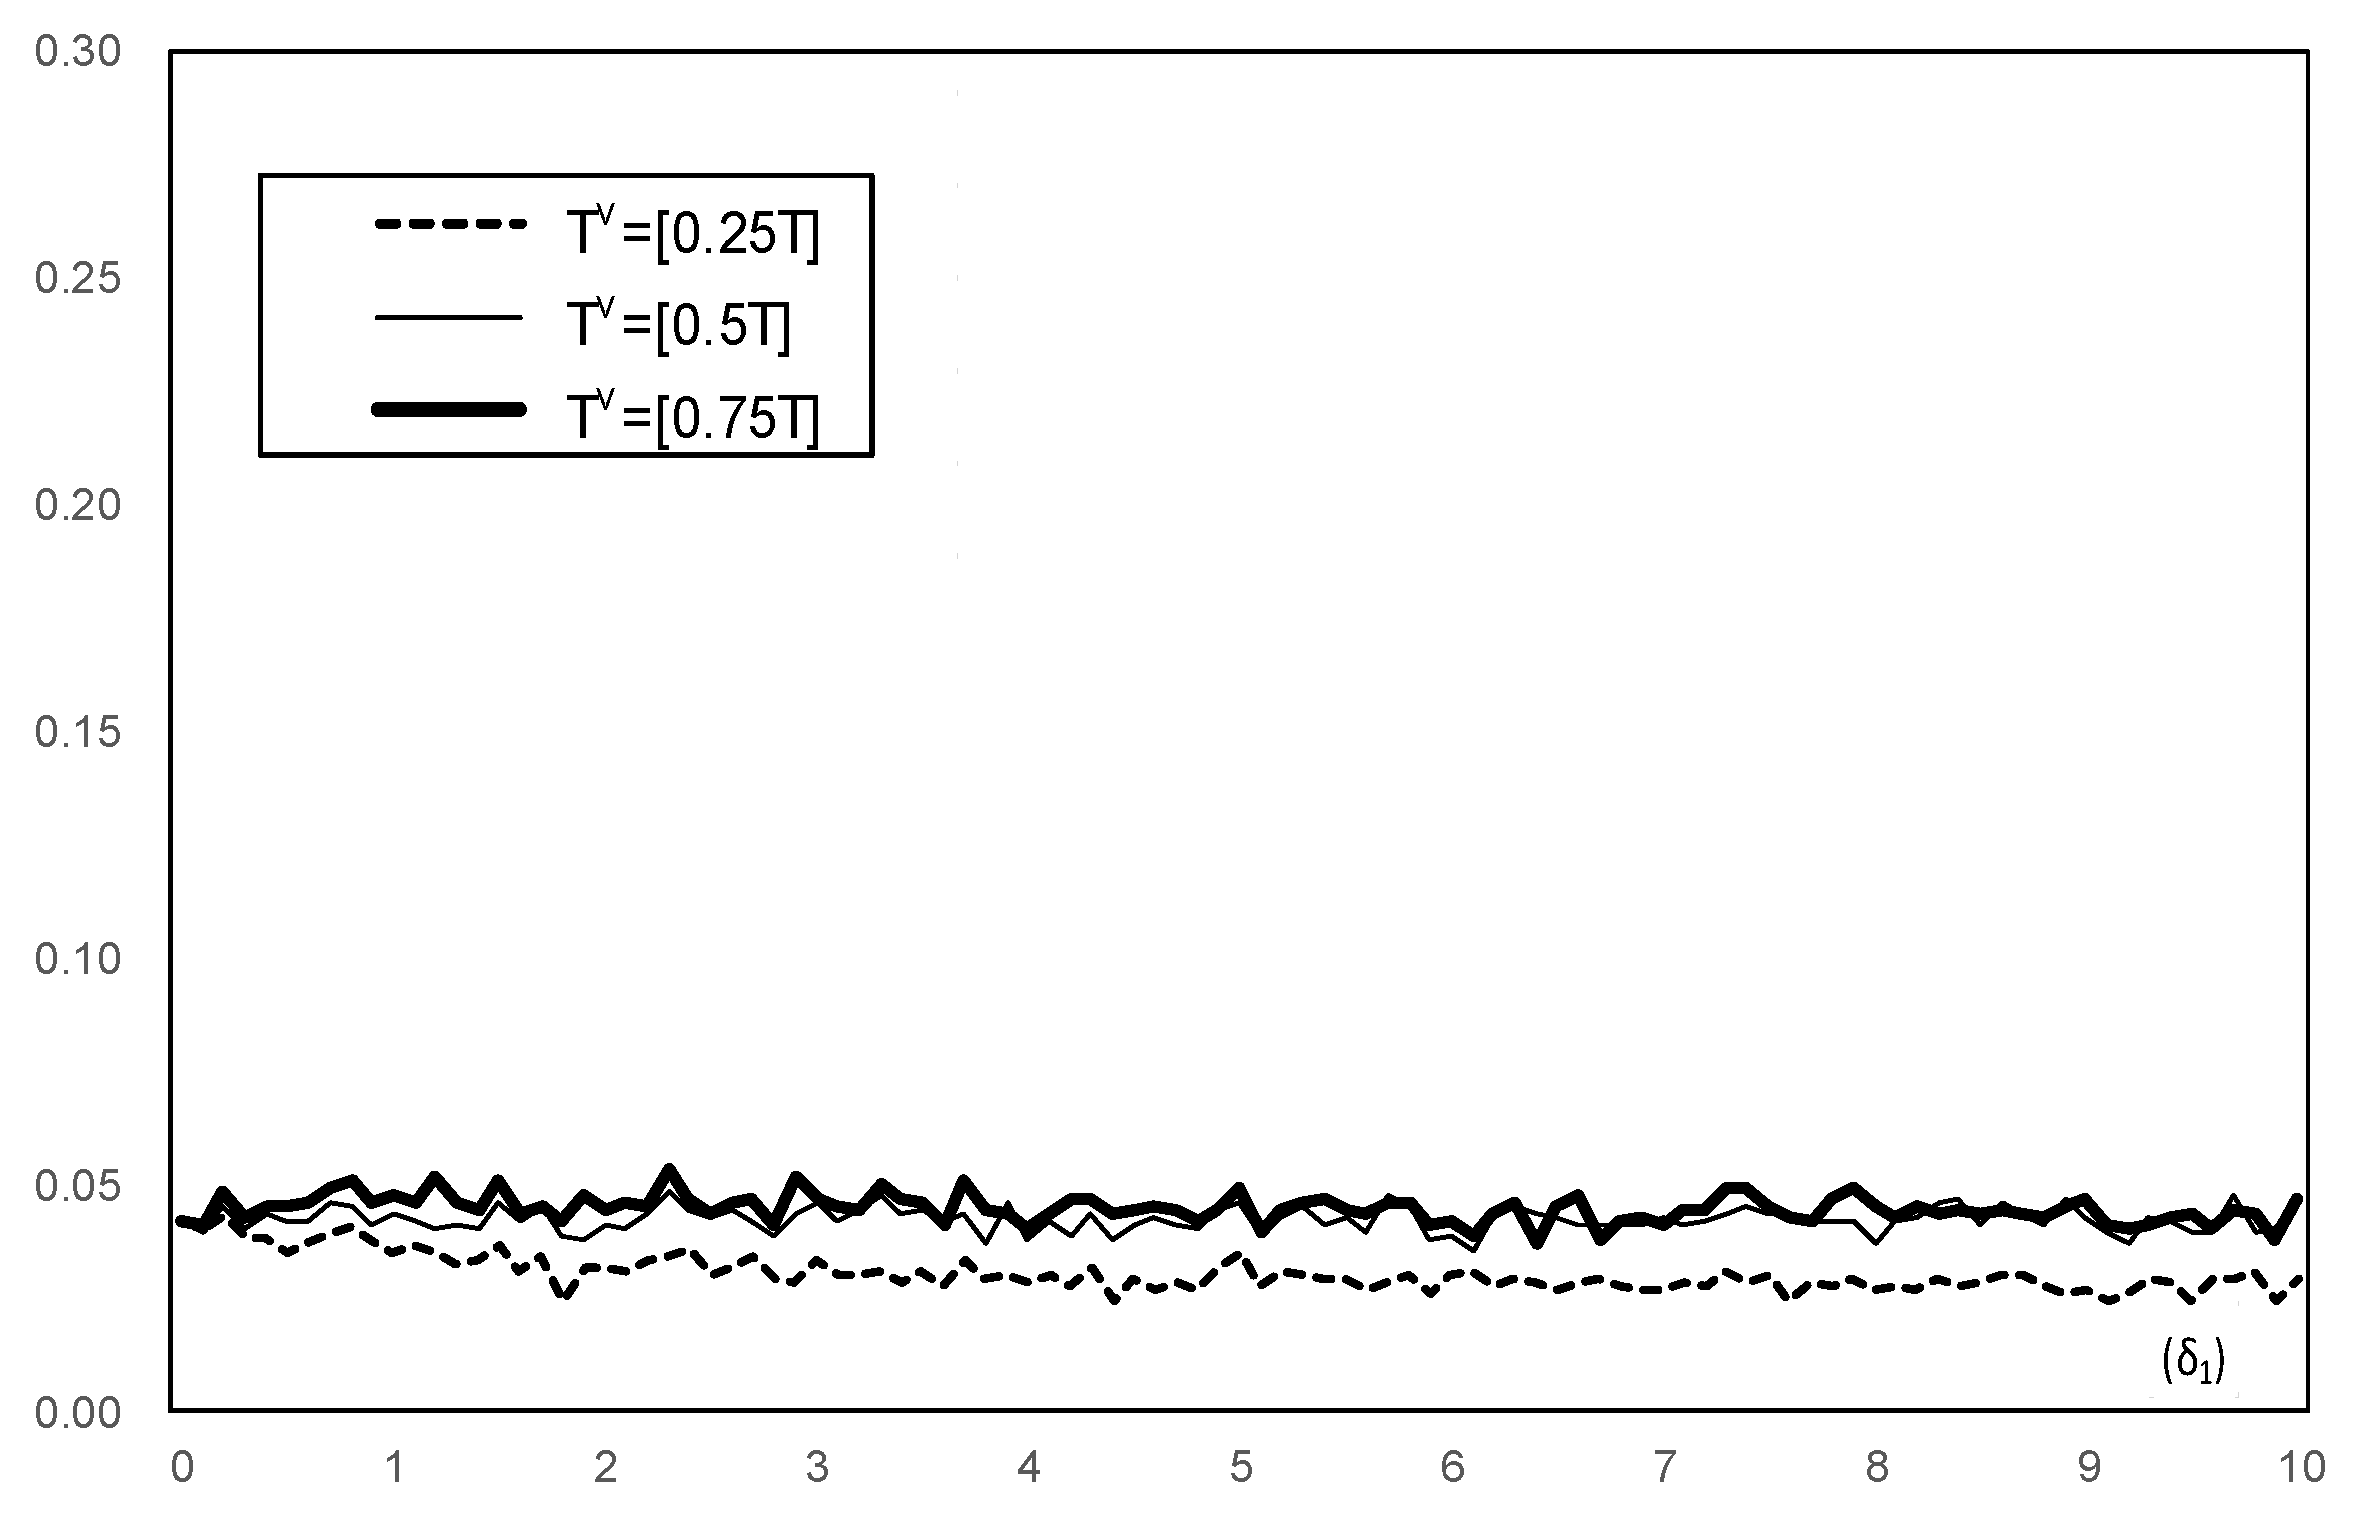
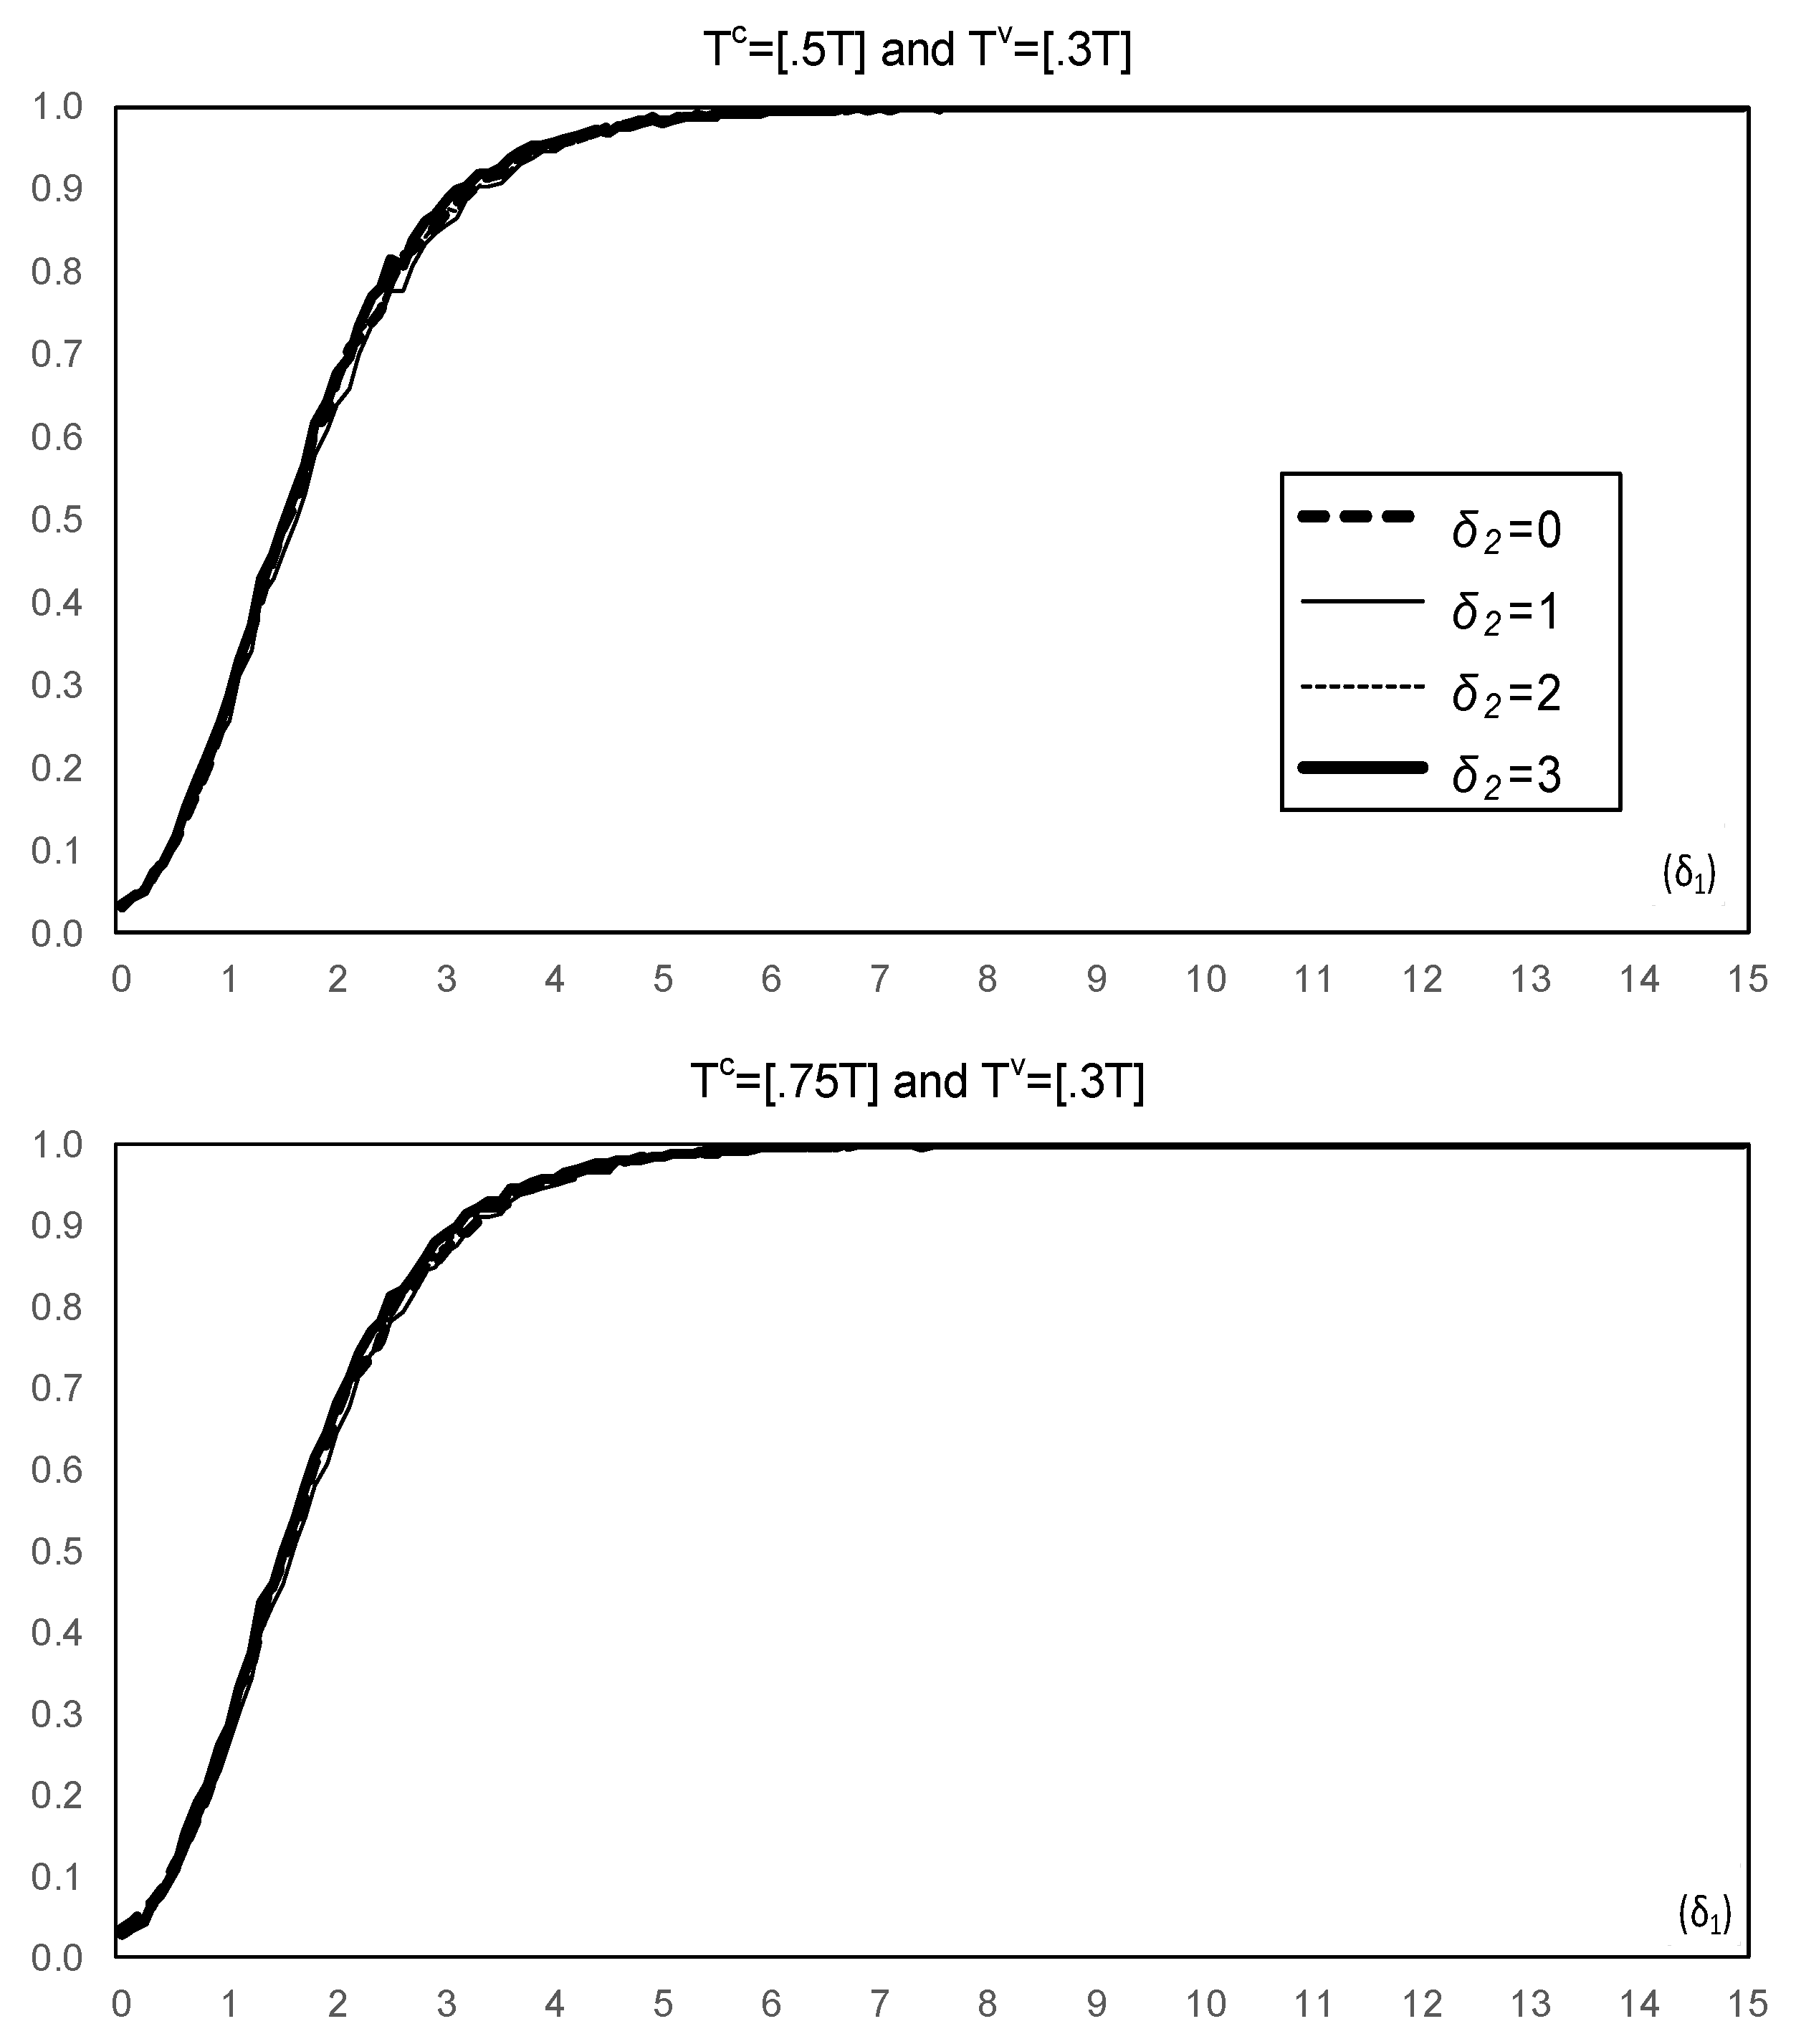
The size of the sup-LR test for a change in under DGP (1) is presented in Figure 1. The results show important size distortions unless the break occurred early at , increasing with . The results for power under the DGP (1) are presented in Figure 2, which show that power decreases as the magnitude of increases. We next considered the results when testing for variance changes. The size of the CUSQ test (2) ignoring a coefficient change is presented in Figure 3. In all cases the size of the test increases to one rapidly as the magnitude of the change in mean increases. This is not surprising in view of the fact that the CUSQ test has power against a change in the regression coefficients as originally argued by Brown et al. (1975); see also Deng and Perron (2008b). The results for power are presented in Figure 4, which show that a change in mean that is unaccounted for can increase the power of the CUSQ test. However, this result is of little help given the large size distortions. Finally, the results of the two-step method are presented in Figure 5 and Figure 6, in which we got residuals ignoring a coefficient change in the first step and tested for changes in the mean of the absolute value of the residuals in the second step. They show that the test suffers from serious size distortions, which increase as the change in mean increases. For the case of a break in mean at mid-sample, which suffers from conservative size distortions, Figure 6 shows that power decreases as the magnitude of the coefficient break increases.
An online supplement shows that the results remain qualitatively the same for the following extended cases: (a) Models with lagged dependent variables (Supplement I); (b) models with multiple structural changes (Supplement II); and (c) CUSQ tests for a change in variance that correct for potential correlation in the error variance; for example, conditional heteroskedasticity (Supplement III).
4. Tests Allowing for Joint Changes
Perron et al. (2019) provided a comprehensive treatment for the problem of testing jointly for structural changes in the regression coefficients and the variance of the errors. Here, we consider two versions of their tests to illustrate how they solve the size and power problems. The first version investigates whether a given number () of structural changes in the coefficients are present when a given number () of structural changes in the error variance are accounted for. The structural change dates for both the coefficients and the variance are unknown and occur at the same or different times. The second version considers whether n structural changes in the error variance are present when m structural changes in the regression coefficients are allowed. Following their labels, we call the former testing problem TP-3 and the latter TP-2. The hypotheses are versus for TP-3 and versus for TP-2, where and are pre-selected values. The break dates for the coefficients are denoted by , those for the error variance by and the break fractions by and , respectively. We also let the number of the union of the coefficients and the variance breaks be .
The test statistics are the quasi-likelihood ratio tests assuming i.i.d. Gaussian disturbances. For TP-3, the log-likelihood function under is
where for with . Under ,
where for with . Because the break dates are unknown, the supremum type LR test over all the permissible break dates is given by
where is the union of the set of permissible break fractions for the coefficients and variance and is a set of the permissible variance break fractions. is a small positive trimming value so that
and . Note that we denote the estimates of the break dates in coefficients and variance by a “” when these are obtained jointly, and by a “” when obtained separately. For TP-2, the sup-LR test is
where with , and . Perron et al. (2019) showed that the asymptotic distributions of these tests are bounded by limit distributions obtained in Bai and Perron (1998). Hence, somewhat conservative tests are possible using their critical values. They also show that the distortions are very minor via Monte Carlo simulations.
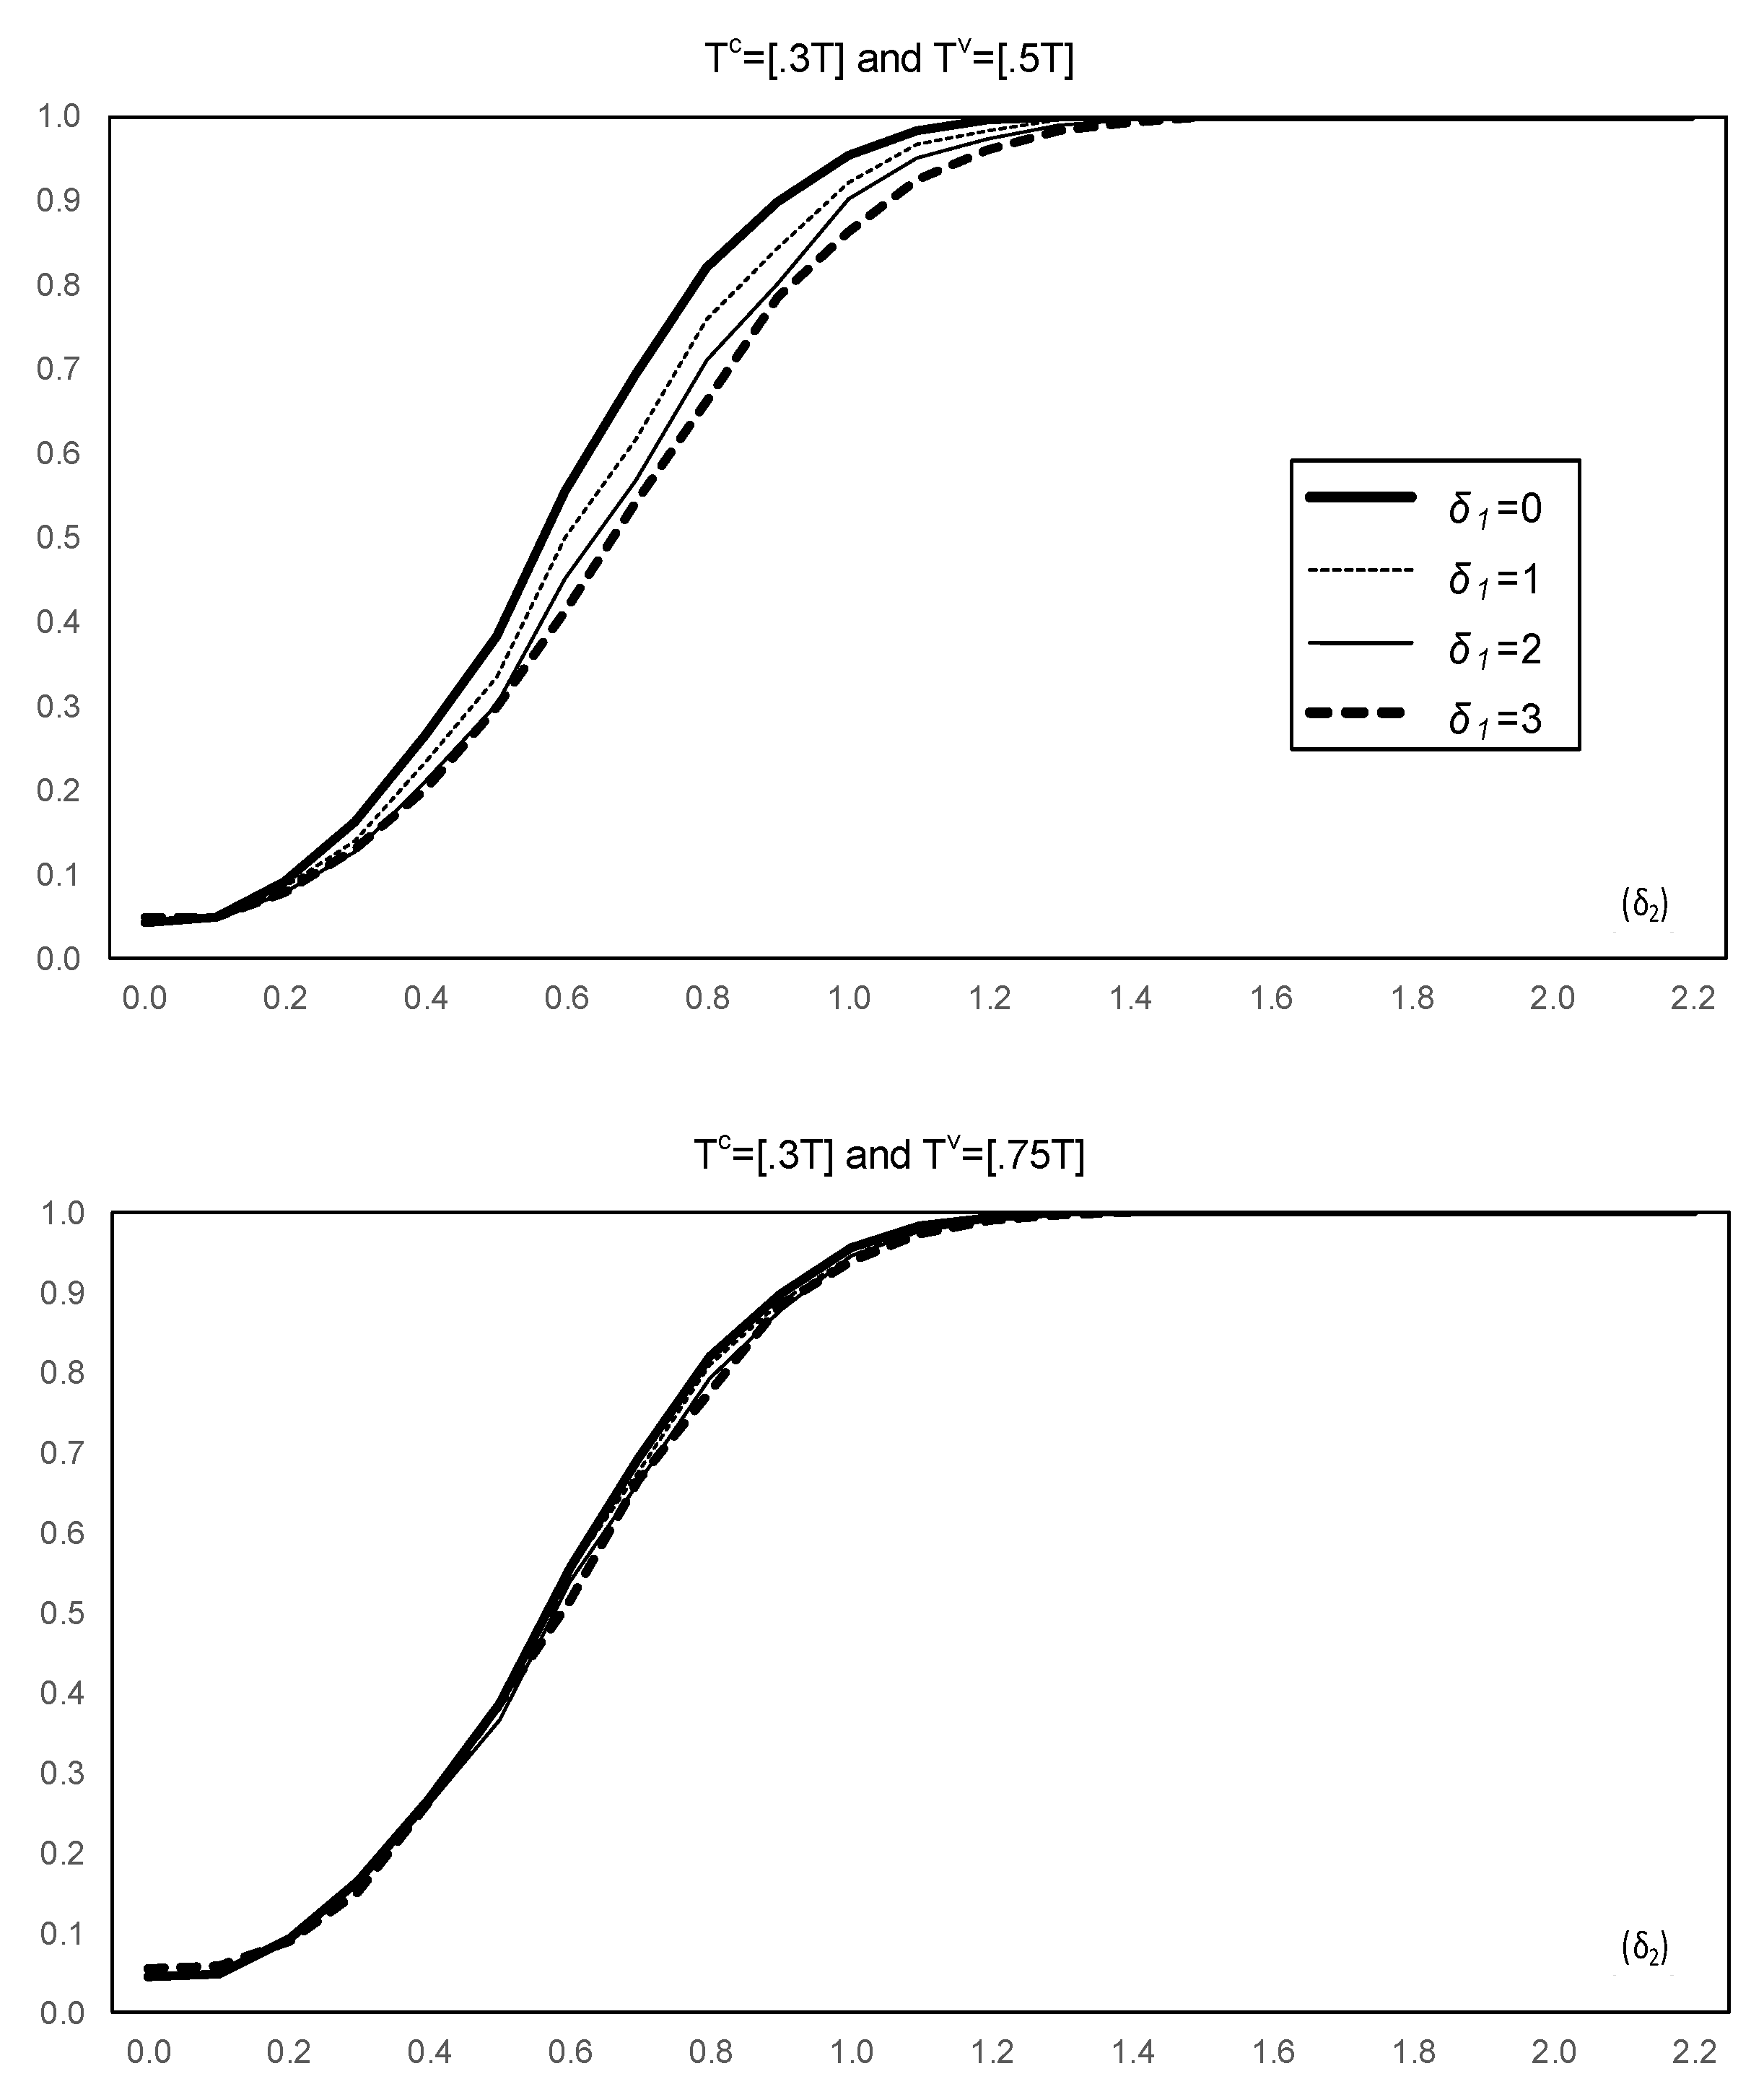
We implemented the sup- and sup- tests for the same DGP as above. We concentrated on testing for the presence of breaks rather than determining their number. Hence, we used the true values and as applicable when breaks were present. The size of the sup- test for a change in given one break in the error variance is presented in Figure 7. As explained in Perron et al. (2019), the exact size is slightly smaller than the nominal level; the distortions due to the variance break are however, minor. The size is more distorted as becomes larger for the case of but there are no evident distortions for the cases with and . The power of the sup- test is presented in Figure 8 for the cases and as well as and . For the first case, the power function decreases somewhat as the variance break increases. However, and more importantly, all power functions are higher than those presented in Figure 2, indicating a reliable power performance. For the second case, the magnitude of the variance break has no evident effect on the power function, which remains high.
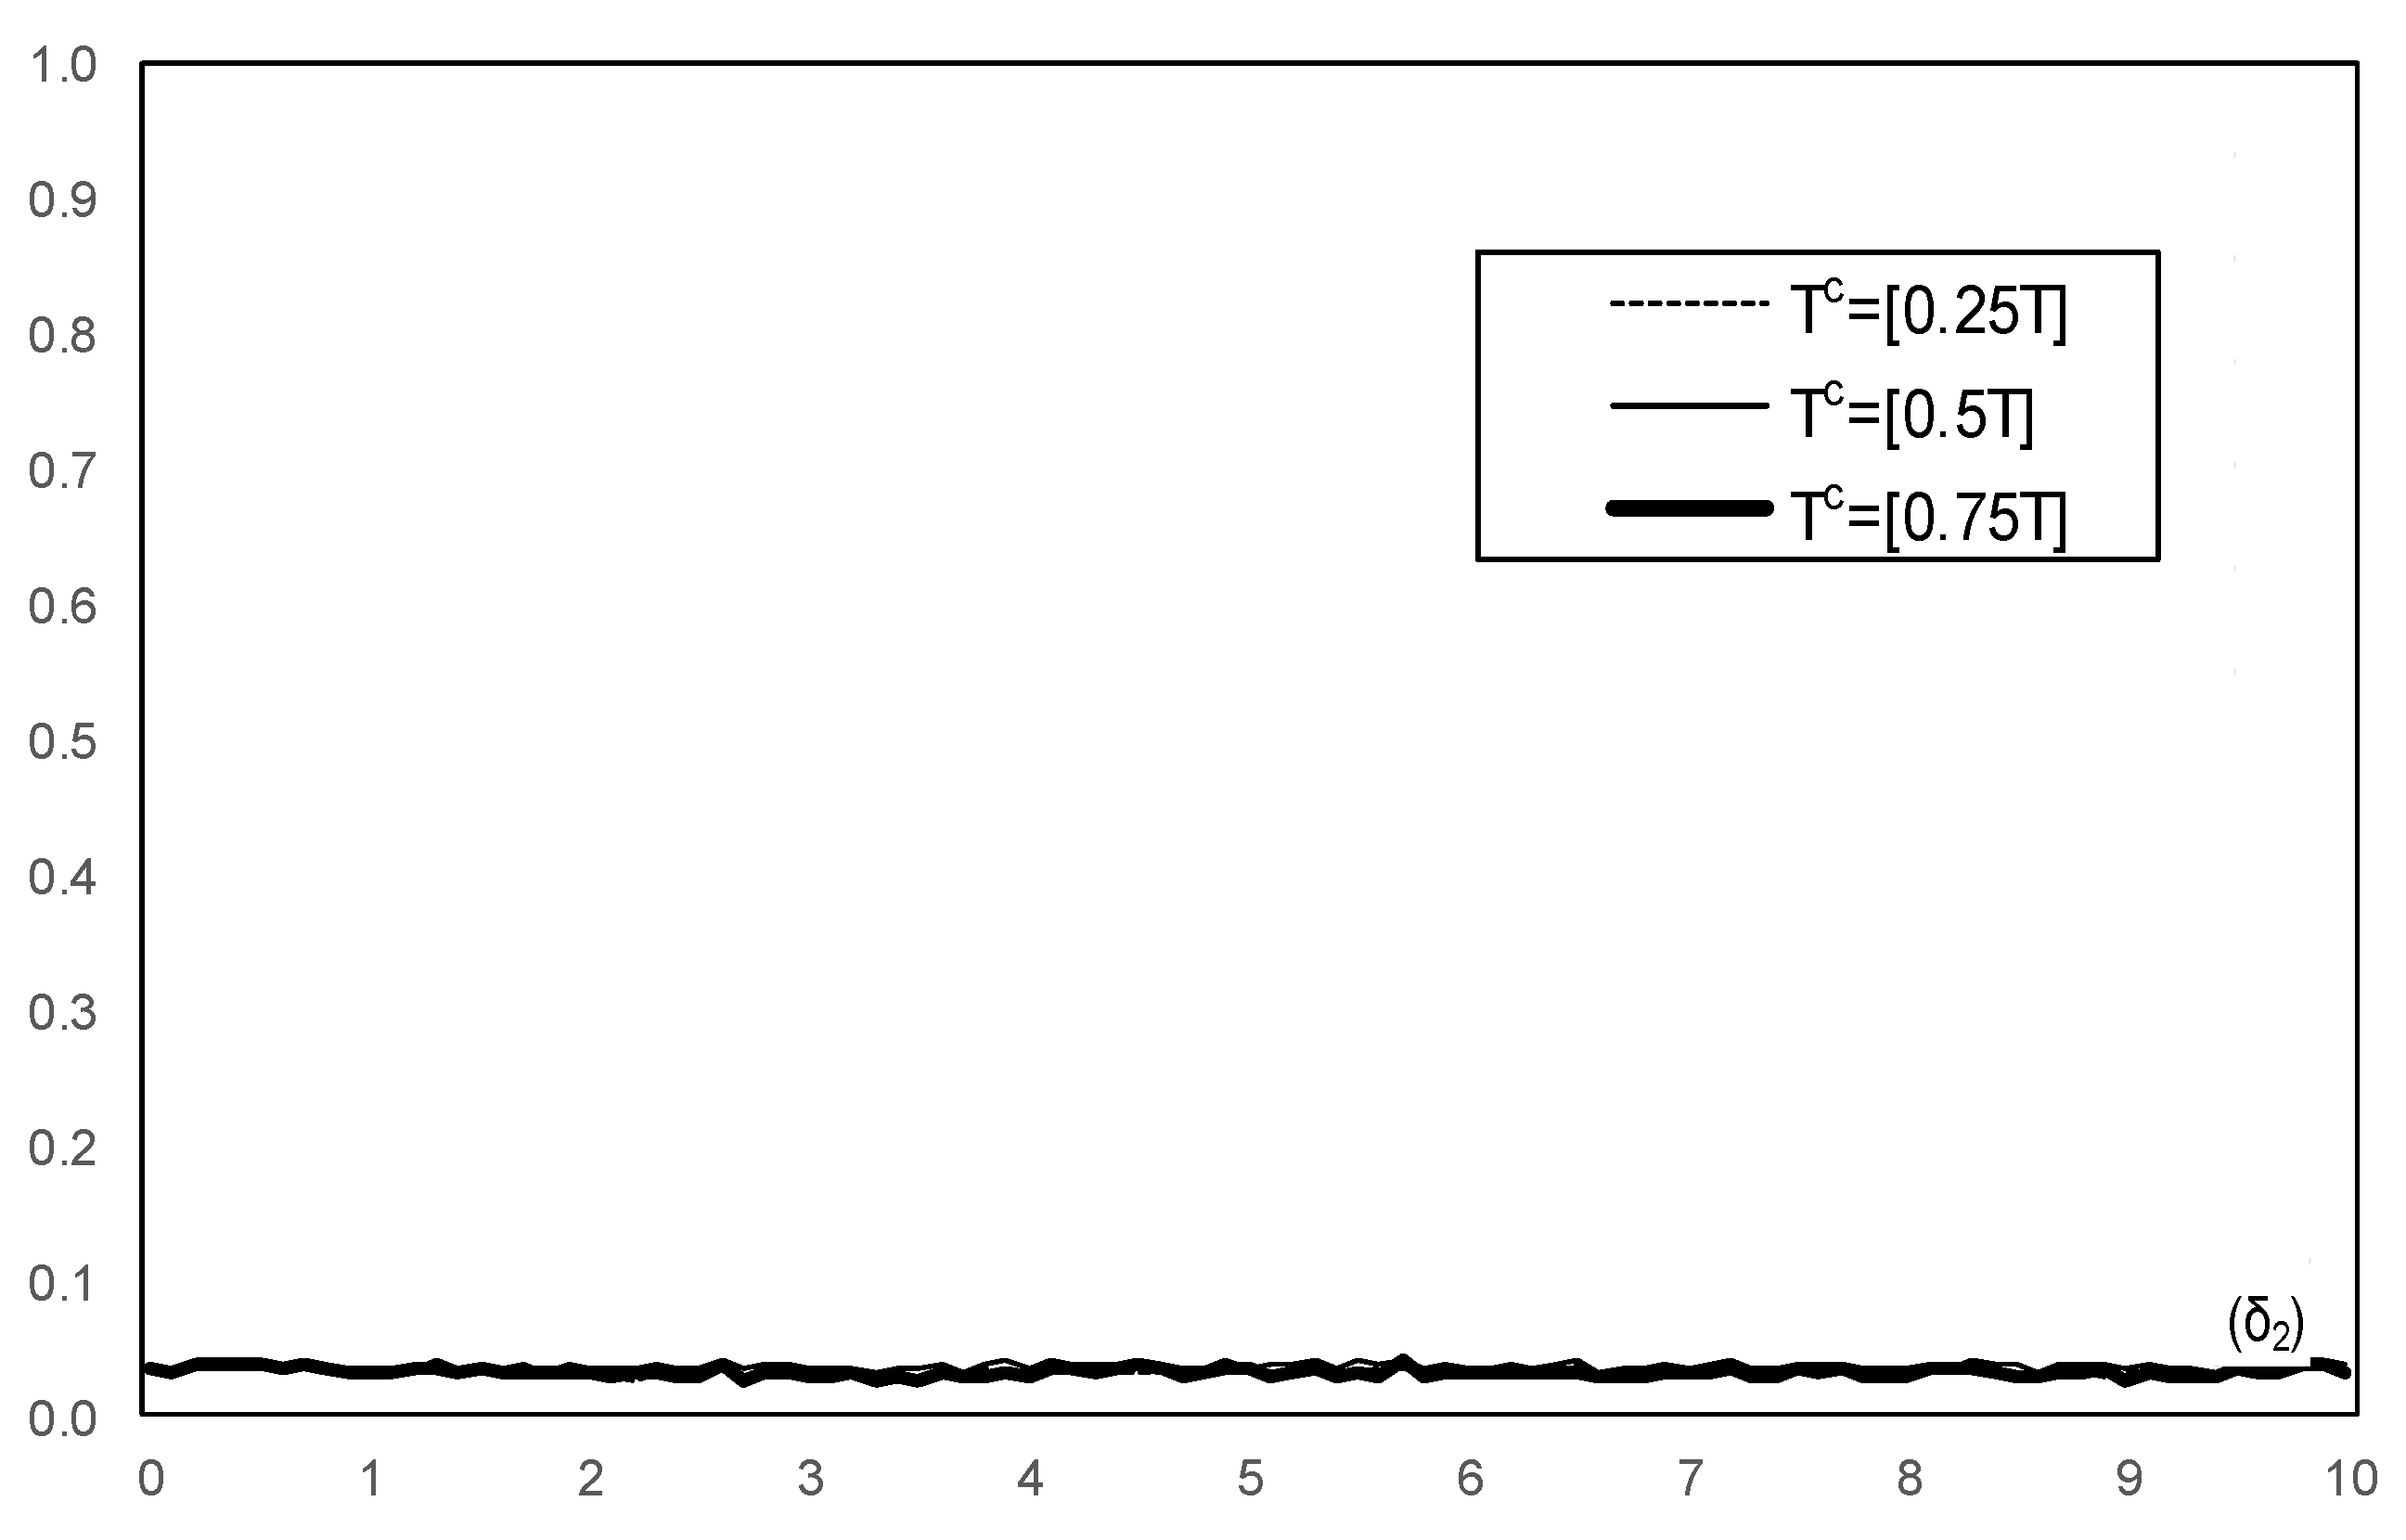
To test for structural breaks in the error variance, Figure 9 shows the size of the sup- test which accounts for a change in the mean. Again, the exact size is slightly conservative, as expected, but not affected by the magnitude of . Figure 10 shows the power functions of the sup- test for the cases and as well as and . Here, the power functions are not affected by for both cases and are higher than those in Figure 6. The results overall illustrate significant improvements of the size and power properties when using the conditional tests.
5. Conclusions
In this paper, we provided evidence about the finite sample properties of the following testing procedures: (a) Applying a sup-LR test for a change in regression coefficients ignoring the presence of a change in variance; (b) applying a CUSQ test for a change in variance ignoring the presence of a change in regression coefficients; and (c) a two-step testing procedure for structural changes in the error variance using a test for a change in the mean of the absolute value of the estimated residuals when the latter are obtained allowing for a change in the regression coefficients ignoring the possibility of a break in the error variance and regression coefficients. The results show that all procedures have important size distortion and/or power losses. In an online supplement, the same qualitative results are shown to hold for models with lagged dependent variables, models with multiple structural changes and tests for changes in variance that account for conditional heteroskedasticity. While the setup considered is quite simple, it shows how inference can be misleading when changes in the coefficients and changes in the error variance are not analyzed jointly. To that effect, we presented limited results showing that the tests proposed by Perron et al. (2019) have good size and power in small samples. This paper contains more extensive results about various tests, including sequential methods to estimate the number of breaks in the regression coefficients and error variance, which should be useful in practice.
Supplementary Materials
The following are available online at http://people.bu.edu/perron/, Supplement I: Experiment with a dynamic regression model, Supplement II: Experiments with multiple structural changes, and Supplement III: Accounting for conditional heteroskedasticity.
Author Contributions
Conceptualization, P.P. and Y.Y.; formal analysis, P.P. and Y.Y.; investigation, P.P. and Y.Y.; methodology, P.P. and Y.Y.; writing—original draft, P.P. and Y.Y.; writing—review & editing, P.P. and Y.Y.
Funding
Yamamoto acknowledges financial support from the Ministry of Education, Culture, Sports, Technology and Science—Japan for the Promotion of Joint International Research No. 15KK0111.
Acknowledgments
This research was carried out in part while Yamamoto was visiting Boston University by financial support from the MEXT Fund for the Promotion of Joint International Research. Yamamoto is grateful to colleagues at Boston University for their hospitality.
Conflicts of Interest
The authors declare no conflict of interest.
References
- Andrews, Donald W. K. 1993. Tests for parameter instability and structural change with unknown change point. Econometrica 61: 821–856. [Google Scholar] [CrossRef]
- Bai, Jushan, and Pierre Perron. 1998. Estimating and testing linear models with multiple structural changes. Econometrica 66: 47–78. [Google Scholar] [CrossRef]
- Brown, Robert L., James Durbin, and James M. Evans. 1975. Techniques for testing the constancy of regression relationships over time. Journal of the Royal Statistical Society B 37: 149–63. [Google Scholar] [CrossRef]
- Deng, Ai, and Pierre Perron. 2008a. The limit distribution of the CUSUM of squares test under general mixing conditions. Econometric Theory 24: 809–22. [Google Scholar] [CrossRef]
- Deng, Ai, and Pierre Perron. 2008b. A non-local perspective on the power properties of the CUSUM and CUSUM of squares tests for structural change. Journal of Econometrics 142: 212–40. [Google Scholar] [CrossRef]
- Herrera, Ana Maria, and Elena Pesavento. 2005. The decline in U.S. output volatility: structural changes and inventory investment. Journal of Business & Economic Statistics 23: 462–72. [Google Scholar]
- Inclán, Carla, and George C. Tiao. 1994. Use of cumulative sums of squares for retrospective detection of changes of variance. Journal of the American Statistical Association 89: 913–23. [Google Scholar]
- Perron, Pierre, Yohei Yamamoto, and Jing Zhou. 2019. Testing Jointly for Structural Changes in the Error Variance and Coefficients of a Linear Regression Model. Unpublished Manuscript, Boston University, Boston, MA, USA. Available online: http://people.bu.edu/perron/ (accessed on 16 April 2019).
- Pitarakis, Jean-Yves. 2004. Least-squares estimation and tests of breaks in mean and variance under misspecification. Econometrics Journal 7: 32–54. [Google Scholar] [CrossRef]
- Qu, Zhongjun, and Pierre Perron. 2007. Estimating and testing multiple structural changes in multivariate regressions. Econometrica 75: 459–502. [Google Scholar] [CrossRef]
- Stock, James H., and Mark W. Watson. 2002. Has the business cycle changed and why? In NBER Macroeconomics Annual 17. Edited by M. Gertler and K. Rogoff. Cambridge: MIT press, pp. 159–218. [Google Scholar]
Figure 1.
Size of the sup-LR test for a coefficient change ignoring a variance change.

Figure 2.
Power of the sup-LR test for a coefficient change ignoring a variance change.

Figure 3.
Size of the CUSQ test for a variance change ignoring a coefficient change.
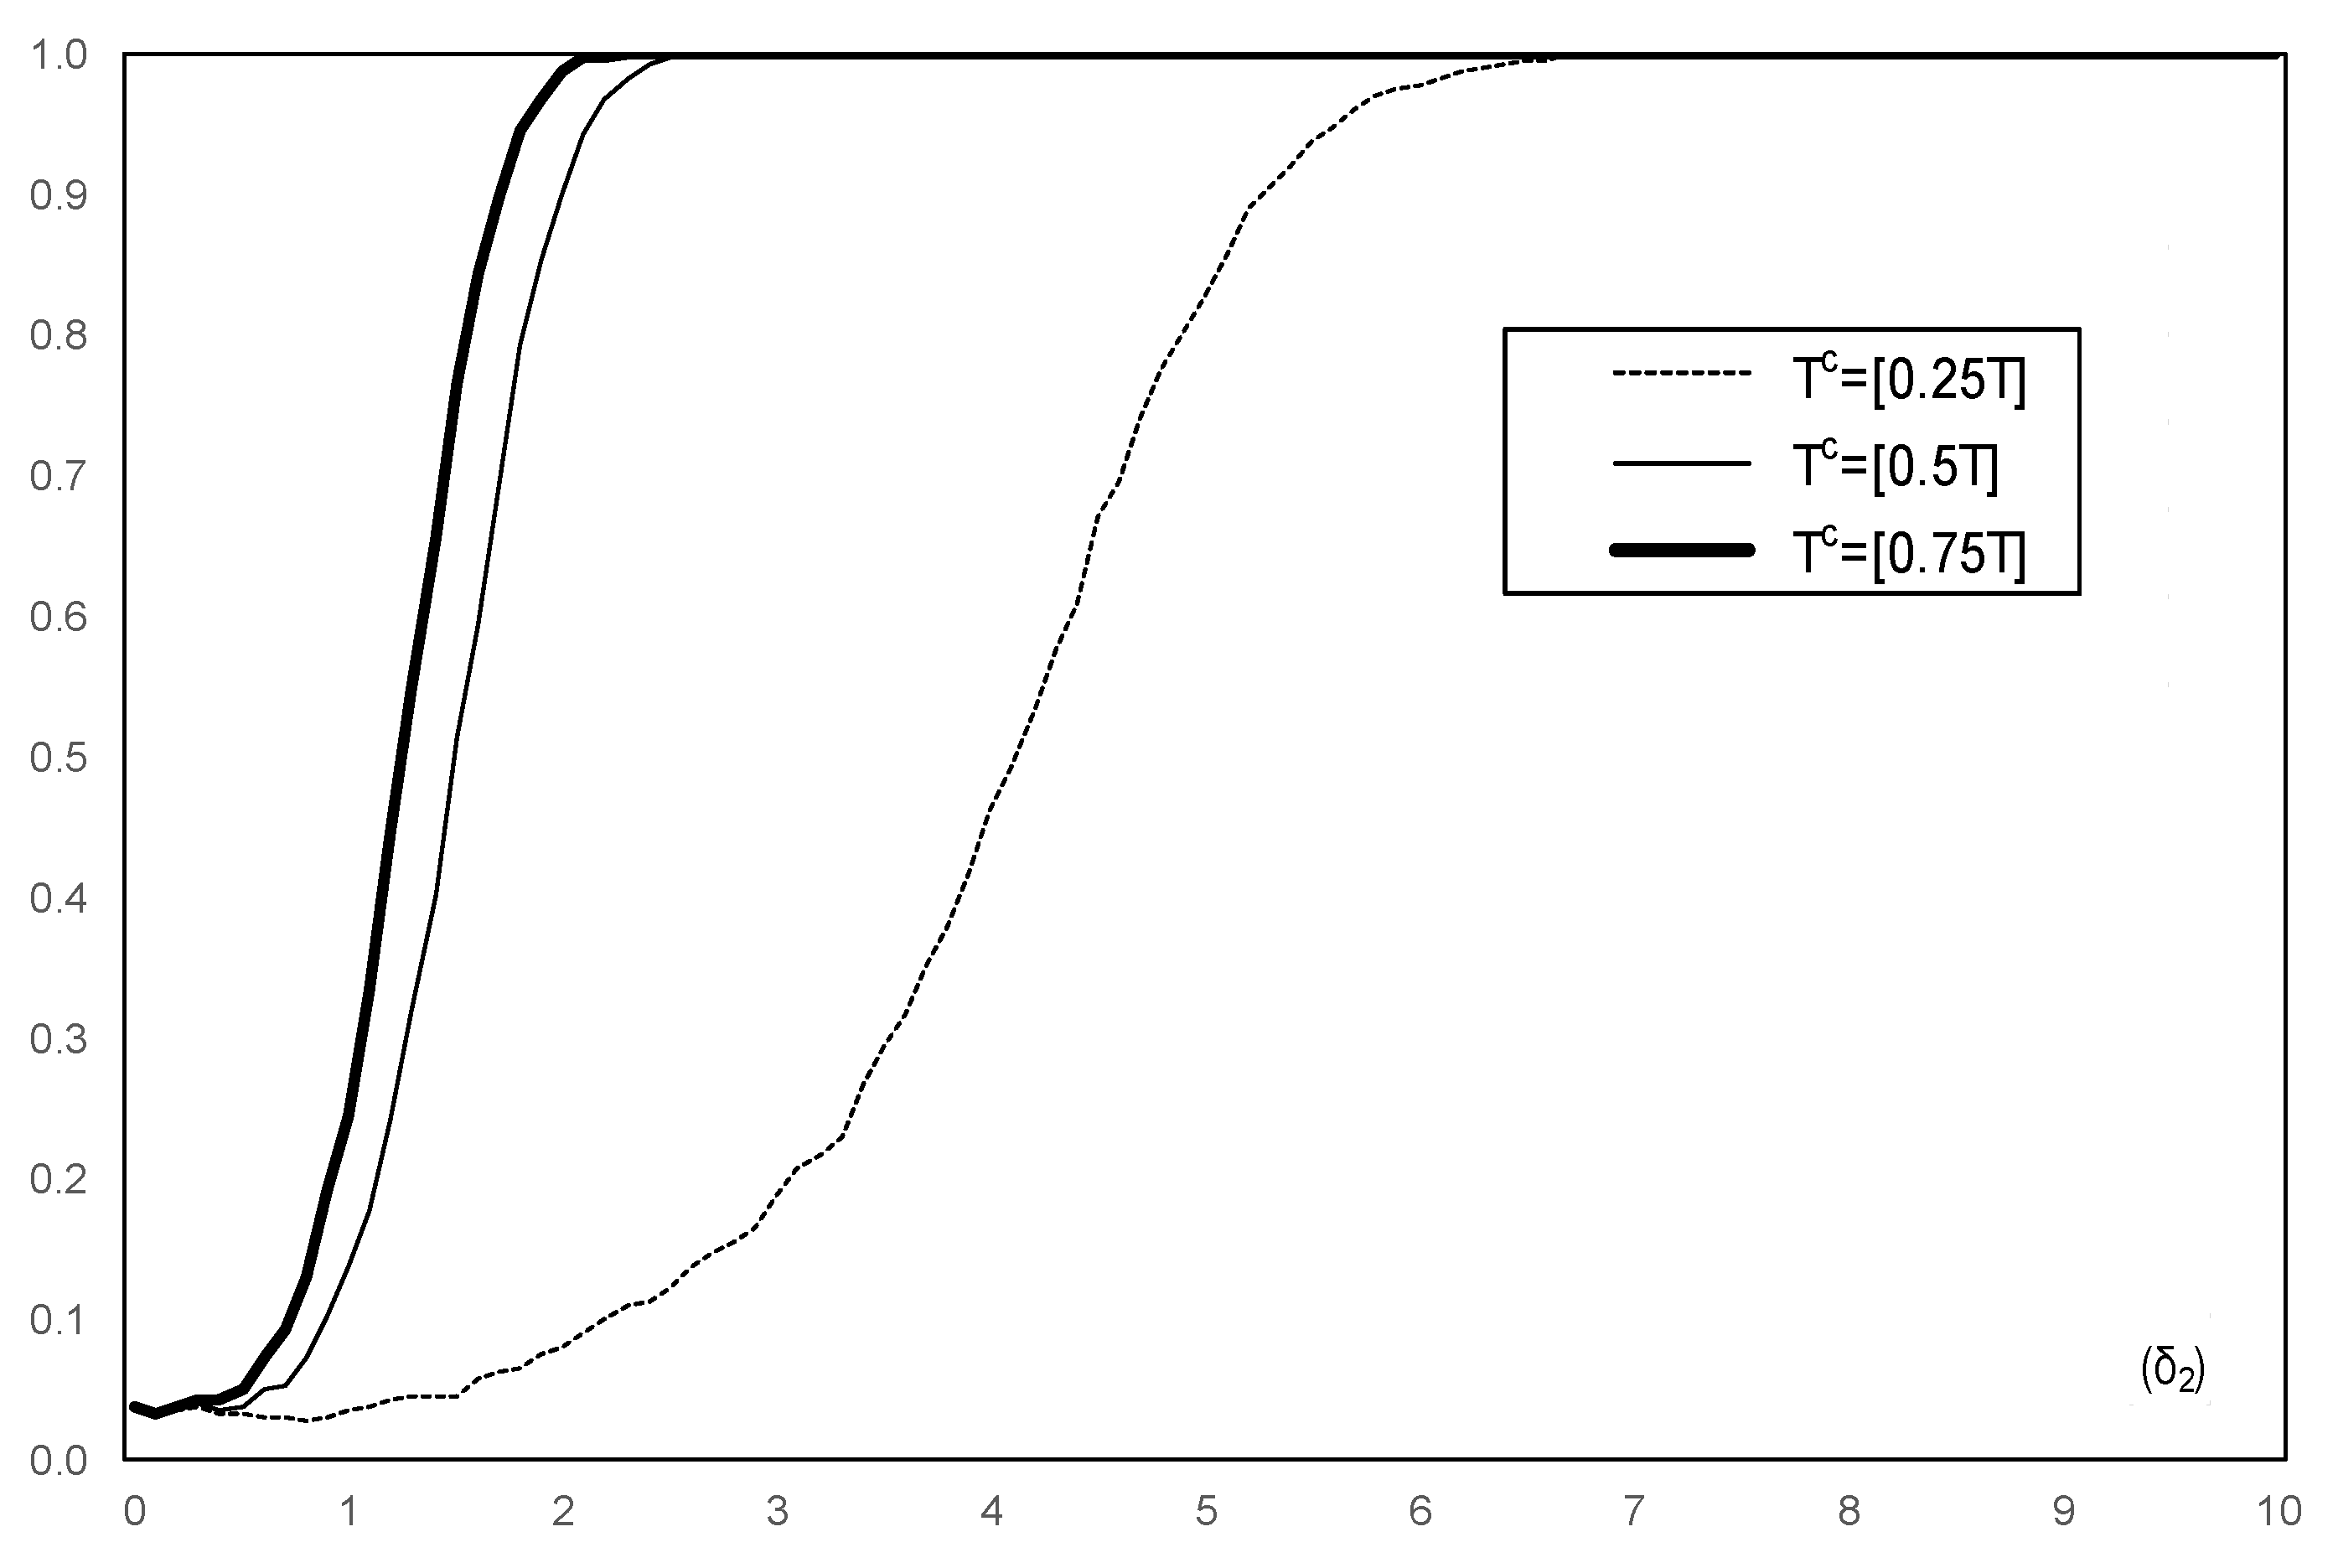
Figure 4.
Power of the CUSQ test for a variance change ignoring a coefficient change.

Figure 5.
Size of the two-step test for a variance change ignoring a coefficient change.

Figure 6.
Power the two-step test for a variance change ignoring a coefficient change.

Figure 7.
Size of the sup- test for a coefficient change accounting for a variance change.

Figure 8.
Power of the sup- test for a coefficient change accounting for a variance change.

Figure 9.
Size of the sup- test for a variance change accounting for a coefficient change.

Figure 10.
Power of the sup- test for a variance change accounting for a coefficient change.

© 2019 by the authors. Licensee MDPI, Basel, Switzerland. This article is an open access article distributed under the terms and conditions of the Creative Commons Attribution (CC BY) license (http://creativecommons.org/licenses/by/4.0/).
Share and Cite
MDPI and ACS Style
Perron, P.; Yamamoto, Y. Pitfalls of Two-Step Testing for Changes in the Error Variance and Coefficients of a Linear Regression Model. Econometrics 2019, 7, 22. https://0-doi-org.brum.beds.ac.uk/10.3390/econometrics7020022
AMA Style
Perron P, Yamamoto Y. Pitfalls of Two-Step Testing for Changes in the Error Variance and Coefficients of a Linear Regression Model. Econometrics. 2019; 7(2):22. https://0-doi-org.brum.beds.ac.uk/10.3390/econometrics7020022
Chicago/Turabian StylePerron, Pierre, and Yohei Yamamoto. 2019. "Pitfalls of Two-Step Testing for Changes in the Error Variance and Coefficients of a Linear Regression Model" Econometrics 7, no. 2: 22. https://0-doi-org.brum.beds.ac.uk/10.3390/econometrics7020022
Note that from the first issue of 2016, this journal uses article numbers instead of page numbers. See further details here.