Next Issue
Volume 8, June
Previous Issue
Volume 7, December


Econometrics, Volume 8, Issue 1 (March 2020) – 11 articles

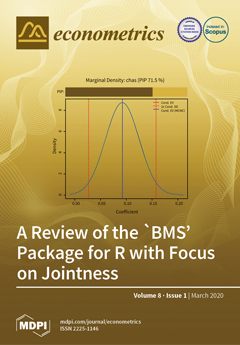
Cover Story (view full-size image): Amini and Parmeter's "A Review of the `BMS' Package for R with Focus on Jointness" details both the basic functionality of the BMS package and provides an easy to deploy function that calculates eight different jointness measures which have been proposed in the Bayesian econometric literature. They describe the main features under the user's control for the BMS package as well as the plot diagnostics available for visualization of the results. Examples are provided to illustrate estimation with full enumeration of the model space as well as requiring a model space search mechanism. Finally, they provide an application to the equity premium from the finance literature to calculate jointness across eight different measures. Having easy access to these various jointness measures allows users to quickly determine how robust economic insights are to various notions of jointness. View this paper.
  • Issues are regarded as officially published after their release is announced to the table of contents alert mailing list.
  • You may sign up for e-mail alerts to receive table of contents of newly released issues.
  • PDF is the official format for papers published in both, html and pdf forms. To view the papers in pdf format, click on the "PDF Full-text" link, and use the free Adobe Reader to open them.
Order results
Result details
Select all
Export citation of selected articles as:
24 pages, 428 KiB  
Article
Sensitivity Analysis of an OLS Multiple Regression Inference with Respect to Possible Linear Endogeneity in the Explanatory Variables, for Both Modest and for Extremely Large Samples
by Richard A. Ashley and Christopher F. Parmeter
Econometrics 2020, 8(1), 11; https://0-doi-org.brum.beds.ac.uk/10.3390/econometrics8010011 - 16 Mar 2020
Cited by 7 | Viewed by 5421
Abstract
This work describes a versatile and readily-deployable sensitivity analysis of an ordinary least squares (OLS) inference with respect to possible endogeneity in the explanatory variables of the usual k-variate linear multiple regression model. This sensitivity analysis is based on a derivation of [...] Read more.
This work describes a versatile and readily-deployable sensitivity analysis of an ordinary least squares (OLS) inference with respect to possible endogeneity in the explanatory variables of the usual k-variate linear multiple regression model. This sensitivity analysis is based on a derivation of the sampling distribution of the OLS parameter estimator, extended to the setting where some, or all, of the explanatory variables are endogenous. In exchange for restricting attention to possible endogeneity which is solely linear in nature—the most typical case—no additional model assumptions must be made, beyond the usual ones for a model with stochastic regressors. The sensitivity analysis quantifies the sensitivity of hypothesis test rejection p-values and/or estimated confidence intervals to such endogeneity, enabling an informed judgment as to whether any selected inference is “robust” versus “fragile.” The usefulness of this sensitivity analysis—as a “screen” for potential endogeneity issues—is illustrated with an example from the empirical growth literature. This example is extended to an extremely large sample, so as to illustrate how this sensitivity analysis can be applied to parameter confidence intervals in the context of massive datasets, as in “big data”. Full article
Show Figures

Figure 1

11 pages, 281 KiB  
Article
Mahalanobis Distances on Factor Model Based Estimation
by Deliang Dai
Econometrics 2020, 8(1), 10; https://0-doi-org.brum.beds.ac.uk/10.3390/econometrics8010010 - 05 Mar 2020
Cited by 5 | Viewed by 4151
Abstract
A factor model based covariance matrix is used to build a new form of Mahalanobis distance. The distribution and relative properties of the new Mahalanobis distances are derived. A new type of Mahalanobis distance based on the separated part of the factor model [...] Read more.
A factor model based covariance matrix is used to build a new form of Mahalanobis distance. The distribution and relative properties of the new Mahalanobis distances are derived. A new type of Mahalanobis distance based on the separated part of the factor model is defined. Contamination effects of outliers detected by the new defined Mahalanobis distances are also investigated. An empirical example indicates that the new proposed separated type of Mahalanobis distances predominate the original sample Mahalanobis distance. Full article
Show Figures

Figure 1

36 pages, 950 KiB  
Article
Distributions You Can Count On …But What’s the Point?
by Brendan P. M. McCabe and Christopher L. Skeels
Econometrics 2020, 8(1), 9; https://0-doi-org.brum.beds.ac.uk/10.3390/econometrics8010009 - 04 Mar 2020
Cited by 1 | Viewed by 4145
Abstract
The Poisson regression model remains an important tool in the econometric analysis of count data. In a pioneering contribution to the econometric analysis of such models, Lung-Fei Lee presented a specification test for a Poisson model against a broad class of discrete distributions [...] Read more.
The Poisson regression model remains an important tool in the econometric analysis of count data. In a pioneering contribution to the econometric analysis of such models, Lung-Fei Lee presented a specification test for a Poisson model against a broad class of discrete distributions sometimes called the Katz family. Two members of this alternative class are the binomial and negative binomial distributions, which are commonly used with count data to allow for under- and over-dispersion, respectively. In this paper we explore the structure of other distributions within the class and their suitability as alternatives to the Poisson model. Potential difficulties with the Katz likelihood leads us to investigate a class of point optimal tests of the Poisson assumption against the alternative of over-dispersion in both the regression and intercept only cases. In a simulation study, we compare score tests of ‘Poisson-ness’ with various point optimal tests, based on the Katz family, and conclude that it is possible to choose a point optimal test which is better in the intercept only case, although the nuisance parameters arising in the regression case are problematic. One possible cause is poor choice of the point at which to optimize. Consequently, we explore the use of Hellinger distance to aid this choice. Ultimately we conclude that score tests remain the most practical approach to testing for over-dispersion in this context. Full article
(This article belongs to the Special Issue Discrete-Valued Time Series: Modelling, Estimation and Forecasting)
Show Figures

Figure 1

15 pages, 826 KiB  
Article
Asymptotic Versus Bootstrap Inference for Inequality Indices of the Cumulative Distribution Function
by Ramses Abul Naga, Christopher Stapenhurst and Gaston Yalonetzky
Econometrics 2020, 8(1), 8; https://0-doi-org.brum.beds.ac.uk/10.3390/econometrics8010008 - 26 Feb 2020
Cited by 2 | Viewed by 4196
Abstract
We examine the performance of asymptotic inference as well as bootstrap tests for the Alphabeta and Kobus–Miłoś family of inequality indices for ordered response data. We use Monte Carlo experiments to compare the empirical size and statistical power of asymptotic inference and the [...] Read more.
We examine the performance of asymptotic inference as well as bootstrap tests for the Alphabeta and Kobus–Miłoś family of inequality indices for ordered response data. We use Monte Carlo experiments to compare the empirical size and statistical power of asymptotic inference and the Studentized bootstrap test. In a broad variety of settings, both tests are found to have similar rejection probabilities of true null hypotheses, and similar power. Nonetheless, the asymptotic test remains correctly sized in the presence of certain types of severe class imbalances exhibiting very low or very high levels of inequality, whereas the bootstrap test becomes somewhat oversized in these extreme settings. Full article
(This article belongs to the Special Issue Econometrics and Income Inequality)
Show Figures

Figure 1

35 pages, 996 KiB  
Article
Cross-Validation Model Averaging for Generalized Functional Linear Model
by Haili Zhang and Guohua Zou
Econometrics 2020, 8(1), 7; https://0-doi-org.brum.beds.ac.uk/10.3390/econometrics8010007 - 24 Feb 2020
Cited by 5 | Viewed by 4518
Abstract
Functional data is a common and important type in econometrics and has been easier and easier to collect in the big data era. To improve estimation accuracy and reduce forecast risks with functional data, in this paper, we propose a novel cross-validation model [...] Read more.
Functional data is a common and important type in econometrics and has been easier and easier to collect in the big data era. To improve estimation accuracy and reduce forecast risks with functional data, in this paper, we propose a novel cross-validation model averaging method for generalized functional linear model where the scalar response variable is related to a random function predictor by a link function. We establish asymptotic theoretical result on the optimality of the weights selected by our method when the true model is not in the candidate model set. Our simulations show that the proposed method often performs better than the commonly used model selection and averaging methods. We also apply the proposed method to Beijing second-hand house price data. Full article
(This article belongs to the Special Issue Bayesian and Frequentist Model Averaging)
Show Figures

Figure 1

21 pages, 437 KiB  
Tutorial
A Review of the ‘BMS’ Package for R with Focus on Jointness
by Shahram Amini and Christopher F. Parmeter
Econometrics 2020, 8(1), 6; https://0-doi-org.brum.beds.ac.uk/10.3390/econometrics8010006 - 24 Feb 2020
Cited by 5 | Viewed by 5559
Abstract
We provide a general overview of Bayesian model averaging (BMA) along with the concept of jointness. We then describe the relative merits and attractiveness of the newest BMA software package, BMS, available in the statistical language R to implement a BMA exercise. BMS [...] Read more.
We provide a general overview of Bayesian model averaging (BMA) along with the concept of jointness. We then describe the relative merits and attractiveness of the newest BMA software package, BMS, available in the statistical language R to implement a BMA exercise. BMS provides the user a wide range of customizable priors for conducting a BMA exercise, provides ample graphs to visualize results, and offers several alternative model search mechanisms. We also provide an application of the BMS package to equity premia and describe a simple function that can easily ascertain jointness measures of covariates and integrates with the BMS package. Full article
(This article belongs to the Special Issue Bayesian and Frequentist Model Averaging)
Show Figures

Figure 1

9 pages, 275 KiB  
Article
Testing for Stochastic Dominance up to a Common Relative Poverty Line
by Tahsin Mehdi
Econometrics 2020, 8(1), 5; https://0-doi-org.brum.beds.ac.uk/10.3390/econometrics8010005 - 11 Feb 2020
Cited by 1 | Viewed by 4887
Abstract
Although a wide array of stochastic dominance tests exist for poverty measurement and identification, they assume the income distributions have independent poverty lines or a common absolute (fixed) poverty line. We propose a stochastic dominance test for comparing income distributions up to a [...] Read more.
Although a wide array of stochastic dominance tests exist for poverty measurement and identification, they assume the income distributions have independent poverty lines or a common absolute (fixed) poverty line. We propose a stochastic dominance test for comparing income distributions up to a common relative poverty line (i.e., some fraction of the pooled median). A Monte Carlo study demonstrates its superior performance over existing methods in terms of power. The test is then applied to some Canadian household survey data for illustration. Full article
1 pages, 153 KiB  
Correction
Correction: Ardia, D., et al. Return and Risk of Pairs Trading Using a Simulation-Based Bayesian Procedure for Predicting Stable Ratios of Stock Prices. Econometrics 2016, 4, 14
by David Ardia, Lukasz T. Gatarek, Lennart Hoogerheide and Herman K. Van Dijk
Econometrics 2020, 8(1), 4; https://0-doi-org.brum.beds.ac.uk/10.3390/econometrics8010004 - 05 Feb 2020
Viewed by 3446
Abstract
The authors wish to make the following corrections to this paper (Ardia et al [...] Full article
23 pages, 361 KiB  
Article
Cointegration and Error Correction Mechanisms for Singular Stochastic Vectors
by Matteo Barigozzi, Marco Lippi and Matteo Luciani
Econometrics 2020, 8(1), 3; https://0-doi-org.brum.beds.ac.uk/10.3390/econometrics8010003 - 04 Feb 2020
Cited by 12 | Viewed by 5408
Abstract
Large-dimensional dynamic factor models and dynamic stochastic general equilibrium models, both widely used in empirical macroeconomics, deal with singular stochastic vectors, i.e., vectors of dimension r which are driven by a q-dimensional white noise, with q < r . The present paper [...] Read more.
Large-dimensional dynamic factor models and dynamic stochastic general equilibrium models, both widely used in empirical macroeconomics, deal with singular stochastic vectors, i.e., vectors of dimension r which are driven by a q-dimensional white noise, with q < r . The present paper studies cointegration and error correction representations for an I ( 1 ) singular stochastic vector y t . It is easily seen that y t is necessarily cointegrated with cointegrating rank c r q . Our contributions are: (i) we generalize Johansen’s proof of the Granger representation theorem to I ( 1 ) singular vectors under the assumption that y t has rational spectral density; (ii) using recent results on singular vectors by Anderson and Deistler, we prove that for generic values of the parameters the autoregressive representation of y t has a finite-degree polynomial. The relationship between the cointegration of the factors and the cointegration of the observable variables in a large-dimensional factor model is also discussed. Full article
(This article belongs to the Special Issue Celebrated Econometricians: Katarina Juselius and Søren Johansen)
2 pages, 165 KiB  
Editorial
Acknowledgement to Reviewers of Econometrics in 2019
by Econometrics Editorial Office
Econometrics 2020, 8(1), 2; https://0-doi-org.brum.beds.ac.uk/10.3390/econometrics8010002 - 21 Jan 2020
Cited by 1 | Viewed by 3243
Abstract
The editorial team greatly appreciates the reviewers who have dedicated their considerable time and expertise to the journal’s rigorous editorial process over the past 12 months, regardless of whether the papers are finally published or not [...] Full article
24 pages, 3952 KiB  
Article
Representation of Japanese Candlesticks by Oriented Fuzzy Numbers
by Krzysztof Piasecki and Anna Łyczkowska-Hanćkowiak
Econometrics 2020, 8(1), 1; https://0-doi-org.brum.beds.ac.uk/10.3390/econometrics8010001 - 18 Dec 2019
Cited by 12 | Viewed by 5138
Abstract
The Japanese candlesticks’ technique is one of the well-known graphic methods of dynamic analysis of securities. If we apply Japanese candlesticks for the analysis of high-frequency financial data, then we need a numerical representation of any Japanese candlestick. Kacprzak et al. have proposed [...] Read more.
The Japanese candlesticks’ technique is one of the well-known graphic methods of dynamic analysis of securities. If we apply Japanese candlesticks for the analysis of high-frequency financial data, then we need a numerical representation of any Japanese candlestick. Kacprzak et al. have proposed to represent Japanese candlesticks by ordered fuzzy numbers introduced by Kosiński and his cooperators. For some formal reasons, Kosiński’s theory of ordered fuzzy numbers has been revised. The main goal of our paper is to propose a universal method of representation of Japanese candlesticks by revised ordered fuzzy numbers. The discussion also justifies the need for such revision of a numerical model of the Japanese candlesticks. There are considered the following main kinds of Japanese candlestick: White Candle (White Spinning), Black Candle (Black Spinning), Doji Star, Dragonfly Doji, Gravestone Doji, and Four Price Doji. For example, we apply numerical model of Japanese candlesticks for financial portfolio analysis. Full article
Show Figures

Figure 1

Previous Issue
Next Issue
Back to TopTop