
Frequency of Winter Coupled North Pacific/North America Circulation Regimes


1
Pacific Marine Environmental Laboratory, National Oceanic and Atmospheric Administration (NOAA), Seattle, WA 98115, USA
2
The Cooperative Institute for Climate, Ocean, and Ecosystems Studies, University of Washington, Seattle, WA 98195, USA
*
Author to whom correspondence should be addressed.
Climate 2022, 10(4), 54; https://0-doi-org.brum.beds.ac.uk/10.3390/cli10040054
Submission received: 8 February 2022
/
Revised: 24 March 2022
/
Accepted: 25 March 2022
/
Published: 2 April 2022
(This article belongs to the Topic The Arctic Atmosphere: Climate and Weather)
Abstract
:The jet stream over North America alternates between a more zonal direction and a wavy pattern (a more meridional flow) associated with persistent blocking patterns. To better understand these important patterns, we base our study on the frequency of winter (November–February) events during 1981–2020, based on four circulation regime types: blocking, the Alaskan Ridge, North American Ridge/Pacific Wave-Train; and zonal, the Pacific Trough and the central Pacific High/Arctic Low (Amini and Straus 2019). Increased information on within and between season variability is important, as the impacts of blocking include the California heatwave and mid-continent or east coast cold spells. Rather than extensive pattern duration or significant trends, temporal variability is the major feature. In some years the combination of the Alaskan Ridge and North American Ridge/Pacific Wave-Train patterns represent ~5 major events covering 35 days of the 120-day winter period, with individual events lasting 10 days. Within-season multiple occurrences and short durations dominate the winter meteorology of the continental United States. The characterization of the persistence of these blocking events is relevant for extended range forecasts.
1. Introduction
Evidence suggests that late winter (JFM), especially during recent decades (since ~1990), featured amplified tropospheric ridge-trough longwave circulation patterns over North America [1,2]. Cold events (daily temperature anomaly <−1.0 standard deviation) in eastern North America usually correspond to an enhanced western ridge/eastern trough jet-stream pattern [3]. Such patterns have been labeled as the North American winter temperature dipole [4], an enhancement to the mean climatological stationary wave pattern due to the Rocky Mountains. When this pattern sets up, persistent cold spells and heavy snow events typically affect eastern North America, including the densely populated eastern U.S. corridor from Boston to New York City and as far south as Washington, D.C. [5]. The existence of an enhanced U.S. west-coast ridge in all seasons intensifies drought conditions in California [6]. When an amplified ridge/trough pattern exists over North America, the eastward propagation of the longwave jet-stream pattern tends to stagnate, thereby slowing the migration of weather systems across the continent and creating persistent weather conditions (i.e., blocking, [7]). North American blocking is associated with Pacific weather patterns [8]. Although such patterns are well known [9,10] (and referenced therein), they are, in fact, dominated by intra-seasonal and inter-annual variability, as noted in our following analysis of the frequency and duration of events. Our motivation is laying out the dominance of intra- and inter-annual variability and the short duration of blocking events. Previous analyses often feature the methodology for developing teleconnection patterns or highlight small but statistically significant meteorological decadal trends, although the meteorological significance of trends is small relative to background variability (e.g., [11]). Within-season variability and the short duration of events should dominate any study of North Pacific/North American teleconnections.
2. Methods: Previous Cluster Analyses
Our methodology starts by using previously developed North Pacific/North American teleconnection patterns, as these are well known. We particularly favored the four patterns of Amni and Straus [12], as they are based on cluster analysis and compare well with other sources. We then located the geographic location of their main center of variability (i.e., action centers) as the region of closed contours of their 500 hPa geopotential height analyses. The daily anomaly of Z500 is computed for each action center location based on NCAR-NCEP reanalysis (R1, psl.noaa.gov/data/gridded/data.ncep.reanalysis.html, 21 March 2022) [13] relative to its climatology, defined as the mean over the 1981–2010 period. Because of within seasonal variability, these anomalies are normalized by their daily standard deviation. This is a way to show the true variability in each action center and to compare them within seasons and between years. The use of R1 is well known and is adequate for our purpose, as we are addressing very large-scale atmospheric patterns, and southwestern Alaska and the continental US have adequate data coverage to feed the reanalyses.
Amini and Straus [12] identified four circulation regimes from a cluster analysis applied to the combined anomalies of 500 hPa geopotential height and 250 hPa zonal wind over the extended Pacific-western North American region. The four regimes are the Arctic Low (AL), Pacific Wave-Train (WT), Alaskan Ridge (AR), and Pacific Trough (PT) (Figure 1). They also examined five clusters, with the Alaskan Ridge separating into Pacific and Arctic high-pressure regions. Our analysis is based on the following four patterns: the Alaskan Ridge and the Pacific Wave-Train responsible for the North American dipole pattern; the Arctic Low as more of a summer central Pacific High pattern; and the Pacific Trough representing North Pacific low pressure—the balance of the event state space. Note that the Pacific Wave-Train ridge location is further east than in the Alaskan Ridge.
Such patterns are well documented in the meteorological literature. The Wave-Train pattern resembles the spatial structure of the Pacific North American (PNA) pattern identified by Wallace and Gutzler [14]. Barnston and Livezey [15], via rotated EOFs, pick up both signs of a 700 hPa center south of the Aleutian Islands (Alaskan Ridge and Pacific Trough locations) that they labeled PNA. Straus et al. [16] identified four patterns, three of which are the Alaskan Ridge, Wave-Train, and Arctic Low. Vigaud et al. [17] notes the Wave-Train pattern. Amini and Straus [12] note an earlier analysis by Riddle et al. [18] with seven clusters, where their #3 and #5 resemble the Alaskan Ridge and #1 and #6 resemble the Pacific Wave-Train. Robertson et al. [10] note the Alaskan and West-Coast Ridges, and the Pacific Trough.
Riddle et al. [18] and Robertson et al. [10] make arguments for the use of cluster analysis for selecting weather types; weather types are not required to be symmetric, and they are statistically significant. Given this previous work, we chose to use the four patterns identified by Amini and Straus [12], as shown in Figure 1. The goal of our paper is not to provide a new analysis of North Pacific/North American patterns, but to use the previous consensus to investigate their frequency and persistence.
To calculate the frequency of each of the four patterns, we computed the daily 500 hPa geopotential height anomaly from November through February during 1981–2020, as located based on action centers from Amini and Straus [12] (Figure 2). We relabel the patterns as the Alaskan Ridge (AR), the North American Ridge/Pacific Wave-Train (PWT), the Pacific Trough (PT-n), and the central Pacific High/Arctic Low (ArcLow-n). For our purpose, the Pacific High/Arctic Low frequency is associated with the low geopotential heights over the Alaskan location (ArcLow-n) and the Pacific Trough depends on the low geopotential heights over the North Pacific (PT-n) rather than the high location over the Hudson Bay. Years are assigned to the January of the following year. We apply a four-day running mean to the normalized 500 hPa geopotential height anomalies. Similar to Figure 1, we find that 40-year composites of the four patterns are visually well separated.
3. Results: Frequency Analysis for Winter (November–February)
We show which of the four patterns dominate each day during November through February of the following year (Figure 3). The main conclusion to notice is the large within-season and year-to-year variability in all patterns; many individual events are two weeks or less in duration. We find no particular monthly dependence for the four patterns.
Figure 4 shows the frequency of each pattern being dominant for individual years. Some patterns reoccur in individual years, such as the Alaskan Ridge in 1982, 1991, 1993–1997, 2011, 2017–2018. The Arctic low/Pacific High, as expected, has a lower frequency relative to the other patterns in almost all years, as it is more of a summer rather than a winter pattern. The two blocking patterns, a combination of the Alaskan Ridge and North American Ridge/Pacific Wave-Train, are dominant in the recent decade, 2011–2019, with the exception of 2012 and 2016. The Pacific Trough is dominant in some years: 1983, 1998, and 2016. Possible reasons for interannual variations have been tied to climate indices, such as the PNA, equatorial, and Arctic changes [5,19,20].
We investigate the statistics for events lasting more than 5 days (Figure 5 and Figure 6). Figure 5 captures the quantitative importance of the qualitative Figure 3. Figure 5 notes the number of events that each pattern is present for in different years. All years show multiple types. The blocking patterns—the Alaskan Ridge or the Pacific Wave-Train—are dominant in different years. The transient low pattern (Pacific Trough) is dominant in 1988 (3 cases) and 2016 (4 cases). We conclude that there is considerable variability in the number of main events during each year for each weather type. No one pattern is completely dominant in any particular year.
The blocking/ridge patterns (the Alaskan Ridge and Wave-Train, Figure 6a) together have an average of 4.8 combined yearly events in the 40-year period (1981–2010), which implies more north–south latitudinal amplitude to the jet stream, while there is a shift in the longitudinal axis for ridging location. There is ridging that is dominant in 1982, 1994, 2005, 2010, 2014, and 2015. There are several years when each one dominates the season with over 35 days of coverage, such as the years of 1986, 1987, 1994, 2003, 2011, 2015, and 2018. The duration of the longest event for the two blocking patterns, the Alaskan Ridge and Pacific Wave-Train, for each year, are provided in Figure 6b. The mean duration for the Alaskan Ridge and the Wave-Train is 8.4 and 9.2 days, respectively. Based on Figure 5 and Figure 6, either the Alaskan Ridge or the Wave-Train tends to dominate the North Pacific in any given year. The few events longer than 10 days approach a sub-seasonal duration.
4. Conclusions
Based on four pattern types resulting from a cluster analysis [12], we note the large temporal variability in the weather pattern types during the winter months (November through February) in the previous 40 years over North Pacific-North America. The two blocking patterns (the Alaskan Ridge and Pacific Wave-Train), located over the northern North Pacific or North American west coast, can last over 10 days and reappear later in a season or be replaced by a different blocking location. They show some dominance since 2010, based on Figure 4. The more zonal Pacific Trough pattern was active in some years throughout the decades but was not dominant. In addressing whether upstream blocking will occur and impact cold conditions in midlatitude central or eastern North America, they were dominant in some years, with over 35-day coverage in 1987, 1994, 2003, 2011, 2015, and 2018; however, within-year and year-to-year variability remain the main story. Erb et al. [21] reach the same conclusion for drought.
This variability has implications for using weather pattern persistence as a basis for sub-seasonal forecasting. Individual dominance by one pattern or event seldom lasts longer than a week. There can be a reoccurrence of the same pattern within a season. Thus, North American winter weather should be considered as a sequence of multiple events.
Author Contributions
Conceptualization, J.E.O.; Formal analysis, M.W.; Funding acquisition, J.E.O.; Investigation, J.E.O. and M.W.; Methodology, M.W.; Software, M.W.; Visualization, J.E.O.; Writing—original draft, J.E.O.; Writing—review & editing, M.W. Both authors have contributed to all aspect of the manuscript. All authors have read and agreed to the published version of the manuscript.
Funding
This research was funded through the support of the Arctic Research Program of the NOAA Global Ocean Monitoring and Observing Office. This research is partially funded by the Cooperative Institute for Climate, Ocean, and Ecosystem Studies (CIOCES) under NOAA Cooperative Agreement NA20OAR4320271, Contribution No. 2021-1150. This is PMEL Contribution 5272.
Data Availability Statement
Data are from standard atmospheric reanalysis sources: the Climate Prediction Center-Reanalysis Project (noaa.gov), NCEP-NCAR Reanalysis (psl.noaa.gov/data/gridded/data.ncep.reanalysis.html accessed on 6 February 2022).
Acknowledgments
We appreciate comments from the anonymous reviewers.
Conflicts of Interest
The authors declare no conflict of interest.
References
- Francis, J.A.; Vavrus, S.J. Evidence for a wavier jet stream in response to rapid Arctic warming. Environ. Res. Lett. 2015, 10, 014005. [Google Scholar] [CrossRef]
- Overland, J.E.; Wang, M. Impact of the winter polar vortex on greater North America. Int. J. Climatol. 2019, 39, 5815–5821. [Google Scholar] [CrossRef] [Green Version]
- Lee, S.H.; Furtado, J.C.; Charlton-Perez, A.J. Wintertime North American weather regimes and the Arctic stratospheric polar vortex. Geophys. Res. Lett. 2019, 46, 14892–14900. [Google Scholar] [CrossRef]
- Singh, D.; Swain, D.L.; Mankin, J.S.; Horton, D.E.; Thomas, L.N.; Rajaratnam, B.; Diffenbaugh, N.S. Recent amplification of the North American winter temperature dipole. J. Geophys. Res. Atmos. 2016, 121, 9911–9928. [Google Scholar] [CrossRef] [Green Version]
- Cohen, J.; Pfeiffer, K.; Francis, J.A. Warm Arctic episodes linked with increased frequency of extreme winter weather in the United States. Nat. Commun. 2018, 9, 869. [Google Scholar] [CrossRef]
- Swain, D.L.; Horton, D.E.; Singh, D.; Diffenbaugh, N.S. Trends in atmospheric patterns conducive to seasonal precipitation and temperature extremes in California. Sci. Adv. 2016, 2, e1501344. [Google Scholar] [CrossRef] [Green Version]
- Woollings, T.; Barriopedro, D.; Methven, J.; Son, S.-W.; Martius, O.; Harvey, B.; Sillmann, J.; Lupo, A.R.; Seneviratne, S. Blocking and its response to climate change. Curr. Clim. Chang. Rep. 2018, 4, 287–300. [Google Scholar] [CrossRef] [Green Version]
- Croci-Maspoli, M.; Schwierz, C.; Davies, H.C. Atmospheric blocking–space-time links to the NAO and PNA. Clim. Dyn. 2007, 29, 713–725. [Google Scholar] [CrossRef] [Green Version]
- Michelangeli, P.; Vautard, R.; Legras, B. Weather regimes: Recurrence and quasi stationarity. J. Atmos. Sci. 1995, 52, 1237–1256. [Google Scholar] [CrossRef]
- Robertson, A.W.; Vigaud, N.; Yuan, J.; Tippett, M.K. Toward identifying subseasonal forecasts of opportunity using North American weather regimes. Mon. Weather Rev. 2020, 148, 1861–1875. [Google Scholar] [CrossRef] [Green Version]
- Kug, J.-S.; Jeong, J.-H.; Jang, Y.-S.; Kim, B.-M.; Folland, C.K.; Min, S.-K.; Son, S.-W. Two distinct influences of Arctic warming on cold winters over North America and East Asia. Nat. Geosci. 2015, 8, 759–762. [Google Scholar] [CrossRef]
- Amini, S.; Straus, D. Control of storminess over the Pacific and North America by circulation regimes. Clim. Dyn. 2019, 52, 4749–4770. [Google Scholar] [CrossRef]
- Kalnay, E. The NCEP/NCAR 40-year reanalysis project. Bull. Am. Meteor. Soc. 1996, 77, 437–472. [Google Scholar] [CrossRef] [Green Version]
- Wallace, J.M.; Gutzler, D.S. Teleconnections in the geopotential height field during the Northern Hemisphere winter. Mon. Weather Rev. 1981, 109, 784–812. [Google Scholar] [CrossRef]
- Barnston, A.G.; Livezey, R.E. Classification, Seasonality and persistence of low-frequency atmospheric circulation patterns. Mon. Weather Rev. 1987, 115, 1083–1126. [Google Scholar] [CrossRef]
- Straus, D.M.; Corti, S.; Molteni, F. Circulation regimes: Chaotic variability versus SST-forced predictability. J. Clim. 2007, 20, 2251–2272. [Google Scholar] [CrossRef]
- Vigaud, N.; Robertson, A.W.; Tippett, M.K. Predictability of recurrent weather regimes over North America during winter from submonthly reforecasts. Mon. Weather Rev. 2018, 146, 2559–2577. [Google Scholar] [CrossRef]
- Riddle, E.E.; Stone, M.B.; Johnson, N.C.; L’Heureux, M.L.; Collins, D.C.; Feldstein, S.B. The impact of the MJO on clusters of wintertime circulation anomalies over the North American region. Clim. Dyn. 2013, 40, 1741–1766. [Google Scholar] [CrossRef] [Green Version]
- Yu, B.; Lin, H.; Wu, Z.W.; Merryfield, W.J. Relationship between North American winter temperature and large-scale atmospheric circulation anomalies and its decadal variation. Environ. Res. Lett. 2016, 11, 074001. [Google Scholar] [CrossRef] [Green Version]
- Henderson, S.A.; Maloney, E.D.; Barnes, E.A. The influence of the Madden–Julian oscillation on Northern Hemisphere winter blocking. J. Clim. 2016, 29, 4597–4616. [Google Scholar] [CrossRef]
- Erb, M.; Emile-Geay, J.; Hakim, G.J.; Steiger, N.; Steig, E.J. Atmospheric dynamics drive most interannual U.S. droughts over the last millennium. Sci. Adv. 2020, 6, eaay7268. [Google Scholar] [CrossRef] [PubMed]
Figure 1.
Pacific cluster patterns from Amini and Straus (2019) of the combined 500 hPa geopotential height and 250 hPa zonal wind anomalies resulting in four patterns. Anomalies of Z500 are given in contours (interval 30 m) and U250 are given in shading (units ms−1). The four patterns are defined as (a) Arctic Low, (b) Pacific Wave-Train, (c) Alaskan Ridge, and (d) Pacific Trough. The numbers in the upper right corner give the relative frequency of occurrence. The figure is from Amini and Straus [12] and is used with permission.

Figure 2.
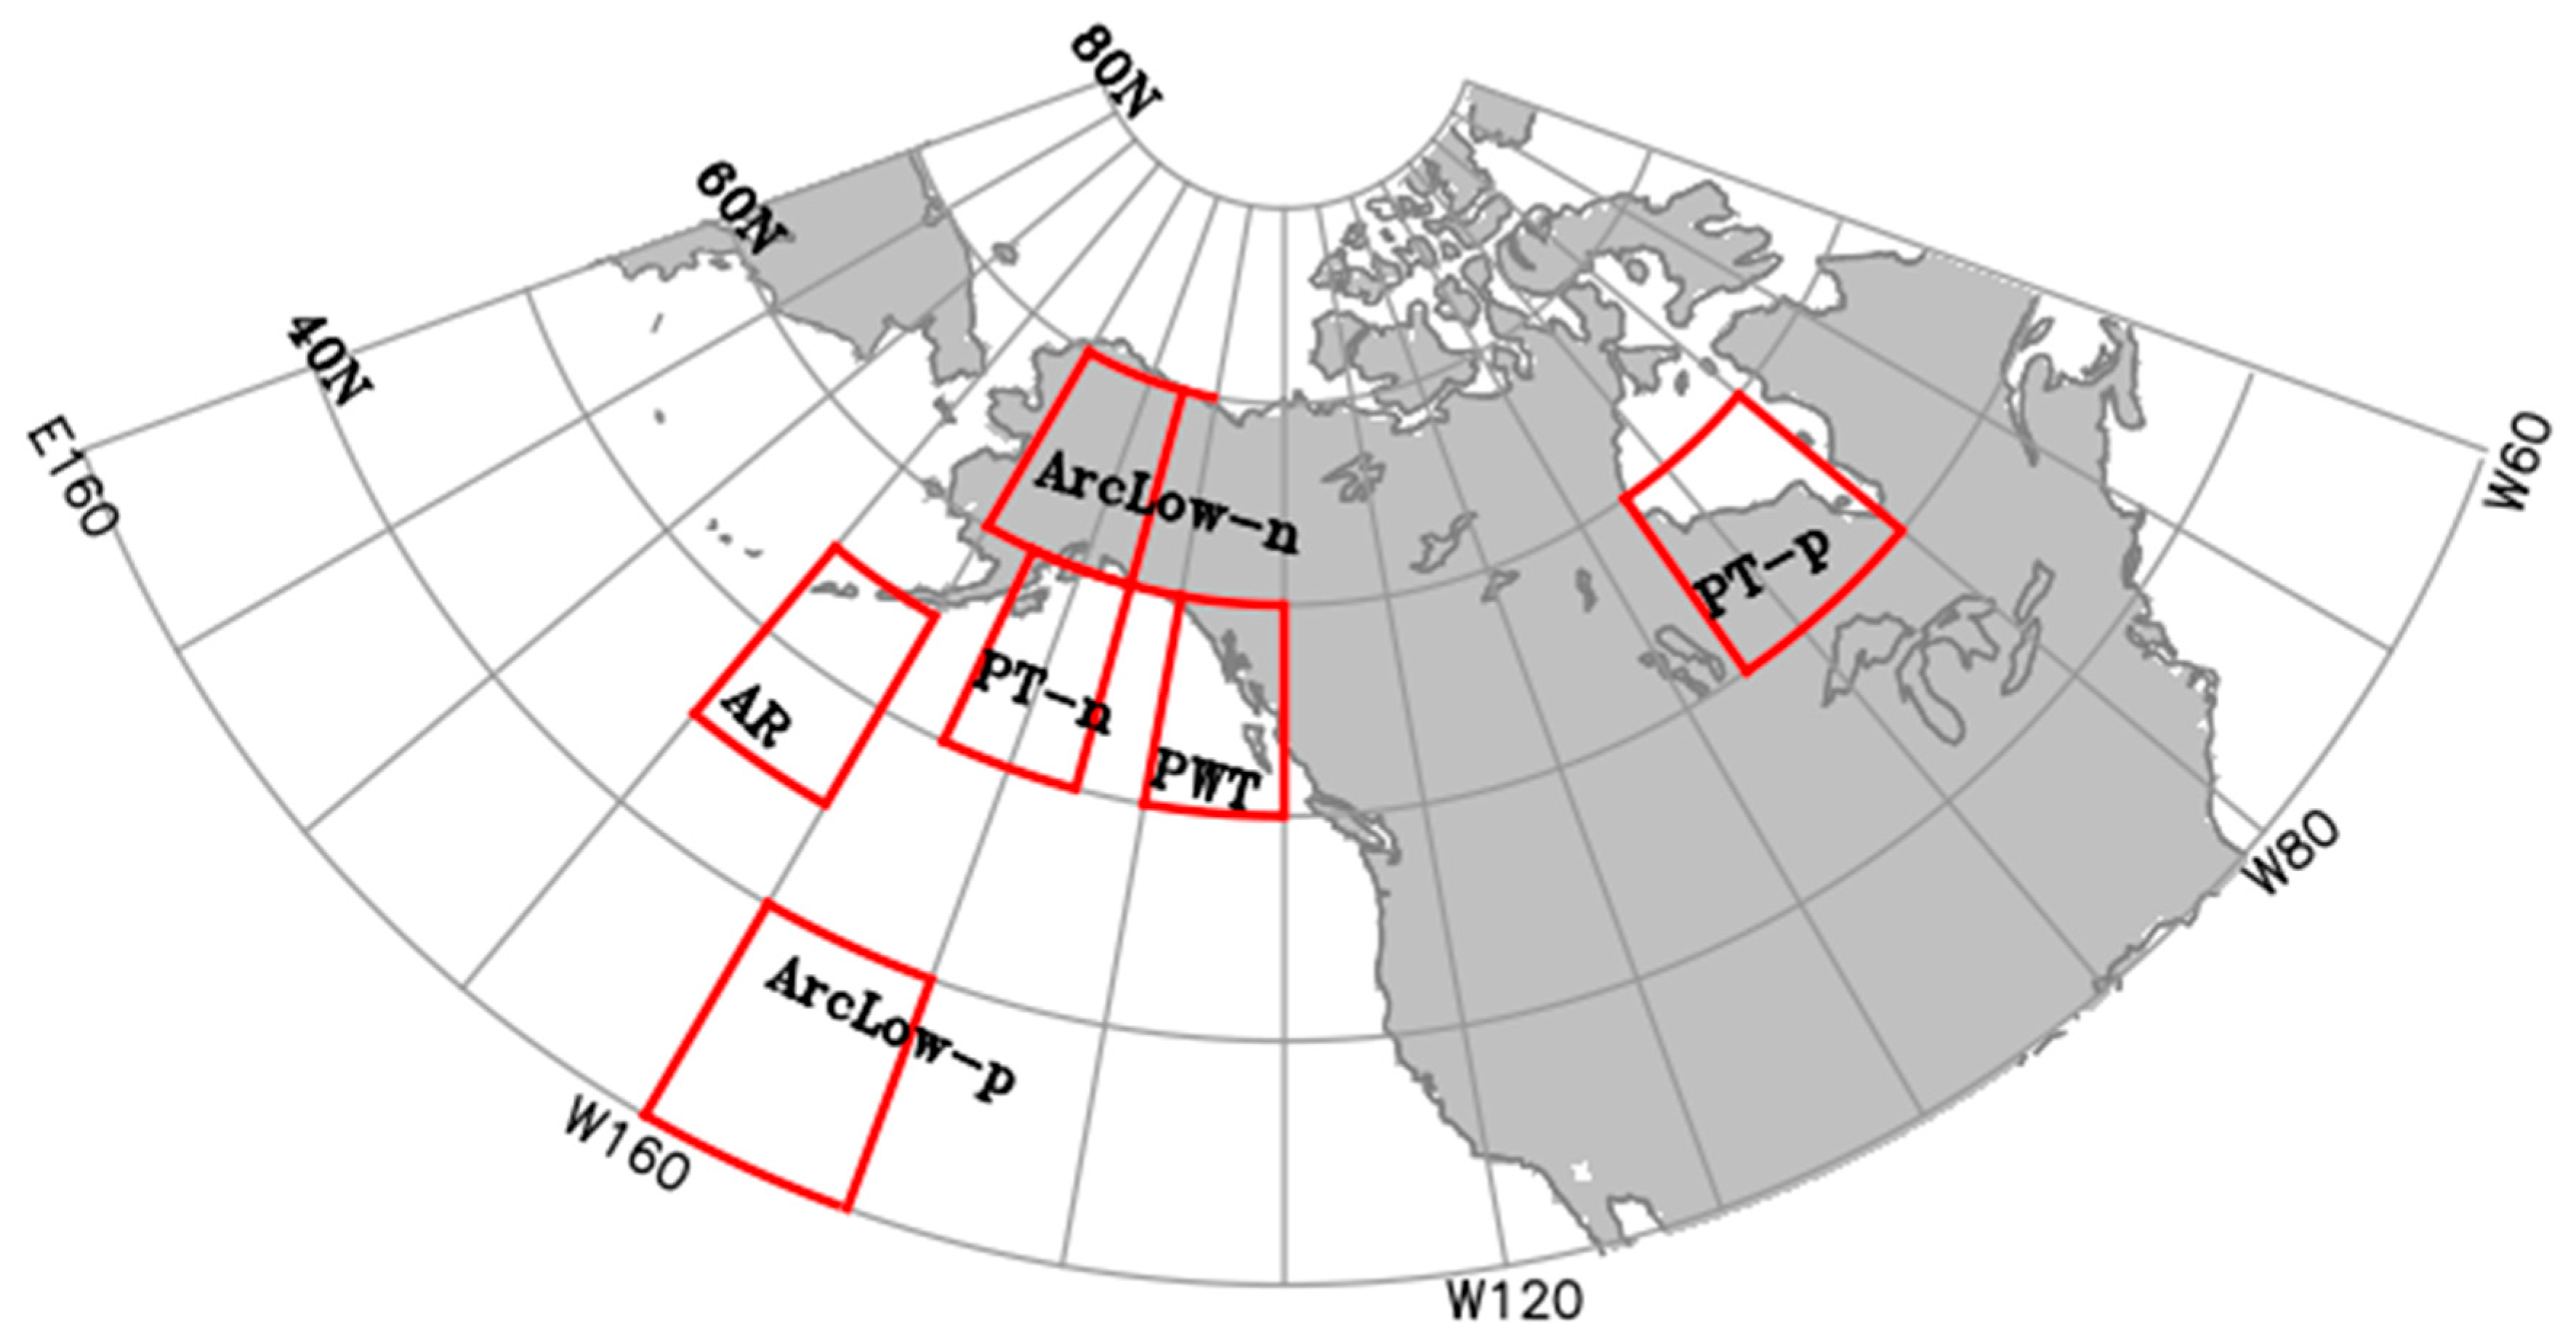
Action centers (outlined by red boxes) at 500 hPa, based on previous studies. Four action centers are chosen in the current study (from left to right): Alaskan Ridge (AR), Pacific High/Arctic Low (ArcLow-n and ArcLow-p), Pacific Trough (PT-n and PT-p), and North American Ridge/Pacific Wave-Train (PWT). In the analysis, ArcLow-n and PT-n were used; –n indicates low-height action centers, and –p indicates high-height action centers.
Figure 2.
Action centers (outlined by red boxes) at 500 hPa, based on previous studies. Four action centers are chosen in the current study (from left to right): Alaskan Ridge (AR), Pacific High/Arctic Low (ArcLow-n and ArcLow-p), Pacific Trough (PT-n and PT-p), and North American Ridge/Pacific Wave-Train (PWT). In the analysis, ArcLow-n and PT-n were used; –n indicates low-height action centers, and –p indicates high-height action centers.

Figure 3.
Days when a given index ranked top among the four patterns (color-coded) for the winter months (November to February) during 1981–2020. Each index is normalized using its own daily standard deviation computed over the 1981–2010 period.
Figure 3.
Days when a given index ranked top among the four patterns (color-coded) for the winter months (November to February) during 1981–2020. Each index is normalized using its own daily standard deviation computed over the 1981–2010 period.

Figure 4.
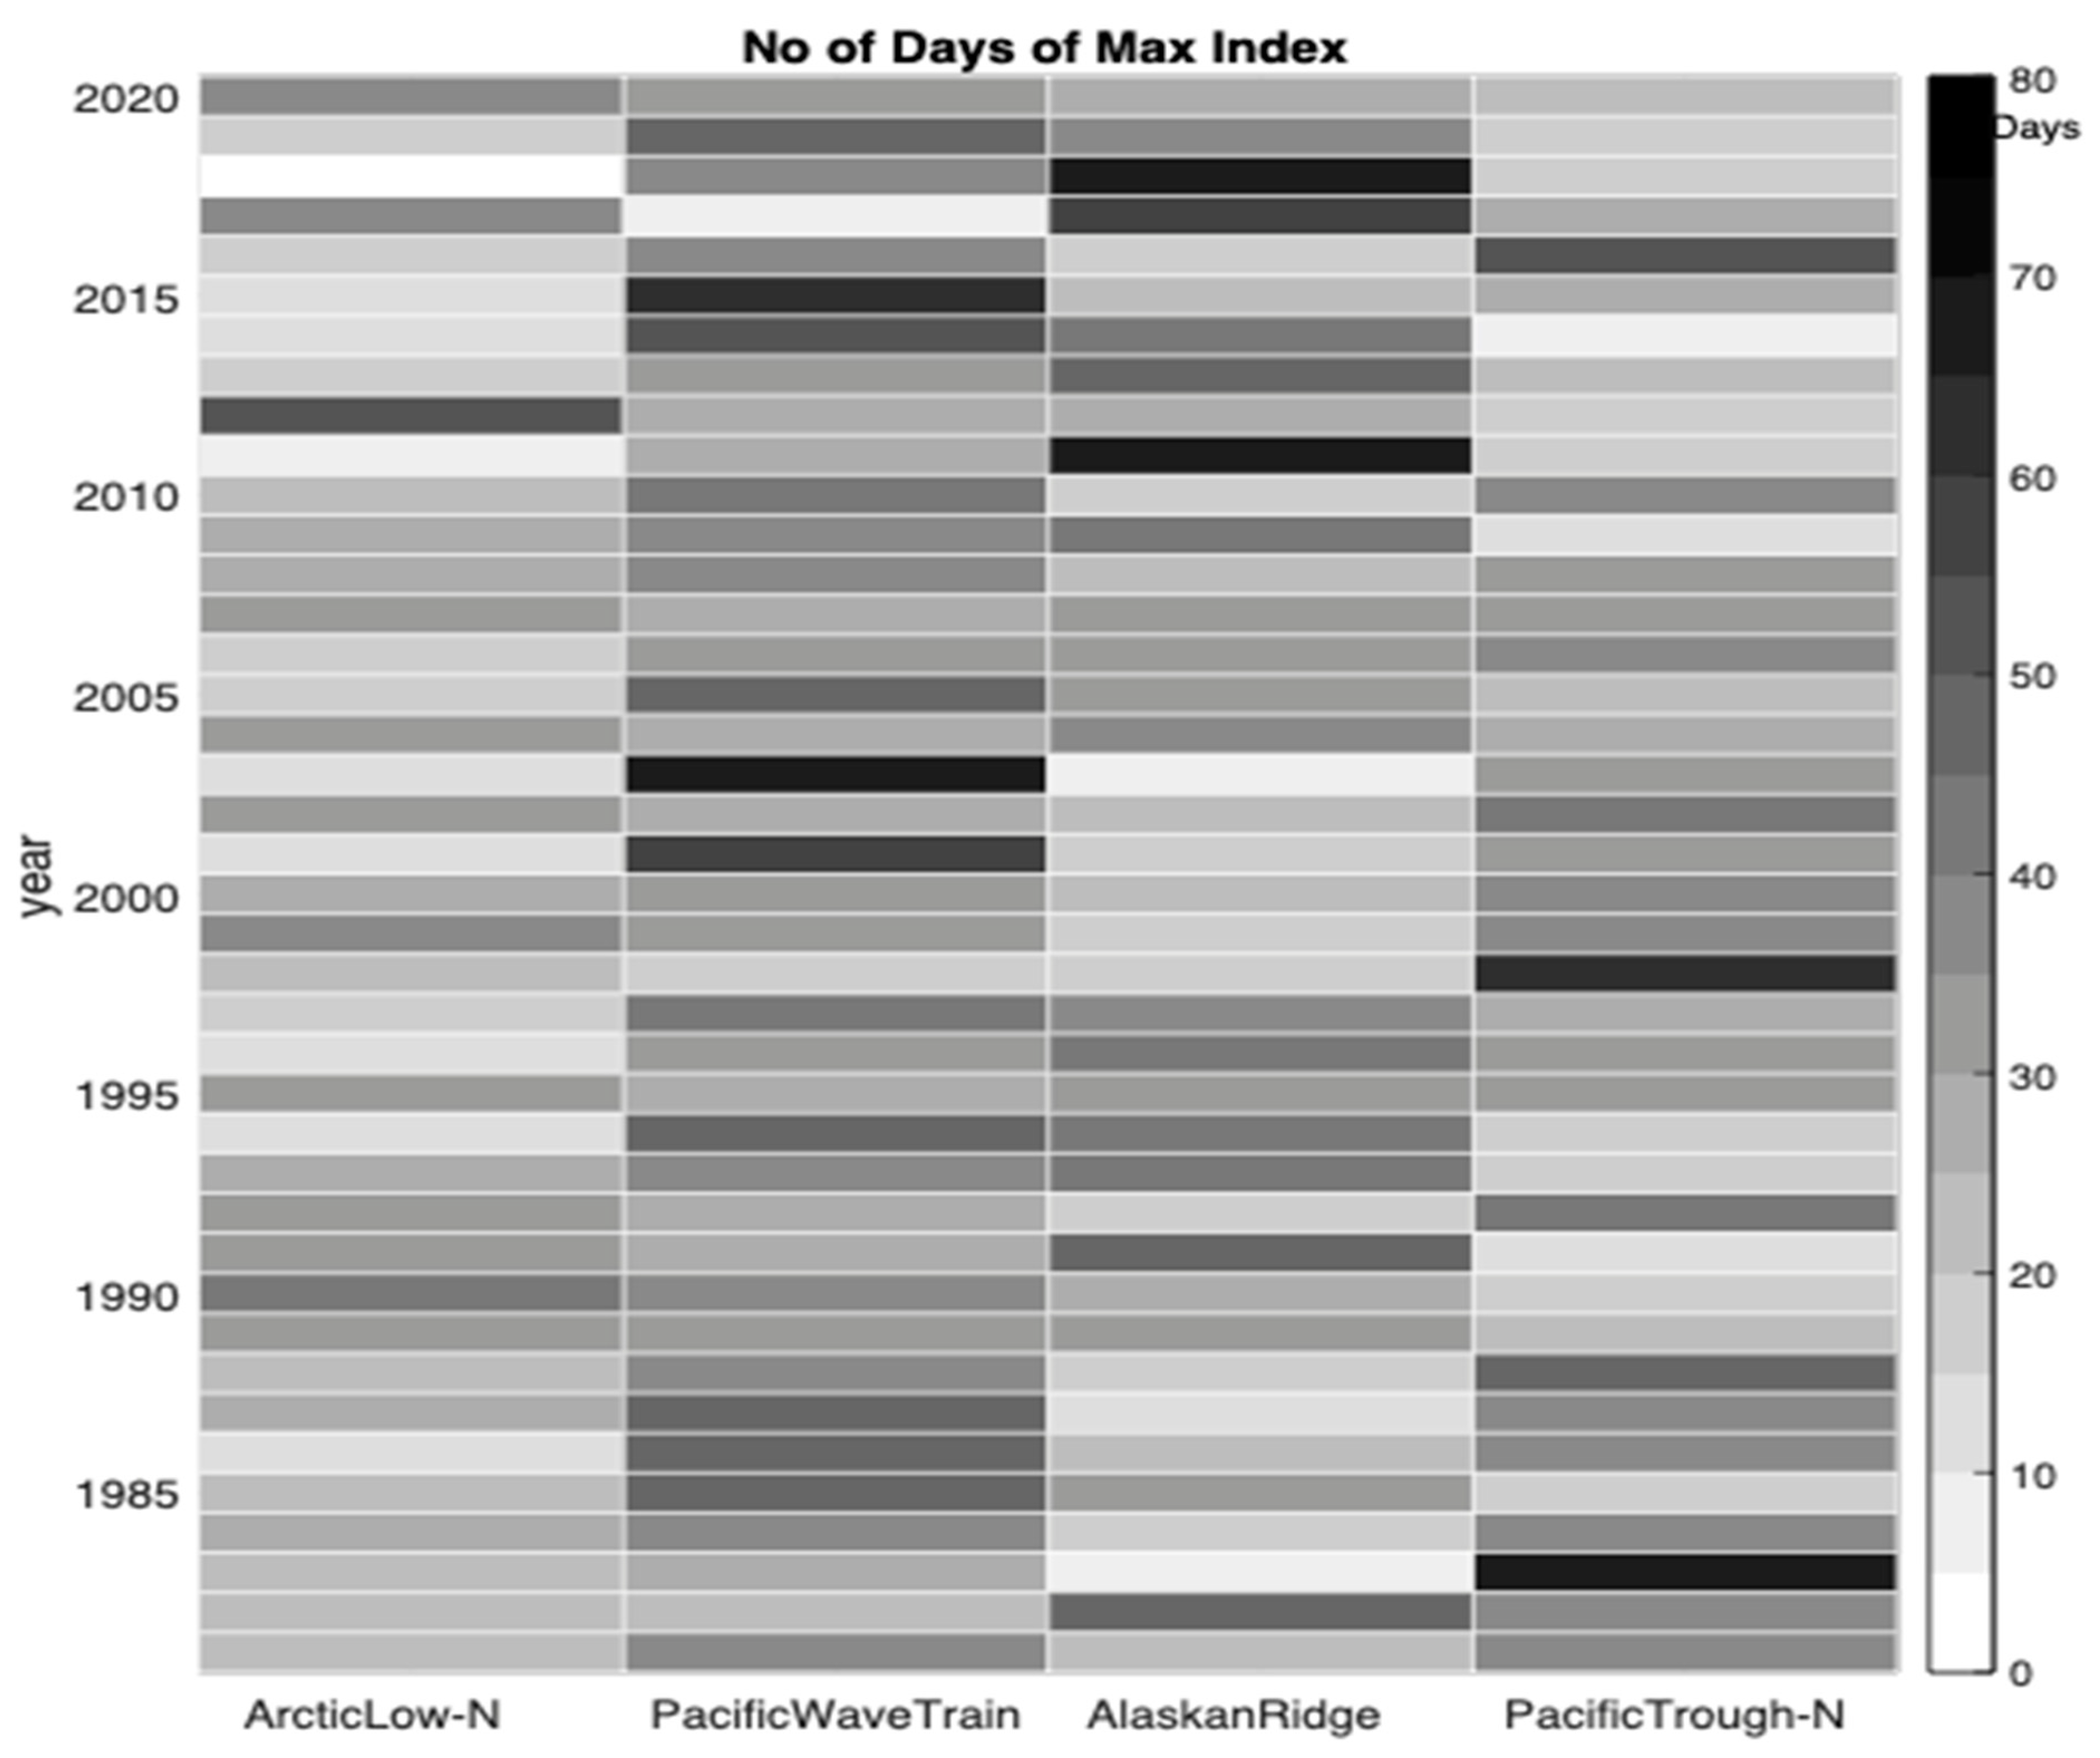
The number of days when each pattern takes a dominant role during the 4-month period in a given year. Among the 120 days in a given year, a pattern could be the strongest among the four patterns for ~80 days (black shading) or less than 5 days (white shading).
Figure 4.
The number of days when each pattern takes a dominant role during the 4-month period in a given year. Among the 120 days in a given year, a pattern could be the strongest among the four patterns for ~80 days (black shading) or less than 5 days (white shading).

Figure 5.
A histogram of the number of events that last longer than 5 days in a given year for each pattern.
Figure 5.
A histogram of the number of events that last longer than 5 days in a given year for each pattern.

Figure 6.
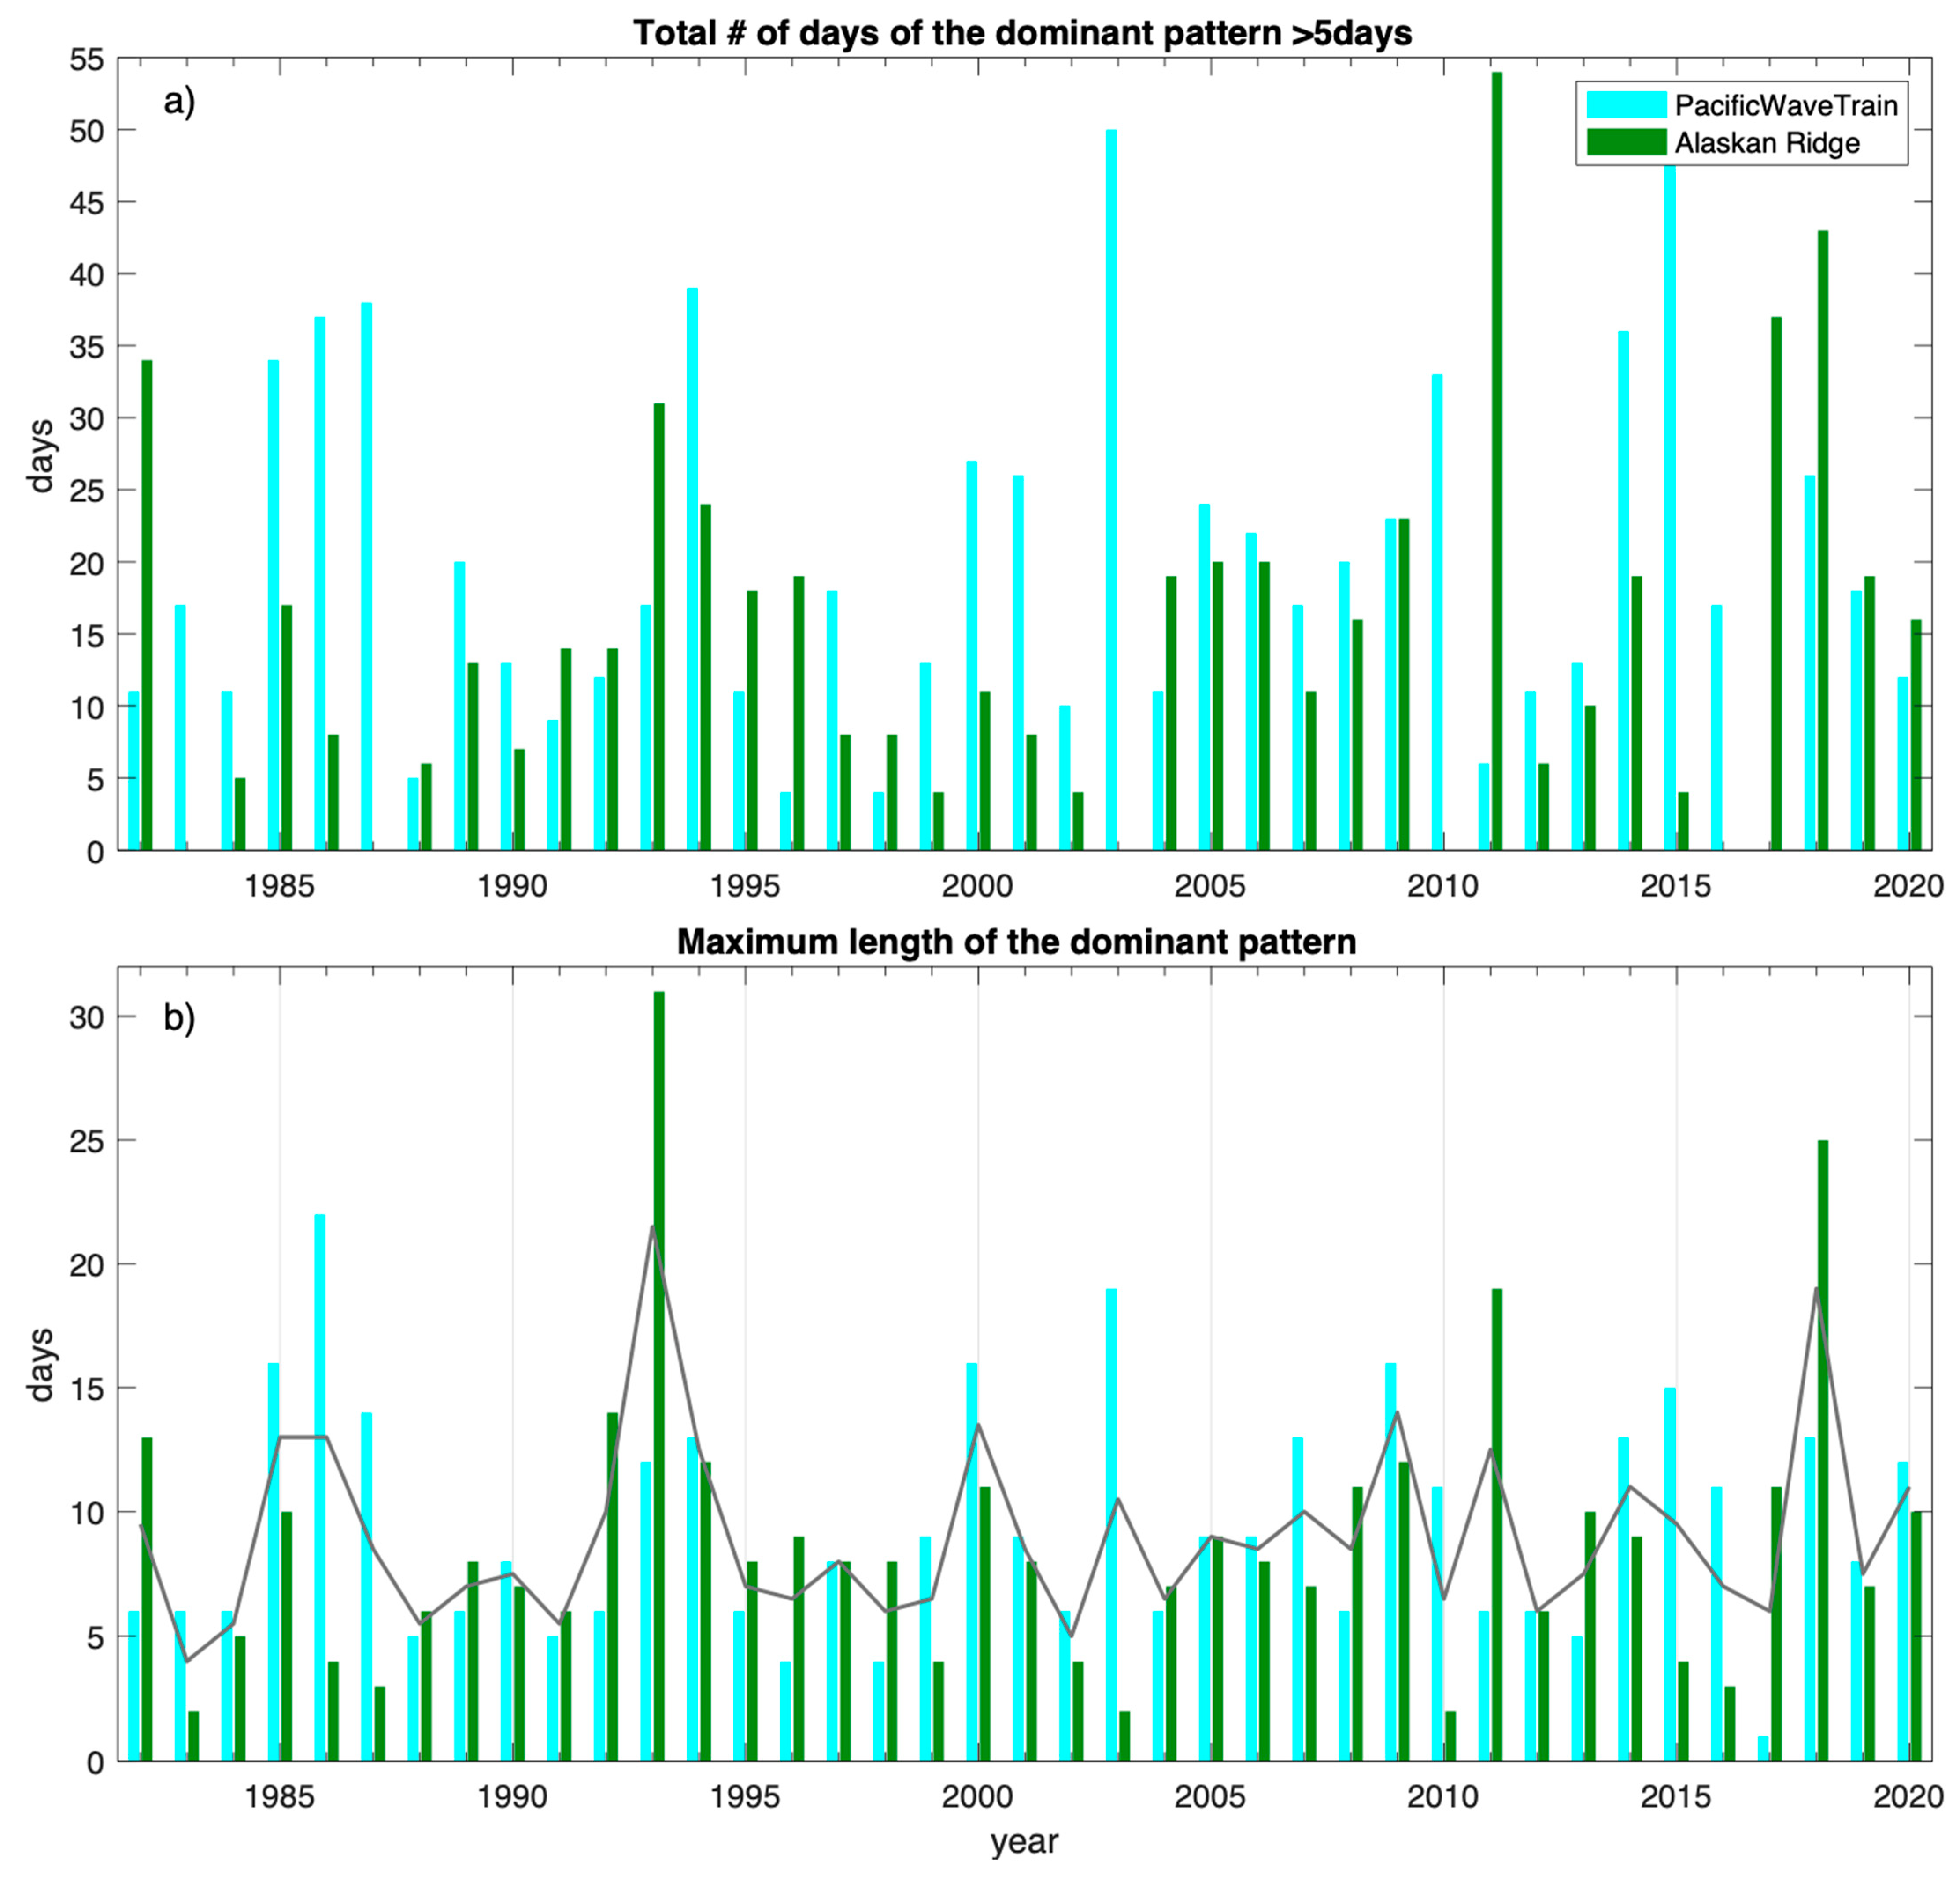
(a) The number of days in each season of the Alaskan Ridge (green bars) and Pacific Wave-Train (light-blue bars) which lasted longer than 5 days. (b) The duration of the longest single event for the Alaskan ridge (green bars) and Pacific Wave-Train/North American Ridge (light-blue bars) for each year. The continuous line is their average.
Figure 6.
(a) The number of days in each season of the Alaskan Ridge (green bars) and Pacific Wave-Train (light-blue bars) which lasted longer than 5 days. (b) The duration of the longest single event for the Alaskan ridge (green bars) and Pacific Wave-Train/North American Ridge (light-blue bars) for each year. The continuous line is their average.

Publisher’s Note: MDPI stays neutral with regard to jurisdictional claims in published maps and institutional affiliations. |
© 2022 by the authors. Licensee MDPI, Basel, Switzerland. This article is an open access article distributed under the terms and conditions of the Creative Commons Attribution (CC BY) license (https://creativecommons.org/licenses/by/4.0/).
Share and Cite
MDPI and ACS Style
Overland, J.E.; Wang, M. Frequency of Winter Coupled North Pacific/North America Circulation Regimes. Climate 2022, 10, 54. https://0-doi-org.brum.beds.ac.uk/10.3390/cli10040054
AMA Style
Overland JE, Wang M. Frequency of Winter Coupled North Pacific/North America Circulation Regimes. Climate. 2022; 10(4):54. https://0-doi-org.brum.beds.ac.uk/10.3390/cli10040054
Chicago/Turabian StyleOverland, James E., and Muyin Wang. 2022. "Frequency of Winter Coupled North Pacific/North America Circulation Regimes" Climate 10, no. 4: 54. https://0-doi-org.brum.beds.ac.uk/10.3390/cli10040054
Note that from the first issue of 2016, this journal uses article numbers instead of page numbers. See further details here.