
Climate Changes in Southeastern Poland and Food Security
by
 , ,
, ,
Barbara Sawicka
1,* ,
,
Piotr Barbaś
2, 
Piotr Pszczółkowski
3,
Dominika Skiba
1,
Farhood Yeganehpoor
4 and
Barbara Krochmal-Marczak
5 1
Department of Plant Production Technology and Commodity Science, University of Life Sciences in Lublin, 20-950 Lublin, Poland
2
Department of Potato Agronomy, Institute of Plant Breeding and Acclimatization, National Research Institute, 05-870 Błonie, Poland
3
Experimental Station for Cultivar Assessment of Central Crop Research Centre, Uhnin, 20-950 Lublin, Poland
4
Department of Plant Eco-Physiology, University of Tabriz, Tabriz 51368, Iran
5
Department of Food Production and Safety, Krosno State College, Rynek 1, 38-400 Krosno, Poland
*
Author to whom correspondence should be addressed.
Climate 2022, 10(4), 57; https://0-doi-org.brum.beds.ac.uk/10.3390/cli10040057
Submission received: 31 January 2022
/
Revised: 31 March 2022
/
Accepted: 4 April 2022
/
Published: 6 April 2022
(This article belongs to the Special Issue Climate Change and Food Insecurity)
Abstract
:The conducted research is of particular importance for the country’s food security in the context of climate change in Southeastern Poland. The aim of the research was to determine the influence of climate on the variability of the appearance and the rate of spread of potato blights as the main factor limiting the potato yield in the conditions of Central and Eastern Europe. Combined statistical and simulation modeling methods were used. A mixed effect model was used to detect the effects of temperature, humidity, rainfall and wind speed on potato yield, and partial regression analysis models were used. The natural, agricultural and economic conditions in terms of suitability for potato cultivation were assessed, and factors influencing the fluctuation of the cultivated acreage, yield and harvesting of potatoes were identified. The forecast was based on empirical data from 2000 to 2019. It has been proven that potato cultivation in Southeastern Poland is more vulnerable to climate change than in the rest of the country. The results obtained from analyzing multi-annual results can help policymakers to develop strategies to increase the stability of future potato production and the safety of the crop. This will enable the better use of generated data and methodological approaches to analyze the role of climate, both on a regional and global scale.
1. Introduction
Climate change is one of the most important issues in science today. It is also an extremely complex and multidisciplinary aspect [1,2]. Climate change is a general threat to food production. The two regions of the world with the highest growth due to malnutrition (PoU) are Asia (418 million) and Africa (282 million people affected by hunger) in 2020 [2,3]. Food insecurity is growing steadily around the world, especially in the African region. Severe global food insecurity is witnessing a huge increase from 8.3% (605 million) in 2014 to 11.9% (928 million) in 2020 [4]. Yields of wheat, maize and other crops are slowing in many countries due to extreme heat, severe weather conditions and droughts [1]. According to some estimates, in the absence of effective adaptation, global yields could fall by as much as 30% by 2050. Global warming, according to the FAO [2], will lead to rising costs of bread, market shocks and political unrest. In recent years, climate change in many countries of the world has been associated with food insecurity, especially in developing countries; for example, this is observed in many African countries such as Nigeria, Senegal, Guinea and others [4]. Serious food insecurity problems also exist in many developed countries in Europe and North America, particularly in some rural areas away from major urban centers. In these areas, human populations may be unsecured from the food side, as this population is usually poor [3,4]. Reducing precipitation will strengthen the desertification process, mainly in the outskirts of the Sahara and Southern Africa. In the case of Asia, climate change will affect the diversification of the production potential of agriculture in individual countries. The most unfavorable changes will occur in poor countries, especially in the coastal areas of the monsoon zone. Rising sea levels will flood some farmlands and worsen the availability of fresh water [3,4]. Kulig et al. [5] and Ziernicka-Wojtaszek [6,7] point out that if the warming trend continues, significant changes in the structure of crops may also occur in Europe, especially in Southeastern Europe, including Poland. For example, on the one hand, it will be possible to introduce plants with increased thermal requirements (maize, sugar sorghum, sweet potato and grapevine) on a larger scale, and on the other hand, the acreage and yields of certain agricultural cultures will be significantly reduced. These climate changes can have a serious impact on food production and have the potential to limit the production of staple food raw materials, such as potatoes [5,8,9]. The temperate climate zone in which Europe is located shows the greatest variation in climatic conditions among all zones. It distinguishes a group of cool climates and a group of warm climates, including maritime, transitional and continental climates. Due to the favorable conditions for agriculture, this zone is the food basin of the world. Strong warming has been observed in the last three decades. Central Europe, including Poland, is also experiencing this. The forecasts for Poland also predict further warming, as well as changes in the spatial and seasonal distributions as well as the amount of precipitation. However, climate models do not agree on the direction of these changes. Rainfall in Poland is expected to decrease in summer (it depends on the model) and increase in winter. Consequently, there is still considerable uncertainty about the likely impact of climate change on Poland’s water resources. In general, changes in thermal characteristics, precipitation and air humidity will have an impact on changes in water balance and, thus, on the productivity of crops and the country’s food security. Due to the insufficient consistency between climate models, the scope of changes may differ depending on the model and biotic and abiotic factors. Climate change trends in Poland, in terms of temperature, precipitation and relative humidity, in the southeastern part of Poland based on global the scenarios for climate and emissions (according to IPCC AR5) are presented in the studies by Kulig et al. [5], Ziernicka-Wojtaszek [6,7] and Mezghani et al. [10]. In general, all climate models show a systematic upward trend average air temperature, both in the short term and as well as the future. Significant regional differences between simulations and seasons were found. However, some simulations were not very good at recreating the temperature gradient from the northwest to the southeast of Poland. This applies, inter alia, to the topographic influence of the mountains in the south of the country, which can be seen, for example, in orographic and convective rainfall [10]. Data from a common subset of global climate models show greater changes in precipitation and less warming than the average based on the full set of GCM models. This means that the predictions based on a subset of global climate models used in Poland cover a limited range of possible climate change, compared to the entire set of GCMs. This is especially true of air temperature, while in the case of precipitation there is almost the same range of variation. Total rainfall is likely to increase by 2035, then changes will stabilize and will be approximately + 6% by the end of the 21st century. In the study of climate change, apart from the course of precipitation and air temperatures, it is also analyzed [7,10]. The average daily value of the Humidex Thermal Discomfort Index, which combines the influence of temperature and air humidity. High values of this index may affect the feeling of thermal discomfort even in healthy people, worsening the health of people suffering from heart and circulatory system diseases, and may accelerate the outbreak of fungal diseases, including potato blight epidemics, and affect the rate of its spread [5,10,11]. However, there is a well-founded fear that with the increase in sensitive meteorological data and the effects of these changes, the risk of unfavorable climate changes in the region of Central and Eastern Europe may begin to increase again, which may be particularly conducive to the spread of dangerous potato diseases [5,11,12,13].
The impact of climate change on Polish agriculture was studied by focusing on the potato, assessing the unfavorable growing conditions in the time horizon of 2000–2019. Among the many pests that attack potato crops in almost all regions of the world, potato blight (Phytophthora infestans Mont de Barry) dominates, a fungus-like organism that is responsible for the most dangerous disease in potato plantations and was responsible for the famine in Ireland in 1843–45 and continues to cause worldwide devastation with respect to potatoes. Moreover, this disease reappears in the form of different genotypes and causes huge losses in potato yields [11,12,13]. Its harmfulness consists in destroying the aerial parts of plants, which in turn results in a reduction in the assimilation area and, thus, the quantity and quality of the yield of progeny tubers. The development of the disease is closely related to the meteorological conditions in potato plantations. The disease develops most rapidly in conditions of high humidity (prolonged rainfall or long-lasting fog) and air temperatures between 12 and 18 °C. In such favorable conditions, if chemical protection is not applied, up to 10% of the assimilation area of potato plants can be destroyed daily—while the destruction of more than 50% of leaves and stems stops the accumulation of tuber yield under the bush. Crop losses on unprotected plantations in Europe reach 70–80%. In some years, the disease appears on plantations very early, even in May. If the meteorological conditions accompanying primary infections are favorable for the development of this disease, then we are dealing with very early epidemics of potato blight and the premature destruction of tops across the field, which significantly affects the size and quality of the crop. In the case of very early infections, potato yield losses may reach even 100%, which directly threatens the country’s food security [13,14,15,16]. The occurrences and intensities of P. infestans on the aerial parts of plants and then on tubers are strictly dependent on the meteorological conditions and the source of the pathogen in the field. The periods of increased air humidity, caused by long rains or long morning mists or dews (RH > 90%) and low temperatures (approx. 15 °C), favor the development of the pathogen causing potato blight. If this type of humid weather persists for several days in June or early July, massive plant contamination can be expected. Under such conditions, P. infestans spores turn into zoosporangia, containing 6–16 tidal spores, which are easily released into the environment, causing massive plant infections and resulting in a high reduction in tuber yield [16]. Lower humidity and air temperatures above 18 °C contribute to P. infestans spores directly by germinating and infecting neighboring plants.
The further development of this pathogen is not only the most intense at temperatures above 20 °C but also at increased ambient humidity. Under such conditions, potato cultivation may be destroyed by P. infestans within a week, and in extreme cases, even within 2–3 days. The pathogen’s spores can spread with wind or rain for a distance of even several dozen kilometers, which facilitates the immediate spread and spread of this disease [17,18]. The harmfulness of potato blight is related both to the decrease in the yield obtained and to the direct infection of tubers. The reduction in the yield is the result of the disease destroying the above-ground part (assimilating surface), leading to the inhibition of tuber growth, which directly threatens the food security of the country’s inhabitants [10,15,16].
It is possible to estimate the risk of a decrease in potato yields as a result of potato blight (Phytopthora infestans Mont de Bary), which is the reason for a significant drop in the yield on the basis of historical data [8]. The rarity of unfavorable meteorological phenomena and the short period of their recording, however, may not capture the real risk [5]. One way to solve this problem is to simulate the values of air temperature and humidity, rainfall and wind speed to obtain a broader picture of the risk of this disease, which can significantly reduce potato yields.
The 1996 World Food Summit established that food security exists when all people, at all times, have physical and economic access to sufficient, safe and nutritious food that meets the nutritional needs and preferences of an active person and a healthy lifestyle [1,2]. This widely accepted FAO definition identifies the following pillars of food security:
- −
- Food availability refers to the availability of a sufficient quantity of food of appropriate quality, either domestically produced or imported (including food aid). What is particularly important is the access to food as a result of sudden shocks (e.g., economic crisis, refugee or climate crisis) or cyclical events (e.g., seasonal food insecurity),
- −
- Access to food means the availability of natural persons to adequate food resources; entitlements to acquire a sufficient amount of food for the preparation of a nutritious diet. Powers are defined as the collection of all commodity packages over which an individual can establish command, taking into account the legal, political, economic and social patterns of the community in which he lives (including traditional rights such as access to shared resources),
- −
- Utilization means using food through an appropriate diet, clean water, proper sanitation and health care in order to achieve a state of good nutrition in which all human physiological needs are met. This also underlines the high importance of non-food inputs for food security,
- −
- Stability means that people must have access to appropriate food at all times in order to ensure food security for the entire public, for households or for an individual person. People should not risk losing their health. The concept of stability can, therefore, refer to both the dimensions of accessibility and access to food security [2,3].
Food uncertainty is likely to deteriorate drastically in many situations and in many countries, especially in Central and Eastern Europe, in the near future [1,3,4]. According to FAO [1], the main factors driving the food crisis include armed conflicts usually followed by extreme weather conditions and climate variability.
Potato production is related to food safety and food security. Several different aspects of food security have been developed in recent years. Food security can not only be considered in various aspects—international and national—but also from the point of view of the household. In the international dimension of food security, the need to combat hunger is indicated [3,4], where food is perceived in terms of a public good. On the other hand, in the national dimension, the emphasis is on the appropriate institutional policy. The aim is for each country to improve its own food law, making the idea of food security a reality.
Hence, the aim of the study was to find the relationship between climate change in Southeastern Poland and the threat to the safety of the potato crop as the basic food raw material [11,12,18]. On this basis, an alternative research hypothesis has been formulated, which assumes that the earlier forecasts of the potential impact of adverse climate changes conducive to the outbreak of P. infestans and the development of this pathogen may allow emergency managers who plan ahead for the occurrence of high risk to prioritize conservation measures plants and save the yield, in view of the null hypothesis that these activities do not affect the outbreak of the epidemic and cannot prevent a decrease in potato yields due to the development of P. infestans.
2. Material and Methods
For the purpose of the work, meteorological data from the experimental stations of the Central Research Center for Cultivated Plants in Southeastern Poland and some selected data from the meteorological stations of the Institute of Meteorology and Water Management (IMGW) in the province of Podkarpackie from 2000 to 2019 were used. Statistical data were also used, such as the following: cultivation area, yields and crops of potatoes (WUS). In addition, the research was based on our own observations and monitoring of potato blight in the years 2000–2019.
2.1. Climatic Conditions
The climate of Podkarpacie is transitional between oceanic and continental climates. It has 3 climatic zones: lowland, submontane and mountain. Average annual temperatures range from 8.3 to 9.5 °C. Annual rainfall ranges from 600 to 1000 mm [19].
2.2. Soil Conditions
The area of Southeastern Poland is characterized by high soil variability, which is related to the very diverse topography. The northern part is flat, and the southern part is mountainous. In lowland agricultural areas, there are mainly fallow and brown soils made of sands, loams, loams and silt deposits. Acidified soils (66%) prevail in this area, including soils that are very acidic 35%, acid 31%, slightly acid 20%, neutral and alkaline 14%. Regardless of the parent rock type and grain size composition, the acidification level is similar (high) both in the northern and southern parts of the voivodeship. Most soils with a pH below 5.5 (very acidic and acidic) are found in the following districts: Bieszczadzki, Brzozowski, Dębicki, Kolbuszowski, Leski, Niski and Sanocki (72–91%). The state of soil abundance in available macroelements and microelements is related to the geochemical composition of the soil, but at the same time, it is an indicator of the level of plant production. As much as 54% of agricultural soils in the voivodship show a deficit of phosphorus. The greatest deficiency of assimilable phosphorus is found in the soils of mountain areas (Bieszczady, Leski, Jasielski, Krośnieński and Sanocki counties) at 78–90% and soils from the Niski and Stalowa Wola counties. Very low and low K2O contents are shown in 45% of the studied soils (in the following districts: Bieszczadzki, Dębicki, Kolbuszowski and Niżański). Seventy-five percent of agricultural land has a satisfactory magnesium content, and only twenty-five percent has a very low and low content. In the northern part of this area of Poland, fawn and brown whitewashed soils formed from water–glacial deposits are dominant. In the central part, there is a predominance of less than brown and leached soils made of sands and tills and brown soils formed from loess and loess-like formations, and the southern part is dominated by acidic brown soils and leached from flysch rocks [20].
2.3. Meteorological Conditions
Meteorological data for the years 2000–2019 were obtained from the meteorological stations at the Variety Assessment Experimental Plants belonging to the Central Research Center for Cultivated Plants (Dukla, Nowy Lubliniec, Przecław and Skołoszów), in the region of Southeastern Poland and from the Agrometeorological Bulletins of the Institute of Meteorology and Water Management [21]. The CLIMGEN model [22] was used to analyze the data.
The station in Dukla (49°33′ N, 21°41′ E) is located in the southwestern part of the Podkarpackie Province at an altitude of 324 m above sea level, with an average annual temperature of 7.3 °C and annual rainfall of 887 mm. Unlike other stations, it was characterized by high rainfall throughout the growing season. The highest amount of rainfall was recorded there in 2001 (830 mm) and the lowest in 2008 (476 mm) (Table 1).
The warmest year was 2008, with an average air temperature of 15.0 °C, while the coldest one was 2005 with an average air temperature of 13.2 °C. All the years were wet, and the hydrothermal coefficient oscillated between 3.1 and 1.7. Optimal hydrological and meteorological conditions occurred only in 2007 [24,25] (K = 1.3).
The station in Nowy Lubliniec (50°17′ N 23°05′ E) is located at an altitude of 217 m above sea level and is characterized by an average annual air temperature of 7.3 °C and a total rainfall of 665 mm (Table 1). The average long-term air temperature in Nowy Lubliniec ranged from 13.8 °C in 2005 to 15.5 °C—in 2003. The highest amount of rainfall occurred in July 2003 and amounted to 239 mm, while the lowest value of this feature was recorded in 2006—11 mm (Table 2). The sum of atmospheric precipitation in the analyzed years ranged from 563 mm in 2000 to 352 mm in 2006. The hydrothermal index ranged from 1.2 to 2.2, with the optimal years being 2007–2008, while they were wet for the remaining years [24,25] (Table 1).
The meteorological station in Przecław, located in the northern part of the region (53°22′ N; 14°28′ E), at an altitude of 185 m above sea level, was characterized by different meteorological conditions and characterized by an average temperature of 8.1 °C and annual rainfall in the amount of 644 mm. The warmest year in this region was 2008, with an average temperature of 8.7 °C. In 2004, the temperature and precipitation conditions during the potato growing season were optimal (K = 1.2). Most of the years analyzed were wet, with the index ranging from 1.3 to 1.9. The highest amount of rainfall in the April-May period was recorded in 2001 (523 mm), and the lowest in 2004 [24,25] (326 mm) (Table 1).
According to the weather station in Skołoszów (49°55′ N 22°48′ E), located at an altitude of 204 m above sea level, the average annual air temperature was 8.3 °C, and the annual rainfall was 667 mm. The warmest year was 2018, and the average air temperature in the period from April to September was 17.0 °C, while the coldest was 2005, with an average temperature of the growing season of 14.0 °C. The lowest amount of precipitation during the vegetation period was recorded in 2004 (297 mm), and the highest was recorded in 2002 (591 mm). The least favorable distribution of precipitation took place in 2008. The years 2000, 2003 and 2008 can be described as quite dry, 2005–2007 can be descripted as optimal, 2008 can be described as quite humid and 2002 is described as wet [24,25] (Table 1).
2.4. Monitoring of Potato Blight
The experimental plots were set up in a randomized block design in 4 replications. Chemical protection against the plague was not carried out during the growing season of potato. Observations on each cultivar were carried out from the moment of potato emergence, every 10 days until the disease appeared on all cultivars. The time when 25% of the plants are already in the field was assumed as the date of potato emergence. In the period of greater risks of plague (prolonged rainfall or fog), observations were carried out more often (1–2 times a week).
The severity of the plague attack was rated on a scale of 9°, where 9° means single necrotic spots and the destruction of the assimilation surface up to 0.5%, and 1° means the complete destruction of the plant. The above data, together with the degree of plant development at the time of observation (according to the BBCH scale), were uploaded to the server thanks to the Pi-monitoring program. Additional information on the location and soil type of the field, cultivated variety and date of emergence of the plants was also entered into the database. After the end of the growing season, the rate of spread of potato blight was determined and calculated as the increase in the damage to tops per unit of time according to van der Plank [26].
2.5. Statistical Analyses
The work uses meteorological data on a year-round scale to generate a real drop in potato yields under the influence of climate change. An earlier prediction of the outbreak of the disease epidemic and an appropriately earlier response to the epidemic of potato blight, which is the cause of a significant drop in the potato yield, is possible thanks to the use of a simulator of records of adverse events in several localities by comparing modeled and observed events over a period of strong intensification of unfavorable meteorological conditions [27].
Based on the analysis of the size of yield characteristics and the course of the weather, the variability of the potato cultivation area, yielding and harvest was determined. Moreover, the partial models of the usefulness of the simulation of atmospheric conditions in the period of 20 years for this region were presented, comparing the observed cases. For this purpose, a combination of statistical methods and simulation modeling was used by using modeling techniques. The forecasts were developed for the same data model using classical statistical methods. Based on the analysis of the size of the cultivation, yield, harvest of potatoes and the course of the weather, a model for forecasting potato yielding in this part of Poland was searched. It was based on empirical data from 2000 to 2019 [28,29,30,31].
The variability of the analyzed yield characteristics and meteorological data was analyzed mainly by means of descriptive statistics (SPSS). On the basis of the diversified course of meteorological conditions during the growing season, an attempt was made to estimate the area of potato cultivation, its yield and harvest by means of a multivariate regression analysis, assuming weighted averages of selected meteorological elements for the examined localities (Table 1). The models used agronomic, phenological and meteorological data, and the correctness of their impact was verified on the basis of data sets not involved in the construction of the models.
Since the magnitude of a given phenomenon is influenced by many simultaneous factors, an attempt was made to build a model forecasting the area and harvest of potato. Such a prediction methodology is useful for optimizing the responses of the independent variables. In this case, the increase in variable y is a response and a function of the yield and the cultivated area. This function can be expressed with the following general formula.
y = f(x,x) + e,
It was assumed that the variables xj are the predictors on which the answer y depends. The dependent variable y is a function of xj and xj2, and the experimental error was denoted by e, which means any measurement error [19]. In order to determine the dependence of potato yield on meteorological indicators, a multivariate regression analysis was used, the parameters of which were determined by the least squares method. As a measure of adjusting the regression function to empirical data, the coefficient of determination R2 was used [27]. Regression analysis models were computed according to the following general formula:
where y denotes the dependent variable, a denotes intercept, b denotes the value of the regression coefficient and x denotes independent variable. Partial regressions were used to examine quantitative relationships between the potato yield and individual independent variables. Partial regression coefficients (bj) indicate how much the yield changes as a given factor increases by a unit. The described relationships were considered in terms of the standard deviation from the arithmetic mean [27]. All statistical analyses were performed using SAS 9.1.
The results of the blight tests were statistically analyzed using the analysis of variance. The significance of the sources of variation was determined by the “F” Fisher–Snedecor test, and the significance of the differences was determined by Tukey’s test [19]. The rate of spread of potato blight as a function of the date of observation was calculated by regression calculus. The observation dates were coded for the calculations, taking the first date as “0”, the second as “10” and the third as “20”, etc. Leaf infection was expressed in logarithmic values corresponding to 9° degrees of the scale and using the van der Plank formula [26]:
where x denotes the values expressed in one hundred parts. They make it possible to express the percentage of damage to the leaf surface in the form of a straight line. The rate of spread of potato blight was considered to be a unit increase in infection over time.
3. Results
3.1. Cultivation Area
The potato cultivation area in 2000–2019 indicated a systematic decline in this value starting from 2002. In 2019, the potato cultivation acreage was only 26.2 thousand hectares, whereas 20 years earlier, there were three times more. The results of the regression analysis showed a downward trend according to the second-degree parabolic regression (Figure 1). The relationship between the analyzed features is usually characterized by the correlation coefficient R, assuming values in the range [−1.1]. It determines the strength of the relationship between the variables. However, the measure of the fit of the regression line to empirical data is the coefficient of determination R2, taking values in the range [0.1] or [0%, 100%]. Moreover, the coefficient of determination can be corrected by the number of degrees of freedom, which increases its value.
3.2. Shaping the Efficiency of Potatoes
The total potato yield varied depending on the course of weather conditions in the years of the study. The highest value of this feature was recorded in 2015 (29.0 tha−1), and the lowest was in 2000 (16.9 tha−1). These fluctuations resulted mainly from the changing course of weather conditions during the growing season and differences in the level of soil factors. The regression analysis of the mean potato yield values for this region showed a curvilinear dependence of the fourth degree tuber yield on the years of the research (Figure 2). The coefficient of determination of this equation was 61.9%, which, according to Kranz [32], ensures its high credibility.
Potato yields in cultivar experiments were characterized by even greater yield variability in this part of Poland. In terms of the total and commercial yield, the yield of very early cultivars was the most diverse, ranging from 30 to 65 t·ha−1 in the case of the total yield and from 37 to 62 t·ha−1 in the case of the commercial yield. The most stable in yieldings were medium-late and late cultivars, and their total yield ranged from 40 to 58 t·ha−1, and the marketable yield ranged from 38 to 52 t·ha−1 (Figure 3).
Determining the trend of changes indicates periodic averages for the time series. Normal moving averages are used only for one-year data or for other time series with no seasonal variation. Two types of averages were used to smooth time series with moving averages: regular or centered. So, by using moving averages, you can smooth series containing only trend and random fluctuations. These fluctuations can be eliminated by replacing the original values of the series with a series of means calculated from several adjacent components of the time series. On the basis of the series y1, y2, …, yn, two-, three- and five-period means can be calculated. These formulas were written as follows.
The function (f (z)) belongs to holomorphic functions, where any function, f (z) with complex values, can be written as follows:
where x, y ∈ R, P (x, y) R and Q (x, y) ∈ R. It has been found that both real and unreal parts of holomorph functions are satisfied by CR equations (i.e., Cauchy Riemann) and are described above (derivation of CR formulas assuming a holomorphism of the function). In this way, random fluctuations have been eliminated to a greater extent from the time series. The new, smoothened series is four words shorter due to improved smoothing. The moving average values were recorded at the level of the middle period (for k = 3 at the level of the second period, and for k = 5 at the level of the third period, etc.). Hence, a secondary series of moving averages was obtained, which is shorter than the empirical series, a primary series of 2 for the 3-year mean, 4 for the 5-year mean, 6 values for the 7-year mean, etc., because only an odd number of words can be assigned a score to a specific period. This allows for further analysis to compare the original time series terms with the smoothened series terms. The longer the moving average used to smoothen the series, the better the smoothing is, but at the same time, the more the periods for which no trend values are obtained are lost. Hence, the selection of the length of the moving averages requires some moderation [5,20].
3.3. Potato Harvest Variability
The evaluation of the yield, made on the basis of the actual results obtained from WUSP [2000–2019], indicates a systematic decrease in potato yields in the analyzed period. Large differences in the value of this feature between consecutive seasons resulted from changes in the cultivation area and the size of the potato yield. The regression analysis of the value of this feature showed a third-degree relationship with the years of research (Figure 4). The highest value characterizing the potato harvest was recorded in 2001, and the lowest was recorded in 2016. This indicates a clear downward trend in potato harvest over the last 20 years. The coefficient of determination of this equation (R2 = 91.56%) indicates its very high reliability [32].
3.4. Potato Harvest Simulation
The simulation of the potato harvest shows that the increase in this value continued until 2018, after which it decreased. There was observed a significant influence of the cultivation area on the harvesting potatoes. The following equation was adopted in the potato area and harvest forecast model.
The coefficient of determination of this equation was R2 = 84.07%, which makes it highly significant and reliable [32].
Forecasting crops yields can be used to plan the structure of their sowing, both on a microscale, i.e., a farm, and on a macroscale, e.g., a country. On this basis, it is also possible to estimate the profitability of growing a given plant. For potato cultivation, forecasting starch yields would be even more important as starch production is determined by law in the EU. Exceeding it reduces the profit of the grower and starch plants. Therefore, the use of modern prognostic techniques can bring measurable financial benefits and improve the profitability of growing a given species.
Table 2 shows certain regularities of the analyzed yield characteristics and meteorological data. The yield is characterized by a high maximum and minimum value. A high maximum and a relatively low minimum were also observed for rainfall in the April–September period. All meteorological data, with the exception of the April–September air temperature, showed a low skewness coefficient lower than one, which means that it takes negative values for distributions with left-hand asymmetry.
Kurtosis for most of the variables was positive, in a wide range from 0.11 to 10.56, but with a distribution close to normal, which means the more frequent occurrence of extreme values but at the same time a greater probability of the expected values. For the variables of tuber yield and air temperature in the April–shadow–May period, the kurtosis value ranged from −0.99 to −1.33, which means a greater share of values close to the median than in the normal distribution. The results in this case are less focused around the midpoint (Table 2). The standard deviation of the examined variables showed relatively little differentiation throughout the year. The highest values of the standard deviation were recorded for the tuber yield and the total rainfall in the period April–September, and the lowest in the case of the April–September hydrothermal coefficient and air temperature in August–September. The dispersion of the obtained results was characterized by the coefficient of variation, which, being the quotient of the absolute measure of trait variability, made it possible to compare the differentiation of several communities in terms of the same feature and the same data set in terms of several functions. The smaller the value of the coefficient of variation, the more stable the function is. The highest variability of the features described by the coefficient of variation was characteristic for the sum of precipitation and the Sielianinov hydrothermal coefficient for the April–September period, while the air temperature in June–July and August–September turned out to be the most stable (Table 2).
The regression analysis was based on the analysis of Pearson’s simple correlation coefficients for the investigated dependent and independent variables (Table 3).
The data that most strongly correlated with each other were analyzed using the multiple, polynomial, linear and partially nonlinear regression methods, which allowed the determination of the influence of many independent features on one selected dependent feature and to build an appropriate regression model. Multiple regression was preceded by the analysis of the determination coefficient R2 for the examined features and the determination of the probability coefficient for the absolute statistic t, verified at two significance levels p0.05 (statistically significant difference) and p0.01 (statistically significant difference) [19].
3.5. Influence of Air Temperature on Tuber Yield
The temperature conditions in the April–May period and the precipitation and temperature-precipitation conditions described by the Sielianinov hydrothermal index in April–September had a decisive influence on the potato yield in the southeastern part of Poland. The influence of air temperature in this period was described by the power function equation in the following form.
y = 13.52x0.1349
This indicates that a positive influence of air temperature in April–May is decisive for plant emergence, rooting and the formation of stolons and tubers. The value characterizing the yield increased with the temperature increase in this period. The coefficient of determination of this equation was 88.63%, which makes it significant and reliable (Figure 5).
Similar relationships were proven for the June–July period. During this period, there was also a positive impact of ever higher air temperature on the shaping of the potato yield described by the equation on Figure 6.
The temperature in the first part of the growing season had a positive effect on potato yields. This fact is confirmed by the coefficient of determination (R2 = 87.4%).
The results of the regression analysis of the yield with air temperature in the second part of the growing season (August–September) are described by the formula in Figure 7. As a result of the air temperature increase in this period of time, there was a systematic decrease in yield value. The value of the coefficient of determination, amounting to 84.67%, makes the equation highly reliable [19].
3.6. Influence of Precipitation on the Formation of Tuber Yield
The factor used to assess the influence of meteorological conditions on potato yielding was also the sum of atmospheric precipitation. Among the periods in which their impact on the variability of potato yielding was the most frequent, the rainfall in the April–May period turned out to be the most impactful. The regression model described by the following equation.
y = 21,936x−0.051,
This indicates a negative impact of increasing sum of rainfall in the analyzed time interval on tuber yield (Figure 8). The coefficient of determination of this equation amounting to 77.02% indicates its high credibility. It was shown that the potato yield assessed on the basis of data from the Central Statistical Office, limited by excess water in April–May, turned out to be 39% lower than the actual yield and as much as 65% lower than the potential yield in the experiments obtained in the Central Research Center for Testing in Poland.
The results of polynomial regression analysis of tuber yield versus rainfall total, performed with the stepwise method, in the case of other time intervals turned out to be insignificant. The coefficients of determination of these equations were also low, which means that other environmental factors not considered in the analysis could have contributed to tuber yields.
3.7. Influence of Hydrothermal Conditions on the Formation of Tuber Yield
The impact of these conditions was similar to that of the rainfall in April–May. From the regression equation described by the formula in Figure 9 results, it can be observed that thermal and precipitation conditions negatively influenced the amount of potato yield. With the increase in the value of the hydrothermal index, the value of the yield decreased systematically. Of all the meteorological elements described by the coefficient of determination, the hydrothermal index turned out to be the most reliable (R2 = 87.72%).
In Figure 10, the values of changes in precipitation are correlated with the average air temperature. Regression analysis showed that these data accounted for 38–49% of the variability in rainfall levels. The diagram also shows the correlation between the yield and meteorological elements in individual localities. The diagram presents selected meteorological parameters, and Student’s t-test showed that rainfall during the growing season was the most statistically significantly (p ≤0.01) correlated with the air temperature in June–July.
3.8. The Rate of Spread of Potato Blight
The first symptoms of potato blight were usually observed 42–73 days after planting, depending on the study year and 44–81 days depending on the variety. The resistance traits of the cultivars studied determined the date of appearance of P. infestans on plants and the infection of 50% of the area of potato leaf blades and the rate of disease spreading on the aerial parts of plants.
Table 4 shows the rate of potato late blight spreading by groups of earliness. Very early varieties showed the fastest spread of this pathogen, while the slowest spread was observed in medium-late and late varieties. The average time of destruction of 50% of the assimilation area for varieties with increased resistance (5–6°) was 22 days—ranging from 16 (very early varieties) to 31 days (late varieties). The theoretical term of stopping the yield for late cultivars resistant to P. infestans (resistance 6–7° on a scale of 9°) differed significantly from the other assessed cultivars by about 7 days.
The meteorological conditions in the years of the study were the most decisive factor in the time pace of P. infestans spread. The fastest spread of this pathogen, in all groups of early varieties, was in 2007, the flood year, and the slowest was in the dry year, 2011 (Table 4).
The analysis of the simple correlation between the P. infestans spreading rate and the potato tuber yield was analyzed. Pearson’s simple correlation coefficients indicate a high positive correlation between the rate of spread of the plague in individual early age groups (r = 0.87 to 1.00), which results from the internal intercorrelation (Table 5). The relationship between the rates of potato late blight spreading and the size of the total, commercial yield of medium-early to late varieties and the yield of very early and early varieties harvested 60 and 75 days after planting turned out to be significantly negative, which means a negative impact of the rate of potato late blight spreading on the yield general and commercial, as well as the yield of early varieties harvested both in the first and second harvest dates. The strongest negative relationship between the rate of spread of potato blight and the potato yield was observed for the commercial yield of tubers (r = −0.62 to −0.71). For very early and early cultivars, the rate of the spread of the blight did not have a significant negative effect, which results from the short vegetation period of these cultivars and their “escape” from infection with P. infestans. The shortest time of destruction of 50% of the lichen surface was found in the group of susceptible cultivars (very early and early cultivars with a resistance of 2–4° on a 9° scale).
Among the assessed groups of potato cultivars, a large variation in the pace of development of P. infestans was observed, from the onset of the disease to the cessation of harvesting. The differences resulting from the level of resistance were reflected in the assessment of the destruction of the assimilation area at the end of the growing season. It was found that the destruction of the aerial part decreased with an increasing degree of resistance on P. infestans. The lowest values of the destruction of the assimilation area were found in the group of medium-late and late cultivars.
4. Discussion
4.1. Climate Changes and Potato Yield and Productivity
Climate change is having an increasingly strong impact on agriculture, but there is no unanimity in the scientific community and there is still no clarity on the directions of this impact. Earlier forecasts of the impact of climate change on the agricultural economy were more radical and assumed very rapid changes. One of such early forecasts was made in 1991 at the Institute of Soil Science and Plant Cultivation in Puławy on the basis of the General Circulation Model developed by the Goddard Institute for Space Studies. According to this model, climate changes were to be beneficial for agriculture and to bring an increase in the yields of all crops, except for potatoes, after 2020, and to significantly increase the area of maize and soybean cultivation [33]. The last two forecasts were confirmed, the others, unfortunately, were not. It was assumed that the growing season would significantly extend, which would allow for the extension of the assortment of arable crops and the improvement of animal production efficiency. This optimism resulted from the prediction of an increase in the average annual air temperature by 3 °C, an extension of the growing season by about 30–40% and an increase in the average amount of rainfall from 625 to 1100 mm [33]. It is now known that such a scenario is not realistic. Recently, the prevailing view is that, on a general scale, the expected changes in the form of global warming will bring beneficial effects in the agricultural economy of Europe. According to most authors [34,35,36,37,38,39,40,41,42,43], the production potential of agriculture was supposed to increase, but unfortunately in the case of potatoes, this scenario did not work. Our research, carried out on the basis of the results of the Central Statistical Office and COBORU research in southeastern Poland show that, in the last 20 years, both the yield, area and harvest of potatoes decreased. The reasons for this condition are manifold. Tomczyk et al. [44] proved that, in Poland, in the last 20 years, there was a significant increase in Tmax in the summer period. This shows, inter alia, for the ten warmest years in the analyzed period, mainly after 2000. The consequence of the increase in Tmax is the increase in the frequency of hot days. A further increase in the number of hot days in Poland is forecast in the coming decades. The smallest changes are predicted for the areas with the most intense changes in Tmax. Agriculture is a sector that is particularly vulnerable to the effects of climate change, and climatic factors are important factors in the success of agricultural production. Therefore, the effects of climate change already have a negative impact on the food security of society [45,46]. The Climate Coalition (CC) report “The impact of climate change on Poland’s food security” warns that if Poland does not achieve the goals of the Paris Agreement and stops the increase in the average global temperature below 2 °C, the food security of citizens at the global level, regional and local will be increasingly threatened. Therefore, both the reduction in greenhouse gas emissions and multi-directional adaptation measures in agriculture are necessary.
According to the reports of the Agricultural Drought Monitoring System in Poland [47], in the years 2009–2011, there was a significant risk of drought in potato crops. In the years 1983–2002, the level of precipitation during the potato growing season reached the optimum only in five of the twenty years studied [35,47,48], and the losses of tuber yield in Poland for this reason ranged from 7% to 45% [47]. The high acclimatization capacity of crops may turn out to be a disadvantageous phenomenon, as it was associated with significant energy expenditure on the reconstruction of structures and adapting their functions to stressful conditions, which results in a reduction in agricultural yields [12,34,38,39,49]. In research on plant productivity, the decline in agricultural yield is often used as a measure of the possibilities of the studied cultivars for the stress syndrome occurring during the growing season. Under such assumptions, the yield is the resultant of many different mechanisms responsible for the diverse sensitivity of plants to environmental stresses, and each of these mechanisms may work differently under specific environmental conditions. The approach that takes yield loss as a measure of resistance may be useful for the final evaluation of the effectiveness of breeding treatments and has a greater selection value than the resistance criteria [38]. The research results presented in the paper concern issues related to the reaction of potatoes to the diversified course of meteorological conditions during the potato growing season and are based on numerous figures from the period of 20 years (2000–2019), taken from several sources (Central Statistical Office, Provincial Statistical Office, Institute of Meteorology and Water Management, and Experimental Stations of the Central Research Center for Cultivated Plants). These results prove that climate change in this period had a significant impact on all the studied economic, meteorological and physiological-natural features.
Precipitation is the most sensitive element of climate changes and that changes in time and space. According to Kalbarczyk [39], no permanent trend has taken place over the last 500 years. This period was subject to much thermal continentalism than it is today. According to the calculations of the Sadowski continentalism index [50], it was found that in Eastern Europe, the warmest century was the 11th century, and in Western Europe, it swas the 20th century, while the coldest centuries were in the 15th and 12th centuries, respectively. From the fifteenth century, the degree of continental climate in Poland remained at a high level until the nineteenth century. Average annual air temperatures in winter were much lower, by approximately 1.5–3.0 °C, compared to the present situation, while summer temperatures were higher than today by 0.9–1.5 °C. Over the past 100 years, Earth has warmed by 0.85 °C, and the speed of this process is increasing. In Europe, the temperature has risen by almost 1 °C.
The impact of climate change on world agriculture can be considered in two main aspects: natural and socio-economic. The first is direct, and the second is indirect, usually resulting from the former. The changes in the natural basis of the agri-environmental economy relate primarily to the greenhouse effect associated with an increase in the concentration of carbon dioxide in the atmosphere. The main cause of the rapidly following climate change is the increase in carbon dioxide (CO2) content in the atmosphere, causing the so-called greenhouse effect. This will enable some cereal crops, such as wheat or rice, as well as potato plants to photosynthesize more intensively and, consequently, result in faster development with higher yields [50,51,52,53]. It was assumed that, as a result, increasing plant production may reduce the specter of hunger but only in the case of organized international activities. It is generally known that areas of hunger are concentrated in the poorest countries, where climatic conditions generally pose problems for proper farming. It is primarily the dry zone of Africa and some regions of Asia [54]. According to Kulig [5] and Ziernicka-Wojtaszek [6,7], the optimism related to the increase in plant production as a result of the increase in CO2 in the atmosphere was, however, premature. These authors propose that the influence of carbon dioxide concentration in the atmosphere on the global agricultural production should be considered in direct and indirect categories. The former concerns the intensification of photosynthesis and the possibility of plant development with lower water resources and their more effective use. Indirect impacts should be seen in the aspect of climate and soil changes, as well as in the development of diseases and pests. In the case of direct impacts, our research indicates a very large differentiation in the increase in yields resulting from the increase in the carbon dioxide content, but under natural conditions. Laboratory experiments confirm that plants absorbing more carbon grow faster and are larger [39]. Moreover, the increased concentration of carbon dioxide increases the efficiency of water use. This applies in particular to plants of the so-called C3 group (e.g., wheat, rice, soybean and potato), which show, under conditions of increased CO2 content, an increased photosynthesis rate and a moderate decrease in transpiration. On the other hand, plants from the C4 group (maize, sugar cane, sorghum, etc.) show relatively slower photosynthesis (slower biomass growth) under these conditions [5,49].
Repeated droughts and desertification on almost all continents already threaten the livelihoods of some 1.2 billion people [4]. For example, an increase in CO2 from 330 to 660 ppm (parts per million—gas particles per million air particles per unit volume) resulted, under optimal conditions, in an increase in cotton yield due to the concentration of carbon dioxide. The main conclusion of physiological studies [49] is the fact that the positive effect of an increase in CO2 than twice lower than other important environmental factors (humidity and thermal conditions, the content of mineral nutrients and another) can counteract this influence. The concentration in laboratory conditions on plant production is not confirmed under the conditions of natural plant cultivation.
The research of many authors [5,6,7,35,36,37,51,52,53] shows that the most likely scenario will be a slow temperature increase resulting from an increase in the concentration of carbon dioxide in the atmosphere. The result will be a shrinkage of cool climate zones and an expansion of hot climate zones. The effects of the temperature rise will be more pronounced in areas near the poles than in the equatorial areas. Therefore, the shift in climatic zones will be more marked in higher latitudes. In regions with a temperate climate, such as Central and Eastern Europe, the shift by 1 °C will be from 200 to 300 km [54]. This will have a direct impact on the extension of the range of some crops, including sweet potatoes [12].
The production potential will increase mainly in the temperate climate zone. Global changes in world agriculture under the influence of climatic changes will cause many processes in the natural environment that are still difficult to identify. They will also shape socio-economic processes and phenomena. The considerations to date show that the greatest increase in production possibilities will take place in the most economically developed countries, where problems with food overproduction are observed. On the other hand, in the poor countries of Africa and Asia, where there are hunger zones, there may be growing food problems resulting from reduced production possibilities [54]. The increase in the production potential of agriculture in rich countries will result in an increase in the average global agricultural production per unit area. There is still a problem of food overproduction in the European Union countries, which the Common Agricultural Policy is trying to mitigate and eliminate. One of the directions of activities is the widely understood extensification of agricultural production, including the reduction in the area of land developed by agriculture [7,50].
Europe and North America have relatively ample room to adapt to the effects of climate change. The research conducted so far shows that there will be rather favorable changes in terms of agricultural production possibilities. However, in subtropical regions (e.g., in southern Europe), large areas may be exposed to drought, while on the continents of the Americas, the risk of extreme phenomena will increase: floods, droughts and cyclones. The warming of the climate will cause the extension of dry areas also to the areas of Southern Europe and the necessity to take decisive measures in the field of water retention and the irrigation of farmland [45,50,54].
Global climate change poses a serious challenge to global food security. The sensitivity of germs, potentially toxin-producing microorganisms and other pests to climate factors, shows that climate change can affect the incidence and intensity of certain food-borne diseases.
4.2. Climate Change and the Spread of Pathogens
Climate change and changes in ecological conditions can promote the spread of pathogens, parasites and diseases, with the potential to seriously affect human health, agriculture and the environment [54,55,56,57]. They are one of the important stressors that can contribute to the extinction of many species. The IPCC estimates that 20–30% of plant and animal species assessed so far in climate change studies are at risk of extinction if temperatures reach levels projected at the end of this century [50].
Poland is one of the largest potato producers in the world, and it is one of the key edible and industrial plants. Unfortunately, its yields are almost half of those obtained in other EU countries. The main reasons are as follows: high susceptibility of genetically homogeneous cultivars to P. infestans and imperfect protection of plantations against pathogen and climate variability, which is favorable for the development and spread of this pathogen [11,56,57] and the ability to carry infectious material. Andrivon et al. [58] believed that the spores of Ph. infestans can spread to a distance of 70–80 km from the site of infection. Aylor et al. [59] state that the spores of the blight at wind speeds of 20–40 km h−1. They can spread from the site of infection to 80–160 km in 4 h. Moreover, the short infection cycle and the possibility of producing a large amount of infectious material creates favorable conditions for the development of blight, and 100,000 spores can be formed from one pathological lesion on a leaf. Fry [56] estimates the number of sporangia at 300,000 for 3 days, and sporulation may begin as early as one or two days after the onset of symptoms [58]. The amount of yield losses ranges from 30 to 60% [60], 70% [61,62] and 100% [57], and the growth of this pathogen, in the absence of protection, amounts to about 10–50% due to the premature destruction of the tops and 0–40% due to the destruction of tubers [12,13,14]. Haverkort et al. [63] estimate that, in Europe, the annual expenditure on combating potato blight amounts to EUR 900 million. In the USA, the amount of expenditure on protection against the plague is estimated at USD 3 billion per year. Global conservation costs and crop losses are estimated at USD 6.7 billion [5].
In the conducted research, the group of early varieties related to the resistance of cultivars to this pathogen had the greatest influence on the pace of spreading P. infestans. The influence of cultivar-related resistance on these plant health traits is confirmed by the studies of Croxall and Smith [64], Kapsa [61,62], Osowski [15] and Sawicka [12,13,14]. In Poland, where protection against late blight is carried out only on about 40% of potato plantations, the average yield loss was 20–25%. Losses on unprotected plantations are estimated at 70–80%. There are two phases in the development of late blight: early (hidden) and epidemic. During the first stage, the fungus multiplies, leading to local infections and the growth of primary infectious foci depending on the following: density and location of primary foci, susceptibility of the cultivars to late blight, plant physiological condition, weather conditions and changes in microclimate and ecoclimate [12,14].
The date of the outbreak in Polish conditions is usually June or July and depends mainly on the air temperature and precipitation patterns during the growing season. The development of the disease after reaching the epidemic stage is usually rapid, and usually, after a few or several days, the plants are almost completely destroyed by the plague. The date of the outbreak and the pace of its development determine the reduction in potential potato yields [11,13,15]. Over the past two decades, an increase in the infectivity of P. infestans has been observed, which results from changes in the population of this pathogen. The result of these changes is an earlier onset of more rapid disease development, increased pathogenicity of the fungus, changes in epiphytotic the development of primary P. infestans infections and the breaking of genetic resistance of many potato cultivars and the ineffectiveness of traditional methods of plantation protection against the pathogen [17,18]. The increased severity of plague and the losses it causes justify the need to combat it. However, the goal of most potato blight control systems, due to their commercial nature, is a comprehensive plant protection strategy with the recommendation of specific chemical preparations and their dosage, while predicting the timing of an outbreak of P. infestans is only auxiliary or even switched off or is established only in case of occurrence through linear models. Almost all decision-making programs were developed on the basis of observations of the development of potato blight in Western Europe, which makes them completely unadjusted to other climatic conditions [2]. Therefore, there is an urgent need to monitor and predict the timing of an outbreak based on meteorological data and/or potato development phases.
Using the method of determining the upper and lower limits of the trait value for groups of varieties significantly different from each other, the cultivars tested were divided into three groups: cultivars with the lowest share of plants with symptoms of potato blight, in which the infection was less than 4%; cultivars with an average share of individuals with symptoms, where the paralysis ranges from 4.1 to 8.0%; and cultivars with a high proportion of plants infected with this pathogen, with an infection rate of > 8%. The late varieties showed the highest resistance to late blight; the lowest resistance was observed in very early and early varieties. It can be assumed that specific defense substances (so-called phytoalexins), which are activators of defense reactions to pathogenic factors, can trigger the trigger mechanism of resistance to plant infection by P. infestans in plants. Stark et al. [49] states that the compounds of this type can act as effectors of the expression of the plant resistance genome, as well as activate enzymes, transfer physiological stimuli from membrane receptors to the genome, etc., and, therefore, fulfill the function of the first informants in the pathogenesis and resistance of plants in establishing parasitic contact. The plant tries to preserve the species in this targeted way.
4.3. Ensuring Food Security
Providing a food base is the basis of food security for each country. The definition of food security adopted at the Food Safety Summit covers four aspects: food availability, access to food, food use and stability [1,2,11]. Food security can be analyzed on several levels (security dimensions): individual or family security, also referred to as food security of households, national food security and international food security [2,65]. Economic globalization justifies the use of the concept of global food security [66]. Particular attention is now paid to the food security of households. The Food and Agriculture Organization of the United Nations (FAO) defines them in such a manner that all households have physical and economic access to sufficient food for all members, and there is no risk that they will lose this access [2,65].
In the legal sense of “food security”, it is said that food security is an optimal state assumed by the legislator. The means that the relevant provisions of national and EU law and, above all, the provisions of international law are required to achieve food security. According to the FAO/WHO (Food and Agriculture Organization of the United Nations), food security means a state in which all people have access to food that is safe for health and value. In legal terms, the concept of food security is related to the human right to food and the need to combat hunger [2,4].
In turn, from a philosophical point of view, “food security” is expressed in the fact that society should not allow any of its members to starve. In this approach, the opposite of food security is hunger related to the body, which can result in the loss of human dignity [4].
Food safety is considered in a production context, especially potato production. Food safety mainly depends on the health quality of food. The Act of August 25, 2006, as amended (2020/2021) on food and nutrition safety, specifies the requirements and procedures necessary to ensure food and nutrition safety in accordance with the provisions of Regulation (EC) No. 178/2002 of the European Parliament and of the Council of 2002 establishing the general principles and requirements of food law, establishing the European Food Safety Authority and laying down procedures for food safety (Journal of Laws EC L 31 of 01.02.2002, p. 1; EU Journal of Laws), called “Regulation No 178/2002”, “by regulation No. 1935/2004” [67,68,69,70]:
- (1)
- Food health requirements—in the scope not regulated in the regulations of the European Union.
- (2)
- Requirements for compliance with hygiene rules:
- (a)
- Food—within the scope not regulated in Regulation (EC) No. 852/2004 of the European Parliament (Journal of Laws UE L 139 of 30 April 2004, p. 1),
- (b)
- Materials and articles intended to come into contact with food—within the scope not regulated in Regulation (EC) No. 1935/2004 of the European Parliament of 27 October 2004 on materials and articles intended to come into contact with food (Journal of Laws UE L 338 from 13 November 2004),
- (3)
- The competence of the authorities to carry out official food controls in accordance with the principles set out in Regulation (EC) No 882/2004 of the European Parliament and of the Council of 29 April 2004 on official controls performed to verify compliance with feed law and food and animal health and animal welfare rules (Journal of Laws UE L 191 of 30 April 2004, p. 1), hereinafter referred to as “Regulation No. 882/2004”,
- (4)
- Requirements for the performance of official food controls—within the scope not regulated in Regulation No 882/2004.
The results of the research by Otekunrin et al. [4] carried out in Nigeria revealed that only 12.8% of households had food security, while 87.2% had varying levels of food insecurity. In Europe, food security is at a higher level than in developing countries, but there are large regional and national differences indicated by FAO/WHO [2], Otekunrin et al. [4,54], Yuen [10], Karaczun [45], Scott et al. [70] and Tripathi et al. [71]. The main objectives of the European food safety policy are to protect human health and consumer interests and to support the smooth operation of the European single market. Thus, the European Union supervises the legal status, the establishment and compliance with control standards in such areas as follows: hygiene of feed and food products, animal health, plant health and the prevention of food contamination by external substances. In addition, the farm-to-fork approach in the EU aims to ensure a high level of safety at all stages of the production and distribution process of all food products placed on the EU market, regardless of whether they are produced in the EU or imported from third countries. This piece of legislation is a complex and comprises an integrated system of rules governing the entire food chain. These rules will be further developed in the context of the Commission’s Farm to Fork Strategy, which was launched in 2020 as part of the European Green Deal. Nevertheless, the level of food security is clearly differentiated between European countries, and Europe is ranked behind North America according to the Global Food Security Index created in cooperation with the Economist Intelligence Unit [4,72]. The first “20” of the index includes eleven EU countries, with Finland, Ireland and the Netherlands at the fore. Bulgaria, Slovakia and Hungary ranked lower; 44, 40 and 36, respectively, Poland was placed 25th in this ranking. The need to implement more solutions that will provide people in need with access to a wide range of food resources is stressed. This variation in food safety is due to an internal discrepancy. The level of food security in the EU is therefore not uniform, as the results of both Mediterranean and Central and Eastern European countries are much weaker than in Western Europe or Northern Europe. Currently, the EU’s food system is dominated by other challenges such as food waste, over-consumption, obesity and the environmental impact of food production [72].
The results presented by the United Nations [3] indicate that age, years of education of the household head, gender, farm size, farm experience, non-farm income, food expenditure and access to advisory services significantly contribute to food insecurity among farms. The state’s efforts should, therefore, be directed towards promoting education-related household intervention programs in order to broaden their knowledge of nutrition, which may improve their food security status. In addition, rural infrastructure facilities should be provided, such as water supply, rural gasification, internet services and healthcare services that promote healthy lifestyles and increase agricultural productivity in households.
The relationship between food safety and food security is also important. The food law does not explicitly state the relations between the two concepts in question, although both are legal concepts. However, the literature on the subject indicates that food safety is an element of a wider issue, which is food safety. Food safety in the legal sense seems to correlate with the aspect of “Food availability” as part of food security in economic terms. Food safety is primarily related to its health values, and “food security” in the “Food access” dimension also means the need to provide food that is safe for health. Therefore, both of these terms draw attention to the need to eliminate pathogenic substances that are dangerous to human health from food products. Thus, it can be said that (in the indicated aspects) the terminological scope of food safety is wider than the terminological scope of food safety and covers it.
The research carried out was innovative as it combined the assessment of climate change with food and food safety. This will allow for better planning of the supply of food raw materials, forecasting possible drops in the potato yield based on the monitoring of potato blight and ensuring a healthy raw material, both for direct consumption and food processing in the southeastern part of Poland.
5. Conclusions
Climate change creates, on the one hand, new opportunities for potatoes as an alternative source of human food and animal feed, as well as a raw material for the production of bioethanol and starch, and on the other hand, unfavorable weather conditions may contribute to a decrease in the acreage suitable for potato cultivation as a result of the deepening hydrological drought and the reduction in yielding, in relation to the actual and potential yield.
The effect of climate warming in the southeastern part of Poland is a prolonged growing season, an earlier start of vegetation, no or little snow cover and the development of diseases, including a faster spread of potato blight, which results in a decrease in the total and commercial yield of early and medium-early varieties, medium-late and late as well as a decrease in the yield of early varieties intended for very early and early potato harvesting.
The meteorological conditions exerted a significant influence on the variability of the potato yielding. The positive dependence of tuber yield was demonstrated on the following: air temperature in April–May and June–July and negative temperature in August–September. Along with the increase in the average temperature in April–May and June-July, tuber yields should be expected to increase, assuming that the increase in temperature will be accompanied by an increase in rainfall in this period.
It has been documented that thermal, precipitation and precipitation conditions have a negative effect on potato yields, especially in the early stages of the growing season. Excessive rainfall in April–May may significantly reduce the yield of potatoes. The yield limited by the excess of water was 39% lower than the actual yield and 64% lower than the potential potato yield.
The modeling method used in this study, after the necessary modification, can be used to forecast the yields of other crop species, which in turn can bring about measurable macroeconomic and microeconomic effects.
Climate changes affect food security in the field of basic food raw materials, including potato, as one of the most important food products and raw material for the processing of main food products such as French fries, crisps, dried products, frozen and freeze-dried products, raw material for the production of starch and bioethanol and influence on the state’s food security policy.
Author Contributions
Conceptualization, B.S., P.B. and P.P.; methodology, P.P. and P.B.; software F.Y.; validation, D.S., P.B. and B.K.-M.; formal analysis, F.Y.; investigation, P.B.; resources, D.S. and P.P.; data curation, P.P.; writing—original draft preparation, D.S.; writing—review and editing, B.S., P.B. and B.K.-M.; visualization, F.Y. and D.S.; supervision, B.S. and P.P.; project administration, P.B. and P.P.; funding acquisition, B.S. All authors have read and agreed to the published version of the manuscript.
Funding
This research received no external funding.
Institutional Review Board Statement
Not applicable.
Informed Consent Statement
Not applicable.
Data Availability Statement
Not applicable.
Acknowledgments
Thank you for supporting the Central Research Center for Cultivated Plants in Słupia Wielka and for sharing the data.
Conflicts of Interest
The authors declare no conflict of interest.
References
- FAO. Hunger Hotspots—FAO-WFP Early Warnings on Acute Food Insecurity: February to May 2022 Outlook; FAO, WFP: Rome, Italy, 2022; ISBN 978-92-5-135662-3. [Google Scholar] [CrossRef]
- FAO; IFAD; UNICEF; WFP; WHO. The State of Food Security and Nutrition in the World 2021. In Transforming Food Systems for Food Security, Improved Nutrition and Affordable Healthy Diets for All; FAO: Rome, Italy, 2021. [Google Scholar]
- WHO. Draft WHO Global Strategy for Food Safety 2022–2030. Towards Stronger Food Safety Systems and Global Cooperation. 2021, p. 48. Available online: https://cdn.who.int/media/docs/default-source/food-safety/who-global-strategy-food-safety-2022-2030.pdf (accessed on 30 March 2022).
- Otekunrin, O.A.; Otekunrin, O.A.; Sawicka, B.; Pszczółkowski, P. Assessing Food Insecurity and Its Drivers among Smallholder Farming Households in Rural Oyo State, Nigeria. HFIAS Approach. Agric. 2021, 11, 1189. [Google Scholar]
- Kulig, B.; Skowera, B.; Klimek-Kopyra, A.; Kołodziej, S.; Grygierzec, W. The Use of the WOFOST Model to Simulate Water-Limited Yield of Early Potato Cultivars. Agronomy 2020, 10, 81. [Google Scholar] [CrossRef] [Green Version]
- Ziernicka-Wojtaszek, A. Porównanie wybranych wskaźników oceny suszy atmosferycznej na obszarze województwa Podkarpackiego (1901−2000). Woda Środowisko Obszary Wiejskie 2012, 12, 365–376. (In Polish) [Google Scholar]
- Ziernicka-Wojtaszek, A. Pluviothermic conditions concerning the vegetation of key crops in south-eastern Poland 1901–2010. Appl. Ecol. Environ. Res. 2020, 18, 839–848. [Google Scholar] [CrossRef]
- Yuen, J.E.; Andersson, B. What is the evidence for sexual reproduction of Phytophthora infestans in Europe? Plant Pathol. 2013, 62, 485–491. [Google Scholar] [CrossRef]
- Bostancı, S.H.; Yıldırım, S. Sustainable Communities vs. Climate Refugees: Two Opposite Results of Climate Change. In Handbook of Research on Novel Practices and Current Successes in Achieving the Sustainable Development Goals; Popescu, C., Raluca, G., Eds.; IGI Global: Hershey, PA, USA, 2021; pp. 298–319. [Google Scholar] [CrossRef]
- Mezghani, A.; Parding, K.M.; Dobler, A.; Benestad, R.E.; Haugen, J.E.; Piniewski, M. Projections of Changes in Temperature, Precipitation and Cove in Poland. In Climate Changes and Their Impact on Selected Sectors in Poland; Zbigniew, W., Kundzewicz, Ø.H., Okruszko, T., Eds.; Polska Akademia Nauk: Poznań, Poland, 2017; pp. 94–118. (In Polish) [Google Scholar]
- Yuen, J. Pathogens which threaten food security: Phytophthora infestans, the potato late blight pathogen. Food Sec. 2021, 13, 247–253. [Google Scholar] [CrossRef]
- Sawicka, B.; Michałek, W.; Pszczółkowski, P. The relationship of potato tubers chemical composition with selected physiological indicators. Zemdirb. Agric. 2015, 102, 41–50. [Google Scholar] [CrossRef] [Green Version]
- Sawicka, B.; Kapsa, J. Effect of varietal resistance and chemical protection on the potato late blight (Phytophthora infestans [Mont.] de Bary) development. Potato Res. 2001, 44, 303–304. [Google Scholar]
- Sawicka, B.; Pszczółkowski, P.; Krochmal-Marczak, B. Efektywność różnych strategii ochrony ziemniaka przed Phytophthora infestans. Pamiętnik Puławski 2006, 142, 411–428. (In Polish) [Google Scholar]
- Osowski, J. The rate of potato late blight development (Phytophthora infestans) in 2005–2007 depending on weather conditions and cultivar resistance. Biuletyn IHAR 2010, 255, 109–118. [Google Scholar]
- Kisinga, B. Predicting potato late blight disease pressure using in artificial neural network. Res. Rep. Math. 2019, 42, 1–46. [Google Scholar]
- Kapsa, J. Zmiany stanu zagrożenia i ochrony plantacji przed zarazą (P. infestans) w Polsce na tle krajów europejskich. Prog. Plant Protect 2004, 44, 129–137. [Google Scholar]
- Kapsa, J. Effect of climatic conditions on infection pressure of Phytophthora infestans and harmfulness of the pathogen to potato crops. J. Plant Prot. Res. 2007, 47, 357–366. [Google Scholar]
- Kaszewski, B.M. Polish climate changes in the works of Polish climatologists. Geophys. Rev. 2015, 3–4, 217–235. (In Polish) [Google Scholar]
- The State of the Environment in the Podkarpackie Province in 1999–2008. VII Soils. Available online: https://wios.rzeszow.pl/cms/upload/edit/file/opracowania/raporty/1999-2008/r7.pdf (accessed on 30 January 2022). (In Polish).
- Biuletyn Państwowej Służby Hydrologiczno-Meteorologicznej 2000−2019; Wydawnictwo IMiGW: Warszawa, Poland, 2019. (In Polish)
- Stöckle, C.; Donatelli, M.; Nelson, R. CropSyst, a cropping systems simulation model. Eur. J. Agron. 2003, 18, 289–307. [Google Scholar] [CrossRef]
- Skowera, B.; Puła, J. Skrajne warunki pluwiometryczne w okresie wiosennym na obszarze Polski w latach 1971–2000. Acta Agroph. 2000, 3, 171–177. (In Polish) [Google Scholar]
- Skowera, B.; Kopcińska, J.; Ziernicka-Wojtaszek, A.; Wojkowski, J. Niedobory i nadmiary opadów w okresie wegetacji ziemniaka późnego w województwie opolskim (1981–2010). Acta Sci. Pol. Form. Circumiectus 2016, 15, 137–149. (In Polish) [Google Scholar]
- Skowera, B. Changes of hydrothermal conditions in the Polish area (1971−2010). Fragm. Agron. 2014, 31, 74–87. [Google Scholar]
- Van der Plank, J.E. Plant Disease: Epidemics and Control; Academic Press: New York, NY, USA, 1963; p. 345. [Google Scholar]
- Koronacki, J.; Ćwik, J. Statystyczne Systemy Uczące Się; Wydanie, A.L., II, Ed.; Akademicka Oficyna Wydawnicza EXIT Andrzej Lang: Warszawa, Poland, 2005. (In Polish) [Google Scholar]
- Muriithi, D.K. Application of Response Surface Methodology for Optimization of Potato Tuber Yield. Am. J. Theor. Appl. Stat. 2015, 4, 300–304. [Google Scholar] [CrossRef]
- GUS. Rocznik Statystyczny Rzeczypospolitej Polskiej 2020. 2020. Available online: https://stat.gov.pl/obszary-tematyczne/roczniki-statystyczne/roczniki-statystyczne/rocznik-statystyczny-rzeczypospolitej-polskiej-2020,2,20.html (accessed on 30 January 2022).
- WUSP. Wojewódzki Urząd Statystyczny Podkarpacia 1999–2018—Statistical Yearbook Podkarpackie Voievodship 2000–2019; Urząd Statystyczny: Rzeszowie, Poland, 2000.
- WUSP. Rocznik Statystyczny Województwa Podkarpackiego 2020. 2020. Available online: https://rzeszow.stat.gov.pl/publikacje-i-foldery/roczniki-statystyczne/rocznik-statystyczny-wojewodztwa-podkarpackiego-2020,5,17.html (accessed on 30 January 2022).
- Kranz, J. Epidemics of Plant Diseases. Mathematical Analysis and Modeling; Springer: Berlin/Heidelberg, Germany, 1990; Volume 268. [Google Scholar] [CrossRef]
- Bis, K. Przewidywane zmiany klimatyczne i ich ekonomiczne konsekwencje dla rolnictwa polskiego. [w:] Rolnictwo w gospodarce rynkowej. In Proceedings of the Międzynarodowa Konferencja Naukowa, Kraków, Poland, 13–15 May 1993; Zeszyty Naukowe AR w Krakowie: Krakow, Poland, 1993; Volume 279, pp. 187–199. [Google Scholar]
- Bartoszuk, W. Zniżka plonu powodowana niedoborem wody w czasie wegetacji. Biuletyn Instytutu Ziemniaka 1987, 36, 43–51. (In Polish) [Google Scholar]
- Boguszewska, D. Zmiany klimatyczne Polski w latach 1983–2002, A perspektywy uprawy ziemniaka. Ziemniak Polski 2008, 3, 19–22. (In Polish) [Google Scholar]
- Boguszewska, D.; Grudkowska, M.; Zagdańska, B. Drought-responsie antioxidant enzymes in potato (Solanum tuberosum L.). Potato Res. 2010, 53, 373–382. [Google Scholar] [CrossRef]
- Boguszewska-Mańkowska, D. Potato soil drought resistance and assessment methods. Biul. Inst. Hod. I Aklim. Roślin 2016, 279, 65–75. [Google Scholar]
- Kacperska, A. Plant reactions to abiotic stress factors. In Plant Physiology; Kopcewicz, J., Lewak, S., Eds.; PWN: Warsaw, Poland, 2005; pp. 612–678. (In Polish) [Google Scholar]
- Kalbarczyk, E.; Kalbarczyk, A. The Course of Phenological Phases of Potato and Its Determination by Multi-Annual Variability of Air Temperature in Poland; Annales Universitatis Mariae Curie-Skłodowska: Lublin, Poland, 2010; Volume 64. [Google Scholar]
- Kalbarczyk, R. Próba prognozowania plonów ziemniaka w Polsce na podstawie danych meteorologicznych. Folia. Univ. Agric. Stetin. 2004, 234, 145–158. (In Polish) [Google Scholar]
- Kalbarczyk, R. Strefy klimatycznego ryzyka uprawy ziemniaka w Polsce. Folia Univ. Agric. Stetin Agric. 2005, 244, 83–90. (In Polish) [Google Scholar]
- Kalbarczyk, R. Wpływ warunków agrometeorologicznych na rozwój ziemniaka średnio późnego w Polsce. Folia. Univ. Agric. Stetin. 2003, 231, 39–46. (In Polish) [Google Scholar]
- Kalbarczyk, R.; Kalbarczyk, E. Needs, and deficiencies of atmospheric precipitation in the cultivation of medium late and late potato in Poland. Infrastruct. Ecol. Rural. Areas 2009, 3, 129–140. [Google Scholar]
- Tomczyk, A.M.; Piniewski, M.; Eini, M.R.; Bednorz, E. Forecasts of changes in the maximum air temperature and hot days in Poland. Int. J. Climatol. 2022, 42. [Google Scholar] [CrossRef]
- Karaczun, Z.M.; Kozyra, J. The Impact of Climate Change on Poland’s Food Security; SGGW Publishing House: Warsaw, Poland, 2020; p. 120. Available online: http://www.koalicjaklimatyczna.org/uploads/publikacje/Raport_Klimat_bezpieczenstwo_zywienowe_Karaczun_20.03.pdf (accessed on 28 January 2022).
- Anonymous. SMSR—System Monitoringu Suszy Rolniczej. 2021. Available online: https://susza.iung.pulawy.pl/ (accessed on 30 January 2022).
- Chmura, K.; Chylińska, E.; Dmowski, Z.; Nowak, L. Role of the Water Factor in Yield Formation of Chosen Field Crops. Infrastructure and Ecology of Rural Areas. Nr 9/2009; Polska Akademia Nauk, Oddział w Krakowie, Komisja Technicznej Infrastruktury Wsi: Krakow, Poland, 2009; pp. 33–44. (In Polish) [Google Scholar]
- Anonymous. Prognozowanie Plonów. 2015. Available online: http://www.igik.edu.pl/pl/teledetekcjaprognozowanie-plonow (accessed on 18 January 2022). (In Polish).
- Stark, C.; Love, S.; King, B.; Marshall, J.; Bohl, H.; Salaiz, T. Potato variety response to seasonal drought patterns. Am. J. Potato Res. 2013, 90, 207–216. [Google Scholar] [CrossRef]
- Sadowski, M. Zmiany Klimatu i Ich Skutki Teraz i w Przyszłości. 2020. Available online: https://www.pzh.gov.pl/wp-content/uploads/2020/11/1_-prof-Sadowski.pdf (accessed on 29 January 2022).
- Rykaczewska, K. Influence of high temperature during the growing season on the potato (Solanum tuberosum L.) yield, tuber dormancy period and the yield value of seed potatoes. I. Plant development and yield. Zesz. Probl. Post. Nauk Roln. 2004, 496, 185–198. (In Polish) [Google Scholar]
- Rykaczewska, K. The impact of high temperature during growing season on potato cultivars with different response to environmental stresses. Am. J. Plant Sci. 2013, 4, 2386–2393. [Google Scholar] [CrossRef] [Green Version]
- Rykaczewska, K. The effect of high temperature occurring in subsequent stages of plant development on potato yield and tuber physiological defects. Am. J. Potato Res. 2015, 92, 339–349. [Google Scholar] [CrossRef] [Green Version]
- Otekunrin, O.A.; Otekunrin, O.A. Healthy and Sustainable Diets: Implications for Achieving SDG2. In Zero Hunger. Encyclopedia of the UN Sustainable Development Goals; Leal Filho, W., Azul, A., Brandli Özuyar, P., Wall, T., Eds.; Springer: Cham, Switzerland, 2021. [Google Scholar]
- Czarnecka, M.; Nidzgorska-Lencewicz, J. The role of meteorological elements in the formation of daily (24 h) variability of the light soil moisture in winter. Ann. Univ. Mariae Curie-Skłodowska Sect. B Geogr. Geol. Min. Alogia Petrogr. 2006, 61, 125–130. [Google Scholar]
- Fry, W.E. Phytophthora infestans: The plant (and R gene) destroyer. Mol. Plant Pathol. 2008, 9, 385–402. [Google Scholar] [CrossRef]
- Harrison, J.G. The effect of aerial environment on late blight of potato foliage—A review. Plant Pathol. 1992, 41, 384–416. [Google Scholar] [CrossRef]
- Andrivon, D.; Evenhuis, B.; Schepers, H.; Gaucher, D.; Kapsa, J.; Lebecka, R.; Nielsen, B.; Ruocco, M. Reducing Primary Inoculum Sources of Late Blight. ENDURE Potato Case Study-Guide 2008, 1, 4. Available online: www.endure-network.eu (accessed on 5 January 2022).
- Aylor, D.E.; Fry, W.E.; Mayton, H.; Andrade-Piedra, J.L. Quantifying the rate of release and escape of Phytophthora infestans sporangia from a potato canopy. Phytopathology 2001, 91, 1189–1196. [Google Scholar] [CrossRef] [Green Version]
- Lung’aho, C.S.K.N.; Nderitu, S.K.N.; Kabira, J.N.; El Bedewy, R.; Olanya, O.M.; Walingo, A. Yield performance and release of four late blight tolerant potato varieties In Kenya. J. Agron. 2006, 5, 57–61. [Google Scholar] [CrossRef] [Green Version]
- Kapsa, J. Zaraza (Phytophthora infestans/Mont./de Bary) występująca na łodygach ziemniaka. Monography 11. IHAR Radzików 2001, 11, 7–10. [Google Scholar]
- Kapsa, J.; Mrówczyński, M.; Erlichowski, T.; Gawińska-Urbanowicz, H.; Matysek, K.; Osowski, J.; Pawińska, M.; Urbanowicz, J.; Wróbel, S. Ochrona ziemniaka zgodna z zasadami integrowanej ochrony roślin. Cz. II. Metoda zrównoważonej chemicznej ochrony ziemniaka. Biul. IHAR 2014, 273, 145–159. (In Polish) [Google Scholar]
- Haverkort, A.J.; Boonekamp, P.M.; Hutten, R.; Jacobsen, E.; Lotz, L.A.P.; Kessel, G.J.T.; Visser, R.G.F.; van der Vossen, E.A.G. Societal costs of late blight in potato and prospects of durable resistance through congenic modification. Potato Res. 2008, 51, 47–57. [Google Scholar] [CrossRef]
- Croxall, M.E.; Smith, L.P. The epidemiology of potato blight in the east Midlands. Ann. Biol. 1976, 82, 451–466. [Google Scholar] [CrossRef]
- Małysz, J. Economic interpretation of food security. In Food Safety in the Era of Globalization; Kowalczyk, S., Ed.; Wydawnictwo SGH: Warszawa, Poland, 2009. (In Polish) [Google Scholar]
- Kraciuk, J. Food security from the perspective of underdeveloped and highly developed countries. Sci. Ann. Assoc. Agric. Agribus. Econ. 2015, 17, 205–209. (In Polish) [Google Scholar]
- ACT of 25 August 2006, on food and nutrition safety. Journal of Laws 2020.2021, i.e., the current act. Version from 1 January 2021, to 3 February 2022. Available online: https://sip.lex.pl/akty-prawne/dzu-dziennik-ustaw/bezpieczenstwo-bezpiecznosci-i-zywien-17302608 (accessed on 25 January 2022).
- Articles 43, 114 and 168 (1) 4 and art. 169 of the Treaty on the Functioning of the European Union. Available online: https://www.europarl.europa.eu/ftu/pdf/pl/FTU_2.2.6.pdf (accessed on 25 January 2022).
- Fortuna, G.; Łobodziński, W. What Is the Level of Food Security in the EU? Available online: https://www.euractiv.pl/section/rolnictwowpr/news/zywnosc-unia-europejska-bezpieczenstwo-zywnosciowe-pandemia-koronawirus-lancuchy-dostaw-od-pola-do-stolu-wpr-wojciechowski-srodowisko-susza-klimat-powodz/ (accessed on 25 January 2022).
- Scott, G.J.; Rosegrant, M.W.; Ringler, C. Global projections for root and tuber crops to the year 2020. Food Policy 2000, 25, 561–597. [Google Scholar] [CrossRef]
- Tripathi, A.; Tripathi, D.K.; Chauhan, D.K.; Kumar, N.; Singh, G.S. Paradigms of climate change impacts on some major food sources of the world: A review on current knowledge and future prospects. Agric. Environ. 2016, 216, 356–373. [Google Scholar] [CrossRef]
- Communication from the Commission to the European Parliament, the European Council, the Council, the European Economic and Social Committee and the Committee of the Regions. The European Green Deal. Brussels, 11 December 2019 COM (2019) 640 Final. Available online: https://ec.europa.eu/info/sites/default/files/european-green-deal-communication_en.pdf (accessed on 30 January 2022).
Figure 1.
The actual general area of potato cultivation and the tendency of changes in this area in the southeastern part of Poland, 2000–2019.
Figure 1.
The actual general area of potato cultivation and the tendency of changes in this area in the southeastern part of Poland, 2000–2019.

Figure 2.
Variability of the total yield of potato tubers in Southeastern Poland in 2000–2019.

Figure 3.
The total and trade yield of potato in Southeastern Poland in the Experimentals of Stations for Cultivar Assessment of Central Crop Research Centre, by groups of earliness of varieties.
Figure 3.
The total and trade yield of potato in Southeastern Poland in the Experimentals of Stations for Cultivar Assessment of Central Crop Research Centre, by groups of earliness of varieties.

Figure 4.
Changes in the total potato harvest in the southeastern part of Poland in 2000–2019.

Figure 5.
Partial dependence of tuber yield on air temperature in the April–May period.

Figure 6.
Partial dependence of tuber yield on air temperature in the June–July period.

Figure 7.
Partial dependence and potato tuber yield on air temperature in August–September.

Figure 8.
Partial dependence of tuber yield on total rainfall in April–May.

Figure 9.
Partial dependence of the potato tuber yield on the value of the hydrothermal coefficient in April–May.
Figure 9.
Partial dependence of the potato tuber yield on the value of the hydrothermal coefficient in April–May.

Figure 10.
The relationship between fluctuations in rainfall level and various meteorological parameters. Y—yield; X1—temperature of the April–may; X2—temperature of June–July; X3—temperature of August–September; X4—rainfalls of April–September; X5—indicators of hydrothermal of April–September.
Figure 10.
The relationship between fluctuations in rainfall level and various meteorological parameters. Y—yield; X1—temperature of the April–may; X2—temperature of June–July; X3—temperature of August–September; X4—rainfalls of April–September; X5—indicators of hydrothermal of April–September.


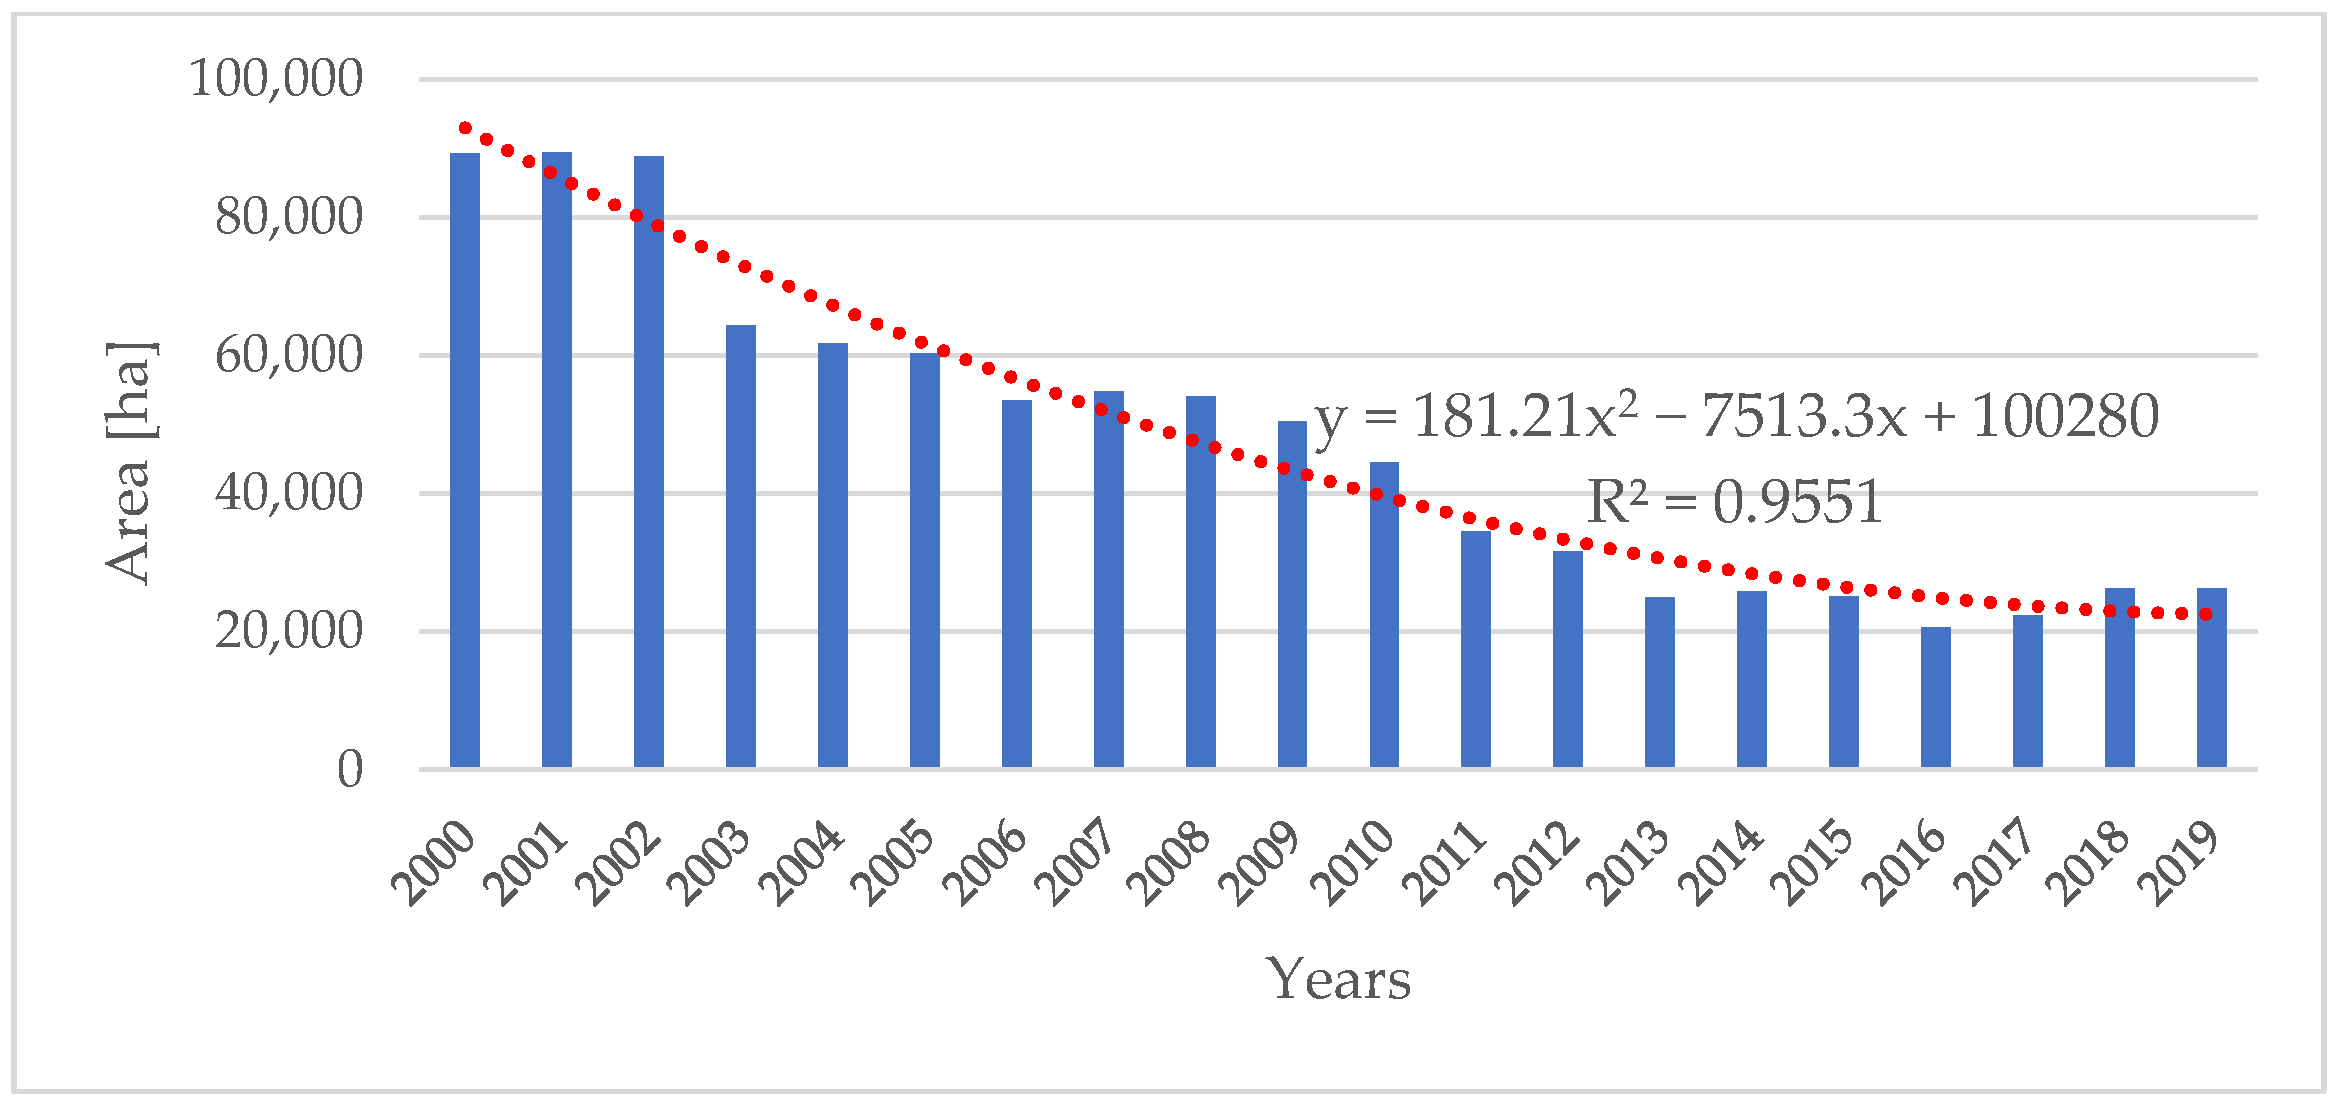
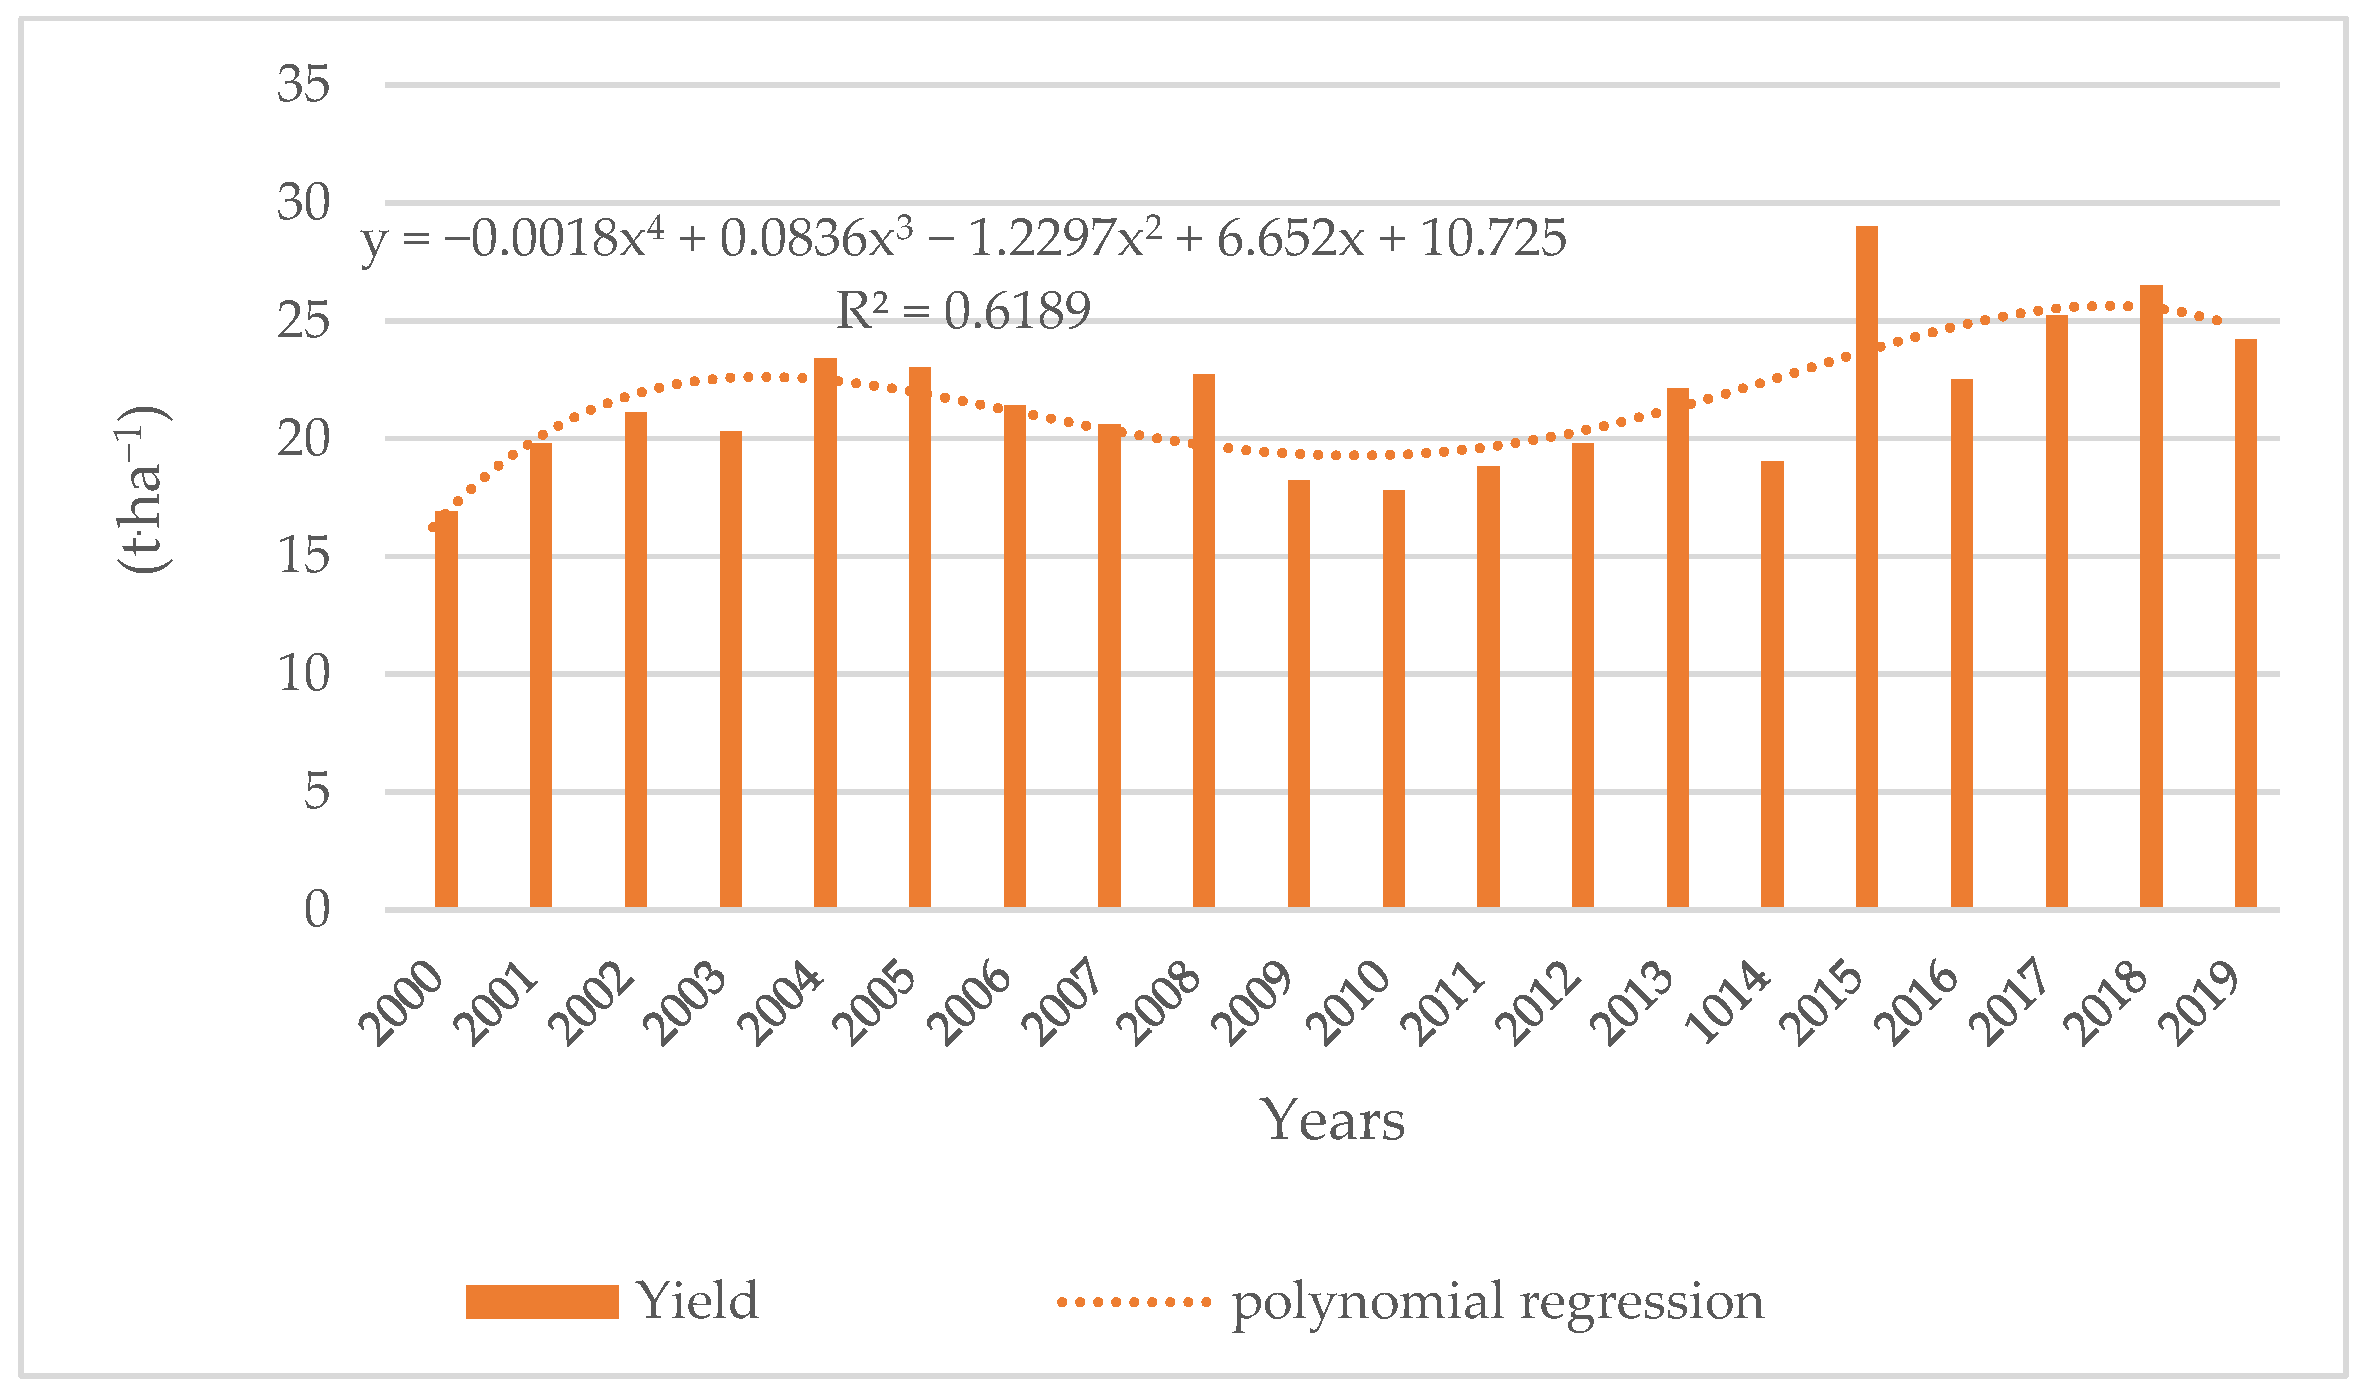
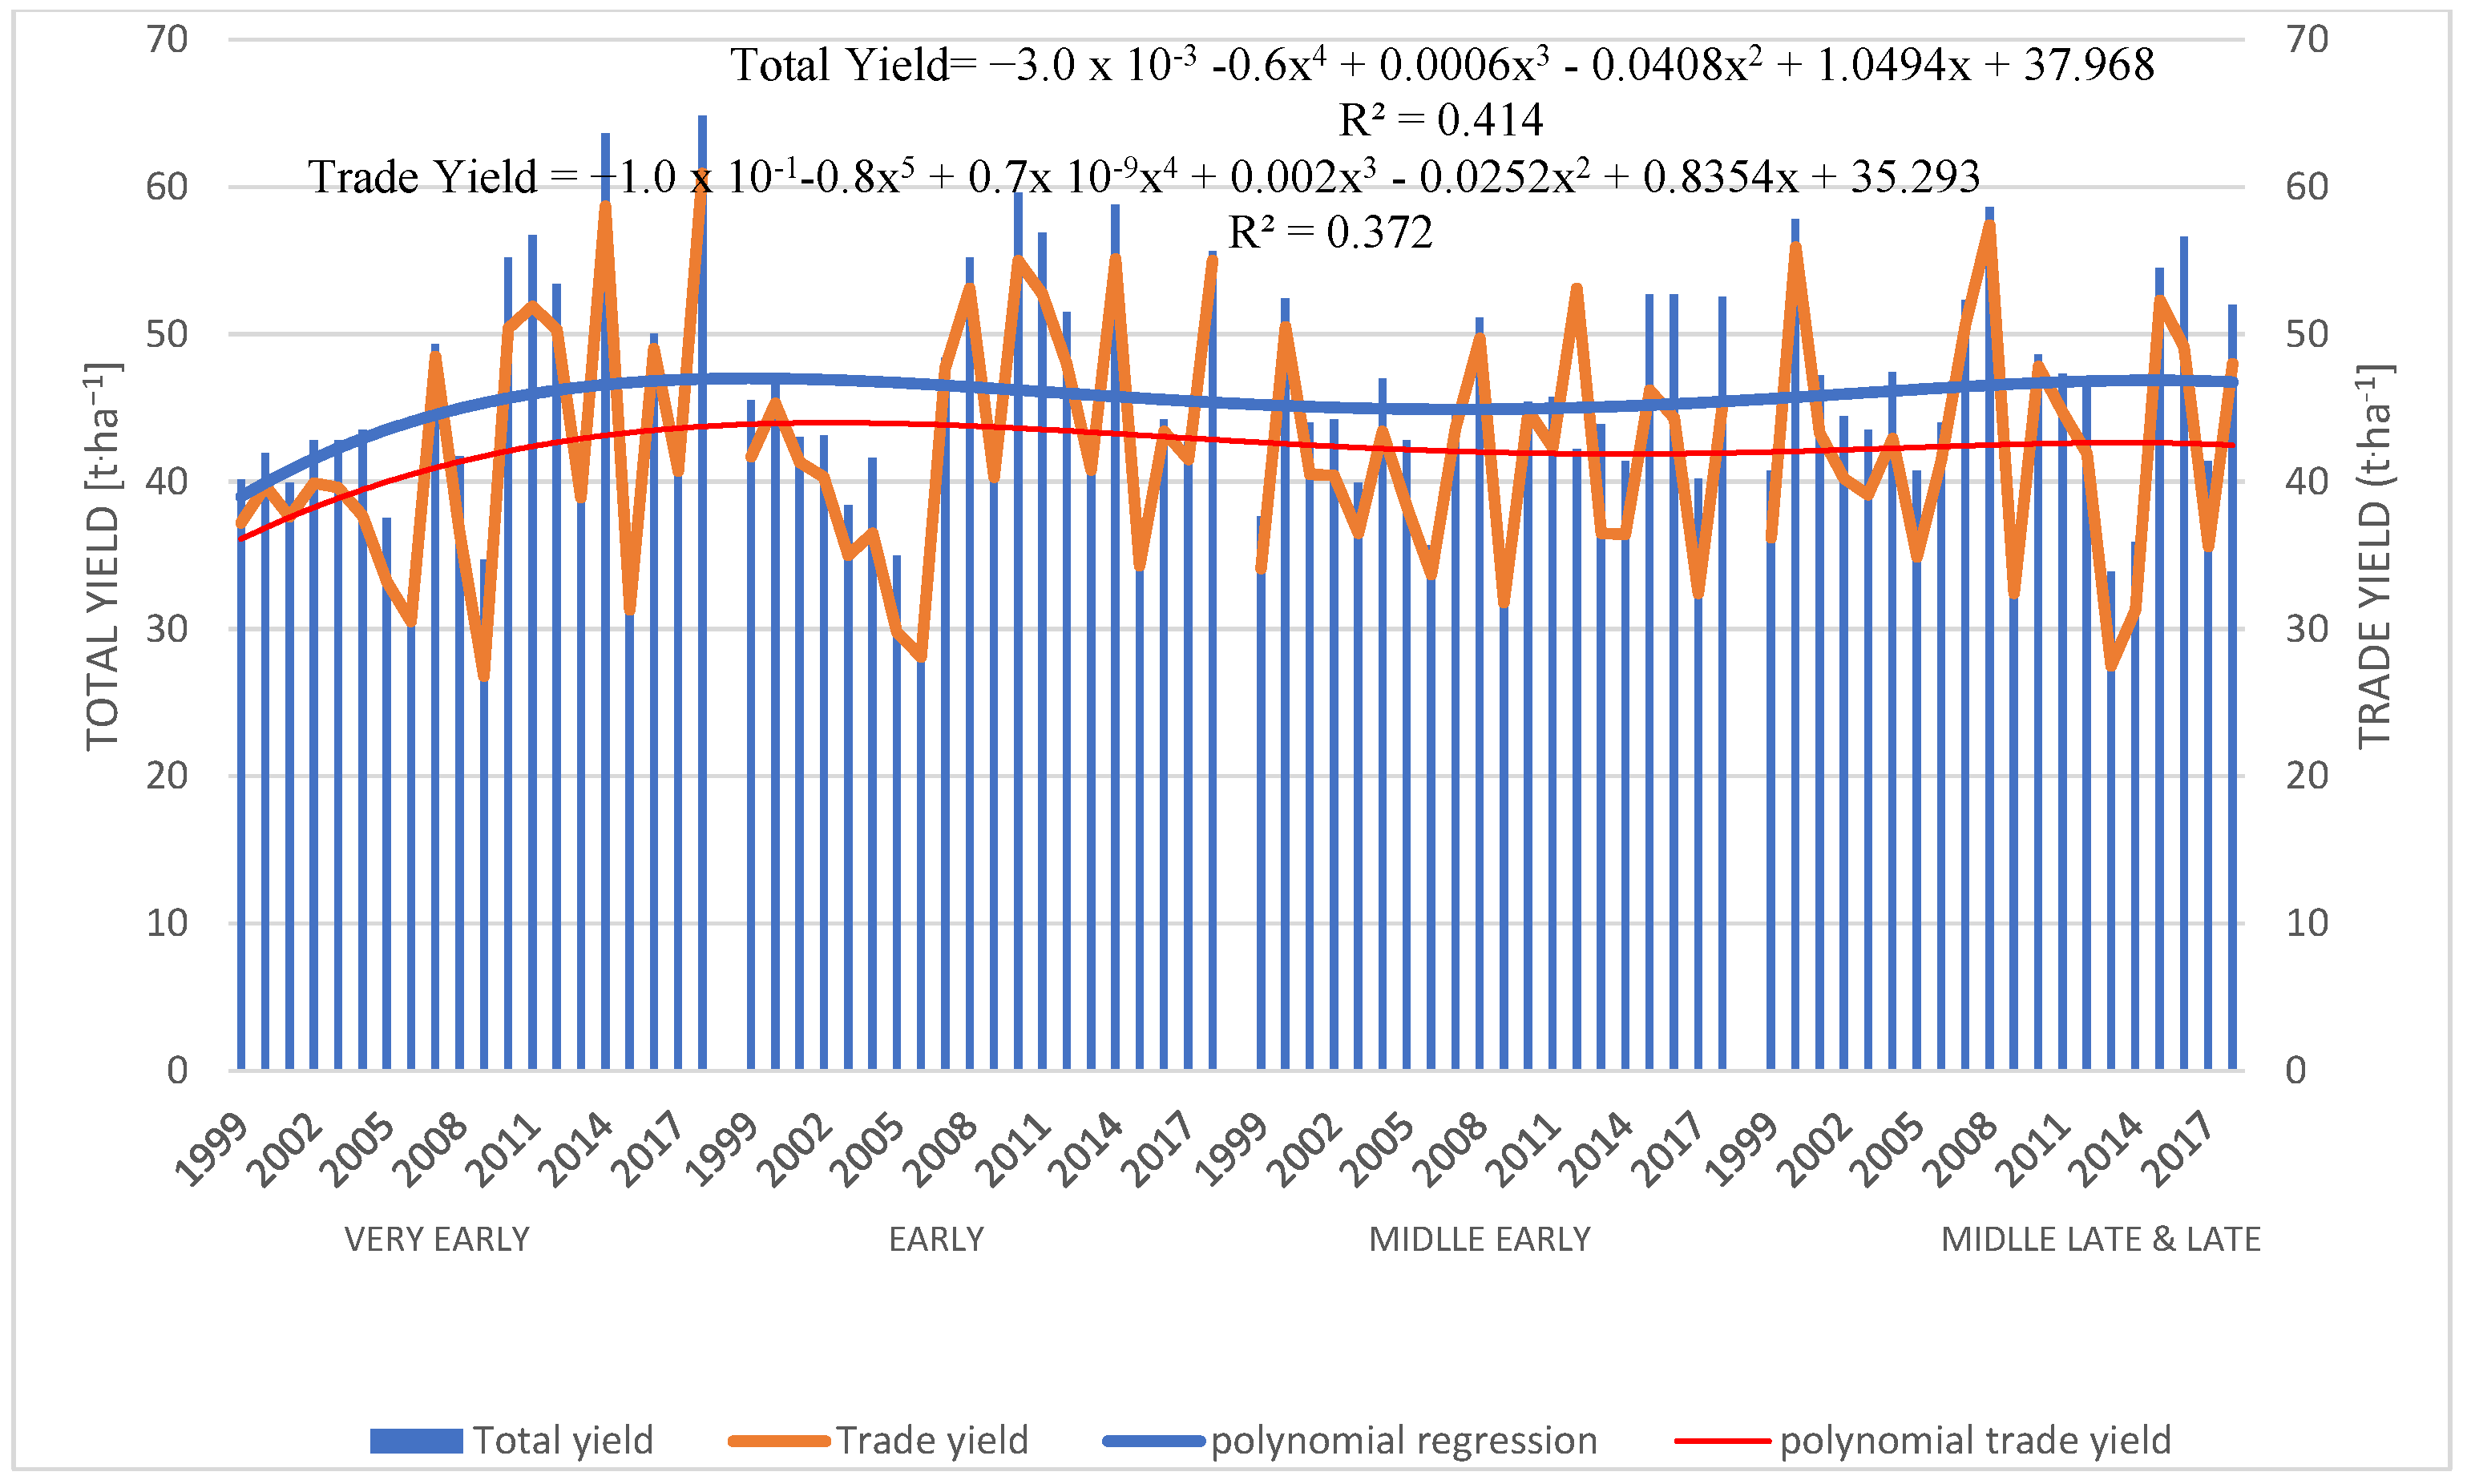
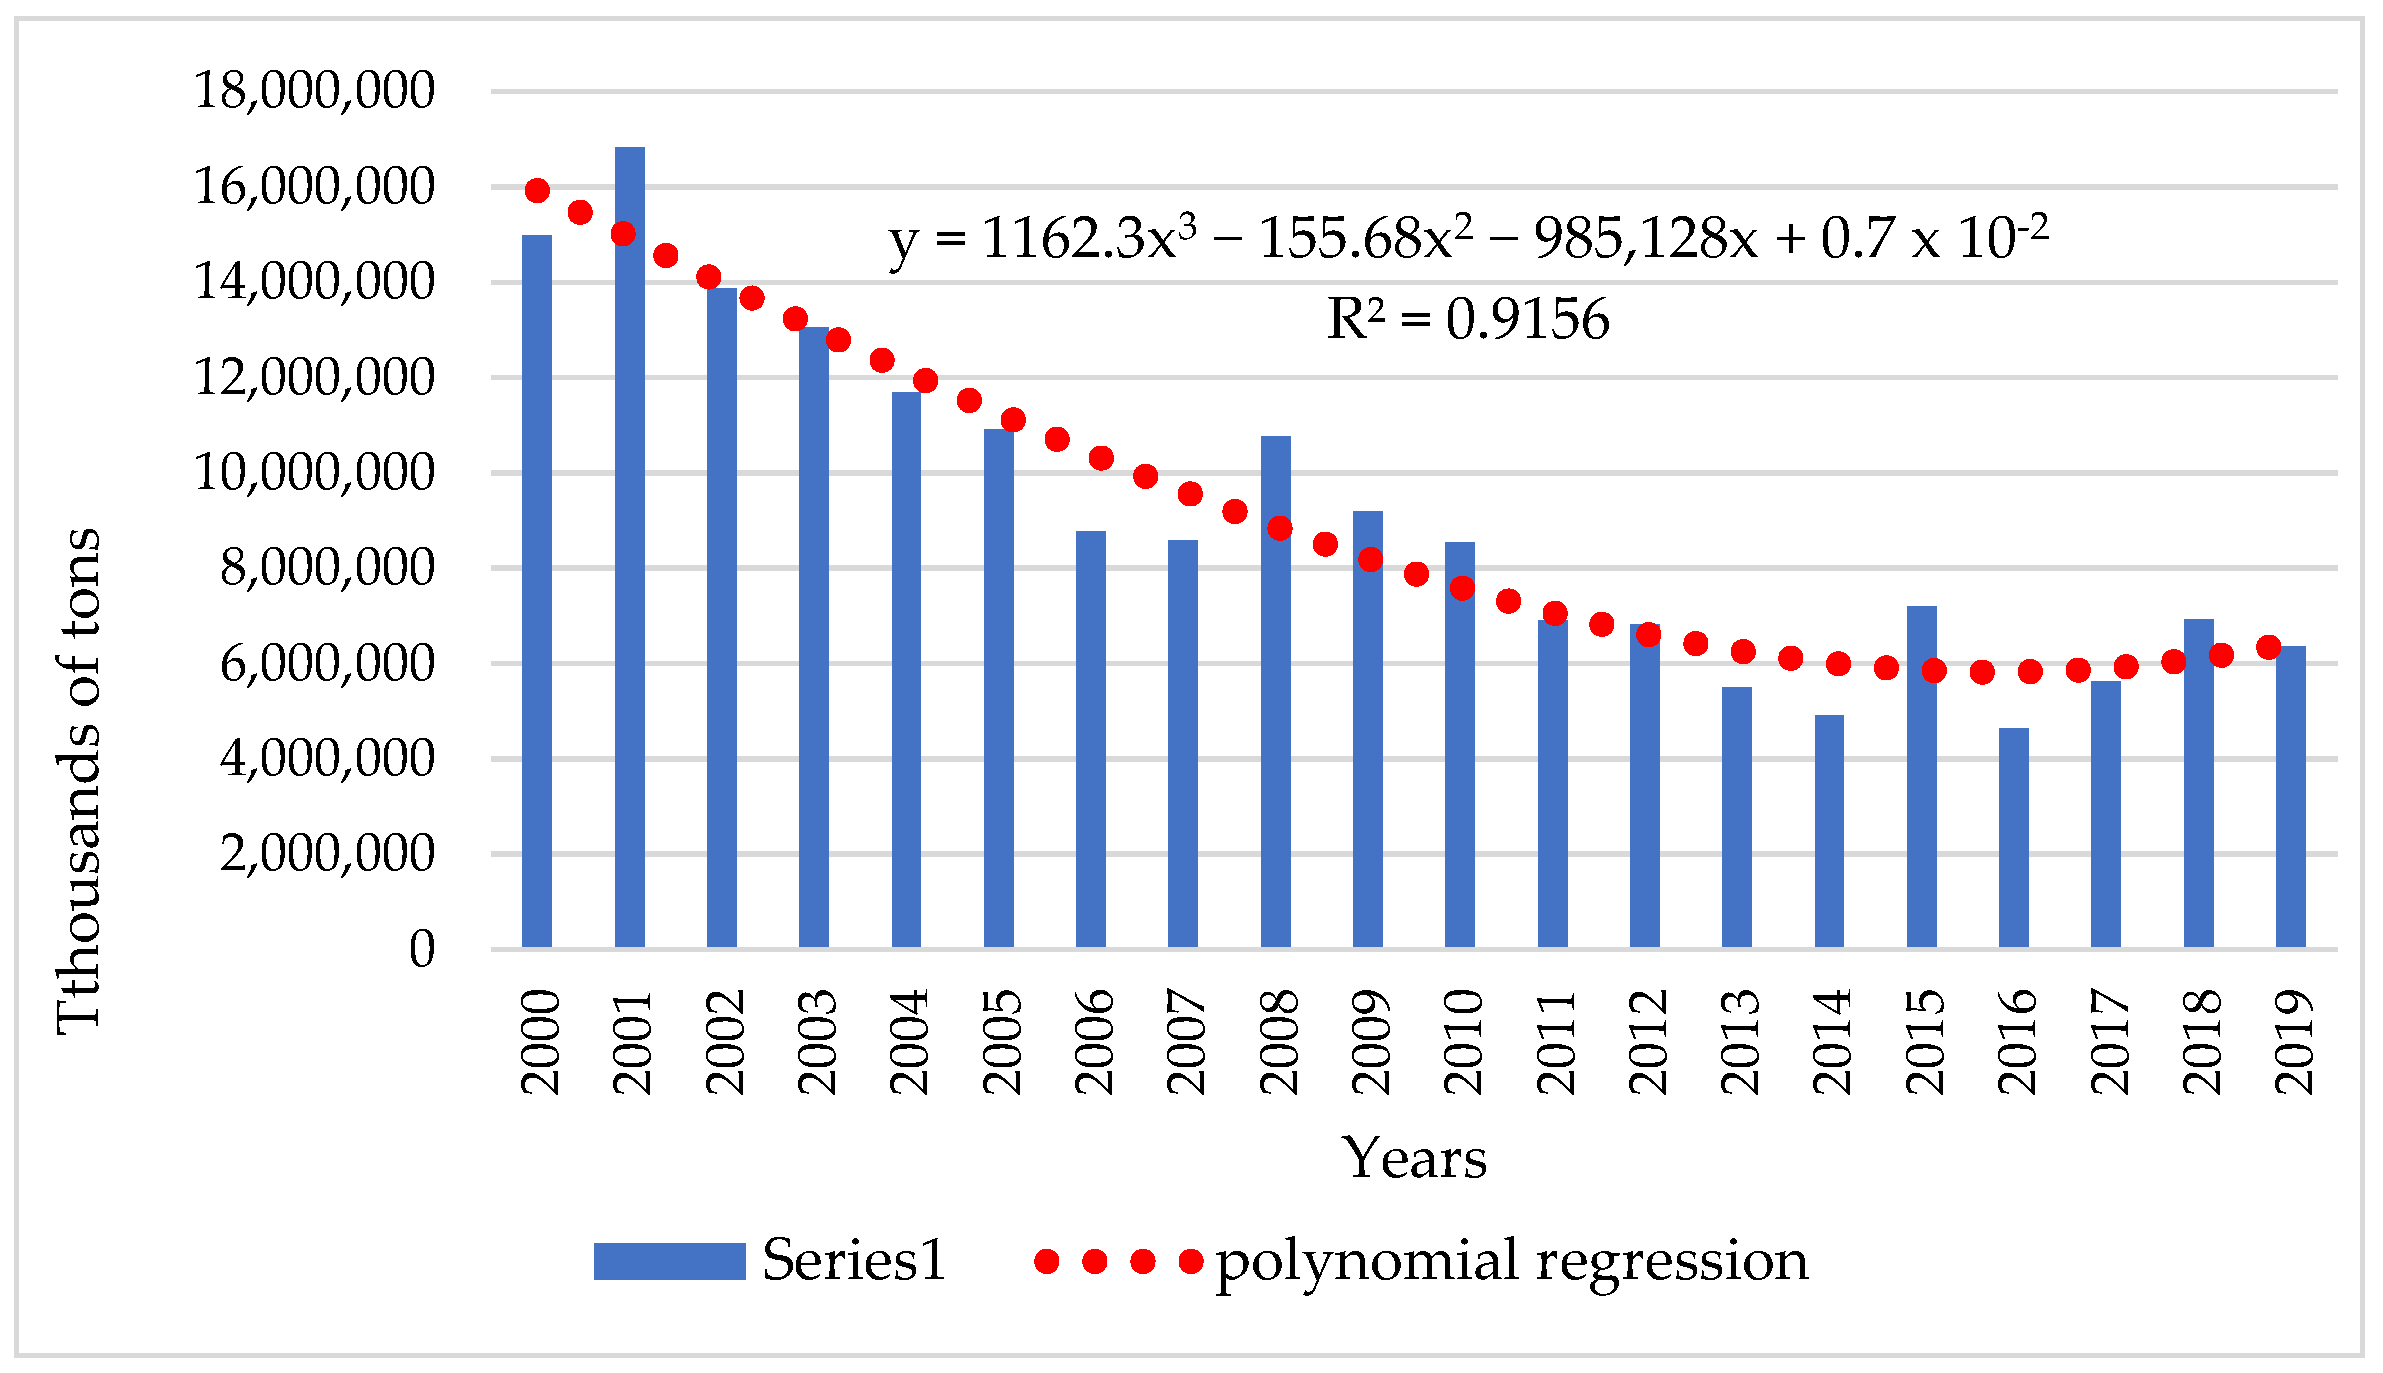
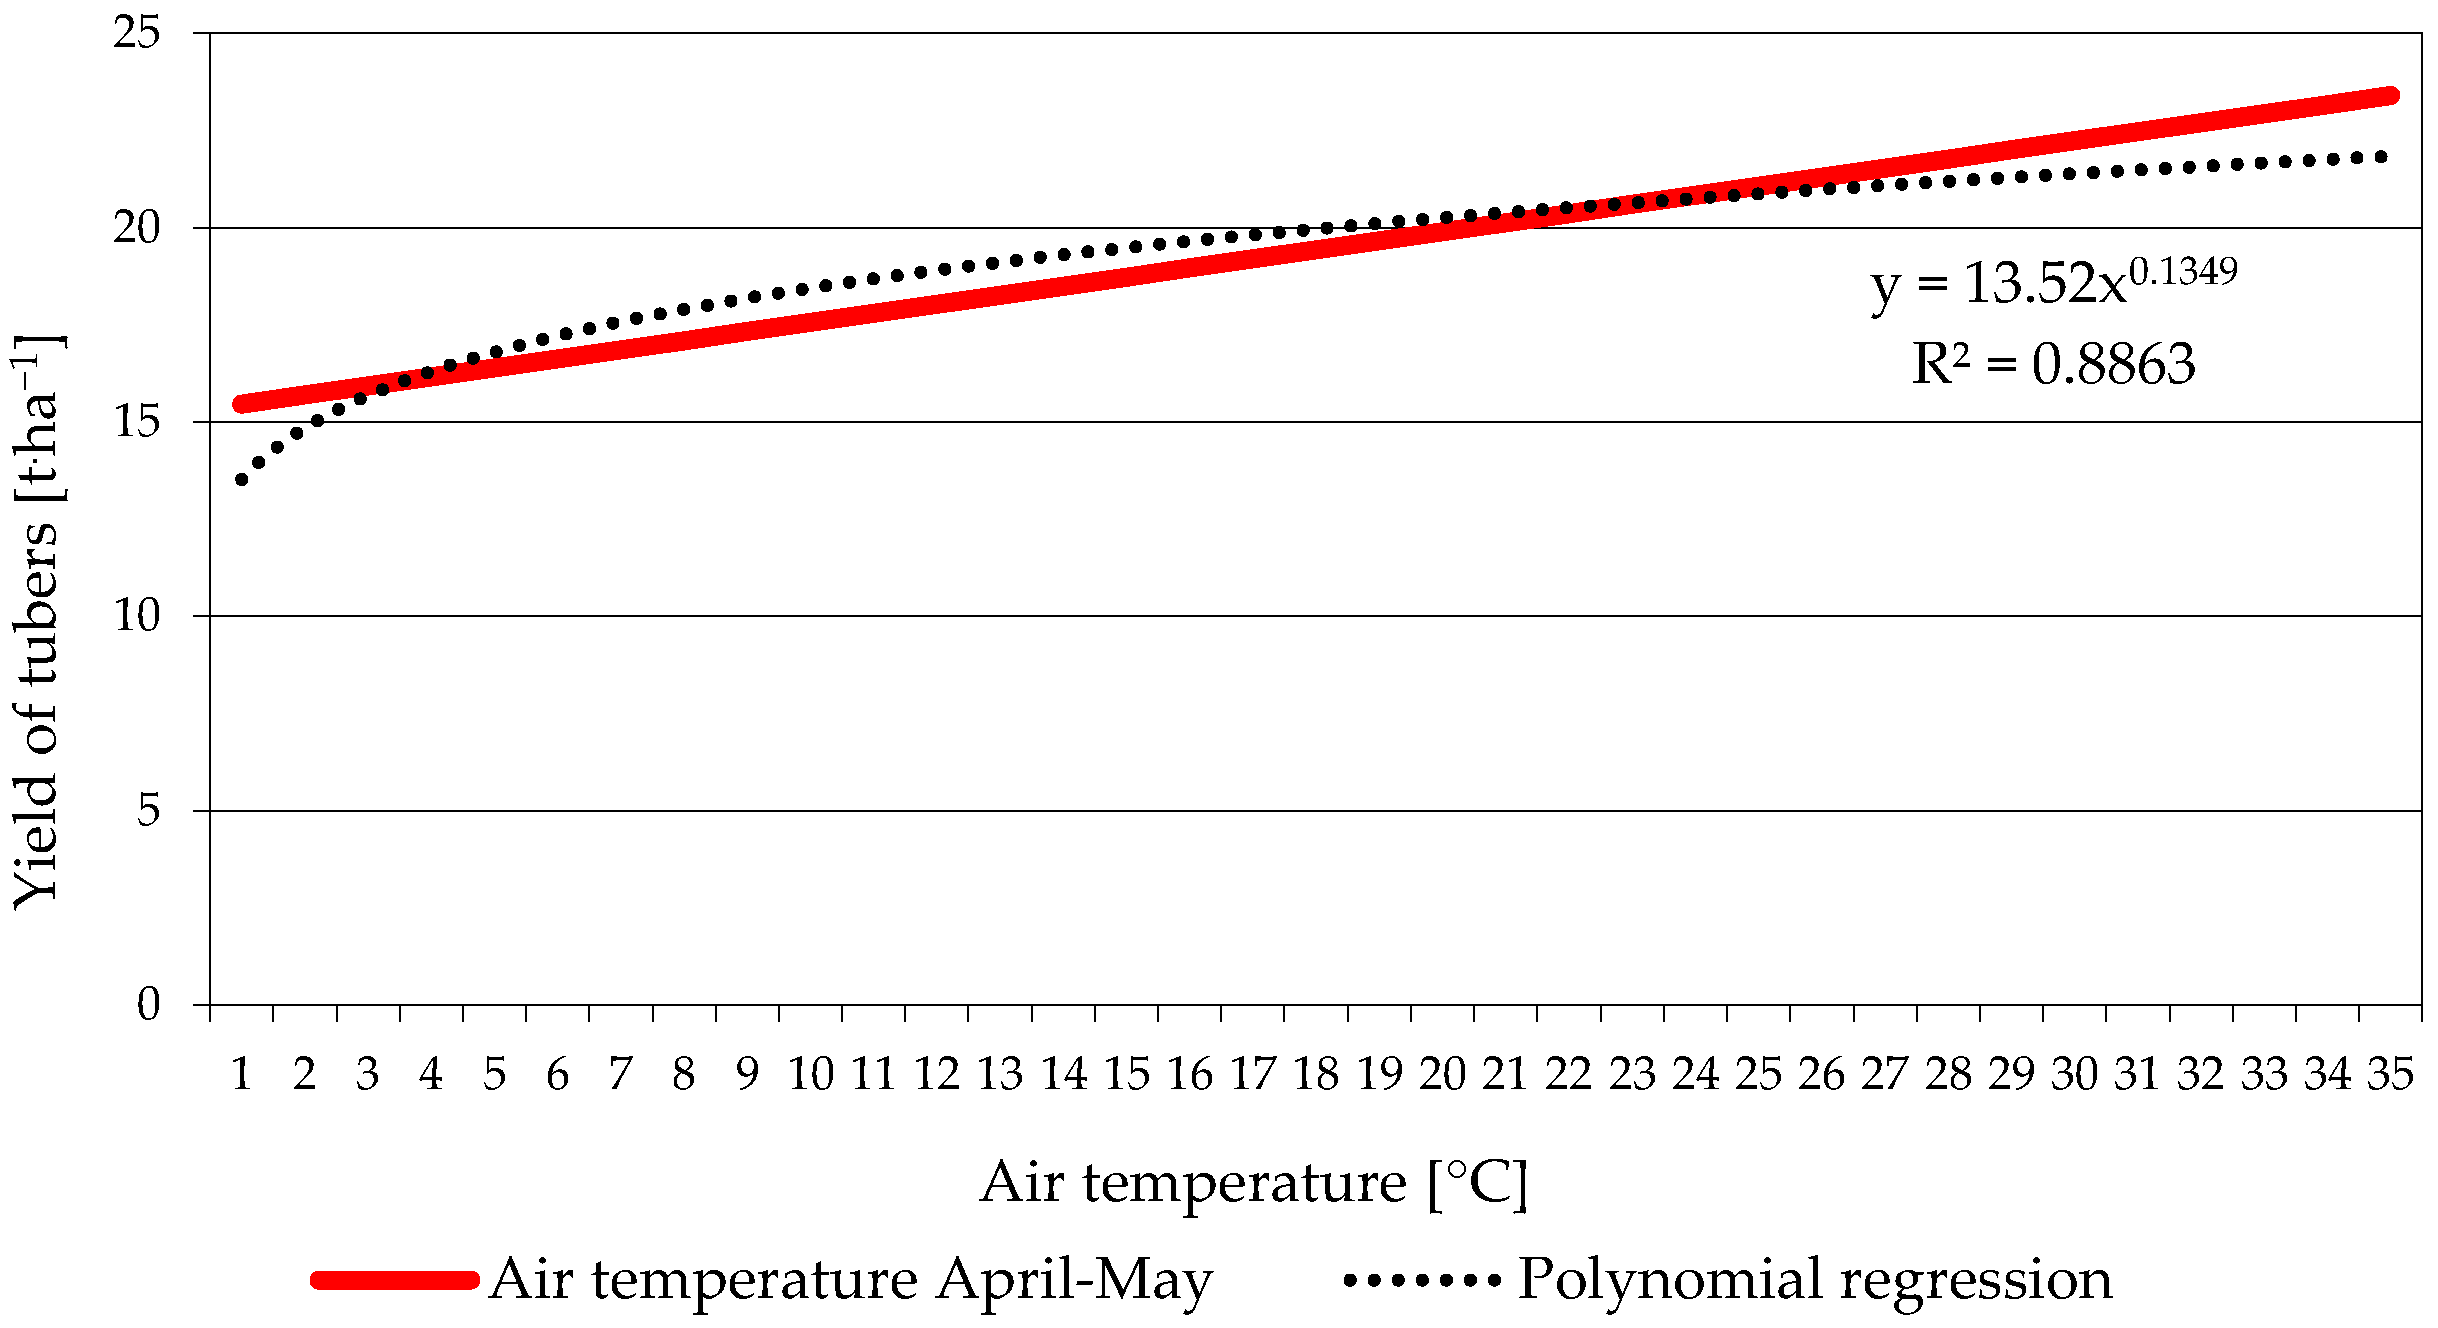
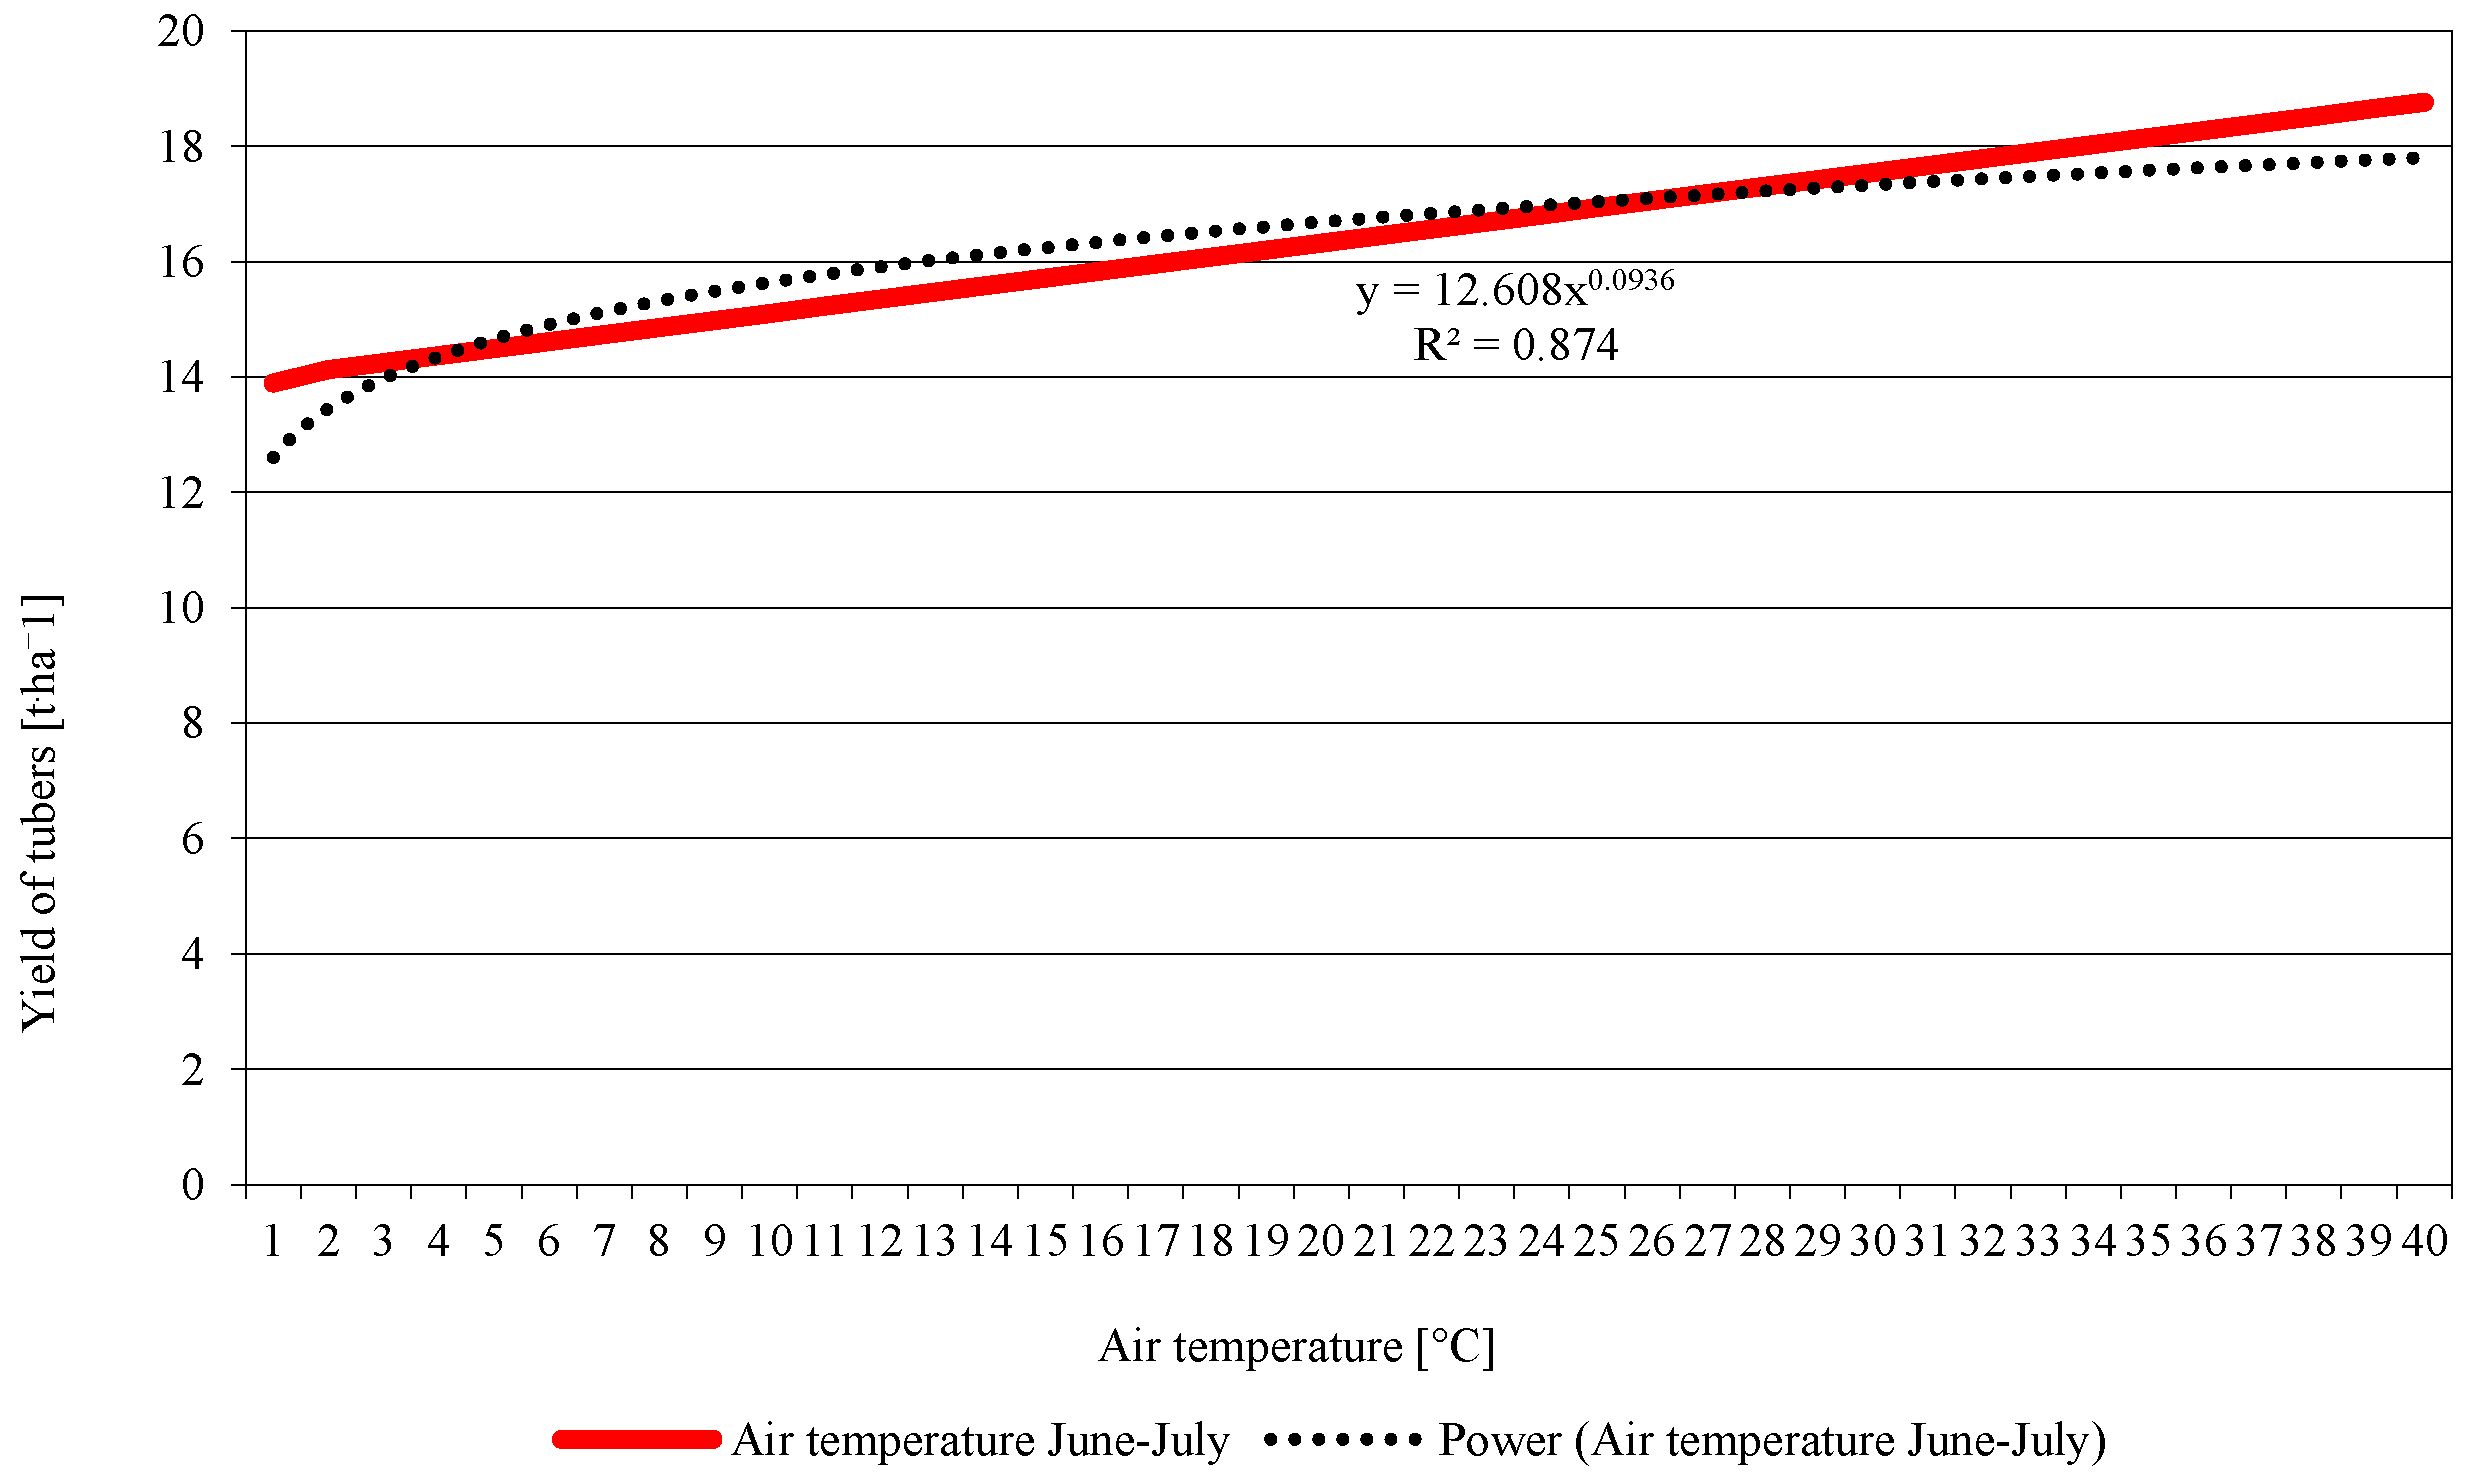
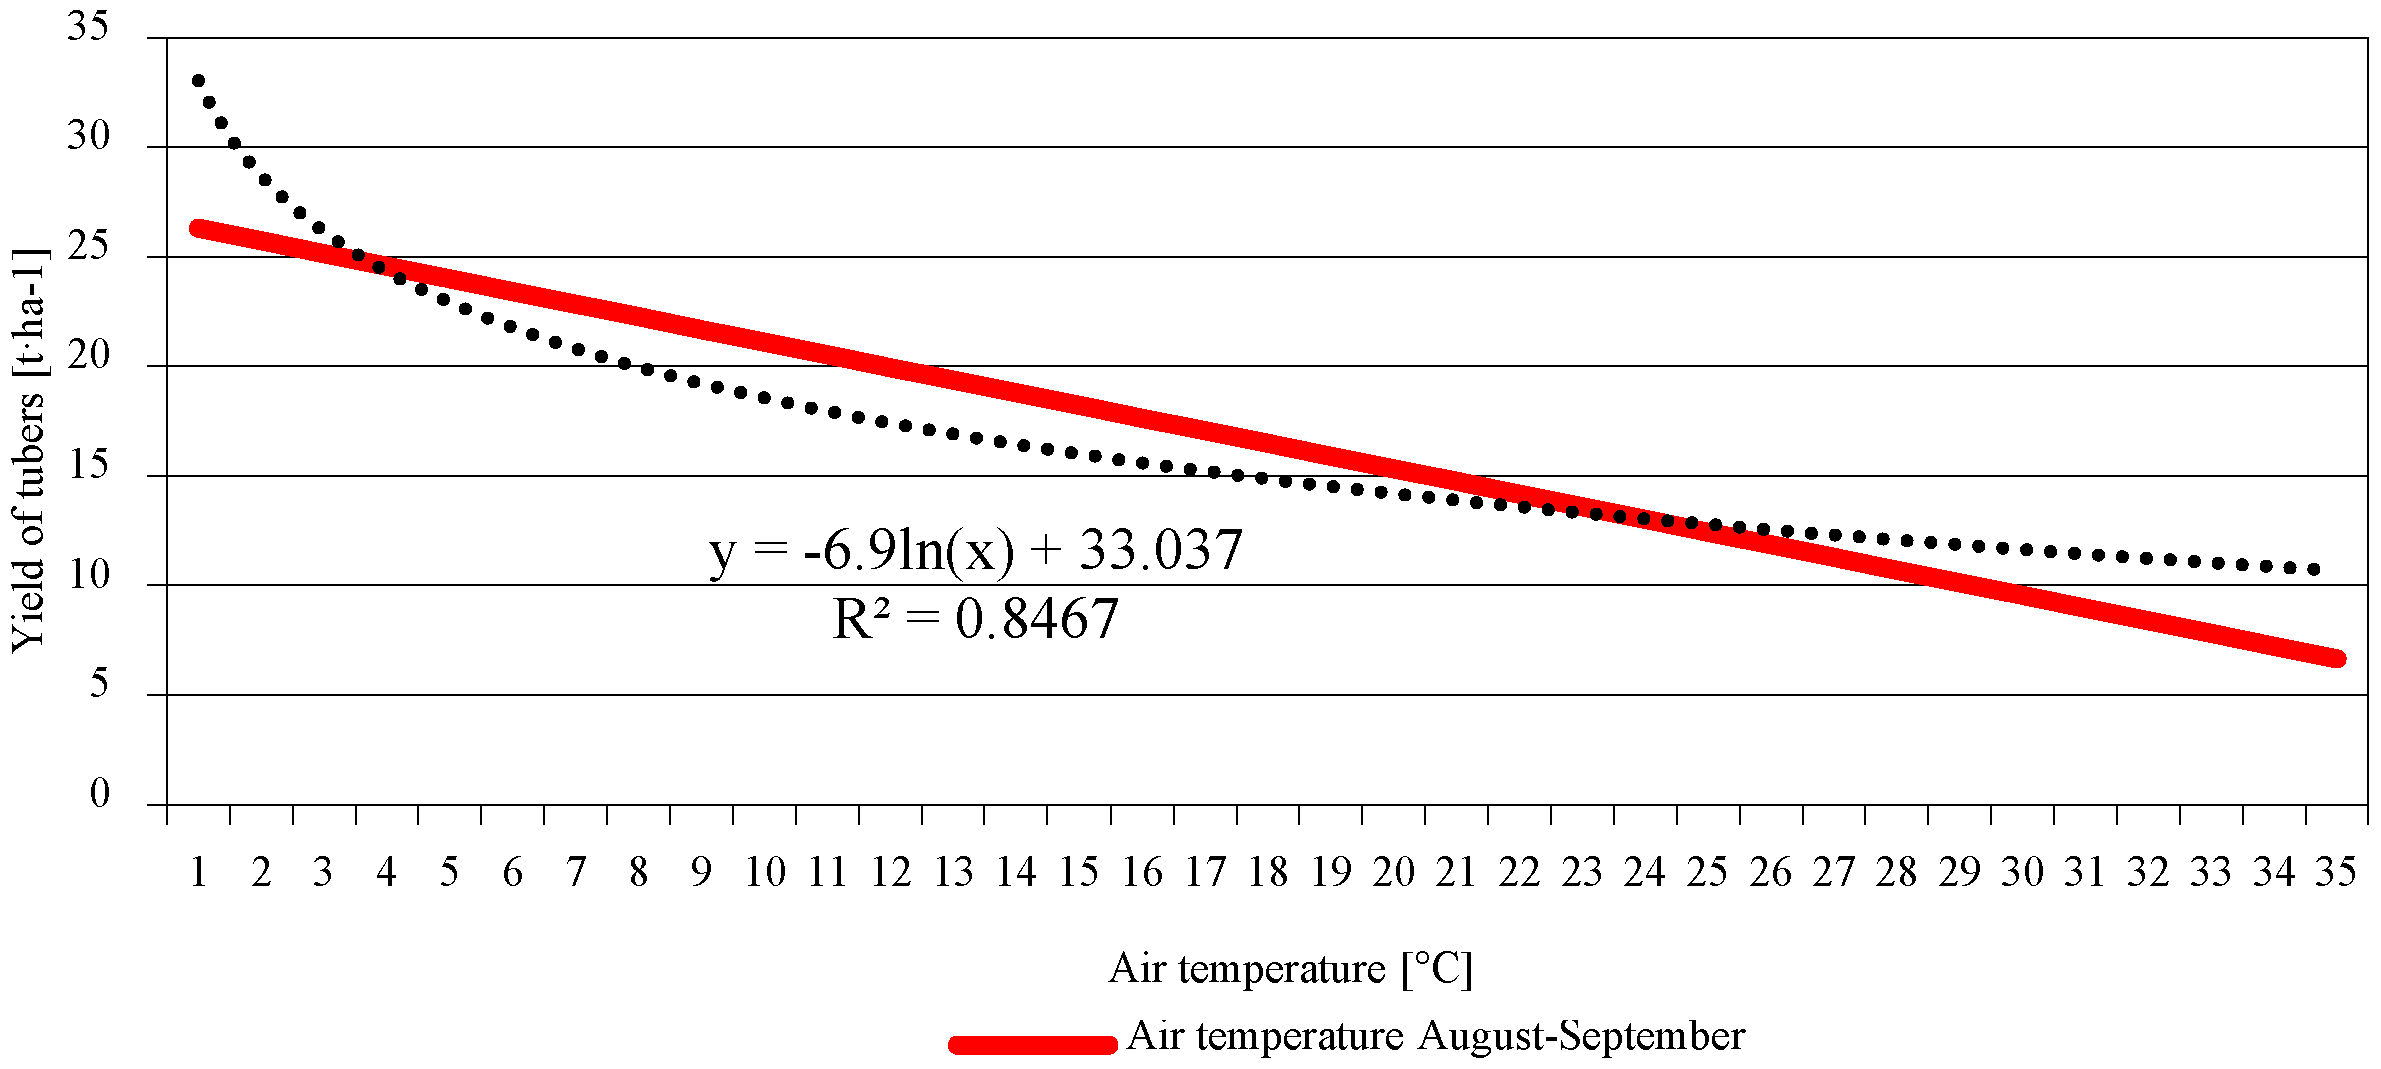
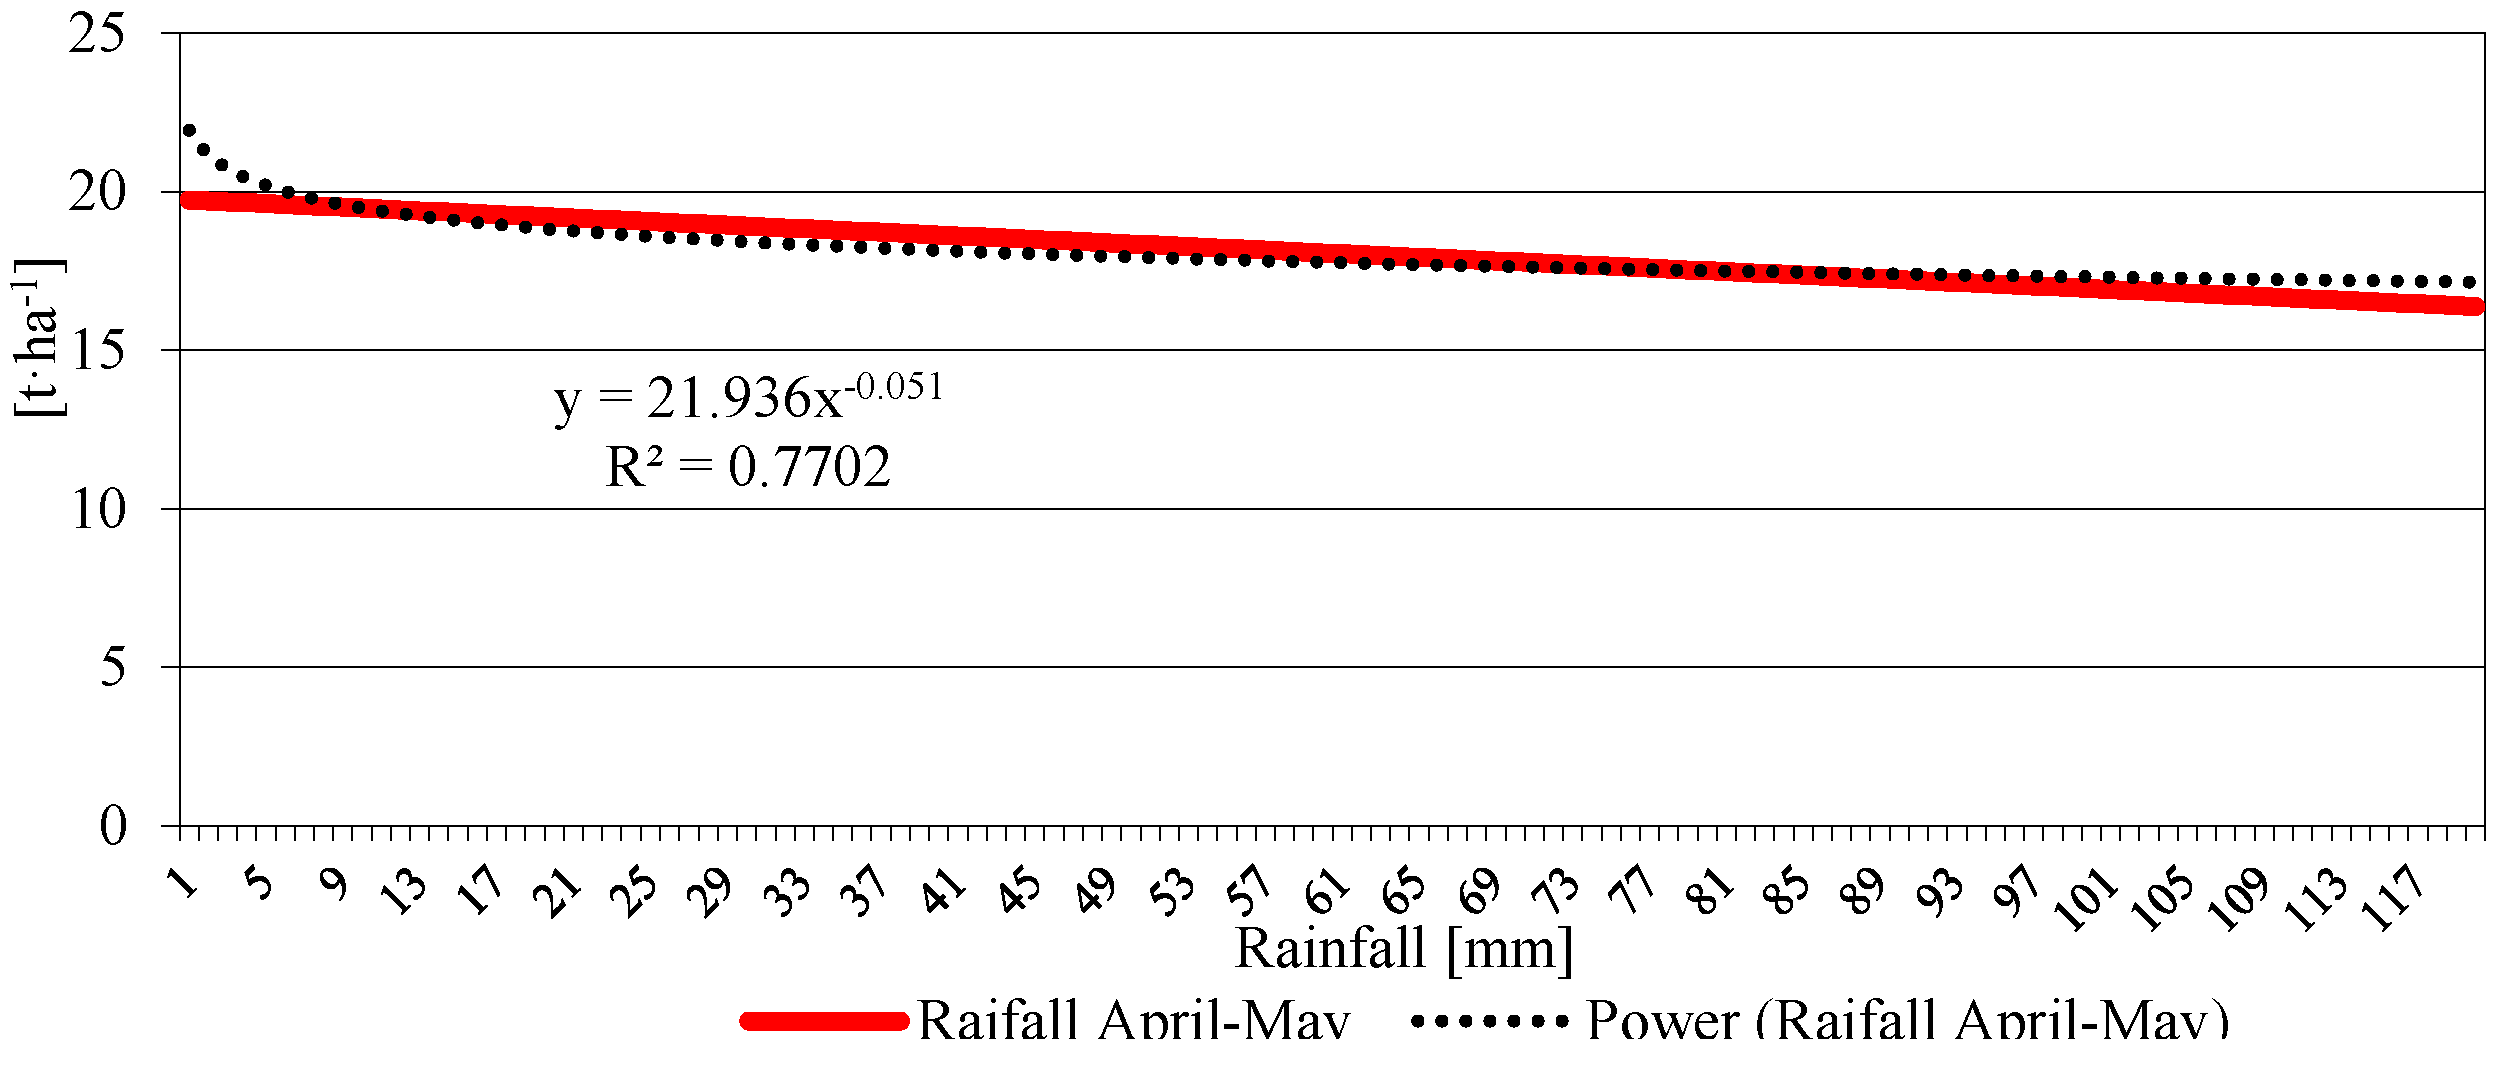
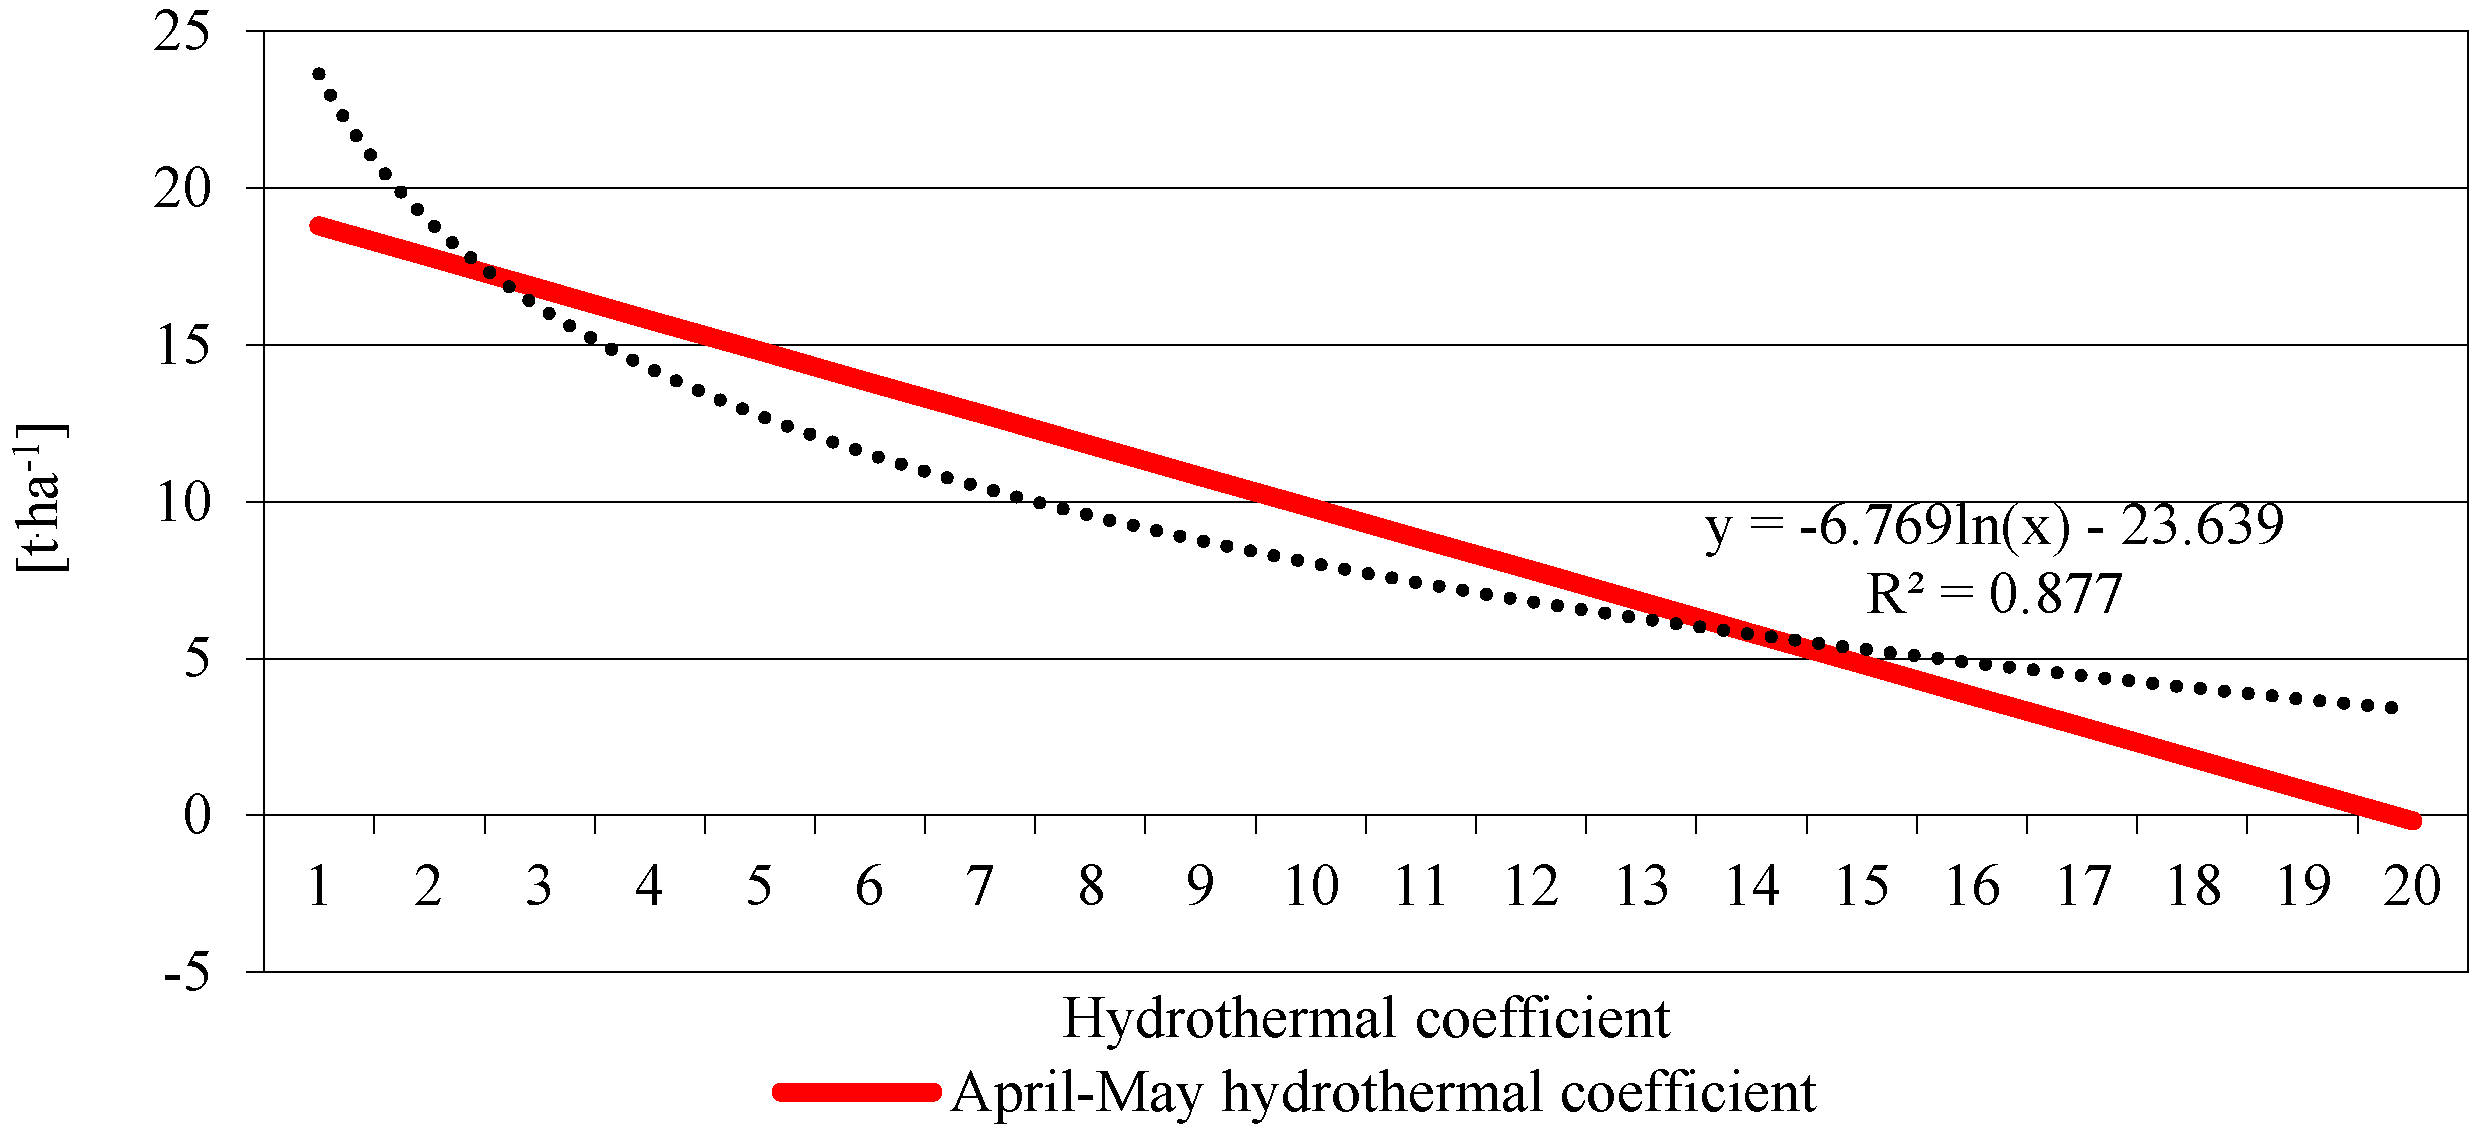
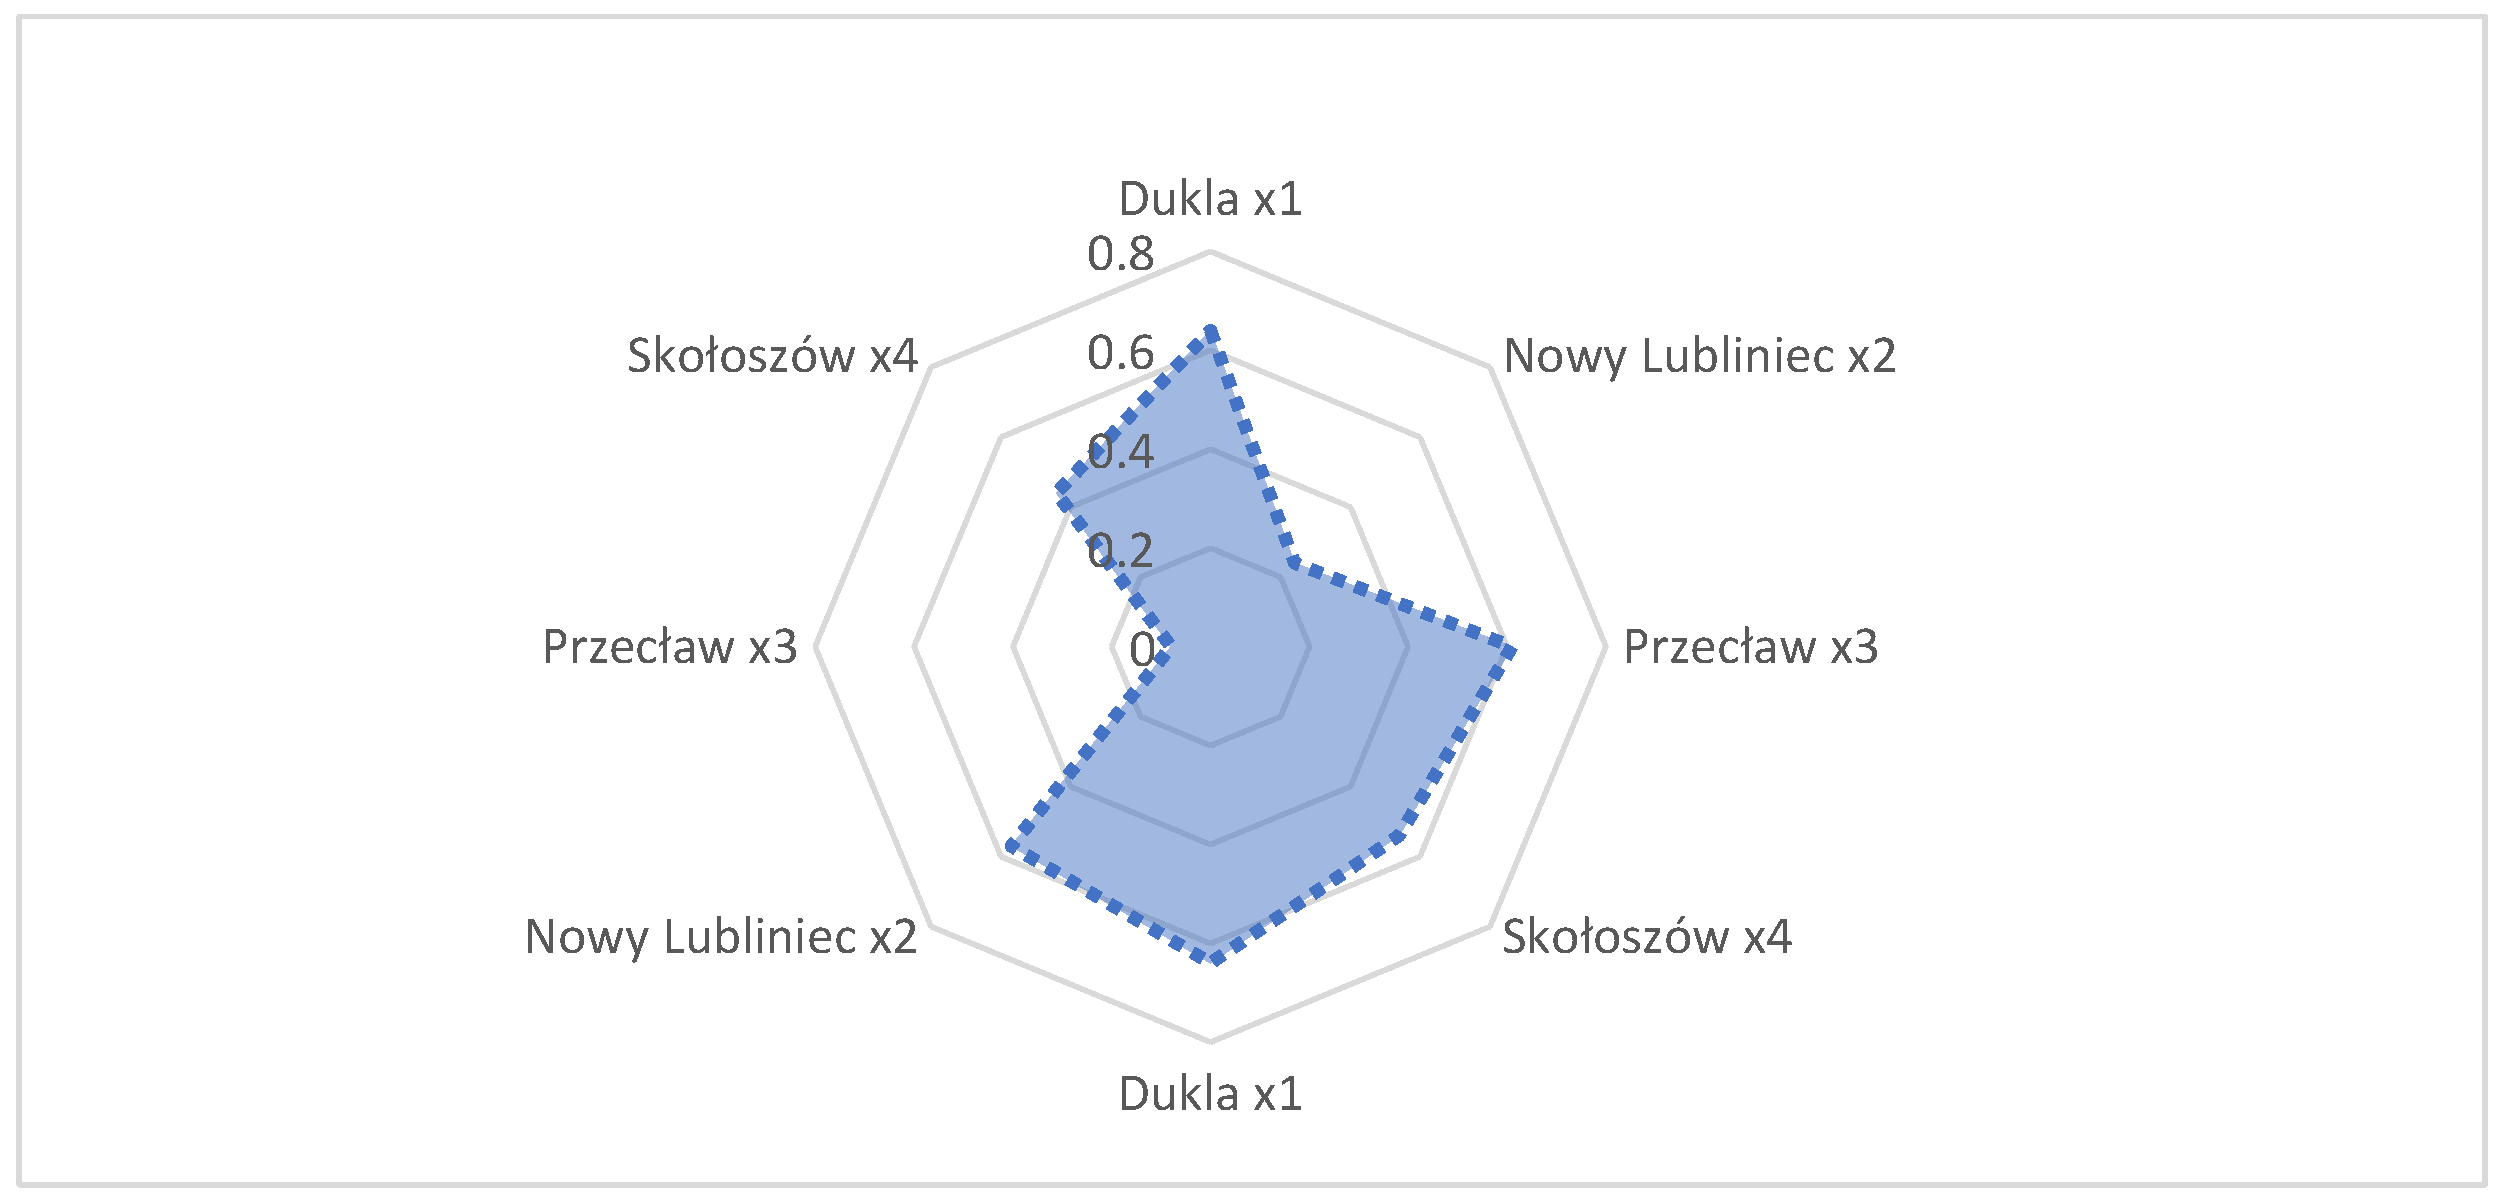
Table 1.
Descriptive statistics of average air temperature, precipitation totals and the hydrothermal coefficient of Sielianinov in 2000–2019 according to COBORU meteorological stations in Dukla, Nowy Lubliniec Przecław and Skołoszów for the potato vegetation period (April–September).
Table 1.
Descriptive statistics of average air temperature, precipitation totals and the hydrothermal coefficient of Sielianinov in 2000–2019 according to COBORU meteorological stations in Dukla, Nowy Lubliniec Przecław and Skołoszów for the potato vegetation period (April–September).
| Specification | 2000 | 2001 | 2002 | 2003 | 2004 | 2005 | 2006 | 2007 | 2008 | 2009 | 2010 | 2011 | 2012 | 2013 | 2014 | 2015 | 2016 | 2017 | 2018 | 2019 |
|---|---|---|---|---|---|---|---|---|---|---|---|---|---|---|---|---|---|---|---|---|
| Average air temperature | ||||||||||||||||||||
| Mean | 15.2 | 15.0 | 14.7 | 15.6 | 15.2 | 14.0 | 14.6 | 15.3 | 15.7 | 14.6 | 15.3 | 15.1 | 16.1 | 15.3 | 15.4 | 15.1 | 15.9 | 15.7 | 15.7 | 17.0 |
| Median | 16.4 | 16.3 | 14.7 | 16.9 | 17.2 | 15.2 | 15.0 | 15.6 | 18.1 | 16.9 | 16.9 | 17.4 | 18.0 | 17.0 | 17.5 | 16.8 | 17.5 | 17.2 | 17.3 | 16.8 |
| Stand. deviation | 3.8 | 2.9 | 4.1 | 4.5 | 4.5 | 3.8 | 3.6 | 3.9 | 4.3 | 3.8 | 4.1 | 4.5 | 4.2 | 3.9 | 3.9 | 3.8 | 4.2 | 3.4 | 3.9 | 2.7 |
| Kurtosis | −1.1 | −1.4 | −0.9 | −0.6 | −0.2 | −1.3 | −0.5 | −0.8 | −1.0 | −1.1 | −0.8 | −1.4 | −1.5 | −0.6 | −1.3 | −0.9 | −0.9 | −1.0 | −1.0 | −1.3 |
| Skewness | −0.4 | −0.4 | −0.3 | −0.8 | −1.1 | −0.4 | −0.6 | −0.3 | −0.7 | −0.6 | −0.6 | −0.5 | −0.3 | −0.8 | −0.6 | −0.6 | −0.6 | −0.6 | −0.6 | −0.1 |
| Range | 11.5 | 8.4 | 13.0 | 13.9 | 13.5 | 10.8 | 11.9 | 13.1 | 12.2 | 11.6 | 12.3 | 12.2 | 12.1 | 11.3 | 10.6 | 11.3 | 12.9 | 10.3 | 11.6 | 8.4 |
| Minimum | 8.8 | 10.7 | 7.4 | 7.1 | 6.1 | 7.6 | 7.9 | 8.4 | 8.0 | 7.9 | 8.1 | 7.9 | 9.3 | 8.0 | 8.8 | 8.1 | 8.4 | 9.7 | 8.8 | 12.4 |
| Maximum | 20.3 | 19.1 | 20.4 | 21.0 | 19.6 | 18.4 | 19.8 | 21.5 | 20.2 | 19.5 | 20.4 | 20.1 | 21.4 | 19.3 | 19.4 | 19.4 | 21.3 | 20.0 | 20.4 | 20.8 |
| V (%) | 24.8 | 19.1 | 27.9 | 28.5 | 29.7 | 26.8 | 24.4 | 25.3 | 27.6 | 25.7 | 26.8 | 29.6 | 26.0 | 25.3 | 25.3 | 25.3 | 26.7 | 21.6 | 25.0 | 16.1 |
| Sum of rainfall | ||||||||||||||||||||
| Mean | 78 | 82 | 102 | 78 | 63 | 82 | 77 | 72 | 71 | 79 | 73 | 89 | 71 | 66 | 68 | 77 | 66 | 66 | 80 | 71 |
| Median | 73 | 72 | 90 | 67 | 61 | 65 | 74 | 75 | 54 | 73 | 72 | 93 | 54 | 73 | 66 | 75 | 75 | 56 | 83 | 83 |
| Stand. deviation | 30 | 54 | 55 | 45 | 35 | 54 | 36 | 50 | 43 | 31 | 29 | 40 | 51 | 24 | 42 | 21 | 32 | 37 | 31 | 35 |
| Kurtosis | 0 | 1 | 6 | 7 | 2 | 3 | −1 | 3 | 0 | −1 | −1 | 0 | 1 | 0 | −1 | 0 | −1 | 2 | −1 | −1 |
| Skewness | 1 | 1 | 2 | 2 | 1 | 1 | 0 | 1 | 1 | 0 | 0 | −1 | 1 | 1 | 1 | 1 | −1 | 2 | −1 | 0 |
| Range | 111 | 188 | 252 | 214 | 154 | 230 | 138 | 223 | 156 | 108 | 105 | 145 | 178 | 96 | 132 | 79 | 107 | 143 | 108 | 115 |
| Minimum | 37 | 19 | 40 | 25 | 10 | 19 | 11 | 7 | 19 | 28 | 20 | 6 | 19 | 33 | 18 | 43 | 8 | 24 | 21 | 16 |
| Maximum | 148 | 207 | 292 | 239 | 164 | 249 | 149 | 230 | 175 | 136 | 125 | 151 | 197 | 129 | 150 | 122 | 115 | 167 | 129 | 131 |
| V (%) | 39 | 66 | 54 | 57 | 56 | 66 | 47 | 69 | 61 | 40 | 40 | 45 | 72 | 37 | 63 | 27 | 48 | 55 | 38 | 48 |
| HCH * | ||||||||||||||||||||
| Mean | 1.9 | 1.8 | 2.4 | 1.7 | 1.5 | 1.9 | 1.8 | 1.6 | 1.5 | 1.9 | 1.5 | 1.9 | 1.6 | 1.4 | 1.5 | 1.7 | 1.5 | 1.4 | 1.7 | 1.3 |
| Median | 1.6 | 1.7 | 2.2 | 1.6 | 1.4 | 1.7 | 1.7 | 1.4 | 1.2 | 1.8 | 1.6 | 1.8 | 1.4 | 1.4 | 1.5 | 1.6 | 1.5 | 1.4 | 1.7 | 1.3 |
| Stand. deviation | 1.0 | 1.0 | 1.1 | 0.7 | 0.8 | 0.9 | 0.7 | 0.9 | 1.1 | 0.7 | 0.4 | 1.0 | 1.2 | 0.5 | 0.8 | 0.4 | 0.6 | 0.6 | 0.7 | 0.5 |
| Kurtosis | 3.7 | 0.1 | 0.1 | 1.4 | −0.1 | 3.1 | −0.2 | 4.9 | 3.5 | 0.4 | 1.0 | 0.1 | 3.3 | 0.6 | −1.1 | −0.1 | 0.5 | −0.0 | −0.1 | −0.5 |
| Skewness | 1.7 | 0.7 | 0.8 | 0.8 | 0.5 | 1.3 | 0.2 | 1.4 | 1.9 | 0.5 | −0.6 | 0.6 | 1.8 | 0.6 | −0.0 | 0.8 | −0.8 | 0.7 | 0.0 | 0.3 |
| Range | 4.2 | 3.7 | 4.1 | 3.1 | 3.1 | 4.2 | 3.2 | 4.8 | 4.6 | 3.0 | 1.9 | 3.9 | 5.1 | 1.8 | 2.4 | 1.4 | 2.5 | 2.5 | 2.8 | 2.2 |
| Minimum | 0.7 | 0.3 | 0.9 | 0.6 | 0.2 | 0.5 | 0.3 | 0.2 | 0.5 | 0.5 | 0.5 | 0.2 | 0.3 | 0.7 | 0.3 | 1.2 | 0.1 | 0.4 | 0.3 | 0.4 |
| Maximum | 4.9 | 4.1 | 5.0 | 3.7 | 3.2 | 4.8 | 3.4 | 4.9 | 5.1 | 3.5 | 2.4 | 4.1 | 5.4 | 2.5 | 2.7 | 2.6 | 2.6 | 2.9 | 3.1 | 2.6 |
| V (%) | 51.1 | 52.3 | 45.0 | 40.9 | 51.7 | 47.9 | 42.0 | 60.0 | 72.1 | 38.9 | 28.2 | 50.3 | 76.9 | 31.4 | 51.8 | 21.7 | 43.6 | 45.0 | 38.8 | 41.8 |
* HTC—Hydro-thermal Coefficient of Sielianinov expressed as the quotient of the monthly sum of atmospheric precipitation and the sum of average daily air temperatures in a given decade or month for the period in which the average daily temperature exceeds 10 °C [23].
Table 2.
Statistical characteristics dependent and independent variables.
| Traits | Y | X1 | X2 | X3 | X4 | X5 |
|---|---|---|---|---|---|---|
| Minimum | 16.9 | 1.42 | 16.01 | 14.31 | 23.52 | 0.61 |
| Maximum | 29.0 | 17.5 | 19.62 | 19.63 | 133.1 | 3.52 |
| Median | 18.15 | 11.32 | 18.03 | 15.6 | 67.02 | 1.94 |
| Mean | 22.96 | 9.46 | 17.96 | 16.97 | 78.31 | 2.07 |
| Standard deviation | 3.66 | 2.17 | 0.98 | 0.89 | 22.12 | 0.65 |
| Skewness | 0.06 | −1.81 | −0.15 | 2.34 | 0.42 | 0.25 |
| Kurtosis | −1.33 | 12.52 | −0.99 | 10.56 | 1.12 | 0.11 |
| Coefficient of variation V [%] | 15.95 | 22.94 | 5.46 | 5.24 | 28.25 | 31.41 |
Y—yield; X1—temperature of the April–May; X2—temperature of June–July; X3—temperature of August–September; X4—rainfalls of April–September; X5—indicators of hydrothermal of April–September.
Table 3.
Correlation coefficients of dependent (y) and independent (x) variable.
| Variables | Y | X1 | X2 | X3 | X4 | X5 |
|---|---|---|---|---|---|---|
| Y | 1.000 | |||||
| X1 | 0.316 * | 1.000 | ||||
| X2 | 0.270 * | 0.090 | 1.000 | |||
| X3 | 0.380 ** | 0.096 | 0.399 ** | 1.000 | ||
| X4 | 0.488 ** | −0.183 | −0.301 * | −0.222 | 1.000 | |
| X5 | 0.496 ** | −0.211 | −0.447 ** | −0.296 * | 0.838 ** | 1.000 |
Y—total yield; X1—temperature of April–May; X2—temperature of June–July; X3—temperature of August–September; X4—rainfalls of April–September; X5—indicators of hydrothermal of April–September; * significant at p ≤ 0.05 ** significant at p ≤ 0.01.
Table 4.
Infection coefficients of Phytophthora infestans in the time.
| Years | Earliness Group | Mean | |||
|---|---|---|---|---|---|
| Very Early | Early | Medium Early | Medium Late and Late | ||
| 2000 | 0.275 | 0.204 | 0.196 | 0.075 | 0.188 |
| 2001 | 0.218 | 0.201 | 0.132 | 0.089 | 0.160 |
| 2002 | 0.278 | 0.189 | 0.111 | 0.078 | 0.164 |
| 2003 | 0.290 | 0.226 | 0.128 | 0.069 | 0.178 |
| 2004 | 0.301 | 0.187 | 0.151 | 0.070 | 0.177 |
| 2005 | 0.412 | 0.325 | 0.273 | 0.189 | 0.300 |
| 2006 | 0.523 | 0.356 | 0.298 | 0.176 | 0.338 |
| 2007 | 0.568 | 0.486 | 0.378 | 0.311 | 0.436 |
| 2008 | 0.218 | 0.178 | 0.143 | 0.073 | 0.153 |
| 2009 | 0.290 | 0.226 | 0.156 | 0.069 | 0.185 |
| 2010 | 0.356 | 0.334 | 0.279 | 0.168 | 0.284 |
| 2011 | 0.189 | 0.079 | 0.075 | 0.073 | 0.104 |
| 2012 | 0.209 | 0.184 | 0.156 | 0.071 | 0.155 |
| 2013 | 0.298 | 0.191 | 0.151 | 0.089 | 0.182 |
| 2014 | 0.314 | 0.243 | 0.181 | 0.083 | 0.205 |
| 2015 | 0.191 | 0.206 | 0.122 | 0.069 | 0.147 |
| 2016 | 0.521 | 0.378 | 0.295 | 0.179 | 0.343 |
| 2017 | 0.351 | 0.181 | 0.120 | 0.073 | 0.181 |
| 2018 | 0.246 | 0.148 | 0.114 | 0.073 | 0.145 |
| 2019 | 0.231 | 0.134 | 0.110 | 0.056 | 0.133 |
| Mean | 0.314 | 0.233 | 0.178 | 0.107 | 0.208 |
| LSD0.05 | 0.016 | 0.012 | 0.009 | 0.006 | 0.011 |
Table 5.
Simple Pearson’s correlation coefficients between the rate of spread of potato blight and the yield of tubers.
Table 5.
Simple Pearson’s correlation coefficients between the rate of spread of potato blight and the yield of tubers.
| Specification | X1 | X2 | X3 | X4 | X5 | Y1 | Y2 | Y3 | Y4 |
|---|---|---|---|---|---|---|---|---|---|
| X1 | 1.00 | ||||||||
| X2 | 0.90 ** | 1.00 | |||||||
| X3 | 0.89 ** | 0.96 ** | 1.00 | ||||||
| X4 | 0.87 ** | 0.92 ** | 0.93 ** | 1.00 | |||||
| X5 | 0.96 ** | 0.98 ** | 0.98 ** | 0.95 ** | 1.00 | ||||
| Y1 | −0.67 ** | −0.67 ** | −0.65 ** | −0.59 ** | −0.68 ** | 1.00 | |||
| Y2 | −0.68 ** | −0.71 ** | −0.70 ** | −0.62 ** | −0.70 ** | 0.98 ** | 1.00 | ||
| Y3 | −0.40 ** | −0.37 ** | −0.36 ** | −0.40 ** | −0.39 ** | 0.50 ** | 0.46 ** | 1.00 | |
| Y4 | −0.15 | −0.17 | −0.12 | −0.19 * | −0.16 | 0.36 * | 0.31 * | 0.85 ** | 1.00 |
X1—P. infestans spreading rate coefficient of very early varieties; X2—factor of the spread of late blight of early cultivars; X3—coefficient of the spreading rate of mid-early cultivars; X4—coefficient of the spreading rate of medium-late and late cultivars; X5—the average rate of the spread of the plague; Y1—total yield of potato tubers; Y2—marketable yield of tubers; Y3—yield of early potato cultivars 60 days after planting; Y4—yield of early potato cultivars after 75 days from planting; *—significant at p ≤ 0.05, **—significant at p ≤ 0.01.
Publisher’s Note: MDPI stays neutral with regard to jurisdictional claims in published maps and institutional affiliations. |
© 2022 by the authors. Licensee MDPI, Basel, Switzerland. This article is an open access article distributed under the terms and conditions of the Creative Commons Attribution (CC BY) license (https://creativecommons.org/licenses/by/4.0/).
Share and Cite
MDPI and ACS Style
Sawicka, B.; Barbaś, P.; Pszczółkowski, P.; Skiba, D.; Yeganehpoor, F.; Krochmal-Marczak, B. Climate Changes in Southeastern Poland and Food Security. Climate 2022, 10, 57. https://0-doi-org.brum.beds.ac.uk/10.3390/cli10040057
AMA Style
Sawicka B, Barbaś P, Pszczółkowski P, Skiba D, Yeganehpoor F, Krochmal-Marczak B. Climate Changes in Southeastern Poland and Food Security. Climate. 2022; 10(4):57. https://0-doi-org.brum.beds.ac.uk/10.3390/cli10040057
Chicago/Turabian StyleSawicka, Barbara, Piotr Barbaś, Piotr Pszczółkowski, Dominika Skiba, Farhood Yeganehpoor, and Barbara Krochmal-Marczak. 2022. "Climate Changes in Southeastern Poland and Food Security" Climate 10, no. 4: 57. https://0-doi-org.brum.beds.ac.uk/10.3390/cli10040057
Note that from the first issue of 2016, this journal uses article numbers instead of page numbers. See further details here.