Article

Spatio-Temporal Trends of Precipitation and Temperature Extremes across the North-East Region of Côte d’Ivoire over the Period 1981–2020

by
Kouamé Donald Kouman
1,2,3,*,
Amos T. Kabo-bah
2,
Boyossoro Hélène Kouadio
3 and
Komlavi Akpoti
4
1
Regional Centre for Energy and Environmental Sustainability, University of Energy and Natural Resources, Sunyani P.O. Box 214, Ghana
2
Civil and Environmental Engineering Department, University of Energy and Natural Resources, Sunyani P.O. Box 214, Ghana
3
UFR-Science de la Terre et des Ressources Minières (STRM), Université Félix Houphouët-Boigny, Abidjan 22 BP 582, Côte d’Ivoire
4
International Water Management Institute (IWMI), Cantonments Accra, Greater Accra PMB CT 112, Ghana
*
Author to whom correspondence should be addressed.
Submission received: 24 March 2022 / Revised: 6 May 2022 / Accepted: 8 May 2022 / Published: 20 May 2022

Abstract

:
The northeast region of Côte d’Ivoire, where agriculture is the main economic activity, is potentially vulnerable to extreme climatic conditions. This study aims to make a comprehensive spatio-temporal analysis of trends in extreme indices related to precipitation and temperature for the Zanzan region of Côte d’Ivoire over the period of 1981–2020. The statistical significance of the calculated trends was assessed using the non-parametric Mann–Kendall test, while Sen’s slope estimation was used to define the amount of change. For extreme precipitations, the results showed a decreasing trend in annual total precipitations estimated at 112.37 mm and in daily precipitations intensity indices. Furthermore, the consecutive dry days’ index showed an increasing trend estimated at 18.67 days. Unlike the trends in precipitation extremes, which showed statistically non-significant trends, the trends in temperature extremes were mostly significant over the entire study area. The cold spells indices all show decreasing trends, while the warm spells show increasing trends. Drawing inferences from the results, it becomes clear that the study area may be threatened by food insecurity and water scarcity. The results are aimed to support climate adaptation efforts and policy intervention in the region.

1. Introduction

The achievement of sustainable development goals (SDGs), especially those related to ensuring environmental sustainability, reduction of poverty and hunger, and access to clean water among others are under severe threat from climate change [1,2]. This is important, particularly for Sub-Saharan Africa (SSA), where agriculture is the primary source of income and livelihood for many people. With nearly 19% of the region’s gross output produced in the agricultural sector, SSA is the most agriculturally dependent region in the world after South Asia [3]. However, there is a high dependence of crops on weather events, with 97% of agricultural land being rainfed [4], and only 1% of cultivated land being irrigated [5,6]. For several decades climate change has strongly affected this part of Africa [7]. This manifestation of climate change in SSA is perceived through the increase in temperature, the presence of storms and extreme precipitation [8], the increase in land salinity, the worsening of weather conditions, and tornadoes that result in the ruin of ecosystems [9]. In its third assessment report, the Intergovernmental Panel on Climate Change (IPCC) stated that the number of hydro-meteorological disasters has increased significantly through heavy rainfall, severe landslides, increased incidence of floods, and severe frequency of droughts in different parts of Africa [10].
The change in rainfall and temperature over the past decades has caused significant vulnerabilities for food security. In maize and rice farming, for example, rainfall and temperature are important factors for yield, water availability, and the potential of the land to support crop production [11], and excesses or reductions in the value of these parameters produce negative effects [12]. Yields of common crops, such as cassava, sorghum, maize, and millet, are currently declining and these declines may be further accentuated in the future under the influence of climate change [13] in SSA. Studies conducted in several SSA countries show that these low agricultural productivity levels are an important threat to human health and nutrition, especially for children [14,15]. In 2006, among the 39 countries in the world that expressed a need for external food aid to cover the consumption needs of their population, 25 were in sub-Saharan Africa [16]. Food insecurity remains a major threat for SSA. With an already precarious economy, economic performance in SSA could be reduced by climate change [17] considering the significant contribution of agriculture to the gross domestic product (GDP). For example, in one of its reports, the World Bank stated that 17% of GDP in SSA comes from agriculture, and this proportion even exceeded 50% in some countries in 2005 [18]. In addition, the provision of ecosystem services and the functioning of ecosystems are also affected by climate change and therefore constitute a considerable concern for economic development and human societies [19]. In terms of health, climate change is leading to the modifications in certain disease vectors, involving changes in the transmissibility of some infectious diseases in SSA [20]. The increase in desertification [21], the threat to the existence of large wetlands that cover 9.01% of the landmass with a large population of poor people dependent on them for their livelihoods [22], and natural disasters, such as heat waves and droughts, coastal, river and rainfall floods that threaten already vulnerable urban areas [23] are also noted.
West Africa, as part of the global climate context of SSA, is heavily reliant on rainfed agriculture [24], high seasonal climate variability, and weak economic and institutional capacity to respond to climate variability and change, the region is perceived to be highly vulnerable to climate change [25]. Several studies on which this statement is based have looked extensively at the impacts of climate extreme events [26,27,28]. A climate extreme is described as a weather or climate variable having a value far from its average value and for simplicity, this term is used to refer to both weather and climate extremes [29]. Rapid climate change is occurring in West Africa, with widespread warming, more frequent climate extremes, and the reappearance of monsoonal rains in some areas [25]. Under both high and moderate emission scenarios, the existing climate trends are likely to persist into the twenty-first century [30]. Heat waves, floods, and droughts, among other events of climate extreme, are predicted to have a large impact in developing nations, especially in the rural areas [31]. However, understanding how climate extremes change at the global, regional, and local levels is a major first step in planning appropriate adaptation measures, as variations in climate extremes have significant socioeconomic impacts [32,33]. Extreme climate events are localized weather events, both in spatial and temporal terms, that cause significant damage to agriculture, livestock, and natural resources [34]. Indeed, rising temperatures coupled with increased variability in precipitation will lead to dysfunctional agricultural seasons, disruption of crop life cycles, and deterioration in agricultural production [35]. According to multiple research studies, cereal production in West Africa is expected to drop about 10% by 2050 [36,37] due to extreme temperature and rainfall. Food insecurity is still an issue in West Africa, where the need for food is anticipated to grow fivefold by 2050 as the region’s population doubles [38]. Agriculture is therefore directly affected by both temperature and rainfall extremes and is the most vulnerable and exposed economic sector in West Africa. Climate extremes have a significant impact on the current economic development of African countries, particularly in areas of traditional rainfed agriculture and pastoralism, and on water resources at all levels. This factor could therefore worsen poverty in Africa where economic development is already precarious. The 2013 report on Geography of Poverty, Disasters and Climate Extremes in 2030 mapped the places where the poorest people were likely to live. It found that many regions with concentrated poor populations would also experience an increasing number of extreme climate events. According to the report, by 2030, up to 325 million extremely poor people will be living in the 49 countries most at risk, the majority of which are located in South Asia and sub-Saharan Africa [39].
Since its independence, Côte d’Ivoire has considered agriculture as its key economic strength. Agriculture currently employs 46% of the working population and contributes 21.2% of the country’s GDP [40]. Furthermore, Côte d’Ivoire’s agriculture is predominantly rainfed, with only 0.2% of the country’s cultivated land currently equipped for irrigation [41]. Concerns about the effects of climate change are therefore high, especially as climate change has already led to warmer temperatures, greater meteorological variability, shifting precipitation patterns and more extreme weather conditions, and increased drought occurrence [42]. In Côte d’Ivoire, rainfall deficits and extreme temperatures have already been highlighted in the central part of the country [43,44], with high values noticed for the southern [45] and the northern parts of the country [46]. The risks to rainfed agriculture related to the new rainfall conditions are disruption of the agricultural cycle, seed losses, and yield reduction [41]. A global food security survey revealed that 12.6% of the rural population in Côte d’Ivoire are food insecure, with 2.5% being severely food insecure and 10.1% being moderately food insecure [40]. One of the reasons for this vulnerability to food insecurity is the occurrence of drought and climate extremes [47]. Communities in the northern part of Côte d’Ivoire have long suffered from recurring climate extremes that have limited their ability to improve agricultural activities [48]. The Zanzan region in the northeastern part of Côte d’Ivoire appears to be one of the least rainfed regions in the country [49]. However, the Zanzan region represents an economic potential for the Côte d’Ivoire. In fact, in the Zanzan region, agriculture is the main source of income for the population, and it occupies more than 90% of the population. In terms of food crops, this region is a potential supplier of food products, such as yams, cassava, and corn, for Côte d’Ivoire. Its main commercial crop, cashew nuts, contributes essentially to the Ivorian GDP. For such a region, climate variability through, for example, rainfall disruption, which is a constraint to agricultural development, would considerably influence socio-economic activities. Indeed, considered as one of the driving forces in the practice of rainfed agriculture, previous studies have shown that, to some extent, the climate by its extreme has played a role in the modification of past and present cropping systems in this region [50]. The study by Dje et al. [51] in the region showed periods of disruption in the rainy season. These previous studies have been limited to the study of climate variability without quantifying these climate disturbances in the region. According to WMO [52,53], the ability to handle the risks related to extreme climate events is critical to the long-term viability of agricultural development and the economic life of the local population. Therefore, the quantification of climate extremes for better understanding of their evolution in the region is essential for long-term socio-economic development. In addition, with the advent of climate change and variability that have disrupted socio-economic patterns in many parts of the world, studies on climate aspects will support local authorities in immediate decision making and planning for the welfare of their populations. The current study’s main objective is to map the spatio-temporal evolution of climatic extremes in the Zanzan region of northeastern Côte d’Ivoire from 1981 to 2020 through the indices generated by the WMO Expert Team on Climate Change Detection Monitoring and Indices (ETCCDMI).

2. Materials and Methods

2.1. Study Area

Côte d’Ivoire is a West African country currently divided into 31 regions including the Zanzan region. The Zanzan region is in the northeast of Côte d’Ivoire between latitudes 7° and 10° North, and longitudes 4°30′ and 2°30′ West (Figure 1). This region, whose regional capital is the city of Bondoukou, is dominated by a humid tropical Sudanese-Guinean climate. The main climate has four seasons, two of which are rainy seasons from March to June and from September to October. These rainy seasons are interspersed with two dry seasons which run from November to February and from July to August. The annual rainfall varies between 800 and 1200 mm with an average temperature of about 28 °C [54]. The Zanzan region has a surface area of approximately 38,000 km2. Based on the 2014 national population and housing census, its population is estimated at 934,352 inhabitants [55]. The region’s economy is mainly based on agriculture, livestock production, trade (food crops, handicrafts, etc.), and services. Cashew nuts are the main cash crop in the region with a contribution of 22% of national production [49]. The cashew industry constitutes 8.8% of the GDP of Côte d’Ivoire with a production of 700,000 tons [56]. In addition to this crop, cocoa and coffee are produced in small quantities in the southern part of the Zanzan region.

2.2. Data

The present research is based on a climatic database, spatially covering the entire Zanzan region. The data are a 40-year (1981 to 2020) time series of daily precipitation and temperature data from 12 measuring stations (Figure 1) taken from the Côte d’Ivoire meteorological station (SODEXAM). The percentage of missing data was used to verify data quality. The percentages of missing data for minimum temperature (Tmin), maximum temperature (Tmax), and precipitation ranged from 0 to 6%, 0 to 7%, and 0 to 11%, respectively (Table 1). To fill in the missing data, the method of using a gridded meteorological database, based on reanalysis and satellite data was used in this study, especially the data from NASA Prediction of Worldwide Energy Resource (POWER). NASA POWER data are a suitable alternative when ground-based data are missing or of doubtful quality [57]. These data based on reanalysis models developed by NASA’s Global Modeling and Assimilation Office (GMAO) [58] can be accessed and downloaded via the POWER website homepage at http://power.larc.nasa.gov (accessed on 11 March 2021). NASA POWER data have long been used and validated in the US in several studies [59]. Before using the NASA POWER data to fill in the missing data from the ground stations (SODEXAM), correlation tests were conducted between the different data sets using Pearson’s correlation coefficient (r) for the twelve stations (Table 2). The positive correlations closer to 1 illustrated by the results in Table 2 show a good correlation between the different data sets. It is at the end of the different tests that the POWER data were used to fill our missing data. Other studies have found a strong link between ground data and NASA POWER data, such as Bai et al. [60] in China, Bender and Sentelhas [61] in Brazil, and Aboelkhair et al. [62] in Egypt, or have used NASA POWER data to fill the gaps in their ground data, such Berhane et al. [63] in Ethiopia and West Africa [64].

2.3. Methods

2.3.1. Homogeneity Test of the Data Used

Before calculating indices related to climate extremes, it is necessary to check the homogeneity of the daily input data, look for points of change in the time series, assess whether they are natural or not, and then rectify them. Homogeneity refers to a series’ consistency through time, and it is an evident necessity for reliable climatic time series analysis [65]. There is presently no mechanism to homogenize the data in ClimPACT2, the software used to calculate the indices related to climatic extremes, except for simple quality control. The software application RHtest of the “Canadian Meteorological Service” and adopted by the ETCCDMI [32,66], was used in the current research work to correct the homogeneity of the daily data. This software is run in the R statistical and programming environment. A double regression model is used in this process [67].

2.3.2. Analysis of Climate Extremes Indices

For the characterization of the intensity, frequency, and duration of extreme climate events, indices have been developed and recommended by the Expert Team on Sector-specific Climate Indices (ET-SCI) and the Expert Team on Climate Change Detection Monitoring and Indices (ETCCDMI), both from the WMO [65]. The ETCCDMI indices are integrated into the RClimDex software [68]. Those of ET-SCI, which already contain the ETCCDMI indices with additional indices to be used in sectoral applications based on specialists from the health, water, and agriculture sectors, are integrated into ClimPACT2 software [65]. ClimPACT2 software is an update of ClimPACT, which was based on ETCCDMI’s RClimDex software. RClimDex and ClimPACT2 are written in R, statistical computing, and graphic language and environment. A series of 27 indices including 11 precipitation and 16 temperature-related indices were defined by ETCCDMI [65,69]. Climate indices are generated values that can be used to reflect the state of variations in the climate system. They allow statistical study and comparison of time series, extremes, trends, and means [70]. The use of indices to detect climate change has the advantage of allowing for a simple comparison of trends across different climate zones and areas [71]. In this study, the indices were calculated using the ClimPACT2 Master program after a quality control and homogeneity test of the daily input data, but only the indices deemed relevant and applicable to Côte d’Ivoire were selected for a detailed analysis (Table 3). The quality control was performed by the software before the calculation of the climate indices in order to check for fundamental input mistakes, such as intentionally exaggerated results or rounding bias, and missing data. The indices listed in Table 2 were chosen for this study because they have already been applied several times in other studies in West Africa [27,72,73,74] and Côte d’Ivoire [71,75,76] for the detection of change in climate extremes. These indices are therefore considered relevant and adaptable to the climatic context of the Zanzan region for the detection of changes in precipitation and temperature extremes.

2.3.3. Trend Analysis

After verification of data quality and coherency, the next step was to calculate the climate indices by ClimPACT2 software. Then a statistical analysis of the trends was performed. There are several methods of statistical trend analysis that other similar studies have already used, where we can mention among others the linear trend analysis [77], the linear trend analysis associated with the t-test [75,78], the non-parametric Kendall’s tau test with linear least squares trend [33,79], the Sen’s slope estimator with non-parametric Mann–Kendall test [63,74,80,81]. The non-parametric Mann–Kendall test has been utilized in various research works since it makes no assumptions regarding data distribution or trend linearity [82]. Unlike parametric trend tests, which demand that the data be both normally distributed and independent, non-parametric trend tests only require independent data [28]. The Sen’s slope estimator and non-parametric Mann–Kendall (MK) test have been used in this study to assess the statistical significance of the trends and to accurately determine the magnitude of the trends in climate extremes indices due to their robustness in addition to their insensitivity to outliers in the times series. The MK test was performed using the MAKESENS software. The null hypothesis (H0) in the calculation of this test asserts that there is no trend in climate extremes over time, whereas the alternative hypothesis (H1) indicates that there is a monotonic decreasing or increasing trend. The mathematical equations used to calculate the Mann–Kendall test are as follows:
S = k = 1 n 1 j = k + 1 n s g n ( X j X k )
In a data set of length n, Xj and Xk are consecutive data values.
s g n ( X j X k ) = { 1 ,   i f   X j > X k 0 ,   i f   X j = X k 1 ,   i f   X j < X k  
The behavior of the S statistic is approximately the same for a normal distribution when n 8 , so the test is performed with a normal distribution with E(S) = 0 with the variance as follows:
Var ( S m k ) = n ( n 1 ) ( 2 n + 5 ) p = 1 q t p ( t p 1 ) ( 2 t p + 5 ) 18  
Here tp is the number of input values inside the p-th affiliated group and q is the number of affiliated groups in the data set. The test statistic Zmk is calculated using the values of S and Var (Smk) as follows:
Z mk = { S 1 V a r ( S m k ) ,   i f   S > 0 0 ,   i f   S = 0 S + 1 V a r ( S m k ) ,   i f   S < 0
Zmk is a statistically significant trend detection tool. A positive (negative) value of Zmk indicates the upward (downward) trend. To check for a monotonic upward or downward trend (two-tailed test) at the α level of significance, H0 is rejected if the absolute value of Z mk > Z 1 2 where Z 1 2 is acquired from the usual normal cumulative distribution tables. The trend outcomes in this study were evaluated at the 5% level of significance, with the null hypothesis of no trend being rejected if |Zmk| > 1.96. The estimator of Sen [83] which is defined by Equations (5) and (6), was used to calculate the real slope of an existing trend.
Q i = X j X k j k   f o r   a l l   j > k
There will be N = n ( n 1 ) / 2 slope Qi estimations if the time series has n xj values. The median of these N values of Qi is Sen’s slope estimator.
Q m e d = { Q [ ( N + 1 ) / 2 ] , i f   N   i s   o d d 1 2 ( Q [ N / 2 ] + Q [ ( N + 2 ) / 2 ] ) ,   i f   N   i s   e v e n

2.3.4. Spatial Interpolation of Climate Indices

To produce a continuous surface, spatial distribution or interpolation improves the representation of a surface and forecasts values for other uncharted territories [84]. It is a mathematical approach or function for estimating values in situations when there are no measurable values [85]. Interpolation methods (e.g., spline, inverse distance weighting (IDW), Kriging, etc.) are numerous and vary greatly in complexity and effectiveness. The Kriging approach was employed in this study to interpolate the extreme climate indices from the ArcGIS software for spatial analysis. Kriging is a geostatistical method that provides unbiased estimates with minimum variance taking into account the spatial relationship between the data points [86]. The advantage of using geostatistical interpolation approaches over conventional techniques for spatial estimation of weather data has been reported by several authors [87,88,89]. One of the main advantages of Kriging over simpler techniques, such as IDW, besides providing a measure of estimation uncertainty (Kriging variance), is that it can use correlated dense secondary variables to improve the prediction of a sparsely sampled primary variable [86]. Considering the topography as a secondary variable, the prediction of meteorological data can be improved by using Kriging. In this study, among the interpolation methods, Kriging gives the best representativeness of our results.

3. Results

3.1. Analysis of the Zanzan Region’s Spatio-Temporal Evolution of Extreme Precipitation Trends

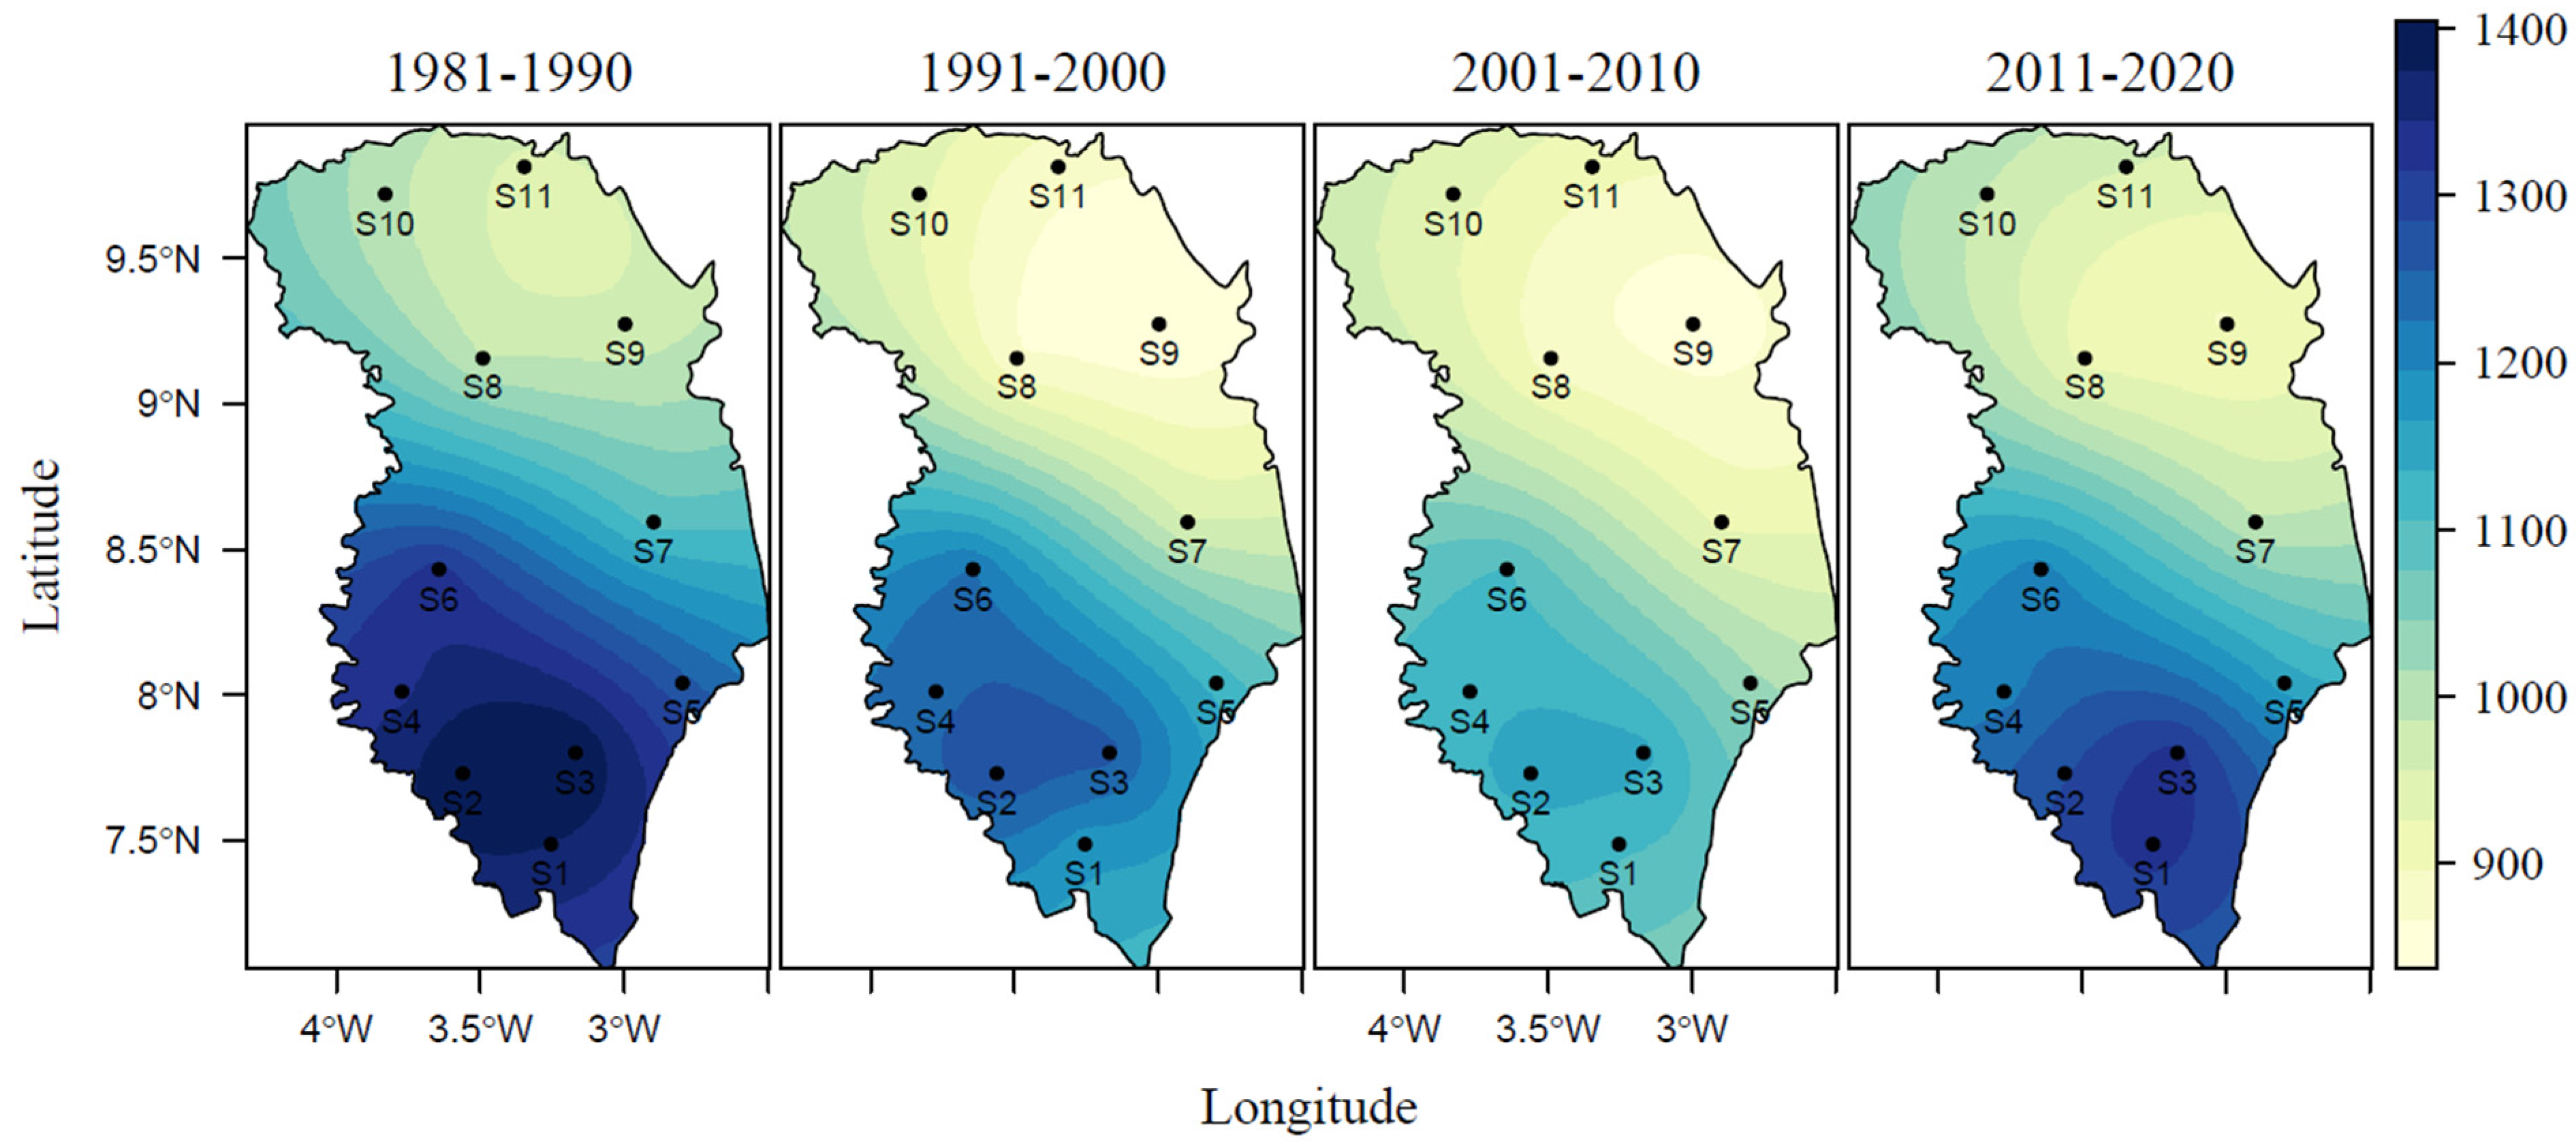
3.1.1. Total Annual Precipitation Index (PRCPTOT)

Table 4 shows both the Sen slope and Mann–Kendall statistical test for all of the extreme rainfall indices studied for the 12 stations. In the Zanzan region, an examination of cumulative annual precipitations PRCPTOT shows a general decreasing trend. This is observed in 10 of the study stations, excluding the Doropo and Téhini sites, which show increasing trends. This downward trend is however statistically non-significant at the 5% level of significance. Over a decade, the largest decreases are estimated at 45.1 mm/decade at Kouassi-datékro, 41.5 mm/decade at Sandegué, and 38.2 mm/decade at Bondoukou. Over the period of 1981–2020, the annual total precipitations decreased by an average of 112.35 mm over the entire study area. The total annual precipitation index is shown in Figure 2 as a spatial distribution per decade. From 1981 to 2020, the cumulative annual rainfall ranged from 837.69 to 1404.3 mm. In the first decade (i.e., 1981 to 1990), the cumulative precipitation was between 947.1 and 1404.3 mm and from 1991 to 2000, the value was between 837.69 and 1276.9 mm, representing a decrease of 127.4 mm. For the 2001–2010 decade, the total annual precipitation varied between 852.14 and 1145.3 mm, for a decrease of 131.6 mm compared to the previous decade. From 2011 to 2020, the total precipitation was between 895.56 and 1327.2 mm, corresponding to an increase of 181.9 mm. Compared to the last two decades, the 2011–2020 decade shows a slight return of precipitation, but less important than the precipitation of the 1981–1990 decade. The analysis of Figure 2 indicates that the largest overall precipitation was found in the Zanzan region’s south, while the lowest was found in the study area’s northern part.

3.1.2. Daily Precipitation Intensity Index (SDII)

The Mann–Kendall test of trends in the daily precipitation intensity index (Table 4) reveals general declining trends at most of the research sites, but are not significant at the 5% level of significance. The daily precipitation intensity in the studied area decreased by 0.47 mm/d on average across the study period. The largest drops were observed in Kouassi-datékro and Sandegué stations, with estimates of 1.17 mm/d and 0.78 mm/d, respectively. Figure 3 displays the spatial distribution of the index per decade. From 1981 to 1990, the daily rainfall intensity in the Zanzan region varied between 5.34 and 7.22 mm/d, and over the 1991–2000 decade this variation was between 4.82 and 6.59 mm/d, corresponding to a decrease of 0.63 mm/d. From 2001 to 2010, the values of the index were between 4.81 and 6.15 mm/d, which implies a decrease of 0.09 mm/d, and from 2011 to 2020 the variation was between 5.26 and 6.73 mm/d, which is an increase of 0.58 mm/d. From 1981 to 2020, the southwestern part of the Zanzan region experienced the highest daily precipitation intensity, while the north-eastern half experienced the lowest.

3.1.3. Index of Consecutive Wet Days (CWD)

Figure 4 and Table 4 show the outputs of the Mann–Kendall statistical test of the data series and the geographical extent of the consecutive wet day’s index in the Zanzan region, respectively. All stations in the study area have a general dropping trend in consecutive wet days, and three of these stations have a significant declining trend at the 5% significance level, according to the descriptive statistics. Over the study period of 1981–2020, these significant decreases were estimated at 30.03 days at Bondoukou, 26.52 days at Sapli, and 22.62 days at Kouassi-datékro. Over the whole study area, the total average decline was 16.45 days. The spatial distribution of consecutive wet days per decade shows a variation from 37.7 to 69.8 days over the period of 1981–1990 and from 1991 to 2000 the index varied from 32.1 to 51.99, indicating a decrease of 17.81 days. From 2001 to 2010 the evolution of the index indicates a decrease of 3.29 days while from 2011 to 2020 a decrease of 5.9 days was observed. The greatest reductions are seen in the southeast of the region under consideration for the entire study period. The duration of rainy seasons in a certain location was determined by the sequence of rainy days CWD.

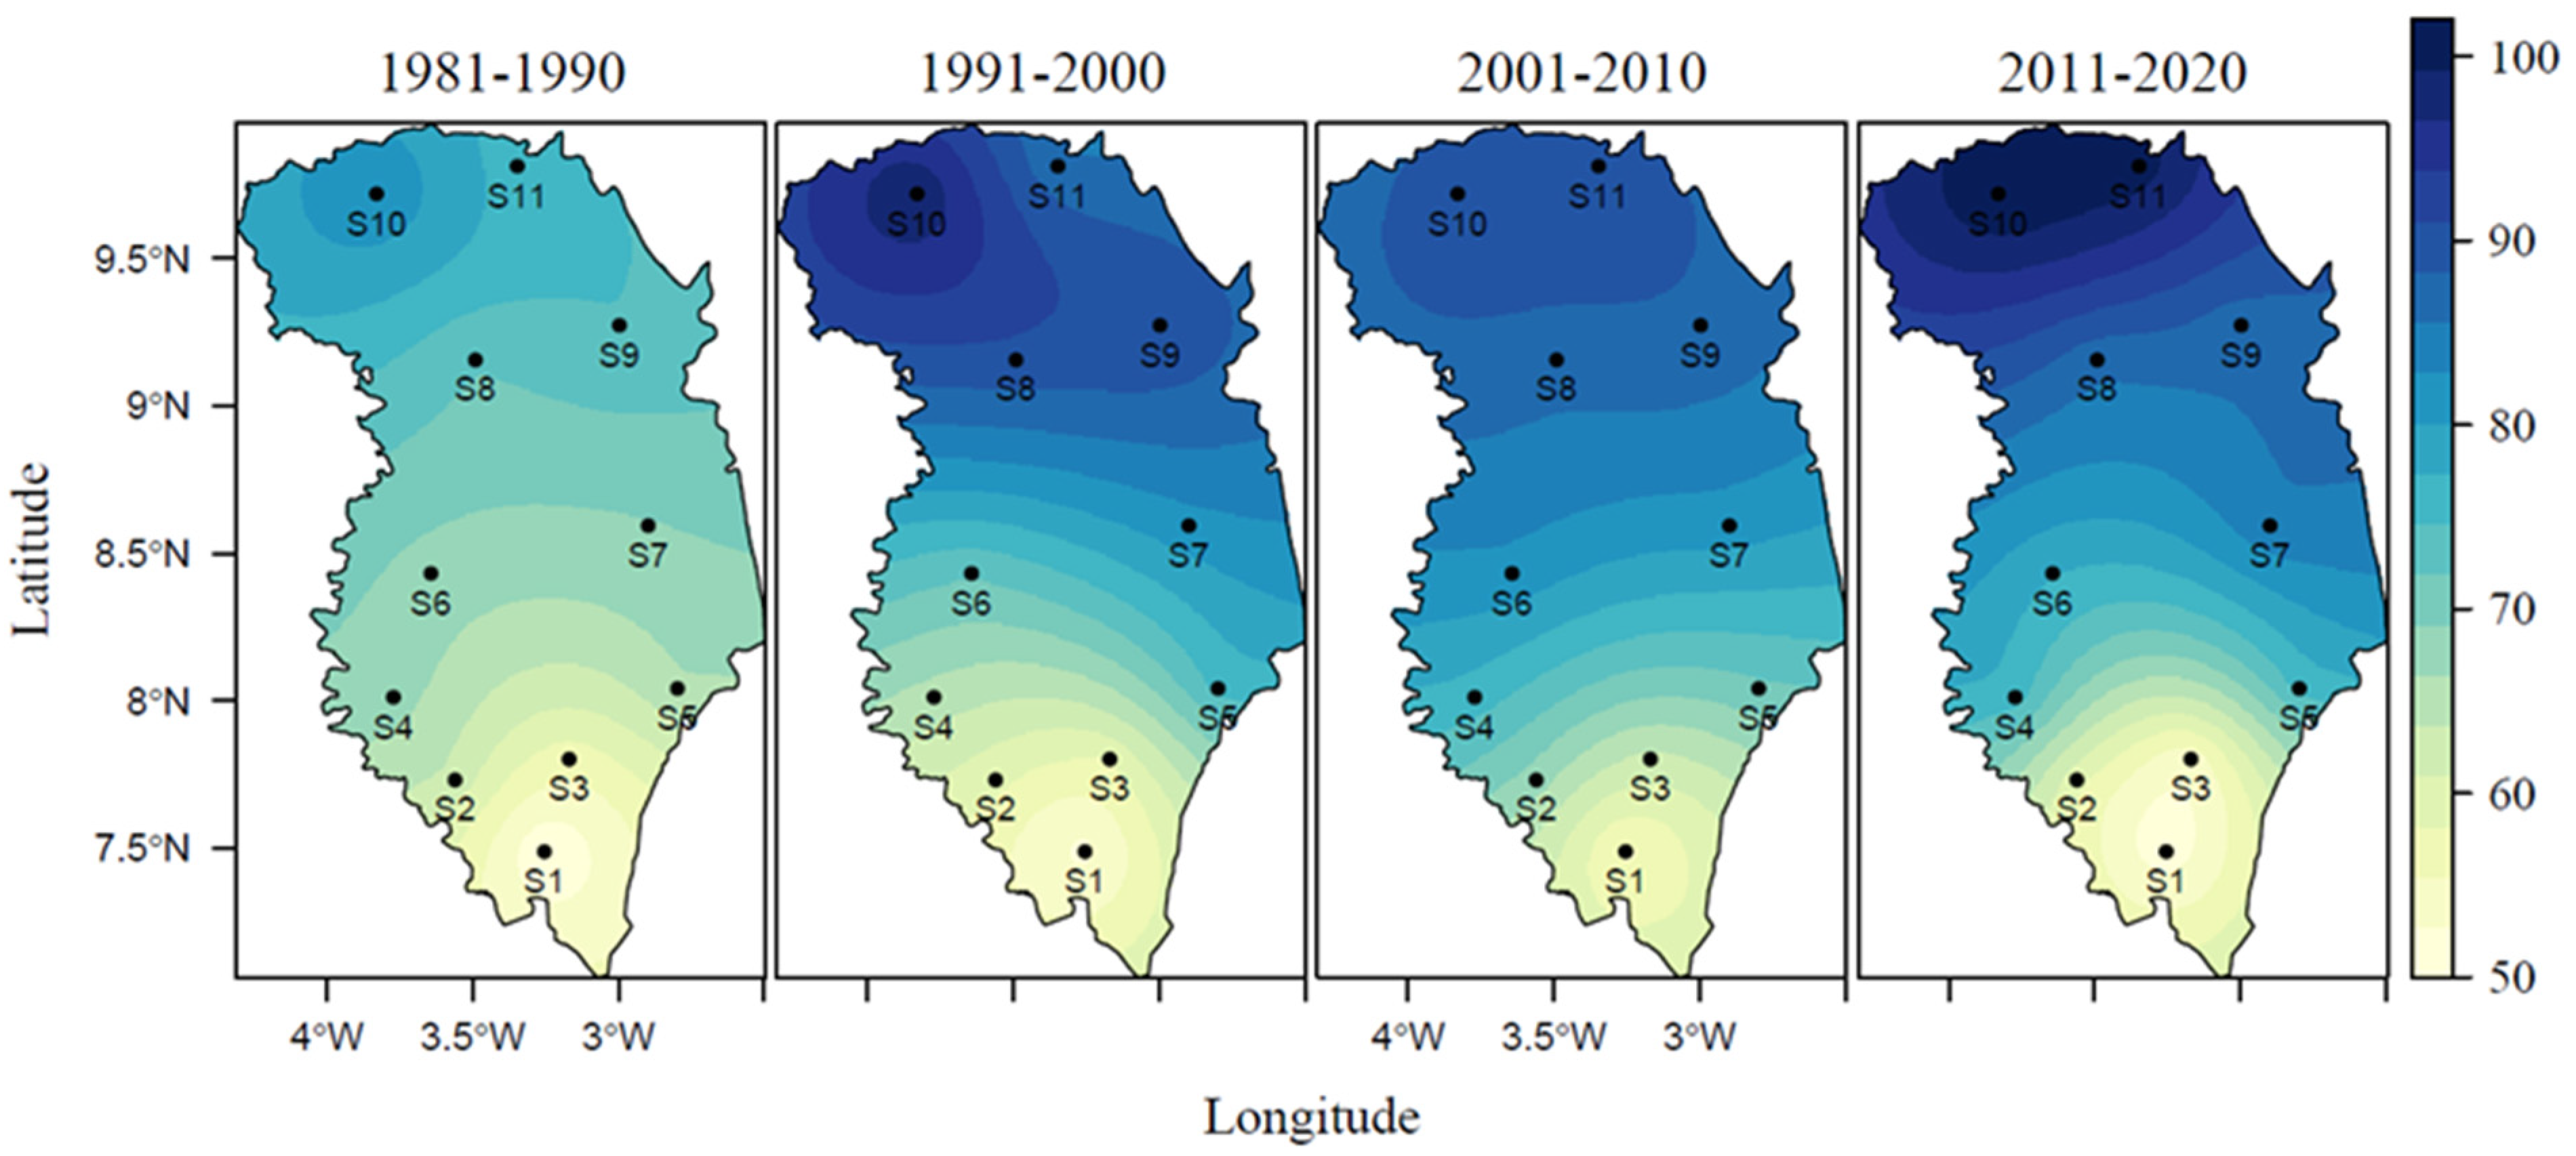
3.1.4. Index of Consecutive Dry Days (CDD)

In the Zanzan region, the trends in the time series of the consecutive dry days’ index assessed using the Mann–Kendall test (Table 4) showed an increase in 10 of the stations tested, except for Koun Fao and Tanda, which showed non-significant declining trends. The almost general upward trend in consecutive dry days in the study area was however non-significant at the 5% significance level for most stations except for the Doropo station, which presented a significant increasing trend. In Doropo the increase was 0.89 days/year, 8.9 days per decade, and 34.71 days over the entire study period. On average, the increase was estimated at 18.67 days over the study period. Figure 5 presents the index of the consecutive dry days’ spatial patterns per decade. Over the 1981–1990 decade, the consecutive dry days were between 50.4 and 82.4 days, and from 1991 to 2000, the index was between 52.1 and 98.8 days, indicating an increase of 16.4 days. Over 2001 and 2010, the variation in consecutive dry days was estimated between 55.1 and 90.6 days, which is a decrease of 8.2 days, and from 2011 to 2020, it was estimated between 51.2 and 102 days, corresponding to an increase of 11.4 days. When comparing the first decade of the study (i.e., 1981–1990), to the last decade (i.e., 2011–2020), there was an increase of 19.6 consecutive dry days. The high values of the index were found in the northern part of the study area, in places such as Doropo, Téhini, and Bouna, and the lowest values were found in the southern part of the Zanzan region, such as Tanda and Koun Fao.

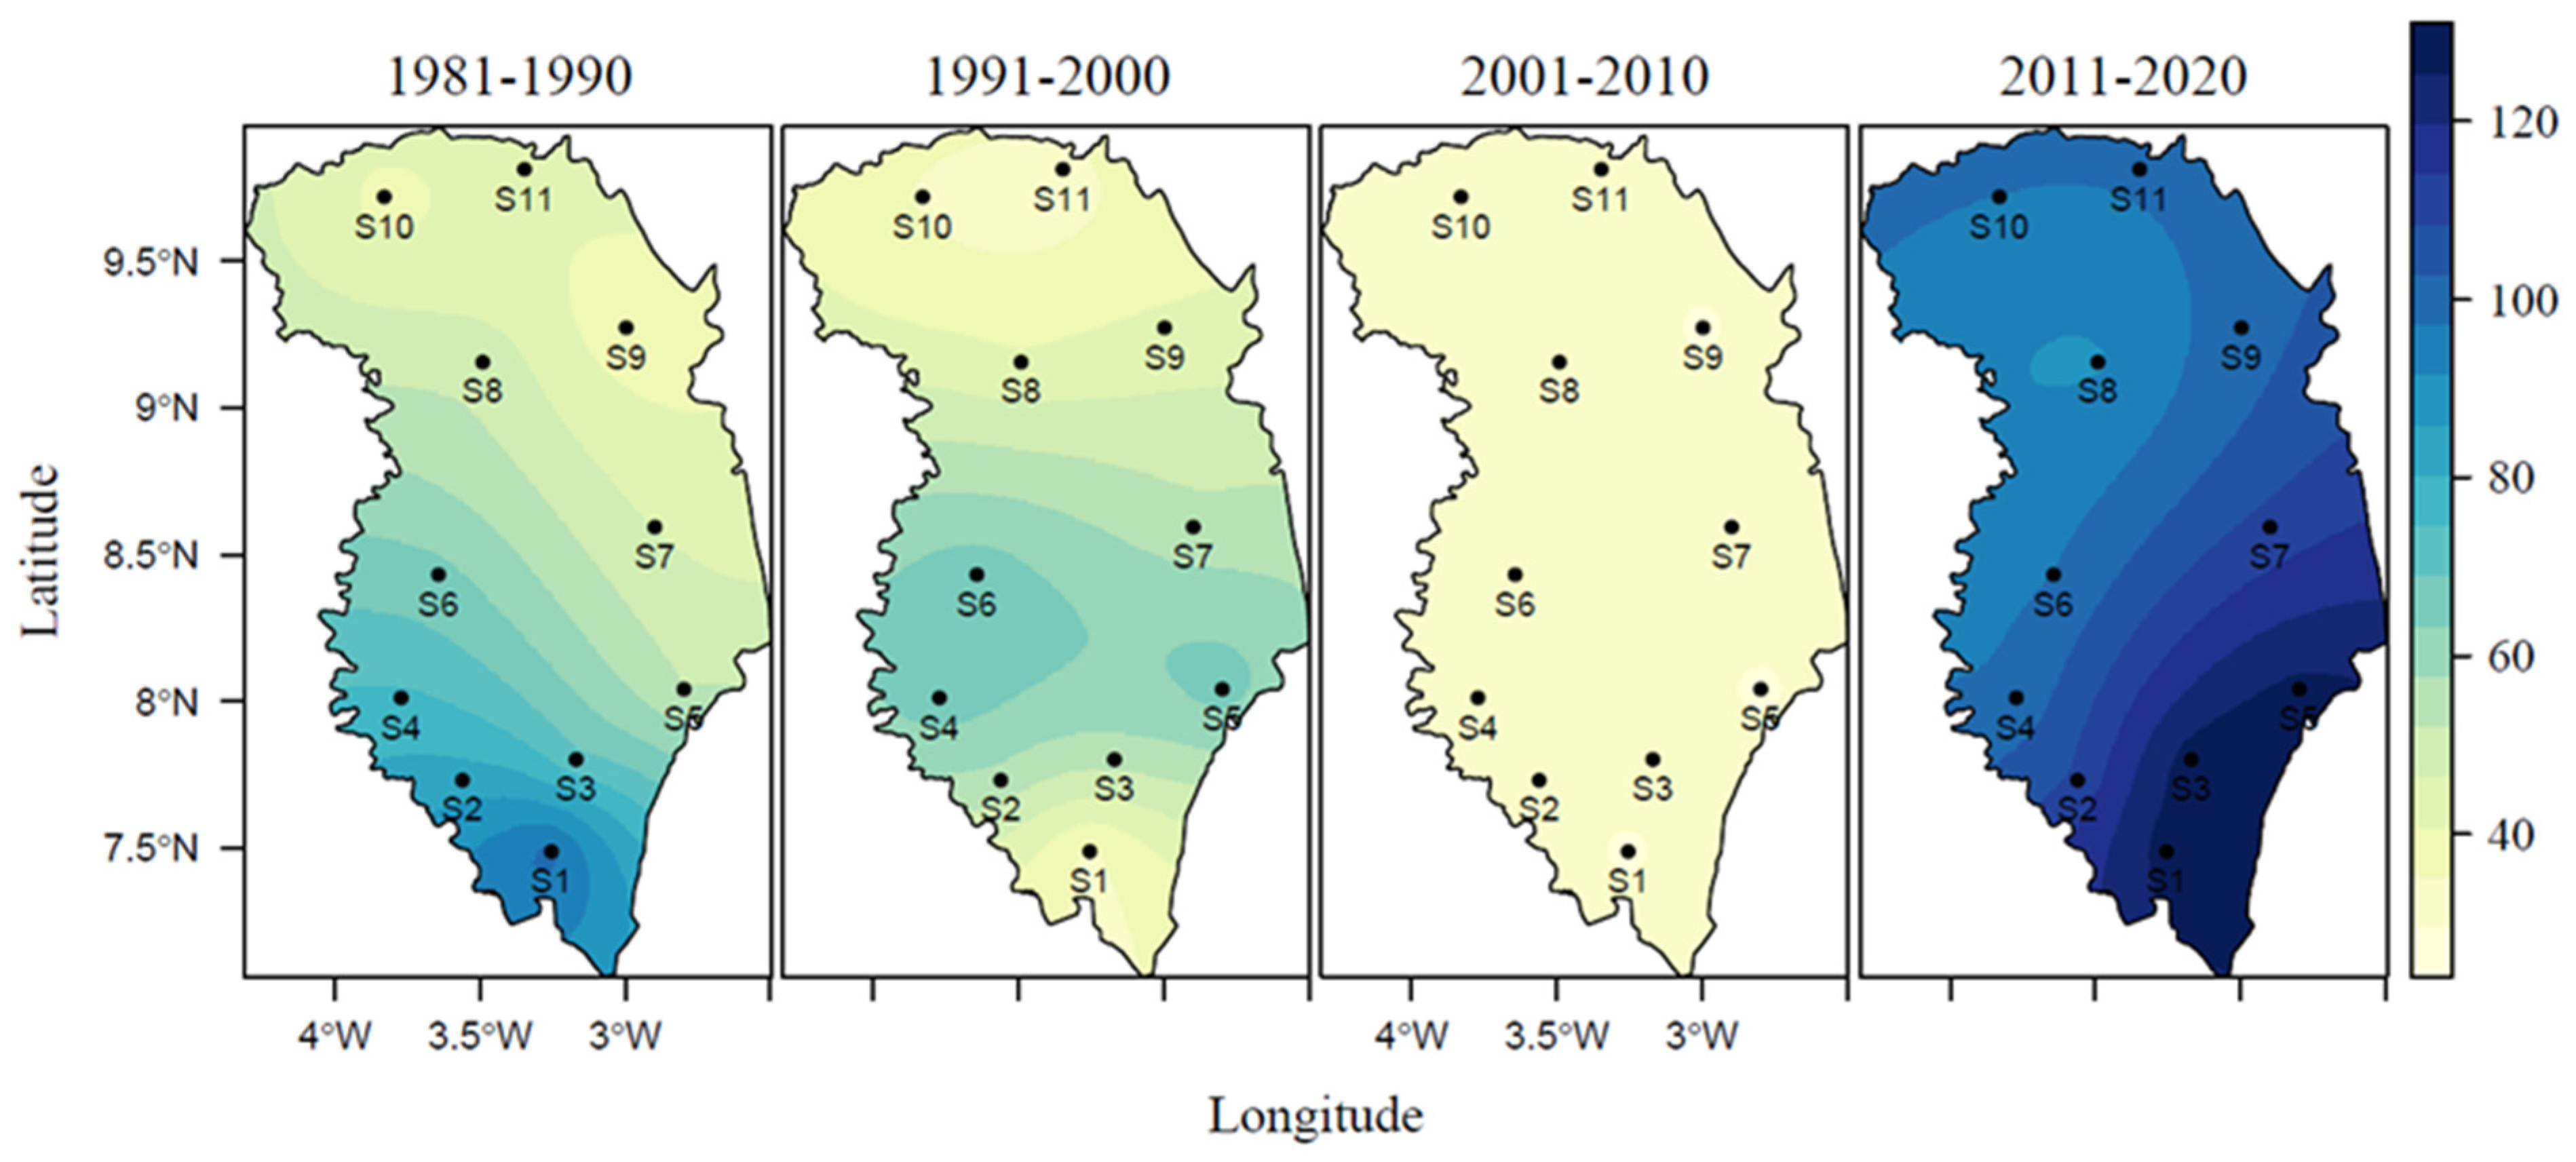
3.1.5. Index of Total Annual Precipitations from Very Heavy Rain Days (R99p)

Table 4 shows the findings of the Mann–Kendall statistical test, which demonstrated a general trend in the Zanzan region of increasing total yearly precipitation from very heavy rain days. At any of the sites studied, the general rise was non-significance at the 5% threshold of significance. Over the study period, the strong increases were estimated at 23.79 mm in Téhini, 10.14 mm in Bondoukou, and 8.97 mm in Tanda. Over the entire research area, the overall average was estimated at 4.61 mm. Figure 6 illustrates the spatial distribution of the total annual precipitations from very heavy rain days. Over the 1981–1990 decade, the evolution of extreme rainy days ranged from 37.4 to 98.5 mm, and from 1991 to 2000, it ranged from 34.1 to 66.9 mm, which represents a decrease of 31.6 mm. From 2001 to 2010 the index varied between 26.4 and 37.4 mm, for a decrease of 29.5 mm, and from 2011 to 2020 the variation was between 91.1 and 130 mm for an increase of 92.6 mm. Compared to the decades of 1991–2000 and 2001–2010, the last decade of the study witnessed a return to a significant quantity of extreme rainy days. These extremely wet days were more pronounced in the south of the Zanzan region across the study decades. The highest daily water intakes relative to the 99th percentile threshold are total annual precipitations from very heavy rain days (R99p).

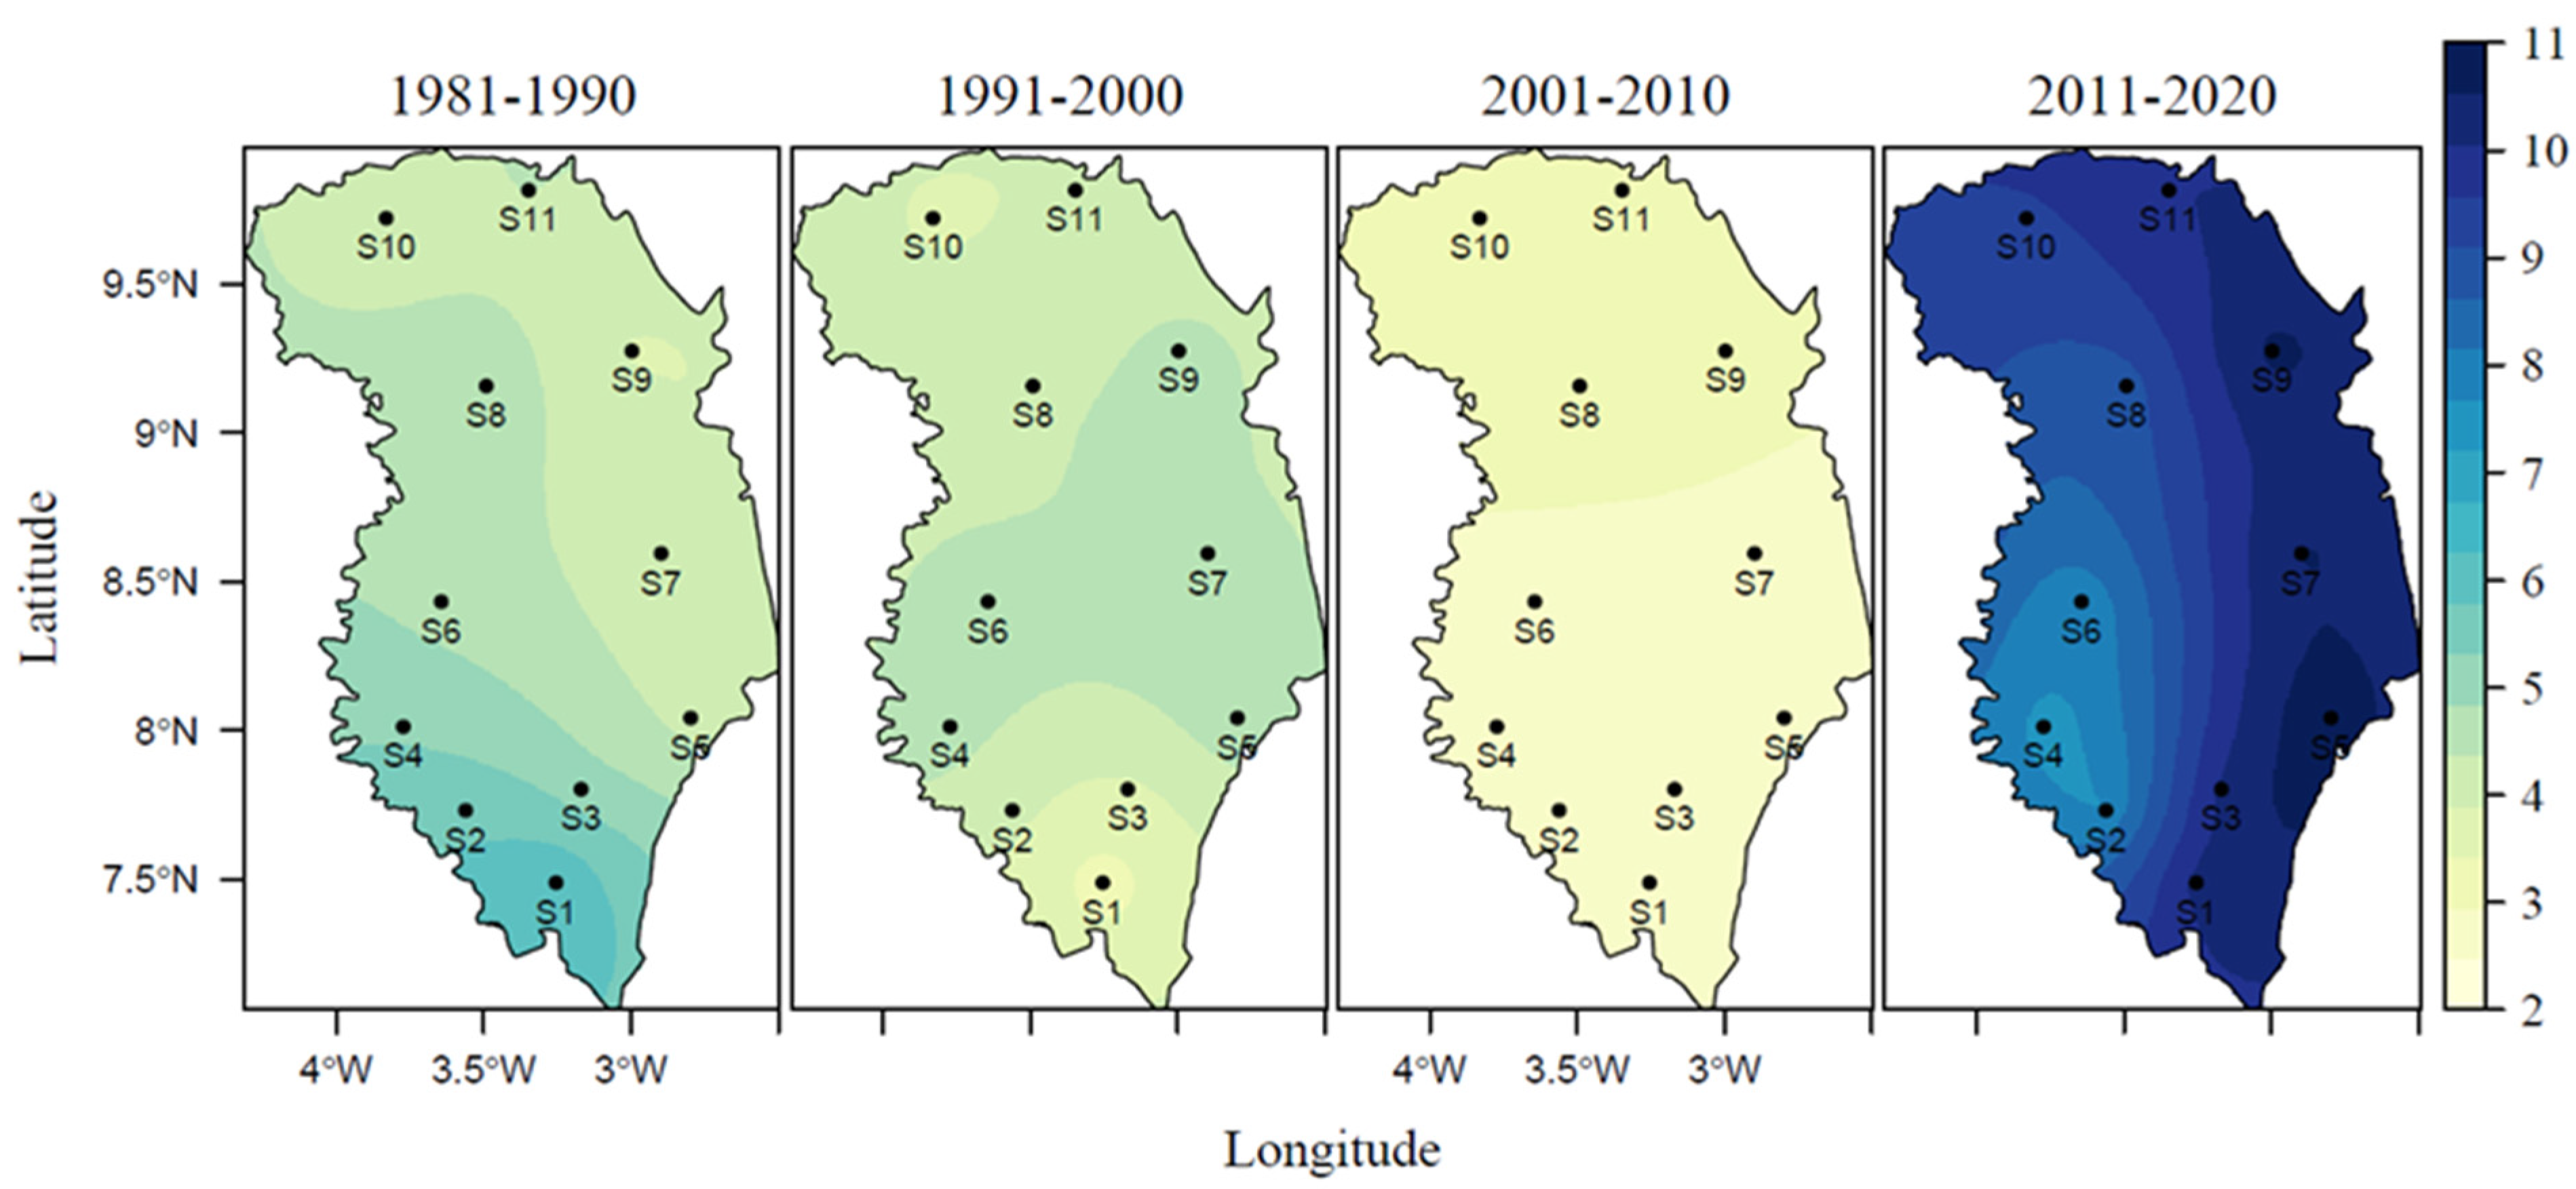
3.1.6. Contribution of Extremely Wet Days (R99pTOT)

The contribution of extremely wet days analyzed using the Mann–Kendall test displays a general increasing trend that was non-significant at the 5% level of significance over the entire study area. The most significant increases were in the locality of Téhini estimated at 3.12%, Bondoukou estimated at 1.95% and Tanda estimated at 1.95% of days. On average, this increase was estimated at 1.41% of days from 1981 to 2020 for the entire region. The spatial distribution per decade of the contribution of extremely wet days illustrated in Figure 7 indicates a variation between 3.87% and 6.18% from 1981 to 1990, and from 1991 to 2000 the contribution was between 3.25% and 4.65%, hence a decrease of 1.53%. During the period 2001–2010, these values were between 2.82% and 3.09%, corresponding to a decrease of 1.56%, and from 2011 to 2020, the contribution of extremely wet days was between 7.58% and 10.08%, representing an increase of 6.99%. The last decade thus witnessed an important contribution of extremely wet days located in the east of the study area.

3.2. Analysis of the Spatio-Temporal Evolution of Extreme Temperature Trends in the Zanzan Region

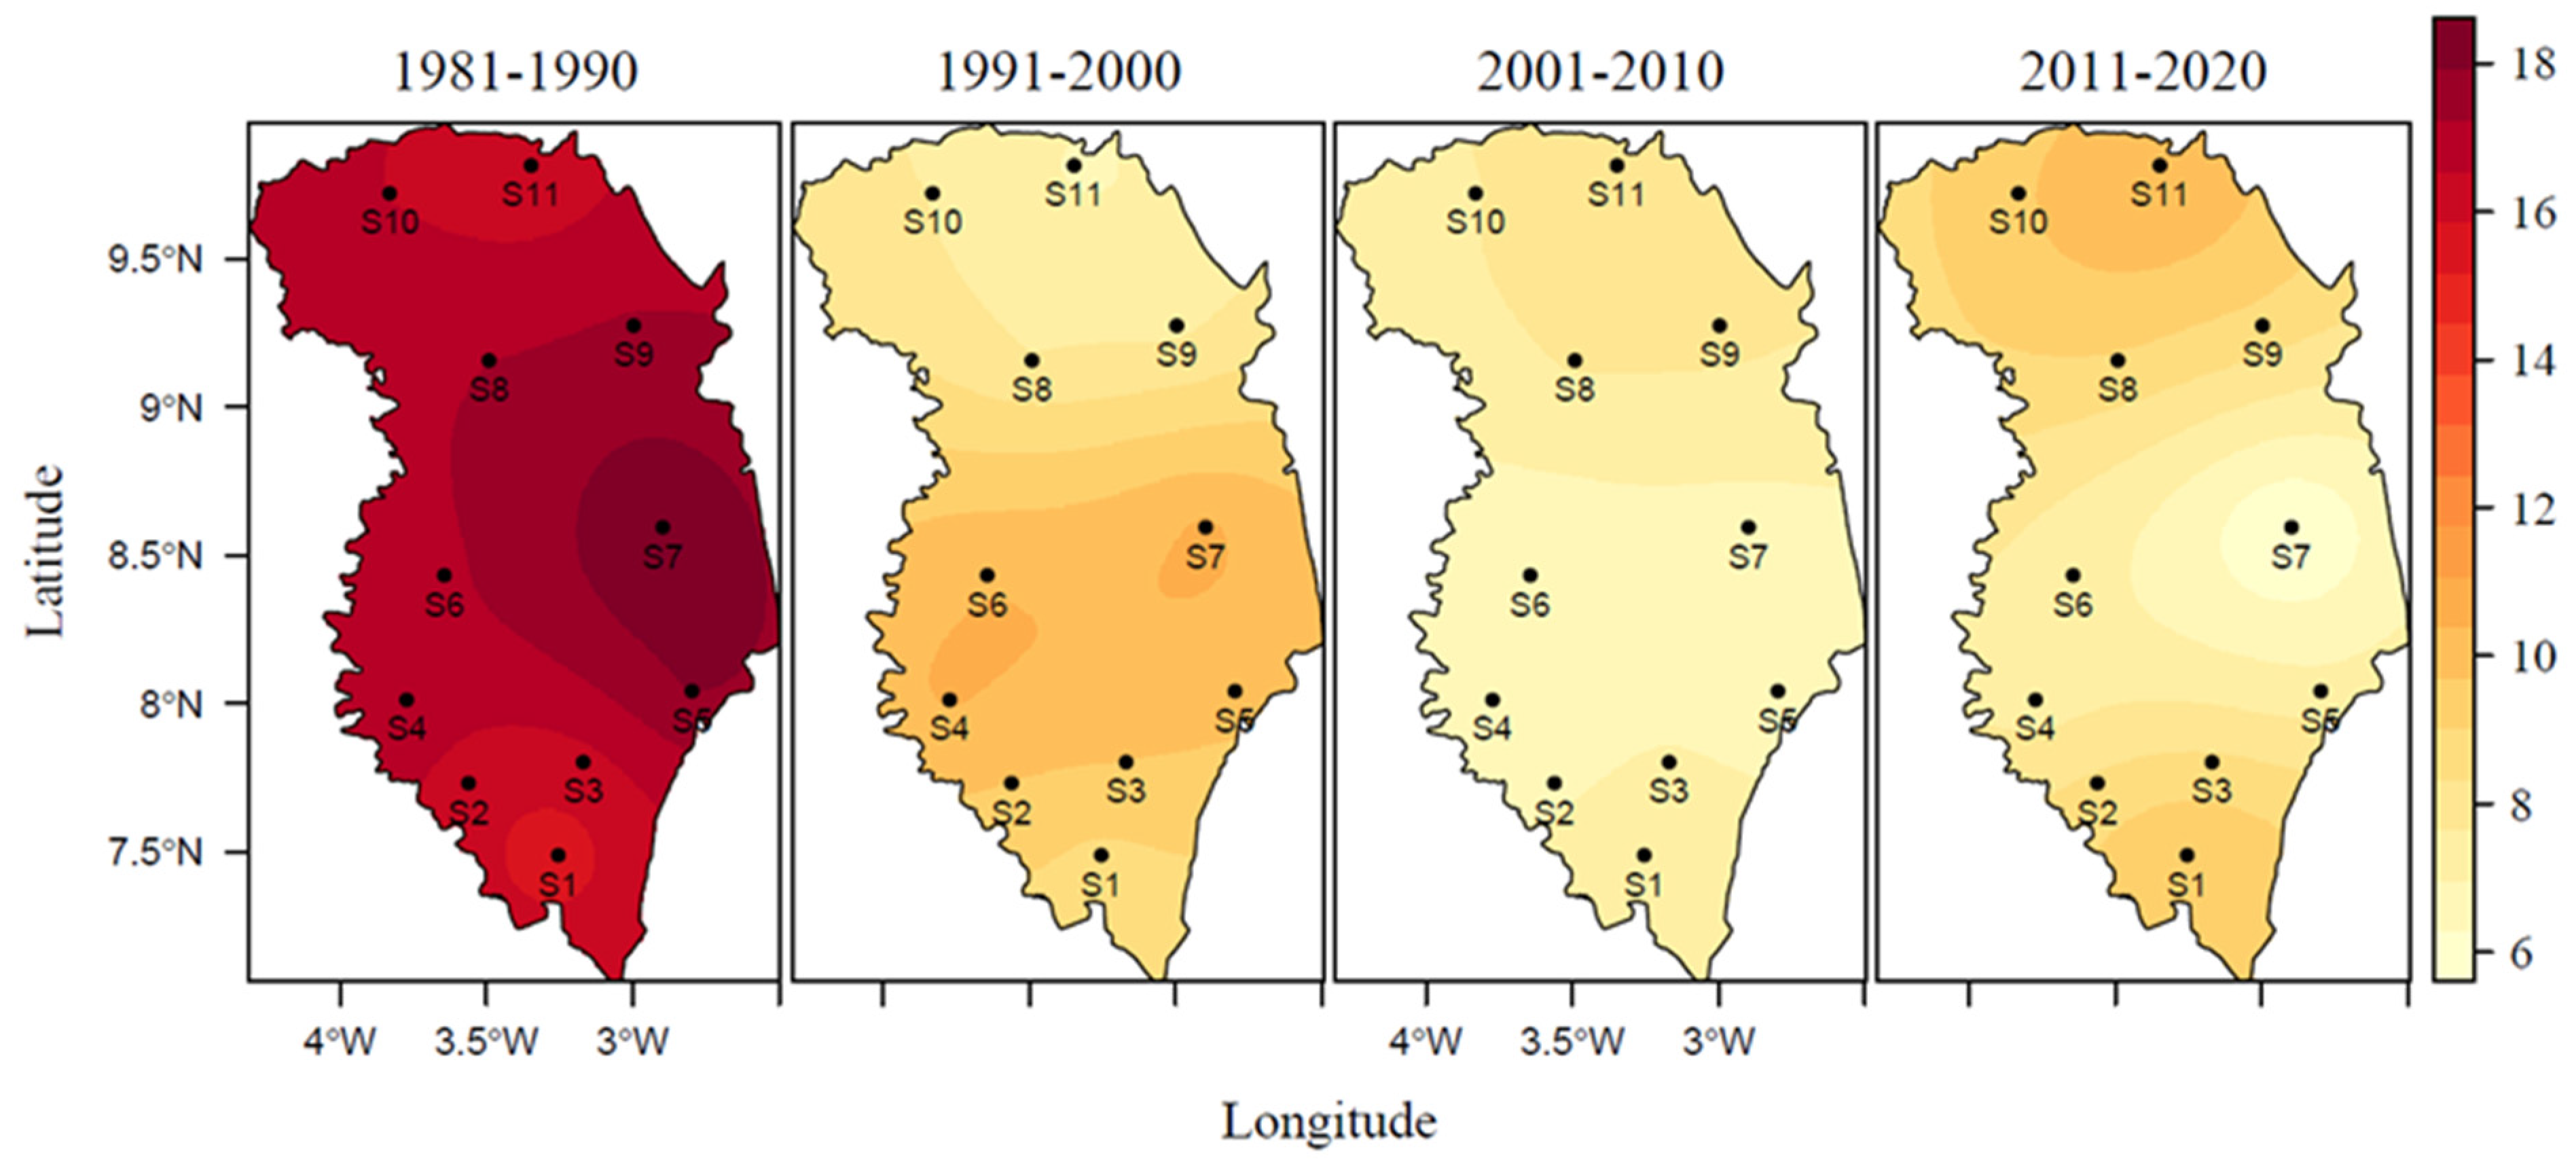
3.2.1. Evolution of the Index of the Number of Cool Days (TX10p)

The Mann–Kendall statistical test and the Sen slope of all the indices of temperature extremes assessed for the 12 study sites are shown in Table 5. The analysis of the number of cool days indicates a general declining trend in the Zanzan region for all the stations studied. Within the general declining trend, eight of the studied stations showed significant trends at the level of 5%. The values of these declines over the 1981–2020 study period for the localities were estimated at 14.54% for Sapli, 9.98% for Bondoukou, 9.08% for Sandegué, 8.85% for Nassian, and 5.96% of days for Tanda sites. Generally, the average decline in the study area was 6.58% of days. To better appreciate this decreasing trend, Figure 8 illustrates the spatial distribution of the number of cool days per decade. From 1981 to 2020, the number of cool days was between 5.61% and 18.53% of days. In the first decade (i.e., 1981 to 1990), the number was between 15.57% and 18.53% and from 1991 to 2000 the values were between 6.92% and 10.51%, which means a decrease of 8.02%. Over the decade 2001 to 2010, the number of cool days ranged between 6.68% and 8.25%, representing a decrease of 2.26% compared to the previous decade. From 2011 to 2020 the number of days varied between 5.61% and 10.35%, corresponding to an increase of 2.1%. Compared to the last two decades, the decade 2011–2020 showed a slight return of cool days, but less than the number of cool days in the decade 1981–1990. The analysis of Figure 8 revealed that the high percentages of cool days in the decades 1981–1990 and 1991–2000 were concentrated in the center of the Zanzan region, but in the decades 2001–2010 and 2011–2020, they were concentrated in the study area’s northern and southern parts.

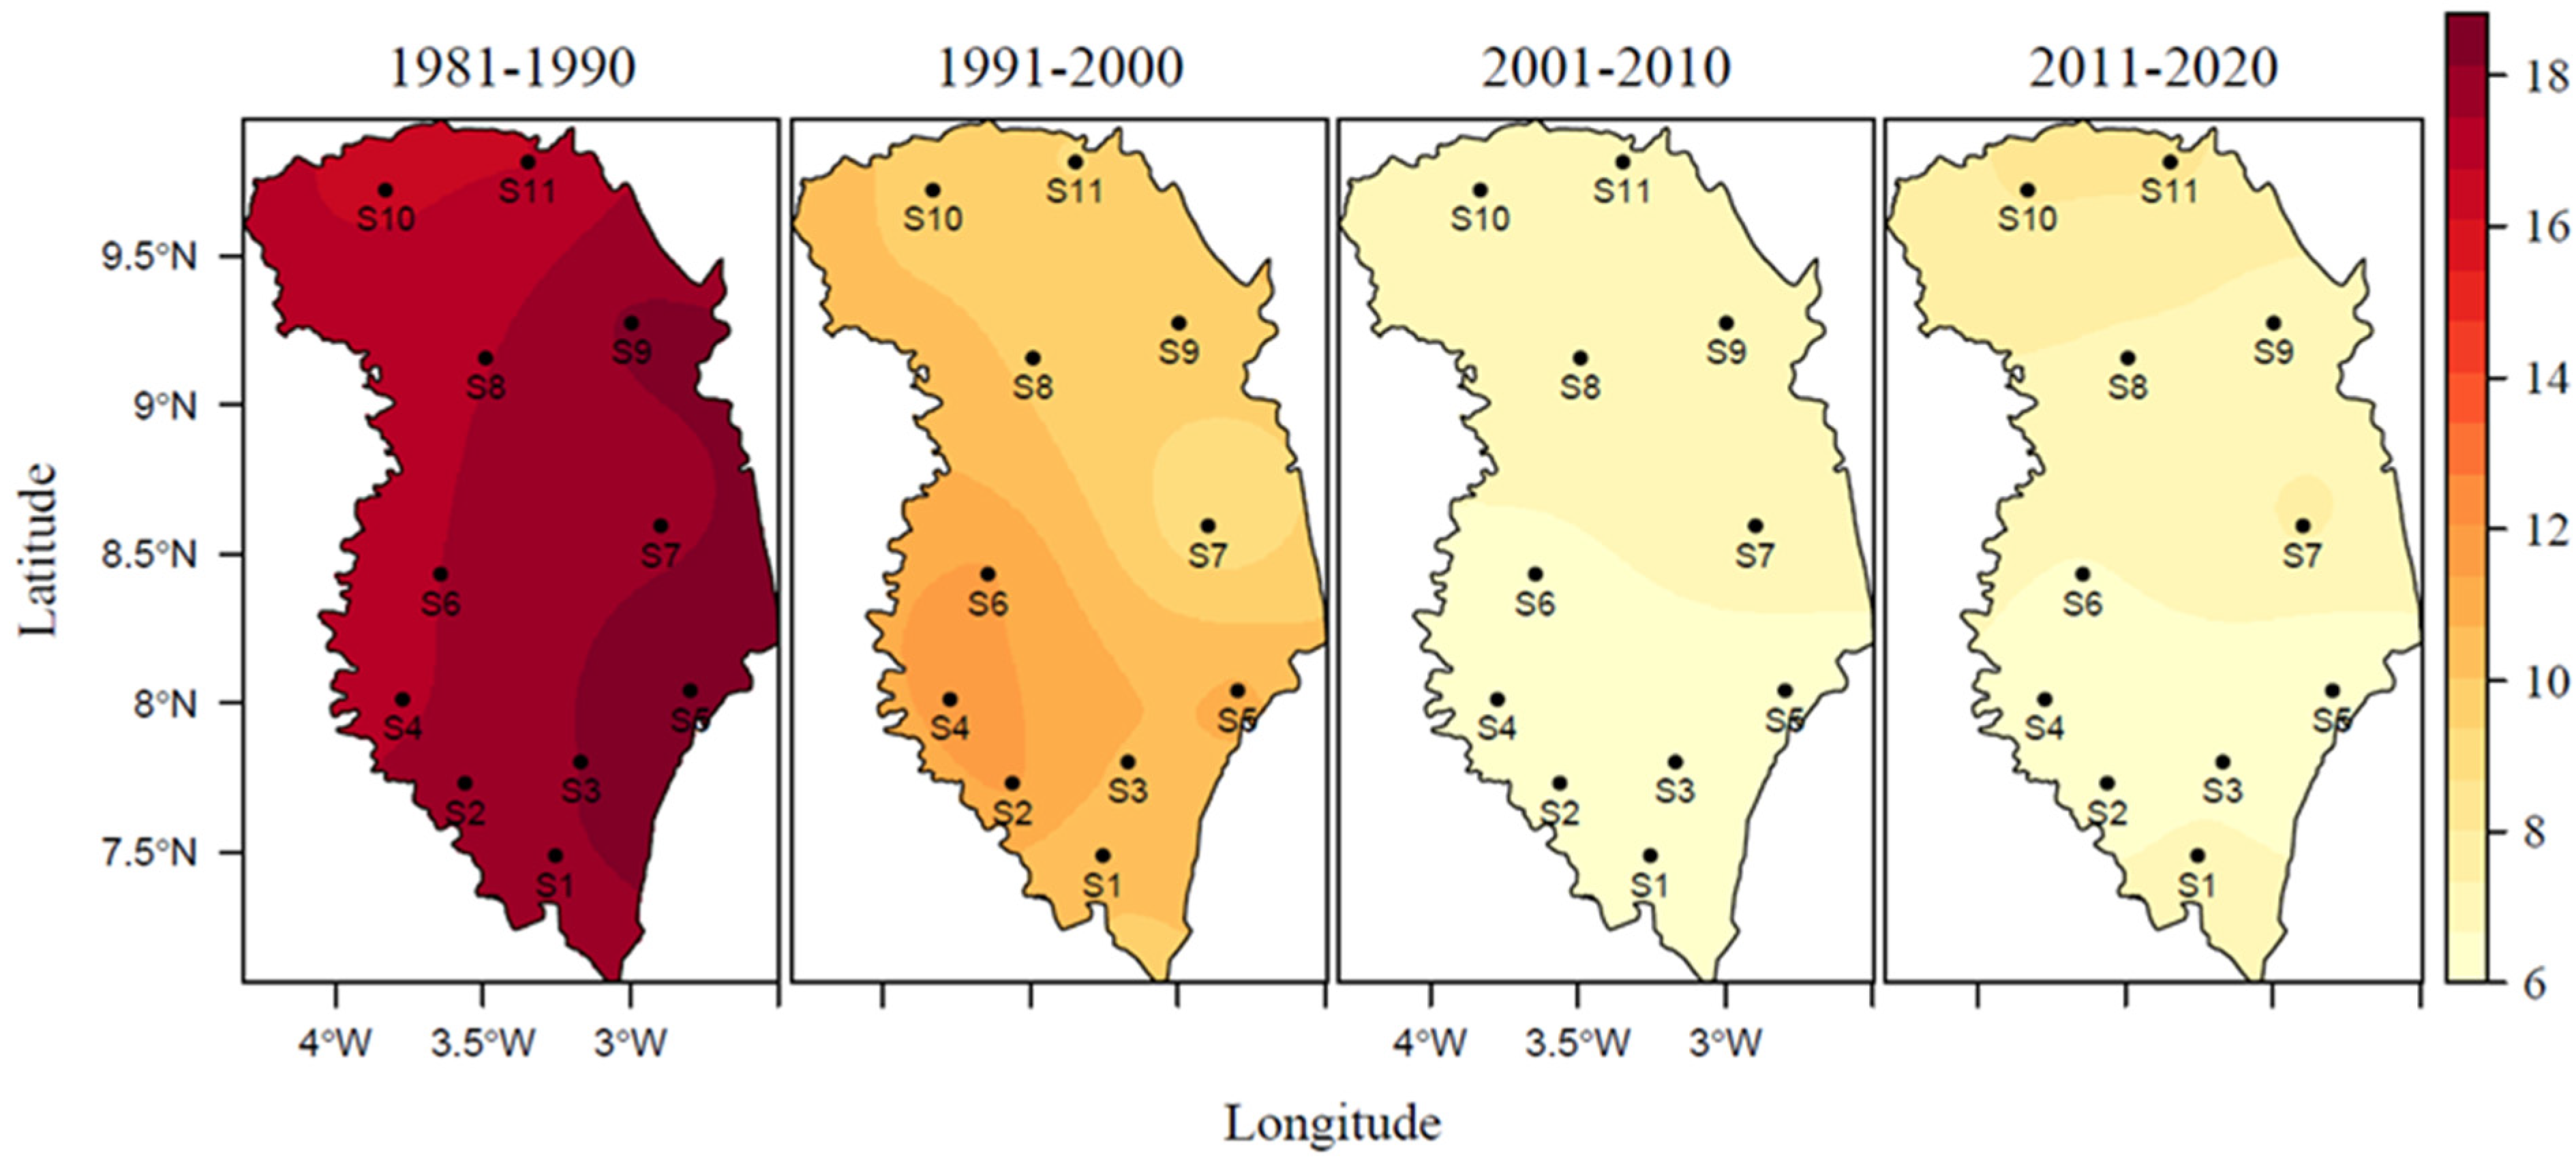
3.2.2. Changes in the Index of the Number of Cold Nights (TN10p)

The Mann–Kendall test of trends in the index of the number of cold nights (Table 5) showed a general declining trend across all stations in the research area, which was significant at the 5% statistical significance. Over the research period from 1981 to 2020, the decline in the number of cold nights in the Zanzan region was estimated at an average of 11.83% of nights. The strongest decreases of cold nights were observed in Bondoukou (14.23%), Nassian (12.36%), Sandegué (12.48%), and Tanda (12.55%). Figure 9 shows the spatial distribution of the index per decade. From 1981 to 1990, the number of cold nights in the Zanzan region varied between 16.69% and 18.73%, and over the decade 1991–2000, the variation was between 8.79% and 11.52%, which represents a decrease of 7.21% of cold nights. From 2001 to 2010 the values of the index were between 6.18% and 7.18%, meaning a decrease of 4.34% and from 2011 to 2020, the variation was between 6.04% and 8.18%, indicating an insignificant increase of 0.99% of cold nights. From 1981 to 1990 and 1991 to 2000, the highest percentages of cold nights in the Zanzan region were recorded in the southeast and southwest of the region, respectively. From 2001 to 2010 and from 2011 to 2020, high percentages were seen in the northern part of Zanzan region.

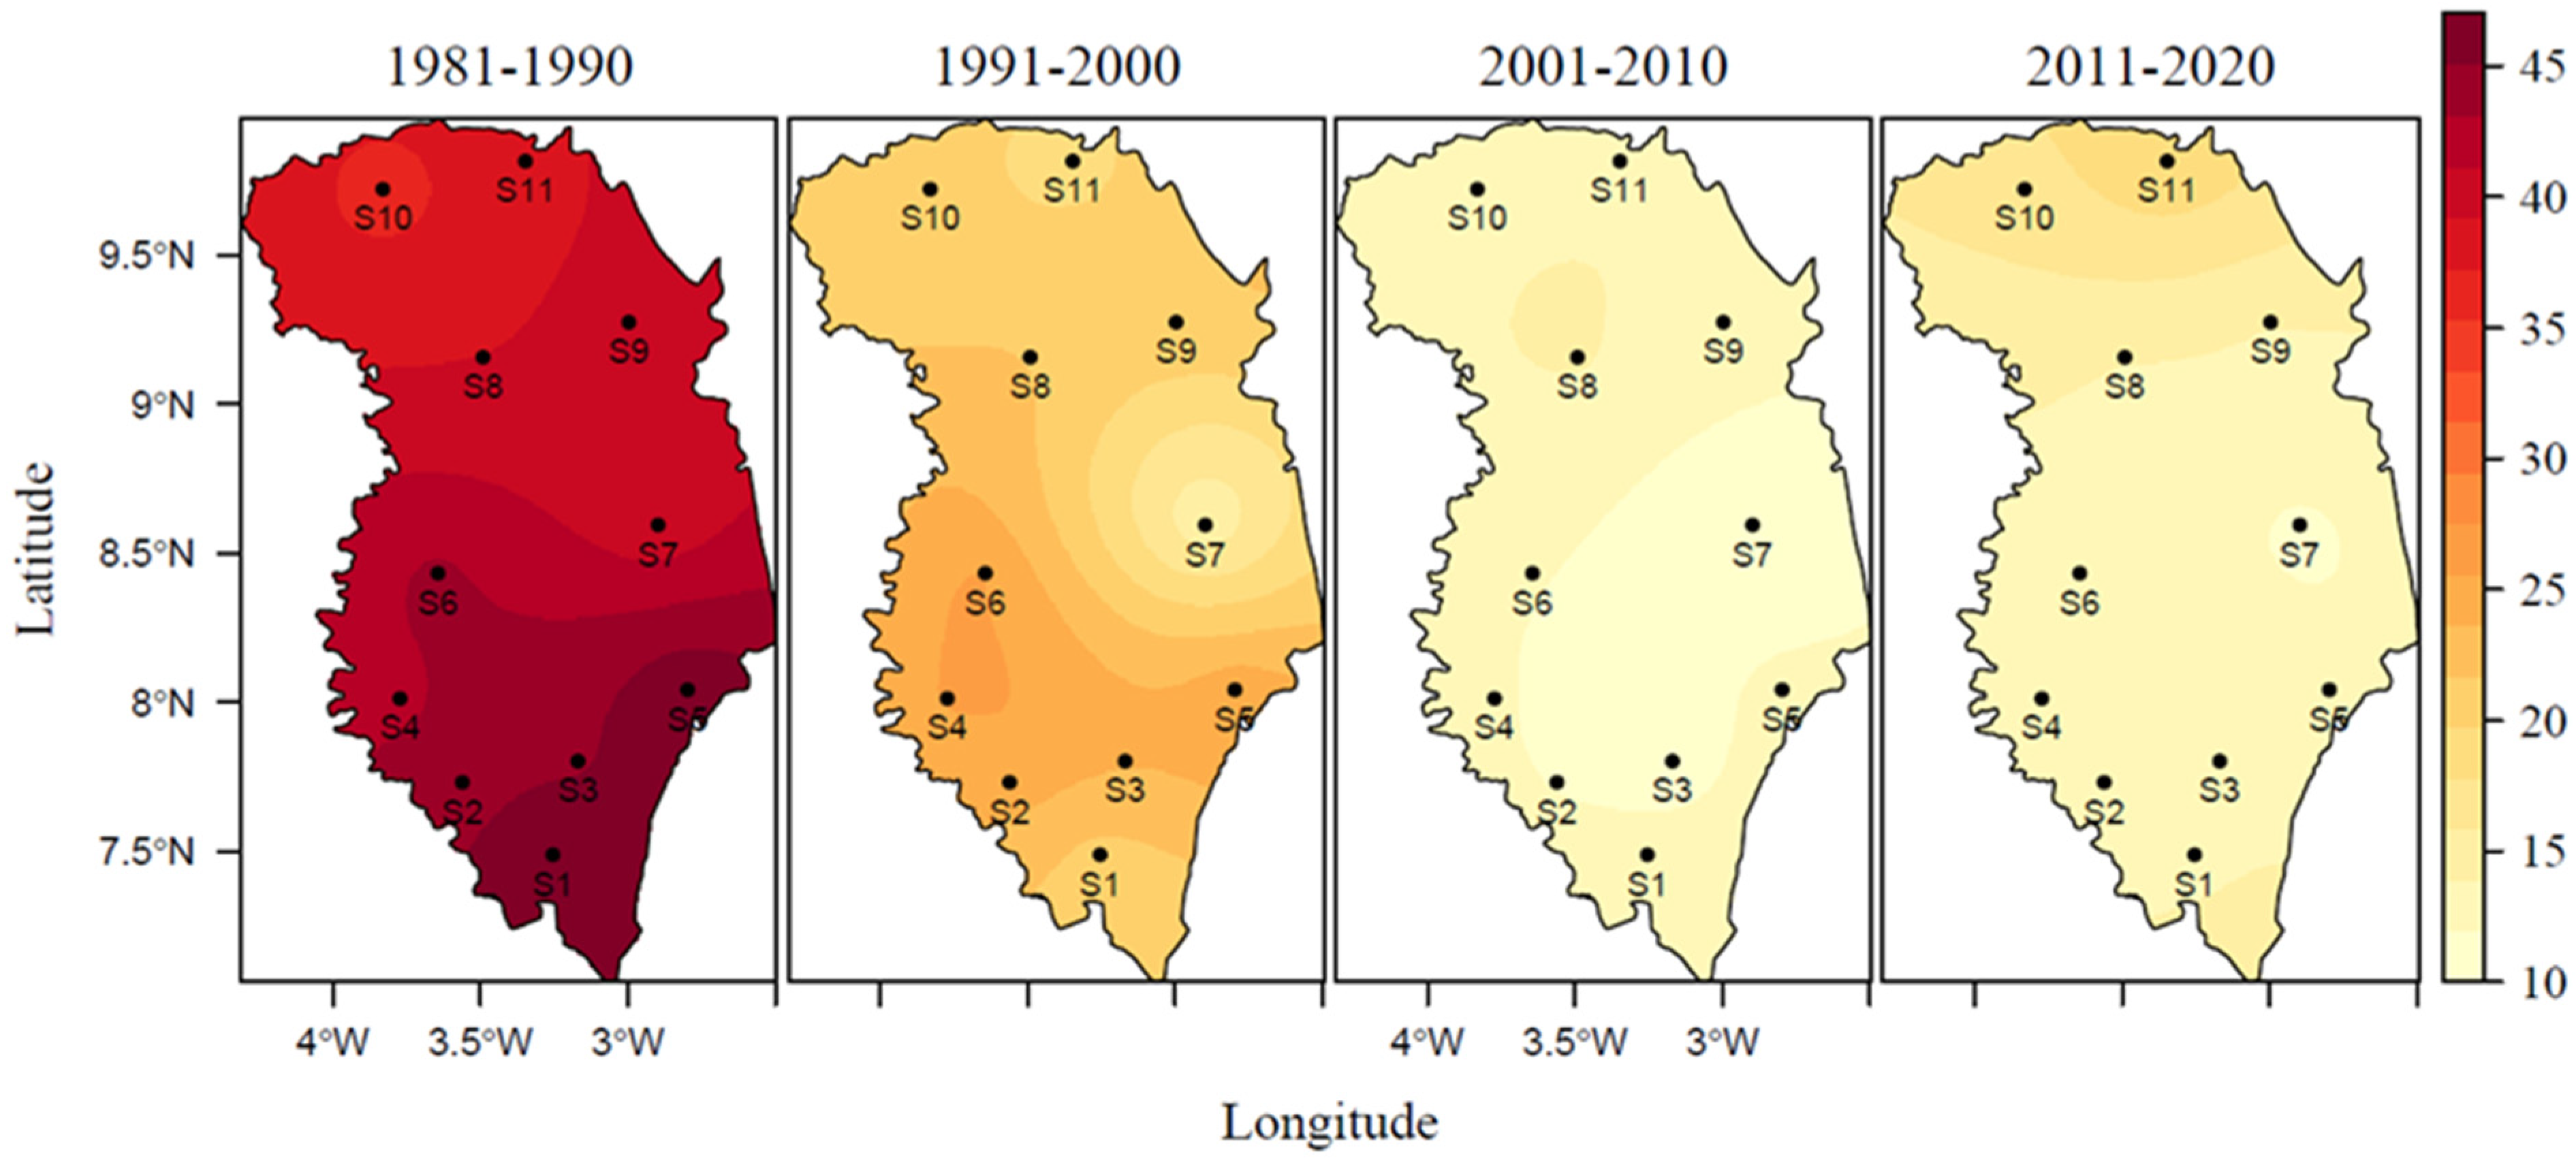
3.2.3. Evolution of the Index of Cold Spell Duration Indicator (CSDI)

The Mann–Kendall test demonstrated a general declining trend in the index of cold spell duration indicator (Table 5) for the entire research area. At the 5% significance level, the general decreasing trends were significant at all study sites. Over the research period of 1981–2020, the largest significant declines were in Bondoukou estimated at 39 days, Kouassi-datékro estimated at 30.57 days, Nassian estimated at 29.99 days, and Sandegué estimated at 29.95 days. On average, this decline was estimated at 26.15 days from 1981 to 2020 for the entire region. The spatial distribution per decade of the cold spell duration indicator shown in Figure 10 indicates that from 1981 to 1990, the variation was between 36.65 and 46.97 days, and from 1991 to 2000 the variation was between 14.43 and 25.8 days, representing a decrease of 21.17 days. During the period 2001 to 2010, the values were between 10.21 and 14.1 days, which was a decrease of 11.7 days, and from 2011 to 2020, the variations were between 11.8 and 19.59 days, implying an increase of 5.49 days. In comparison with the preceding two decades, the cold spell duration indicator in the north of the region under consideration has made a slight return in the last decade.

3.2.4. Changes in the Number of Hot Days’ Index (TX90p)

Table 5 and Figure 11 give the outputs of the Mann–Kendall statistical test and the spatial distribution of the number of hot days’ index in the Zanzan region, respectively. In all of the stations within the research area, the statistical analysis provides an overall increase in the number of hot days, and two of these stations show significant increasing trends at the 5% significance level. Over the study period of 1981–2020, the significant increases were estimated at 13.18% of days at Sapli, and 7.44% of days at Sandegué. The overall average increasing trend was 5.19% of days across the entire research area. The spatial distribution of the number of hot days per decade showed a variation from 5.74% to 9.11% over the period of 1981–1990, and from 1991 to 2000, the index varied from 8.07% to 12.3%, which represents an increase of 3.19% of days. The highest index values over the last two decades have been observed in the northern and southern parts of the study area. From 2001 to 2010 the variation of the index was estimated between 12.2% and 15.4%, meaning an increase of 3.1% and from 2011 to 2020, the variation was between 6.72% and 14.5%, meaning a small decrease of 0.9% of days. The decade 2001–2010 appears to be the hottest in the spatial analysis of the number of relatively hot days, and this significant heating was more pronounced in the south-western part of the Zanzan region.

3.2.5. Evolution of the Index of the Number of Warm Nights (TN90p)

The trends in the temporal series of the index of the number of warm nights analyzed through the Mann–Kendall test (Table 5) in the Zanzan region revealed a general increase over all the stations studied. Except for the Sapli station, which indicated a non-significant rising trend, the general rising trend in the number of warm nights in the study region was significant at the 5% level of statistical significance for 11 of the study stations. Geographically over the study period, these increases were estimated at 14.89% in Bondoukou, 14.27% in Sandegué, 13.68% in Nassian, and 13.80% of nights in Tanda. On average in the study area, this increase was estimated at 11.50% of nights. The spatial distribution of the warm nights’ index per decade is presented in Figure 12. Over the decade 1981–1990, the number of warm nights was between 4.84% and 7.77% and from 1991 to 2000 it varied between 8.1% and 10.25%, which is an increase of 2.48%. From 2001 to 2010, the variation in the number of warm nights was estimated between 11.19% and 14.73%, representing an increase of 4.48%, and from 2011 to 2020, the variation was between 10.44% and 14.56%, indicating a small decrease of 0.17% in warm nights. The comparison between the first decade of this study (i.e., 1981–1990) and the last decade (i.e., 2011–2020) indicated an increase in the number of warm nights by 5.39%. For the first two decades of the study period, the highest values of the index were found in the north of the area under study, in places such as Doropo, Téhini, and Bouna. For the decades of 2001–2010 and 2011–2020, the high values were found in the southeast and southwest of the Zanzan region respectively in locations such as Tanda and Bondoukou.

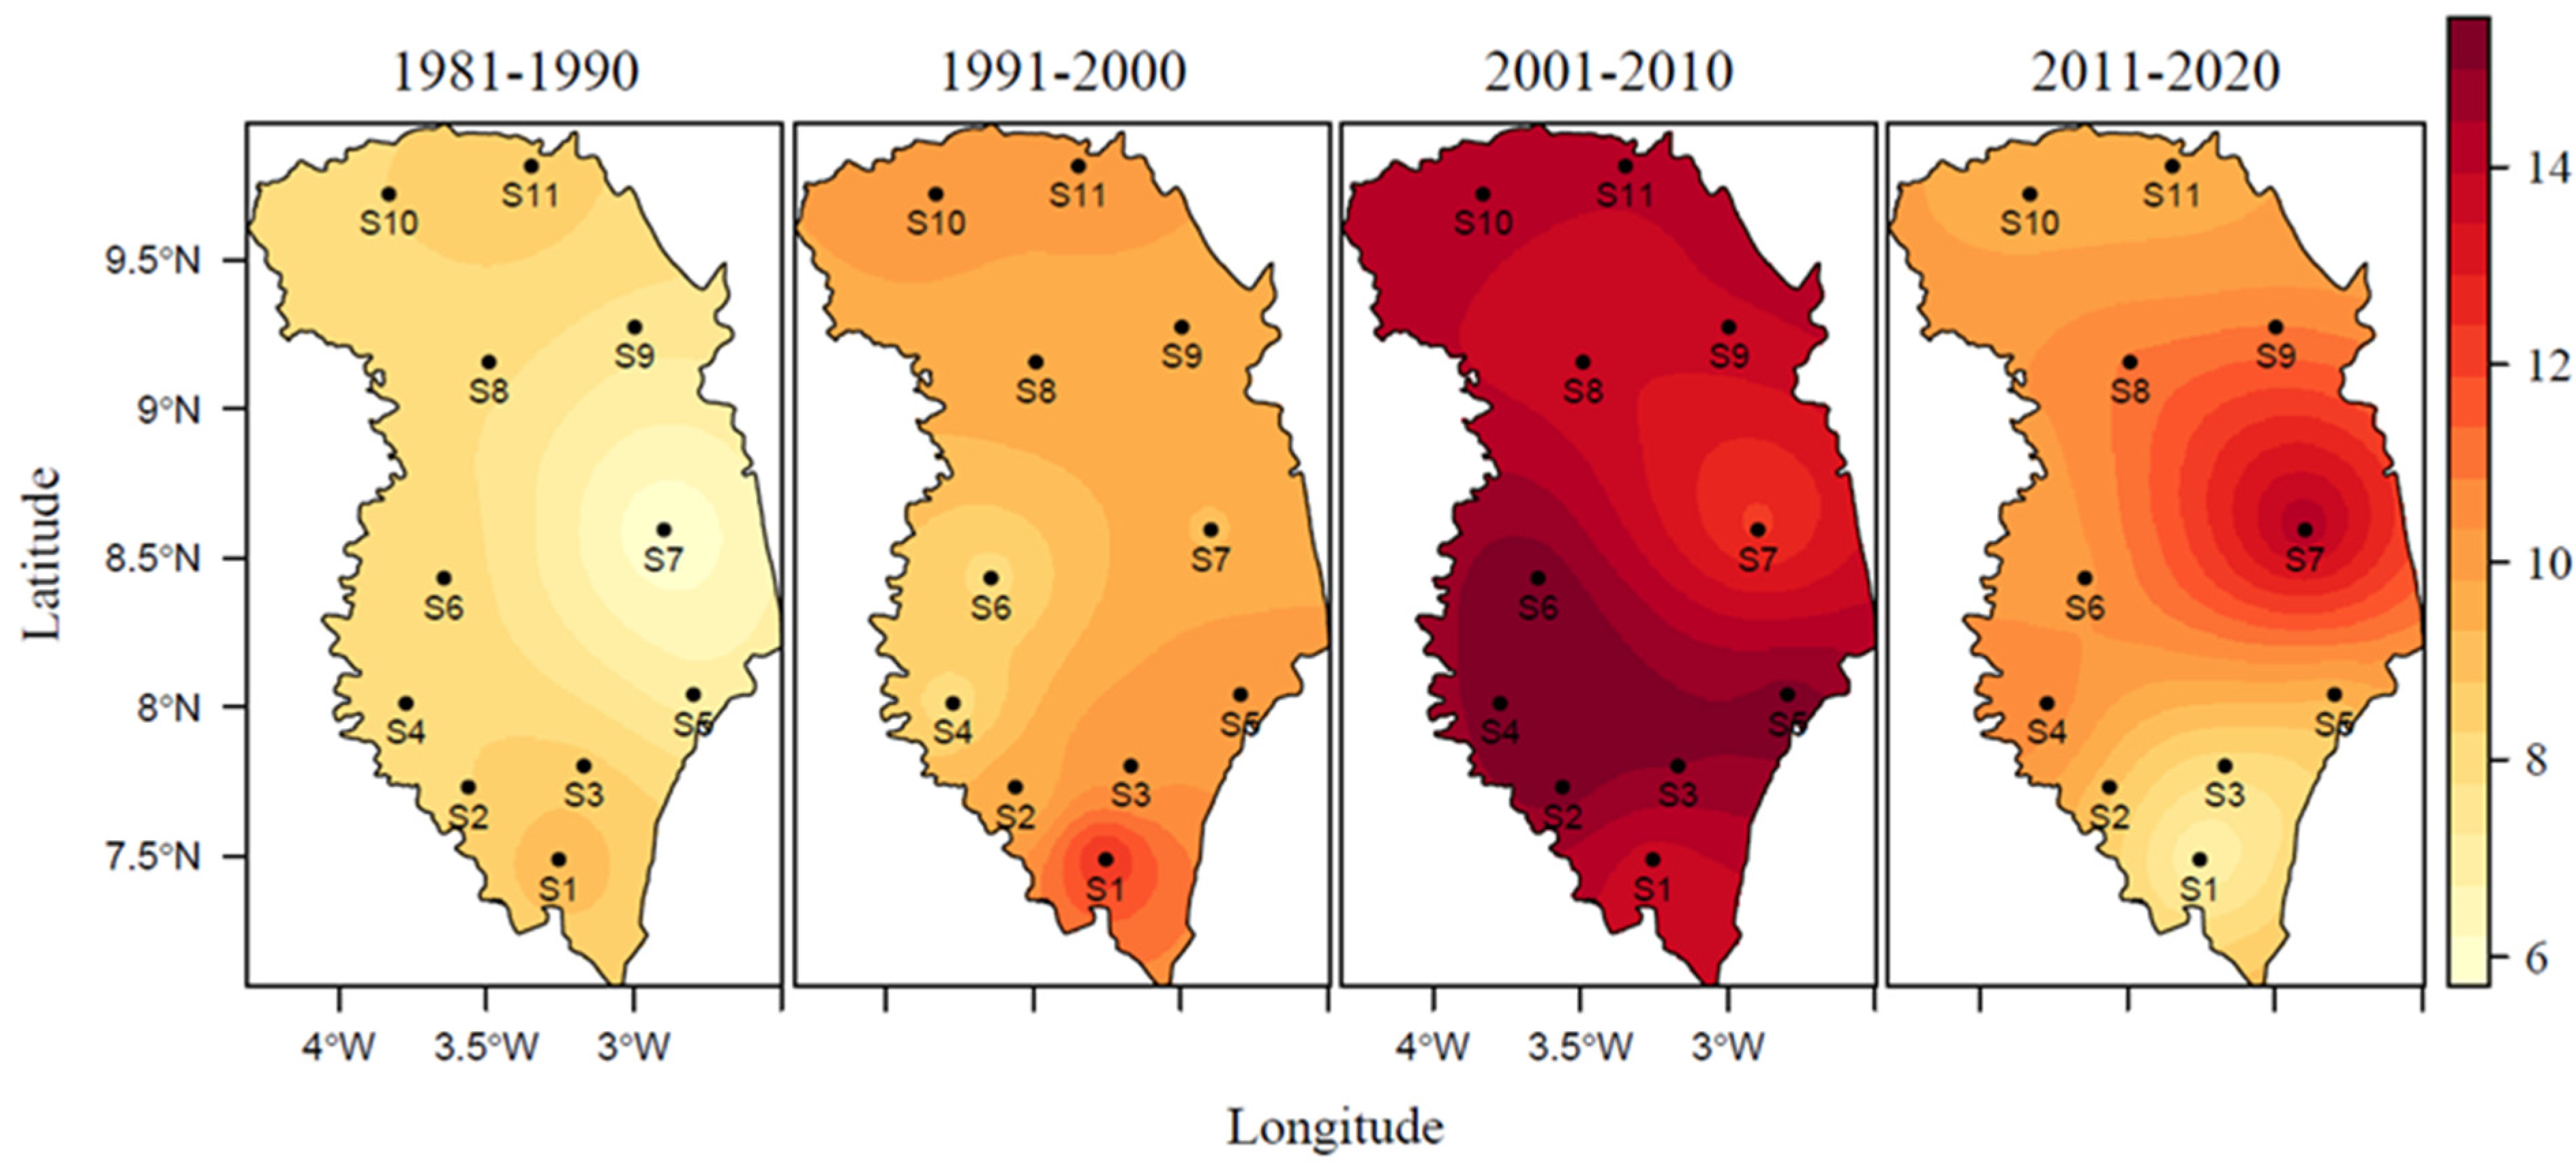
3.2.6. Evolution of the Warm Spell Duration Indicator (WSDI)

The data in Table 5 on the outputs of the Mann–Kendall statistical test showed a general increasing trend of the warm spell duration indicator in the Zanzan region. The general rising trend was nevertheless non-significant at the 5% significance level, except for the Sapli and Sandegué stations, which displayed significant rising trends. Over the study period, these significant increases were estimated at 24.29 days in Sapli, 14.39 days in Sandegué, and the overall average increase was estimated at 9.71 days over the entire study area. Figure 13 illustrates the spatial pattern of the warm spell duration indicator. Over the decade 1981–1990, the evolution of the warm spell duration indicator was between 13.5 and 26.7 days, and from 1991 to 2000, the evolution was between 16.8 and 31.3 days, meaning an increase of 4.6 days. Over the first decade, the strong warm spells were more intense in the southern and northern part of the research area, and over the second decade 1991–2000, the strong warm spells were more noticeable in the southern part of the region. From 2001 to 2010 the warm spell duration indicator varied between 25.3 and 40.1 days, which corresponds to an increase of 8.8 days, and from 2011 to 2020, the variation was between 14.9 and 29.8 days, which corresponds to a decrease of 10.3 days. Compared to other decades, the decade 2001–2010 stands out as the warmest with longer warm spells that cover almost the entire Zanzan region.

4. Discussion

4.1. Extreme Precipitations

This study carried out in the Zanzan region showed a decrease in total annual precipitation (PRCPTOT) at most of the stations studied (10 of the stations), with an average decrease of 112 mm over the research period. Furthermore, a generalized decrease in daily precipitation intensity SDII was seen across the entire study area, with the example of the localities in the southeast of the region, namely, Kouassi-datékro and Sandegué with respective decreases estimated at 1.17 mm/d and 0.78 mm/d. The decrease of the PRCPTOT index was also observed in the spatial distribution following the decades even if in the last decade we notice a slight return of precipitations. The primary influence of the decrease in precipitation was observed through the low intensity of rainfall received by the study area, as the daily precipitation intensity was also decreasing even though the decrease seemed insignificant. The increasing trend in daily precipitation intensity over the last decade had also led to a slight overall increase in rainfall. The general decrease in rainfall in the study area followed the general trend of decreasing rainfall that is observed throughout Côte d’Ivoire and varies according to the regions of the country. Indeed, for the PRCPTOT index, Allechy et al. [76] in the central-western part of Côte d’Ivoire noted a decrease of 788 mm between 1984 and 2013, Atcheremi et al. [71] in the south-western part of Côte d’Ivoire revealed a decrease of 85 mm in Daloa and 493 mm in Sassandra as well as a decrease of 159 mm according to Balliet et al. [75] in Gagnoa. In the forested south of Côte d’Ivoire, N’guessan et al. [90] determined a decrease in PRCPTOT of 20 mm followed by a decrease of 0.5 mm/d in rainfall intensities over two decades. The generalized decline in rainfall, which had even created a major drought wave starting in the 1970s, as revealed in the study conducted by Paturel et al. [91], continued over the following decades in Côte d’Ivoire, particularly in the Zanzan region, even though a slight return of rainfall was observed over the last decade. However, this decline in total annual precipitation and daily precipitation intensity is more than problematic for agricultural development, especially for the main cash crop in the Zanzan region, cashew nuts. For acceptable cashew nut production, rainfall between 800 and 1800 mm is required to be considered sufficient [92], whereas in the Zanzan region this rainfall, which varies between 800 and 1400 mm, is decreasing. A future study of the impact of rainfall variations on agricultural products, especially cashew nuts, will provide information on the real economic threat in the Zanzan region. The observation of rainfall disruption is also shown elsewhere in other studies. In the West African sub-region, studies such as that of New et al. [33] showed that the regions as a whole experienced a decrease in total annual precipitation and the number of rainy days. Thus, Hountondji et al. [72] in Benin found a decrease in total annual precipitation PRCPTOT for 95% of the stations studied and stability of the daily precipitation intensity SDII. This decrease in rainfall extends even across Africa as Vondou et al. [74], reported that the cumulative annual rainfall and the daily precipitation intensity SDII are decreasing in northern Cameroon. Unlike the decrease in the daily precipitation intensity SDII found in our study area, Gebrechorkos et al. [81] in their work found an increase in the SDII index in Kenya.
The CWD index for consecutive wet days was declining by an average of 16.45 days across all of the stations analyzed in the Zanzan region, while the CDD index for consecutive dry days was rising by an average of 18.67 days throughout most of the stations studied, according to the findings of this study. The CDD index is a marker of the presence of drought in a region. Its increase in a locality should be a concern, especially in an area such as the Zanzan region where the source of income of the population is based on agriculture. It is also a factor in the threat to water resources. These indicators have been studied in other regions of Côte d’Ivoire. In the southwest of Côte d’Ivoire, contrary to our result, Atcheremi et al. [71] observed an increase in consecutive wet days in Daloa, but in Gagnoa in the same area, Balliet et al. [75] indicated that the CWD was decreasing while the CDD was increasing. Furthermore, in the west-central area of Côte d’Ivoire, Allechi et al. [76] demonstrated that the CWD index has decreased while the CDD index has increased by 0.812 days/year. The occurrence of dry sequences within the rainy season thus seems to be widespread in Côte d’Ivoire, which is a cause for concern in an essentially agricultural country. For a proper practice of rainfed agriculture, when during the rainy season there are sequences of dry days, this can cause the drying of the young plant at the primary stage of its growth, especially for crops such as maize and yam, which are cultivated in the Zanzan region. This impact may be minimal on cashew trees because they have more or less short-drought resistant characteristics. In the West African sub-region, this observation of the evolution of these indices seems to be the same. The study in Ghana by Larbi et al. [93] showed rising trends in CDD and a declining trend in the CWD index, and Ozer et al. [94] identified the same results in Niger. These rainfall pattern parallels would be worldwide in scope, as they have been confirmed in several parts of the Pacific [31], and Donat et al. [95] detected that the CDD index was trending toward arid conditions across South Africa, East Asia, and South America in their analytical research of precipitation and temperature extremes since the turn of the 20th century. The R99p and R99pTOT indices in this study were slightly increased in the Zanzan region. The average increase in total annual precipitation from very heavy rain days was 1.41% of days. The spatial distribution clearly showed this evolution over the decades. The last decade, 2011–2020, showed a significant increase for both indices. A rise in the R99p and R99pTOT indices is a very important water contribution. For rainfed agriculture, these high water inputs can contribute to the development of the plant, but only if the plant has already exceeded the primary growth period, at the risk of being destroyed by these heavy rains, as could be the case for maize or cashew. These indices are sometimes the cause of flooding and landslides. Balliet et al. [75] identified a rise in R99p index at Gagnoa in Côte d’Ivoire. These patterns of change in these indices are similar and sometimes different in other parts of Africa. Hountondji et al. [72] found more stable conditions of the R99p and R99pTOT index in Benin. In the Central Sahel, Panthou et al. [73] reported that the occurrence of extreme rainfall was increasing as well as in the West African Sahel [96]. In contrast to the increase in R99p index found in this study, Berhane et al. [63] found in their study a significant decrease of R99p in Ethiopia in the Tigray region. With the advent of climate change, some areas of the world will receive more rainfall, and sometimes the scarcity of rainfall in some areas will increase, hence the similarity and differences in the results of this study compared to others. In the Zanzan region, these high rainfall amounts have certainly influenced the slight return of rainfall observed in the decade 2011–2020.

4.2. Temperature Extremes

A considerable drop in the trends of the cold spells, such as the index of the number of cold nights TN10p, the index of the number of cool days TX10p, and the cold spell duration indicator CSDI, was noted at all research stations in the Zanzan region in the north-east of Côte d’Ivoire. On the other hand, the warm spells, such as the index of the number of hot days TX90p, the index of warm spell duration indicator WSDI, and the index of the number of warm nights TN90p increased in all the stations studied and were more significant in the stations such as Bondoukou, Sapli, and Sandegué. Regarding the spatial distribution per decade, the cold and warm spells have evolved in contrast. The first decade (i.e., 1981–1990) showed a large number of cool days and this has evolved in a decreasing way until the last decade (i.e., 2011–2020) which showed a very low number of cool days. For the warm spells, the evolution started with a low number of hot days before displaying a high number of hot days over the last two decades. However, the decade 2001–2010 has shown to be the warmest in terms of days and the last two decades in terms of nights in the study area. The humid climate of the Zanzan region has been transformed into a hot climate. In the climatic context of Côte d’Ivoire, Atcheremi et al. [71] found similar results concerning the increase in the WSDI index and the decrease in a CSDI index in the southwest of Côte d’Ivoire, precisely in Daloa, Gagnoa, and Sassandra. The various trends observed related to the warming of the study area are under the influence of climate change. For the Zanzan region, this situation is a concern. The shortening of the rainy seasons and the warming of the study area will have an influence on water resources in the region and will greatly impact agriculture, which is essentially rainfed in this area. For cashew farming, for example, the presence of high temperatures during the flowering period can be very problematic. The threshold temperature should not be above 32 °C in order not to compromise the flowering and fruiting of the cashew tree. Indeed, beyond this threshold value, the temperature can provoke scald and flower abortion phenomena and significantly reduce the fruiting of the cashew tree [97]. The lack of cold nights in favor of the warming could impact the health of the population as shown in other studies, namely, Ambouta et al. [98] in Niger and Abatan et al. [26] in Nigeria. The climate context related to global warming is a sub-regional observation. Barry et al. [27] found in West Africa that warm nights and hot days are becoming more common, whereas cold nights and cool days are becoming less common. Furthermore, Chaney et al. [99] concluded that in Sub-Saharan Africa, there is a more rapid rise in warm climatic occurrences and a decline in cold spells. This warming is even spreading across Africa and around the world. In a study conducted in the “Greater Horn of Africa” in countries such as Burundi, Sudan, Rwanda, Djibouti, Tanzania, Uganda, and Ethiopia, Omondi et al. [100] stated that there was a rise in extreme heat (TX90P, WSDI) while cold spells decreased. In South Africa [101] and Morocco [102,103], the scholars concluded that there was an increase in warm extreme events TX90p and WSDI while cold extreme conditions TX10p and CSDI declined. Popov et al. [104] evaluated the extreme temperature indices in Bosnia and Herzegovina and concluded that there was a significant rise in warm temperature (TN90p, TX90p, WSDI) and similar observations were made in Israel and Palestine by Salameh et al. [105], as well as in China by Zhou et al. [106]. The decade 2001–2010 was found to be warmer than other decades in this study. This increase in warmer conditions during the 2001–2010 decade according to the WMO [107] and Coumou and Rahmstorf [108] studies was felt globally in several regions of the world. According to the IPCC [31], the temperature change follows natural and anthropogenic factors, especially in the causal relationships between the emissions of greenhouse gas (GHG). For the IPCC, continued GHG emissions at the current rate or higher are expected to increase warming and profoundly alter the climate system in the 21st century. It should be noted that the decrease in rainfall and the temperature rise are also locally linked to the regression of forests following the ongoing deforestation in Côte d’Ivoire. Indeed, according to Yao [109], the Ivorian forest has declined from 13 million hectares in colonial times to less than two million hectares currently.

5. Conclusions

The current study, whose major objective was to spatiotemporally assess the climate change in precipitation and temperature extremes in the Zanzan region using ETCCDMI indices, has produced a summary of the region’s extreme climatic trends. Daily observations of minimum and maximum temperatures, as well as daily rainfall, were used to calculate the indices. For the extreme precipitation trends, the stations studied showed indices that have mostly non-significant statistical trends. Indeed, the results showed a decline in annual total precipitation PRCPTOT, daily precipitation intensity SDII, and consecutive wet days CWD, indicating a decrease in rainfall in the region. These decreases were estimated to be an average over the study period at 112.35 mm for the PRCPTOT index and 16.45 days for the CWD index. Following that, the CDD (consecutive dry days) was increased, as well as the indices R99p and R99pTOT (total annual precipitation from very heavy rain days and contribution from extremely wet days, respectively). The latter indices can lead to flooding and sometimes landslides. The increase, for example, in the CDD index, was estimated at 18.67 days over the study period. The indices related to extreme temperatures were much more statistically significant than the indices related to extreme precipitation. For these temperature extremes, we observed a decline in the cold spells TX10p, TN10p, CSDI and a rise in the warm spells TX90p, TN90p, and WSDI. We can state that the decreases in the cold spells were estimated on average over the study period at 6.58% of the days for the TX10p index and 26.15 days for the CSDI index. As for the warm spells, the increases were estimated on average at 5.19% of days for the TX90p index and 9.71 days for the WSDI index. Decreased rainfall and increased temperatures in this agricultural region of Côte d’Ivoire may influence agricultural production through low yields and could also threaten water resources. Furthermore, the socio-economic situation of this region would be even more alarming if there is an intensification of the currently observed trends in the future regarding the practice of crops, such as cashew, which would provoke a vulnerable health situation for the population. The knowledge of these different trends in temperature and rainfall extremes for this region is of high importance in the measure of sustainable agricultural and economic planning by the government authorities. Measures to encourage the population to adopt crops that are more resistant to the current climatic conditions, to think about better planning of the agricultural calendar according to the rainfall conditions, and consider forest management can immediately be set up by the authorities of the Zanzan region.

Author Contributions

Conceptualization, K.D.K., B.H.K. and K.A.; methodology, K.D.K.; software, K.D.K. and K.A.; validation, K.D.K., A.T.K.-b., B.H.K. and K.A.; formal analysis, K.D.K.; investigation, K.D.K.; resources, K.D.K. and A.T.K.-b.; data curation, K.D.K. and B.H.K.; writing—original draft preparation, K.D.K.; writing—review and editing, K.D.K. and K.A.; visualization, A.T.K.-b., B.H.K. and K.A.; supervision, A.T.K.-b., B.H.K. and K.A.; project administration, A.T.K.-b., K.A. and K.D.K.; funding acquisition, A.T.K.-b., K.A. and K.D.K. All authors have read and agreed to the published version of the manuscript.

Funding

This research received no external funding.

Institutional Review Board Statement

Not applicable.

Informed Consent Statement

Not applicable.

Data Availability Statement

Some of the data analyzed in this study are a re-analysis of existing data, which are freely available at locations cited in the reference section and the remaining data are available from the corresponding author on reasonable request.

Acknowledgments

The authors would like to acknowledge the Regional Centre for Energy and Environmental Sustainability (RCEES) for their investment in this work.

Conflicts of Interest

The authors declare no conflict of interest.

References

  1. Orellana, M. Climate Change and the Millennium Development Goals: The Right to Development, International Cooperation and the Clean Development Mechanism. Sur.-Int. J. Hum. Rights 2010, 7, 144. [Google Scholar]
  2. Akpoti, K.; Kabo-bah, A.T.; Zwart, S.J. Agricultural Land Suitability Analysis: State-of-the-Art and Outlooks for Integration of Climate Change Analysis. Agric. Syst. 2019, 173, 172–208. [Google Scholar] [CrossRef]
  3. World Bank World Development Indicators. 2006. Available online: Https://Openknowledge.Worldbank.Org/Handle/10986/8151 (accessed on 8 June 2021).
  4. Rockström, J.; Folke, C.; Gordon, L.; Hatibu, N.; Jewitt, G.; Penning de Vries, F.; Rwehumbiza, F.; Sally, H.; Savenije, H.; Schulze, R. A Watershed Approach to Upgrade Rainfed Agriculture in Water Scarce Regions through Water System Innovations: An Integrated Research Initiative on Water for Food and Rural Livelihoods in Balance with Ecosystem Functions. Phys. Chem. Earth 2004, 29, 1109–1118. [Google Scholar] [CrossRef]
  5. Dixon, J.; Gulliver, A.; Gibbon, D. Farming Systems and Poverty: Improving Farmers’ Livelihoods in a Changing World. In Farming Systems and Poverty: Improving Farmers’ Livelihoods in a Changing World. Food and Agriculture Organization and the World Bank. 2001. Available online: Https://Www.Fao.Org/3/Ac349e/Ac349e (accessed on 8 June 2021).
  6. Akpoti, K.; Higginbottom, T.P.; Foster, T.; Adhikari, R.; Zwart, S.J. Mapping Land Suitability for Informal, Small-Scale Irrigation Development Using Spatial Modelling and Machine Learning in the Upper East Region, Ghana. Sci. Total Environ. 2022, 803, 149959. [Google Scholar] [CrossRef]
  7. Waha, K.; Müller, C.; Rolinski, S. Separate and Combined Effects of Temperature and Precipitation Change on Maize Yields in Sub-Saharan Africa for Mid-to Late-21st Century. Glob. Planet. Chang. 2013, 106, 1–12. [Google Scholar] [CrossRef]
  8. Siabi, E.K.; Kabobah, A.T.; Akpoti, K.; Anornu, G.K.; Amo-Boateng, M.; Nyantakyi, E.K. Statistical Downscaling of Global Circulation Models to Assess Future Climate Changes in the Black Volta Basin of Ghana. Environ. Chall. 2021, 5, 100299. [Google Scholar] [CrossRef]
  9. Ibe, G.O.; Amikuzuno, J. Climate Change in Sub-Saharan Africa: A Menace to Agricultural Productivity and Ecological Protection. J. Appl. Sci. Environ. Manag. 2019, 23, 329. [Google Scholar] [CrossRef] [Green Version]
  10. IPCC. The Scientific Basis, Summary for Policy Makers—Contribution of Working Group I to the Third Assessment Report of the Intergovermental Panel on Climate Change; Houghton, J.T., Ding, Y., Griggs, D.J., Noguer, M., van der Linden, P.J., Dai, X., Maskell, K., Eds.; IPCC: Geneva, Switzerland, 2001. [Google Scholar]
  11. Akpoti, K.; Dossou-Yovo, E.R.; Zwart, S.J.; Kiepe, P. The Potential for Expansion of Irrigated Rice under Alternate Wetting and Drying in Burkina Faso. Agric. Water Manag. 2021, 247, 106758. [Google Scholar] [CrossRef]
  12. Shoko, R.R.; Chaminuka, P.; Belete, A. Maize yield sensitivity to climate variability in south africa: Application of the ardl-ecm approach. J. Agribus. Rural Dev. 2019, 2016, 363–371. [Google Scholar] [CrossRef]
  13. Blanc, E. The Impact of Climate Change on Crop Yields in Sub-Saharan Africa. Am. J. Clim. Change 2012, 1, 1–13. [Google Scholar] [CrossRef] [Green Version]
  14. Grace, K.; Nagle, N.N.; Husak, G. Can Small-Scale Agricultural Production Improve Children’s Health? Examining Stunting Vulnerability among Very Young Children in Mali, West Africa. Ann. Am. Assoc. Geogr. 2016, 106, 722–737. [Google Scholar] [CrossRef]
  15. Belesova, K.; Gasparrini, A.; Sié, A.; Sauerborn, R.; Wilkinson, P. Household Cereal Crop Harvest and Children’s Nutritional Status in Rural Burkina Faso. Environ. Health A Glob. Access Sci. Source 2017, 16, 65. [Google Scholar] [CrossRef] [PubMed] [Green Version]
  16. FAO. The State of Food and Agriculture. Food Aid for Food Security? FAO: Rome, Italy, 2006; ISBN 9789251056004. [Google Scholar]
  17. Alagidede, P.; Adu, G.; Frimpong, P.B. The Effect of Climate Change on Economic Growth: Evidence from Sub-Saharan Africa. Environ. Econ. Policy Stud. 2016, 18, 417–436. [Google Scholar] [CrossRef] [Green Version]
  18. World Bank. World Bank. World Development Indicators 2007. In World Development Indicators; World Bank: Washington, DC, USA, 2007; ISBN 0821369598. [Google Scholar]
  19. Müller, C. Climate Change Impact on Sub-Saharan Africa? An Overview and Analysis of Scenarios and Models. (DIE Discussion Paper, 3/2009). In Bonn: Deutsches Institut Für Entwicklungspolitik GGmbH; DIE: Bonn, Germany, 2009; ISBN 9783889854513. [Google Scholar]
  20. Chen, H.; Githeko, A.K.; Zhou, G.; Githure, J.I.; Yan, G. New Records of Anopheles Arabiensis Breeding on the Mount Kenya Highlands Indicate Indigenous Malaria Transmission. Malar. J. 2006, 5, 17. [Google Scholar] [CrossRef] [Green Version]
  21. Reich, P.; Numbe, S.; Almaraz, R.; Eswaran, H. Land Resources Stresses and Desertification in Africa. AgroSci 2001, 2, 1–10. [Google Scholar] [CrossRef]
  22. Mitchell, S.A. The Status of Wetlands, Threats and the Predicted Effect of Global Climate Change: The Situation in Sub-Saharan Africa. Aquat. Sci. 2013, 75, 95–112. [Google Scholar] [CrossRef]
  23. Pelling, M.; Wisner, B. (Eds.) Urbanisation, Human Security and Disaster Risk in Africa. In Disaster Risk Reduction—Cases from Urban Africa; Earthscan: London, UK, 2009; pp. 3–16. [Google Scholar]
  24. Akpoti, K.; Kabo-bah, A.T.; Dossou-Yovo, E.R.; Groen, T.A.; Zwart, S.J. Mapping Suitability for Rice Production in Inland Valley Landscapes in Benin and Togo Using Environmental Niche Modeling. Sci. Total Environ. 2020, 709, 136165. [Google Scholar] [CrossRef]
  25. Sultan, B.; Gaetani, M. Agriculture in West Africa in the Twenty-First Century: Climate Change and Impacts Scenarios, and Potential for Adaptation. Front. Plant Sci. 2016, 7, 1262. [Google Scholar] [CrossRef] [Green Version]
  26. Abatan, A.A.; Abiodun, B.J.; Lawalc, K.A.; Gutowski, W.J. Trends in Extreme Temperature over Nigeria from Percentile-Based Threshold Indices. Int. J. Climatol. 2016, 36, 2527–2540. [Google Scholar] [CrossRef]
  27. Barry, A.A.; Caesar, J.; Klein Tank, A.M.G.; Aguilar, E.; McSweeney, C.; Cyrille, A.M.; Nikiema, M.P.; Narcisse, K.B.; Sima, F.; Stafford, G.; et al. West Africa Climate Extremes and Climate Change Indices. Int. J. Climatol. 2018, 38, e921–e938. [Google Scholar] [CrossRef]
  28. Kpanou, M.; Laux, P.; Brou, T.; Vissin, E.; Camberlin, P.; Roucou, P. Spatial Patterns and Trends of Extreme Rainfall over the Southern Coastal Belt of West Africa. Theor. Appl. Climatol. 2021, 143, 473–487. [Google Scholar] [CrossRef]
  29. IPCC. Managing the Risks of Extreme Events and Disasters to Advance Climate Change Adaptation. A Special Report of Working Groups I and II of the Intergovernmental Panel on Climate Change; Field, C.B., V. Barros, T.F., Stocker, D., Qin, D.J., Dokken, K.L., Ebi, M.D., Eds.; IPCC: Geneva, Switzerland, 2012; ISBN 9781139177245. [Google Scholar]
  30. Roudier, P.; Sultan, B.; Quirion, P.; Berg, A. The Impact of Future Climate Change on West African Crop Yields: What Does the Recent Literature Say? Glob. Environ. Chang. 2011, 21, 1073–1083. [Google Scholar] [CrossRef] [Green Version]
  31. IPCC. Climate Change 2007: Impacts, Adaptation and Vulnerability. Contribution of Working Group II to the Fourth Assessment Report of the Intergovernmental Panel on Climate Change; Parry, M.L., Canziani, O.F., Palutikof, J.P., van der Linden, P.J., Hanson, C.E., Eds.; Cambridge University Press: Cambridge, UK, 2007; ISBN 9780521880107. [Google Scholar]
  32. Aguilar, E.; Barry, A.A.; Brunet, M.; Ekang, L.; Fernandes, A.; Massoukina, M.; Mbah, J.; Mhanda, A.; do Nascimento, D.J.; Peterson, T.C.; et al. Changes in Temperature and Precipitation Extremes in Western Central Africa, Guinea Conakry, and Zimbabwe, 1955–2006. J. Geophys. Res. Atmos. 2009, 114, 1–11. [Google Scholar] [CrossRef]
  33. New, M.; Hewitson, B.; Stephenson, D.B.; Tsiga, A.; Kruger, A.; Manhique, A.; Gomez, B.; Coelho, C.A.S.; Masisi, D.N.; Kululanga, E.; et al. Evidence of Trends in Daily Climate Extremes over Southern and West Africa. J. Geophys. Res. Atmos. 2006, 111, 1–11. [Google Scholar] [CrossRef]
  34. Karimou, B.M.; Ambouta, K.; Sarr, B.; Tychon, B. Analyse Des Phénomènes Climtiques Extrêmes Dans Le Sud-Est Du Niger; Publications de l’Association Internationale de Climatologie: Liège, Belgique, 2015. [Google Scholar]
  35. Cameron, C.; Norrington-Davies, G.; De Agulhas, V.t.V.; Mitchell, T. Climate and Development Knowledge Network Managing Climate Extremes and Disasters in Africa: Lessons from the SREX Report; 2012. Available online: www.Cdkn.Org/Srex (accessed on 12 June 2021).
  36. Schlenker, W.; Lobell, D.B. Robust Negative Impacts of Climate Change on African Agriculture. Environ. Res. Lett. 2010, 5, 014010. [Google Scholar] [CrossRef]
  37. Sultan, B.; Guan, K.; Kouressy, M.; Biasutti, M.; Piani, C.; Hammer, G.L.; McLean, G.; Lobell, D.B. Robust Features of Future Climate Change Impacts on Sorghum Yields in West Africa. Environ. Res. Lett. 2014, 9. [Google Scholar] [CrossRef]
  38. Rockström, J.; Falkenmark, M. Increase Water Harvesting in Africa: Meeting Global Food Needs Requires Strategies for Storing Rainwater and Retaining Soil Moisture to Bridge Dry Spells. Nature 2015, 519, 283–285. [Google Scholar] [CrossRef]
  39. Wilkinson, E.; Peters, K. Extrêmes Climatiques et Réduction de La Pauvreté Par La Résilience: Le Développement Conçu Dans l’incertitude; Overseas Development Institute: Londres, UK, 2016; Volume 2015. [Google Scholar]
  40. FAO. Climate-Smart Agriculture in Côte d ’ Ivoire. Climate-Smart Agriculture in Côte d’Ivoire; FAO: Rome, Italy, 2018. [Google Scholar]
  41. Diomande, M.; Dongo, K.; Koné, B.; Cissé, G.; Biémi, J.; Bonfoh, B. Vulnérabilité de l’agriculture Pluviale Au Changement de Régime Pluviométrique et Adaptation Des Communautés Rurales Du «V-Baoulé» En Côte d’Ivoire. 14e Colloq. Int. en Éval. Environ. 2009, 11, 8–16. [Google Scholar]
  42. DJE KOUAKOU BERNARD. Document de Stratégie Du Programme National Changement Climatique (2015–2020). In 84 Pages + Annexes; Ministère de l’Enivironndment, de la Salubrité Urbaine et du Développement Durable (MESUDD): Abidjan, Côte d’Ivoire, 2014. [Google Scholar]
  43. Kassin, K.E.; Doffangui, K.; Kouamé, B.; Yoro, R.G.; Assa, A. Variabilité Pluviométrique et Perspectives Pour La Replantation Cacaoyère Dans Le Centre Ouest de La Côte d’Ivoire. J. Appl. Biosci. 2008, 12, 633–641. [Google Scholar]
  44. Guessan, K.; Kouassi, A.; Gnaboa, R.; Traoré, K.; Houenou, P. Analyse de phenomènes hydrologiques dans un bassin versant urbanisé: Cas de la ville de yamoussoukro (centre de la cote d ’ ivoire). Larhyss J. 2014, 17, 135–154. [Google Scholar]
  45. Ernest, A.K.; Blaise, K.Y.; Michel, K.A.; Gbombélé, S.; Nagnin, S.; Jean, B. Étude de La Variabilité Hydroclimatique et de Ses Conséquences Sur Les Ressources En Eau Du Sud Forestier et Agricole de La Côte d ’ Ivoire: Cas de La Région d ’ Abidjan-Agboville. Int. J. Pure Appl. Biosci. 2013, 1, 30–50. [Google Scholar]
  46. Dekoula, C.; Brou, K.; N’goran, k.E.; Yao, F.; Ehounou, J.; Soro, N. Impact De La Variabilité Pluviométrique Sur La Saison Culturale Dans La Zone De Production Cotonnière En Côte D’. Eur. Sci. J. 2018, 14, 143–156. [Google Scholar] [CrossRef]
  47. MINAGRI (Ministère de l’Agriculture). Rapport Sur La Dynamique de La Consommation Alimentaire En Côte d’Ivoire. In 98 Pages + Annexes; MINAGRI: Abidjan, Côte d’Ivoire, 2011. [Google Scholar]
  48. WFP (World Food Programme). WFP Côte d’Ivoire Country Brief August 2019; WFP: Rome, Italy, 2019. [Google Scholar]
  49. CI-Energies Plan Cadre de Gestion Environnementale et Sociale (PCGES) Du Projet Electrification de 1088 Localités de La Côte d’Ivoire; Rapport Final: Abidjan, Côte d’Ivoire, 2019; pp. 1–169.
  50. Dabissi, N. Changements Hydroclimatiques et Transformations de l’agriculture: L’exemple Des Paysanneries de l’Est de La Côte d’Ivoire; Universite Paris 1 Pantheon-Sorbonne: Paris, France, 2011. [Google Scholar]
  51. Dje, K.B.; Ochou, A.D.; Kouadio, Z.A.; Alama, K. Impacts of El Nino on Rainfall and Its AgrocltmaticIncidences in the Zanzan Region: North-East of Côte d’Ivoire. Geosci. Res. 2018, 3, 9–20. [Google Scholar] [CrossRef]
  52. WMO. Guidelines on Analysis of Extremes in a Changing Climate in Support of Informed Decisions for Adaptation; WMO-TD No. 1500: Geneva, Switzerland, 2009; pp. 361–375. [Google Scholar]
  53. WMO. Inter-Regional Workshop on Indices and Early Warning Systems for Drought; World Meteorological Organization: Lincoln, NE, USA, 2009. [Google Scholar]
  54. Brou, Y.T. La Variabilité Climatique En Côte d’Ivoire: Entre Perceptions Sociales et Réponses Agricoles. Cah. Agric. 2005, 14, 533–540. [Google Scholar]
  55. INS Recensement Général de La Population et de l’habitat (RGPH) 2014; Répertoire Des Localités: Abidjan, Côte d’Ivoire, 2015.
  56. Sinan, A.; Abou, N.K. Impacts Socio-Economiques De La Culture De L’anacarde Dans La Sous-Prefecture D’odienne (Côte d’Ivoire). Eur. Sci. J. ESJ 2016, 12, 369. [Google Scholar] [CrossRef] [Green Version]
  57. Westberg, D.J.; Stackhouse, P.W.; Crawley, D.B.; Hoell, J.M.; Chandler, W.S.; Zhang, T. An Analysis of NASA’s Merra Meteorological Data to Supplement Observational Data for Calculation of Climatic Design Conditions. ASHRAE Trans. 2013, 119, 210–221. [Google Scholar]
  58. Rienecker, M.M.; Suarez, M.J.; Gelaro, R.; Todling, R.; Bacmeister, J.; Liu, E.; Bosilovich, M.G.; Schubert, S.D.; Takacs, L.; Kim, G.K.; et al. MERRA: NASA’s Modern-Era Retrospective Analysis for Research and Applications. J. Clim. 2011, 24, 3624–3648. [Google Scholar] [CrossRef]
  59. Chandler, W.S.; Hoell, J.M.; Westberg, D.; Whitlock, C.H.; Zhang, T., Jr.; Stackhouse, P.W. NASA’s Prediction of Worldwide Energy Resource (POWER) Web Services; American Meteorological Society 91st Annual Meeting: Seattle, WA, USA, 2011. [Google Scholar]
  60. Bai, J.; Chen, X.; Dobermann, A.; Yang, H.; Cassman, K.G.; Zhang, F. Evaluation of Nasa Satellite-and Model-Derived Weather Data for Simulation of Maize Yield Potential in China. Agron. J. 2010, 102, 9–16. [Google Scholar] [CrossRef]
  61. Bender, F.D.; Sentelhas, P.C. Solar Radiation Models and Gridded Databases to Fill Gaps in Weather Series and to Project Climate Change in Brazil. Adv. Meteorol. 2018, 2018, 6204382. [Google Scholar] [CrossRef] [Green Version]
  62. Aboelkhair, H.; Morsy, M.; El Afandi, G. Assessment of Agroclimatology NASA POWER Reanalysis Datasets for Temperature Types and Relative Humidity at 2 m against Ground Observations over Egypt. Adv. Space Res. 2019, 64, 129–142. [Google Scholar] [CrossRef]
  63. Berhane, A.; Hadgu, G.; Worku, W.; Abrha, B. Trends in Extreme Temperature and Rainfall Indices in the Semi-Arid Areas of Western Tigray, Ethiopia. Environ. Syst. Res. 2020, 9, 3. [Google Scholar] [CrossRef] [Green Version]
  64. Akpoti, K.; Antwi, E.; Kabo-bah, A. Impacts of Rainfall Variability, Land Use and Land Cover Change on Stream Flow of the Black Volta Basin, West Africa. Hydrology 2016, 3, 26. [Google Scholar] [CrossRef] [Green Version]
  65. Alexander, L.V.; Zhang, X.; Peterson, T.C.; Caesar, J.; Gleason, B.; Klein Tank, A.M.G.; Haylock, M.; Collins, D.; Trewin, B.; Rahimzadeh, F.; et al. Global Observed Changes in Daily Climate Extremes of Temperature and Precipitation. J. Geophys. Res. Atmos. 2006, 111, 1–22. [Google Scholar] [CrossRef] [Green Version]
  66. Aguilar, E.; Peterson, T.C.; Obando, P.R.; Frutos, R.; Retana, J.A.; Solera, M.; Soley, J.; García, I.G.; Araujo, R.M.; Santos, A.R.; et al. Changes in Precipitation and Temperature Extremes in Central America and Northern South America, 1961–2003. J. Geophys. Res. Atmos. 2005, 110, 1–15. [Google Scholar] [CrossRef]
  67. Wang, X.L. Comments on “Detection of Undocumented Change Points: A Revision of the Two Phase Regression Model”. J. Clim. 2003, 16, 3383–3385. [Google Scholar] [CrossRef]
  68. Zhang, X.; Yang, F. RClimDex (1.0)—User Manual, Climate Research Branch Environment Canada Downsview; Climate Research Branch Environment Canada: Toronto, ON, Canada, 2004. [Google Scholar]
  69. Zhang, X.; Alexander, L.; Hegerl, G.C.; Jones, P.; Tank, A.K.; Peterson, T.C.; Trewin, B.; Zwiers, F.W. Indices for Monitoring Changes in Extremes Based on Daily Temperature and Precipitation Data. Wiley Interdiscip. Rev. Clim. Change 2011, 2, 851–870. [Google Scholar] [CrossRef]
  70. Bedoum, A.; Bouka Biona, C.; Jean Pierre, B.; Adoum, I.; Mbiake, R.; Baohoutou, L. Évolution Des Indices Des Extrêmes Climatiques En République Du Tchad de 1960 à 2008. Atmos.-Ocean 2017, 55, 42–56. [Google Scholar] [CrossRef]
  71. Atcheremi, N.D.; Jourda, J.P.; Saley, M.B.; Kouame, K.J.; Balliet, R. Study of the evolution of the rainfall extremes and temperature extremes in davo river basin (south- western of cote d’ivoire) from some indices of the software rclimdex. Larhyss J. 2018, 36, 99–117. [Google Scholar]
  72. Hountondji, Y.C.; De Longueville, F.; Ozer, P. Trends in Extreme Rainfall Events in Benin (West Africa), 1960–2000. In Proceedings of the 1st International Conference on Energy, Environment and Climate Change, Ho Chi Minh City, Vietnam, 26–27 August 2011. [Google Scholar]
  73. Panthou, G.; Vischel, T.; Lebel, T. Recent Trends in the Regime of Extreme Rainfall in the Central Sahel. Int. J. Climatol. 2014, 34, 3998–4006. [Google Scholar] [CrossRef]
  74. Vondou, D.A.; Guenang, G.M.; Kamsu-Tamo, P.H. Trends and Interannual Variability of Extreme Rainfall Indices over Cameroon. Sustainability 2021, 13, 6803. [Google Scholar] [CrossRef]
  75. Balliet, R.; Saley, M.B.; Anowa Eba, E.L.; Sorokoby, M.V.; N’Guessan Bi, H.V.; N’Dri, A.O.; Djè, B.K.; Biémi, J. Évolution Des Extrêmes Pluviométriques Dans La Région Du Gôh (Centre-Ouest De La Côte d’Ivoire). Eur. Sci. J. ESJ 2016, 12, 74. [Google Scholar] [CrossRef] [Green Version]
  76. Allechy, F.B.; Youan Ta, M.; N’Guessan Bi, V.H.; Yapi, F.A.; Koné, A.B.; Kouadio, A. Trend of Extreme Precipitations Indices in West-Central Côte d’Ivoire: Case of the Lobo Watershed. Eur. J. Eng. Res. Sci. 2020, 5, 1281–1287. [Google Scholar] [CrossRef]
  77. Kruger, A.C.; Shongwe, S. Temperature Trends in South Africa: 1960–2003. Int. J. Climatol. 2004, 24, 1929–1945. [Google Scholar] [CrossRef]
  78. Kruger, A.C.; Rautenbach, H.; Mbatha, S.; Ngwenya, S.; Makgole, T.E. Historical and Projected Trends in near Surface Temperature Indices for 22 Locations in South Africa. S. Afr. J. Sci. 2019, 115, 1–9. [Google Scholar] [CrossRef] [Green Version]
  79. Croitoru, A.E.; Chiotoroiu, B.C.; Ivanova Todorova, V.; Toricǎ, V. Changes in Precipitation Extremes on the Black Sea Western Coast. Glob. Planet. Chang. 2013, 102, 10–19. [Google Scholar] [CrossRef]
  80. Kabo-Bah, A.T.; Diji, C.J.; Nokoe, K.; Mulugetta, Y.; Obeng-Ofori, D.; Akpoti, K. Multiyear Rainfall and Temperature Trends in the Volta River Basin and Their Potential Impact on Hydropower Generation in Ghana. Climate 2016, 4, 49. [Google Scholar] [CrossRef]
  81. Gebrechorkos, S.H.; Hülsmann, S.; Bernhofer, C. Changes in Temperature and Precipitation Extremes in Ethiopia, Kenya, and Tanzania. Int. J. Climatol. 2019, 39, 18–30. [Google Scholar] [CrossRef] [Green Version]
  82. Davis, C.L.; Hoffan, M.T.; Roberts, W. Recent Trends in Climate of Namaqualand, a Megadiverse Arid Region of South Africa. S. Afr. J. Sci. 2015, 112, 3/4. [Google Scholar]
  83. Sen, P.K. Journal of the American Statistical Estimates of the Regression Coefficient Based on Kendall’s Tau. J. Am. Stat. Assoc. 1968, 63, 1379–1389. [Google Scholar] [CrossRef]
  84. Sterling, D.L. A Comparison of Spatial Interpolation Techniques for Determining Shoaling Rates of the Atlantic Ocean Channe. Master’s Thesis, Virginia Polytechnic Institute and State University, Blacksburg, VA, USA, 2003. [Google Scholar]
  85. Kyriakidis, P.C.; Goodchild, M.F. On the Prediction Error Variance of Three Common Spatial Interpolation Schemes. Int. J. Geogr. Inf. Sci. 2006, 20, 823–855. [Google Scholar] [CrossRef]
  86. Delbari, M.; Afrasiab, P.; Jahani, S. Spatial Interpolation of Monthly and Annual Rainfall in Northeast of Iran. Meteorol. Atmos. Phys. J. 2013, 122, 103–113. [Google Scholar] [CrossRef]
  87. Goovaerts, P. Geostatistical Approaches for Incorporating Elevation into the Spatial Interpolation of Rainfall. J. Hydrol. 2000, 228, 113–129. [Google Scholar] [CrossRef]
  88. Tsintikidis, D.; Georgakakos, K.P.; Sperfslage, J.A.; Smith, D.E.; Carpenter, T.M. Precipitation Uncertainty, Raingauge Network Design within Folsom Lake Watershed. ASCE J. Hydrol. Eng. 2002, 7, 175–184. [Google Scholar] [CrossRef]
  89. Afanasev, I.; Volkova, T.; Elizaryev, A.; Longobardi, A. Analysis of Interpolation Methods to Map the Long-Term Annual Precipitation Spatial Variability for the Republic of Bashkortostan, Russian Federation. WSEAS Trans. Environ. Dev. 2014, 10, 405–416. [Google Scholar]
  90. N’guessan, H.B.V.; Arona, D.; Adjakpa, T.; Kouadio, B.H.; Kone, B.; Kouame, K.; Yapi, A.; Koaudio, A. Apport de la télédétection à l ’ analyse spatio-temporelle de l’ évolution des extrêmes pluviométriques dans le district d’ abidjan au sud de la cote d ’ ivoire. Mélanges en hommages aux Professeurs Houssou C. S., Houndagba C. J. Thomas 2015, 3, 364–378. [Google Scholar]
  91. Paturel, J.E.; Servat, E.; Dela, M.O. Analyse de Séries Pluviométriques de Longue Durée En Afrique de l’Ouest et Centrale Non Sahélienne Dans Un Contexte de Variabilité Climatique. Hydrol. Sci. Sci. Hydrol. 1998, 43, 937–946. [Google Scholar] [CrossRef]
  92. Lacroix, E.J. Les Anacardiers, Les Noix de Cajou et La Filière Anacarde à Bassila et Au Bénin. Projet Restauration Des Ressources Forestières de Bassila; GFA Terra Systems: Hamburg, Allemagne, 2003. [Google Scholar]
  93. Larbi, I.; Hountondji, F.C.C.; Annor, T.; Agyare, W.A.; Gathenya, J.M.; Amuzu, J. Spatio-Temporal Trend Analysis of Rainfall and Temperature Extremes in the Vea Catchment, Ghana. Climate 2018, 6, 87. [Google Scholar] [CrossRef] [Green Version]
  94. Ozer, P.; Manzo, O.L.; Tidjani, A.D.; Djaby, B.; Longueville, F.D.E. Evolution Récente Des Extrêmes Pluviométriques Au Niger (1950–2014). Geo-Eco-Trop. 2017, 41, 375–383. [Google Scholar]
  95. Donat, M.G.; Alexander, L.V.; Yang, H.; Durre, I.; Vose, R.; Dunn, R.J.H.; Willett, K.M.; Aguilar, E.; Brunet, M.; Caesar, J.; et al. Updated Analyses of Temperature and Precipitation Extreme Indices since the Beginning of the Twentieth Century: The HadEX2 Dataset. J. Geophys. Res. Atmos. 2013, 118, 2098–2118. [Google Scholar] [CrossRef]
  96. Mouhamed, L.; Traore, S.B.; Alhassane, A.; Sarr, B. Evolution of Some Observed Climate Extremes in the West African Sahel. Weather Clim. Extremes 2013, 1, 19–25. [Google Scholar] [CrossRef] [Green Version]
  97. Vaz Milheiro, A.; Neves, E. Manual Do Cajueiro. Cultivar–Associação de Técnicos de Culturas Tropicais; Cultivar-Associação de Técnicos de Culturas Tropicais: Porto, Portugal, 1994; p. 204. [Google Scholar]
  98. Ambouta, K.; Sarr, B.; Tychon, B. Analyse Des Phénomènes Climatiques Extrêmes Dans Le Sud-Est Du Niger; XXVIIIe Colloque de l’Association Internationale de Climatologie: Liège, Belgium, 2015; pp. 537–542. [Google Scholar]
  99. Chaney, N.W.; Sheffield, J.; Villarini, G.; Wood, E.F. Development of a High-Resolution Gridded Daily Meteorological Dataset over Sub-Saharan Africa: Spatial Analysis of Trends in Climate Extremes. J. Clim. 2014, 27, 5815–5835. [Google Scholar] [CrossRef]
  100. Omondi, P.A.o.; Awange, J.L.; Forootan, E.; Ogallo, L.A.; Barakiza, R.; Girmaw, G.B.; Fesseha, I.; Kululetera, V.; Kilembe, C.; Mbati, M.M.; et al. Changes in Temperature and Precipitation Extremes over the Greater Horn of Africa Region from 1961 to 2010. Int. J. Climatol. 2014, 34, 1262–1277. [Google Scholar] [CrossRef]
  101. van der Walt, A.J.; Fitchett, J.M. Exploring Extreme Warm Temperature Trends in South Africa: 1960–2016. Theor. Appl. Climatol. 2021, 143, 1341–1360. [Google Scholar] [CrossRef]
  102. Filahi, S.; Tanarhte, M.; Mouhir, L.; El Morhit, M.; Tramblay, Y. Trends in Indices of Daily Temperature and Precipitations Extremes in Morocco. Theor. Appl. Climatol. 2016, 124, 959–972. [Google Scholar] [CrossRef]
  103. Aoubouazza, M.; Rajel, R.; Essafi, R. Impact Des Phénomènes Climatiques Extrêmes Sur Les Ressources En Eau et l ’ Agriculture Au Maroc. Rev. Mar. Sci. Agron. Vét. 2019, 7, 223–232. [Google Scholar]
  104. Popov, T.; Gnjato, S.; Trbić, G.; Ivanišević, M. Recent Trends in Extreme Temperature Indices in Bosnia and Herzegovina. Carpathian J. Earth Environ. Sci. 2018, 13, 211–224. [Google Scholar] [CrossRef]
  105. Salameh, A.A.M.; Gámiz-Fortis, S.R.; Castro-Díez, Y.; Abu Hammad, A.; Esteban-Parra, M.J. Spatio-Temporal Analysis for Extreme Temperature Indices over the Levant Region. Int. J. Climatol. 2019, 39, 5556–5582. [Google Scholar] [CrossRef]
  106. Zhou, J.; Huang, J.; Zhao, X.; Lei, L.; Shi, W.; Wang, L.; Wei, W.; Liu, C.; Zhu, G.; Yang, X. Changes of Extreme Temperature and Its Influencing Factors in Shiyang River Basin, Northwest China. Atmosphere 2020, 11, 1171. [Google Scholar] [CrossRef]
  107. WMO. The Global Climate 2001–2010: A Decade of Climtate Extreme; World Meteorological Organisation WMO-No. 1103: Geneva, Switzerland, 2010. [Google Scholar]
  108. Coumou, D.; Rahmstorf, S. A Decade of Weather Extremes. Nat. Clim. Chang. 2012, 2, 491–496. [Google Scholar] [CrossRef]
  109. YAO, K.T. Hydrodynamisme Dans Les Aquifères de Socle Cristallin et Cristallophyllien Du Sud-Ouest de La Côte d’Ivoire: Cas Du Département de Soubré. Apport de La Télédétection, de La Géomorphologie et de l’hydrogéochimie. Thèse Unique. UFR STRM; Université de Coco: Abidjan, Côte d’Ivoire, 2009. [Google Scholar]
Figure 1. Geographical location of the Zanzan region and spatial representation of the meteorological stations of the study.
Climate 10 00074 g001
Figure 2. Spatial distribution of annual total precipitations (PRCPTOT) (mm) per decade in the Zanzan region. Stations (S1 = Koun Fao, S2 = Kouassi-datékro, S3 = Tanda, S4 = Sandegué, S5 = Bondoukou, S6 = Nassian, S7 = Sapli, S8 = PN Comoé S1, S9 = Bouna, S10 = Téhini, S11 = Doropo).
Climate 10 00074 g002
Figure 3. Spatial distribution of the daily precipitation intensity (SDII) (mm/d) per decade in the Zanzan region. Stations (S1 = Koun Fao, S2 = Kouassi-datékro, S3 = Tanda, S4 = Sandegué, S5 = Bondoukou, S6 = Nassian, S7 = Sapli, S8 = PN Comoé S1, S9 = Bouna, S10 = Téhini, S11 = Doropo).
Climate 10 00074 g003
Figure 4. Spatial distribution of the consecutive wet days (CWD) (days) per decade in the Zanzan region. Stations (S1 = Koun Fao, S2 = Kouassi-datékro, S3 = Tanda, S4 = Sandegué, S5 = Bondoukou, S6 = Nassian, S7 = Sapli, S8 = PN Comoé S1, S9 = Bouna, S10 = Téhini, S11 = Doropo).
Climate 10 00074 g004
Figure 5. Spatial distribution of the consecutive dry days (CDD) (days) per decade in the Zanzan region. Stations (S1 = Koun Fao, S2 = Kouassi-datékro, S3 = Tanda, S4 = Sandegué, S5 = Bondoukou, S6 = Nassian, S7 = Sapli, S8 = PN Comoé S1, S9 = Bouna, S10 = Téhini, S11 = Doropo).
Climate 10 00074 g005
Figure 6. Spatial distribution of the total annual precipitation from very heavy rain days (R99p) (mm) per decade in the Zanzan region. Stations (S1 = Koun Fao, S2 = Kouassi-datékro, S3 = Tanda, S4 = Sandegué, S5 = Bondoukou, S6 = Nassian, S7 = Sapli, S8 = PN Comoé S1, S9 = Bouna, S10 = Téhini, S11 = Doropo).
Climate 10 00074 g006
Figure 7. Spatial distribution of the contribution of extremely wet days (R99pTOT) (%) per decade in the Zanzan region. Stations (S1 = Koun Fao, S2 = Kouassi-datékro, S3 = Tanda, S4 = Sandegué, S5 = Bondoukou, S6 = Nassian, S7 = Sapli, S8 = PN Comoé S1, S9 = Bouna, S10 = Téhini, S11 = Doropo).
Climate 10 00074 g007
Figure 8. Spatial distribution of number of cool days (TX10p) (%) per decade in Zanzan region. Stations (S1 = Koun Fao, S2 = Kouassi-datékro, S3 = Tanda, S4 = Sandegué, S5 = Bondoukou, S6 = Nassian, S7 = Sapli, S8 = PN Comoé S1, S9 = Bouna, S10 = Téhini, S11 = Doropo).
Climate 10 00074 g008
Figure 9. Spatial distribution of number of cold nights (TN10p) (%) per decade in Zanzan region. Stations (S1 = Koun Fao, S2 = Kouassi-datékro, S3 = Tanda, S4 = Sandegué, S5 = Bondoukou, S6 = Nassian, S7 = Sapli, S8 = PN Comoé S1, S9 = Bouna, S10 = Téhini, S11 = Doropo).
Climate 10 00074 g009
Figure 10. Spatial distribution of cold spell duration indicator (CSDI) (%) per decade in Zanzan region. Stations (S1 = Koun Fao, S2 = Kouassi-datékro, S3 = Tanda, S4 = Sandegué, S5 = Bondoukou, S6 = Nassian, S7 = Sapli, S8 = PN Comoé S1, S9 = Bouna, S10 = Téhini, S11 = Doropo).
Climate 10 00074 g010
Figure 11. Spatial distribution of number of hot days (TX90p) (%) per decade in Zanzan region. Stations (S1 = Koun Fao, S2 = Kouassi-datékro, S3 = Tanda, S4 = Sandegué, S5 = Bondoukou, S6 = Nassian, S7 = Sapli, S8 = PN Comoé S1, S9 = Bouna, S10 = Téhini, S11 = Doropo).
Climate 10 00074 g011
Figure 12. Spatial distribution of number of warm nights (TN90p) (%) per decade in Zanzan region. (S1 = Koun Fao, S2 = Kouassi-datékro, S3 = Tanda, S4 = Sandegué, S5 = Bondoukou, S6 = Nassian, S7 = Sapli, S8 = PN Comoé S1, S9 = Bouna, S10 = Téhini, S11 = Doropo).
Climate 10 00074 g012
Figure 13. Spatial distribution of warm spell duration indicator (WSDI) (days) per decade in Zanzan region. Stations (S1 = Koun Fao, S2 = Kouassi-datékro, S3 = Tanda, S4 = Sandegué, S5 = Bondoukou, S6 = Nassian, S7 = Sapli, S8 = PN Comoé S1, S9 = Bouna, S10 = Téhini, S11 = Doropo).
Climate 10 00074 g013
Table 1. Geolocation of the stations with the percentage of missing data.
Station NameElevation (m)Longitude (⁰W)Latitude (⁰N)Percentage (%) of Missing Data
TminTmaxPrecip.
Bondoukou286.62−2.798.040.30.62
Sapli283.55−2.898.594.54.46
Bouna288.64−2.999.27303.4
Doropo315.91−3.349.81457
Kouassi-datékro211.45−3.567.730.62.34.1
Koun Fao224.41−3.257.48000.3
Nassian241.9−3.648.436711
PN Comoé S1311.65−3.499.15000
PN Comoé S2284.6−4.049.38000
Sandegué242.1−3.778.013.14.68
Tanda263.51−3.167.8022.24
Téhini324.98−3.839.72000.2
Table 2. Pearson’s correlation coefficient (r) between the ground data (SODEXAM) and NASA POWER for the twelve stations.
Coefficient, r
Station NameTminTmaxPrecip.
Bondoukou0.980.970.86
Sapli0.960.960.95
Bouna0.970.970.96
Doropo0.980.990.98
Kouassi-datékro0.990.980.88
Koun Fao0.940.930.87
Nassian0.960.960.95
PN Comoé S10.950.960.97
PN Comoé S20.910.950.99
Sandegué0.970.970.88
Tanda0.980.960.94
Téhini0.960.970.96
Table 3. Indices of daily precipitation and temperature extremes and their descriptions as defined by ETCCDMI.
IndicesNamesDefinitionsUnits
Precipitations
PRCPTOTAnnual total precipitations PRSum of daily PR ≥ 1.0 mmmm
SDIIDaily precipitations (PR) intensityAnnual total PR divided by the number of wet days (when total PR ≥ 1.0 mm)mm/d
CDDConsecutive dry daysMaximum number of consecutive dry days (when PR < 1.0 mm)day
CWDConsecutive wet daysMaximum annual number of consecutive wet days (when PR ≥ 1.0 mm)day
R99pTotal annual PR from very heavy rain daysAnnual sum of daily PR > 99th percentilemm
R99pTOTContribution from extremely wet days 100   × R 99 p / PRCPTOT %
Temperatures
TX10pNumber of cool daysPercentage of days when TX < 10th percentile%
TN10PNumber of cold nightsPercentage of days when TN < 10th percentile%
TX90pNumber of hot daysPercentage of days when TX > 90th percentile%
TN90pNumber of warm nightsPercentage of days when TN > 90th percentile%
WSDIWarm spell duration indicatorAnnual number of days contributing to events where 6 or more consecutive days experience TX > 90th percentileday
CSDICold spell duration indicatorAnnual number of days contributing to events where 6 or more consecutive days experience TN < 10th percentileday
Table 4. Mann–Kendall (Z) trend test statistics and Sen’s slope (S) of extreme precipitation indices from 1981 to 2020 for the twelve stations.
Station NamePRCPTOTSDIICWDCDDR99pR99pTOT
ZSZSZSZSZSZS
Bondoukou−1.11−3.82−0.66−0.01−3.00 *−0.770.830.271.120.261.310.05
Sapli−1.20−3.28−0.41−0.01−2.87 *−0.681.290.410.880.171.140.04
Bouna−0.78−1.88−0.20−0.00−1.85−0.440.900.350.770.001.060.01
Doropo0.641.231.080.01−1.39−0.332.18 *0.890.850.091.110.03
Kouassi-datékro−1.27−4.51−0.94−0.03−2.74 *−0.580.000.000.520.010.680.01
Koun Fao−0.38−1.22−0.36−0.01−1.89−0.52−0.110.000.850.050.940.02
Nassian−1.36−3.75−1.08−0.01−1.80−0.291.290.400.560.000.560.00
PN Comoé S1−0.62−1.34−0.36−0.01−1.29−0.221.330.440.310.000.540.00
PN Comoé S2−0.78−2.26−0.64−0.01−1.12−0.221.780.650.210.000.420.00
Sandegué−1.57−4.15−0.90−0.02−1.17−0.220.990.350.340.000.340.00
Tanda−0.69−2.60−0.64−0.01−1.94−0.57−0.030.001.060.231.040.05
Téhini0.220.490.850.01−1.07−0.221.390.551.060.611.320.08
* Trends that are statistically significant at the 5% level; positive (+)/negative (−) values imply an increasing/decreasing trend respectively.
Table 5. Mann–Kendall (Z) trend test statistics and Sen’s slope (S) of extreme precipitation indices from 1981 to 2020 for the twelve stations.
STATION NAMETX10PTN10PTX90PTN90PWSDICSDI
ZSZSZSZSZSZS
BONDOUKOU−3.40 *−0.26−4.84 *−0.371.430.124.31 *0.380.820.17−4.45 *−1.00
SAPLI−4.54 *−0.37−2.90 *−0.203.72 *0.341.670.162.77 *0.62−2.39 *−0.40
BOUNA−1.99 *−0.15−3.81 *−0.291.550.153.23 *0.341.530.34−3.42 *−0.62
DOROPO−0.17−0.02−2.67 *−0.220.790.072.33 *0.190.770.17−2.57 *−0.55
KOUASSI-DATéKRO−2.50 *−0.15−4.03 *−0.311.150.113.95 *0.350.830.21−3.59 *−0.78
KOUN FAO−1.39−0.11−3.62 *−0.310.230.033.55 *0.300.130.00−3.72 *−0.67
NASSIAN−3.25 *−0.23−3.97 *−0.321.900.174.23 *0.351.730.30−3.92 *−0.77
PN COMOé S1−1.48−0.13−3.30 *−0.261.460.122.90 *0.271.350.24−3.05 *−0.56
PN COMOé S2−2.13 *−0.16−3.50 *−0.291.350.152.69 *0.251.340.29−3.21 *−0.67
SANDEGUé−3.32 *−0.23−3.93 *−0.322.13 *0.194.23 *0.372.08 *0.37−3.82 *−0.77
TANDA−2.50 *−0.15−3.86 *−0.320.860.083.97 *0.360.440.11−3.33 *−0.76
TéHINI−0.90−0.07−2.95 *−0.440.790.082.60 *0.230.720.17−2.82 *−0.50
* Trends that are statistically significant at the 5% level; positive (+)/negative (−) values imply an increasing/decreasing trend, respectively.
Publisher’s Note: MDPI stays neutral with regard to jurisdictional claims in published maps and institutional affiliations.

