
Mini Containers to Improve the Cold Chain Energy Efficiency and Carbon Footprint

 , and
, and
Abstract
:1. Introduction
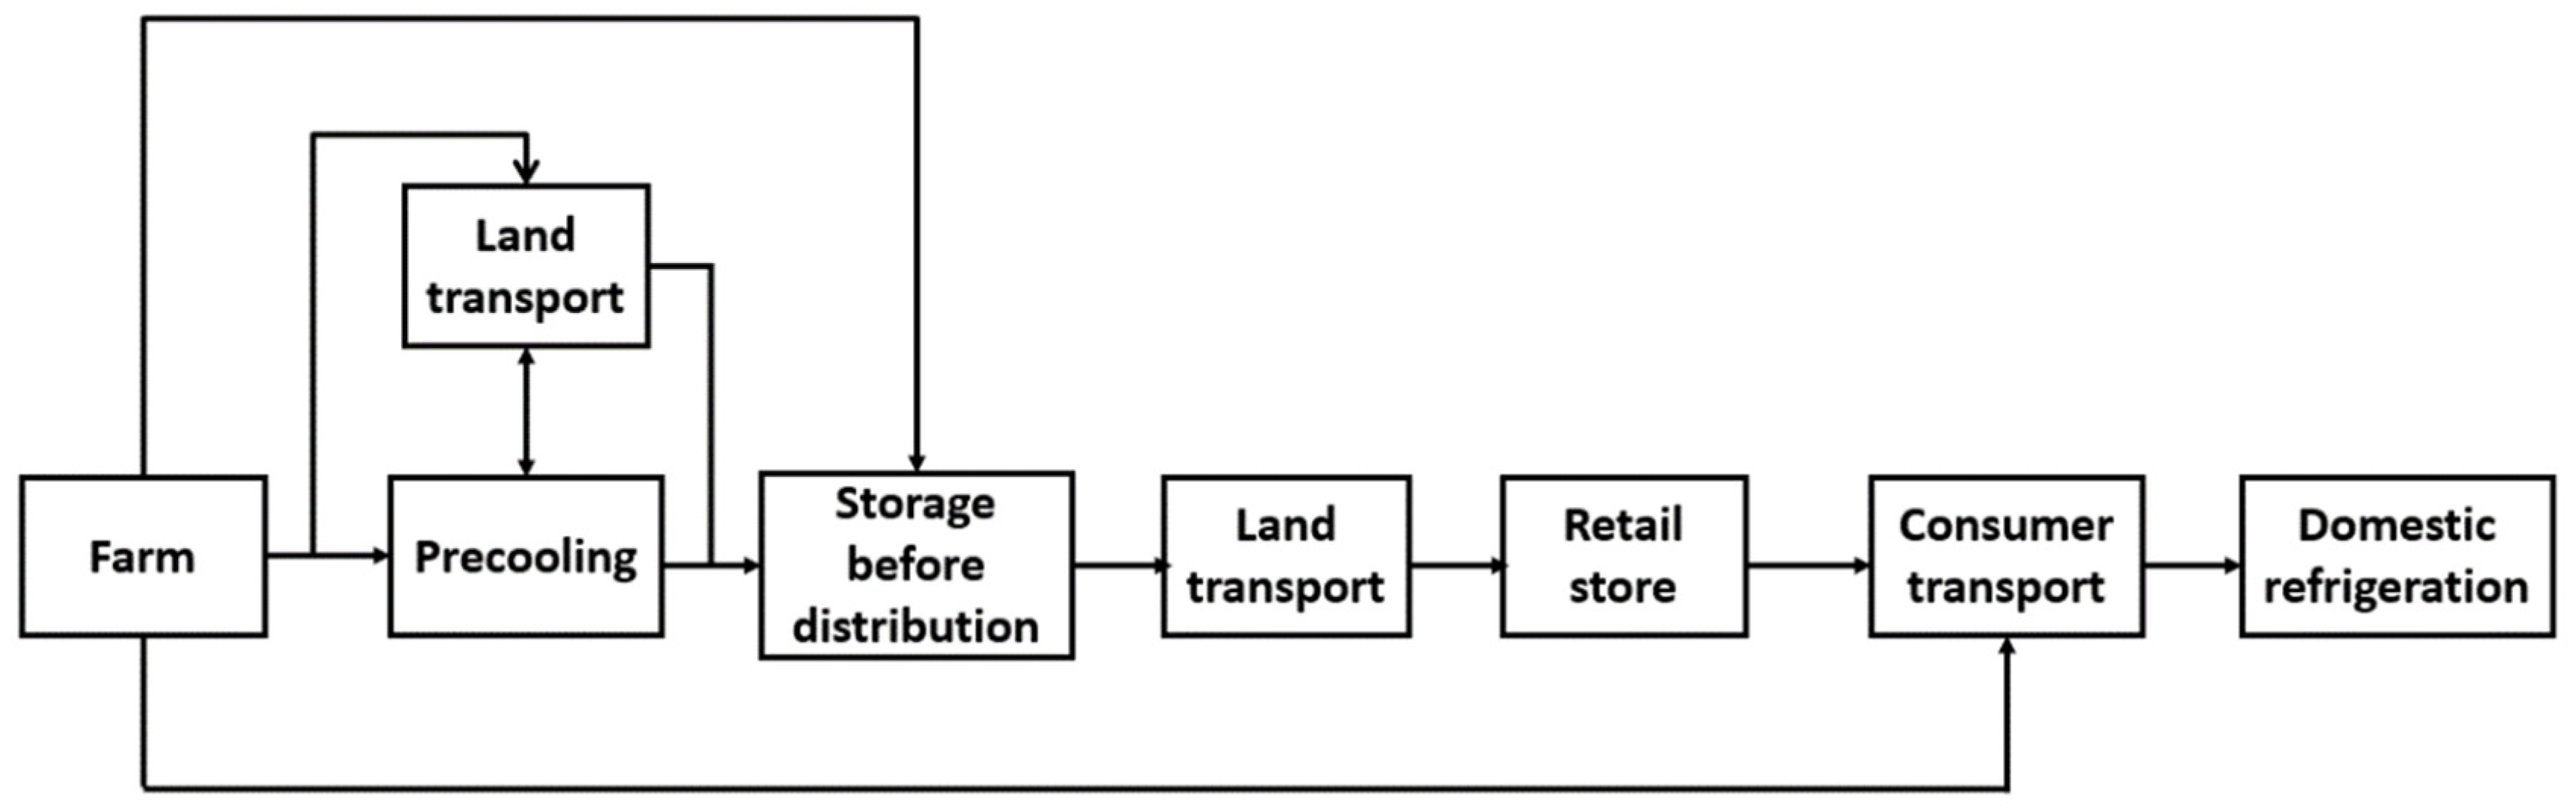
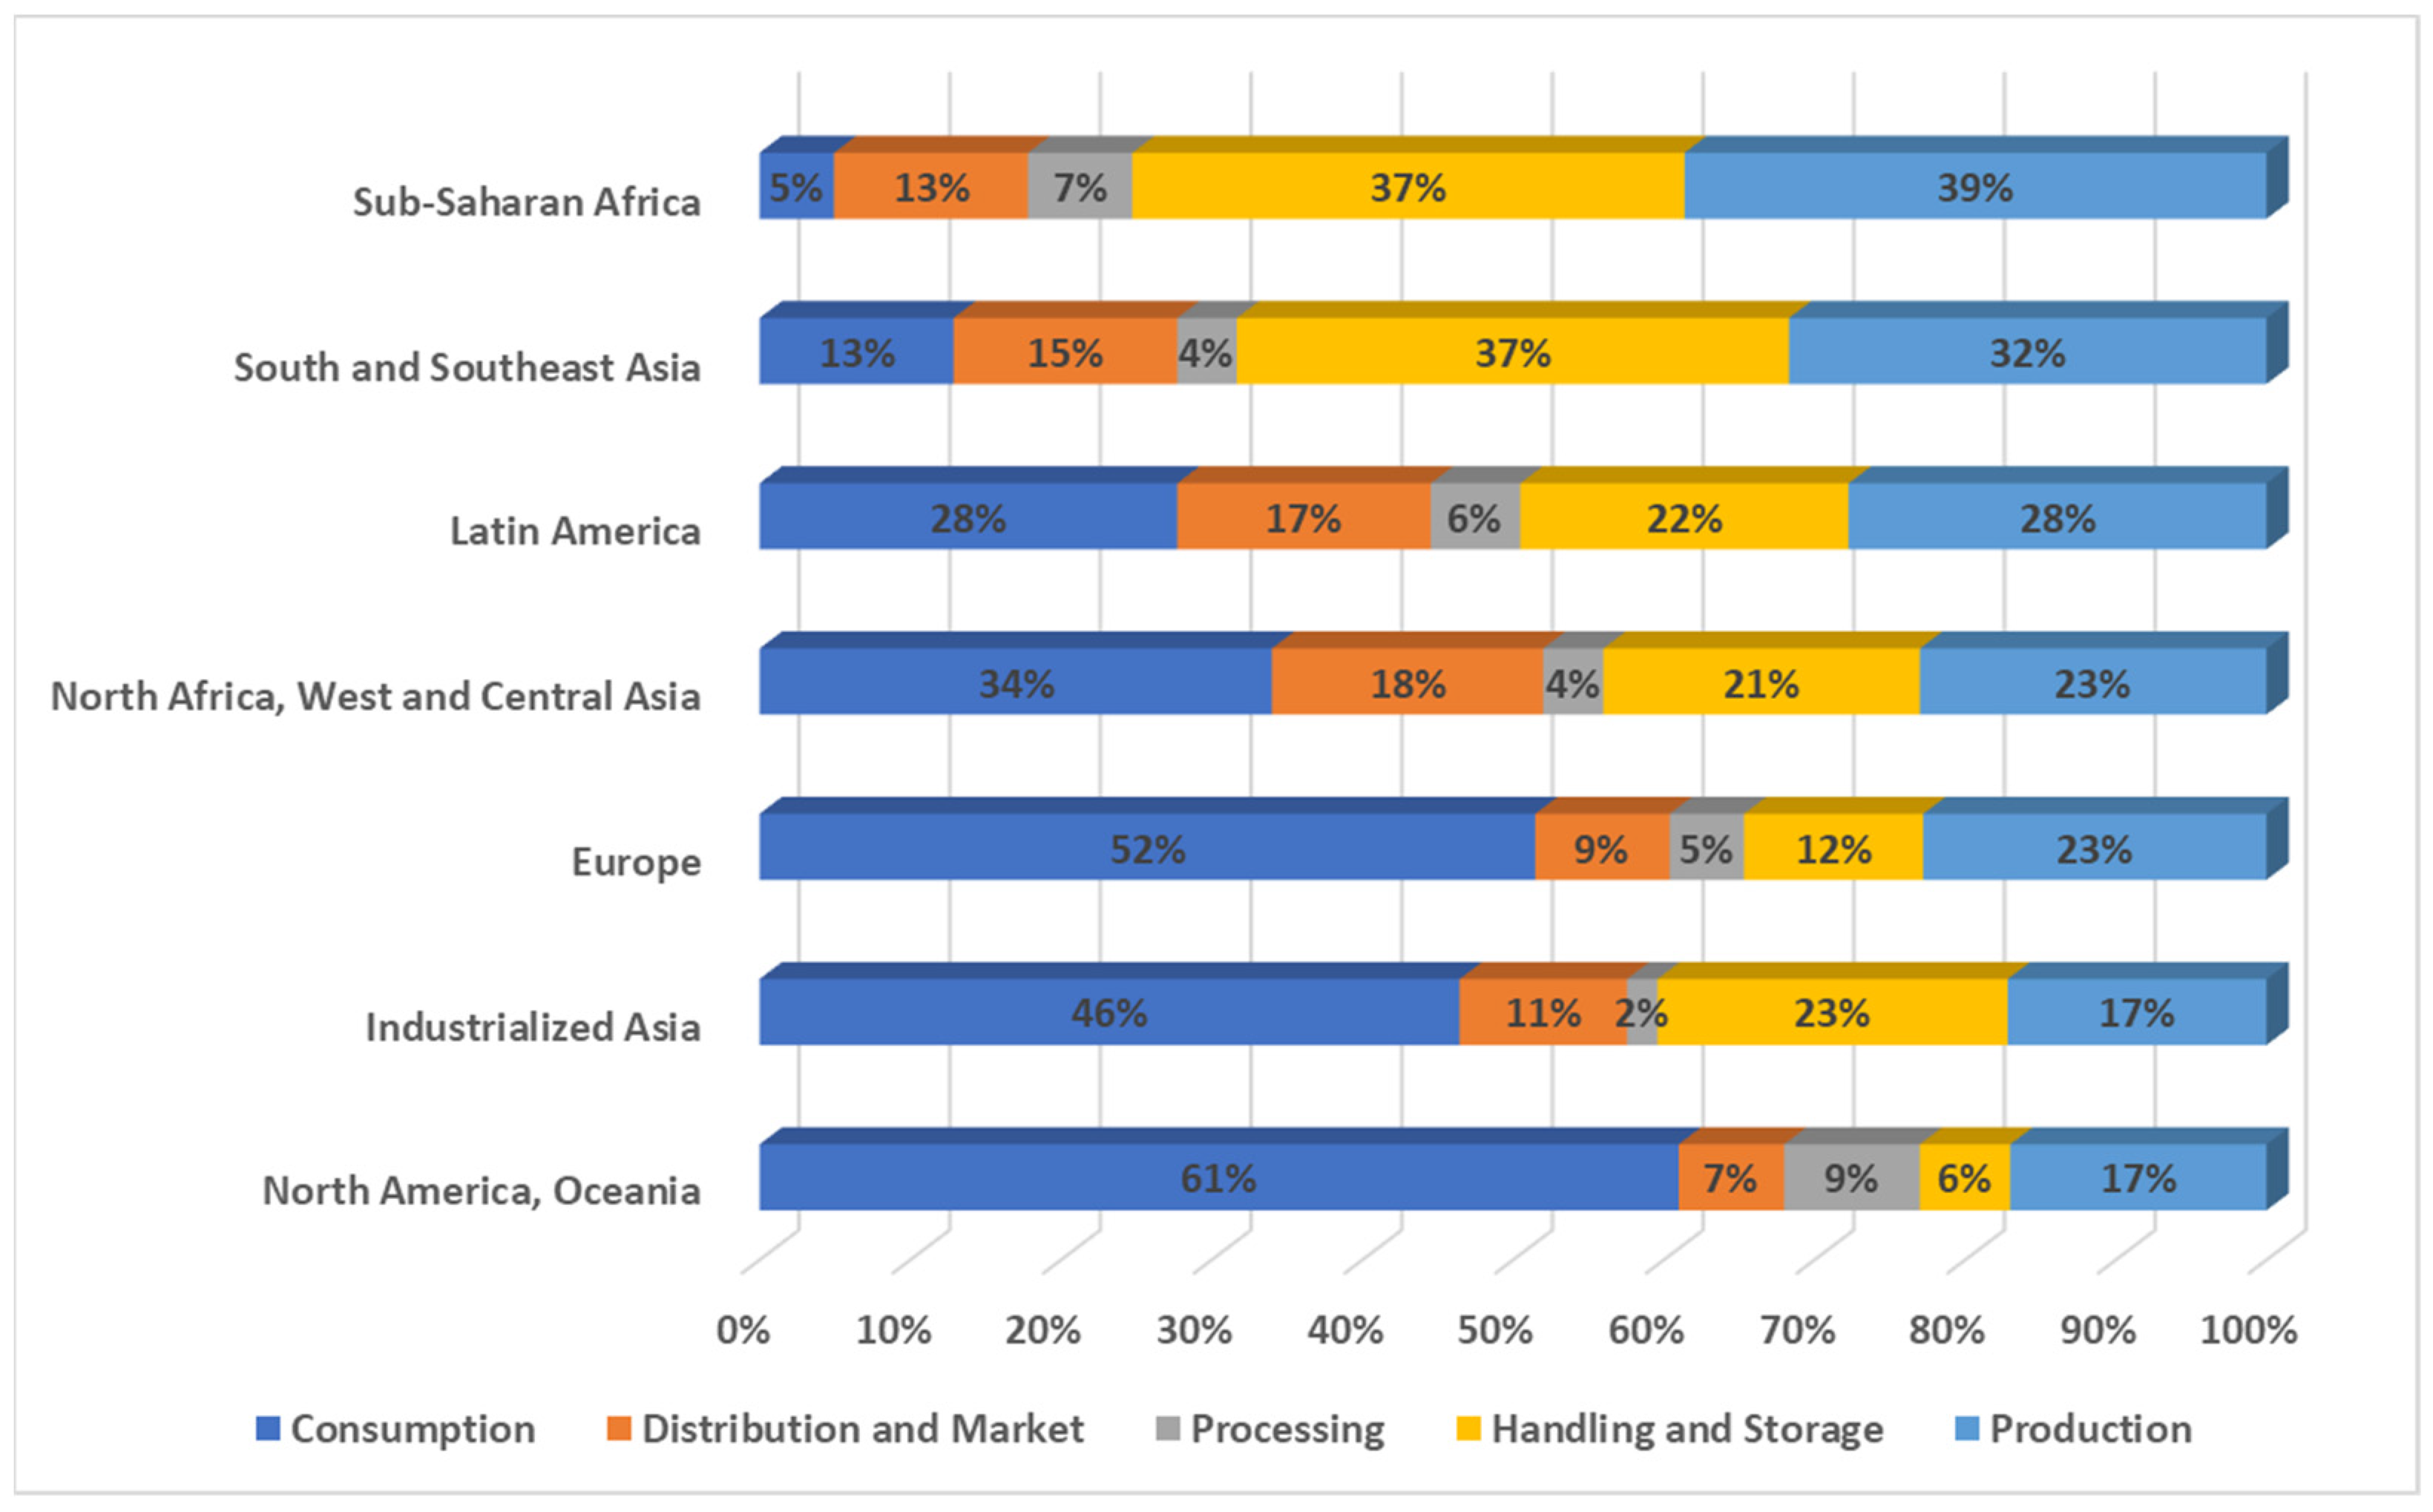
2. Background
Post-harvest Technologies
3. Methods
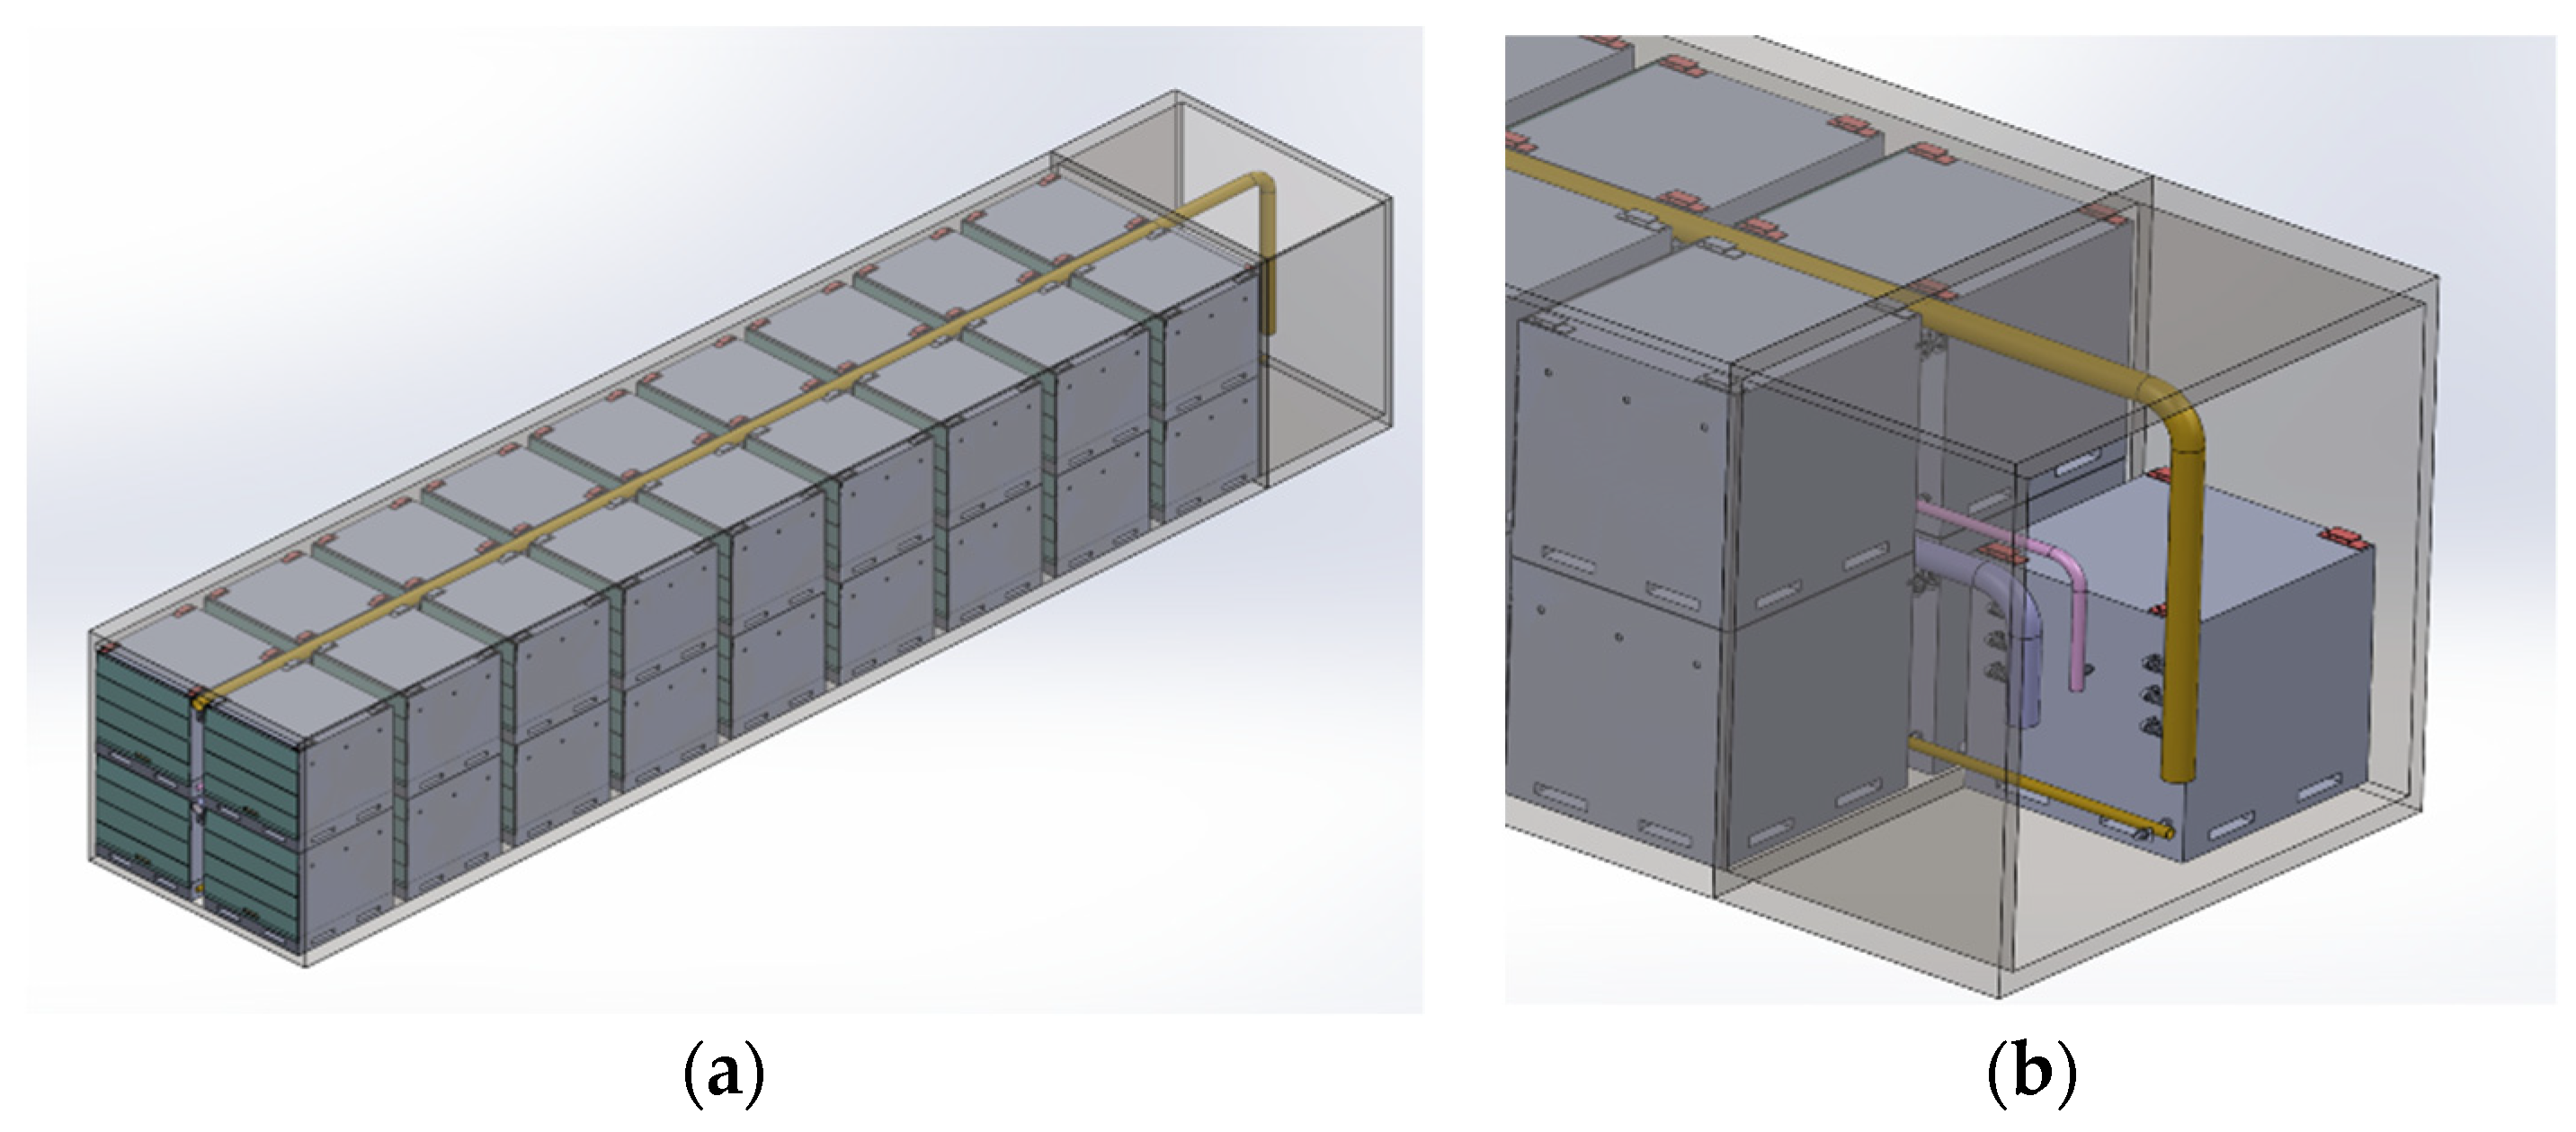
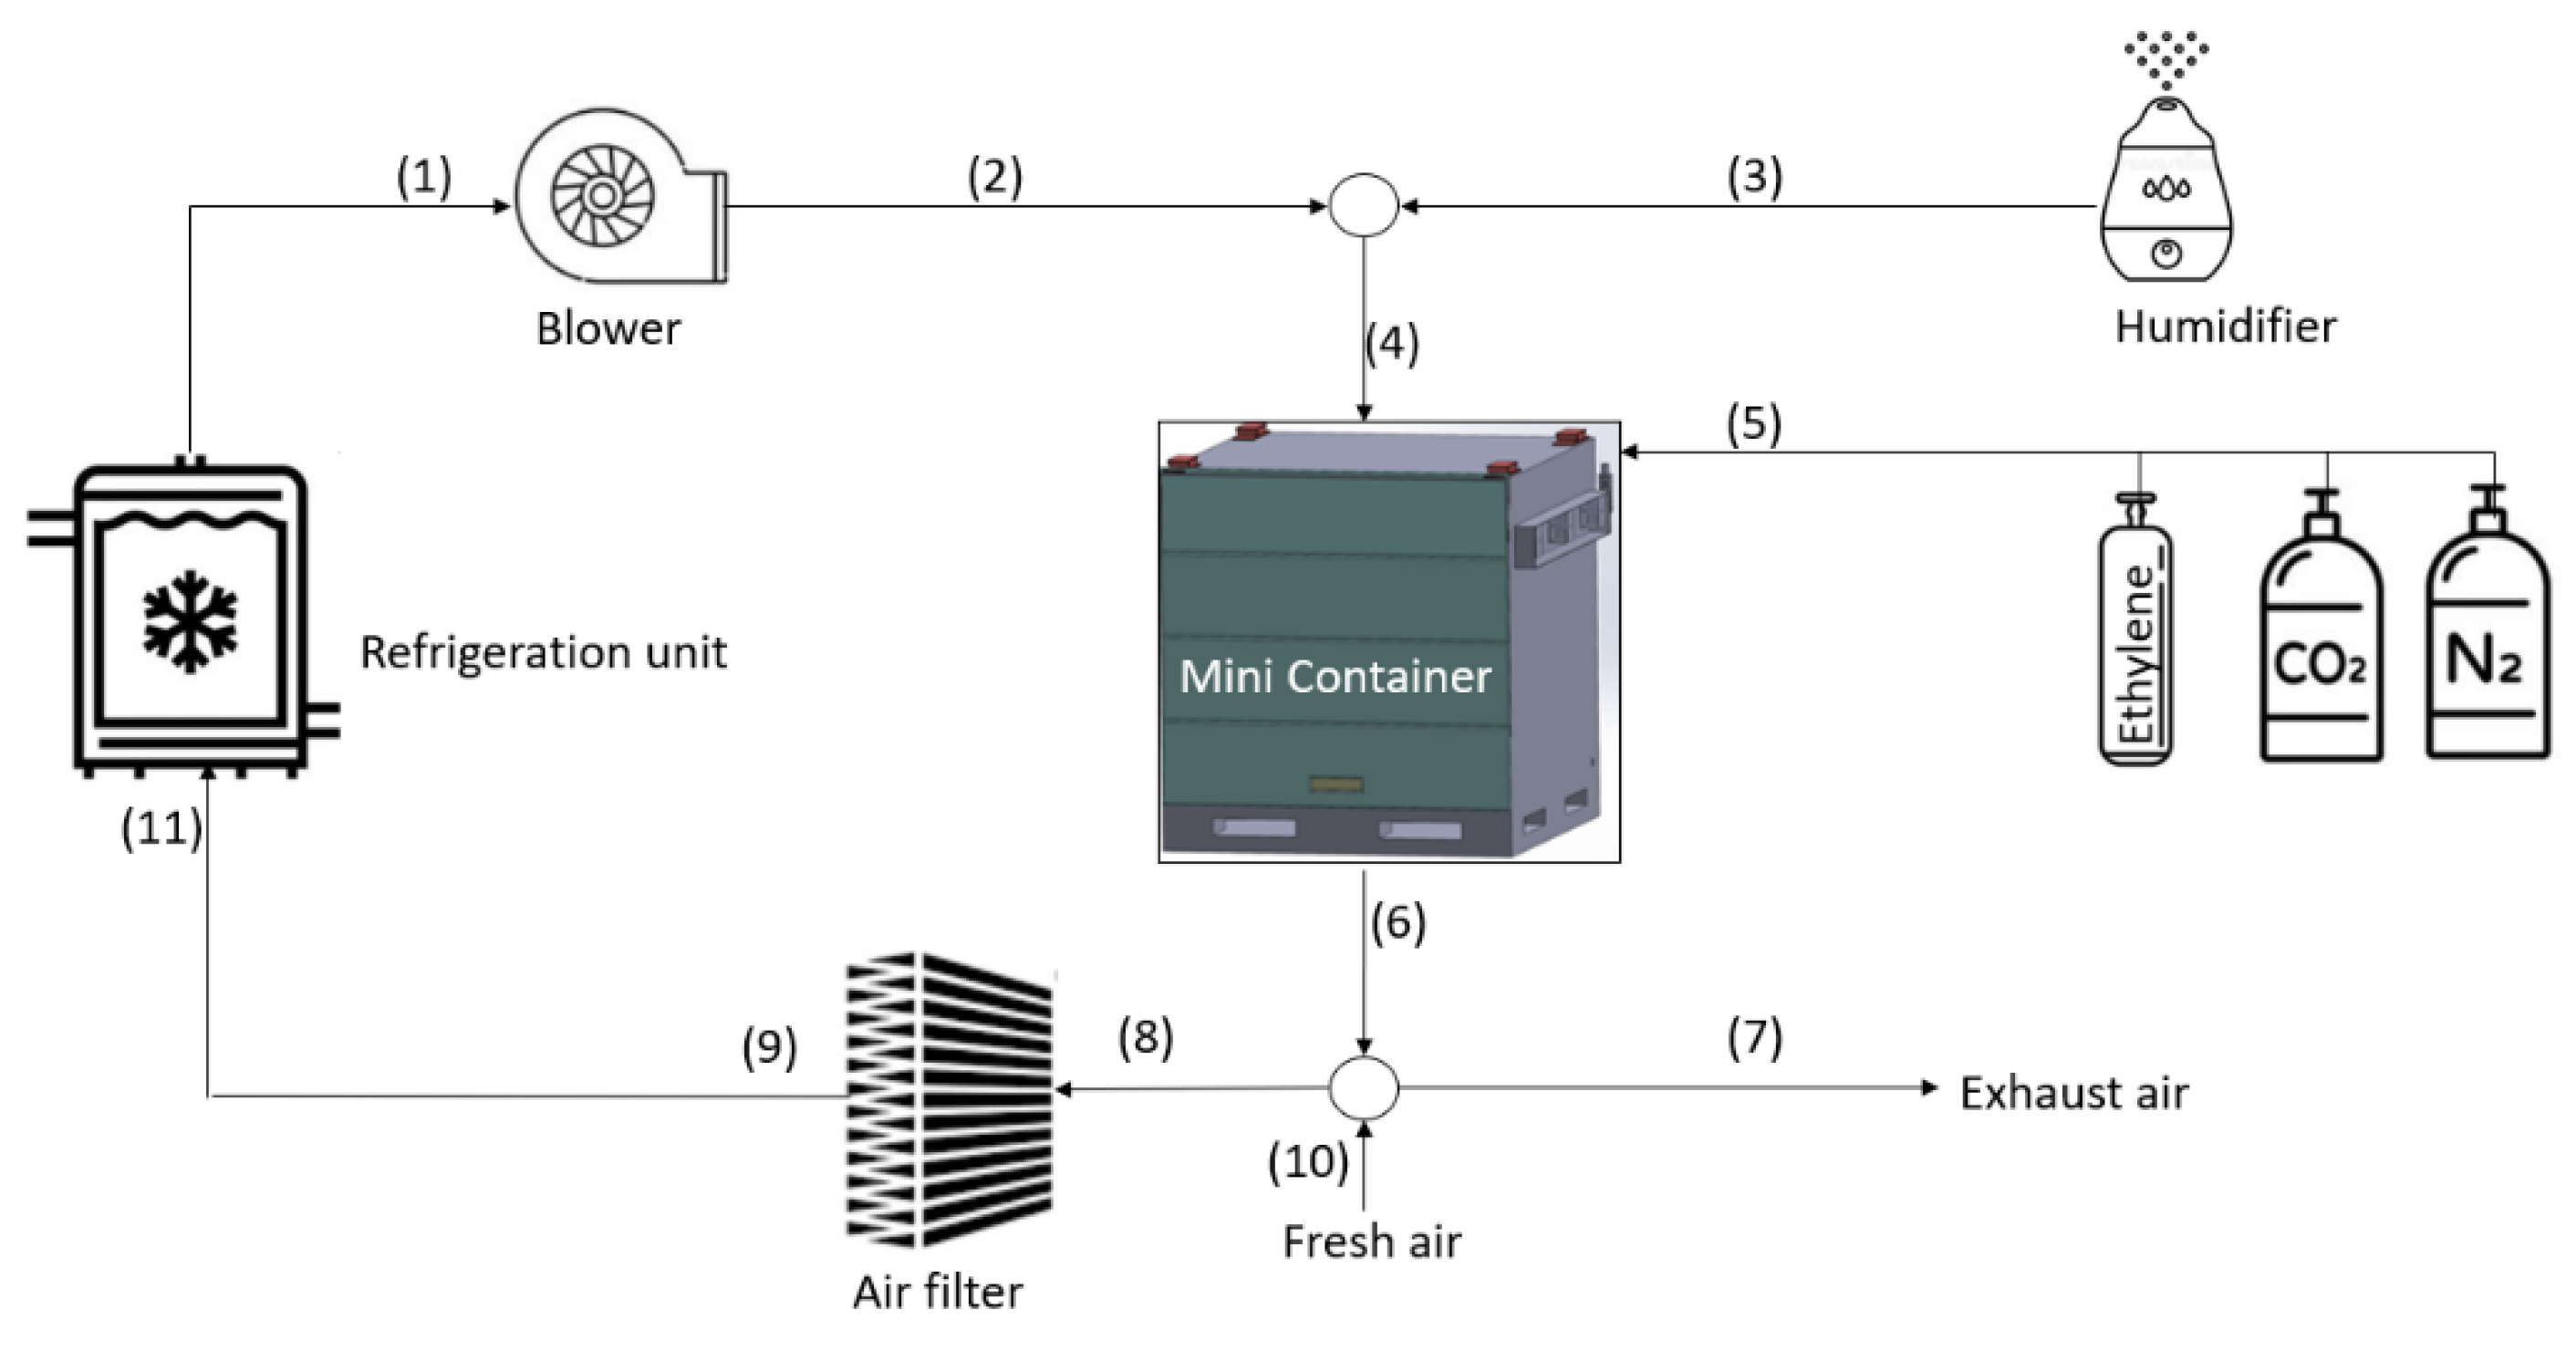
3.1. Mini Containers
3.2. Heat Loads and CO2 Generation Calculations
4. Results
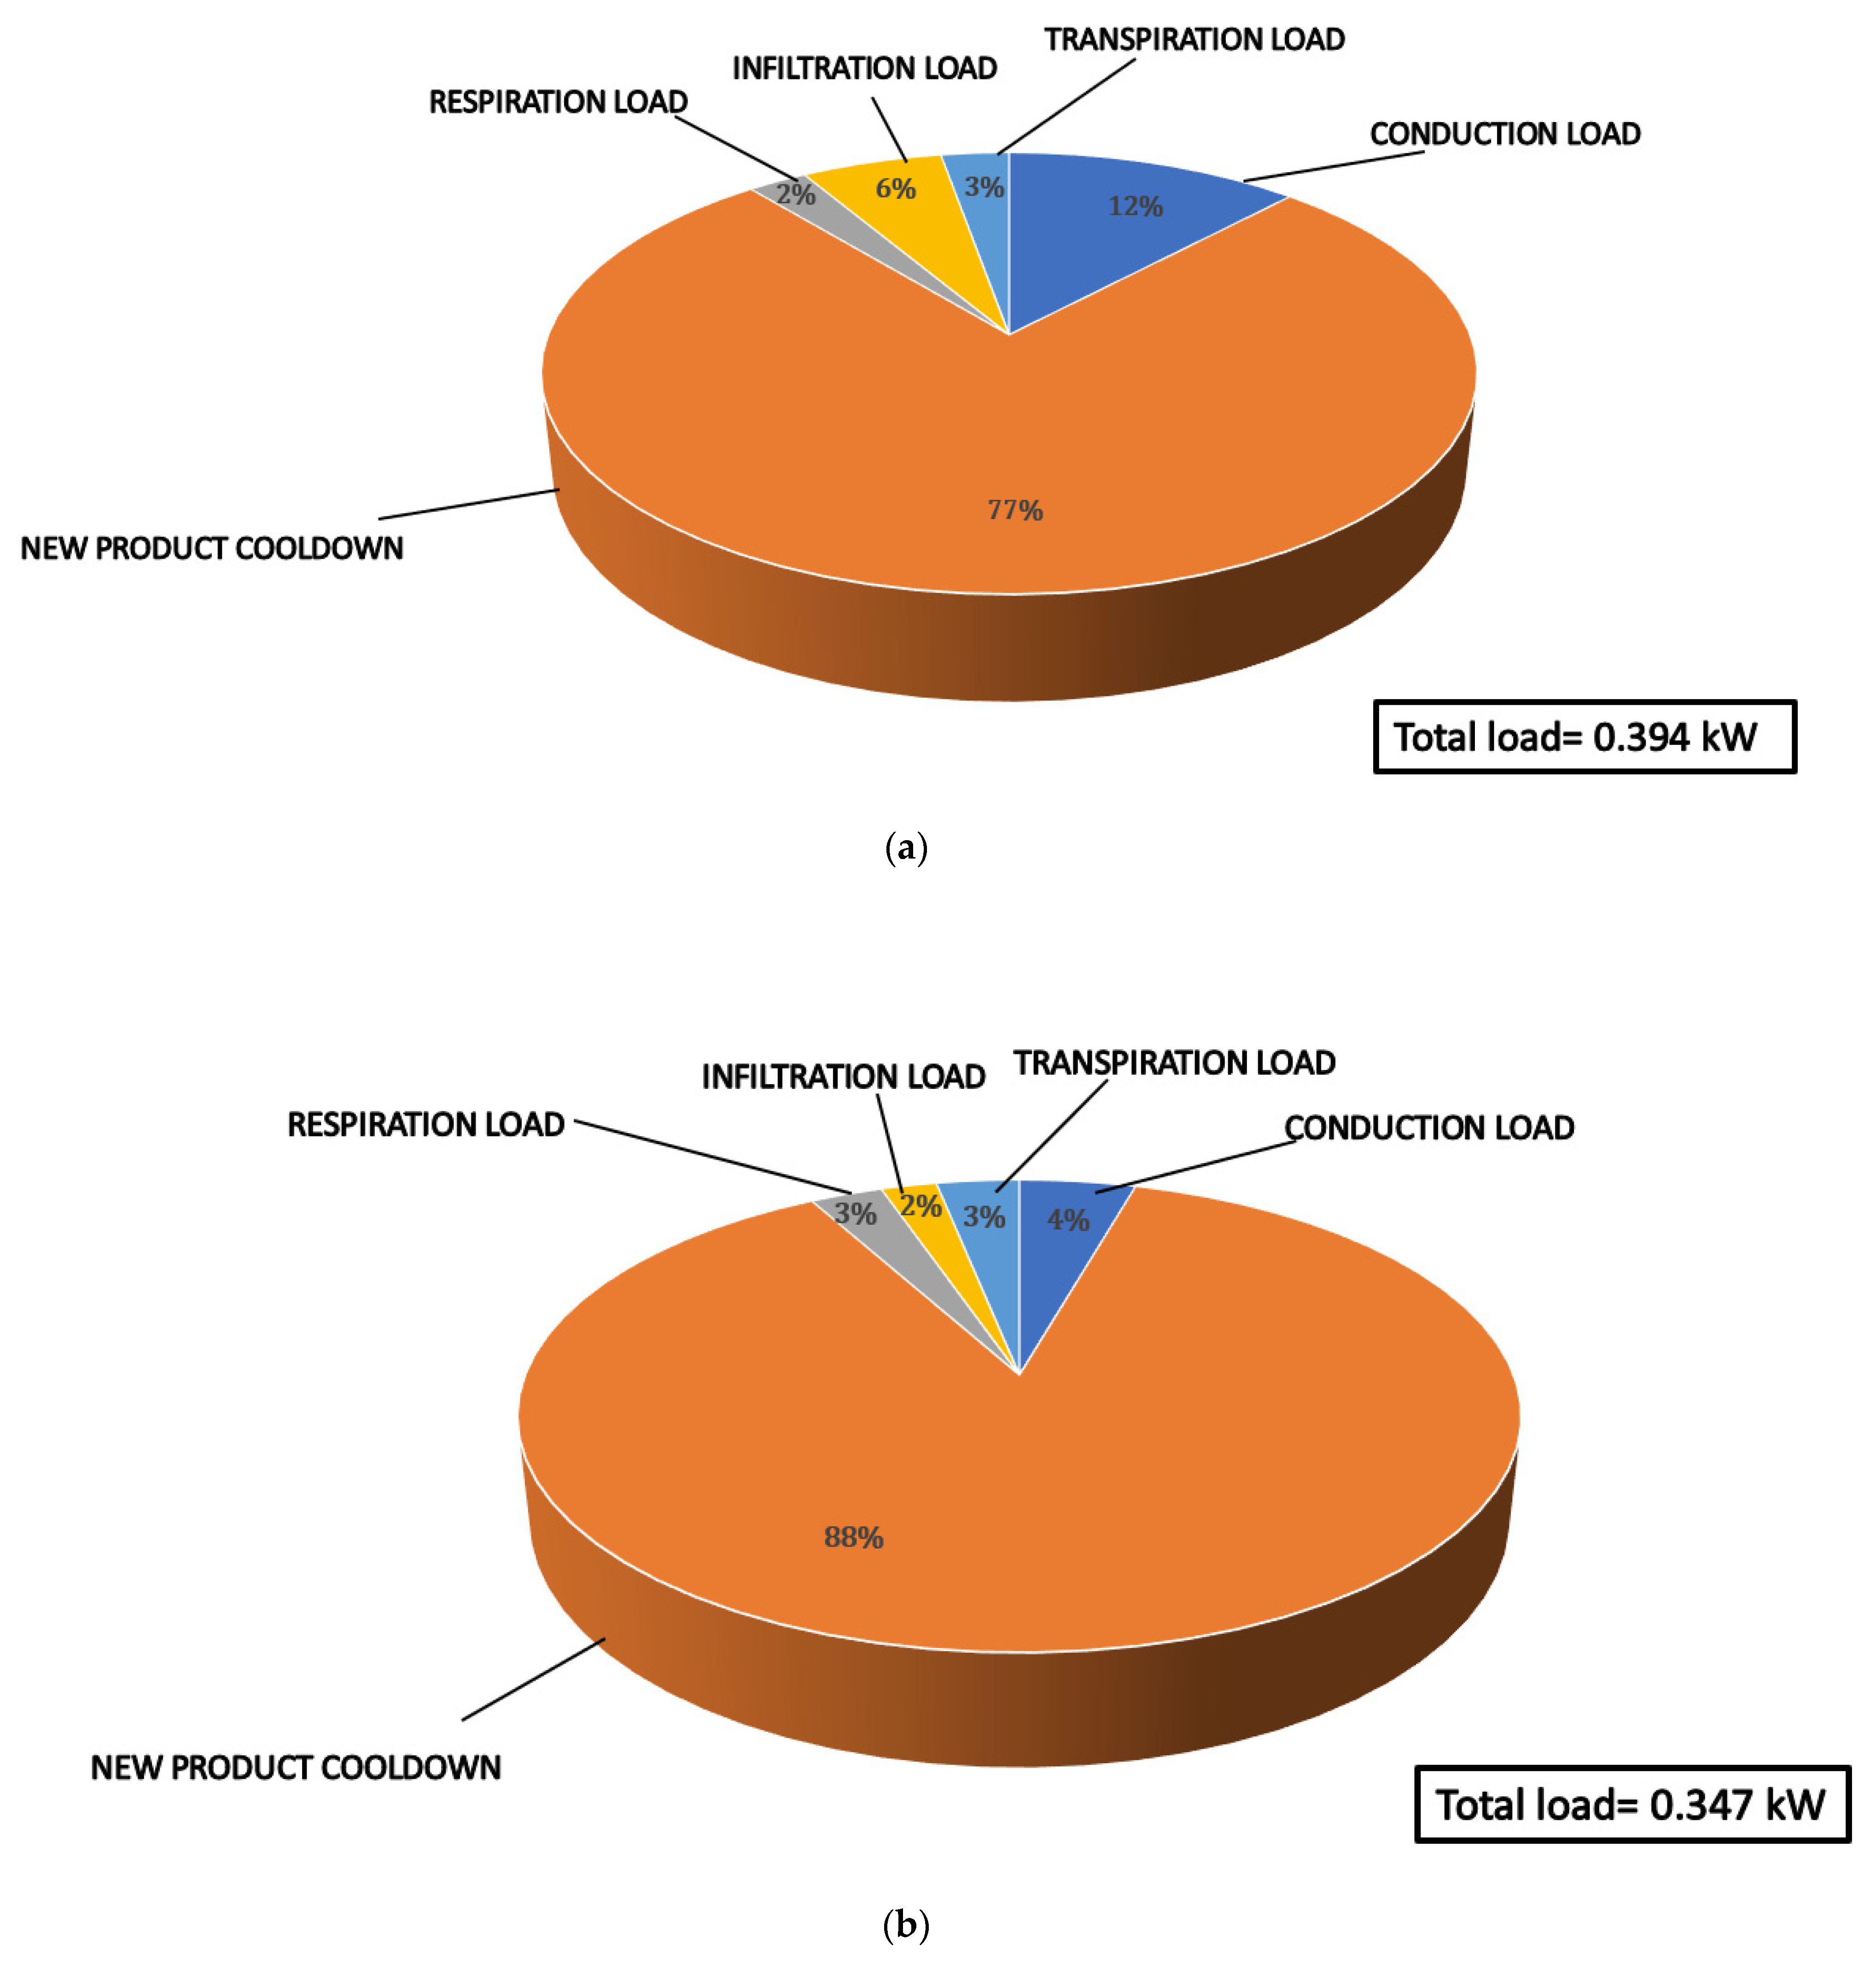
4.1. Heat Load Distribution for Phoenix, AZ, and Chicago, IL
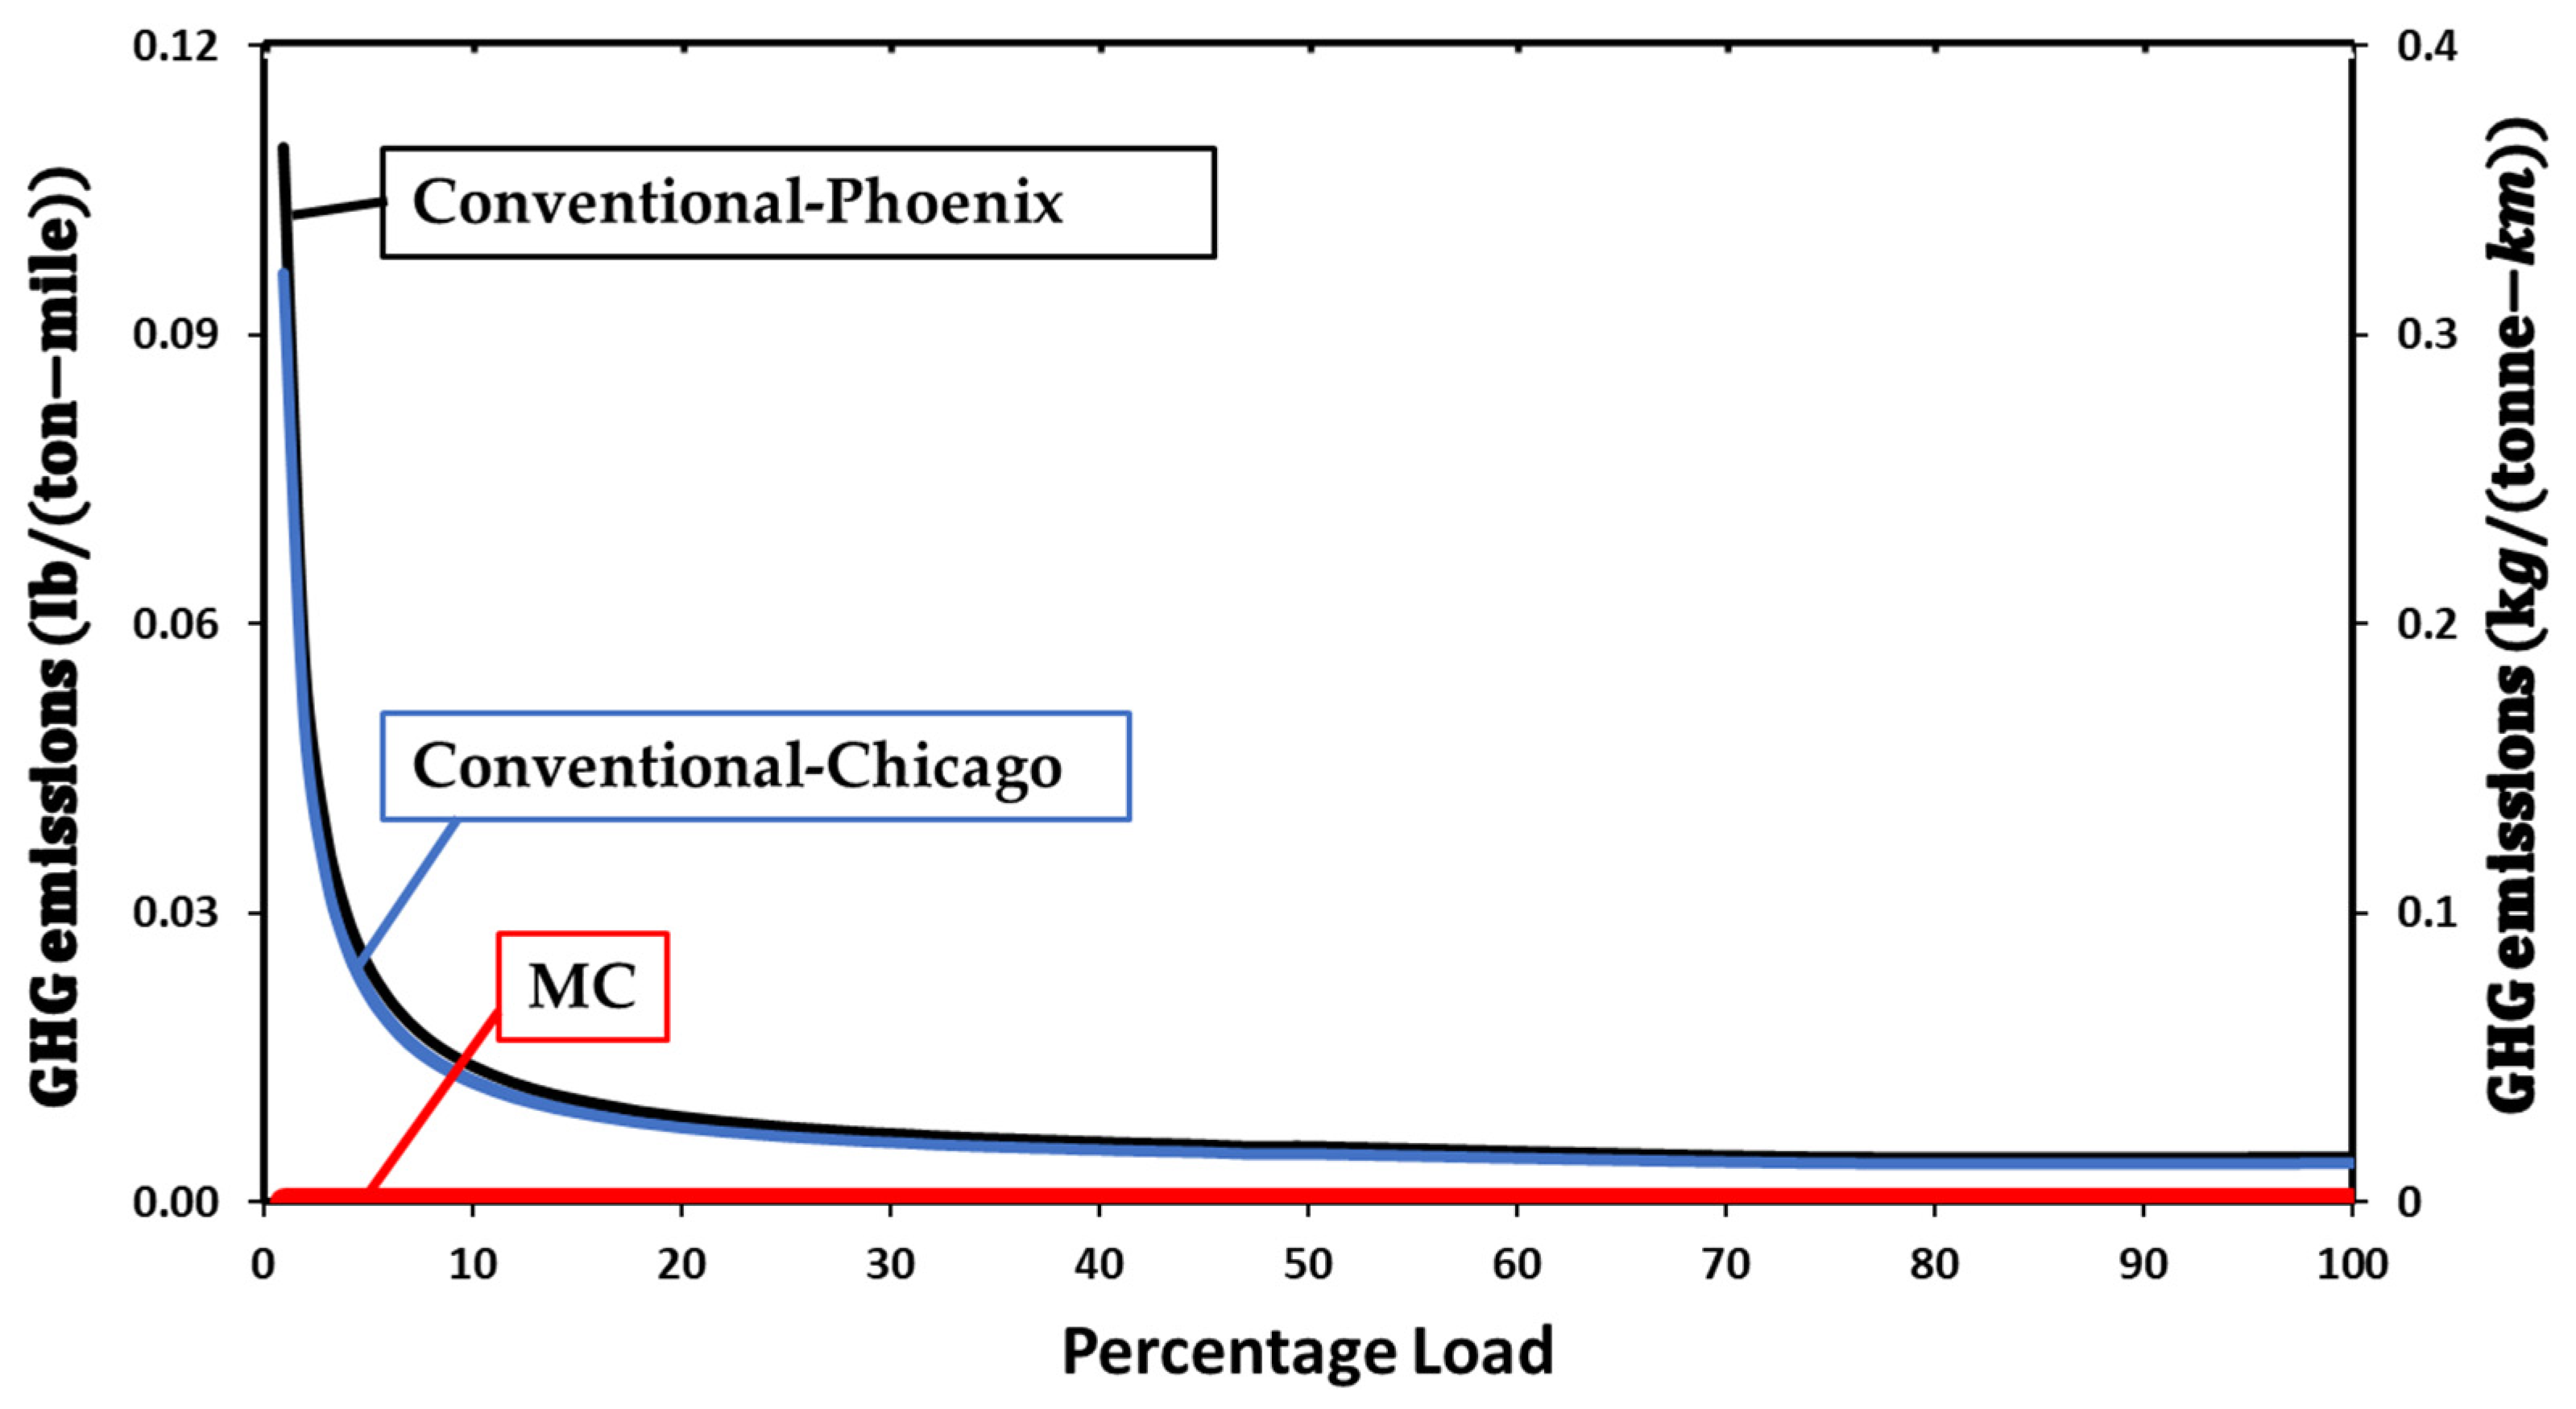
4.2. Energy Consumption and GHG Emissions
5. Conclusions
Author Contributions
Funding
Data Availability Statement
Conflicts of Interest
Nomenclature
| Area over which the heat transfer occurs | |
| COP | Coefficient of performance |
| Specific heat of ambient air | |
| Specific heat of the product | |
| f, g | Respiration coefficients for tomatoes (-) |
| hfg | |
| Mass of the product | |
| Psat | |
| RH | Relative humidity (-) |
| t | Time needed for cooling the product to the desired Storage temperature (h). |
| Dry-bulb temperature of the ambient air (°C) | |
| Dry-bulb temperature of the air inside the MC (°C) | |
| Dry-bulb temperature difference between the ambient and inside the MC (°C) | |
| Density of ambient air |
References
- Etemadnia, H.; Goetz, S.J.; Canning, P.; Tavallali, M.S. Optimal wholesale facilities location within the fruit and vegetables supply chain with bimodal transportation options: An LP-MIP heuristic approach. Eur. J. Oper. Res. 2015, 244, 648–661. [Google Scholar] [CrossRef]
- Tsai, K.-M.; Pawar, K.S. Special Issue on Next-Generation Cold Supply Chain Management: Research, Applications and Challenges. Int. J. Logist. Manag. 2018, 29, 786–791. [Google Scholar] [CrossRef] [Green Version]
- James, S.J.; James, C. The food cold-chain and climate change. Food Res. Int. 2010, 43, 1944–1956. [Google Scholar] [CrossRef]
- Zhao, H.; Liu, S.; Tian, C.; Yan, G.; Wang, D. An overview of current status of cold chain in China. Int. J. Refrig. 2018, 88, 483–495. [Google Scholar] [CrossRef]
- Soussana, J.-F. Research priorities for sustainable agri-food systems and life cycle assessment. J. Clean. Prod. 2014, 73, 19–23. [Google Scholar] [CrossRef]
- Global Food Losses and Food Waste. Available online: http://www.fao.org/3/mb060e/mb060e00.htm (accessed on 14 September 2021).
- The Role of Refrigeration in Worldwide Nutrition—Cool Coalition. Available online: https://coolcoalition.org/the-role-of-refrigeration-in-worldwide-nutrition/ (accessed on 14 September 2021).
- Repice, C.; Stumpf, A. Energy Efficiency in Transport Refrigeration. Available online: https://iifiir.org/en/fridoc/energy-efficiency-in-transport-refrigeration-130158 (accessed on 14 September 2021).
- Zilio, C. Moving toward sustainability in refrigeration applications for refrigerated warehouses. HVACR Res. 2014, 20, 1–2. [Google Scholar] [CrossRef] [Green Version]
- Gogou, E.; Katsaros, G.; Derens, E.; Alvarez, G.; Taoukis, P.S. Cold chain database development and application as a tool for the cold chain management and food quality evaluation. Int. J. Refrig. 2015, 52, 109–121. [Google Scholar] [CrossRef]
- Tilman, D.; Balzer, C.; Hill, J.; Befort, B.L. Global food demand and the sustainable intensification of agriculture. Proc. Natl. Acad. Sci. USA 2011, 108, 20260–20264. [Google Scholar] [CrossRef] [Green Version]
- Morris, K.J.; Kamarulzaman, N.H.; Morris, K.I. Small-scale postharvest practices among plantain farmers and traders: A potential for reducing losses in rivers state, Nigeria. Sci. Afr. 2019, 4, e00086. [Google Scholar] [CrossRef]
- Arias Bustos, C.; Moors, E.H.M. Reducing post-harvest food losses through innovative collaboration: Insights from the Colombian and Mexican avocado supply chains. J. Clean. Prod. 2018, 199, 1020–1034. [Google Scholar] [CrossRef] [Green Version]
- Lundqvist, J.; Fraiture, C.; Molden, D.; Berndes, G.; Berntell, A.; Falkenmark, M. Saving Water: From Field to Fork: Curbing Losses and Wastage in the Food Chain; Draft for CDS, May 2008. SIWI Paper 13; Stiftelsen Stockholm International Water Institute: Stockholm, Sweden, 2008; pp. 5–6. [Google Scholar]
- Office of Assistant Director-General (Natural Resources Management and Environment Department). Food Wastage Footprint Impact on Natural Resources: Summary Report; FAO: Rome, Italy, 2013. [Google Scholar]
- dos Santos, S.F.; de Cardoso, R.C.V.; Borges, Í.M.P.; e Almeida, A.C.; Andrade, E.S.; Ferreira, I.O.; do Ramos, L.C. Post-harvest losses of fruits and vegetables in supply centers in Salvador, Brazil: Analysis of determinants, volumes and reduction strategies. Waste Manag. 2020, 101, 161–170. [Google Scholar] [CrossRef] [PubMed]
- Godfray, H.C.J.; Beddington, J.R.; Crute, I.R.; Haddad, L.; Lawrence, D.; Muir, J.F.; Pretty, J.; Robinson, S.; Thomas, S.M.; Toulmin, C. Food Security: The Challenge of Feeding 9 Billion People. Science 2010, 327, 812–818. [Google Scholar] [CrossRef] [PubMed] [Green Version]
- Nellemann, C. The Environmental Food Crisis: The Environment’s Role in Averting Future Food Crises: A UNEP Rapid Response Assessment; United Nations Environment Programme, GRID--Arendal, Eds.; UNEP: Arendal, Norway, 2009; ISBN 978-82-7701-054-0. [Google Scholar]
- Kantor, L.S.; Lipton, K.; Manchester, A.; Oliveira, V. Estimating and Addressing America’s Food Losses. Food Rev. Natl. Food Rev. 1997, 20, 2–12. [Google Scholar]
- Mampholo, B.M.; Sivakumar, D.; Thompson, A.K. Maintaining overall quality of fresh traditional leafy vegetables of Southern Africa during the postharvest chain. Food Rev. Int. 2016, 32, 400–416. [Google Scholar] [CrossRef]
- Bradford, K.J.; Dahal, P.; Van Asbrouck, J.; Kunusoth, K.; Bello, P.; Thompson, J.; Wu, F. The dry chain: Reducing postharvest losses and improving food safety in humid climates. Trends Food Sci. Technol. 2018, 71, 84–93. [Google Scholar] [CrossRef]
- Canadian Food Inspection Agency (Government of Canada). Food Safety Enhancement Program. Available online: https://inspection.canada.ca/food-safety-for-industry/archived-food-guidance/safe-food-production-systems/food-safety-enhancement-program/eng/1299855874288/1299859914238 (accessed on 14 September 2021).
- Gustavsson, J.; Cederberg, C.; Sonesson, U.; van Otterdijk, R.; Meybeck, A. Global Food Losses and Food Waste: Extent, Causes and Prevention; Food and Agriculture Organization of the United Nations (FAO): Rome, Italy, 2011; pp. 4–10. [Google Scholar]
- Heap, R. Refrigerated Transport: Progress Achieved and Challenges to Be Met, 16th Informatory Note on Refrigerating Technologies. Available online: https://iifiir.org/en/fridoc/refrigerated-transport-progress-achieved-and-challenges-to-be-met-123990 (accessed on 14 September 2021).
- LeBlanc, D. Land transportation of fresh fruits and vegetables: An update. Stewart Postharvest Rev. 2005, 1, 1–7. [Google Scholar] [CrossRef]
- What is Reefer in Shipping Terms? Available online: https://www.porttechnology.org/news/what-is-reefer-in-shipping-terms/ (accessed on 28 March 2022).
- Villalobos, J.R. Systems, Methods, and Apparatuses for Implementing Aggregable, Environment-Controlled Minicontainers for the Efficient Logistics of Perishable Products. U.S. Patent PCT/US21/37432, 15 June 2021. [Google Scholar]
- Bagheri, F.; Fayazbakhsh, M.A.; Bahrami, M. Real-time performance evaluation and potential GHG reduction in refrigerated trailers. Int. J. Refrig. 2017, 73, 24–38. [Google Scholar] [CrossRef]
- Sacks, R.; Yi, S.S.; Nonas, C. Increasing Access to Fruits and Vegetables: Perspectives From the New York City Experience. Am. J. Public Health 2015, 105, e29–e37. [Google Scholar] [CrossRef] [Green Version]
- John, F.M.; Patrick, O.A.; Moses, S.A. Effect of maturity stage on quality and shelf life of tomato (lycopersicon esculentum mill) using refrigerator storage system. Eurasian J. Agric. Res. 2020, 4, 22. [Google Scholar]
- FAOSTAT. Available online: http://www.fao.org/faostat/en/#home (accessed on 14 September 2021).
- Ask IFAS—Powered by EDIS. Available online: https://edis.ifas.ufl.edu/ (accessed on 14 September 2021).
- Available online: https://AshraeChapter19ThermalPropertiesofFoods.pdf (accessed on 28 March 2022).
- Becker, B.R. Transpiration and Respiration of Fruits and Vegetables. In Proceedings of the Meeting of Commission C2 with Commissions B2, D1 and D2-3, of the International Institute of Refrigeration, Lexington, KY, USA, 2–4 October 1996; Institut International du Froid: Paris, France, 1996. ISBN 0-929355-80-6. [Google Scholar]
- Ingersoll-Rand Company. Genuine Parts Catalog. The Finest Parts Engineered with Unmatched Quality and Reliability; Termo King, 2010; Available online: http://www.thermoking.comp (accessed on 28 March 2022).
- Lafaye de Micheaux, T.; Ducoulombier, M.; Moureh, J.; Sartre, V.; Bonjour, J. Experimental and numerical investigation of the infiltration heat load during the opening of a refrigerated truck body. Int. J. Refrig. 2015, 54, 170–189. [Google Scholar] [CrossRef]
- Tassou, S.A.; De-Lille, G.; Ge, Y.T. Performances of transport refrigeration units at partial load; testing methodology and comparison with performances at full load. In Proceedings of the 24th IIR International Congress of Refrigeration, Yokohama, Japan, 16–22 August 2015; Available online: https://iifiir.org/fr/fridoc/31667 (accessed on 14 September 2021).
- Tassou, S.; De-Lille, G.; Ge, Y. Food transport refrigeration—Approaches to reduce energy consumption and environmental impacts of road transport. Appl. Therm. Eng. 2009, 29, 1467–1477. [Google Scholar] [CrossRef] [Green Version]
- Parfitt, J.; Barthel, M.; Macnaughton, S. Food waste within food supply chains: Quantification and potential for change to 2050. Phil. Trans. R. Soc. B 2010, 365, 3065–3081. [Google Scholar] [CrossRef] [PubMed] [Green Version]


| Parameter | Value |
|---|---|
| Ambient temperature in Phoenix (°C) | |
| Relative humidity in Phoenix (%) | |
| Ambient temperature in Chicago (°C) | |
| Relative humidity in Chicago (%) | |
| Temperature inside the mini container (°C) | |
| Relative humidity inside the mini container (%) | |
| (m) | |
| /MC | |
| f | |
| g | |
| COP | |
Publisher’s Note: MDPI stays neutral with regard to jurisdictional claims in published maps and institutional affiliations. |
© 2022 by the authors. Licensee MDPI, Basel, Switzerland. This article is an open access article distributed under the terms and conditions of the Creative Commons Attribution (CC BY) license (https://creativecommons.org/licenses/by/4.0/).
Share and Cite
Syam, M.M.; Cabrera-Calderon, S.; Vijayan, K.A.; Balaji, V.; Phelan, P.E.; Villalobos, J.R. Mini Containers to Improve the Cold Chain Energy Efficiency and Carbon Footprint. Climate 2022, 10, 76. https://0-doi-org.brum.beds.ac.uk/10.3390/cli10050076
Syam MM, Cabrera-Calderon S, Vijayan KA, Balaji V, Phelan PE, Villalobos JR. Mini Containers to Improve the Cold Chain Energy Efficiency and Carbon Footprint. Climate. 2022; 10(5):76. https://0-doi-org.brum.beds.ac.uk/10.3390/cli10050076
Chicago/Turabian StyleSyam, Mahmmoud Muhammed, Samantha Cabrera-Calderon, Kishorre Annanth Vijayan, Vignesh Balaji, Patrick E. Phelan, and Jesus Rene Villalobos. 2022. "Mini Containers to Improve the Cold Chain Energy Efficiency and Carbon Footprint" Climate 10, no. 5: 76. https://0-doi-org.brum.beds.ac.uk/10.3390/cli10050076