Next Issue
Volume 10, July
Previous Issue
Volume 10, May


Climate, Volume 10, Issue 6 (June 2022) – 12 articles

Cover Story (view full-size image): 
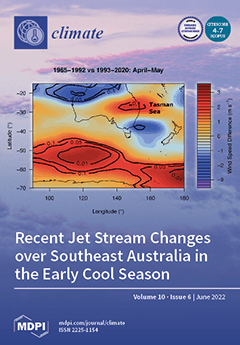
Upper-level jet stream variations during the accelerated global warming period (GW) have been found to affect the formation, tracks, and strength of southeast Australian rainfall systems. In the Australian region cool season (April–September) there are two jets, the Subtropical Jet (STJ) and the Polar Front Jet (PFJ). Using ERA5 data for 1965–2020, this split jet is present from April to September and from October to March (Figure 1d) and gradually forms a single jet. The STJ moves poleward in the cool season during GW, allowing fewer cold fronts and low-pressure systems to influence southeast Australia. Hence, the cool season is the main period for jet stream changes. Notably, in April–May, an anomalous mid-latitude low-pressure trough and decreased relative humidity form during GW, resulting in decreased April–May rainfall in southeast Australia. View this paper
  • Issues are regarded as officially published after their release is announced to the table of contents alert mailing list.
  • You may sign up for e-mail alerts to receive table of contents of newly released issues.
  • PDF is the official format for papers published in both, html and pdf forms. To view the papers in pdf format, click on the "PDF Full-text" link, and use the free Adobe Reader to open them.
Order results
Result details
Section
Select all
Export citation of selected articles as:
24 pages, 58796 KiB  
Article
Spatiotemporal Changes in Mean and Extreme Climate: Farmers’ Perception and Its Agricultural Implications in Awash River Basin, Ethiopia
by Addisu Damtew, Ermias Teferi, Victor Ongoma, Richard Mumo and Befikadu Esayas
Climate 2022, 10(6), 89; https://0-doi-org.brum.beds.ac.uk/10.3390/cli10060089 - 20 Jun 2022
Cited by 5 | Viewed by 2800
Abstract
The increase in the intensity and frequency of climate extremes threatens socioeconomic development. This study examines variability of mean and extreme climate, farmers’ perception of the changes, and impacts in the Awash River Basin. Daily rainfall and temperature data were used to analyze [...] Read more.
The increase in the intensity and frequency of climate extremes threatens socioeconomic development. This study examines variability of mean and extreme climate, farmers’ perception of the changes, and impacts in the Awash River Basin. Daily rainfall and temperature data were used to analyze 23 extreme climate indices. The Mann–Kendall test was used to assess the magnitude and significance of the changes. Results show an increase in minimum (0.019–0.055 °C/year) and maximum temperatures (0.049–0.09 °C/year), while total rainfall is on a downward trend (from −3.84 mm/year to −10.26 mm/year). Warm extreme temperature indicators, including warmest day (TXx), warmest night (TNx), warm day (TX90p), warm night (TN90p), and warm spell duration indicator (WSDI), show a significant increasing trend (p < 0.05). Nevertheless, except the tepid–cool humid agroecology zone, cold extreme temperature indicators in cool days (TN10p), cool nights (TX10p), and cold spell duration (CSDI) are declining. Extreme precipitation indices, including maximum 1-day precipitation amount (RX1day), count of days when precipitation ≥10 mm (R10 mm), maximum 5-day precipitation amount (RX5day), count of days when precipitation ≥20 mm (R20mm), very wet days (R95p), extreme wet days (R99p), and total precipitation (PRCPTOT), show a decreasing trend. The perception of most farmers’ on climate change and climate extremes agreed with climate records. The major impacts perceived and asserted over all agroecologies are food price inflation, crop productivity decline, crop pests and diseases spread, livestock disease increase, and the emergence of pests and weeds. The increasing trend in extreme warm temperatures, decreasing trend in the cold extreme, and declining trend in precipitation indicators affected agricultural productivity and farmers whose livelihood depends on rainfed agriculture. This agroecology-specific study provides critical information to policymakers, decision makers, and farmers about the potential impacts of climate change and extreme events, leading to the development of agroecology-based adaptation measures. Full article
(This article belongs to the Special Issue Climate and Weather Extremes)
Show Figures

Figure 1

23 pages, 9854 KiB  
Article
Analysis of Ocean Parameters as Sources of Coastal Storm Damage: Regional Empirical Thresholds in Northern Spain
by Victoria Rivas, Carolina Garmendia and Domingo Rasilla
Climate 2022, 10(6), 88; https://0-doi-org.brum.beds.ac.uk/10.3390/cli10060088 - 17 Jun 2022
Cited by 4 | Viewed by 1905
Abstract
This contribution aims to explore the role of oceanographic parameters on the damage caused by storms at the eastern Cantabrian coast (1996–2016). All wave storms affecting the study area were characterized in terms of several oceanographic parameters; among them, damaging storms (responsible for [...] Read more.
This contribution aims to explore the role of oceanographic parameters on the damage caused by storms at the eastern Cantabrian coast (1996–2016). All wave storms affecting the study area were characterized in terms of several oceanographic parameters; among them, damaging storms (responsible for direct and tangible loss) were identified. Cross-referencing both databases makes it possible to find some thresholds that explain storm conditions associated with property damage. Particularly relevant are those responsible for significant and widespread damage: maximum significant offshore wave height >6.5 m, maximum total water level >6 m, SPI > 1700 m2h, and a storm duration >48 h. These values are exceptionally high, mostly exceeding the 95th percentile. A comparison has been made with other thresholds described in the literature. The concurrence of high wave height and high tidal level is crucial as the greatest damage is caused by the combination of wave impact and over-wash, so a long duration of the storm is necessary to coincide with high tide. An empirical Intensity-Duration threshold has also been obtained with the following function I = 248.7 D−0.45. Damage can occur with moderate storms, but with severe effects only with exceptional wave and sea-level values, during long-lasting storms. Full article
Show Figures

Figure 1

18 pages, 8285 KiB  
Article
Spatiotemporal Analysis of Urban Heat Islands in Relation to Urban Development, in the Vicinity of the Atacama Desert
by Jorge Espinoza-Molina, Karina Acosta-Caipa, Esther Chambe-Vega, Germán Huayna, Edwin Pino-Vargas and Jorge Abad
Climate 2022, 10(6), 87; https://0-doi-org.brum.beds.ac.uk/10.3390/cli10060087 - 16 Jun 2022
Cited by 14 | Viewed by 3470
Abstract
Near the Atacama Desert, Tacna city in Peru is among the largest arid cities with constant urban development, thus understanding of the urban surface thermal pattern is needed. We propose a comprehensive study of the urban heat island phenomenon, with the objective of [...] Read more.
Near the Atacama Desert, Tacna city in Peru is among the largest arid cities with constant urban development, thus understanding of the urban surface thermal pattern is needed. We propose a comprehensive study of the urban heat island phenomenon, with the objective of (1) determining the spatial and temporal variations of the urban heat islands (UHIs), in the period 1985 to 2020; (2) analyzing the relationship between the UHI and influencing factors such as vegetation, urban area, and population, using indices calculated with satellite images. The Google Earth Engine repository was used to evaluate the corrected images from the years 1985 to 2020. The coincidence between the normalized difference vegetation index (NDVI) and normalized difference built-up index (NDBI) was good, negative between NDVI and the land surface temperature (LST), attributable to dense vegetation, and negative and very high (−0.81) between NDBI and NDVI, as massive urbanization leads to the reduction in the vegetal surface. The NDBI has a high impact on the LST; a coefficient of connections is recorded as 0.46. Tacna is a very arid region, and an increase in the time of the LST occurred with the increase in industrialization and urbanization. The land use/cover change (LUCC) evidences change in the climate in the city of Tacna; temperatures of 24.2 °C to 44.2 °C are observed in the built-up areas. In vegetated areas, the temperature remains below 24 °C, which is associated with a high rate of potential evapotranspiration. Thus, this study shows that variations in urban form and growth have produced the development of intraurban surface thermal patterns. Full article
Show Figures

Figure 1

20 pages, 4398 KiB  
Article
Remarkable Resilience of Forest Structure and Biodiversity Following Fire in the Peri-Urban Bushland of Sydney, Australia
by Elise Pendall, Alison Hewitt, Matthias M. Boer, Yolima Carrillo, Nancy F. Glenn, Anne Griebel, Jason H. Middleton, Peter J. Mumford, Peter Ridgeway, Paul D. Rymer and Greg L. Steenbeeke
Climate 2022, 10(6), 86; https://0-doi-org.brum.beds.ac.uk/10.3390/cli10060086 - 16 Jun 2022
Cited by 3 | Viewed by 3683
Abstract
In rapidly urbanizing areas, natural vegetation becomes fragmented, making conservation planning challenging, particularly as climate change accelerates fire risk. We studied urban forest fragments in two threatened eucalypt-dominated (scribbly gum woodland, SGW, and ironbark forest, IF) communities across ~2000 ha near Sydney, Australia, [...] Read more.
In rapidly urbanizing areas, natural vegetation becomes fragmented, making conservation planning challenging, particularly as climate change accelerates fire risk. We studied urban forest fragments in two threatened eucalypt-dominated (scribbly gum woodland, SGW, and ironbark forest, IF) communities across ~2000 ha near Sydney, Australia, to evaluate effects of fire frequency (0–4 in last 25 years) and time since fire (0.5 to >25 years) on canopy structure, habitat quality and biodiversity (e.g., species richness). Airborne lidar was used to assess canopy height and density, and ground-based surveys of 148 (400 m2) plots measured leaf area index (LAI), plant species composition and habitat metrics such as litter cover and hollow-bearing trees. LAI, canopy density, litter, and microbiotic soil crust increased with time since fire in both communities, while tree and mistletoe cover increased in IF. Unexpectedly, plant species richness increased with fire frequency, owing to increased shrub richness which offset decreased tree richness in both communities. These findings indicate biodiversity and canopy structure are generally resilient to a range of times since fire and fire frequencies across this study area. Nevertheless, reduced arboreal habitat quality and subtle shifts in community composition of resprouters and obligate seeders signal early concern for a scenario of increasing fire frequency under climate change. Ongoing assessment of fire responses is needed to ensure that biodiversity, canopy structure and ecosystem function are maintained in the remaining fragments of urban forests under future climate change which will likely drive hotter and more frequent fires. Full article
(This article belongs to the Special Issue Climate System Uncertainty and Biodiversity Conservation)
Show Figures

Figure 1

25 pages, 8310 KiB  
Article
Skill and Inter-Model Comparison of Regional and Global Climate Models in Simulating Wind Speed over South Asian Domain
by Naresh K. G. Lakku and Manasa R. Behera
Climate 2022, 10(6), 85; https://0-doi-org.brum.beds.ac.uk/10.3390/cli10060085 - 16 Jun 2022
Cited by 3 | Viewed by 2603
Abstract
Global Climate Models (GCMs) and Regional Climate Models (RCMs) have been widely used in understanding the impact of climate change on wind-driven processes without explicit evaluation of their skill. This study is oriented towards assessing the skill of 28 GCMs and 16 RCMs, [...] Read more.
Global Climate Models (GCMs) and Regional Climate Models (RCMs) have been widely used in understanding the impact of climate change on wind-driven processes without explicit evaluation of their skill. This study is oriented towards assessing the skill of 28 GCMs and 16 RCMs, and more importantly to assess the ability of RCMs relative to parent GCMs in simulating near-surface wind speed (WS) in diverse climate variable scales (daily, monthly, seasonal and annual) over the ocean and land region of the South Asian (SA) domain (11° S–30° N and 26° E–107° E). Our results reveal that the climate models’ competence varies among climate variable scales and regions. However, after rigorous examination of all climate models’ skill, it is recommended to use the mean ensemble of MPI-ESM-MR, CSIRO-Mk3.6.0 and GFDL-ESM2G GCMs for understanding future changes in wave climate, coastal sediment transport and offshore wind energy potential, and REMO2009 RCM driven by MPI-M-MPI-ESM-LR for future onshore wind energy potential assessment and air pollution modelling. All parent GCMs outperform the RCMs (except CCCma-CanESM2(RCA4)) over the ocean. In contrast, most RCMs show significant added value over the land region of the SA domain. Further, it is strongly discouraged to use the RCM WS simulations in modelling wind-driven processes based on their parent GCM’s skill over the ocean. Full article
(This article belongs to the Section Climate Dynamics and Modelling)
Show Figures

Figure 1

11 pages, 2245 KiB  
Communication
Jet Stream Changes over Southeast Australia during the Early Cool Season in Response to Accelerated Global Warming
by Milton S. Speer, Lance M. Leslie and Joshua Hartigan
Climate 2022, 10(6), 84; https://0-doi-org.brum.beds.ac.uk/10.3390/cli10060084 - 15 Jun 2022
Cited by 1 | Viewed by 3006
Abstract
In recent decades, southeast Australia has experienced both extreme drought and record-breaking rainfall, with devastating societal impacts. Variations in the Australian polar-front jet (PFJ) and the subtropical jet (STJ) determine, for example, the location and frequency of the cool season (April–September) weather systems [...] Read more.
In recent decades, southeast Australia has experienced both extreme drought and record-breaking rainfall, with devastating societal impacts. Variations in the Australian polar-front jet (PFJ) and the subtropical jet (STJ) determine, for example, the location and frequency of the cool season (April–September) weather systems influencing rainfall events and, consequently, water availability for the southern half of Australia. Changes in jet stream wind speeds also are important for aviation fuel and safety requirements. A split jet occurs when the single jet separates into the STJ and PFJ in the early cool season (April–May). This study focusses on split jet characteristics over Australian/New Zealand longitudes in recent decades. During the accelerated global warming from the mid-1990s, higher mean wind speeds were found in the PJF across the Australian region during June–September, compared to the STJ. In contrast, significant wind speed increases occur in the early cool season (April–May) at STJ latitudes, which straddle the East Coast of Australia and the adjacent Tasman Sea. These changes are linked to major changes in the mean atmospheric circulation, and they include relative vorticity and humidity, both being vital for the development of rain-bearing weather systems that affect the region. Full article
(This article belongs to the Special Issue Recent Climate Change Impacts in Australia)
Show Figures

Figure 1

19 pages, 469 KiB  
Article
Common Issues in Verification of Climate Forecasts and Projections
by James S. Risbey, Dougal T. Squire, Marina Baldissera Pacchetti, Amanda S. Black, Christopher C. Chapman, Suraje Dessai, Damien B. Irving, Richard J. Matear, Didier P. Monselesan, Thomas S. Moore, Doug Richardson, Bernadette M. Sloyan and Carly R. Tozer
Climate 2022, 10(6), 83; https://0-doi-org.brum.beds.ac.uk/10.3390/cli10060083 - 15 Jun 2022
Cited by 4 | Viewed by 2116
Abstract
With increased interest in climate forecasts and projections, it is important to understand more about their sources and levels of skill. A starting point here is to describe the nature of the skill associated with forecasts and projections. Climate forecasts and projections typically [...] Read more.
With increased interest in climate forecasts and projections, it is important to understand more about their sources and levels of skill. A starting point here is to describe the nature of the skill associated with forecasts and projections. Climate forecasts and projections typically both include time varying forcing of the climate, but only forecasts have initial conditions set close to the observed climate state. Climate forecasts therefore derive skill from both initial conditions and from forcing. The character of the initial condition skill and forcing skill is different. Skill from initial conditions results in a narrowing of expectations relative to a climatological distribution and points toward a more favoured part of the distribution. Forcing skill could result from a shift in the preferred parts of the climatological distribution in response to forcing, or it could result from a shift in the entire distribution, or both. Assessments of forcing skill require time averages of the target variable that are long enough so that the contributions from internal variations are small compared to the forced response. The assessment of skill of climate forecasts and projections is inherently partial because of the small number of repeated trials possible on typical climate time scales but is nonetheless the only direct measure of their performance. Full article
Show Figures

Figure 1

18 pages, 7693 KiB  
Article
The Application of Geographical Information Systems and the Analytic Hierarchy Process in Selecting Sustainable Areas for Urban Green Spaces: A Case Study in Hue City, Vietnam
by Nguyen Hoang Khanh Linh, Pham Gia Tung, Huynh Van Chuong, Nguyen Bich Ngoc and Tran Thi Phuong
Climate 2022, 10(6), 82; https://0-doi-org.brum.beds.ac.uk/10.3390/cli10060082 - 12 Jun 2022
Cited by 5 | Viewed by 3322
Abstract
In recent years, there has been growing awareness about the roles and benefits of urban green spaces (UGSs), particularly in the context of mitigating the negative effects of climate change, which have become increasingly serious. In Vietnam, the government has allocated considerable resources [...] Read more.
In recent years, there has been growing awareness about the roles and benefits of urban green spaces (UGSs), particularly in the context of mitigating the negative effects of climate change, which have become increasingly serious. In Vietnam, the government has allocated considerable resources to the development of UGSs in many cities. However, regarding implementation, UGS development in Vietnam faces many challenges; many cities find it difficult to meet the set criterion regarding the number of green spaces per capita. This research was conducted in Hue City, which is known as one of the greenest cities in Vietnam. The results show that there are twenty-one UGSs in Hue City (with a total area of 88.67 ha). These are located primarily along the Huong River and around the Hue Imperial Citadel. However, under government stipulations, the current number of UGSs is not considered sufficient in proportion to the local population, and will not accommodate the future growth of the population. We applied the analytic hierarchy process (AHP) along with the participation of local residents, using six criteria to map potential areas for future UGS planning. In this, the distance from existing residential areas to potential UGS locations is the most important criterion. The suitability map identified 684 hectares of Hue City as highly suitable for UGSs. This research also proposes a scenario for UGS planning in Hue based on retaining the existing green spaces combined with creating another 35 green spaces, comprising a total area of 167 hectares. This is to meet the needs of local residents by 2030. Full article
Show Figures

Figure 1

15 pages, 4985 KiB  
Article
Changes in Selected Low-Flow Characteristics in the 2001–2015 Period Compared to the 1961–2000 Reference Period in Slovakia
by Lotta Blaškovičová, Katarína Jeneiová, Katarína Melová, Jana Poórová, Soňa Liová, Katarína Slivková and Beáta Síčová
Climate 2022, 10(6), 81; https://0-doi-org.brum.beds.ac.uk/10.3390/cli10060081 - 31 May 2022
Cited by 4 | Viewed by 1757
Abstract
This research is focused on the assessment of drought on surface watercourses in Slovakia. Low-flow characteristics and their changes in the 2001–2015 period in comparison with the 1961–2000 reference period were evaluated at selected representative water-gauging stations. Two different methods were used to [...] Read more.
This research is focused on the assessment of drought on surface watercourses in Slovakia. Low-flow characteristics and their changes in the 2001–2015 period in comparison with the 1961–2000 reference period were evaluated at selected representative water-gauging stations. Two different methods were used to calculate the flow duration curves (FDCs): the standard method, based on mean daily discharge data series for the whole evaluated period in descending order, and the alternative method, based on first calculating the values of FDCs for each year of the assessed period and then averaging the corresponding percentile values. The changes were evaluated for selected percentiles of the FDCs (330-, 355-, and 364-day discharge). The number of days with the mean daily flow below the set limits and the seasonality of their occurrence were assessed. The results show significant changes in cases of both methods in the compared time periods, while differences in individual regions of Slovakia were also found. The weakness of the standard method is in allowing the values of the smallest quantiles to be influenced by a small number of long-lasting drought episodes. The alternative method eliminates the aforementioned shortcoming and could be used to determine the ecological flows in Slovakia. Full article
(This article belongs to the Special Issue Climate Change, Hydrology and Freshwater Resources)
Show Figures

Figure 1

23 pages, 7619 KiB  
Article
Wave Climate along Calabrian Coasts
by Giandomenico Foti, Giuseppe Barbaro, Giovanni Besio, Giuseppina Chiara Barillà, Pierluigi Mancuso and Pierfabrizio Puntorieri
Climate 2022, 10(6), 80; https://0-doi-org.brum.beds.ac.uk/10.3390/cli10060080 - 28 May 2022
Cited by 3 | Viewed by 2941
Abstract
The wave climate is highly variable temporally and spatially, depending mainly on the atmospheric conditions and on fetch extensions. Wave climate is one of the main causes of coastal erosion processes, together with anthropogenic pressure and with coastal and river sedimentary balance. Therefore, [...] Read more.
The wave climate is highly variable temporally and spatially, depending mainly on the atmospheric conditions and on fetch extensions. Wave climate is one of the main causes of coastal erosion processes, together with anthropogenic pressure and with coastal and river sedimentary balance. Therefore, a detailed spatial and temporal knowledge of wave climate is very important in managing coastal areas and in planning coastal defense works. This paper describes an analysis of the wave climate carried out along the Calabrian coasts in over 50 areas, each of them covering an average of 15 km of coastline. For each area, over 40 years of wave data were analyzed to calculate over 20 parameters, representative of annual and seasonal average and maximum wave conditions. The large number of areas is related to the geomorphological and climatic complexity of Calabria. This analysis mainly highlighted that the two Ionian and Tyrrhenian coasts are very different from the wave climate point of view. Indeed, the Ionian coast is heavier in ordinary wave conditions, while the Tyrrhenian coast is heavier in extreme wave conditions. Full article
(This article belongs to the Special Issue Wave Climate)
Show Figures

Figure 1

20 pages, 3597 KiB  
Article
Challenges of Managing Maritime Cultural Heritage in Asia in the Face of Climate Change
by Patrick Daly, R. Michael Feener, Noboru Ishikawa, Ibrahim Mujah, Maida Irawani, Alexandru Hegyi, Krisztina Baranyai, Jedrzej Majewski and Benjamin Horton
Climate 2022, 10(6), 79; https://0-doi-org.brum.beds.ac.uk/10.3390/cli10060079 - 25 May 2022
Cited by 7 | Viewed by 4741
Abstract
Changing weather patterns, increasing frequency and intensity of natural hazards, and rising sea levels associated with global climate change have the potential to threaten cultural heritage sites worldwide. This is especially the case for maritime heritage sites located in the low-lying coastal and [...] Read more.
Changing weather patterns, increasing frequency and intensity of natural hazards, and rising sea levels associated with global climate change have the potential to threaten cultural heritage sites worldwide. This is especially the case for maritime heritage sites located in the low-lying coastal and delta regions of Asia. Maritime heritage can reflect both highly localized cultural products based on the coupling of people and maritime environments and the historic footprints of complex maritime networks that connect people, ideas, and material over vast distances, creating unique cultural spheres. Furthermore, maritime heritage sites potentially serve as or contain records of how past societies have been impacted by and adapted to past environmental stress. Therefore, their degradation threatens local/regional/global cultural patrimony as well as evidence of human resilience and fragility in the face of environmental change. This makes a strong case for urgent preservation. However, the possible damage caused by climate change and the scale of vulnerable maritime heritage pose seemingly insurmountable challenges. In this paper, we present the ways in which maritime heritage sites across Asia are vulnerable to environmental stresses, such as changing sea levels, coastal erosion, flooding, and storm surges. Our objective is to draw upon our experience documenting endangered cultural heritage across South and Southeast Asia to illustrate that there are unique conceptual and practical characteristics of maritime heritage that complicate effective management and conservation efforts on the scale required to prevent massive loss by climate change. We conclude by stressing the need to reconceptualize debates about the custody and stewardship of maritime heritage and the urgency of employing a wide range of innovative preservation solutions to ensure maritime patrimony is not lost to the rising tides. Full article
Show Figures

Figure 1

10 pages, 1129 KiB  
Article
Evaluation of Machine-Learning Models for Predicting Aeolian Dust: A Case Study over the Southwestern USA
by Yog Aryal
Climate 2022, 10(6), 78; https://0-doi-org.brum.beds.ac.uk/10.3390/cli10060078 - 24 May 2022
Cited by 4 | Viewed by 2395
Abstract
Aeolian dust has widespread consequences on health, the environment, and the hydrology over a region. This study investigated the performance of various machine-learning (ML) models including Multiple Linear Regression (MLR), Support Vector Machines (SVM), Random Forests (RF), Bayesian Regularized Neural Networks (BRNN), and [...] Read more.
Aeolian dust has widespread consequences on health, the environment, and the hydrology over a region. This study investigated the performance of various machine-learning (ML) models including Multiple Linear Regression (MLR), Support Vector Machines (SVM), Random Forests (RF), Bayesian Regularized Neural Networks (BRNN), and Cubist (Cu) in predicting dust emissions over the Southwestern United States (US). Six meteorological and climatic variables (precipitation, air temperature, wind speed, ENSO, PDO, and NAO) were used to predict dust emissions. The correlation (r) and root mean square error (RMSE) for fine dust vary from 0.67 to 0.80, and 0.40 to 0.52 µg/m3, respectively. For coarse dust, the r and RMSE vary from 0.69 to 0.73, and 2.01 to 2.34 µg/m3, respectively. The non-linear ML models outperformed linear regression for both fine and coarse dust. ML models underestimated high concentrations of dust. Machine-learning models better predict fine dust than coarse dust over the Southwestern USA. Air temperature was found to be the most important predictor, followed by precipitation, for both fine- and coarse- dust-prediction over the region. These results improve our understanding of the predictability of Southwestern US dust. Full article
Show Figures

Figure 1

Previous Issue
Next Issue
Back to TopTop