Article

Long-Term Climate Trends and Extreme Events in Northern Fennoscandia (1914–2013)

1
Department of Geographical and Historical Studies, University of Eastern Finland, P. O. Box 111, FI-80101 Joensuu, Finland
2
Department of Geography and Geology, University of Turku, FI-20014 Turku, Finland
3
Department of Biological and Environmental Science, University of Jyväskylä, P.O. Box 35, FI-40014 Jyväskylä, Finland
4
Finnish Meteorological Institute, P. O. Box 503, FI-00101 Helsinki, Finland
*
Author to whom correspondence should be addressed.
Submission received: 16 December 2016 / Accepted: 22 February 2017 / Published: 26 February 2017
(This article belongs to the Special Issue Climate Extremes, the Past and the Future)

Abstract

:
We studied climate trends and the occurrence of rare and extreme temperature and precipitation events in northern Fennoscandia in 1914–2013. Weather data were derived from nine observation stations located in Finland, Norway, Sweden and Russia. The results showed that spring and autumn temperatures and to a lesser extent summer temperatures increased significantly in the study region, the observed changes being the greatest for daily minimum temperatures. The number of frost days declined both in spring and autumn. Rarely cold winter, spring, summer and autumn seasons had a low occurrence and rarely warm spring and autumn seasons a high occurrence during the last 20-year interval (1994–2013), compared to the other 20-year intervals. That period was also characterized by a low number of days with extremely low temperature in all seasons (4%–9% of all extremely cold days) and a high number of April and October days with extremely high temperature (36%–42% of all extremely warm days). A tendency of exceptionally high daily precipitation sums to grow even higher towards the end of the study period was also observed. To summarize, the results indicate a shortening of the cold season in northern Fennoscandia. Furthermore, the results suggest significant declines in extremely cold climate events in all seasons and increases in extremely warm climate events particularly in spring and autumn seasons.

1. Introduction

Observations from northern regions have shown a significant warming trend during the past decades [1,2]. Temperatures at northern high latitudes have increased more than twice as fast as the global average. This phenomenon, usually referred as arctic or polar amplification, is driven by complex climate system feedbacks, such as reductions of sea ice and snow cover and changes in atmospheric and ocean circulation [3,4,5]. Nevertheless, the magnitude and spatiotemporal pattern of warming and associated precipitation changes show a strong variation across circumpolar areas [6,7,8].
In addition to increasing temperatures, climate warming is expected to lead to increases in frequency, intensity and duration of several extreme weather and climate events [9,10,11]. Earlier observational and climate model studies focused mainly on changes in mean climate, and possible changes in weather and climate extremes started to be analyzed only since the early 1990s [12,13]. An extreme weather event is an event that is rare within its statistical reference distribution at a particular place, whereas an extreme climate event is an average of a number of weather events over a certain period of time. This means an average which is itself extreme [14]. Statistics of past climate and model simulations for the future both suggest, e.g. higher maximum and minimum temperatures, more hot summer days and heavier precipitation events or more severe drought, in different parts of the world [9,15,16]. Recent papers have discussed influences of changes in atmospheric circulation patterns and in thermodynamic aspects, such as sea level, sea surface temperature and atmospheric moisture content, on the occurrence and intensity of extreme events [17,18]. The issue of connections between Arctic amplification and mid-latitude weather extremes is also actively debated [19,20,21,22].
In northern Europe, the temperature rise is expected to keep on being much larger than the global mean [2]. The warming has a wide variety of impacts on northern ecosystems and significant consequences for agriculture, forestry, human health, and infrastructure [23,24,25,26]. It is assumed that especially more frequent and intense extreme weather events increase the vulnerability of northern environment and human activities to warming [24]. Direct impacts of temperature and precipitation changes are experienced in northern hydrological regimes, such as groundwater levels, permafrost, and snow and ice conditions [27,28,29]. Dependency of northern key species on snow and ice increase the northern terrestrial ecosystems vulnerability to warming [26,30].
Traditional livelihoods, like hunting, fishing, harvesting and herding economies, depend on healthy ecosystems with habitats suitable for plant and animal populations. Climate change together with other drivers decrease the availability and quality of these habitats [31,32]. Reindeer herding is one of the most important traditional livelihoods in northern Fennoscandia and northwestern Russian tundra and boreal environments. It is strongly dependent on climatic conditions, and particularly the winter season is a critical period for reindeer grazing [33,34,35]. Exceptional winters with difficult snow and ice conditions have long-term negative impacts on reindeer populations and consequently, economic and cultural viability of reindeer herding livelihoods [36,37,38]. In addition, modern livelihoods may be sensitive to changes. For example, tourism is an important part of the northern economies and is very vulnerable to changing winter conditions [39].
Understanding climate variability, trends and changes in frequency, intensity and duration of extreme events requires long-term climate observation data. Temperature records have generally a good coverage since the 1950s in northern regions, but the availability of instrumental measurements extending to the beginning of the 20th century is considerably limited [6,7,40]. In northernmost Europe, long-term climate trends (ca 100 years) calculated from weather station data have usually been studied within one country or a region with a relatively limited spatial extent ([40,41,42,43,44,45,46], but see, e.g. [47,48] for a wider Northern Russian area). Furthermore, long-term changes in extreme weather events in northern Fennoscandia are relatively little studied [49,50,51]. The study period of [49,50] ended in the year 1995, and most of the study sites were located to the south of the Arctic Circle. On the other hand, [51] focused on wintertime warm weather episodes alone.
In this work, we studied climate trends and extreme events in northern Fennoscandia over the 100-year period 1914–2013 using long-term weather data from nine weather stations located in Finland, Norway, Sweden and Russia. Our aims were to: (1) examine trends in monthly mean temperature variables, monthly precipitation sums and in the spring and autumn, number of frost days at different geographical locations, and (2) study temporal distributions of the occurrence of rare and extreme climate events, also discussing their links to atmospheric circulation and reductions in the Barents Sea ice. The following climate events were considered: rarely cold and warm seasons, extremely high and low daily temperatures, and extremely high daily precipitation sums. The results will be considered from the viewpoint of high-latitude species, ecosystem services and local livelihoods.

2. Materials and Methods
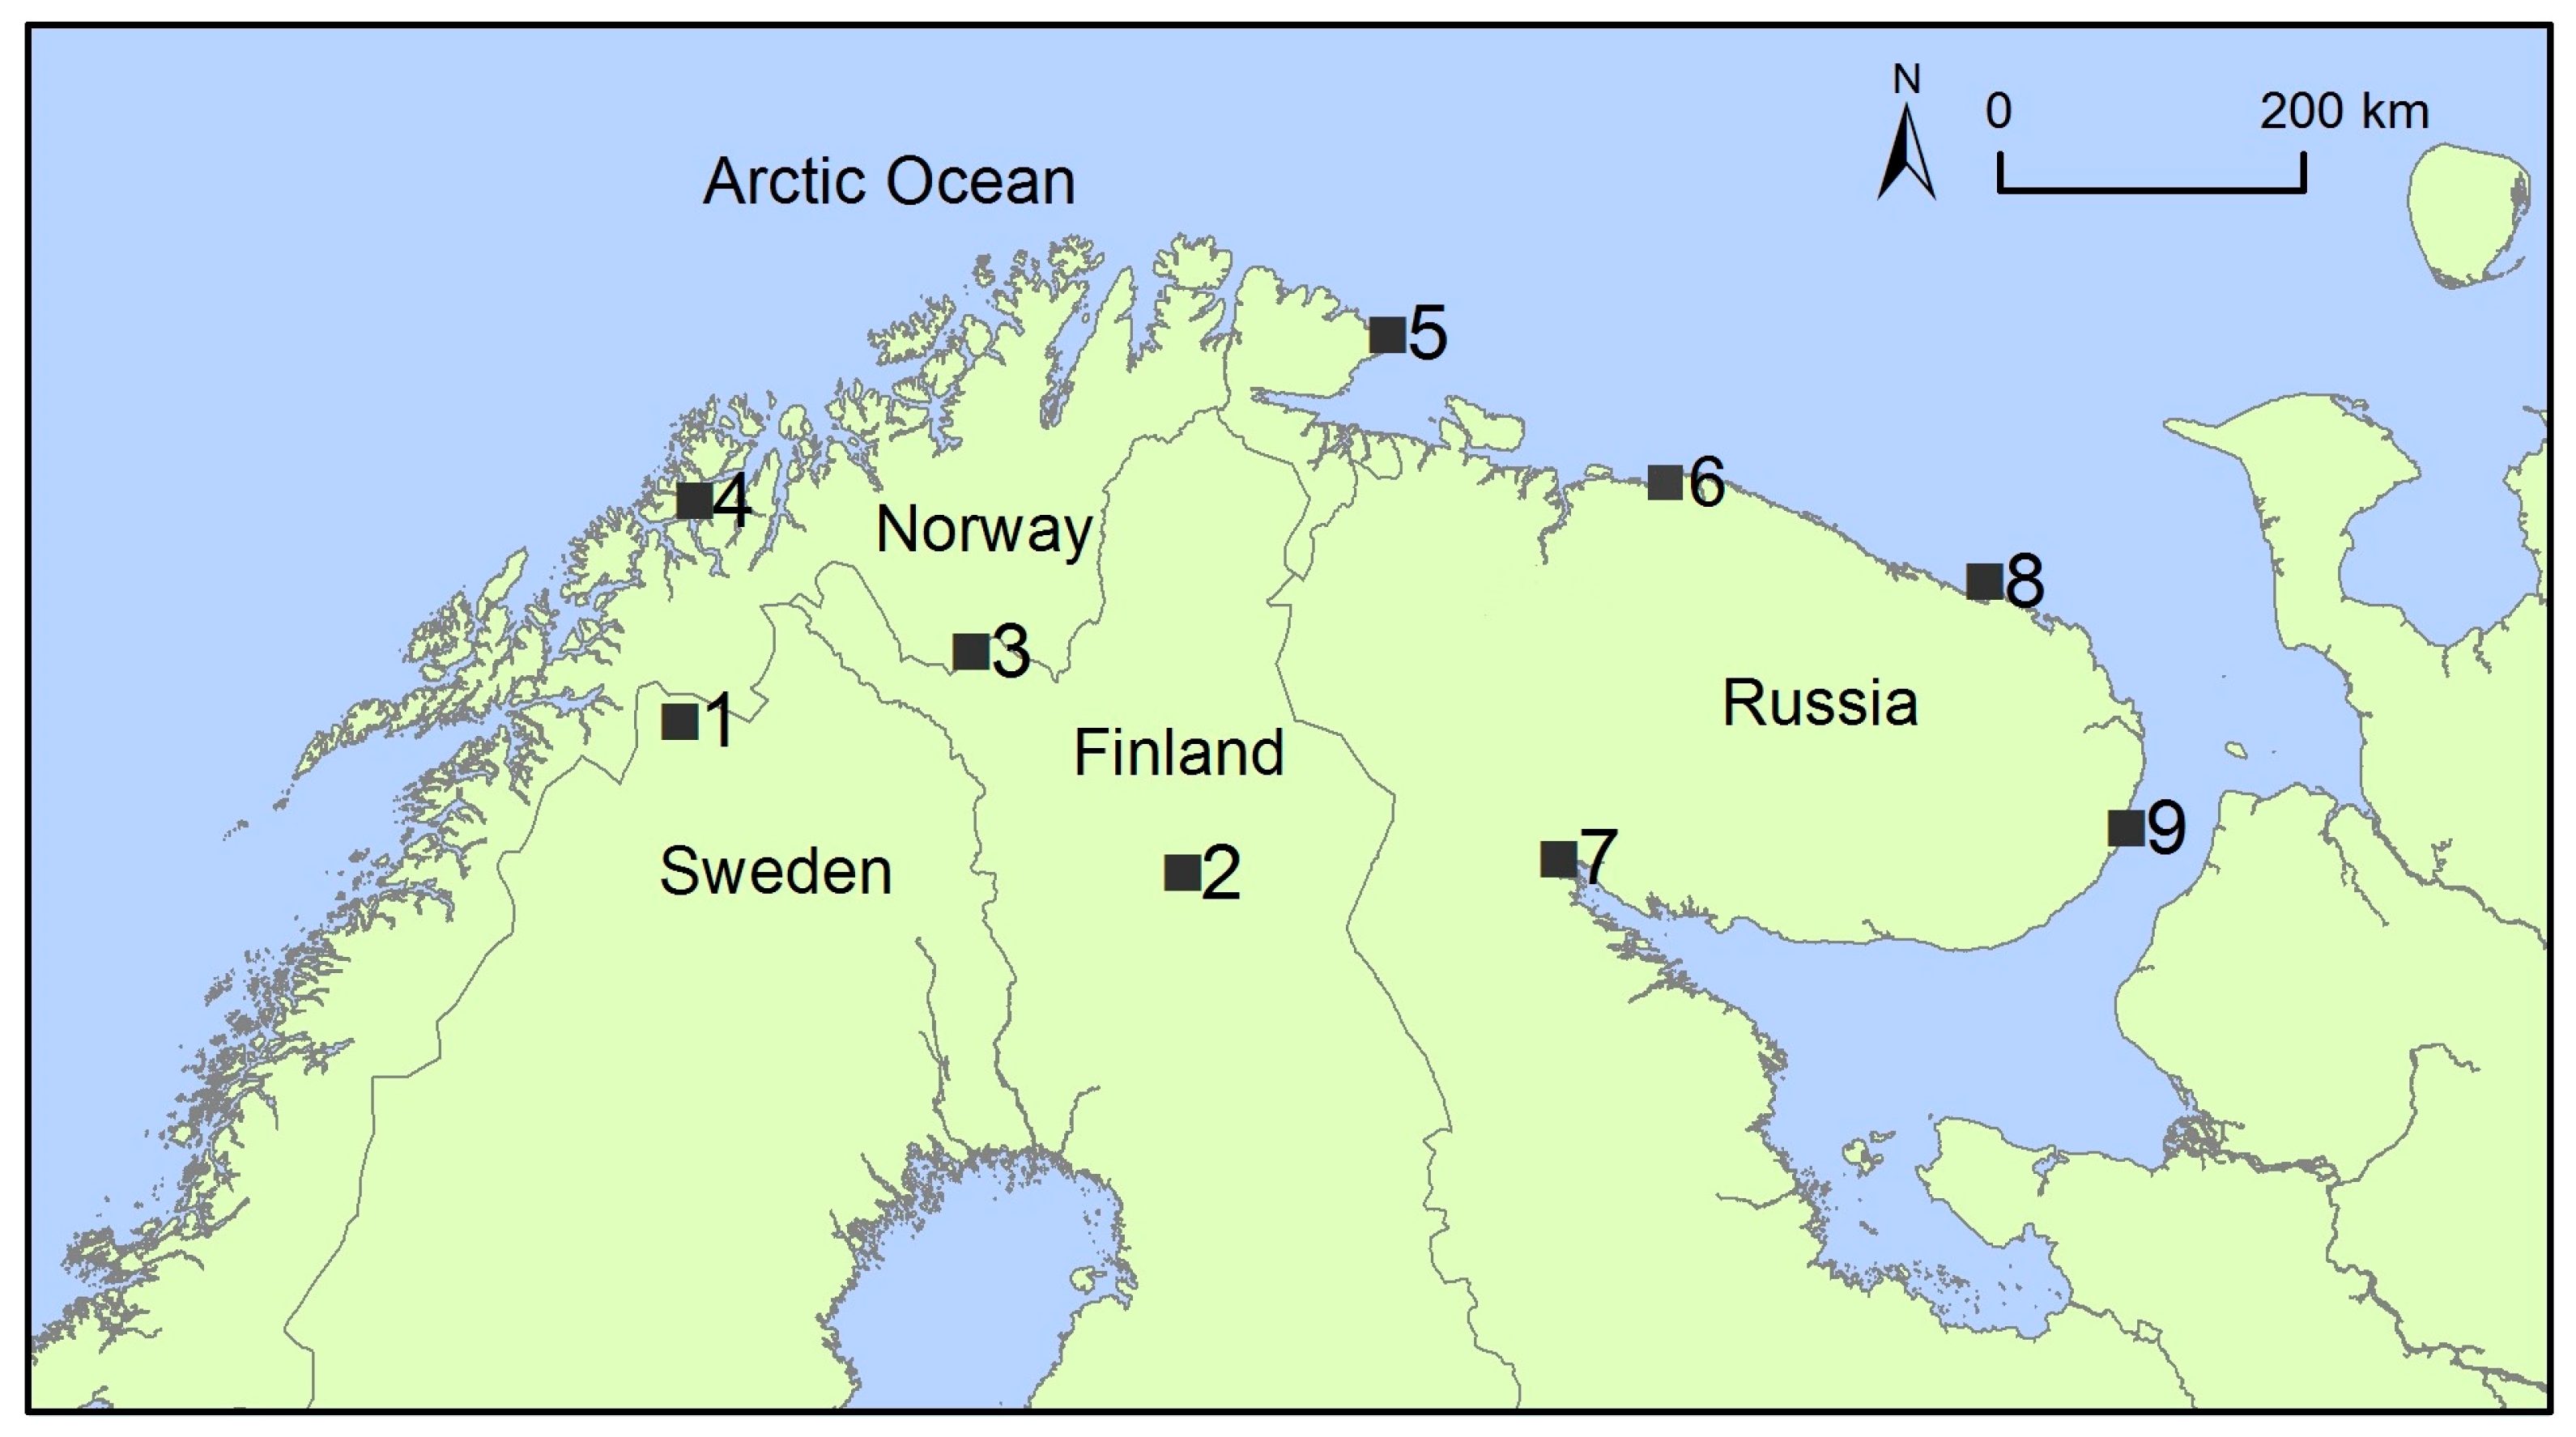
2.1. Study area

The study area covered the northern parts of Finland, Norway and Sweden and the Kola Peninsula in Russia (67.15–70.37° N, 18.83–40.68° E). Nine weather stations located in the region were included in the analyses: (1) Abisko (SWE), (2) Sodankylä (FIN), (3), Sihccajavri (NOR), (4) Tromsø (NOR), (5) Vardø (NOR), (6) Teriberka (RUS), (7) Kandalaksa (RUS), (8) Svyatoy Nos (RUS), and (9) Ostrov Sosnovez (RUS) (Figure 1, Table 1).

2.2. Climate Data

Climate data for the period 1914–2013 were derived from the Finnish Meteorological Institute’s open data service (Sodankylä) [52], the Eklima web portal of Norwegian Meteorological Institute (Sihccajavri, Tromsø, Vardø) [53] and the European Climate Assessment & Dataset project (Teriberka, Kandalaksa, Svyatoy Nos, Ostrov Sosnovez) [54]. The Abisko dataset was provided by the Abisko Scientific Research Station. The number of months excluded from the analyses of temperature and precipitation due to lack of data is given in Supplementary Material (Table S1).
In addition to temperature and precipitation data in northern Fennoscandia, we used seasonal time series of two indices of the North Atlantic Oscillation (NAO). The station-based index has been calculated as the difference of normalized sea level pressure between Lisbon, Portugal and Stykkisholmur/Reykjavik, Iceland, and the principal-component index is defined by the leading empirical orthogonal function of sea level pressure over the Atlantic sector (20°–80° N, 90° W–40° E) [55]. Both indices are provided by the Climate Analysis Section, NCAR, Boulder, USA [56].

2.3. Statistical Analyses

Observations of daily mean, minimum and maximum temperatures and precipitation were used to calculate annually: (1) monthly mean air temperature, (2) monthly mean of daily maximum air temperatures, (3) monthly mean of daily minimum air temperatures, (4) the number of frost days (TMin < 0 °C) in April-May and in September–October, and (5) monthly precipitation sum. Long-term trends in temperature and precipitation conditions were studied using linear and non-parametric models. The magnitude of the trend with 95% confidence intervals was calculated for each calendar month using the least squares method and non-parametric Sen’s trend estimate. The statistical significance of the trends was calculated using the Mann-Kendall trend test.
Most long-term climatic time series are influenced by inhomogeneities, i.e., non-climatic factors, like changes in observational instruments and practices, station relocations and changes in station environment. A homogenous time series is defined as one where variations are caused only by variations in climate. Time series influenced by inhomogeneities may lead to deceptive conclusions about the state of climate and possible trends included. In this study, we applied HOMER [57], software for detecting inhomogeneities in time series of essential climate variables at monthly and annual time scales. It is an outcome of the COST Action ES0601 HOME, which carried out a blind benchmarking experiment to compare and validate homogenization algorithms, resulting in a group of recommended methods [58]. HOMER integrates the best characteristics of some of these recommended methods into one interactive open access software tool. It is a semi-automatic multiple breakpoint method utilizing state-of-the-art homogenization algorithms that are able to work with inhomogenous reference series [57,59,60].
We limited detection of inhomogeneities with respect to monthly mean, minimum and maximum temperatures, since time series of precipitation are more difficult to homogenize due to lower cross-correlations [58], especially with a sparse station network like ours (Figure 1). Because of the lack of metadata and the sparse station network and in order to make sure that no possible false detections are given importance, we took a rather reserved approach to isolated inhomogeneities, i.e., to inconsistencies detected in one of the temperature series but not in two others. This demand of having inhomogeneities simultaneously in more than one of the temperature variables (difference of one year accepted) is one way to provide some additional evidence for detection based solely on statistics. We decided not to adjust any time series even if inhomogeneities were detected. Instead, when reporting the results, we place more emphasis on homogeneous stations and stations with only isolated inhomogeneities than on stations with coinciding inhomogeneities.
In the analysis of the time series, seasonal mean temperature values in (1) December-February, (2) March-May, (3) June-August and (4) September-November were first calculated for each year. Separately for each weather station, a rarely cold (or warm) season was then defined as a case belonging to the 10th (or 90th) percentile of the mean seasonal temperature values, respectively (10 rarely cold/warm seasons per station during the 100-year study period).
Second, extremely low and high daily temperatures and extremely high daily precipitation sum in (1) January, (2) April, (3) July and (4) October were studied. Extremely low daily temperatures were defined as belonging to the 1st percentile of minimum daily temperatures, and extremely high daily temperatures were defined as values belonging to the 99th percentile of maximum daily temperatures. Extremely low and high temperatures were defined separately for each station (30 or 31 extremely cold/warm days per station during the study period). Extremely high precipitation was defined as values belonging to the 99th percentile of daily precipitation sum. The Sihccajavri, Tromsø and Vardø weather stations were excluded from temperature analyses, because maximum temperature values were available only since 1925–1955.
Temporal distribution of rarely cold and warm seasons and extreme daily events was studied over the past 100 years by examining their total occurrence (all included weather stations) during five subsequent 20-year intervals, the first covering the years 1914–1933 and the last, years 1994–2013. A temporally even distribution of the occurrence would imply that each 20-year interval had 20% of the cases. Averages of the seasonal mean NAO indices were calculated for the same 20-year periods.

3. Results

3.1. Temperature and Precipitation Variability and Trends

The weather stations were located over a wide range of latitudinal, altitudinal and continental-oceanic values (Figure 1, Table 1). The 100-year mean annual temperature ranged from −0.6 to 2.8 °C across the stations. Tromsø (4) and Vardø (5) weather stations were characterized by oceanic climate with high annual mean temperatures and precipitation sums. Sodankylä (2), Sihccajavri (3) and Kandalaksa (7) weather stations were characterized by continental climate with a large difference in winter and summer temperatures. The Abisko weather station (1) was located at the highest altitude in the Scandinavian mountain chain. Teriberka (6), Svyatoy Nos (8) and Ostrov Sosnovez (9) were the most eastern weather stations located on the shore of the Arctic Sea.
In the context of homogeneity testing, three stations were found to be homogenous, i.e., no inhomogeneities were detected in any of the temperature time series (stations 1, 6 and 9). Only isolated inhomogeneities were found from stations 2 and 4. Inhomogeneities consistent between at least two of the three temperature variables were found from stations 3, 5, 7 and 8 mainly before the 1950s and 1960s. Inhomogeneities detected from the temperature series of stations 3 and 7 mean that the period 1914–1957 (1914–1961) was on average about 0.5 °C too warm compared to the latter part of the studied time period. At station 5, the period 1914–1954 was on average 0.3 °C too cold compared to the period 1955–2014. At station 8, the period 1914–1980 was on average 0.2 °C too cold compared to the period of 1981–2013.
Statistically significant warming trends across the period 1914–2013 were found in March–May in all studied locations and in September-October in most of the locations (Table 2). The monthly mean minimum temperatures showed the greatest increases, 0.1–0.5 °C decade−1. Focusing on the five stations with no or only isolated inhomogeneities, we can see that the mean and maximum temperatures increased by 0.1–0.3 °C decade−1. Monthly mean minimum temperatures, in particular, increased at some stations also in summer, whereas nearly no increasing trends were found during winter months. Annual mean minimum temperatures increased by 0.1–0.3 °C decade−1 at four of the five stations with no or only isolated inhomogeneities. Statistically significant trends in annual mean temperature and in annual mean maximum temperature were less commonly detected. It is worth noting that inhomogeneities detected in the time series of stations 5 and 8 potentially mean weaker warming trends than shown in Table 2 and vice versa for stations 3 and 7.
The number of frost days varied between 29 and 50 days in April–May and between 13 and 37 days in September-October (Figure 2). The number of frost days declined by 7–11 days century−1 in April–May and 0–12 days century−1 in September-October in five stations with no or only isolated inhomogeneities.
Statistically significant trends in monthly precipitation sums were less common compared to those in temperatures (Table 2). Monthly precipitation sums increased significantly particularly in October and December (1.1–3.7 mm decade−1) and in July (3.3–4.0 mm decade−1) at several eastern and coastal stations, but only at a few stations in the other months. Annual precipitation sums increased by 5–38 mm decade−1 at four stations (1, 3, 4, 7).

3.2. Rarely Cold and Warm Seasons

The rarely cold seasons (defined as cases belonging to the 10th percentile of the mean seasonal temperature values) did not occur temporally evenly among the five 20-year intervals of the study period. In particular, the last interval (1994–2013) had low proportions of rarely cold seasons (2%–9% of all rare events, depending on the season) (Figure 3). Rarely cold winter and summer seasons occurred in the study region, particularly between 1954 and 1993 (69%–71% of seasonal rare events), and rarely cold spring and autumn seasons occurred especially in 1913#x2013;1934 and 1954#x2013;1973 (67%–72% of seasonal rare events).
On average, 37% of rarely warm spring seasons and 48% of rarely warm autumn seasons (defined as cases belonging to the 90th percentile of the mean seasonal temperature values) occurred in 1994–2013 (Figure 3). On the contrary, rarely warm winter and summer seasons had no significant peaks during the last 20-year interval, but occurred more evenly during the 100-year study period. For example, 59% of rarely warm summer seasons occurred during the second and third 20-year periods (1934–1973).
A tentative comparison between the occurrence of rarely cold or warm seasons and the average NAO indices during the five 20-year intervals suggested that although the portion of cold winters had a tendency to decrease with increasing wintertime NAO, as could be expected, the period 1974–1993 did not fit into that general picture. This interval was characterized by a large portion of cold winters, a typical number of mild winters and a high NAO value. Rarely warm winters were most uncommon during the period of the most negative winter NAO (1954–1973), and the share of rarely cold springs clearly decreased with increasing principle-component spring NAO index. Otherwise, no clear linkages were found between the occurrence of extreme seasons and the oscillation pattern.

3.3. Extreme Daily Events

The number of days with extremely low minimum temperatures in April, July and October (defined as 1st percentile of minimum daily temperatures) was noticeably smaller during the last 20-year interval compared to other time periods (4%–9% of all extremely cold days) (Figure 4). Extremely low minimum temperatures in April occurred particularly during the first 20-year interval of the study period (39% of days with extremely low temperatures), whereas extremely low temperatures in July and October were more evenly distributed between the time period of 1914–1993. Extremely low minimum temperatures in January occurred particularly in 1973–1994.
On average, 36% and 42% of days with extremely high maximum temperature in April and October (defined as 99th percentile of minimum daily temperatures, respectively, occurred during the last 20-year interval of the study period (Figure 4). Extremely high daily temperatures in January were more evenly distributed over the 20-year study intervals. Extremely high daily temperatures in July occurred particularly in the time period of 1954–1973 (43% of all extreme values).
Extreme daily precipitation sums were relatively evenly distributed over the studied 20-year intervals (Figure 5). However, a slight tendency of higher extreme daily precipitation sums towards the end of the study period could be observed.

4. Discussion

The results showed that northern Fennoscandia is experiencing increasing surface air temperatures, steeper trends in monthly mean minimum rather than maximum temperatures, slight increases in precipitation as well as a changing occurrence of extreme climate events. The most noticeable changes were observed in spring and autumn seasons and to a lesser extent in the summer. These results are consistent with studies from the circumpolar areas reporting increasing temperature trends [40,46], narrowing diurnal temperature ranges [50], shortening cold season, declining number of frost days [61,62,63,64], an increasing number of extreme warm events and a declining number of extreme cold events [11,48,51,65,66,67,68,69]. For example, the mean temperature in Finland has risen by 0.14 °C/decade during the years 1847–2013 with the highest increases in winter and spring months [45]. In Fennoscandia, a long-term decrease of diurnal temperature range has been observed. The warming trend has been most notable in March-May with a significant increase in mean maximum air temperature by 0.4 °C/decade during the period 1950–1995 [50]. The fact that hardly any statistically significant warming trends were detected in winter can be explained by the high variability of temperatures during that season. Fewer and less pronounced trends were likewise found in summer than in spring and autumn. This feature is common to other Nordic areas as well [40,50].
The trends detected hitherto are broadly consistent with climate model projections showing a warming influence of increasing greenhouse gas concentrations. In northern Fennoscandia under the high-emission RCP8.5 forcing scenario for the period 2040–2069, temperatures are projected to increase by 4–6 °C in winter and by 2–3 °C in summer, relative to 1981–2010, while the warming rate in spring and autumn is expected to fall between these values [70]. Simultaneously, the diurnal temperature range is projected to decrease by about 1 °C in winter, but less so in summer. The observed slight increase in extreme precipitation events is likewise consistent with projected increase in extreme precipitation on northern Fennoscandia [71,72].
Besides resulting from anthropogenic influences on the climate system, climate variations and trends may be due to natural internal processes within the climate system (internal variability), and natural external forcing (volcanic eruptions, solar activity). NAO is a leading pattern of weather and climate variability over the northern hemisphere [55], and it is known to have a significant influence on wintertime temperatures and precipitation in the Nordic region [73] and references therein. Although our simple comparison between the portions of rarely warm or cold seasons and seasonal NAO indices at 20-year averaging intervals does not allow any definite inferences, it seems as if the share of rarely cold springs clearly decreased with increasing principle-component spring NAO index. Stronger-than-average westerlies over the middle latitudes during a positive phase of NAO might, however, have a less pronounced impact on local climate in our study area than south of 65° N [74]. Of importance are also other atmospheric oscillation patterns, such as Siberian high [46] and Scandinavian blocking [75].
The reduced sea ice in the Barents and White Seas [75,76,77] and associated circulation changes have been regarded as likely principal drivers behind the observed warming in the Kola Peninsula [46]. During the most recent time span considered by us (1994–2013), the mean annual ice cover in Barents Sea was notably small [76], and substantial areas of the Barents Sea became ice-free year round [77]. Consistent with that, rarely warm spring and autumn seasons were frequent in northern Fennoscandia, while the portions of rarely cold spring, summer and autumn seasons were at their lowest (Figure 3).
In the homogeneity testing, we aimed to reveal the most pronounced inhomogeneities having the largest influence on the analyzed time series. This approach was driven by the sparse station network and the lack of available station history metadata. Although use was made of state-of-the-art homogenization algorithms in HOMER, the homogeneity testing performed in this study must be considered rather simplistic. However, we are confident that even this simplistic approach improves the robustness of analyzes and helps to assess uncertainties. First, at five stations out of nine, no or only isolated inhomogeneities were detected in the time series of monthly mean, minimum and maximum temperatures. Trend analyses for these stations can be regarded as rather reliable. Second, the inhomogeneities at the remaining four stations may be taken into account in a qualitative manner. One may argue that in the absence of no-climatic biases in the temperature data of stations 3 and 7, even greater warming trends had been analysed, whereas inhomogeneities detected in stations 5 and 8 potentially mean weaker warming trends.
A shortening of the cold season, declines in extremely cold climate events in all seasons and increases in extremely warm climate events, particularly in spring and autumn seasons, can have several consequences. In northern Fennoscandia, spring and autumn seasons are transitional periods of melting and formation of continuous seasonal snow, ice and ground frost. Snow covers the ground several months in the winter with the longest duration in the Scandinavian mountain range [78,79]. Increasing spring temperatures are likely to result in more efficient and earlier snow melt in the future. Furthermore, the observed increases in precipitation together with warmer air temperatures in the beginning of the cold season are likely to result in increases in rainfall and decreases in snowfall [80,81,82]. A shorter duration of snow cover and increasing air and soil temperatures alter the geophysical and hydrological characteristics of the high-latitude areas [3,78,83]. As the cryosphere, climate and terrestrial ecology are closely related, these changes have significant impacts on the structure and functioning of high-latitude ecosystems and human activities [79,84,85,86].
Decreases in the length of the cold season can result in major changes in vegetation and have a variety of impacts on distribution, abundance, migration and overwintering of high-latitude species [87,88,89]. Vegetation in northern Fennoscandia is characterized by coniferous forests, birch forests and open tundra. A warming climate is predicted to result in shrubification of tundra with important consequences for habitat availability and ecosystem functioning [90]. A shorter period of snow cover also significantly decreases surface albedo, which has a positive feedback on global climate change [3,91]. A majority of ecological studies have concentrated on studying impacts of warming during the spring and summer, whereas the autumn season has been largely neglected [92,93]. The significant temperature increases in the late autumn observed in this study highlights the need of more autumnal research in arctic and subarctic areas.
Hydrological changes in warming climate, such as increased river discharge and altered freeze-up and break-up timing for rivers, lakes and oceans, have important consequences in northern ecosystems and communities [94]. In the Barents region, for example, consequences of hydrological changes are assumed to include alterations in nutrient cycling, species distributions and animal fitness, which eventually are reflected in ecosystem services and local livelihoods [26]. Permafrost thawing has been reported in many parts of the circumpolar area as a consequence of warmer ground temperatures [95]. Permafrost and its dynamics are major drivers of hydrological and geomorphological processes [96]. The northern parts and mountain regions of Fennoscandia belong mainly to the zone of discontinuous permafrost. In these areas, thawing permafrost can cause various hazards, such as less stable ground and slope failures that can threaten local community infrastructure and become an increasing cost factor in the maintenance and construction of mountain infrastructure [97,98,99]. There is also evidence that palsas, peat covered permafrost mounds containing segregation ice and surrounded by wet mires, are shrinking in northern Fennoscandia [100].
Understanding the extreme events and their effects is one of the major challenges of current climate research [2]. For example, extreme weather events may affect the ecosystem functioning by causing or accelerating the shifts in species composition and distribution or by changing competitive interactions within the ecosystem. Sudden and extreme events can change the whole system characteristics through disturbance effects and can drive ecosystems beyond their stability and resilience [101,102,103]. It may be probable that reaching the tipping point of the near-zero °C in common cold season temperatures is critical, and northern ecosystems and societies are especially sensitive to this kind of regime shift [85].
Reindeer herding in northern Fennoscandia is a good example of the impacts of both gradual warming and extreme climate events on a socio-ecological system [104,105]. Reindeer access to lichen during the winter is strongly dependent on snow cover characteristics [106]. The formation of the snow cover during the autumn is considered crucial for all winter conditions. During unstable early winter with several 0-degree days, there is a high probability of icy snow cover or ground ice formation that prevents reindeer access to lichens [33,34,35,38]. Warmer and wetter winters have been reported to decrease reindeer condition and productivity and increase their mortality in Nordic countries and Russia. Extreme climate events, such as warm spells during the cold season and heavy rain-on-snow events can also result in formation of icy layers in the snowpack with negative impacts on reindeer populations [85]. A recent study [51] found that the rate of melt days in winter increased by 3–9 days decade−1 in Nordic arctic islands and mainland over the past 50 years. Furthermore, an increase in precipitation sum for winter melt days was observed [51]. Warm conditions in the late winter may lead to wet and slushy snow that hamper reindeer grazing and herding [35]. Increasing temperatures can also, e.g. lead to a declining extent of summer snowbeds and snow patches [82]. These isolated spots of snow in summer are important resources for reindeer through decreasing insect harassment and temperature stress and providing fresh high-quality fodder along the melting edges of snow [107].

5. Conclusions

Significant increasing trends in spring and autumn temperatures, increasing occurrence of extremely warm events and decreasing occurrence of extremely cold events suggest notable changes in northern Fennoscandian cold season characteristics. Based on climate model projections, these changes are not likely to decelerate in the future, rather vice versa, unless efficient mitigation actions will be realized. The shortening duration of the cold season together with higher minimum temperatures and more frequently occurring extremely warm climate events are likely to have major impacts on geophysical, hydrological and ecological as well as socio-economic systems of high latitude environments.

Supplementary Materials

Table S1 is available online at www.mdpi.com/2225-1154/5/1/16/s1.

Acknowledgments

We thank Annika Kristoffersson for providing data from the Abisko weather station. Kai Rasmus and Eirik Forland are acknowledged for their help with Sodankylä and Russian data. We thank Minna Turunen with her help on socio-economic effects of warming. We also thank two anonymous reviewers for constructive comments on the manuscript. SK was funded by the NCoE Tundra (the Nordic Council of Ministers) and Maj and Tor Nessling Foundation. SR was funded by the Finnish Cultural Foundation. KJ was partially funded by the Academy of Finland (Decision No. 278067 for the PLUMES project).

Author Contributions

Sonja Kivinen and Sirpa Rasmus initiated the study and acquired climate data from different sources. Sonja Kivinen performed trend analyses and extreme event analyses, Mikko Laapas carried out homogeneity testing of temperature data, and Kirsti Jylhä conducted comparisons related to NAO. Kirsti Jylhä and Sirpa Rasmus provided regular feedback on the analyses and helped develop the methodology part of the study. All authors contributed to the discussion and interpretation of the results and writing of the manuscript.

Conflicts of Interest

The authors declare no conflict of interest.

References

  1. ACIA. Arctic Climate Impact Assessment; Cambridge University Press: Cambridge, UK, 2005. [Google Scholar]
  2. IPCC. Climate Change 2013. The Physical Science Basis. Contribution of Working Group I to the Fifth Assessment Report of the Intergovernmental Panel on Climate Change; Cambridge University Press: Cambridge, UK; New York, NY, USA, 2003. [Google Scholar]
  3. Serreze, M.C.; Barry, R.G. Processes and impacts of Arctic amplification: A research synthesis. Glob. Planet. Chang. 2011, 77, 85–96. [Google Scholar] [CrossRef]
  4. Pithan, F.; Mauritsen, T. Arctic amplification dominated by temperature feedbacks in contemporary climate models. Nat. Geosci. 2014, 7, 181–184. [Google Scholar] [CrossRef]
  5. Vihma, T. Effects of Arctic sea ice decline on weather and climate: A review. Surv. Geophys. 2014, 35, 1175–1214. [Google Scholar] [CrossRef]
  6. Przybylak, R. Temporal and spatial variation of surface air temperature over the period of instrumental observations in the Arctic. Intern. J. Clim. 2000, 20, 587–614. [Google Scholar] [CrossRef]
  7. Overland, J.E.; Spillane, M.C.; Percival, D.B.; Wang, M.; Mofjeld, M. Seasonal and regional variation of Pan-Arctic surface air temperature over the instrumental record. J. Clim. 2004, 17, 3263–3282. [Google Scholar] [CrossRef]
  8. Ding, Q.; Walalce, J.M.; Battisti, D.S.; Steig, E.J.; Gallant, A.J.E.; Kim, H.-J.; Geng, L. Tropical forcing of the recent rapid Arctic warming in northeastern Canada and Greenland. Nature 2014, 509, 209–212. [Google Scholar] [CrossRef] [PubMed]
  9. Easterling, D.R.; Meehl, G.A.; Parmesan, C.; Changnon, S.A.; Karl, T.R.; Mearns, L.O. Climate extremes: Observations, modeling and impacts. Science 2000, 289, 2068. [Google Scholar] [CrossRef] [PubMed]
  10. Dankers, R.; Hiederer, R. Extreme Temperatures and Precipitation in Europe: Analysis of a High-Resolution Climate Change Scenario; EUR 23291; Office for Official Publications of the European Communities: Luxembourg, 2008. [Google Scholar]
  11. Rahmstorf, S.; Coumou, D. Increase of extreme weather events in a warming world. Proc. Natl. Acad. Sci. USA 2011, 108, 17905–17909. [Google Scholar] [CrossRef] [PubMed]
  12. Meehl, G.A.; Zwier, F.; Evans, J.; Knutson, T.; Mearns, L.; Whetton, P. Trends in extreme weather and climate events: Issues related to modeling extremes in projections of future climate change. B. Am. Meteorol. Soc. 2000, 81, 427–436. [Google Scholar] [CrossRef]
  13. Alexander, L.V.; Zhang, X.; Peterson, T.C.; Caesar, J.; Gleason, B.; Klein Tank, A.M.G.; Haylock, M.; Collins, D.; Trewin, B.; Rahimzadeh, F.; et al. Global observed changes in daily climate extremes of temperature and precipitation. J. Geophys. Res. 2006, 111, D05109. [Google Scholar]
  14. IPCC. Annex III: Glossary (ed. Planton, S.). In Climate Change 2013: The Physical Science Basis. Contribution of Working Group I to the fifth Assessment Report of the Intergovernmental Panel on Climate Change; Stocker, T.F., Qin, D., Plattner, G.-K., Tignor, M., Allen, S.K., Boschung, J., Nauels, A., Xia, Y., Bex, V., Midgley, P.M., Eds.; Cambridge University Press: Cambridge, UK, 2013. [Google Scholar]
  15. Wen, G.; Huang, G.; Hu, K.; Qu, X.; Tao, W.; Gong, H. Changes in the characteristics of precipitation over northern Eurasia. Theor. Appl. Climatol. 2015, 119, 653–665. [Google Scholar] [CrossRef]
  16. Ye, H.; Fetzer, E.J.; Behrangi, A.; Wong, S.; Lambrigtsen, B.H.; Wang, C.Y.; Cohen, J.; Gamelin, B.L. Increasing daily precipitation intensity associated with warmer air temperatures over northern Eurasia. J. Clim. 2016, 29, 623–636. [Google Scholar] [CrossRef]
  17. Horton, D.E.; Johnson, N.C.; Singh, D.; Swain, D.L.; Rajaratnam, B.; Diffenbaugh, N.S. Contribution of changes in atmospheric circulation patterns to extreme temperature trends. Nature 2015, 522, 465–469. [Google Scholar] [CrossRef] [PubMed]
  18. Trenbeth, K.E.; Fasullo, J.T.; Shepherd, T.G. Attribution of climate extreme events. Nat. Clim. Change 2015, 5, 725–730. [Google Scholar] [CrossRef]
  19. Francis, J.A.; Vavrus, S.J. Evidence linking Arctic Amplification to extreme weather in mid-latitudes. Geophys. Res. Lett. 2012, 39, L06801. [Google Scholar] [CrossRef]
  20. Cohen, J.; Screen, J.A.; Furtado, J.C.; Barlow, M.; Whittleston, D.; Coumou, D.; Francis, J.; Dethloff, K.; Entekhabi, D.; Overland, J.; et al. Recent Arctic amplification and extreme mid-latitude weather. Nat. Geosci. 2014, 7, 627–637. [Google Scholar] [CrossRef] [Green Version]
  21. Overland, J.E.; Francis, J.A.; Hall, R.; Hanna, E.; Kim, S.-J.; Vihma, T. The melting Arctic and midlatitude weather patterns: Are they connected? J. Clim. 2015, 28, 7917–7932. [Google Scholar] [CrossRef]
  22. Overland, J.E. A difficult Arctic science issue: Midlatitude weather linkages. Polar Sci. 2016, 10, 210–216. [Google Scholar] [CrossRef]
  23. Duarte, C.M.; Lenton, T.M.; Wadhams, P.; Wassmann, P. Abrupt climate change in the Arctic. Nat. Clim. Change 2012, 2, 60–62. [Google Scholar]
  24. European Environment Agency EEA. Climate Change, Impacts and Vulnerability in Europe; Environment Agency EEA: København, Denmark, 2012. [Google Scholar]
  25. Krug, J.; Eriksson, H.; Heidecke, C.; Kellomäki, S.; Köhl, M.; Lindner, M.; Saikkonen, K. Socio-economic Impacts—Forestry and Agriculture. In Second Assessment of Climate Change for the Baltic Sea Basin; Springer Regional Climate Studies; The BACC II Author Team, Ed.; Springer International Publishing: Cham, Switzerland, 2015; pp. 399–409. [Google Scholar]
  26. AMAP. Adaptation Actions for a Changing Arctic; Arctic Monitoring and Assessment Programme (AMAP): Oslo, Norway, 2017. (in press) [Google Scholar]
  27. AMAP. Snow, Water, Ice and Permafrost in the Arctic (SWIPA): Climate Change and the Cryosphere; Arctic Monitoring and Assessment Programme (AMAP): Oslo, Norway, 2011; p. 538. [Google Scholar]
  28. Ye, H.; Cohen, J. A shorter snowfall season associated with higher air temperatures over northern Eurasia. Environ. Res. Lett. 2013, 8, 014052. [Google Scholar] [CrossRef]
  29. The BACC II Author Team. Second Assessment of Climate Change for the Baltic Sea Basin; Springer Regional Climate Studies; Springer International Publishing: Cham, Switzerland, 2015. [Google Scholar]
  30. Bjerke, J.W.; Karlsen, S.R.; Høgda, K.A.; Malnes, E.; Jepsen, J.U.; Lovibind, S.; Vikhamar-Schuler, D.; Tømmervik, H. Record-low primary productivity and high plant damage in the Nordic Arctic Region in 2012 caused by multiple weather events and pest outbreaks. Environ. Res. Lett. 2015, 9, 084006. [Google Scholar] [CrossRef]
  31. Kivinen, S. Many a little makes a mickle: Cumulative land cover changes and traditional land use in the Kyrö reindeer herding district, northern Finland. Appl. Geogr. 2015, 63, 204–211. [Google Scholar] [CrossRef]
  32. Turunen, M.; Reinert, E.; Kietäväinen, A. Indigenous and local economies. In Adaptation Actions for a Changing Arctic; Arctic Monitoring and Assessment Programme (AMAP): Oslo, Norway, 2017. (in press) [Google Scholar]
  33. Kivinen, S.; Rasmus, S. Observed cold season changes in a Fennoscandian fell area over the past three decades. Ambio 2015, 44, 214–225. [Google Scholar] [CrossRef] [PubMed]
  34. Rasmus, S.; Kivinen, S.; Bavay, M.; Heiskanen, J. Local and regional variability in snow conditions in northern Finland: A reindeer herding perspective. Ambio 2016, 45, 398–414. [Google Scholar] [CrossRef] [PubMed]
  35. Turunen, M.; Rasmus, S.; Bavay, M.; Ruosteenoja, K.; Heiskanen, J. Coping with increasingly difficult weather and snow conditions: Reindeer herders’ views on climate change impacts and coping strategies. Clim. Risk Manag. 2016, 11, 15–36. [Google Scholar] [CrossRef]
  36. Lee, S.E.; Press, M.C.; Lee, J.A.; Ingold, T.; Kurttila, T. Regional effects of climate change on reindeer: A case study of the Muotkatunturi region in Finnish Lapland. Polar Res. 2000, 19, 99–105. [Google Scholar] [CrossRef]
  37. Kumpula, J.; Colpaert, A. Effects of weather and snow conditions on reproduction and survival of semi-domesticated reindeer (R. t. tarandus). Polar Res. 2003, 22, 225–233. [Google Scholar] [CrossRef]
  38. Helle, T.; Kojola, I. Demographics in an alpine reindeer herd: Effects of density and winter weather. Ecography 2008, 31, 221–230. [Google Scholar] [CrossRef]
  39. Kietäväinen, A.; Tuulentie, S. Tourism strategies and climate change: Rhetoric at both strategic and grassroots levels about growth and sustainable development in Finland. J. Sustain. Tour. 2013, 21, 845–861. [Google Scholar] [CrossRef]
  40. Tietäväinen, H.; Tuomenvirta, H.; Venäläinen, A. Annual and seasonal mean temperatures in Finland during the last 160 years based on gridded temperature data. Int. J. Climatol. 2010, 30, 2247–2256. [Google Scholar] [CrossRef]
  41. Hanssen-Bauer, I.; Førland, E. Temperature and precipitation variations in Norway 1900–1994 and their links to atmospheric circulation. Int. J. Climatol. 2000, 20, 1693–1708. [Google Scholar] [CrossRef]
  42. Førland, E.J.; Hanssen-Bauer, I. Past and future climate variations in the Norwegian Arctic: Overview and novel analyses. Polar Res. 2003, 22, 113–124. [Google Scholar] [CrossRef]
  43. Vikhamar-Schuler, D.; Hanssen-Bauer, I.; Førland, E. Long-Term Climate Trends of Finnmarksvidda, Northern-Norway; Report no. 6/2010; Norwegian Meteorological Institute: Oslo, Norway, 2010. [Google Scholar]
  44. Yang, Z.; Hanna, E.; Callaghan, T.V.; Jonasson, C. How can meteorological and microclimate simulations improve understanding of 1913–2010 climate change around Abisko, Swedish Lapland? Meteorol. Appl. 2011, 19, 454–463. [Google Scholar] [CrossRef]
  45. Mikkonen, S.; Laine, M.; Mäkelä, H.; Gregow, H.; Tuomenvirta, H.; Lahtinen, M.; . Laaksonen, A. Trends in the average temperature in Finland, 1847–2013. Stoch. Environ. Res. Risk Assess. 2015, 29, 1521–1529. [Google Scholar] [CrossRef]
  46. Marshall, G.J.; Vignols, R.M.; Rees, W.G. Climate Change in the Kola Peninsula, Arctic Russia, during the Last 50 Years from Meteorological Observations. J. Clim. 2016, 29, 6823–6840. [Google Scholar] [CrossRef]
  47. Svyashchennikov, P.; Førland, E. Long-Term Trends in Temperature, Precipitation and Snow Conditions in Northern Russia; Report no. 9/2010; Norwegian Meteorological Institute: Oslo, Norway, 2010. [Google Scholar]
  48. Bulygina, O.N.; Razuvaev, V.N.; Korshunova, N.N.; Groisman, P.Y. Climate variations and changes in extreme climate events in Russia. Environ. Res. Lett. 2007, 2, 044020. [Google Scholar] [CrossRef]
  49. Heino, R.; Brázdil, R.; Førland, E.; Tuomenvirta, H.; Alexandersson, H.; Beniston, M.; Pfister, C.; Rebetez, M.; Rosenhagen, G.; Rösner, S.; et al. Progress in the study of climatic extremes in Northern and Central Europe. Clim. Change 1999, 42, 151–181. [Google Scholar] [CrossRef]
  50. Tuomenvirta, H.; Alexandersson, H.; Drebs, A.; Frich, P.; Nordli, P.O. Trends in Nordic and Arctic temperature extremes and ranges. J. Clim. 2000, 13, 977–990. [Google Scholar] [CrossRef]
  51. Vikhamar-Schuler, D.; Isaksen, K.; Haugen, J.E.; Tømmervik, H.; Luks, B.; Schuler, T.V.; Bjerke, J.W. Changes in winter warming events in the Nordic Arctic Region. J. Clim. 2016, 29, 6223–6244. [Google Scholar] [CrossRef]
  52. The Finnish Meteorological Institute’s open data. Available online: https://en.ilmatieteenlaitos.fi/open-data (accessed 10 May 2015).
  53. The Eklima web portal of Norwegian Meteorological Institute. Available online: www.eklima.met.no (accessed 23 September 2015).
  54. European Climate Assessment & Dataset. Available online: http://eca.knmi.nl (accessed 23 September 2015).
  55. Hurrell, J.W.; Kushnir, Y.; Ottersen, G.; Visbeck, M. An Overview of the North Atlantic Oscillation. In The North Atlantic Oscillation: Climate Significance and Environmental Impact; Geophysical Monograph Series; American Geophysical Union: Washington, DC, USA, 2003; Volume 134, pp. 1–35. [Google Scholar]
  56. NAO Index Data. Provided by the Climate Analysis Section, NCAR, Boulder, USA, Hurrell (2003). Updated regularly. Available online: https://climatedataguide.ucar.edu/climate-data/hurrell-north-atlantic-oscillation-nao-index-pc-based (accessed 1 February 2017).
  57. Mestre, O.; Domonkos, P.; Picard, F. HOMER: A Homogenization Software—methods and Applications. Idöjárás 2013, 117, 47–67. [Google Scholar]
  58. Venema, V.K.C.; Mestre, O.; Aguilar, E.; Auer, I. Benchmarking homogenization algorithms for monthly data. Clim. Past 2012, 8, 89–115. [Google Scholar] [CrossRef]
  59. Hawkins, D.M. Fitting Multiple Change-Point Models to Data. Comput. Stat. Data Anal. 2001, 37, 323–341. [Google Scholar] [CrossRef]
  60. Engström, E.; Carlund, T.; Laapas, M.; Aalto, J.; Drebs, A.; Lundstad, E.; Gjelte, H.M.; Vint, K. NORDHOM —A Nordic Collaboration to Homogenize Long-Term Climate Data. In Proceedings of the EGU General Assembly 2015, Vienna, Austria, 12–17 April 2015.
  61. Kaufman, D.S.; Schneider, D.P.; McKay, N.P.; Ammann, C.M.; Bradley, R.S.; Briffa, K.R.; Miller, G.H.; Otto-Bliesner, B.L.; Overpeck, J.T.; Vinther, B.M.; et al. Recent warming reverses long-term Arctic cooling. Science 2009, 325, 1236–1239. [Google Scholar] [CrossRef] [PubMed]
  62. Vincent, L.A.; Zhang, X.; Brown, R.D.; Feng, Y.; Mekis, E.; Milewska, E.J.; Wan, H.; Wang, X.L. Observed trends in Canada’s climate and influence of low-frequency variability modes. J. Clim. 2015, 28, 4545–4560. [Google Scholar] [CrossRef]
  63. Anisimov, O.; Kokorev, V.; Zhil’tsova, Y. Temporal and spatial patterns of modern climatic warming: Case study of Northern Eurasia. Clim. Change 2013, 118, 871–883. [Google Scholar] [CrossRef]
  64. Jones, P.D.; Lister, D.H.; Osborn, T.J.; Harpham, C.; Salmon, M.; Morice, C.P. Hemispheric and large-scale land-surface air temperature variations: An extensive revision and an update to 2010. J. Geophys. Res. Atmos. 2012, 117. [Google Scholar] [CrossRef] [Green Version]
  65. Beniston, M.; Stephenson, D.B.; Christensen, O.; Ferro, C.A.; Frei, C.; Goyette, S.; Halsnaes, K.; Holt, T.; Jylhä, K.; Koffi, B.; et al. Future extreme events in European climate: An exploration of regional climate model projections. Clim. Change 2007, 81, 71–95. [Google Scholar] [CrossRef]
  66. Frich, P.; Alexander, L.V.; Della-Marta, P.; Gleason, B.; Haylock, M.; Tank, A.K.; Peterson, T. Observed coherent changes in climatic extremes during the second half of the twentieth century. Clim. Res. 2002, 19, 193–212. [Google Scholar] [CrossRef]
  67. Donat, M.G.; Alexander, L.V.; Yang, H.; Durre, I.; Vose, R.; Dunn, R.J.; Willett, K.M.; Aguilar, E.; Brunet, M.; Caesar, J.; et al. Updated analyses of temperature and precipitation extreme indices since the beginning of the twentieth century: The HadEX2 dataset. J. Geophys. Res. Atmos. 2013, 118, 2098–2118. [Google Scholar] [CrossRef]
  68. Wang, X.L.; Feng, Y.; Vincent, L.A. Observed changes in one-in-20 year extremes of Canadian surface air temperatures. Atmos.-Ocean 2014, 52, 222–231. [Google Scholar] [CrossRef]
  69. Beniston, M. Ratios of record high to record low temperatures in Europe exhibit sharp increases since 2000 despite a slowdown in the rise of mean temperatures. Clim. Change 2015, 129, 225–237. [Google Scholar] [CrossRef]
  70. Ruosteenoja, K.; Jylhä, K.; Kämäräinen, M. Climate projections for Finland under the RCP forcing scenarios. Geophysica 2016, 51, 17–50. [Google Scholar]
  71. Nikulin, G.; Kjellström, E.; Hansson, U.L.; Strandberg, G.; Ullerstig, A. Evaluation and future projections of temperature, precipitation and wind extremes over Europe in an ensemble of regional climate simulations. Tellus A 2011, 63, 41–55. [Google Scholar] [CrossRef]
  72. Lehtonen, I.; Ruosteenoja, K.; Jylhä, K. Projected changes in European extreme precipitation indices on the basis of global and regional climate model ensembles. Int. J. Climatol. 2014, 34, 1208–1222. [Google Scholar] [CrossRef]
  73. Seitola, T.; Järvinen, H. Decadal climate variability and potential predictability in the Nordic region. Boreal Environ. Res. 2014, 19, 387–407. [Google Scholar]
  74. Blenckner, T.; Järvinen, M.; Weyhenmeyer, G.A. Atmospheric circulation and its impact on ice phenology in Scandinavia. Boreal Environ. Res. 2004, 9, 371–380. [Google Scholar]
  75. Dobricic, S.; Vignati, E.; Russo, S. Large-scale atmospheric warming in winter and the Arctic sea ice retreat. J. Clim. 2016, 29, 2869–2888. [Google Scholar] [CrossRef]
  76. Matishov, G.; Moiseev, D.; Lyubina, O.; Zhichkin, A.; Dzhenyuk, S.; Karamushko, O.; Frolova, E. Climate and cyclic hydrobiological changes of the Barents Sea from the twentieth to twenty-first centuries. Polar Biol. 2012, 35, 1773. [Google Scholar] [CrossRef]
  77. Parkinson, C.L. Spatially mapped reductions in the length of the Arctic sea ice season. Geophys. Res. Lett. 2014, 41, 4316–4322. [Google Scholar] [CrossRef] [PubMed]
  78. Brown, R.D.; Möte, P.W. The response of northern hemisphere snow cover to a changing climate. J. Clim. 2009, 22, 2124–2145. [Google Scholar] [CrossRef]
  79. Callaghan, T.V.; Johansson, M.; Brown, R.D.; Groisman, P.Y.; Labba, N.; Radionov, V.; Barry, R.G.; Bulygina, O.N.; Essery, R.L.; Frolov, D.M.; et al. The changing face of Arctic snow cover: A synthesis of observed and projected changes. Ambio 2011, 40, 17–31. [Google Scholar] [CrossRef]
  80. Räisänen, J. Warmer climate: Less or more snow? Clim. Dynam. 2008, 30, 307–319. [Google Scholar] [CrossRef]
  81. Derksen, C.; Brown, R. Spring snow cover extent reductions in the 2008–2012 period exceeding climate model projections. Geophys. Res. Lett. 2012, 39, 19. [Google Scholar] [CrossRef]
  82. Kivinen, S.; Kaarlejärvi, E.; Jylhä, K.; Räisänen, J. Spatiotemporal distribution of threatened high-latitude snowbed and snow patch habitats in warming climate. Environ. Res. Lett. 2012, 034024. [Google Scholar] [CrossRef]
  83. Choi, G.; Robinson, D.A.; Kang, S. Changing Northern Hemisphere Snow Seasons. J. Clim. 2010, 23, 5305–5310. [Google Scholar] [CrossRef]
  84. Post, E.; Forchhammer, M.C.; Bret-Harte, M.S.; Callaghan, T.V.; Christensen, T.R.; Elberling, B.; Fox, A.D.; Gilg, O.; Hik, D.S.; Høye, T.T.; et al. Ecological dynamics across the Arctic associated with recent climate change. Science 2009, 325, 1355–1358. [Google Scholar] [CrossRef] [PubMed]
  85. Hansen, B.; Isaksen, K.; Benestad, R.; Kohler, J.; Pedersen, Å.; Loe, L.E.; Coulson, S.; Larsen, J.; Varpe, Ø. Warmer and wetter winters: Characteristics and implications of an extreme weather event in the High Arctic. Environ. Res. Lett. 2014, 9, 114021. [Google Scholar] [CrossRef]
  86. Euskirchen, E.; Turetsky, M.; O’Donnell, J.; Daanen, R.P. Snow, Permafrost, Ice Cover, and Climate Change. Glob. Environ. Chang. 2014, 199–204. [Google Scholar]
  87. Pauli, J.N.; Zuckerberg, B.; Whiteman, J.P.; Porter, W. The subnivium: A deteriorating seasonal refugium. Front. Ecol. Environ. 2013, 11, 260–267. [Google Scholar]
  88. Pearson, R.G.; Phillips, S.J.; Loranty, M.M.; Beck, P.S.; Damoulas, T.; Knight, S.J.; Goetz, S.J. Shifts in Arctic vegetation and associated feedbacks under climate change. Nature Clim. Change 2013, 3, 673–677. [Google Scholar]
  89. Ruosteenoja, K.; Räisänen, J.; Venäläinen, A.; Kämäräinen, M. Projections for the duration and degree days of the thermal growing season in Europe derived from CMIP5 model output. Int. J. Climatol. 2016, 36, 3039–3055. [Google Scholar] [CrossRef]
  90. Myers-Smith, I.H.; Forbes, B.C.; Wilmking, M.; Hallinger, M.; Lantz, T.; Blok, D.; Tape, K.D.; Macias-Fauria, M.; Sass-Klaassen, U.; Esther, L.; et al. Shrub expansion in tundra ecosystems: Dynamics, impacts and research priorities. Environ. Res. Lett. 2011, 6, 045509. [Google Scholar] [CrossRef]
  91. Sturm, M.; Holmgren, J.; McFadden, J.P.; Liston, G.E.; Chapin, F.S., III; Racine, C.H. Snow-shrub interactions in Arctic tundra: A hypothesis with climatic implications. J. Clim. 2001, 14, 336–344. [Google Scholar] [CrossRef]
  92. Gallinat, A.S.; Primack, R.B.; Wagner, D.L. Autumn, the neglected season in climate change research. Trends Ecol. Evol. 2015, 30, 169–176. [Google Scholar] [CrossRef] [PubMed]
  93. Liu, Q.; Fu, Y.H.; Zhu, Z.; Liu, Y.; Liu, Z.; Huang, M.; Janssens, I.A.; Piao, S. Delayed autumn phenology in the Northern Hemisphere is related to change in both climate and spring phenology. Glob. Change Biol. 2016, 22, 3702–3711. [Google Scholar] [CrossRef] [PubMed]
  94. Olsen, M.S.; Callaghan, T.V.; Reist, J.D.; Reiersen, L.O.; Dahl-Jensen, D.; Granskog, M.A.; Goodison, B.; Hovelsrud, G.K.; Johansson, M.; Kallenborn, R.; et al. The changing Arctic cryosphere and likely consequences: An overview. Ambio 2011, 40, 111–118. [Google Scholar] [CrossRef]
  95. Grosse, G.; Goetz, S.; McGuire, A.D.; Romanovsky, V.E.; Schuur, E.A. Changing permafrost in a warming world and feedbacks to the Earth system. Environ. Res. Lett. 2016, 11, 040201. [Google Scholar] [CrossRef]
  96. Anisimov, O.A.; Nelson, F.E. Permafrost zonation and climate change in the northern hemisphere: Results from transient general circulation models. Clim. Chang. 1997, 35, 241–258. [Google Scholar] [CrossRef]
  97. Nelson, F.E.; Anisimov, O.A.; Shiklomanov, N.I. Climate change and hazard zonation in the circum-Arctic permafrost regions. Nat. Hazards 2002, 26, 203–225. [Google Scholar] [CrossRef]
  98. Isaksen, K.; Sollid, J.L.; Holmlund, P.; Harris, C. Recent warming of mountain permafrost in Svalbard and Scandinavia. J. Geophys. Res. Earth Surface 2007, 112. [Google Scholar] [CrossRef]
  99. Harris, C.; Arenson, L.U.; Christiansen, H.H.; Etzelmüller, B.; Frauenfelder, R.; Gruber, S.; Isaksen, K. Permafrost and climate in Europe: Monitoring and modelling thermal, geomorphological and geotechnical responses. Earth-Sci. Reviews 2009, 92, 117–171. [Google Scholar] [CrossRef] [Green Version]
  100. Luoto, M.; Heikkilä, R.K.; Carter, T.R. Loss of palsa mires in Europe and biological consequences. Environ. Conserv. 2004, 31, 30–37. [Google Scholar] [CrossRef]
  101. Jentsch, A.; Kreyling, J.; Beierkuhnlein, C. A new generation of climate change experiments: Events, not trends. Front. Ecol. Environ. 2007, 5, 315–324. [Google Scholar] [CrossRef]
  102. Bokhorst, S.; Phoenix, G.K.; Berg, M.P.; Callaghan, T.V.; Kirby-Lambert, C.; Bjerke, J.W. Climatic and biotic extreme events moderate long-term responses of above- and belowground sub-Arctic heathland communities to climate change. Glob. Change Biol. 2015, 21, 4063–4075. [Google Scholar] [CrossRef] [PubMed]
  103. Vasseur, D.A.; DeLong, J.P.; Gilbert, B.; Greig, H.S.; Harley, C.D.; McCann, K.S.; Savage, V.; Tunney, T.D.; O'Connor, M.I. Increased temperature variation poses a greater risk to species than climate warming. Proc. R. Soc. Lond. B: Biol. Sci. 2014, 281, 20132612. [Google Scholar] [CrossRef] [PubMed]
  104. Riseth, J.Å.; Tømmervik, H.; Helander-Renvall, E.; Labba, N.; Johansson, C.; Malnes, E.; Bjerke, J.W.; Jonsson, C.; Pohjola, V.; Sarri, L.E.; et al. Sámi traditional ecological knowledge as a guide to science: Snow, ice and reindeer pasture facing climate change. Polar Rec. 2011, 47, 202–217. [Google Scholar] [CrossRef]
  105. Vuojala-Magga, T.; Turunen, M.; Ryyppö, T.; Tennberg, M. Resonance strategies of Sami reindeer herding during climatically extreme years in northernmost Finland in 1970–2007. Arctic 2011, 64, 227–241. [Google Scholar]
  106. Horstkotte, T.; Roturier, S. Does forest stand structure impact the dynamics of snow on winter grazing grounds of reindeer (Rangifer t. tarandus)? For. Ecol. Manage 2013, 291, 162–171. [Google Scholar] [CrossRef]
  107. Van Oort, B.; Rautio, P.; Denisov, D. Terrestrial and freshwater ecosystems. In Adaptation Actions for a Changing Arctic; Arctic Monitoring and Assessment Programme (AMAP): Oslo, Norway, 2017. (in press) [Google Scholar]
Figure 1. The location of weather stations in northern Fennoscandia. (1) Abisko, (2) Sodankylä, (3) Sihccajavri, (4) Tromsø, (5) Vardø, (6) Teriberka, (7) Kandalaksa, (8) Svyatoy Nos, (9) Ostrov Sosnovez.
Climate 05 00016 g001
Figure 2. (a) The average number of frost days (TMin < 0 °C) and (b) a frost day trend (change in the number of frost days/100 years) in April-May and September-October in nine studied weather station. Stations 1, 6, and 9 are homogeneous, and only isolated inhomogeneities were detected in stations 2 and 4.
Climate 05 00016 g002
Figure 3. The total proportion of rarely cold and warm seasons (10th and 90th percentile of mean seasonal temperatures defined separately for each weather station) observed in 20-year study intervals in northern Fennoscandia. (a) December-February, (b) March–May, (c) June-August, and (d) September–November.
Climate 05 00016 g003
Figure 4. The total proportion of extremely low daily minimum temperatures and extremely high daily maximum temperatures (1st percentile of minimum temperatures and 99th percentile of maximum temperatures defined separately for each weather station) observed in 20-year study intervals in northern Fennoscandia. (a) January, (b) April, (c) July, and (d) October. (Stations 2, 4 and 5 excluded from maximum temperature calculations).
Climate 05 00016 g004
Figure 5. The total proportion of extremely high daily precipitation (99th percentile of daily precipitation sum defined separately for each weather station) observed in 20-year study intervals in northern Fennoscandia. (a) January, (b) April, (c) July, and (d) October.
Climate 05 00016 g005
Table 1. Weather stations included in the study and their general climate characteristics. Annual mean temperature (Tmean), January mean temperature (TJan), July mean temperature (TJul) and annual precipitation sum (Prec) were calculated for the period 1914–2013.
StationCountryAltitudeTmeanTJanTJulPrec
(m.a.s.l.)(°C)(°C)(°C)(mm)
1AbiskoSweden388−0.5−10.711,7307
2SodankyläFinland179−0.5−13.714.8485
3SihccajavriNorway382−2.5−14.412.6383
4TromsøNorway1002.8−3.612.01015
5VardøNorway141.6−4.59.3570
6TeriberkaRussia330.8−7.911.4470
7KandalaksaRussia260.4−11.914.7462
8Svyatoy NosRussia700.2−7.39.2412
9Ostrov SosnovezRussia15−0.6−9.28.6345
Table 2. Trends (p < 0.05) and the 95% confidence intervals over the period 1914–2013 for monthly and annual means of daily mean, minimum and maximum temperatures (°C/decade) and monthly and annual precipitation sums (mm/decade) using a least-squares method. Sen’s trend estimate produced nearly identical results (not shown in the table). Homogeneous stations (1, 6, 9) or stations with only isolated inhomogeneities (2, 4) are marked in bold. Blanks indicate the absence of statistically significant trends.
StationJanFebMarAprMayJunJulAugSepOctNovDecAnnual
TMean
(°C)
1 0.2 ± 0.10.2 ± 0.10.2 ± 0.1 0.1 ± 0.10.2 ± 0.1 0.1 ± 0.1
2 0.3 ± 0.20.1 ± 0.1
3 0.2 ± 0.20.2 ± 0.1 -0.1 ± 0.1
4 0.2 ± 0.1
5 0.2 ± 0.10.2 ± 0.10.2 ± 0.10.1 ± 0.1 0.1 ± 0.10.1 ± 0.1 0.1 ± 0.1
6 0.3 ± 0.20.1 ± 0.10.1 ± 0.1 0.1 ± 0.1
7 0.2 ± 0.2 0.1 ± 0.10.1 ± 0.1
80.2 ± 0.2 0.4 ± 0.20.2 ± 0.20.2 ± 0.1 0.1 ± 0.10.2 ± 0.1 0.2 ± 0.20.2 ± 0.1
9 0.3 ± 0.2 0.1 ± 0.1 0.1 ± 0.1 0.2 ± 0.1
TMin
(°C)
1 0.2 ± 0.20.3 ± 0.10.3 ± 0.10.2 ± 0.1 0.2 ± 0.10.1 ± 0.10.2 ± 0.1 0.1 ± 0.1
2 0.4 ± 0.30.3 ± 0.20.2 ± 0.10.2 ± 0.10.2 ± 0.10.2 ± 0.10.2 ± 0.10.3 ± 0.2 0.2 ± 0.1
3 0.3 ± 0.20.2 ± 0.1
4 0.2 ± 0.1 0.2 ± 0.1
50.1 ± 0.10.1 ± 0.10.3 ± 0.10.2 ± 0.10.2 ± 0.10.1 ± 0.10.1 ± 0.10.1 ± 0.10.1 ± 0.10.2 ± 0.1 0.2 ± 0.1
6 0.3 ± 0.20.2 ± 0.20.2 ± 0.10.1 ± 0.1 0.1 ± 0.10.1 ± 0.1 0.1 ± 0.1
7 0.3 ± 0.3 0.1 ± 0.1 0.1 ± 0.1
80.2 ± 0.20.3 ± 0.20.5 ± 0.20.3 ± 0.20.3 ± 0.10.2 ± 0.10.2 ± 0.1 0.2 ± 0.10.3 ± 0.1 0.2 ± 0.20.3 ± 0.1
9 0.5 ± 0.20.2 ± 0.20.2 ± 0.10.1 ± 0.10.2 ± 0.1 0.1 ± 0.10.2 ± 0.2 0.2 ± 0.1
TMax
(°C)
1 0.2 ± 0.10.3 ± 0.10.2 ± 0.1 0.2 ± 0.1 0.1 ± 0.1
2 0.2 ± 0.20.2 ± 0.10.2 ± 0.2 0.1 ± 0.1
3n.d.n.d.n.d.n.d.n.d.n.d.n.d.n.d.n.d.n.d.n.d.n.d.n.d.
4 0.2 ± 0.10.2 ± 0.10.3 ± 0.1
5 0.2 ± 0.20.2 ± 0.10.2 ± 0.1 0.2 ± 0.1
6 0.2 ± 0.2 0.2 ± 0.2
7 0.3 ± 0.20.2 ± 0.10.3 ± 0.10.2 ± 0.1
8 0.3 ± 0.20.2 ± 0.20.1 ± 0.2 -0.2 ± 0.2 0.2 ± 0.1 0.2 ± 0.2
9 0.3 ± 0.20.1 ± 0.10.1 ± 0.10.1 ± 0.10.1 ± 0.1 0.2 ± 0.1
Prec
(mm)
1 1 ± 1 5 ± 4
2
3 3 ± 1 8 ± 7
4 4 ± 2 3 ± 418 ± 11
5 4 ± 2 3 ± 22 ± 2
6 1 ± 1 3 ± 2 2 ± 22 ± 2 1 ± 1
74 ± 13 ± 13 ± 11 ± 13 ± 2 3 ± 2 4 ± 24 ± 14 ± 138 ± 7
8 2 ± 1
92 ± 12 ± 11 ± 1 2 ± 22 ± 23 ± 1

