Article

Elevational Trends in Usnic Acid Concentration of Lichen Parmelia flexilis in Relation to Temperature and Precipitation

School of Health and Allied Sciences, Faculty of Health Sciences, Pokhara University, Lekhnath-12, P.O. Box 427, Kaski, Nepal
*
Author to whom correspondence should be addressed.
Submission received: 31 December 2016 / Revised: 24 May 2017 / Accepted: 25 May 2017 / Published: 27 May 2017

Abstract

:
Usnic acid contents in acetone extracts of 31 samples of lichen Parmelia flexilis collected from different altitudes were identified using thin layer chromatography (TLC) and determined by high performance liquid chromatography (HPLC). The usnic acid content varied in between highest 5.13% to lowest 1.66% in oven dried (80 °C) lichen samples. The species collected from lower altitudes all show high levels of usnic acid. The negative relationship between usnic acid and altitude was obtained. Statistically, it is revealed that there is a significant difference between average percentages of usnic acid in lichen samples with varying altitudes (p < 0.05). Beside these, the precipitation averages of the regions where the species have been collected were linked with the content of usnic acid. It is clear that lichens from the regions receiving the highest precipitation produced lower amounts of usnic acid. The results suggest that the production of secondary metabolite in lichens is altered due to the climatic variables like temperature and precipitation at different altitude gradients.

1. Introduction

According to climate scientists, a long-term change in the earth’s climate is likely to continue over this century and beyond. The main reason for this is the increased concentration of carbondioxide and other heat trapping greenhouse gasses produced by human activities. Understanding and predicting the responses of climate change is essential to long-term conservation strategy [1]. Research to examine the species response to climate change would draw complementary data sets from observations and functional analyses, i.e., changed species interaction and chemical compositions. Global climate change conditions often alter plant chemical composition, which in turn can affect food and fodder quality and decomposition rates [2]. These alterations in the chemical composition of plants grown under the current climate can provide significant information concerning the impact of climate change on synthesis of secondary metabolites. Therefore, it is pertinent to investigate the effects of temperature and precipitation on production of secondary metabolites in plants.
Apart from being an excellent air pollution indicator, another little explored aspect of lichen is its chemistry, which is gaining importance in climate change studies [3]. Lichens are highly valued ecological indicators, known for their sensitivity to a wide variety of environmental factors like air quality and climate change. The anticipated climate change is predominately associated with the depletion of the atmospheric ozone layer, allowing more UV-B radiation exposure to living organisms [4]. Since many lichen compounds absorb UV-B [5] an increase in production of those compounds is expected with continued climate change. Lichen fungi are known to produce over 800 secondary metabolites, most of these compounds have bioactive properties [6]. Most natural products in lichens are small aromatic polyketides synthesized by the fungal partner in the symbiosis [7]. Production of such metabolites in fungi may be influenced directly or indirectly by numerous environmental stimulants. For example, in a study on Cladonia chlorophaea, the levels of fumarprotocetraric acid, a polyketide, were found to vary among individuals within the same species. One explanation for inconsistency of these metabolites in lichen fungi may be that changes in the environment affect regulatory pathways that depend on fungal developmental and environmental cues [8].
The most widely studied polyketide secondary metabolite produced by lichen-forming fungi is usnic acid, a cortical compound that absorbs UV light. Seasonal and geographic variation has been shown to occur in production of the usnic acid in lichens Flavocetraria nivalis and Nephroma arcticum in Arctic and Antarctic regions [9,10]. These are regions that are highly exposed to strong UV light, desiccating winds, and harsh temperature changes. The main objective of this study was to determine the concentrations of usnic acid in the selected lichen at varying altitudes in the Kaski district, Nepal. Common analytical methods (extraction, separation and HPLC) were used to meet these objectives.

2. Materials and Methods

2.1. Species, Sampling Strategy, and Chemicals

Lichen Parmelia flexilis species was chosen for this experiment, (Figure 1). P. flexilis is a foliose lichen that grows on exposed rocks and plant surfaces like trunks, branches, and twigs belonging to the family, Parmeliceae (Ascomycotina). P. flexilis has a greenish grey upper surface and a blackish lower surface foliose [11].
The sampling of lichen occurred in the different regions of Kaski district, such as Ghandruk (28.4633° N–83.8261° E), Landruk (28.2219° N–83.4932° E), Chhomrong (28.4193° N–83.8181° E), Lumle (28.3762° N–83.8314° E), Sikles (28.3578° N–84.1052° E), and Pokhara (28.2380° N–83.9956° E). Vouchers were collected, identified, and deposited at the National Herbarium and Plant Laboratory, Godawari, Lalitpur, Nepal (00L5). The lichen was collected from several microsites at each altitude and mixed together as one sample per altitude. Usnic acid was estimated from 31 Lichen samples of P. flexilis collected from different altitudes (841–2250 m asl) at the same time in the summer of 2015. All the solvents and chemicals used in the experiments were of HPLC grade from Sigma-Aldrich, Germany.

2.2. Extraction and Thin Layer Chromatography (TLC) Analysis

The samples were oven dried at 80 °C for 24 h [12] and foreign matter was removed prior to grinding. The powdered samples were extracted in 0.05 g amount in 10 mL acetone at room temperature. The extracts were stored in a dark freezer until HPLC analysis. A portion of acetone extracted samples were processed using thin layer chromatography. The protocol was standardized by placing 46 µL on each spot of the silica-coated TLC plate and placed in solvent (toluene 200 mL: glacial acetic acid 30 mL) for migration of the solvent to the top of the plate. After drying, pictures were taken of each plate for short-wave (254 nm) and long-wave (365 nm) ultraviolet light. The plates were then sprayed with 10% sulphuric acid and heated in an 80 °C oven until colors developed (10 min). Secondary metabolite was determined by comparison with known characteristics by using a standard retention factor (Rf) comparison of usnic acid.

2.3. Quantitative Analysis by High Performance Liquid Chromatography (HPLC)

2.3.1. Sample Preparation for the HPLC Analysis

HPLC analyses were performed for quantitative determination of usnic acid present in lichen extracts. Before the analysis, extracts were passed through 0.45 μm filters. After the filtration process, owing to solvent loss due to evaporation, solutions were made up to the volume of 10.0 mL with acetone, and then injected into the HPLC system in 20 μL aliquots [13].

2.3.2. Analytical Conditions

An Agilent 1290 HPLC System equipped with a diode array detector (DAD) and autosampler was used. A reverse phase C18, 5 µm particle size in a 250 × 4.6 mm I.D. stainless steel column was also used. The flow rate was 0.8 mL/min. For usnic acid detection at 245 nm, a mixture of methanol and phosphate buffer (pH 7.4) (70:30 v/v) was used as a mobile phase. 20μL aliquots of the extracts were injected into the HPLC system. Each analysis was carried out in a triplicate. The calibration curve for usnic acid was obtained with five samples of various concentrations (20 mg/L–100 mg/L) using linear regression analysis (Figure 2).

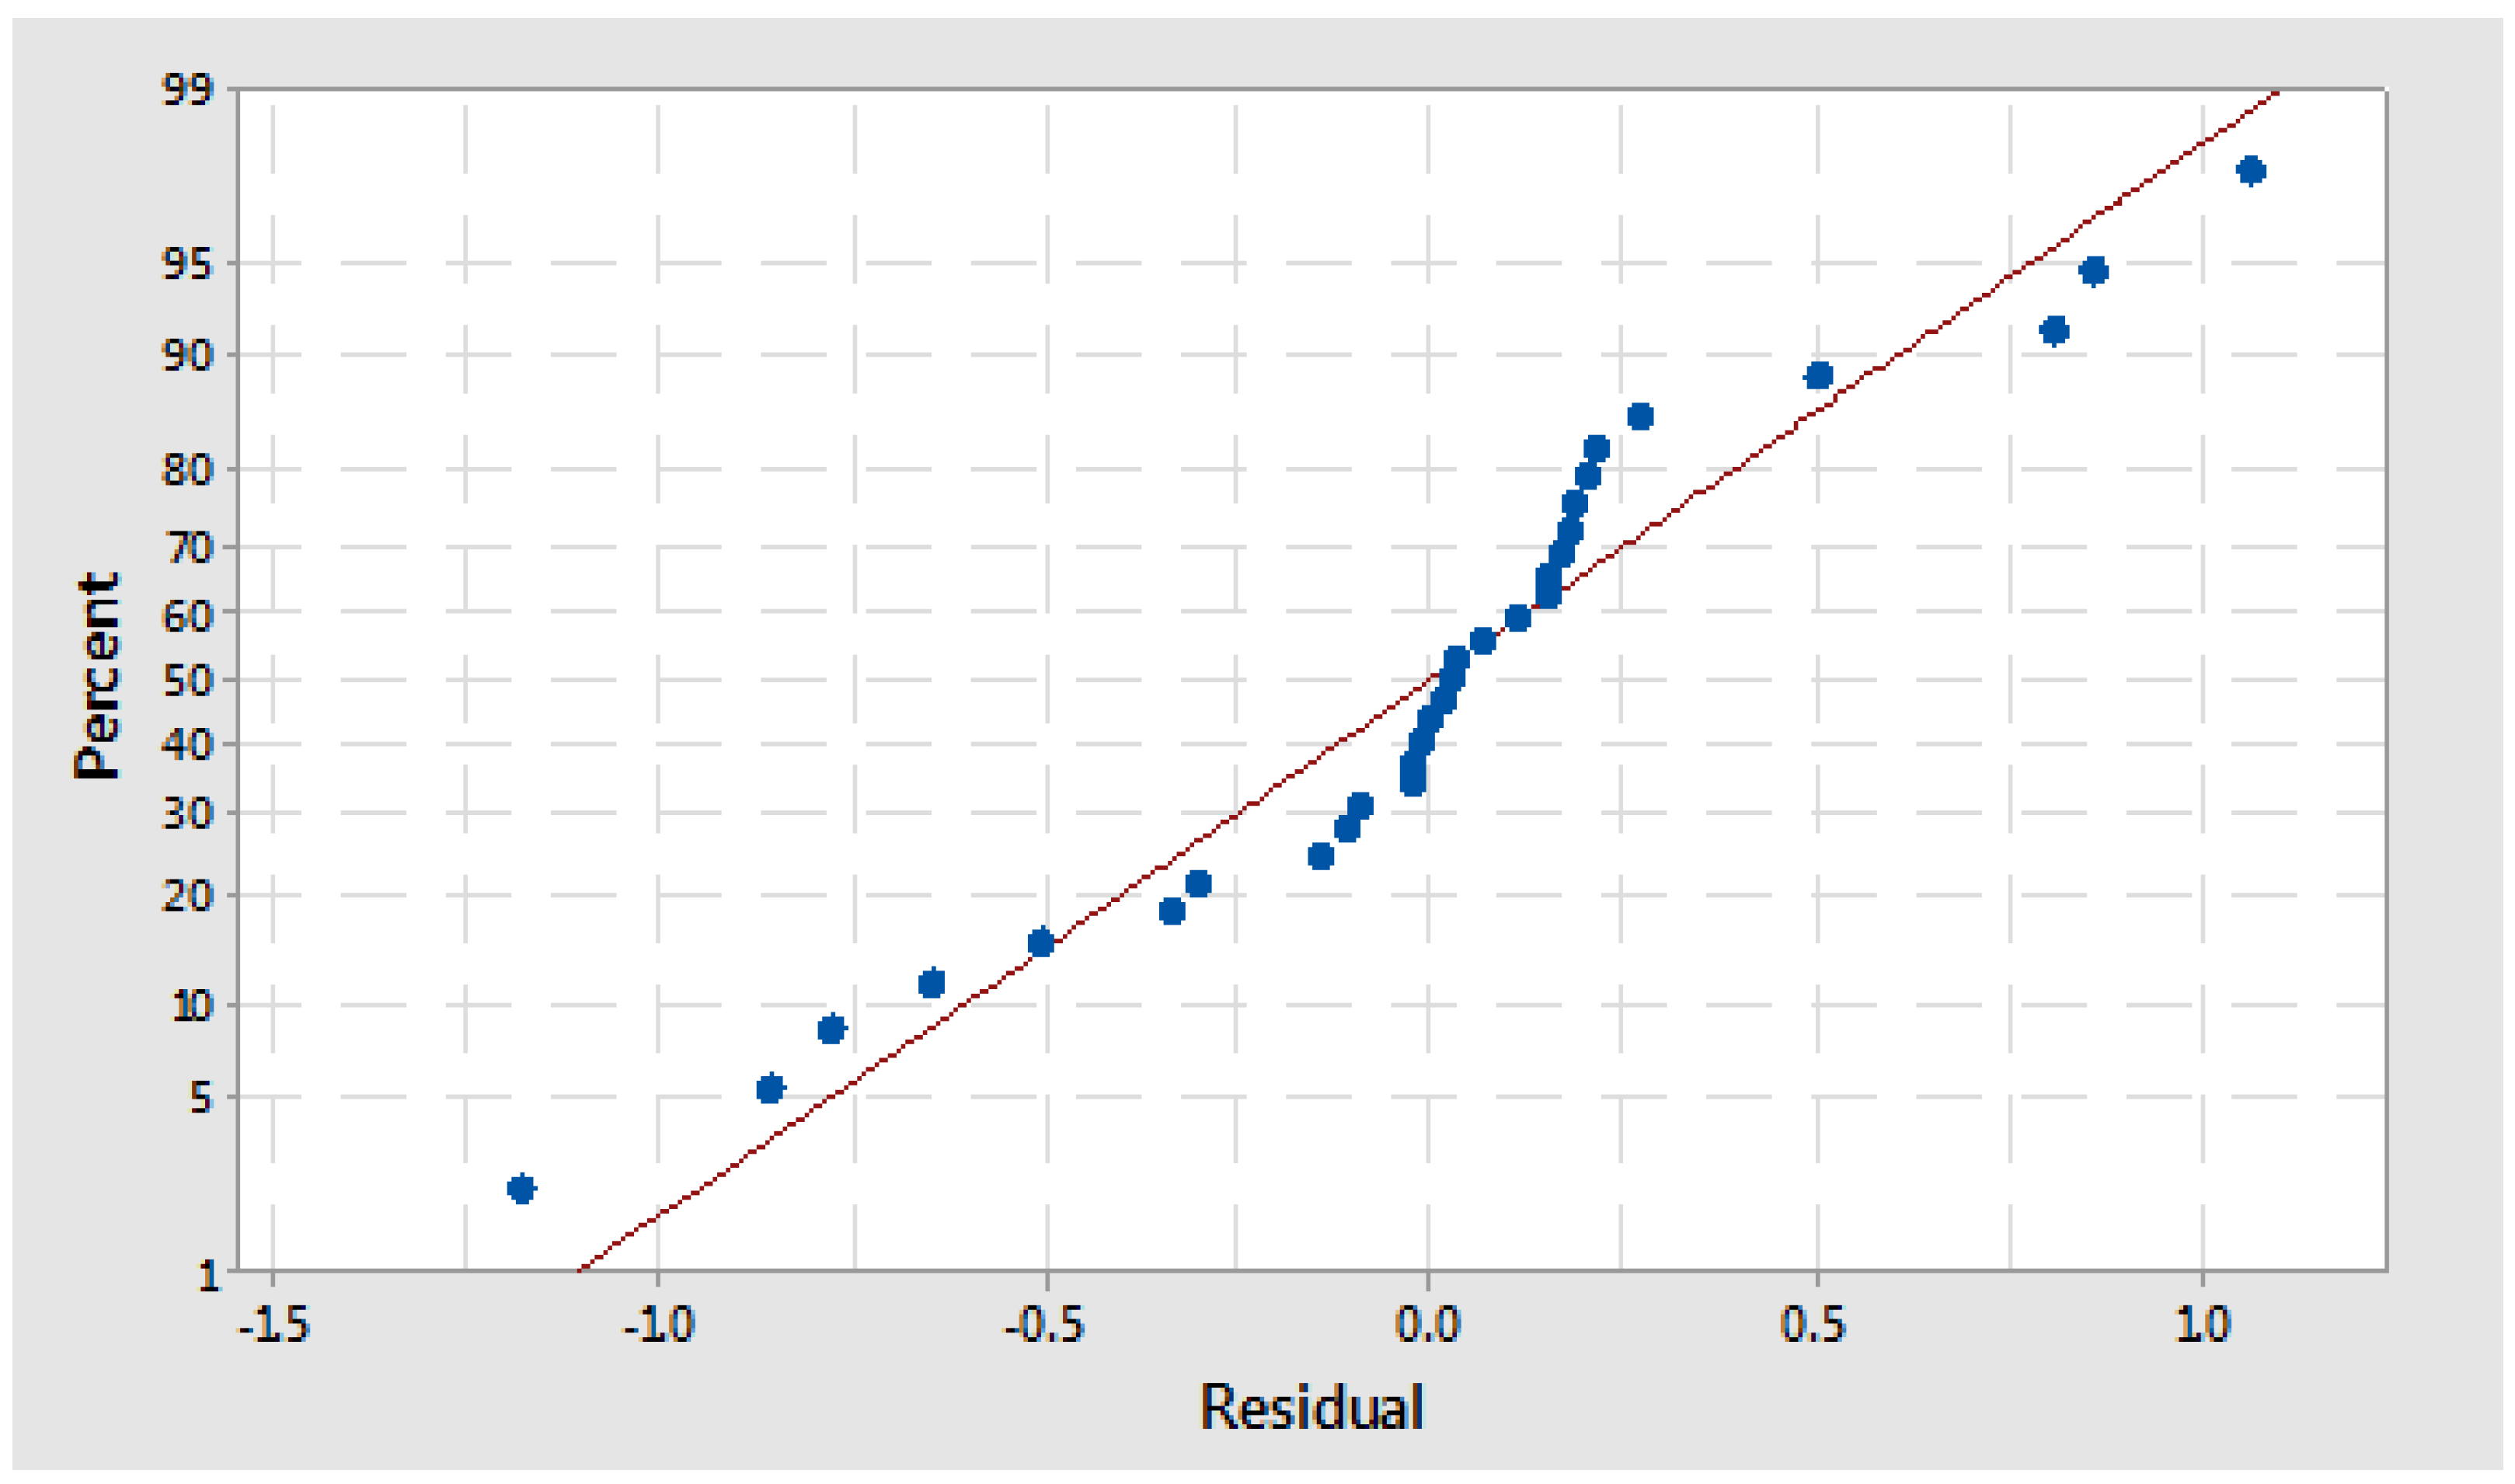
2.4. Statistical Analysis

Statistical analysis was carried out by using Minitab 17 software. Descriptive as well as inferential statistical analyses were adopted. An F-test was used to test the significance of overall model, then t-test was used to test the significance of individual regression coefficient. All the experiments were carried out in triplicate. A p-value (<0.05) was considered significant.

3. Results and Discussion

3.1. Extraction Yield and TLC

The extractive yields from the samples extracted in acetone solvent show a degree of dissimilarity varying between 0.8% and 1.7% of the lichen dry weight. One-dimensional TLC in a solvent system, toluene 200 mL: glacial acetic acid 30 mL showed consistent migration with the usnic acid reference and crude sample alone. The developed TLC plate, when analyzed in short-wave (254 nm) ultraviolet light, showed clear spots of lichen metabolites. A color reaction test of these spots was carried out with 10% sulphuric acid and baking in an 80 °C oven. A spot that developed light greenish color with an Rf value of 7, indicated the presence of usnic acid in the crude extract by comparison with standard value. The proportion of secondary metabolite within P. flexilis was relatively adequate in the analyzed samples.

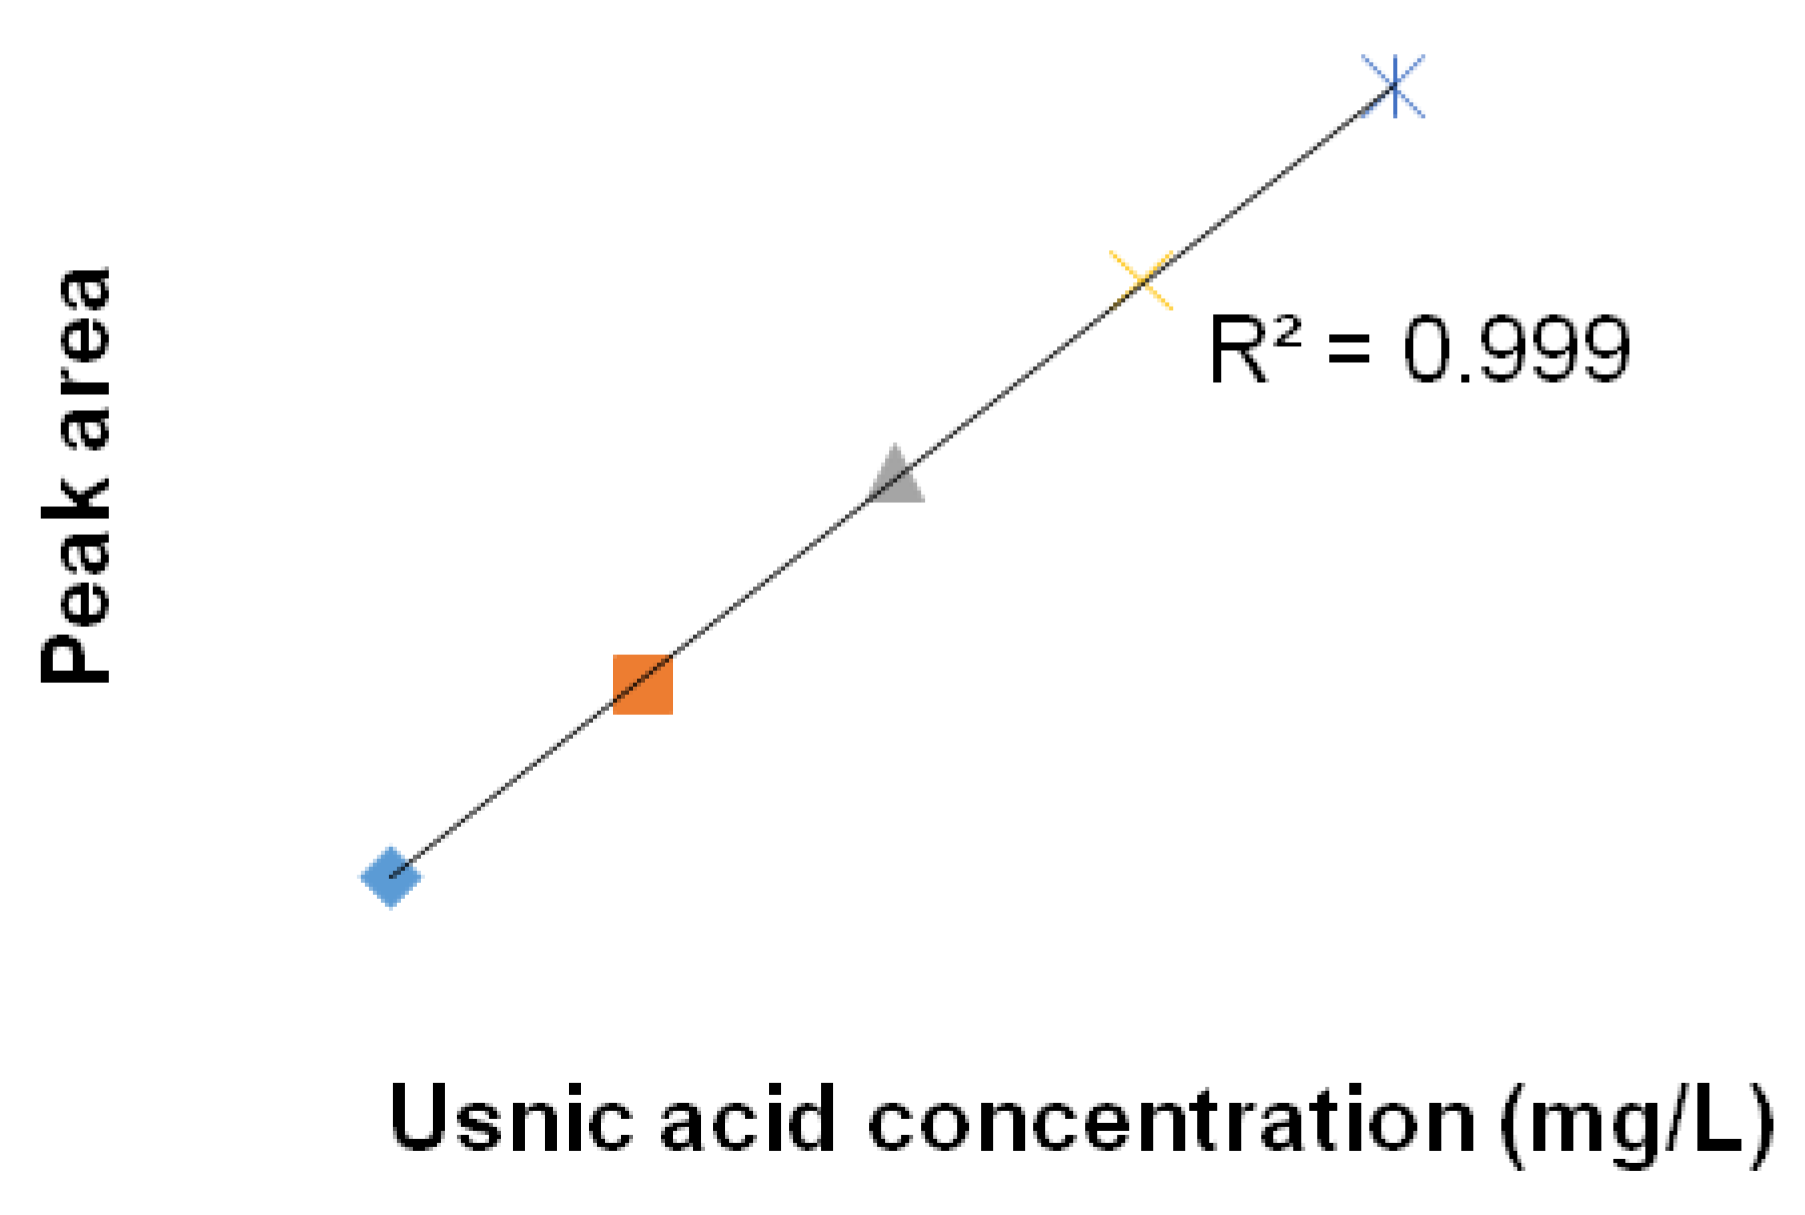
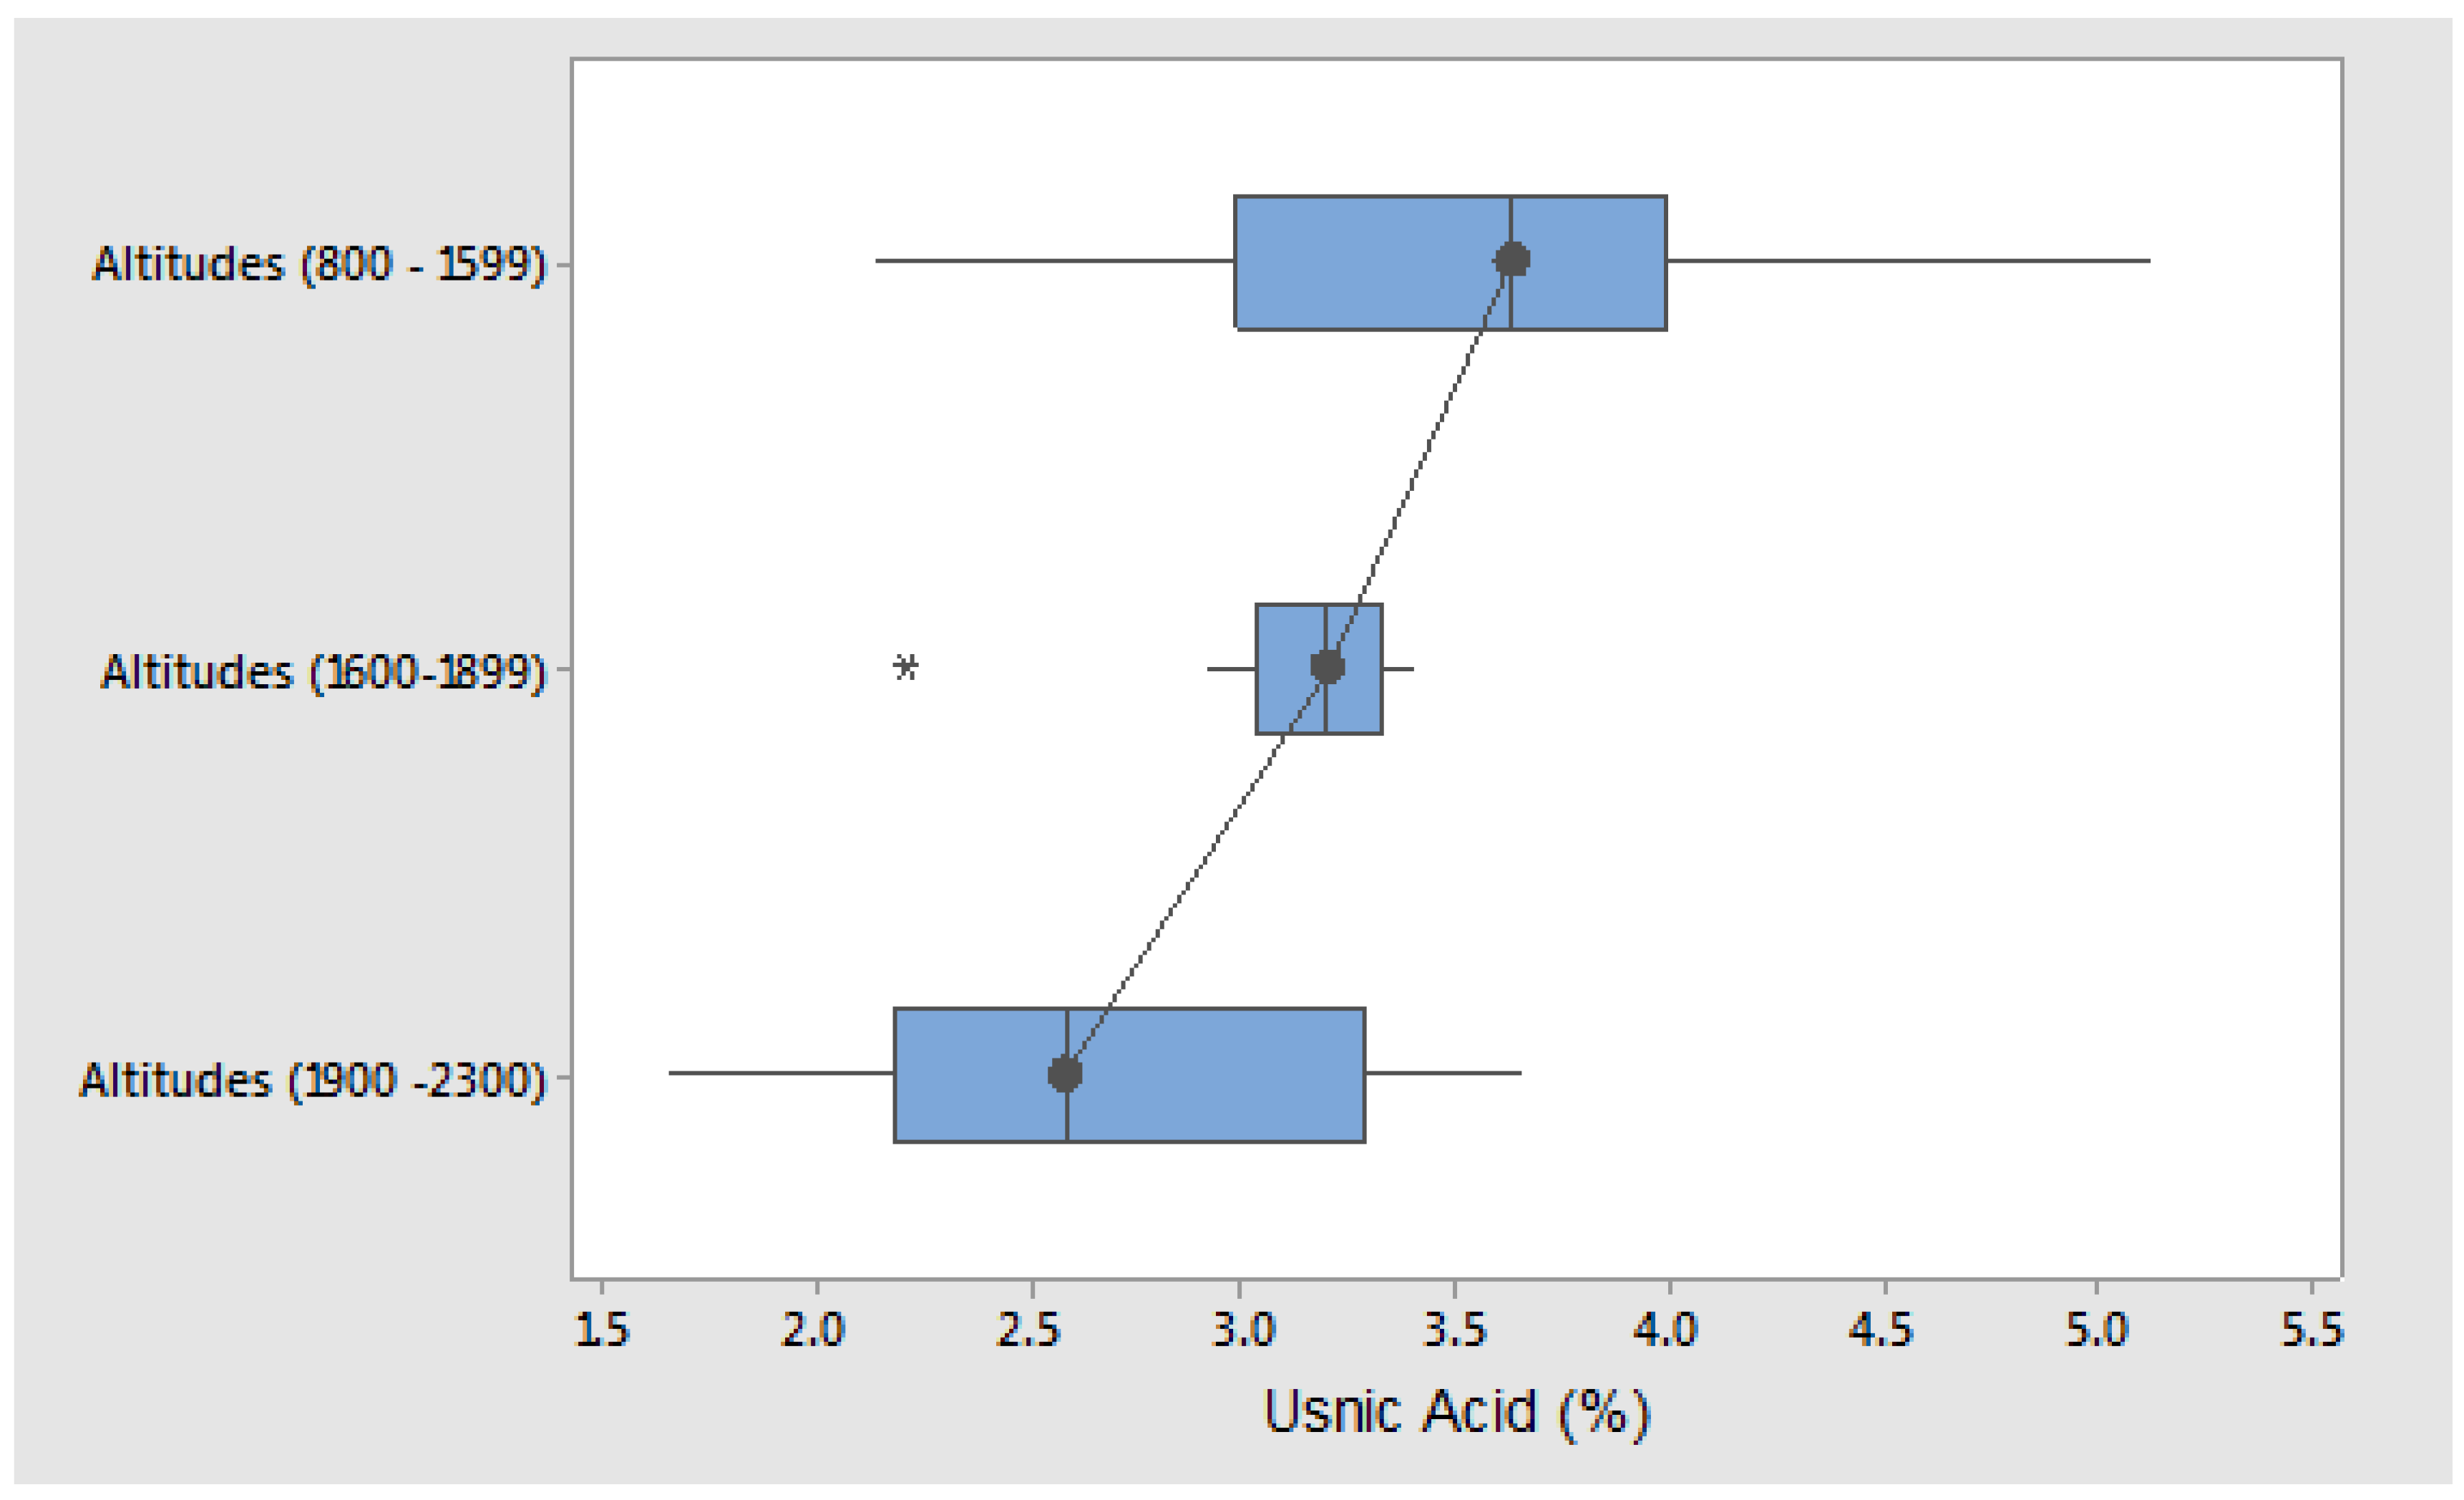
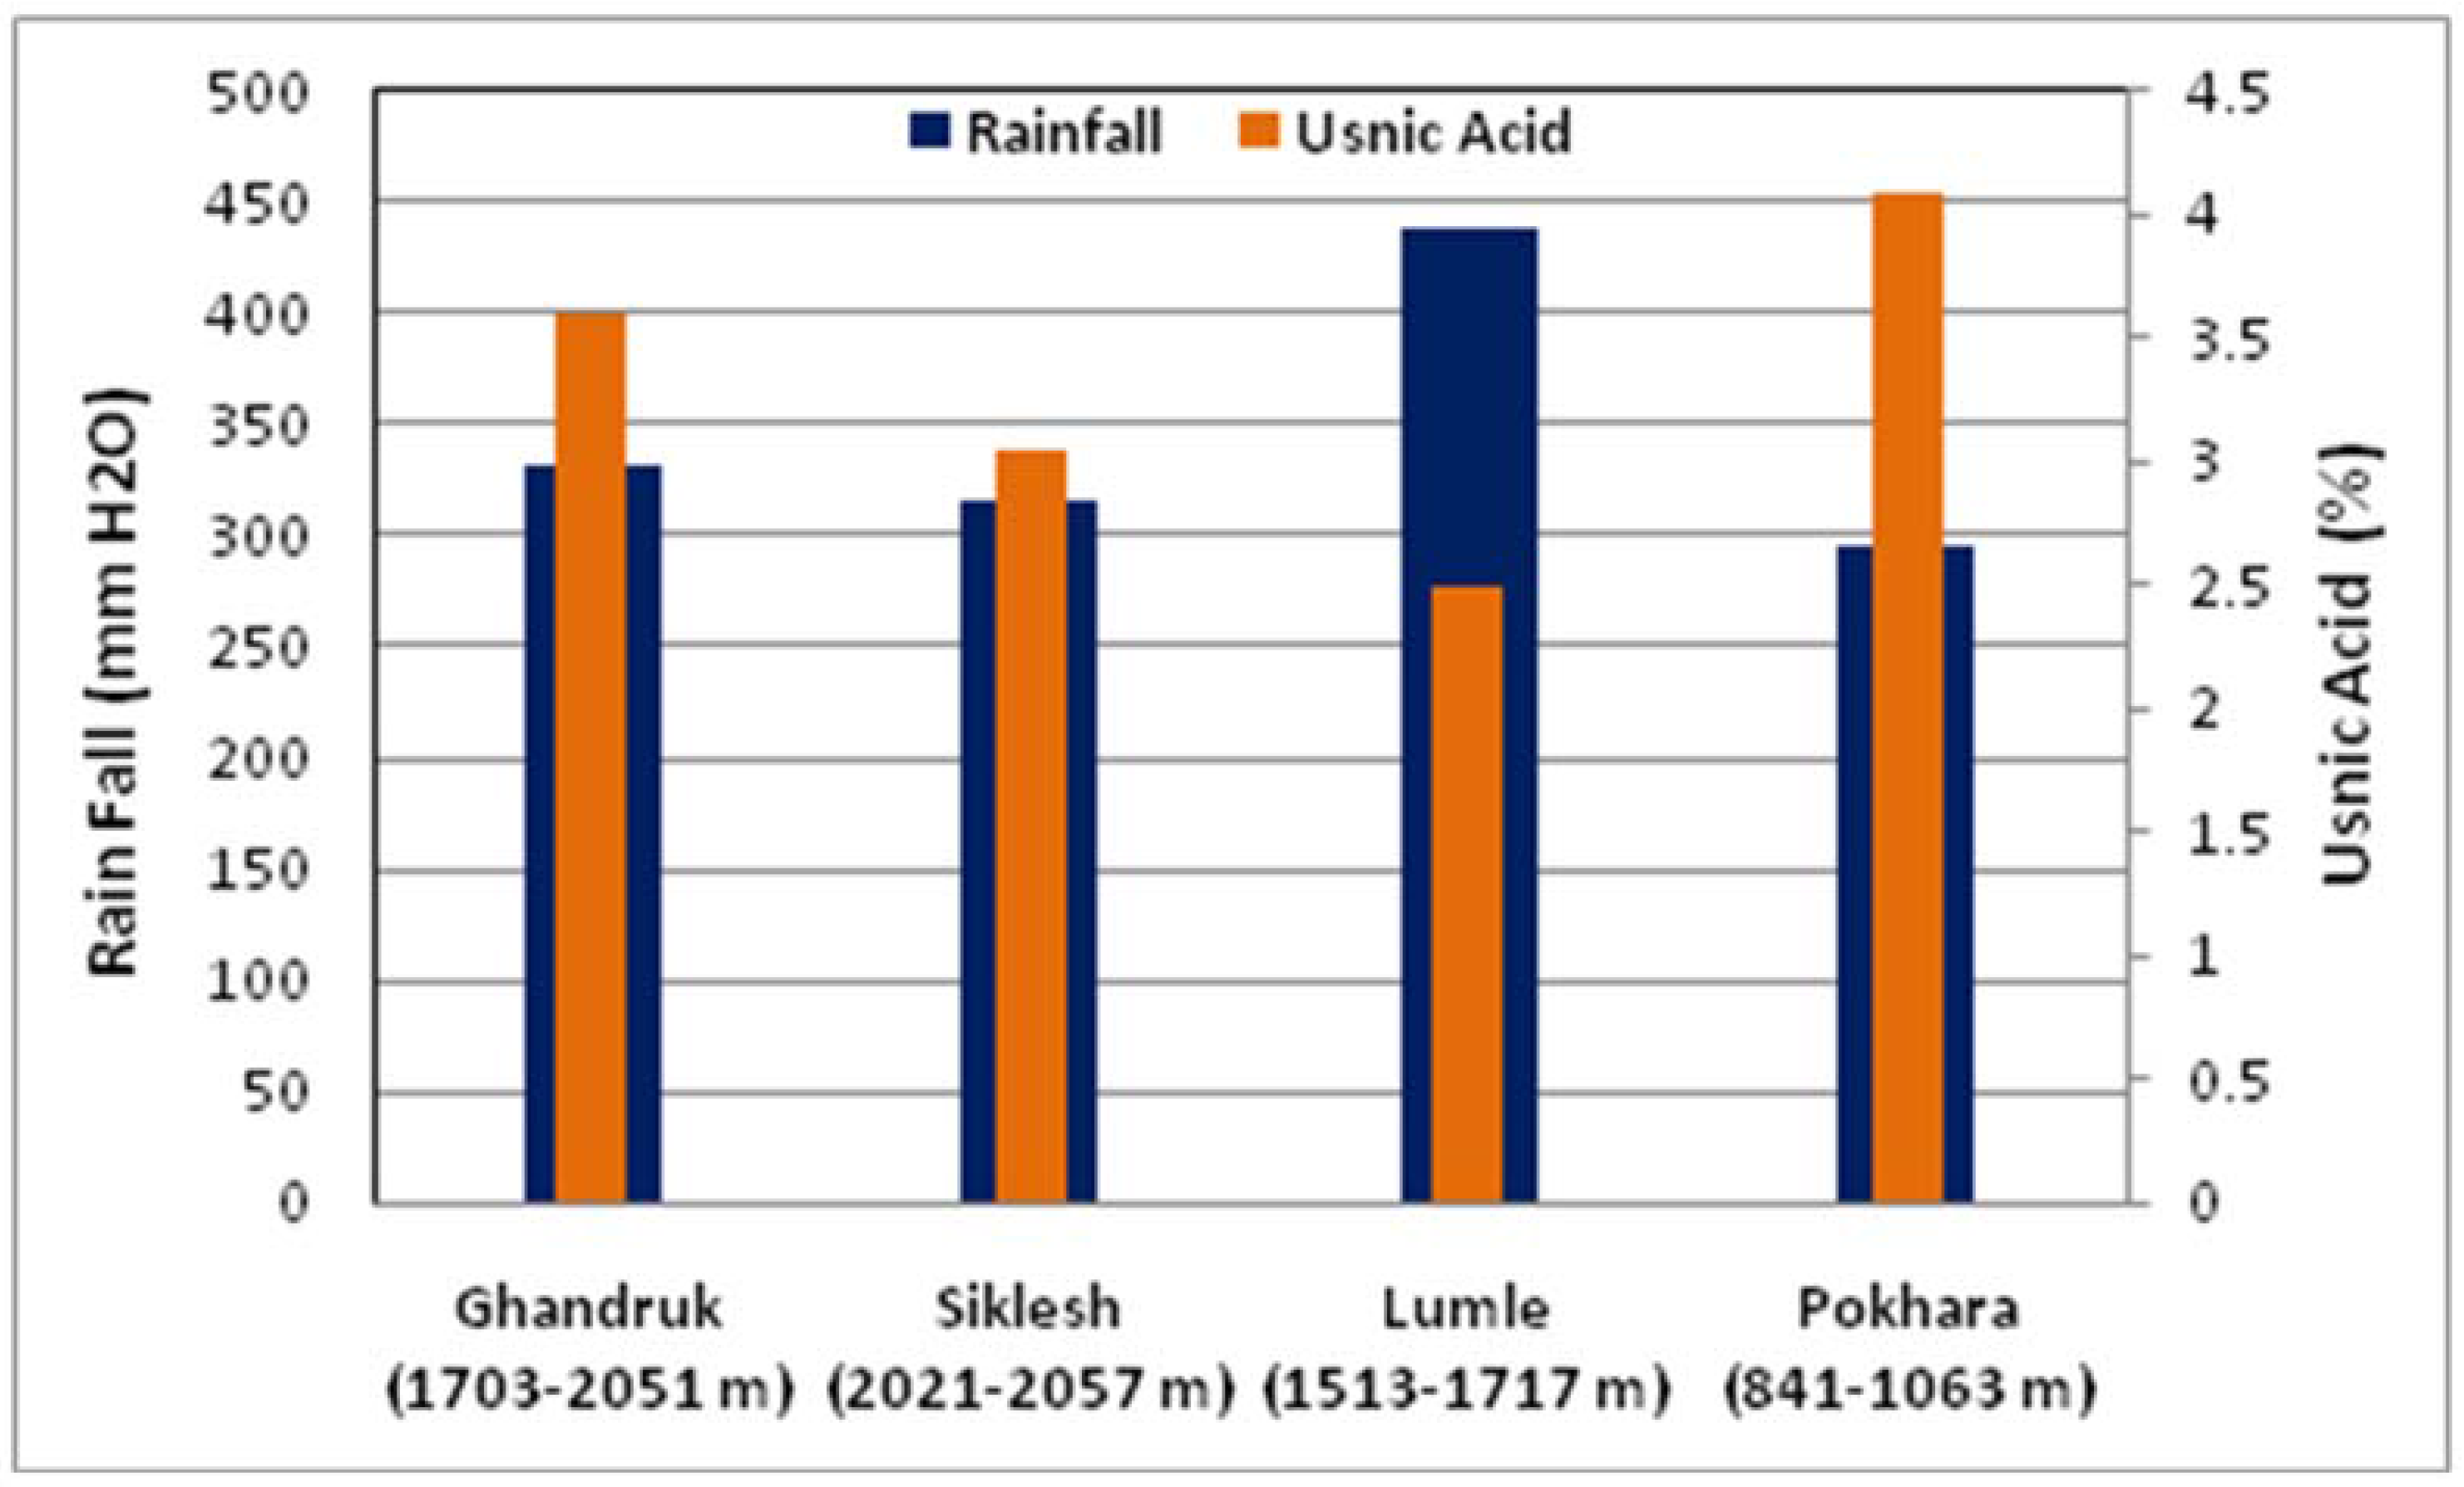
3.2. Quantification of Usnic Acid by HPLC

Quantitative analysis of usnic acid in 31 lichen samples was achieved using HPLC. Identification of peaks in chromatograms of lichen extracts was accomplished by comparison of retention times with that of standard usnic acid. The quantitative results obtained from HPLC are displayed in Table 1. The usnic acid content varied between the highest at 5.13% (sample no. 1) to the lowest at 1.66% (sample no. 31). Spearman’s correlations were calculated for secondary compound, usnic acid across the entire altitudes of study areas. From the experiment, it was seen that usnic acid decreased significantly from the lowest to highest altitudes of the collection sites (Spearman’s rho = −0.613 and p = 0.01, 2-tailed).
Pairwise regression analyses were conducted between the concentration of usnic acid produced and altitudes to determine whether the production of usnic acid was related to the altitude.
A reciprocal but linear relationship is clearly seen (Figure 3) between usnic acid and altitude, observing a regression coefficient of −0.001432. Statistically, this reveals that a significant difference between average percentages of usnic acid in three groups of altitudes at p = 0.05 (Figure 4).
The exploratory data analyses (EDA) and whisker plot show that distribution of usnic acid is approximately normal within the altitude groups, but median percentage of acid significantly decreases as altitude rises (Figure 4). Statistically, it is found that the amounts of usnic acid produced by lichens grown at different altitudes varied significantly.
The content of usnic acid, from Table 1, was found to be as high as 5.13%. Similar to our findings, the literature has showed that, for Cladonia, Usnea, Lecanora, Ramalina, and Everniaand Parmelia the usnic acid content could be as high as 6.49% [14]. The significant decrease in the average quantities of usnic acid from lower to higher altitudes (Figure 4) is large enough to suggest that Parmelia flexilis may be responding to environmental changes.
It is reported that the usnic acid content of Flavocetraria nivalis thalli collected from 25 sites in northwestern Splitsbergen, Norway varied considerably between sites along local longitudinal and altitudinal transects [9]. Similarly, a significant decrease in the quantity of slazinic acid from southern to northern latitudes has been recorded for Xanthoparmelia viariduloumbrina [15]. Several studies have also demonstrated that the production of secondary metabolites in the lichens varied with changes in elevation. For instance, it has been reported for Umbilicaria americana that lichen secondary metabolite production decreases with increasing elevations [16].
In addition to the influences of altitudes, the secondary metabolites of lichens have also been reported to vary against precipitation and temperature. A recent study found lower levels of usnic acid in Flavocetraria nivalis during late spring and early summer, which might have been due to higher levels of precipitation during spring and summer months [17]. Evidently, in our work, a lower percentage of usnic acid (2.5%) was found in samples collected from Lumle, which is the highest precipitation receiving region of Nepal (Figure 5). This might be due to decreasing temperature of that region caused by heavy rainfall. Moreover, a steady increase in the concentration of usnic acid and 4-O-dimethylbarbatic acid in mycobiont cultures from Ramalina siliquosa was found when the temperature of the culture was increased to 12% for usnic acid, and to 15 °C for 4-O-dimethylbarbatic acid [18]. Similarly, it has been reported that the concentration of usnic acid in Cladonia subtenuis increased with higher light intensity under natural conditions [19].
From this, it can be inferred that the production of secondary metabolites by lichen may dynamically interact with various environmental factors, such as temperature and precipitation patterns, along with other climatic variables like UV-light, wind, sunlight, etc.

4. Conclusions

The quantity of secondary metabolite usnic acid produced by lichen collected from different regions of Kaski district, Nepal, is estimated by HPLC and found in 1.66% to 5.13%. The concentration of usnic acid had a significantly negative relationship with altitude. Therefore, the results showed that the usnic acid in P. flexilis is directly responding to climatic variables like temperature and precipitation at different altitude gradients. The result of this study seems useful to provide information of biological effects on the ground due to global warming.

Acknowledgments

This paper is based on research financed under the Climate Change Research Grants Program implemented by the Nepal Academy of Science and Technology. The program is part of the Mainstreaming Climate Change Risk Management in Development project. This project is a component of Nepal’s Pilot Program for Climate Resilience and is executed by the Ministry of Science, Technology and Environment, (Nepal), financed by the Climate Investment Funds, administered by the Asian Development Bank. Prof. Dr. Bishnu Raj Tiwari, Pokhara University, is acknowledged for his valuable support during the study. Assistant Professor Nirajan Bam is acknowledged for assisting the statistical analysis of experimental data. We warmly thank Assistant Professor Sushil Adhikari for language editing.

Author Contributions

Bishnu Prasad Neupane designed the research and structured and wrote the manuscript. Komal Prasad Malla and Anil Gautam conducted field visits for sample collection. Dinesh Chaudhary, Sanjita Paudel, and Sangita Timsina collected secondary data and performed the experiments. Nirmala Jamarkattel supervised the work and provided technical assistance.

Conflicts of Interest

The authors declare no conflict of interest. All authors read and approved the final manuscript.

References

  1. Hannah, L.; Midgley, G.F.; Lovejoy, T.; Bond, W.J.; Bush, M.; Lovett, J.C.; Scott, D.; Woodward, F.I. Conservation of biodiversity in a changing climate. Conserv. Biol. 2002, 16, 264–268. [Google Scholar] [CrossRef]
  2. Warren, J.M.; Bassman, J.H.; Fellman, J.K.; Mattinson, D.S.; Eigenbrode, S. Ultraviolet-B radiation alters phenolic salicylate and flavonoid composition of Populus trichocarpa leaves. Tree Physiol. 2003, 23, 527–535. [Google Scholar] [CrossRef] [PubMed]
  3. Divakar, P.K.; Crespo, A. Molecular phylogenetic and phylogenomic approaches in studies of lichen systematic and evolution. In Recent Advances in Lichenology, 2nd ed.; Upreti, D.K., Upreti, P.K., Divakar, V., Bajpai, R., Eds.; Springer: Berlin, Germany, 2015; Volume 2, pp. 6–10. [Google Scholar]
  4. Kerr, J.B.; McElroy, C.T. Evidence for large upward trends of ultraviolet-B radiation linked to ozone depletion. Science 1993, 262, 1032–1034. [Google Scholar] [CrossRef] [PubMed]
  5. Solhaug, K.A.; Gauslaa, Y.; Nybakken, L.; Bilger, W. UV-induction of sun-screening pigments in lichens. New Phytol. 2003, 158, 91–100. [Google Scholar] [CrossRef]
  6. Huneck, S. The significance of lichens and their metabolites. Die Naturwissenschaften 1999, 86, 559–570. [Google Scholar] [CrossRef] [PubMed]
  7. Elix, J.A.; Ferguson, B.A.; Sargent, M.V. The structure of alectoronic acid and related lichen metabolites. Aust. J. Chem. 1974, 27, 2403–2411. [Google Scholar] [CrossRef]
  8. Culberson, C.F.; Culberson, W.L.; Arwood, D.A. Physiography and fumarprotocetraric acid production in the Cladonia chlorophaea group in North Carolina. Bryology 1977, 80, 71–75. [Google Scholar] [CrossRef]
  9. Bjerke, J.W.; Joly, D.; Nilsen, L.; Brossard, T. Spatial trends in usnic acid concentrations of the lichen Flavocetraria nivalis along local climatic gradients in the Arctic (Kongsfjorden, Svalbard). Polar Biol. 2004, 27, 409–417. [Google Scholar]
  10. McEvoy, M.K.; Solhaug, A.; Gauslaa, Y. Solar radiation screening in usnic acid containing cortices of the lichen Nephroma arcticum. Symbiosis 2007, 43, 143–150. [Google Scholar]
  11. Thapa, K.B.; Rajbhandary, S. Apothetical anatomy of some parmelia species of namobudha, kavrepalanchowk district, central Nepal. J. Nat. Hist. Mus. 2012, 26, 146–154. [Google Scholar]
  12. Rahman, M.; Falck-Ytter, A.B.; Antonsenm, Ø.G.; Strætkvern, K.O. Reindeer lichen (Cladonia stellaris) from a Norwegian mountain region as a sustainable source of usnic acid. Int. J. Appl. Res. Nat. Prod. 2015, 8, 17–23. [Google Scholar]
  13. Cansaran, D.; Atakol, O.; Halıcı, M.G.; Aksoy, A. HPLC analysis of usnic acid in some Ramalina species from Anatolia and investigation of their antimicrobial activities. Pharm. Biol. 2007, 45, 1–5. [Google Scholar] [CrossRef]
  14. Cansaran, D.; Aras, S.; Atako, O. Determination of usnic acid content in some lichen species found in Anatolia. J. Appl. Biol. Sci. 2008, 2, 41–44. [Google Scholar]
  15. Deduke, C.; Timsina, B.; Piercey-Normore, M.D. Effect of environmental change on secondary metabolite production in lichen-forming fungi. In International Perspectives on Global Environmental Change; Young, S., Ed.; InTech: Rijeka, Croatia, 2012; pp. 197–230. [Google Scholar]
  16. Swanson, A.; Fahselt, D.; Smith, D. Phenolic levels in Umbilicaria americana in relation to enzyme polymorphism, altitude and sampling date. Lichenologist 1996, 28, 331–339. [Google Scholar] [CrossRef]
  17. Bjerke, J.W.; Elvebakk, A.; Dominiguez, E.; Dahlback, A. Seasonal trends in usnic acid concentrations of Arctic, alpine and Patagonian populations of the lichen Flavocetraria nivalis. Phytochemistry 2005, 66, 337–344. [Google Scholar] [CrossRef] [PubMed]
  18. Hamada, N. Environmental factors affecting the content of usnic acid in the lichen Mycobiont of Ramalina siliquosa. Bryologist 1991, 94, 57–59. [Google Scholar] [CrossRef]
  19. Rundel, P.W. Clinical variation in the production of usnic acid in Cladonia subtenuis along light gradients. Bryologist 1969, 72, 40–44. [Google Scholar] [CrossRef]
Figure 1. Parmelia flexilis inhabiting exposed rock in Ghandruk, Kaski, Nepal.
Climate 05 00040 g001
Figure 2. Calibration curve of usnicacid (Sigma–Aldrich) for HPLC analysis.
Climate 05 00040 g002
Figure 3. Normality probability plot of usnic acid (%).
Climate 05 00040 g003
Figure 4. Usnic acid concentration at the six sites in Kaski. The sites are sorted in three groups according to altitude.
Climate 05 00040 g004
Figure 5. Mean usnic acid of P. flexilis and rainfall (between the years 2006–2015) at four major collection sites. Altitude ranges are noted in the parentheses. (Rainfall Source: Department of Hydrology and Metrology, Pokhara, Nepal, 2016).
Climate 05 00040 g005
Table 1. Concentration of usnic acid in dry weight of lichen (n = 31).
Sample No Altitudes (m asl)% Usnic Acid (Mean ± STD)Sample NoAltitudes (m asl)% Usnic Acid (Mean ± STD)
18415.13 ± 0.221717033.12 ± 0.13
29104.21 ± 0.131817153.10 ± 0.42
310123.78 ± 0.071917172.21 ± 0.16
410633.67 ± 0.332017333.02 ± 0.26
515133.63 ± 0.082118182.92 ± 0.17
615412.14 ± 0.282218672.83 ± 0.08
715512.53 ± 0.072319502.59±0.30
815913.46 ± 0.162420152.55 ± 0.13
915913.45 ± 0.152520212.65 ± 0.06
1016113.40 ± 0.362620213.49 ± 0.22
1116113.39 ± 0.302720513.09 ± 0.33
1216503.35 ± 0.222820523.65 ± 0.18
1316753.28 ± 0.522920572.47 ± 0.04
1416753.28 ± 0.033021891.89 ± 0.27
1516813.23 ± 0.203122501.66 ± 0.10
1616933.17 ± 0.05

