
Identification of Homogeneous Rainfall Regions in the Eastern Watersheds of the State of Paraná, Brazil


Department of Geography, University of São Paulo (USP), 338 Prof. Lineu Prestes Avenue, São Paulo 05508-000, Brazil
*
Authors to whom correspondence should be addressed.
Climate 2017, 5(3), 53; https://0-doi-org.brum.beds.ac.uk/10.3390/cli5030053
Submission received: 19 April 2017
/
Revised: 3 July 2017
/
Accepted: 6 July 2017
/
Published: 15 July 2017
(This article belongs to the Special Issue Studies and Perspectives of Climatology in Brazil)
Abstract
:The objectives of this study are to use a clustering technique to identify homogeneous rainfall regions in the watersheds of the eastern region of the state of Paraná and to associate the spatial and temporal distribution of rainfall with the influences of orography, the ocean and regional atmospheric dynamics. Rainfall data were obtained from 54 pluviometric stations and from eight meteorological stations, which comprise the historical series from 1976 to 2015. A cluster analysis technique was used with the Euclidean distance for measuring proximity and Ward’s method for hierarchical grouping. The Litorânea watershed exhibited the highest rainfall totals in the study area, and the annual average was 2551 mm for the homogeneous group with the highest rainfall. The Ribeira river watershed exhibited the lowest total rainfall (1488 mm); therefore, it was considered a rain shadow region with a more tropical climate due to the concentration of rainfall in the period from September to March. The Alto Iguaçu watershed was characterized by the smallest spatiotemporal variation in rainfall due to its flatter relief and the influence of the subtropical climate.
1. Introduction
Rainfall is the main input in analyses of the hydrological balance of a watershed, and it is the climatic attribute that provides the greatest interaction between the climatic elements and the physical aspects of this study, according to Clarke and Silva [1], especially in regions with tropical climates due to an abundance of annual rainfall [2,3,4]. Therefore, understanding the pluviometric regime in watersheds contributes to decision-making in areas of economic and social development, such as electric power generation, civil defence and agricultural and industrial activities, as well as in planning for the rational use of water resources [5,6].
The establishment of appropriate methodologies to define the spatial and temporal distribution of rainfall is of paramount importance to meeting the need for hydroclimatic information. The widely used technique of cluster analysis allows the action of atmospheric systems generated by rainfall in a determined region to be revealed [7].
Wrege et al. [8] highlighted the relevance of the grouping technique to identifying homogeneous zones with respect to the water regime and its contribution in land use planning studies, such as the reduction of climatic risk in agriculture, livestock and forestry production. They stressed that a lower water balance compromises agricultural yield, whereas a water surplus can increase the majority of crop yields and thus favours the appearance of pests and diseases, hampering the quality of the crops.
Keller Filho et al. [9] highlighted the fact that rainfall is the climatic element that poses the greatest threat to agriculture, and studies of this attribute make it possible to establish adequate agricultural planning for planting crops in a specified region. Using cluster analysis, 25 homogeneous rainfall zones were identified in Brazilian territory based on the monthly rainfall distribution.
Brito et al. [10] used cluster analysis, with Ward’s hierarchical method [11] and the Euclidean distance, to measure the dissimilarity between homogeneous groups with respect to the rainfall regime in the state of Rio de Janeiro. They identified eight homogeneous groups with similar temporal rainfall distribution patterns and highlighted the role of orography and oceanic influence in the occurrence of the highest rainfall totals on the coastal face of the Serra do Mar, where the average annual rainfall exceeded 2750 mm, whereas the continental face of the Serra do Mar exhibited an annual average of less than 1100 mm.
Using cluster analysis, Fritzsons et al. [12] identified three large rainfall regimes in the state of Paraná: the first regime, in the northern region, exhibited a significant decrease in rainfall in the winter months; the second region, in the south-central and eastern regions of the state, exhibited the highest annual rainfall and was marked by a homogeneous monthly distribution; the third region, in the central, southeastern and northern regions, exhibited lower annual rainfall totals than the second group and a lower rainfall concentration in the summer than the first group. This analysis of the spatial distribution of rainfall regimes is consistent with the climatic typologies obtained for the Paraná region by Aparecido et al. [13], who verified the subtropical climate of the south-central region and the tropical climate of the northern region.
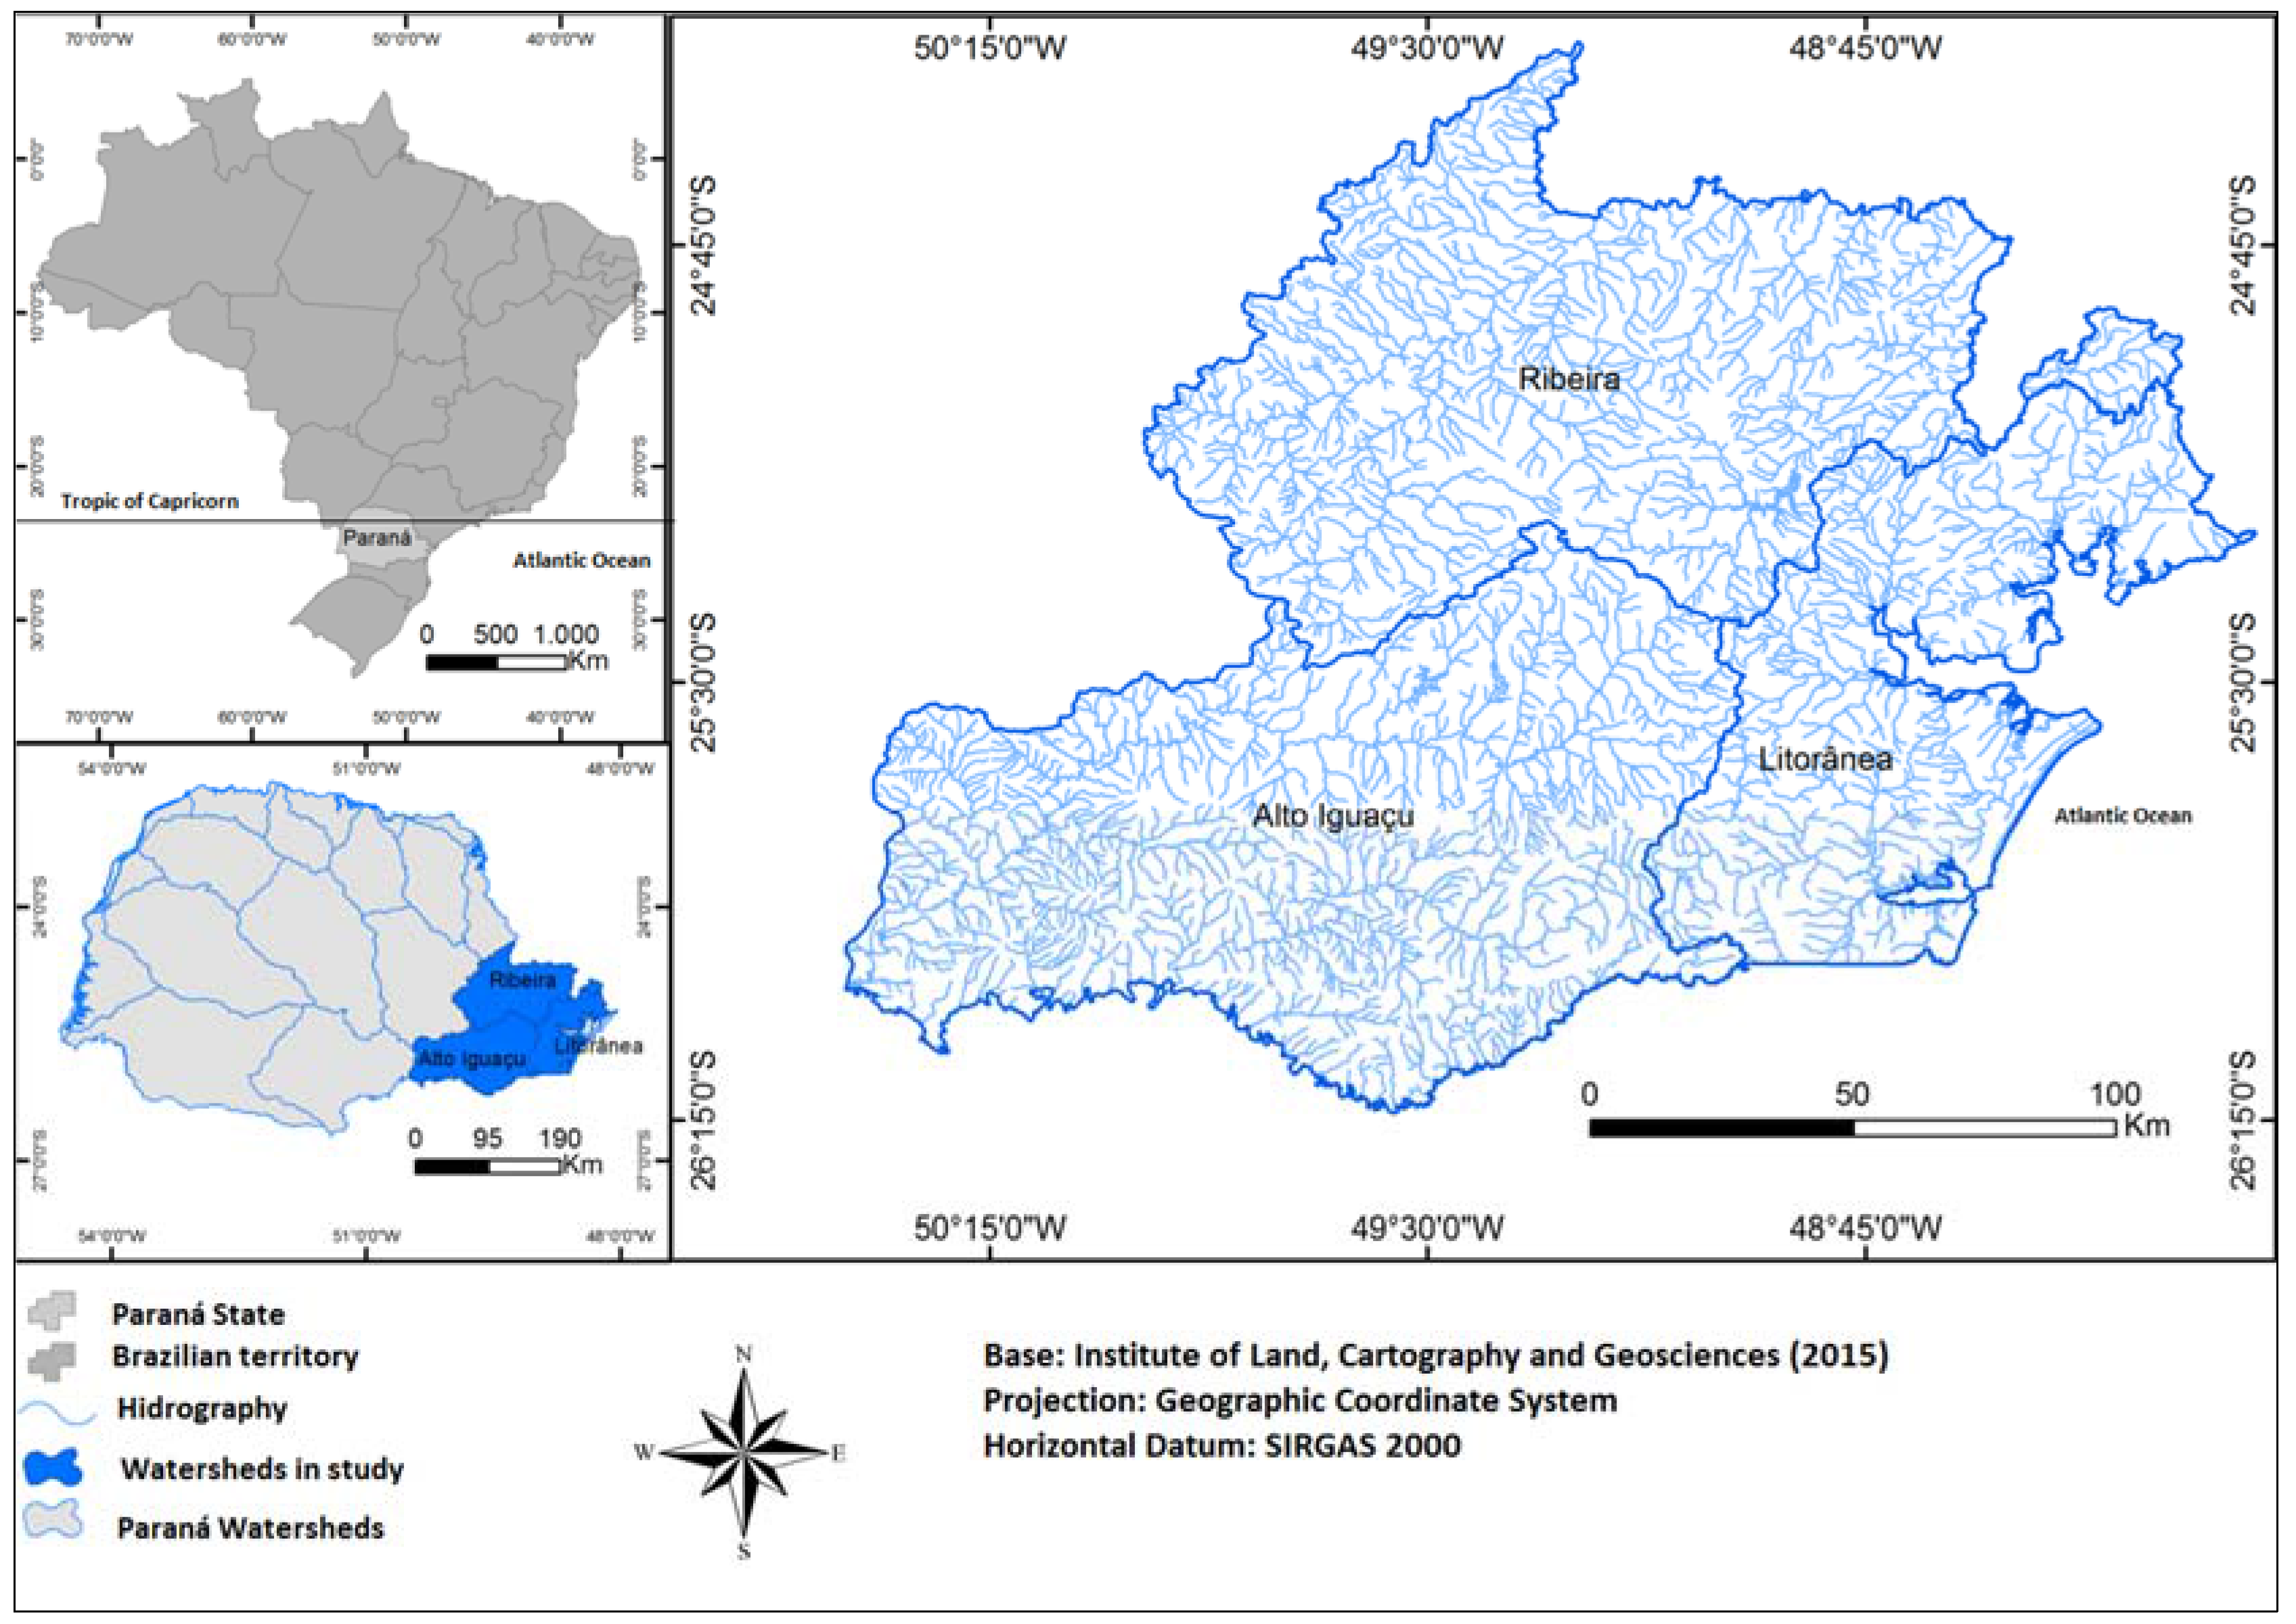
The area selected for the present study corresponds to the Alto Iguaçu, Ribeira and Litorânea watersheds, which are located in the eastern sector of the state of Paraná. These watersheds have areas of 10,261 km², 9736 km² and 5630 km² [14], respectively, as shown in Figure 1. According to Grimm [15], on the eastern coast of the southern region, especially along the coast of Paraná, the significant contribution of the orographic effect results in higher rainfall totals because surface winds diverge from the South Atlantic high perpendicular to the coast and are forced to ascend near the coast of the Serra do Mar.
The assumption cited above stems from several studies that highlight the orographic influence of the Serra do Mar on the spatial distribution of rainfall. Pellegatti and Galvani [16] reported that along the coast of São Paulo, the windward slope of the Serra do Mar exhibits rainfall totals that are among the highest in Brazil at over 3000 mm, whereas the leeward slope is characterized by approximately 1500 mm of rainfall. This finding indicates the importance of elevation and relief orientation in relation to atmospheric systems and the effect of oceanic influence on enhanced rainfall totals previously observed by Nunes and Modesto [17], Sant’Anna Neto [18], Seluchi and Chou [19] and Milanesi and Galvani [20] for the coastal zone of São Paulo.
The objectives of this study are to use grouping to identify regions of homogeneous rainfall in watersheds of the eastern region of the state of Paraná and to associate the spatial and temporal distribution of rainfall with the influence of orography based on the regional oceanic influence and atmospheric dynamics.
2. Materials and Methods
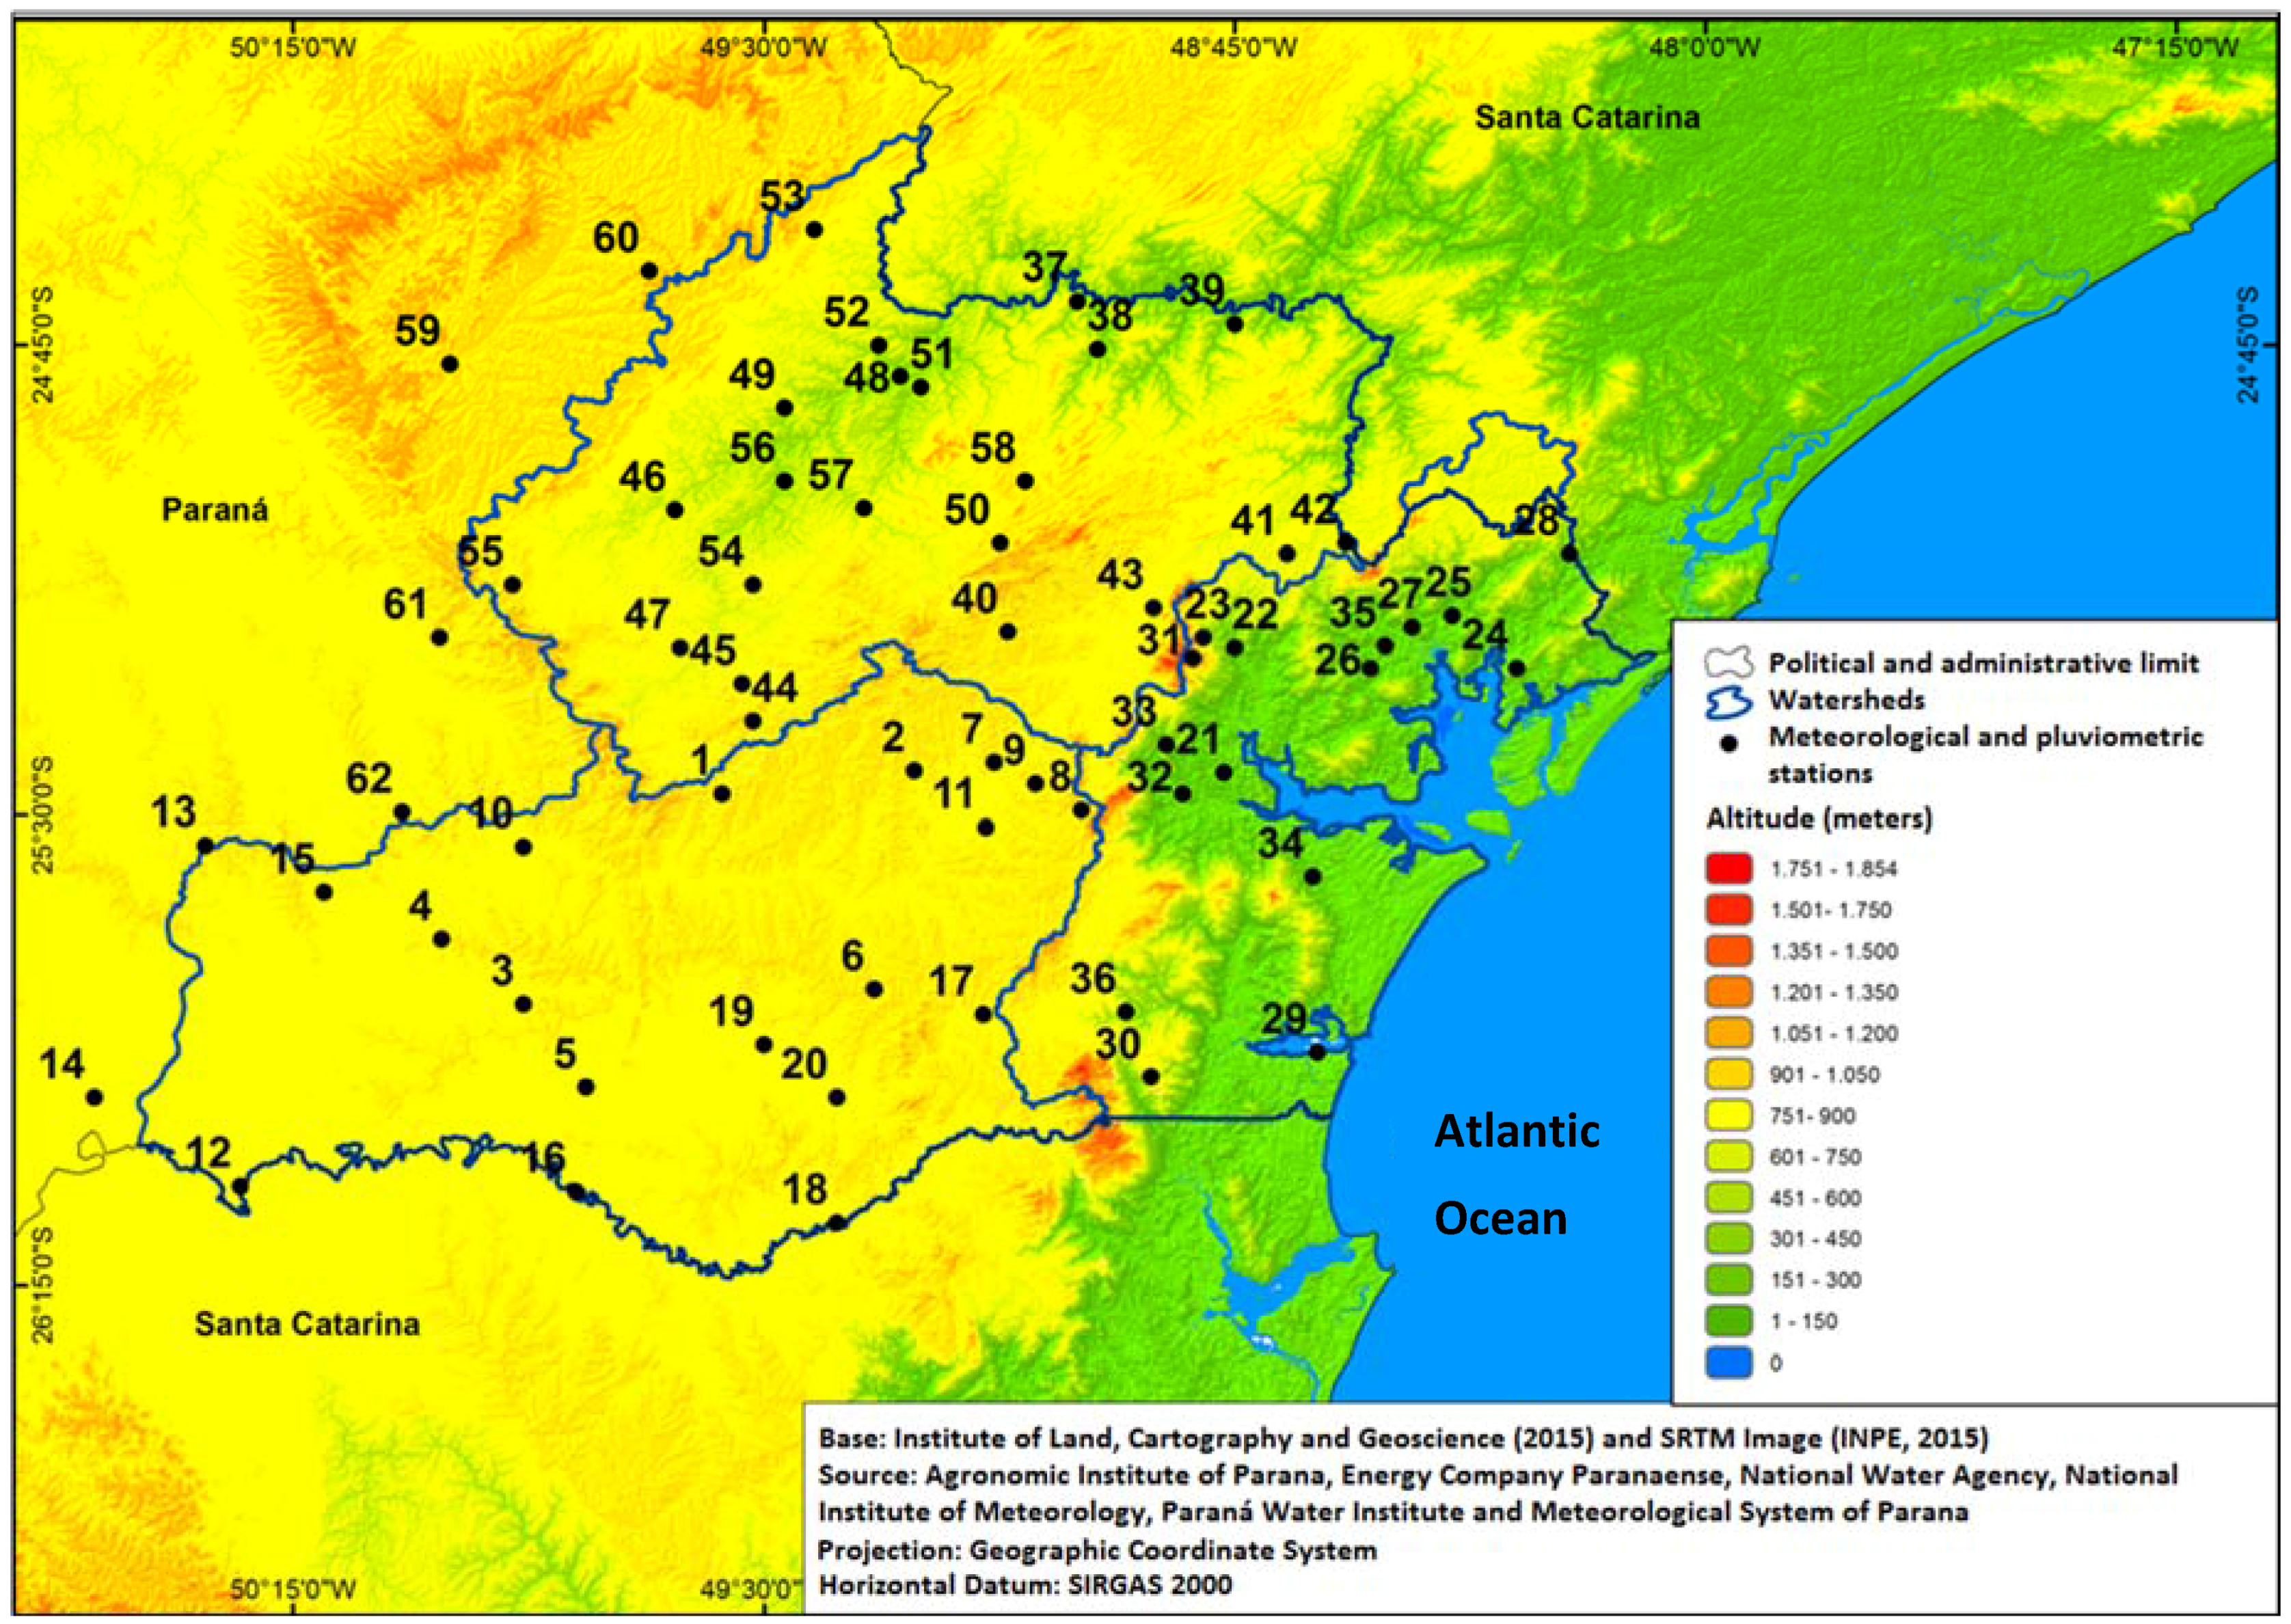
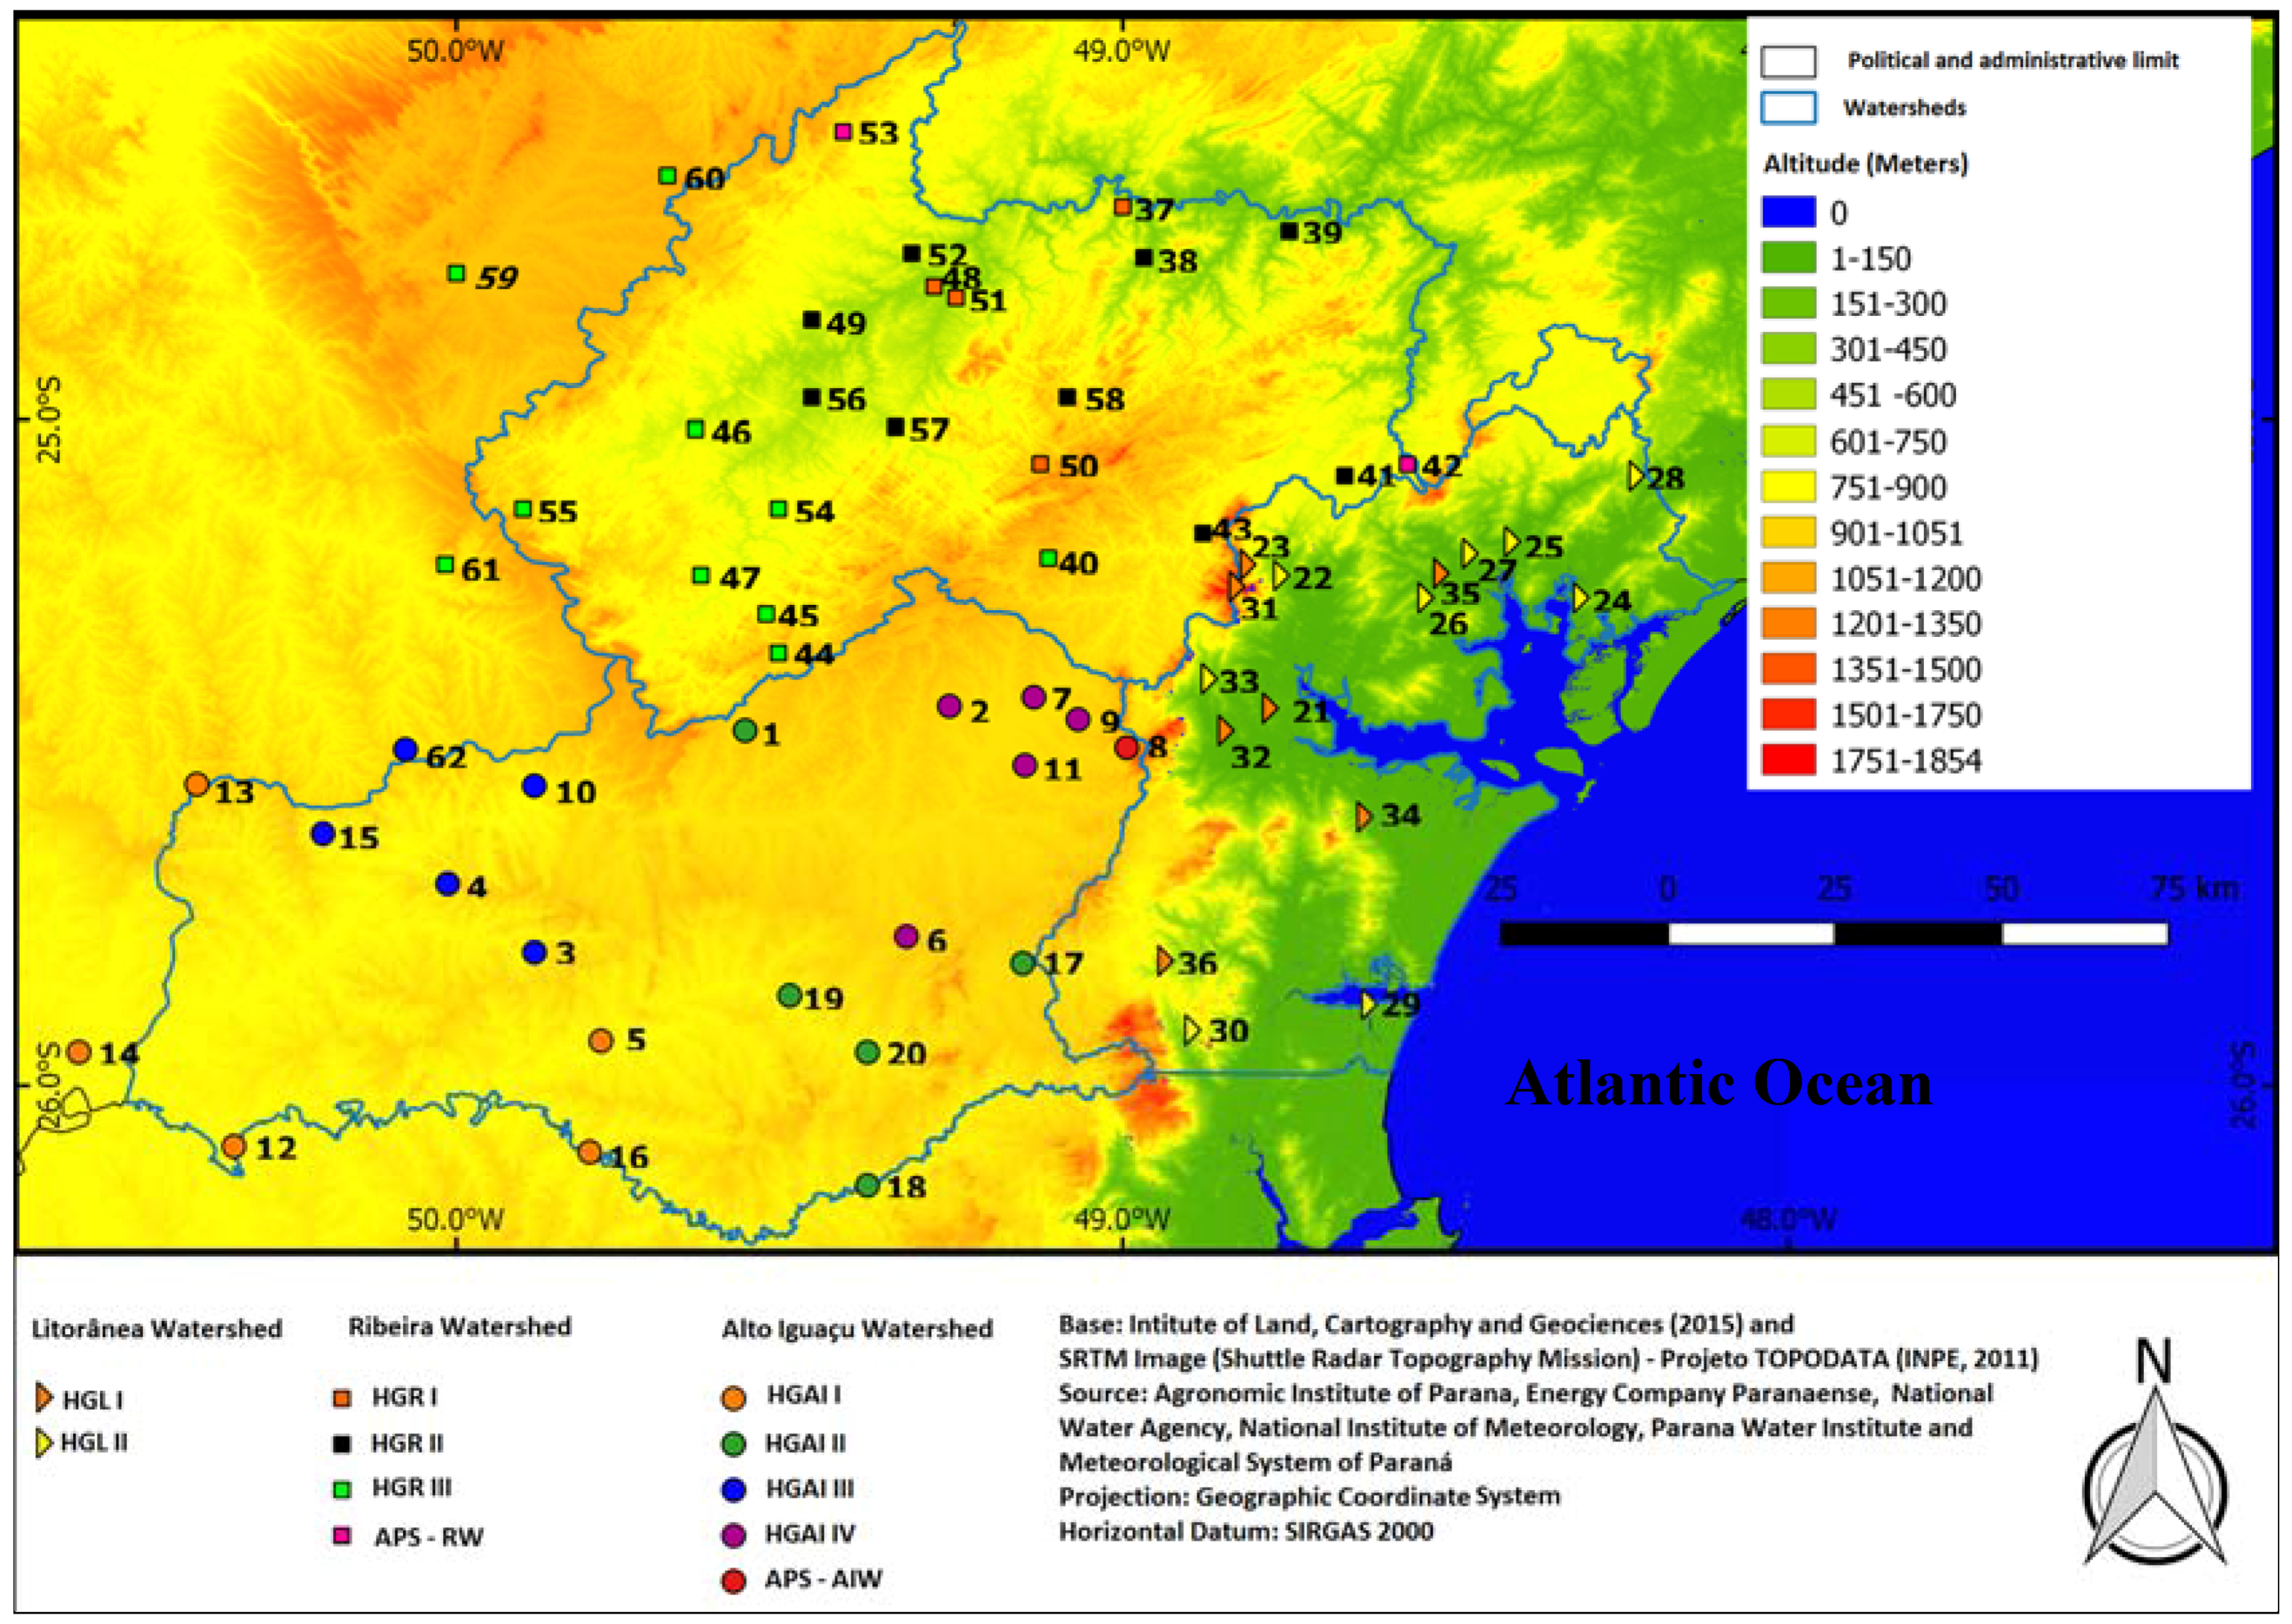
Rainfall data were obtained from 54 pluviometric stations belonging to the National Water Agency (Agência Nacional de Águas—ANA), the Energy Company of Parana (Companhia Paranaense de Energia—COPEL) and the Paraná Water Institute (Instituto das Águas do Paraná) and eight meteorological stations belonging to the Agronomic Institute of Paraná (Instituto Agronômico do Paraná—IAPAR), the National Institute of Meteorology (Instituto Nacional de Meteorologia—INMET) and the Meteorological System of Paraná (Sistema Meteorológico do Paraná—SIMEPAR), which comprise the historical series from 1976 to 2015 (Figure 2).
The meteorological and pluviometric stations surrounding the watersheds were selected to adequately compensate for the absence of records, as recommended by Bertoni and Tucci [21]. Missing data from the pluviometric and meteorological stations were replaced using the regional weighting method of Villella and Matos [22]. This method is based on the pluviometric records of three stations located as close as possible to the station at which there is a lack of data that have similar pluviometric characteristics (monthly and seasonal distribution) and altitudes [23]. Missing monthly rainfall records comprised less than 5% of the total.
To define homogeneous regions in terms of rainfall variability, a grouping technique was used for each of the watersheds. The clustering method of Ward [11] was used; it allows the distance between two groups to be determined from the sum of the squares of the distances from the points to the centroid. According to Nascimento et al. [24] and Wrege et al. [8], the Ward method [11] was used for cluster analysis because it proposes that the loss of information resulting from the grouping of elements is measured by the sum of the squares of the deviations of each element relative to the average of the members of the group.
As a measure of proximity, the Euclidean distance was used for representing the similarity and dissimilarity of the pluviometric stations [9,12,25]. The Euclidean distance is commonly used for the analysis of quantitative variables and, according to Freitas et al. [26], corresponds to the geometric distance in the multidimensional space between observations. Melo Júnior et al. [7] described it as the geometric distance taken in a space of p dimensions, where Xij is the observation of the i-th rain station (= 1, 2,…, n) in reference to the j-th variable and absolute frequency in each class ( = 1, 2..., p); the standardized Euclidean distance between two stationsand can be defined by the following expression:
where Zij, standardized variable,
and (Zij) and are the standard deviation and the mean of the original j-th variable.
The data used for this analysis were the annual rainfall totals at the pluviometric stations and the meteorological stations. A table describing the “individuals” versus “variables” was created considering each of the pluviometric stations as an individual and various factors, such as annual rainfall totals, as variables.
The cluster analysis produced a type of graph called a dendrogram using Statistica 7.0. It presented a summary of the method applied step by step, with the first two joined, until the final step, when all the elements were combined into one group. The rainfall variability, the relief characteristics, and the spatial proximity of the pluviometric and meteorological stations and their proximity to the connecting branches were used as criteria for establishing the dendrogram’s cut-off point to create homogeneous groups with similar rainfall characteristics.
3. Results
The cluster analysis resulted in nine homogeneous groups and three anomalous pluviometric stations, which demonstrated the structure of rainfall in the study area. The dendrogram’s cut-off points (Figure 3, Figure 4 and Figure 5), the monthly distribution characteristics, and the identified dissimilarities and the spatial similarities between the pluviometric and meteorological stations were used to identify spatial rainfall patterns (Figure 6 and Figure 7) and showed evidence of relationships among the climatic attributes that control the spatial rainfall distribution: oceanic influence, orography and regional atmospheric dynamics.
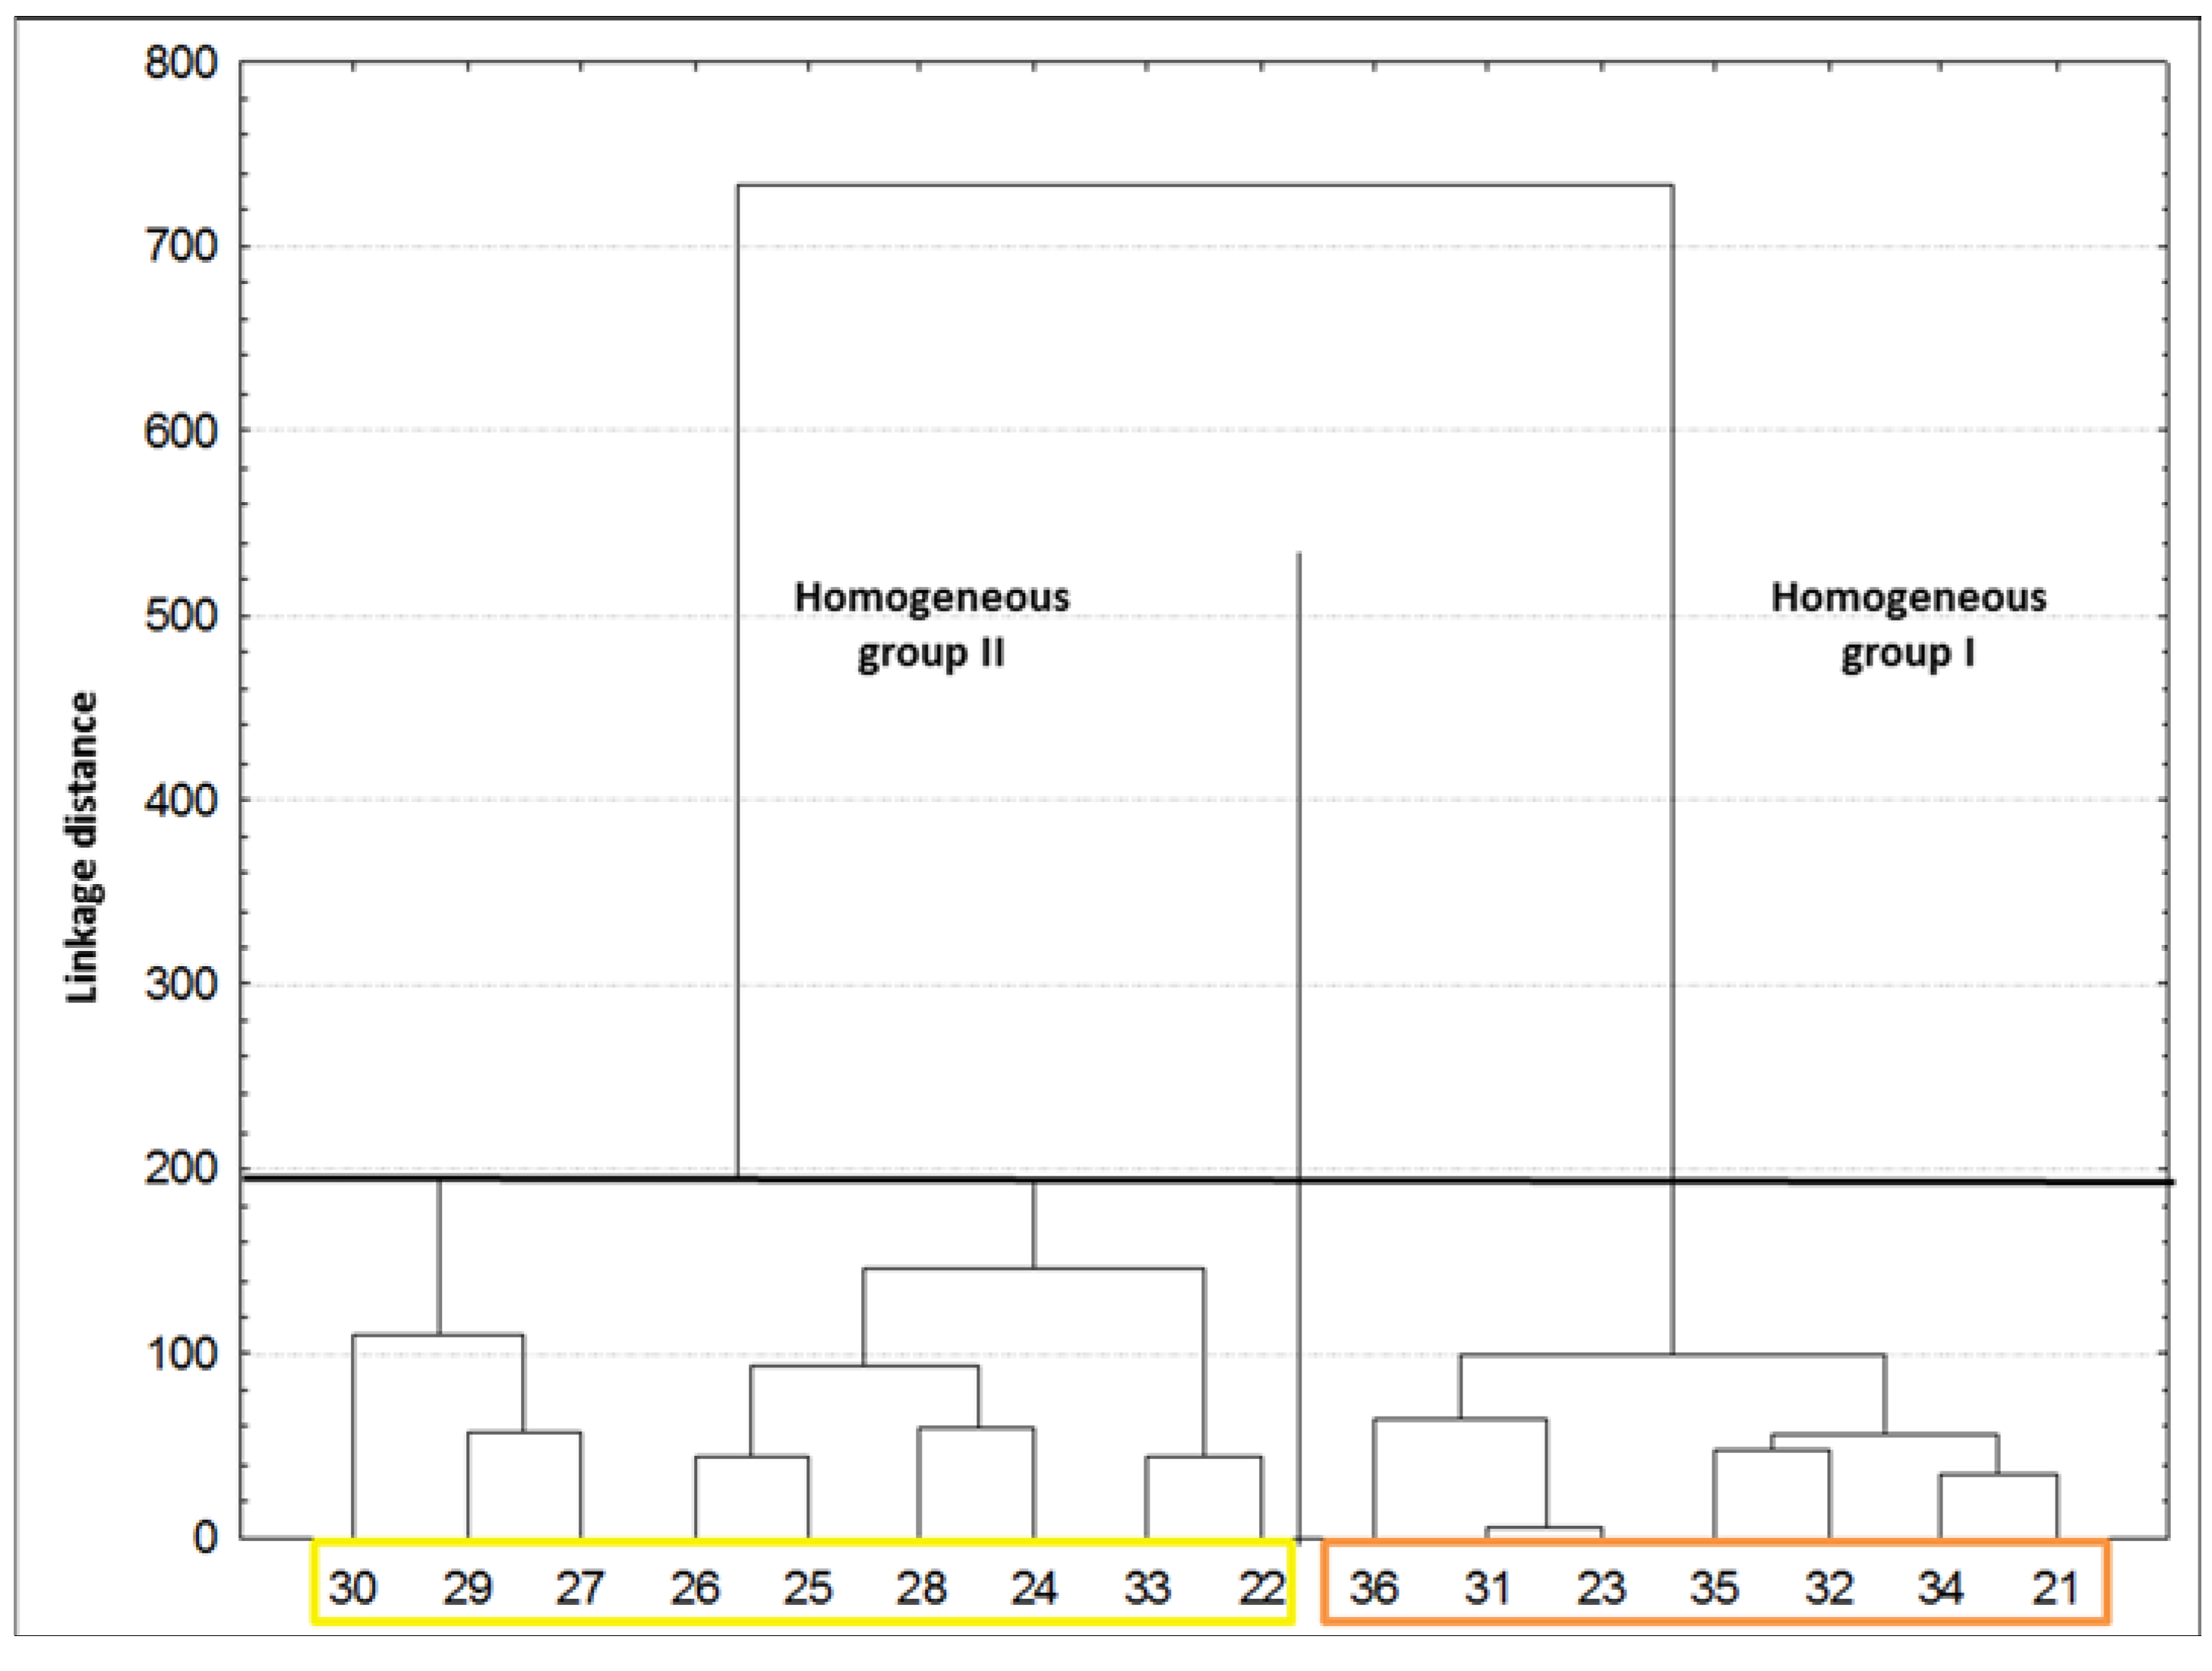
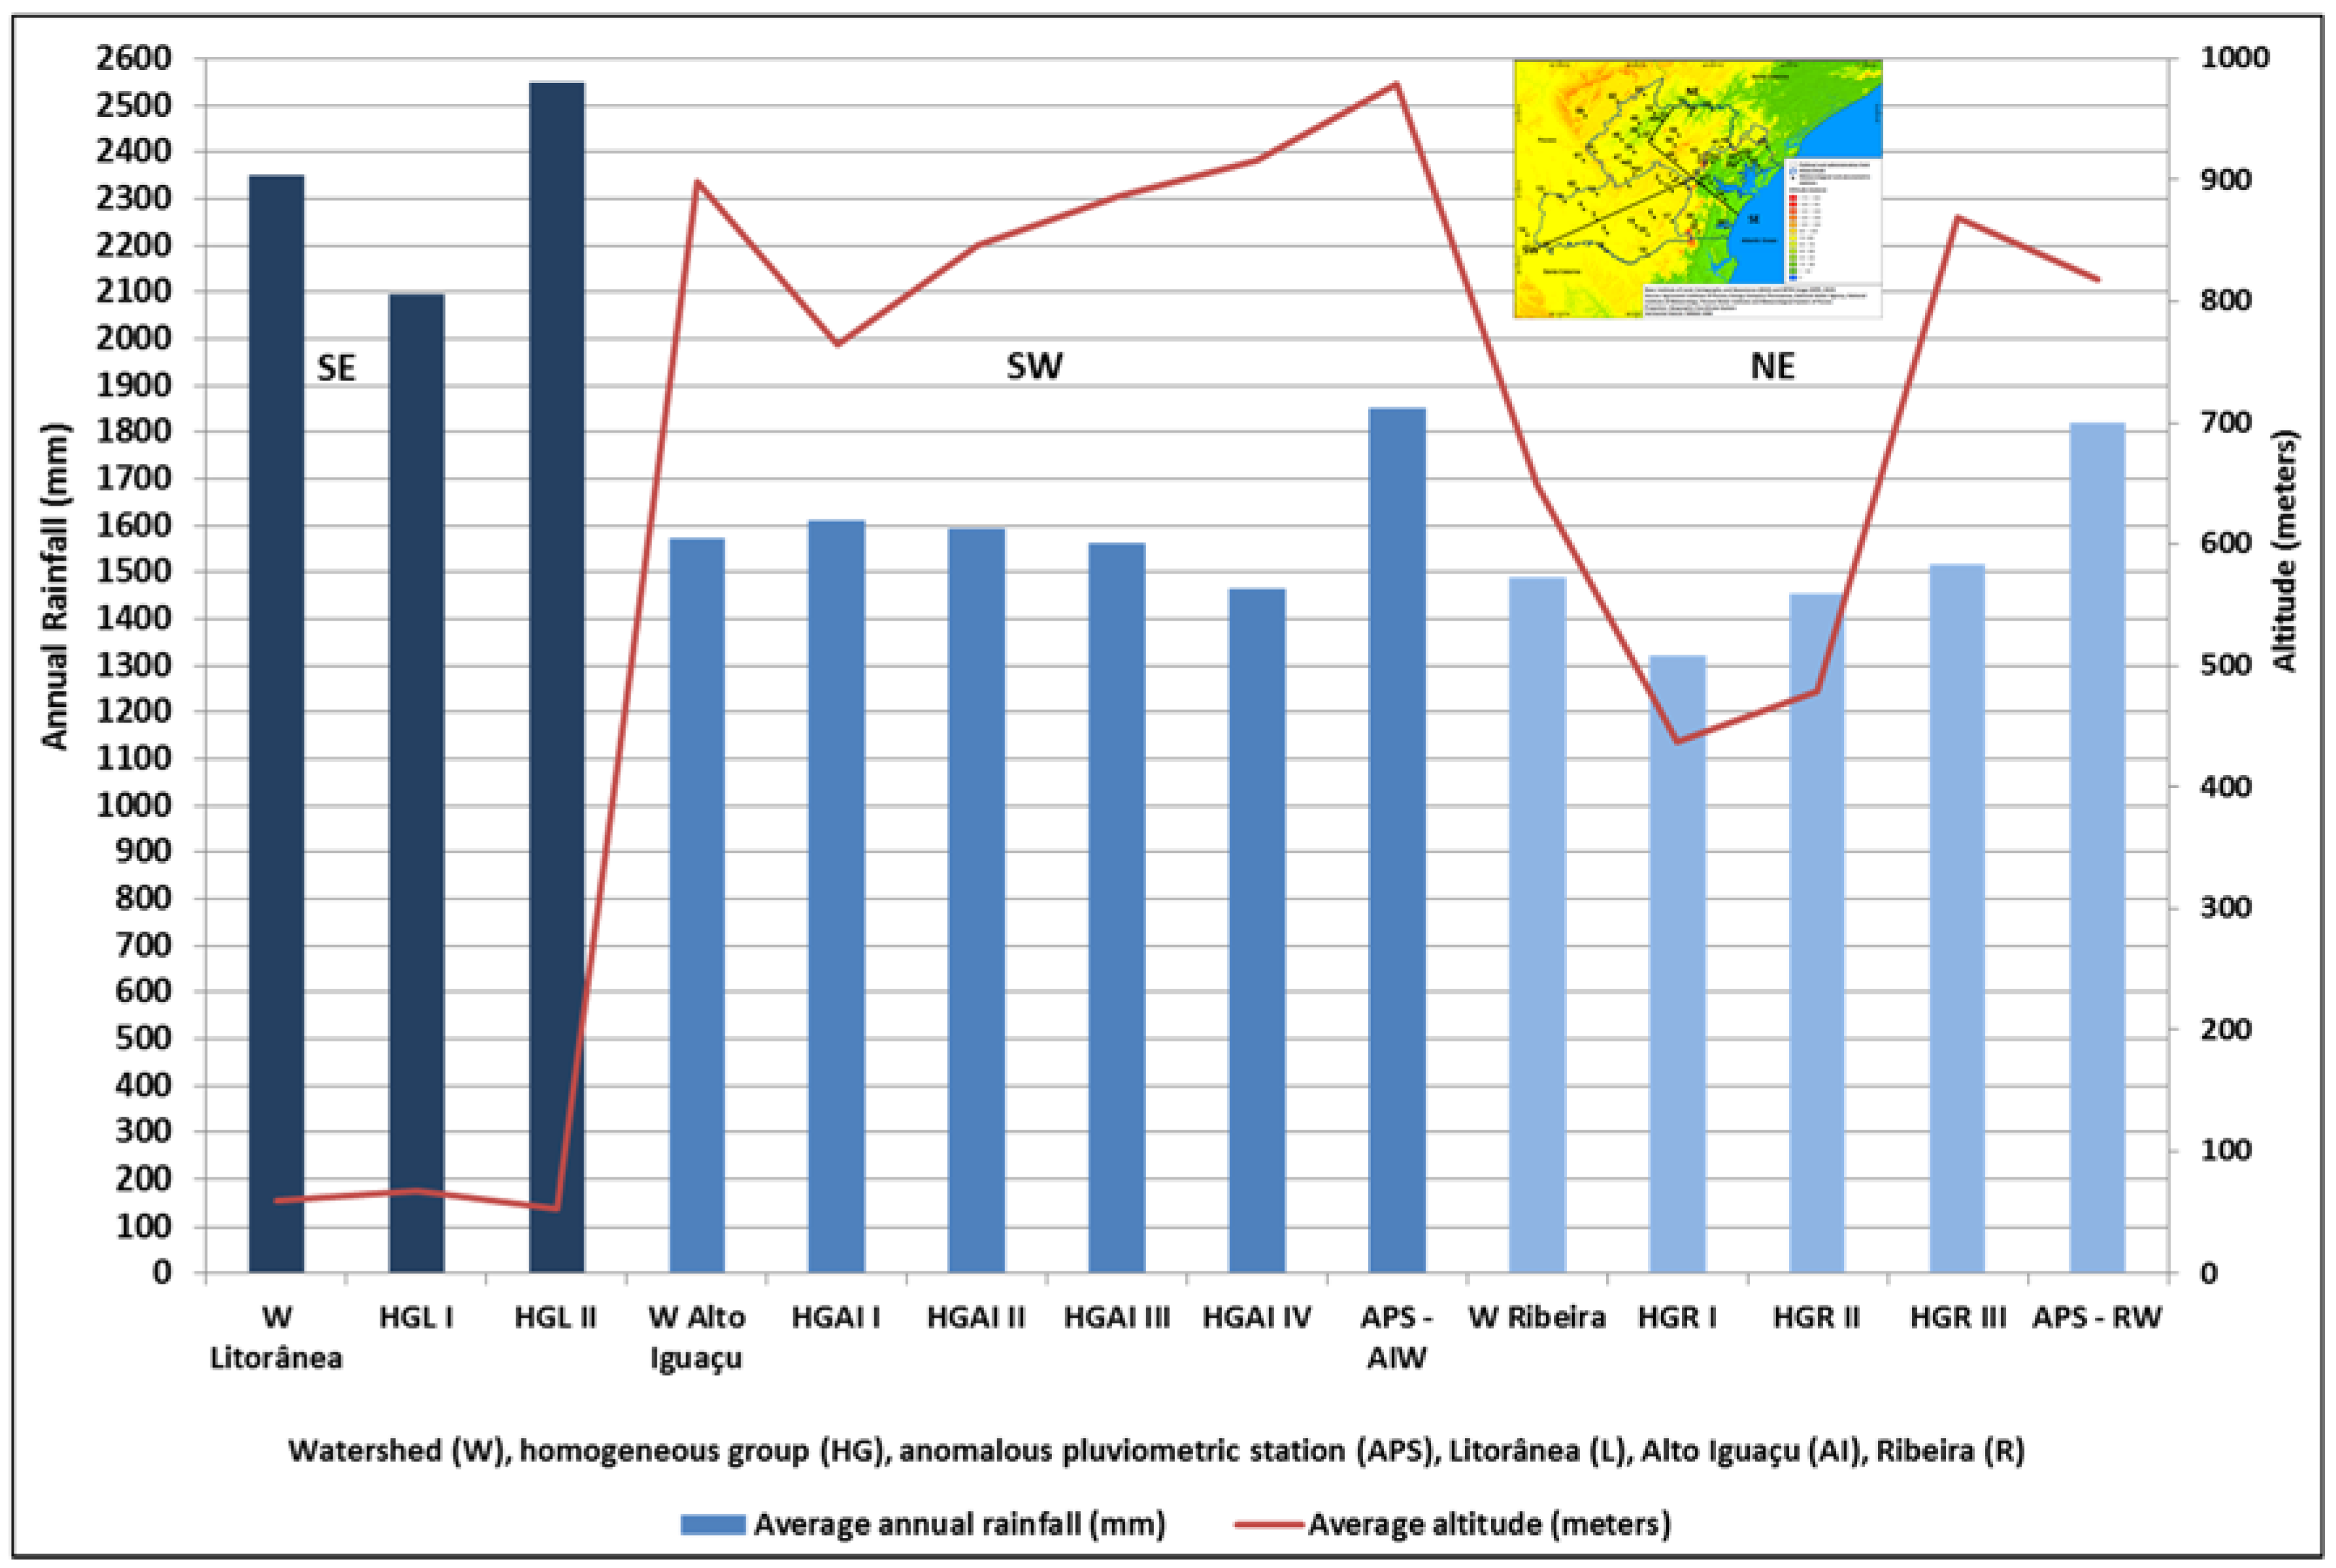
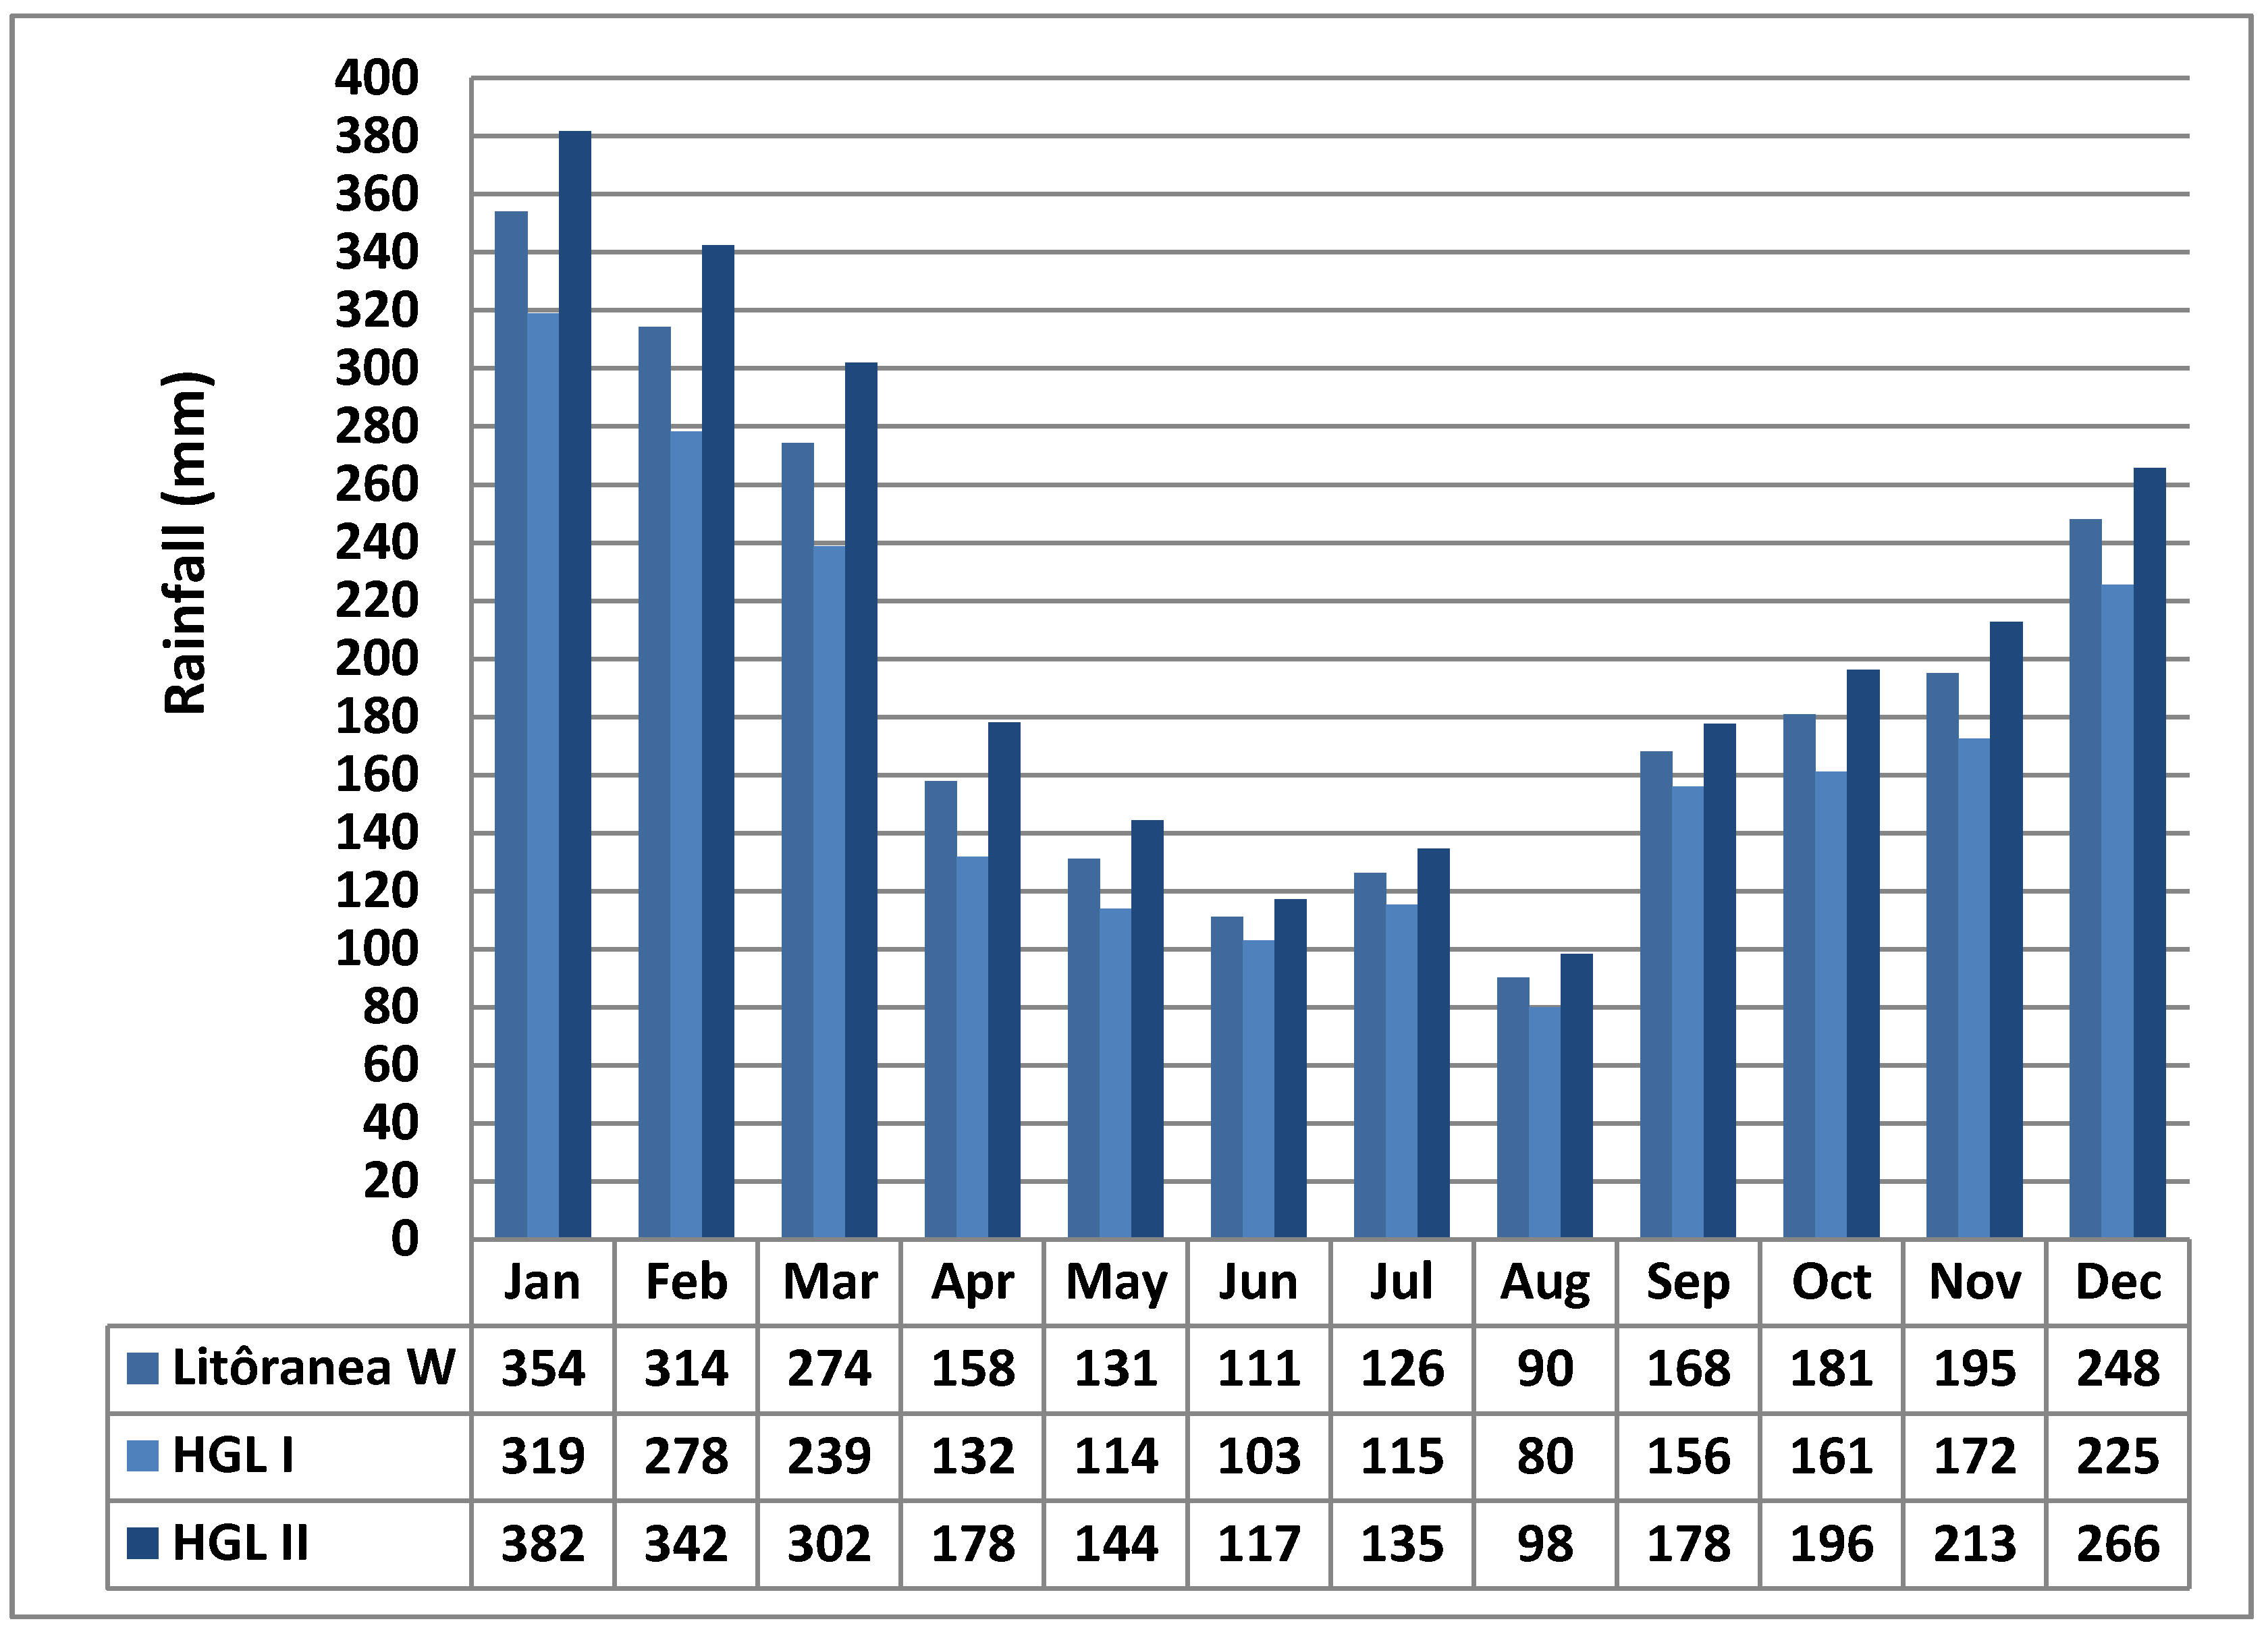
In the Litorânea watershed, two homogeneous groups were identified. Homogeneous group I corresponds to the region receiving less rain, with an annual average of 2094 mm, which is predominantly located in the central sector. Homogeneous group II is characterized by the highest annual rainfall totals, which average 2551 mm and is mainly located in the northeastern region (Figure 7).
Homogeneous group II presents the highest rainfall totals of all the homogeneous groups identified in the watersheds of the eastern region of the state of Paraná for all months, including values above 300 mm in the first quarter (January, February and March) with decreases in the winter months. Homogeneous group I shows higher rainfall totals than other portions of the study area, except for the aforementioned group, and monthly totals that are similar to those of the homogeneous groups of the Alto Iguaçu watershed for the period from May to August (Figure 8).
According to the results of Silva et al. [27], during the rainy season (September to March) and the dry season (April to August), the Paraná coast presents the highest annual rainfall totals among the watersheds selected for the present study. However, due to the oceanic influence, January presented a mean of 382 mm for homogeneous group II. Moreover, the seasonal rainfall typical of tropical climate regions and of the transition between tropical and subtropical climate zones [28] was captured in the data, with 98 mm of monthly rainfall for August (Figure 8). Therefore, although no dry season is observed, the decrease in the monthly rainfall from the wettest month to the driest month is the most significant among the studied watersheds. This highlights the summer monsoon regime in South America observed by Reboita et al. [29] and the highest average annual rainfall totals in the southern region of Brazil, as observed by Nery et al. [30], Grimm [15] and Nery and Carfan [31].
The greatest difference in rainfall between the Litorânea basin and the other basins selected in this study occurs in the summer, between December and February, when the oceanic influence is intensified by warming of the surface water, and rainfall on the continent is reduced by the orography of the Serra do Mar. Conversely, during the winter months, mainly between June and August, the more frequent passage of the Atlantic polar system provides wider rain systems, which are due to its direction and dimensions, as indicated by Borsato and Mendonça [32], Cardozo et al. [33] and Zandonadi et al. [34].
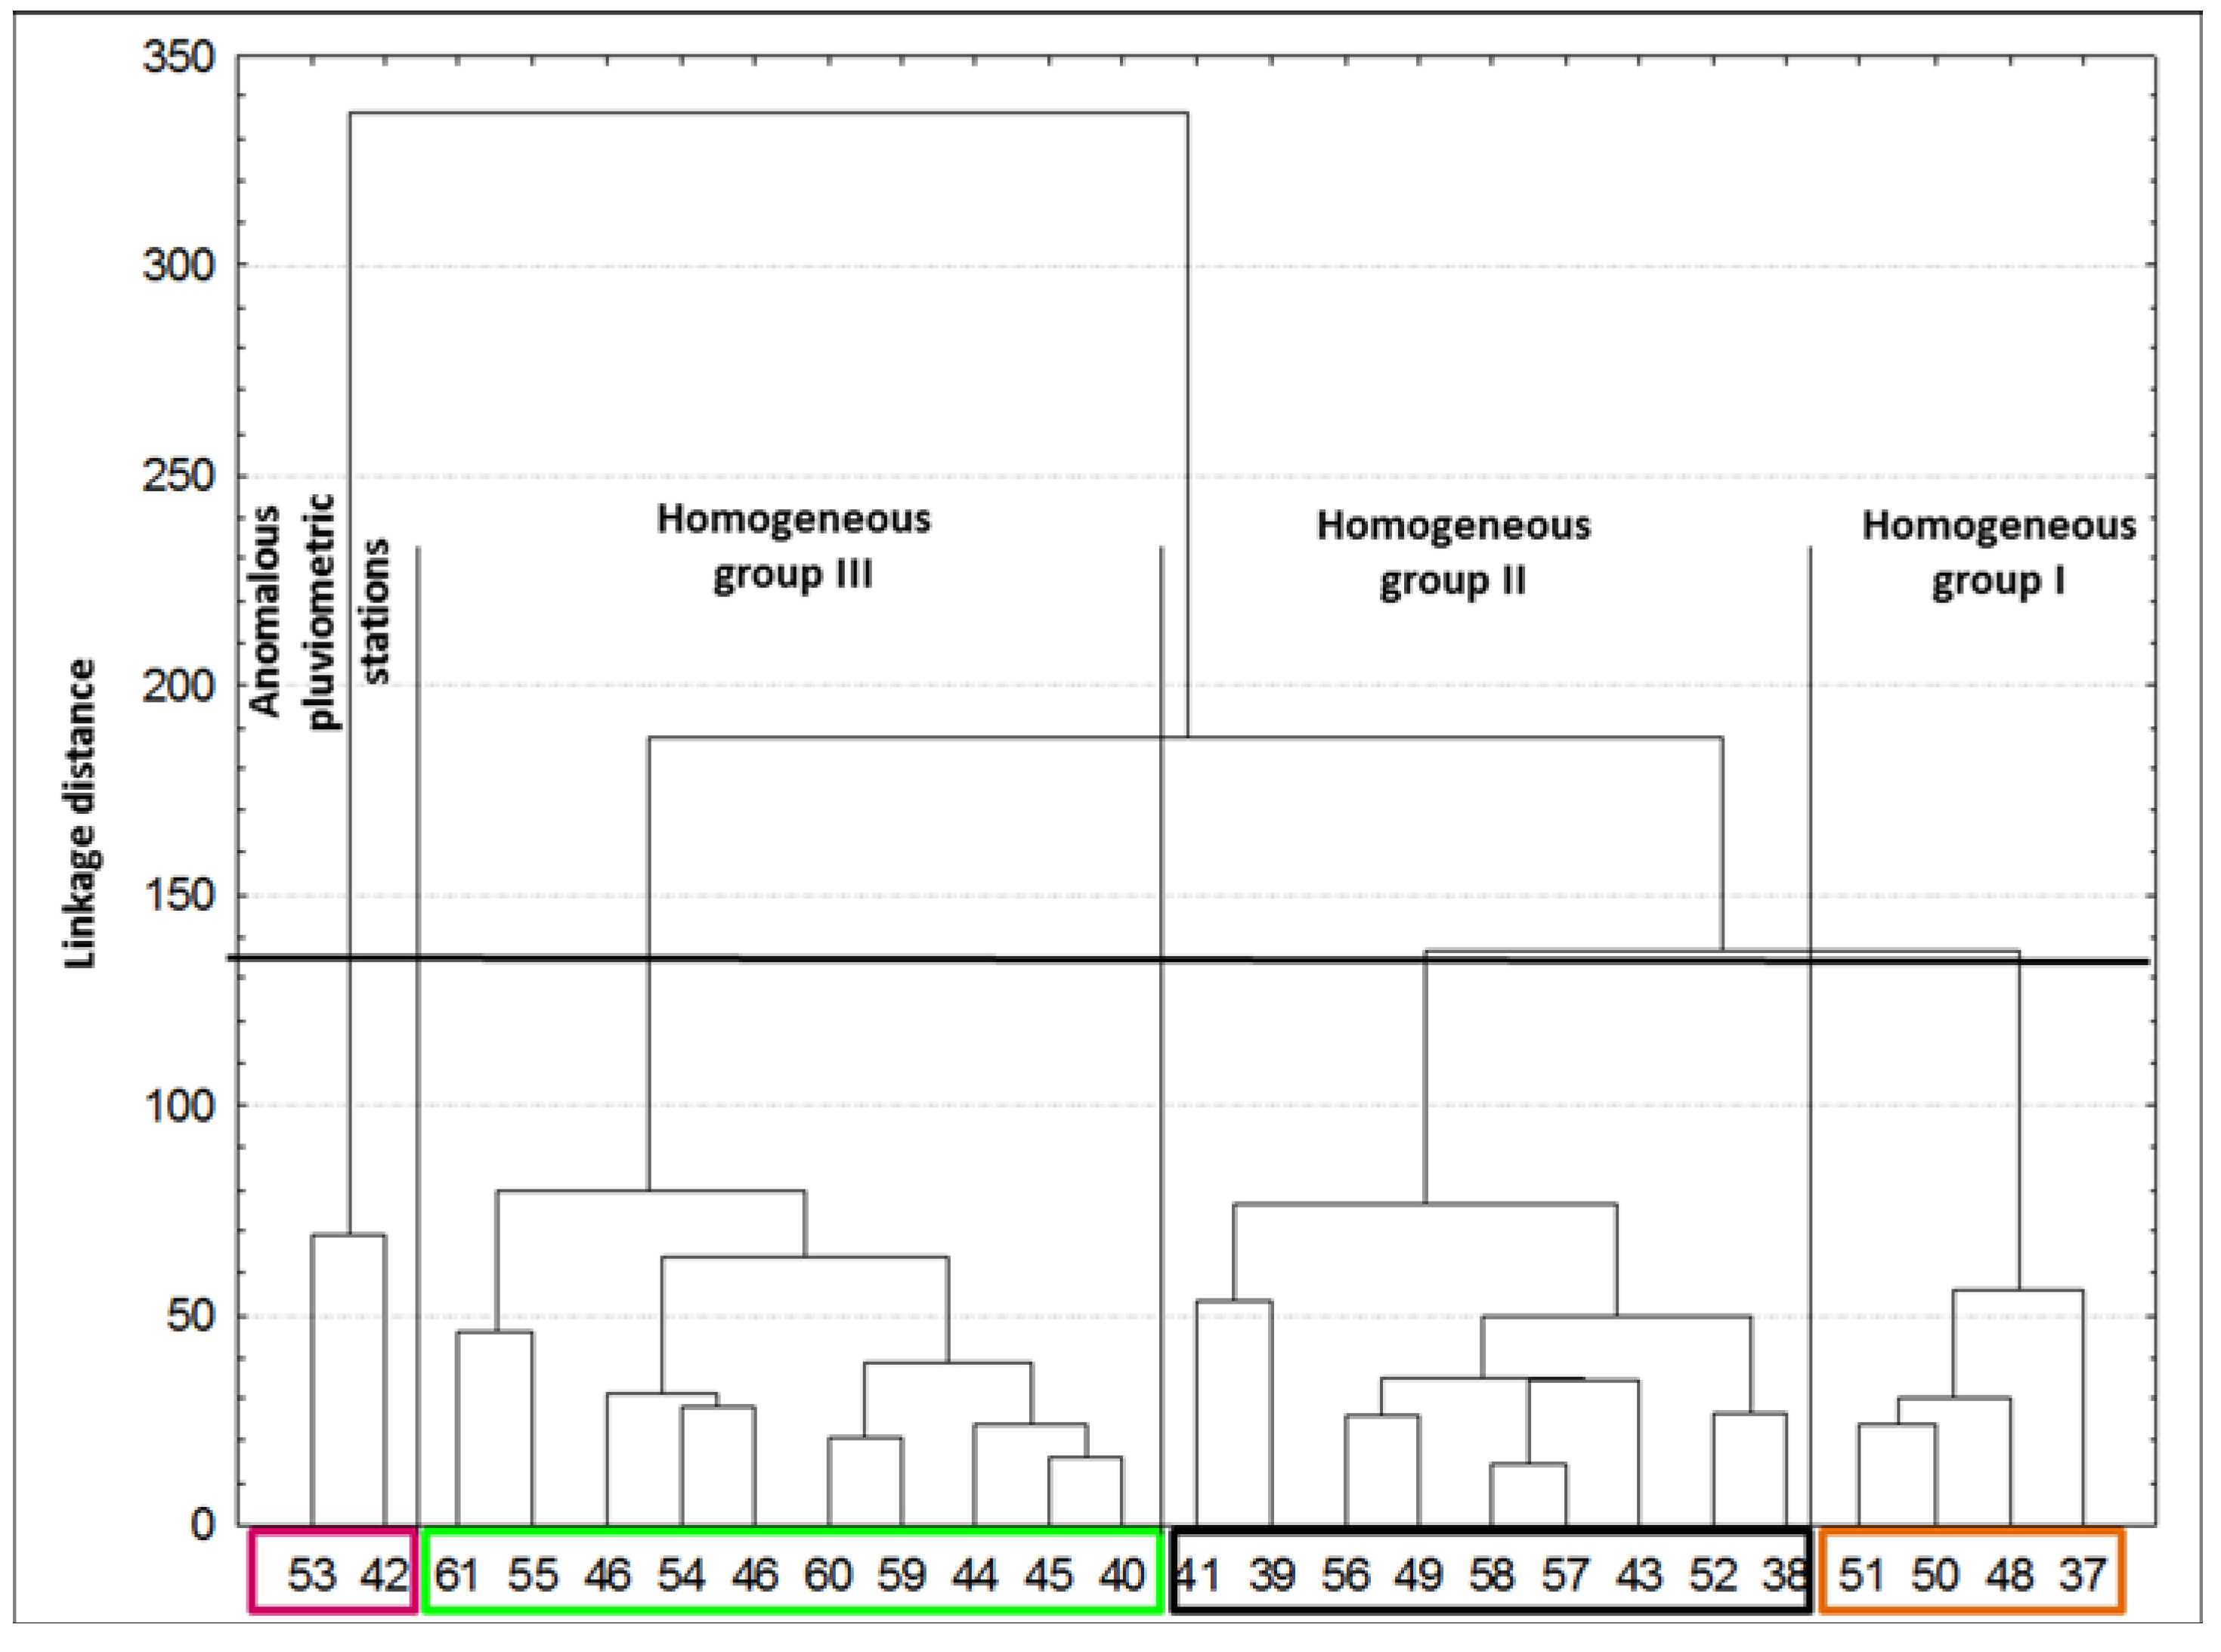
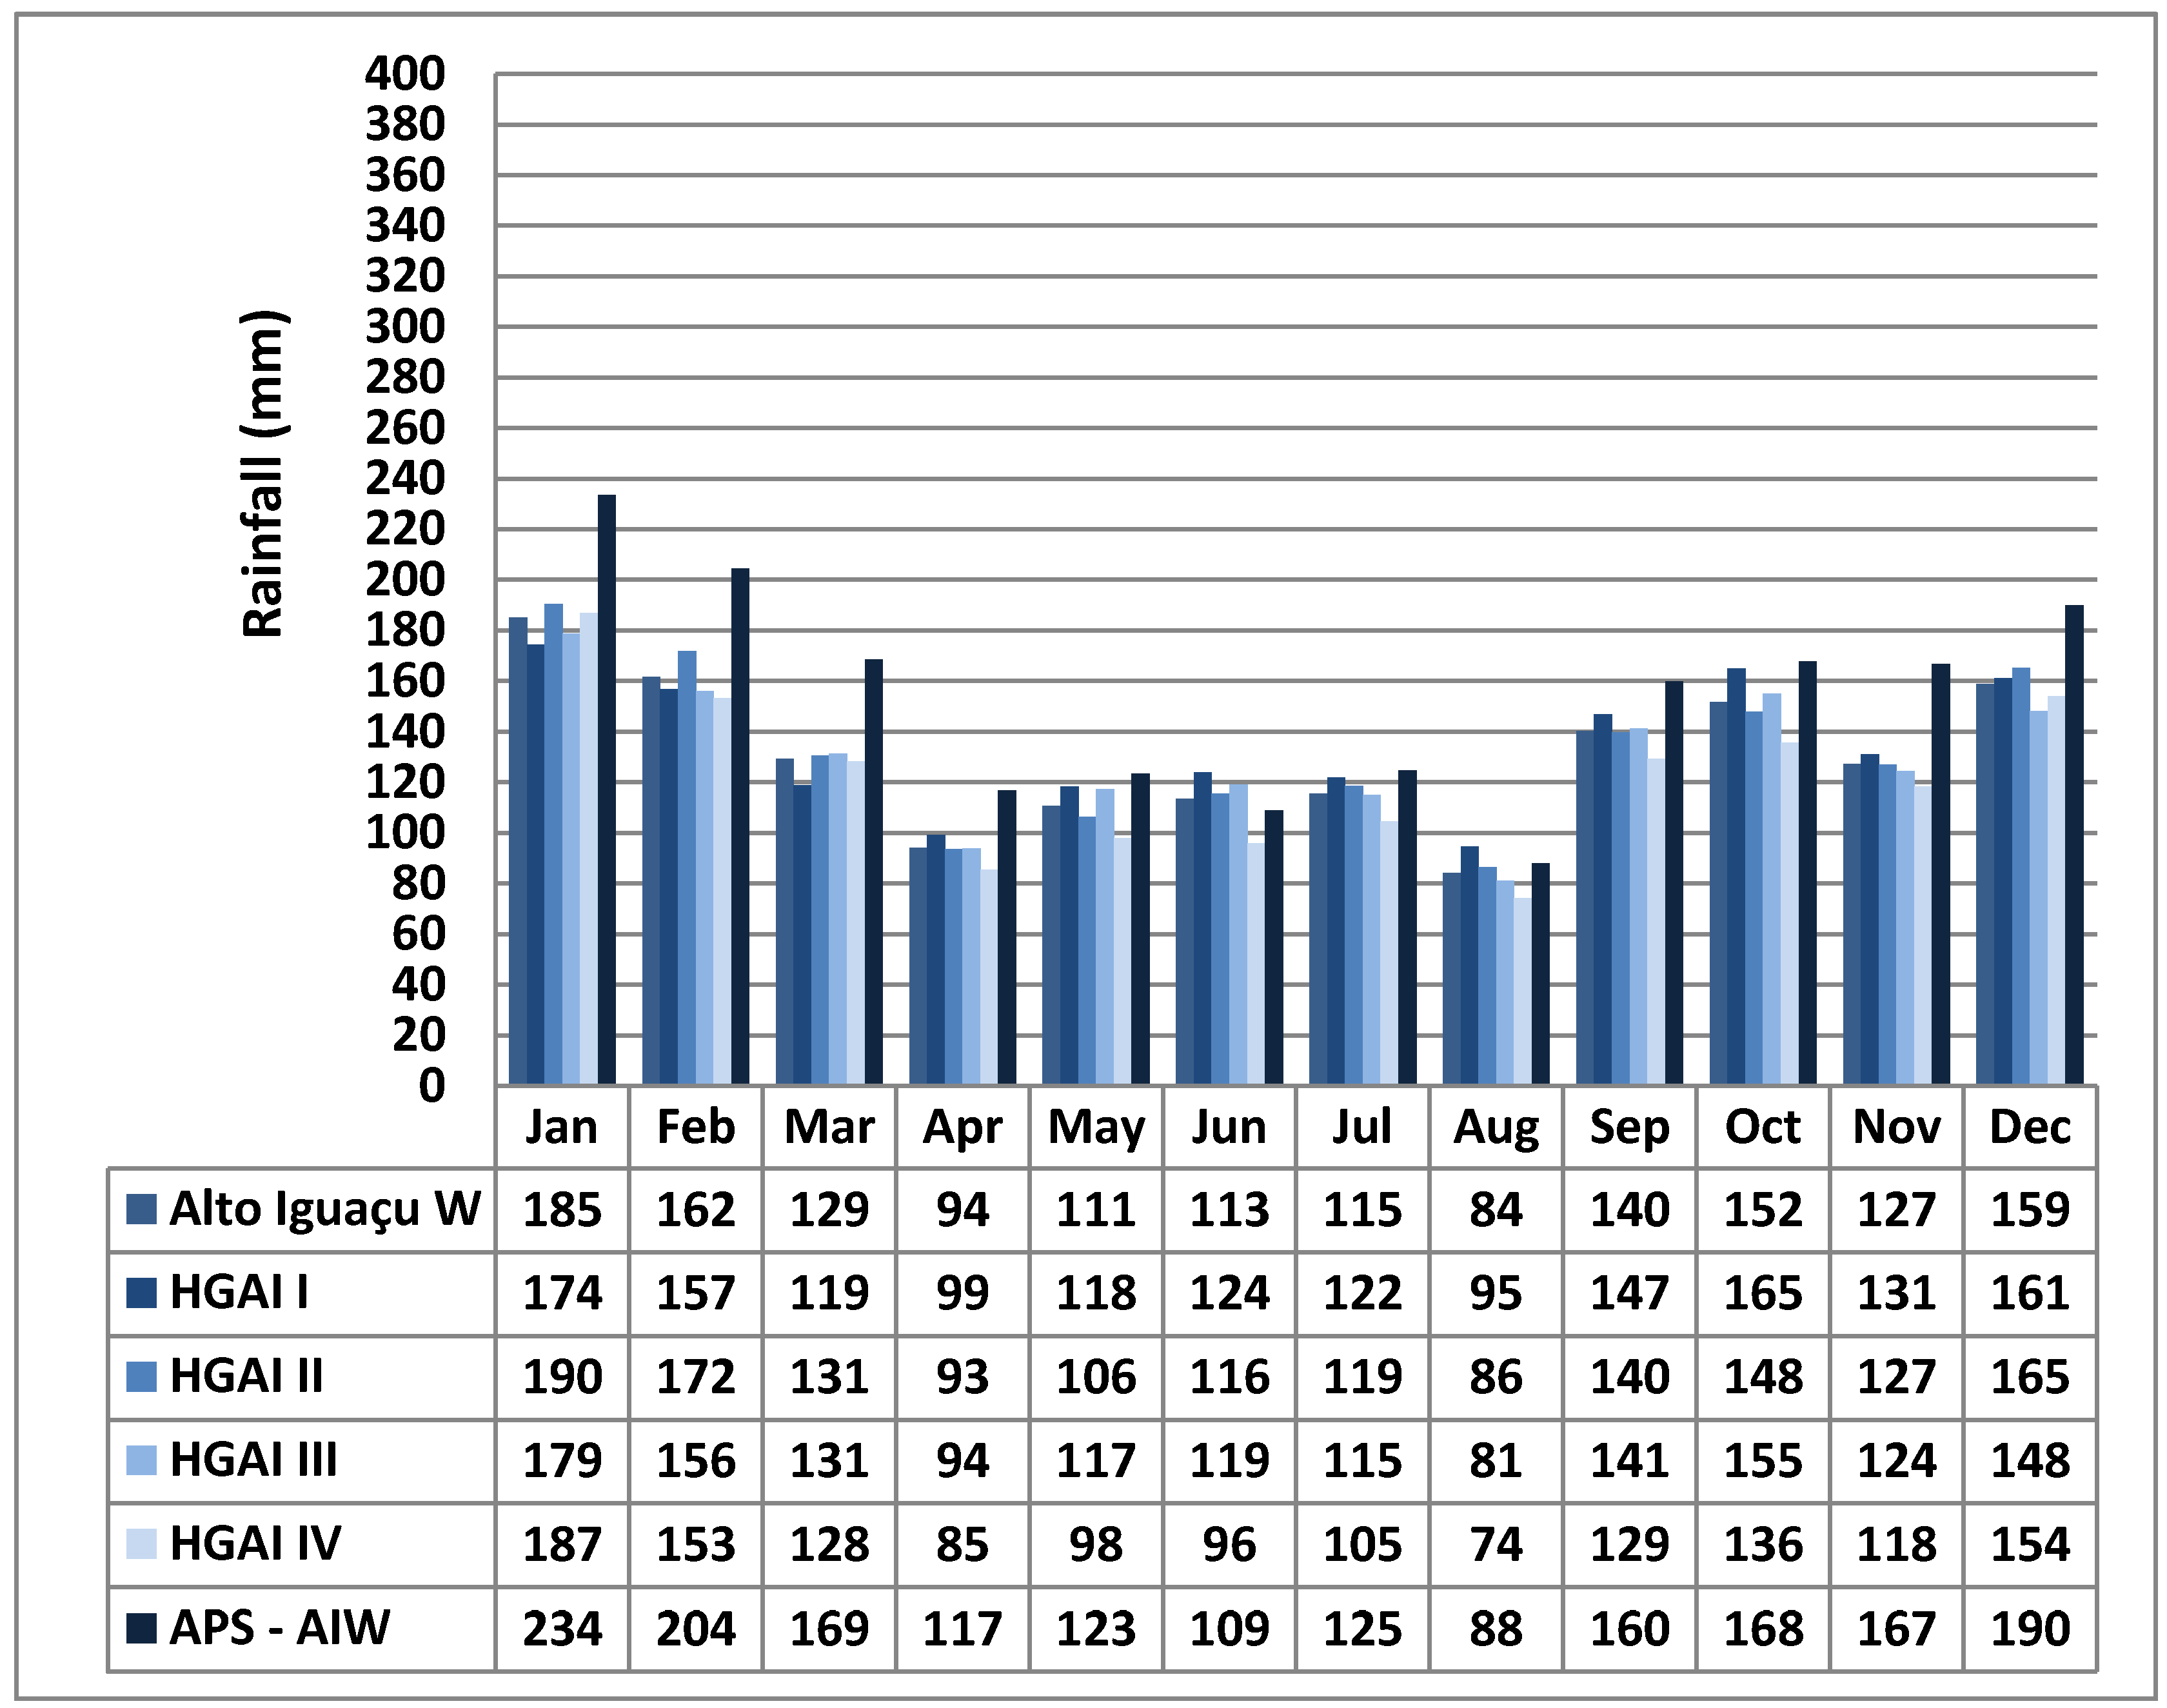
The Alto Iguaçu watershed contains four homogeneous groups and one anomalous pluviometric station, with an average annual rainfall of 1571 mm. In the western sector, homogeneous group I presents the highest annual rainfall totals (1612 mm), even at lower altitudes, whereas homogeneous group IV in the east is characterized by lower total rainfall (1464 mm), which is probably due to the rainfall shadow effect of the Serra do Mar. The anomalous pluviometric station (Piraquara) presents the largest annual rainfall total in this watershed, which can be attributed to its location windward of the Serra do Mar, especially in the summer months, in which the maritime influence is strongest (Figure 7).
Higher rainfall averages were observed for homogeneous group I in the period from May to September, which is probably due to the more incisive action of the frontal atmospheric system in response to its proximity to a subtropical climate zone, whereas in the other months, this rainfall station presents the highest monthly rainfall totals. Homogeneous groups II and III exhibit similar annual totals; however, due to its location closer to the Atlantic Ocean and the consequent increase in the influence of intertropical systems, homogeneous group II presents higher rainfall totals in January, February and December. Homogeneous group IV presents the lowest rainfall totals for the period from April to November among all the groups identified, with emphasis on August (74 mm), which, despite having less than half the average for the wettest month (January), is not a period of drought because it coincides with lower recorded air temperatures, according to Silva et al. [27], significantly decreasing evapotranspiration (Figure 9).
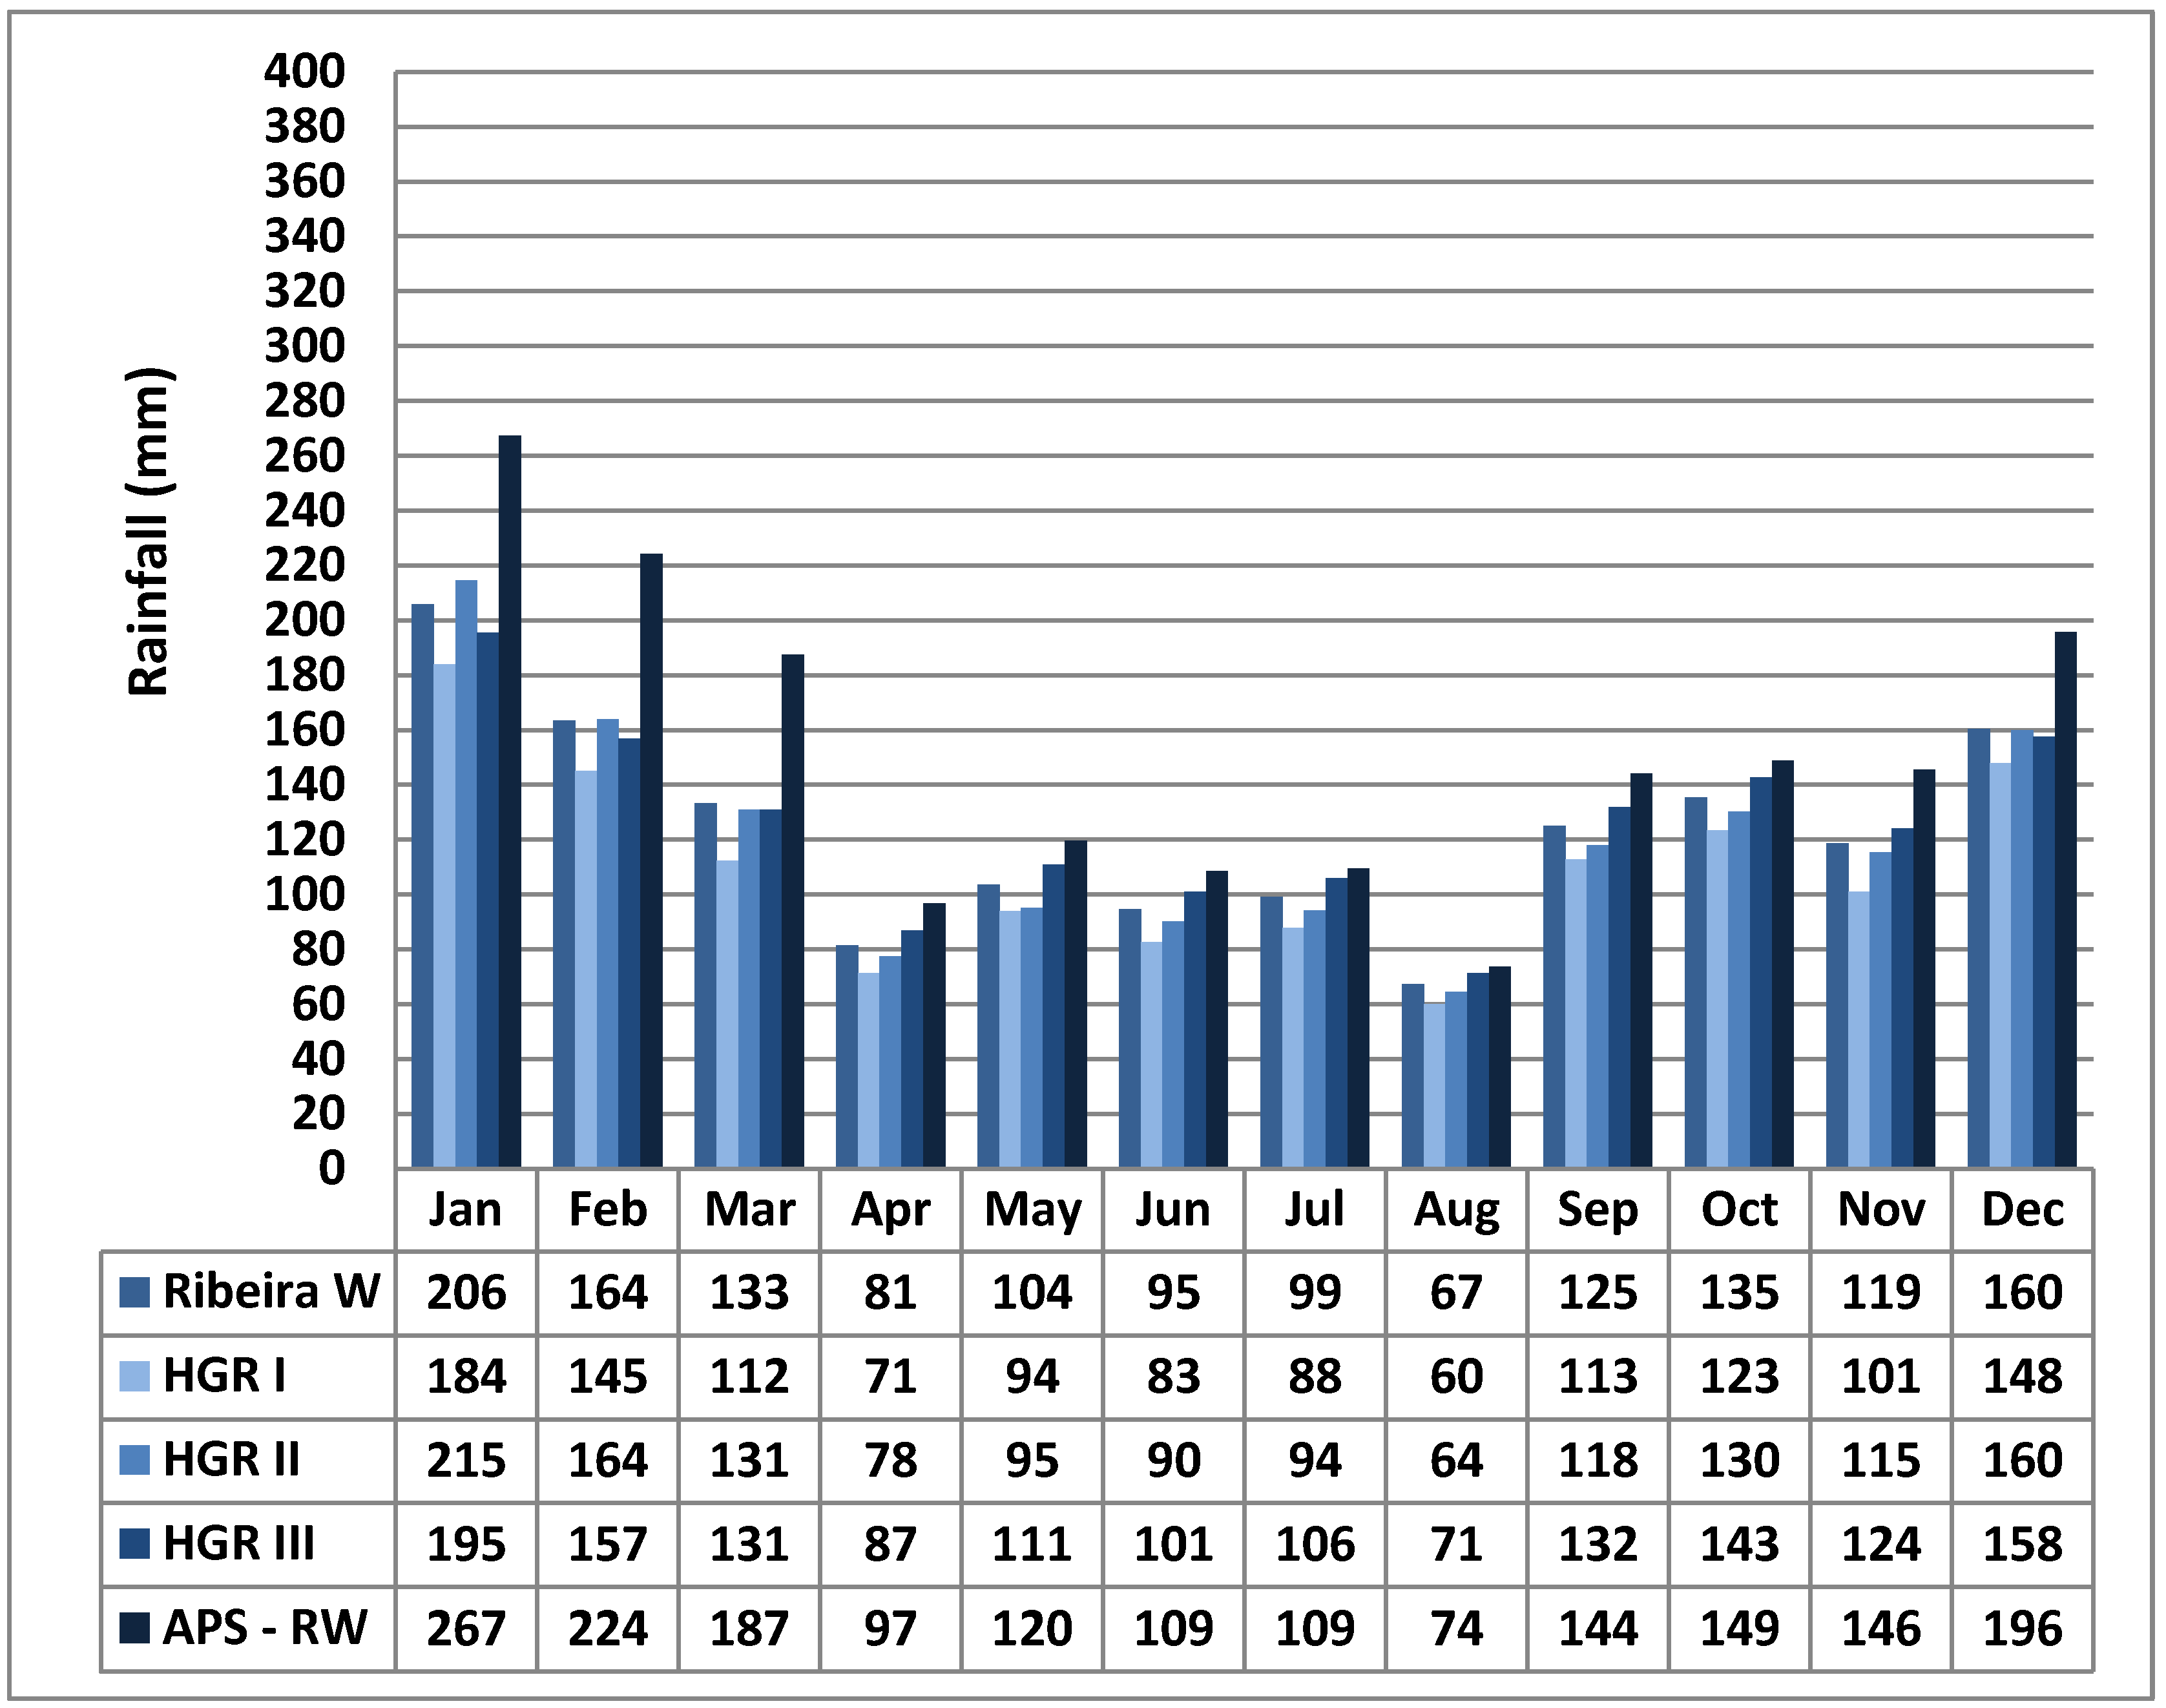
The Ribeira watershed presents the homogeneous groups with the lowest annual rainfall totals for the study area and the lowest average among the watersheds (1488 mm). Because it presents the broadest range of altitude, unlike the Alto Iguaçu watershed, the spatial distribution of rainfall in this watershed is more effectively controlled by the orography, resulting in higher annual totals for homogeneous group III, which has a mean of 1515 mm at an altitude of 869 m, and lower values for homogeneous group I, which has a mean of 1322 mm at an altitude of 437 m. The anomalous pluviometric stations, which are highlighted by higher annual rainfall totals, presented annual totals of 1821 mm at an altitude of 818 m (Figure 7), with the highest monthly rainfall totals mainly between November and March.
It should be noted that homogeneous group I presents the lowest monthly rainfall totals, with the greatest decrease in the months of June, July and August, which implies that this region of the study area is the most tropical. Although the annual totals present a difference of only 60 mm between homogeneous groups II and III, group II is characterized by the highest monthly totals from December to February and is closer to the subtropical climate of southern Brazil, whereas group III, compared with group II, is characterized by greater monthly rainfall homogeneity and higher values between April and November (Figure 10).
The western location of homogeneous group III explains the similarities of its rainfall regime to that of a subtropical climate in addition to the higher altitudes at which the pluviometric and meteorological stations that compose it are located. It is notable that the greatest differences in rainfall among the homogeneous groups of the Ribeira river watershed occur between December and March. During this period, tropical mechanisms are more evident in the formation and generation of rainfall, whereas during the period from June to August, the average monthly rainfall totals are similar and frontal systems predominate in the generation of rainfall [28].
4. Discussion
The resulting grouping of homogeneous rainfall regions is concordant with and similar to that obtained by Fritzsons et al. [12] for the state of Paraná. In the regions of the study area with lower rainfall, specifically in homogeneous group I (1322 mm) in the Ribeira Valley region, the greatest differences are between the rainy quarter (December, January and February) and the dry quarter (June, July and August). These same authors determined that the region including the Alto Iguaçu watershed is characterized by a homogeneous distribution of rainfall, smaller differences between the rainy and dry quarters and even smaller differences in the pluviometric spatial variability among the homogeneous groups. The Paraná coastline stands out among the homogeneous groups identified for the state due to its high rainfall (2351 mm), which is due to several factors, such as its oceanic influence, the orography of the Serra do Mar and the thermal contrast between the ocean and the continent (Figure 7).
According to Vanhoni and Mendonça [35], the Paraná coast presents the highest rainfall totals in the state, with average values exceeding 2000 mm, and it is characterized by maximum rainfall during the summer due to the profound influence of the tropical Atlantic air mass, which enhances the oceanic influence and generates greater rainfall totals. Conversely, the Ribeira river watershed is characterized by one of the lowest rainfall averages in the state of Paraná, with annual rainfall averaging between 1200 and 1400 mm, because it is located in the leeward region of the Serra do Mar, which is subject to concentrated rainfall in the summer and a significant decrease in rainfall in the winter. In contrast, in the Alto Iguaçu watershed, the average annual rainfall is between 1500 and 1700 mm, and the monthly totals are distributed homogeneously; these characteristics are similar to those of the subtropical climate of southern Brazil, which exhibits a nearly constant polar frontal system that generates rain [36,37].
Baldo et al. [38] observed high rainfall totals in the coastal regions of Paraná and Santa Catarina, with values exceeding 2000 mm due to the influence of the transition between the cold currents of the Malvinas and the warm current of Brazil, especially when the rainfall increases in January, February and December. They also reported that the role played by the Serra do Mar, which separates the coast from the high-altitude interior plateau, forms a barrier that hinders the entry of air masses and reduces rainfall in the continental region.
Comparatively, the Paraná coast is characterized by less annual rainfall than the São Paulo coast due to its greater dependence on frontal systems for generating rain, the decreased action of tropical systems and the decreased frequency of stationary fronts in comparison to the northern coast of São Paulo, which is one of the regions of the Brazilian territory with the highest average annual rainfall, according to Sant’Anna Neto [18].
5. Conclusions
Establishing homogeneous groups for each watershed allowed rainfall variability and the relationships among the effects of oceanic influence, the orographic action of the Serra do Mar, and the regional atmospheric dynamics underlying the pluviometric spatial structure of the studied area to be identified. This paper allowed a satisfactory application of cluster analysis for understanding the interaction between the geographic factors of climate, highlighting the role played by the oceanic influence for the highest rainfall totals in the coastal watershed, the orographic effect for the rainfall reduction in the Alto Iguaçu and Ribeira watersheds, and the interference of regional atmospheric dynamics in the monthly rainfall distribution. Thus, it constitutes an important analysis of the spatial distribution of rainfall in a transition region from a tropical to subtropical climate and with an important orographic barrier, namely, the Serra do Mar in the Paraná territory.
The Litorânea watershed exhibited the highest rainfall totals of the study area, with an average of 2551 mm for the homogeneous group with the highest rainfall total. Rainfall exceeding 300 mm was observed in January, demonstrating the effects of oceanic influence and ocean surface warming on rainfall generation, whereas in the Ribeira and Litorânea watersheds, on the leeward side of the Serra do Mar, averages of approximately 180 mm were observed for the homogeneous groups with the lower rainfall amounts. The winter months, from June to August, presented the lowest rainfall differences between the homogeneous groups and the watersheds, which is attributed to the predominant action of extratropical atmospheric systems for rainfall generation.
It was determined that the Ribeira river watershed presents the greatest spatial rainfall variability due to its greater hypsometry variations. This same watershed is characterized by the lowest rainfall totals, especially for the homogeneous group at lower altitudes, which has an annual average of 1322 mm, where the significant decrease in rainfall during the winter months showed a climatic transition from subtropical to tropical. However, it is observed that the Alto Iguaçu watershed presents smaller differences in the rainfall of the homogeneous groups, which is attributed to flatter relief and to the more homogeneous rainfall regime that is inherent in the subtropical climate domain.
Acknowledgments
The authors thank the Coordination for the Improvement of Higher Education Personnel (CAPES) for granting a doctoral scholarship to the first author and National Counsel of Technological and Scientific Development (CNPq) for the Research productivity fellowship—Level 1D (303676/2013-2) granted to the second author.
Author Contributions
This paper is one part of the doctoral thesis of the first author under the guidance of the second author.
Conflicts of Interest
The authors declare no conflict of interest.
References
- Clarke, R.T.; Silva, B.C. Análise estatística de chuvas intensas na bacia do rio São Francisco. Rev. Bras. Met. 2004, 19, 265–272. [Google Scholar]
- Álvares, C.A.; Stape, J.L.; Sentelhas, P.C.; De Moraes Gonçalves, J.L.; Sparovek, G. Köppen’s climate classification map for Brazil. Meteorol. Z. 2013, 22, 711–728. [Google Scholar] [CrossRef]
- Pell, M.C.; Finlayson, B.L.; MCMahon, T.A. Update world map of the Köppen—Geiger climate classification. Hydrol. Earth Syst. Sci. 2007, 11, 1633–1644. [Google Scholar] [CrossRef]
- Silva, A.M. Rainfall erosivity map for Brazil. Catena 2004, 57, 251–259. [Google Scholar] [CrossRef]
- Queiroz, E.F.; Silva, R.J.B.; Oliveira, M.C.N. Modelo de análise de regressão periódica da precipitação mensal, da bacia atlântico sudeste, no Estado do Paraná. Pesq. Agropec. Bras. 2001, 36, 727–742. [Google Scholar] [CrossRef]
- Chierice, R.A.F.; Landim, P.M.B. Variabilidade espacial e temporal de precipitação pluviométrica na bacia hidrográfica do rio Mogi Guaçu. Geociências 2014, 33, 157–171. [Google Scholar]
- Melo Júnior, J.C.F.; Sediyama, G.C.; Ferreira, P.A.; Leal, B.G. Determinação de regiões homogêneas quanto à distribuição de freqüência de chuvas no leste do Estado de Minas Gerais. Rev. Bras. Eng. Agríc. Amb. 2006, 10, 408–416. [Google Scholar] [CrossRef]
- Wrege, M.S.; Fritzsons, E.; Caramori, P.H.; Ricce, W.S.; Radin, B.; Steinmetz, S.; Reisser Júnior, C. Regiões com similaridade de comportamento hídrico no Sul do Brasil. RA’E GA: O Esp. Geogr. Análise 2016, 38, 363–382. [Google Scholar] [CrossRef]
- Keller Filho, T.; Assad, E.D.; Lima, P.R.S.R. Regiões pluviometricamente homogêneas no Brasil. Rev. Bras. Pesq. Agropec. 2005, 40, 311–322. [Google Scholar] [CrossRef]
- Brito, T.T.; Oliveira Júnior, J.F.; Lyra, G.B.; Gois, G.; Zeri, M. Multivariate analysis applied to monthly rainfall over Rio de Janeiro state, Brazil. Meteo. Atmosp. Phys. 2016, 128, 1–10. [Google Scholar] [CrossRef]
- Ward, J.H. Hierarquical grouping to optimize an objective function. J. Am. Stat. Assoc. 1963, 58, 236–244. [Google Scholar] [CrossRef]
- Fritzsons, E.; Mantovani, L.E.; Wrege, M.S.; Chaves Neto, A. Análise da pluviometria para definição de zonas homogêneas no estado do Paraná. RA’E GA: O Esp. Geogr. Análise 2011, 23, 555–572. [Google Scholar] [CrossRef]
- Aparecido, L.E.O.; Rolim, G.S.; Richetti, J.; Souza, P.S.; Johann, J.A. Köppen, Thornthwaite and Camargo climate classifications for climatic zoning in the State of Paraná, Brazil. Ciência e Agrotecnologia 2016, 40, 405–417. [Google Scholar] [CrossRef]
- Instituto de Terras, Cartografia e Geodésia (ITCG). Available online: http://www.itcg.pr.gov.br/modules/conteudo/conteudo.php?conteudo=47 (accessed on 28 August 2016).
- Grimm, A.M. Clima na Região Sul. In Tempo e Clima no Brasil, 1st ed.; Cavalcanti, I.F.A., Ferreira, N.J., Justi da Silva, M.G.A., Silva Dias, M.A.F., Eds.; Editora Contexto: São Paulo, Brazil, 2009; pp. 259–275. [Google Scholar]
- Pellegatti, C.H.G.; Galvani, E. Avaliação da precipitação na Serra do Mar—SP: Eventos de diferentes intensidade e duração. Geousp 2010, 13, 132–148. [Google Scholar] [CrossRef]
- Nunes, L.H.; Modesto, R.P. Comportamento pluviométrico nos municípios atendidos pelo Plano Preventivo de Defesa Civil—PPDC. Rev. Inst. Geol. 1992, 13, 47–57. [Google Scholar] [CrossRef]
- Sant’Anna Neto, J.L. Dinâmica atmosférica e o caráter transicional do clima na Zona Costeira Paulista. Rev. Dep. Geo. (USP) 1994, 8, 35–49. [Google Scholar] [CrossRef]
- Seluchi, M.E.; Chou, S.C. Synoptic patterns associated with landslides events in the Serra do Mar, Brazil. Theor. App. Climatol. 2009, 98, 67–77. [Google Scholar] [CrossRef]
- Milanesi, M.A.; Galvani, E. Efeito orográfico na Ilha de São Sebastião (Ilha Bela—SP). Rev. Bras. Climatol. 2011, 9, 68–79. [Google Scholar]
- Bertoni, J.C.; Tucci, C.E.M. Precipitação. In Hidrologia: Ciência e Aplicação, 2nd ed.; Tucci, C.E.M., Ed.; Editora da Universidade Federal do Rio Grande do Sul/Associação Brasileira de Recursos Hídricos: Porto Alegre, Brazil, 1997; pp. 727–768. [Google Scholar]
- Villella, S.M.; Mattos, A. Hidrologia Aplicada; Editora McGraw-Hill: São Paulo, Brazil, 1975; p. 245. [Google Scholar]
- Oliveira, L.F.C.; Fioreze, A.P.; Medeiros, A.M.M.; Silva, M.A.S. Comparação de metodologias de preenchimento de falhas em séries históricas de precipitação pluvial anual. Rev. Bras. Eng. Agríc. Amb. 2010, 14, 1186–1192. [Google Scholar] [CrossRef]
- Nascimento, F.C.A.; Araújo, F.R.C.D.; Braga, C.C.; Costa, E.V.S. Análise dos padrões espaciais e temporais da precipitação no Estado do Maranhão. Rev. Bras. Geo. Fís. 2015, 8, 422–430. [Google Scholar]
- Teodoro, P.E.; Oliveira Júnior, J.F.; Da Cunha, E.R.; Correa, C.C.G.; Torres, F.E.; Bacani, V.M.; Gois, G.; Ribeiro, L.P. Cluster analysis applied to the spatial and temporal variability of monthly rainfall in Mato Grosso do Sul State, Brazil. Meteorol. Atmo. Phys. 2015, 128, 197–209. [Google Scholar] [CrossRef]
- Freitas, J.C.; Andrade, A.R.S.; Braga, C.C.; Godoi Neto, A.H.; Almeida, T.F. Análise de agrupamento na identificação de regiões homogêneas de índices climáticos no Estado da Paraíba, Brasil. Rev. Bras. Geo. Fís. 2013, 6, 732–748. [Google Scholar]
- Silva, W.L.; Dereczynski, C.; Chang, M.; Freitas, M.; Machado, B.J.; Tristão, L.; Ruggeri, J. Tendências observadas em indicadores de extremos climáticos de temperatura e precipitação no Estado do Paraná. Rev. Bras. Met. 2015, 30, 181–194. [Google Scholar] [CrossRef]
- Silva, C.B.; Sant’anna Neto, J.L.; Tommaselli, J.T.G.; Passos, M.M. Dinâmica atmosférica e análise geoestatística do clima na área de integração paisagística ‘Raia Divisória’ SP/PR/MS: Uma proposta de tipologia climática. Rev. Bras. Climatol. 2006, 2, 53–70. [Google Scholar] [CrossRef]
- Reboita, M.S.; Gan, M.A.; Rocha, R.P.; Ambrizzi, T. Regimes de precipitação na América do Sul. Rev. Bras. Met. 2010, 25, 185–204. [Google Scholar] [CrossRef]
- Nery, J.T. Dinâmica climática da região Sul do Brasil. Rev. Bras. Climatol. 2006, 1, 61–75. [Google Scholar] [CrossRef]
- Nery, J.T.; Carfan, A.C. Re-analysis of pluvial precipitation in southern Brazil. Atmosféra 2014, 27, 103–114. [Google Scholar]
- Borsato, V.A.; Mendonça, F.A. Participação da massa polar atlântica na dinâmica dos sistemas atmosféricos no Centro Sul do Brasil. Mercator 2015, 14, 113–130. [Google Scholar] [CrossRef]
- Cardozo, A.B.; Reboita, M.S.; Garcia, S.R. Climatologia de Frentes Frias na América do Sul e sua relação com o Modo Anular Sul. Rev. Bras. Climatol. 2015, 17, 9–29. [Google Scholar] [CrossRef]
- Zandonadi, L.; Acquaotta, F.; Fratianni, S.; Zavattini, J.A. Changes in precipitation extremes in Brazil (Paraná River Basin). Theor. Appl. Climatol. 2015, 119, 741–756. [Google Scholar] [CrossRef]
- Vanhoni, F.; Mendonça, F.A. O clima no litoral do Estado do Paraná. Rev. Bras. Climat. 2008, 3, 49–64. [Google Scholar] [CrossRef]
- Nery, J.T.; Martins, M.L.F.; Sant’Anna Neto, J.L. Variabilidade da precipitação no Brasil Meridional. Acta Scient. Technol. 2002, 24, 1687–1695. [Google Scholar] [CrossRef]
- Maack, R. Geografia Física do Estado do Paraná, 4th ed.; Editora UEPG: Ponta Grossa, Brazil, 2012; p. 526. [Google Scholar]
- Baldo, M.C.; Nery, J.T.; Martins, M.O.F. Análise da estrutura da precipitação pluviométrica na região Sul do Brasil. Bol. Geografia 2001, 19, 115–128. [Google Scholar] [CrossRef]
Figure 1.
Location map of the Alto Iguaçu, Litorânea and Ribeira watersheds, Paraná State, Brazil.

Figure 2.
Location and hypsometric map of meteorological and pluviometric stations in the Alto Iguaçu, Ribeira and Litorânea watersheds, Paraná State, Brazil.
Figure 2.
Location and hypsometric map of meteorological and pluviometric stations in the Alto Iguaçu, Ribeira and Litorânea watersheds, Paraná State, Brazil.

Figure 3.
Dendogram with pluviometric stations and meteorological stations and their homogeneous pluviometric groups for the Litorânea watershed.
Figure 3.
Dendogram with pluviometric stations and meteorological stations and their homogeneous pluviometric groups for the Litorânea watershed.

Figure 4.
Dendogram with pluviometric stations and meteorological stations and their homogeneous pluviometric groups for the Alto Iguaçu watershed.
Figure 4.
Dendogram with pluviometric stations and meteorological stations and their homogeneous pluviometric groups for the Alto Iguaçu watershed.

Figure 5.
Dendogram with pluviometric stations and meteorological stations and their homogeneous pluviometric groups for the Ribeira watershed.
Figure 5.
Dendogram with pluviometric stations and meteorological stations and their homogeneous pluviometric groups for the Ribeira watershed.

Figure 6.
Location of homogeneous groups and anomalous pluviometric stations.

Figure 7.
Average annual rainfall (mm) and average altitude (meters) for the homogeneous groups and anomalous pluviometric stations.
Figure 7.
Average annual rainfall (mm) and average altitude (meters) for the homogeneous groups and anomalous pluviometric stations.

Figure 8.
Average monthly rainfall (mm) for the homogeneous groups (HG) in the Litorânea watershed (W), Paraná, Brazil.
Figure 8.
Average monthly rainfall (mm) for the homogeneous groups (HG) in the Litorânea watershed (W), Paraná, Brazil.

Figure 9.
Average monthly rainfall (mm) for the homogeneous groups (HG) and anomalous pluviometric station (APS) in the Alto Iguaçu watershed (W), Paraná, Brazil.
Figure 9.
Average monthly rainfall (mm) for the homogeneous groups (HG) and anomalous pluviometric station (APS) in the Alto Iguaçu watershed (W), Paraná, Brazil.

Figure 10.
Average monthly rainfall (mm) for the homogeneous groups (HG) and anomalous pluviometric station (APS) in the Ribeira watershed (W), Paraná, Brazil.
Figure 10.
Average monthly rainfall (mm) for the homogeneous groups (HG) and anomalous pluviometric station (APS) in the Ribeira watershed (W), Paraná, Brazil.

© 2017 by the authors. Licensee MDPI, Basel, Switzerland. This article is an open access article distributed under the terms and conditions of the Creative Commons Attribution (CC BY) license (http://creativecommons.org/licenses/by/4.0/).
Share and Cite
MDPI and ACS Style
Terassi, P.M.d.B.; Galvani, E. Identification of Homogeneous Rainfall Regions in the Eastern Watersheds of the State of Paraná, Brazil. Climate 2017, 5, 53. https://0-doi-org.brum.beds.ac.uk/10.3390/cli5030053
AMA Style
Terassi PMdB, Galvani E. Identification of Homogeneous Rainfall Regions in the Eastern Watersheds of the State of Paraná, Brazil. Climate. 2017; 5(3):53. https://0-doi-org.brum.beds.ac.uk/10.3390/cli5030053
Chicago/Turabian StyleTerassi, Paulo Miguel de Bodas, and Emerson Galvani. 2017. "Identification of Homogeneous Rainfall Regions in the Eastern Watersheds of the State of Paraná, Brazil" Climate 5, no. 3: 53. https://0-doi-org.brum.beds.ac.uk/10.3390/cli5030053
Note that from the first issue of 2016, this journal uses article numbers instead of page numbers. See further details here.