Mapping the Potential Global Range of the Brown Marmorated Stink Bug, Halyomorpha halys, with Particular Reference to New Zealand


Environmental and Animal Sciences Practice Pathway, Unitec Institute of Technology, Private Bag 92025, Victoria Street West, Auckland 1142, New Zealand
*
Author to whom correspondence should be addressed.
Climate 2017, 5(3), 75; https://0-doi-org.brum.beds.ac.uk/10.3390/cli5030075
Submission received: 13 July 2017
/
Revised: 25 August 2017
/
Accepted: 13 September 2017
/
Published: 20 September 2017
Abstract
:Originating from Asia, the brown marmorated stink bug (BMSB) is a significant pest of horticultural/agricultural crops, grapes, woody ornamental and herbaceous plants, and is also a nuisance to people, due to its overwintering behavior in human habitation. The global range of this pest is steadily increasing and previous predictions of environmental suitability have shown New Zealand to be highly suitable. Due to the economic value of horticultural and agricultural industries to the New Zealand economy, it is vital to understand the range of potential risk within the country. Global and New Zealand potential suitability for BMSB was modeled using three algorithms and the resulting predictions ensembled to predict the potential range under current climatic conditions and under trajectories of future low (Representative Concentration Pathways, RCP, 2.6) and high (RCP 8.5) greenhouse gas emissions for both 2050 and 2070. Under current conditions, models showed a high global suitability within latitudes 25°–50° N, southern South America, southeast and southwest regions of Australia and large areas of New Zealand. Modeling the effect of climate change on BMSB range in New Zealand resulted in a southerly range shift over time, particularly with high emissions trajectory. Currently, BMSB is not established in New Zealand and it is vital that this remains the case.
Keywords:
brown marmorated stink bug; insect; pest; modeling; range; global; New Zealand; climate change1. Introduction
New Zealand, being an island nation heavily reliant on primary industry productivity, is particularly vulnerable to the impact of invasive species. Currently, New Zealand’s Ministry of Primary Industries (MPI) is on high alert to prevent the entry of Halyomorpha halys or brown marmorated stink bug (BMSB) from entering the country [1]. This arthropod, of approximately 17 mm in length [2], is a native of Japan, Korea, China and Taiwan [3] and is known as a horticultural pest and nuisance to humans in an increasing number of locations around the world. First introduced to Allentown, Pennsylvania in the 1990s [3], it is now found in 43 states in the USA and four Canadian provinces [4]. The origin of the BMSB in the US has been traced to the Beijing area of China [5]. Although older records are available for presence of this arthropod in Lichtenstein in 2004 [6], the BMSB was first officially reported in 2008 from collections in Europe in the Zürich region of Switzerland in 2007 [7]. Subsequently, it has spread within Switzerland, was recorded in Germany in 2012 [8], Strasbourg in France in 2012/2013 [9], northern Italy in 2013 [10] and Hungary in 2014 [11]. Detection of BMSB was recorded in the Dunedin area, New Zealand, in 2010, [12] while reported interceptions by MPI have shown steady increases in the 2014 to 2016 period [13].
As good fliers and generalist feeders on a wide range of plants, such as vegetables, fruit and ornamental plants [14], this species has the potential to easily disperse and establish in novel environments. Despite this high association with plant material, it is suggested that entry to New Zealand is less likely on fruit and nursery stock, due to the high health standards applied to imported goods [14]. Entry to New Zealand is, however, more likely due to the species overwintering behavior where it infiltrates personal or commercial items such as luggage, freight and loaded containers [14].
Known as a destructive pest of various fruits, particularly apple trees, and soybean crops in its native range [15], the brown marmorated stink bug has proven to be an increasingly significant pest of a range of orchard crops, agricultural crops such as soybeans and sweet corn, grapes and ornamental plants [16,17]. Damage is varied but may include scarring, depressions and internal tissue damage, premature flower drop, reduction in field corn kernel size and color change, “stay green” syndrome in soybeans and early fruiting body drop, resulting in low yield in vegetable and fruit crops, and potential tainting of grape juice [16]. This damage can result in significant economic loss, as reported in the 2010 apple crops in the mid-Atlantic regions of the US, which was estimated at approximately $37 million [18], and product losses exceeding 90% in some stone fruit crops [19]. The range of plant host species, including woody and herbaceous plants, appears to be steadily increasing [20], with stippling and scabbing leaf damage from foliage feeding by the arthropod [3] to profuse sap flow from injury sites due to bark feeding [21]. In addition to fruit and crop damage, BMSB is also known to be a nuisance to people, due to its overwintering behavior [22]. The bug tends to swarm together during winter in human habitation, and produces of an unpleasant odor if crushed [22,23,24].
Ecological Niche Modeling (ENM) has been used to determine potential range distribution of invasive species in new environments [25,26,27]. These predictions provide valuable information for the protection of novel environments and the prevention and/or reduction of impacts resulting from invasive species. The potential global invasive range of the BMSB has previously been mapped by Zhu et al. [28]. The authors predicted that northern Europe, northeastern North America, Angola, Uruguay, southern Australia and the North Island of New Zealand showed high climate suitability.
Due to the potential severity of the impact of this species both in terms of plant susceptibility, economic loss, a nuisance to human society, and the increase in New Zealand border detection of BMSB, it is important to determine the potential suitable environmental range in New Zealand. This situation is of greater concern under the influence of climate change, whereby the environmental suitable is expected to increase across the country [29,30,31,32]. This study aims to determine the potential global and New Zealand distribution of BMSB under current climatic conditions and future environmental suitability under the influence of two climate change scenarios; low (Representative Concentration Pathways, RCP, 2.6) and high (RCP 8.5) greenhouse gas emissions for both 2050 and 2070. This will highlight the extent of the potential problem, indicate the risk of invasion, and support the management for prevention of entry, as well as its future regional and national management if this destructive species become established in New Zealand.
2. Materials and Methods
Occurrence data for this species in both its native and invasive range was collected using Global Biodiversity Information Facility (http://www.gbif.org/) and the US Department of Agriculture Animal and Plant Health Inspection Services [33]. Occurrence points were checked for redundancy and spatially rarified using the SDMtoolboxv1.1 [34] in ArcMap 10.2. A total of 573 records were downloaded, and after manual checking and SDMToolbox correction for spatial autocorrelation and redundancy, 125 were used for modeling [34]. The deletion of points determined to contribute to spatial autocorrelation was necessary to increase confidence that more robust prediction models result with less inflated performance measures are produced from spatially independent data [35,36,37].
The environmental variables used were derived from the WorldClim Database for current conditions and future climatic scenarios (http://worldclim.org/). The world model was at a resolution of 5 min and the New Zealand projection at 30 s. The future climatic scenarios consisted of the data used in the fifth Intergovernmental Panel on Climate Change (IPCC) assessment report that was based on the representative concentration pathways (RCP 2.6 representing lower emissions and RCP 8.5 representing higher emissions) [38]. Models were run for both emission trajectories for the years 2050 and 2070 to predict environmental suitability. Environmental variables at the occurrence points, determined using the ArcMap tool Extract Multi-values from rasters, were used in the models (Table 1). These consisted of 19 parameters, which were checked for cross correlation using the SDMtoolbox in ArcMap [34]. Only variables that were not cross-correlated at Pearson coefficient of less than or equal to 0.7 were used in the model, and with a variance inflation factor (VIF) of less than 10 [39]. Studies have shown that using simpler models with a smaller number of variables improves projection of species distribution models [25,40,41]. Of the 19 variables, seven (BIO1, BIO2, BIO8, BIO9, BIO12, BIO15, and BIO19) were selected in the final model (Table 1). To check for co-linearity, the VIF of the environmental variables was checked with the r-package “usdm” [42]. VIF values for the non-correlated variables ranged from 3.11 to 7.06 or below commonly used thresholds [42].
Species distribution modeling was run using the R package “dismo” using three high performing algorithms; Random Forest (RF), Support Vector Machine (SVM) and Maxent, using the default values for each algorithm [43,44]. These have been found to be high performance algorithms with occurrence only data [45]. A worldwide distribution model was generated for each of the algorithms and projected to New Zealand for current and future conditions [32,43,44]. Each model was evaluated according to Area Under the Curve (AUC), Kappa and True Skills Statistic (TSS). The AUC, while some problems are reported with its use, is a threshold independent widely employed performance metric that shows the accuracy of the models in correctly predicting presence and absence (values of >0.7 showing good performance) [46,47]. The “Kappa” statistic describes agreement between the observations and predictions, and incorporates the effect of chance on the accuracy of the prediction (values nearing 1.0 showing good performance) [48,49]. The TSS is a commonly used measure that overcomes some of the weaknesses of the Kappa statistics (values near 1.0 indicate good performance) while addressing Kappa’s sensitivity to prevalence [50].
Prediction maps of environmental suitability for each of the models were ensembled, each being weighted using the combined ranked values of AUC, Kappa and TSS [51,52]. Ensembled approaches have the advantage of addressing the individual weaknesses of each modeling approach or deriving results similar to a consensus [51,52]. The ensemble modeling approach has been used to predict the suitability of areas for the Argentine ant in Spain [53], invasive aquatic fishes in United States [54], pine forests in China [55], and forecasting distributions of the Queensland fruit fly in climate change scenarios [32]. The R package “dismo” [56] was used with the built-in Maxent, SVM and RF algorithms to generate prediction maps and derive the final ensembled maps for each climatic scenario. The resulting ensembled predictions, in the form of rasters, were processed for presentation in ArcMap 10.2. The predictive maps were reclassified into low, medium and high categories using equal distribution categories in order to clearly present the differences between current and future suitability and measure the area that changed between periods [43]. Commonly used thresholds to determine presence absence were not utilized because of the reported insensitivity of some thresholds to the lack of absence data as well as the reported variability between different thresholds [57,58]. The centroid of the high category area for each projection was also determined and plotted to show the direction and magnitude of movement or shift of the highly suitable areas [32,43,44]. Territorial boundaries were overlaid on the suitability model to provide information for management purposes.
3. Results
3.1. Occurrence Data
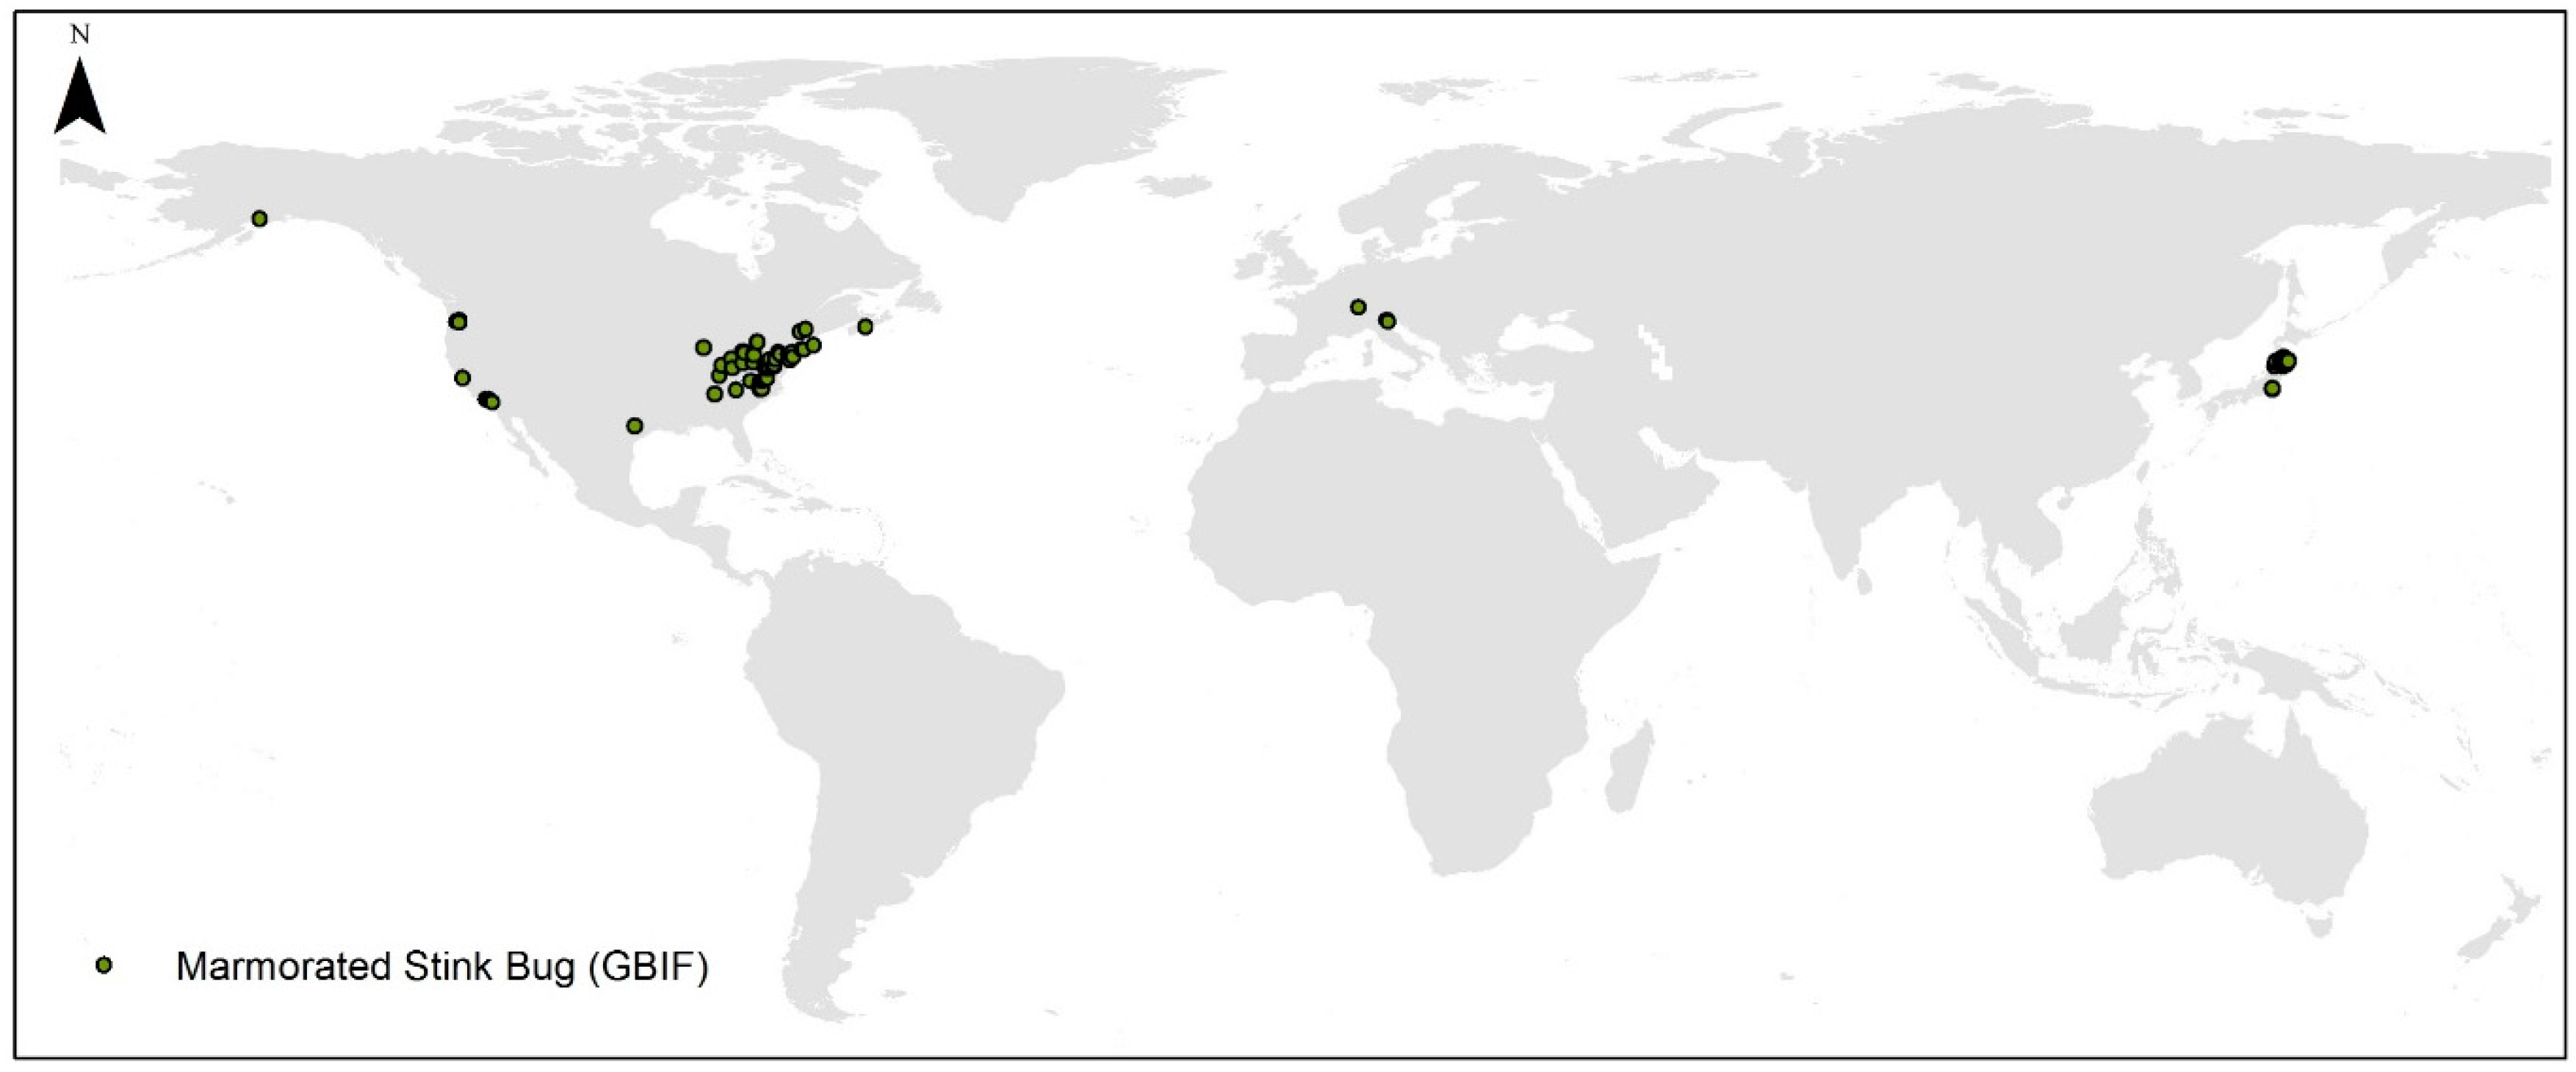
Global spatially rarified occurrence points used in the model consisted of 125 sites, which were mainly located in the Northern Hemisphere (Figure 1).
3.2. Model Evaluation
Model evaluation shows that RF was the highest performer in terms of AUC (Table 2) followed closely by Maxent and SVM. Kappa and TSS is highest for RF followed by SVM. The minor differences shown with AUC reflect similar performance between the algorithms.
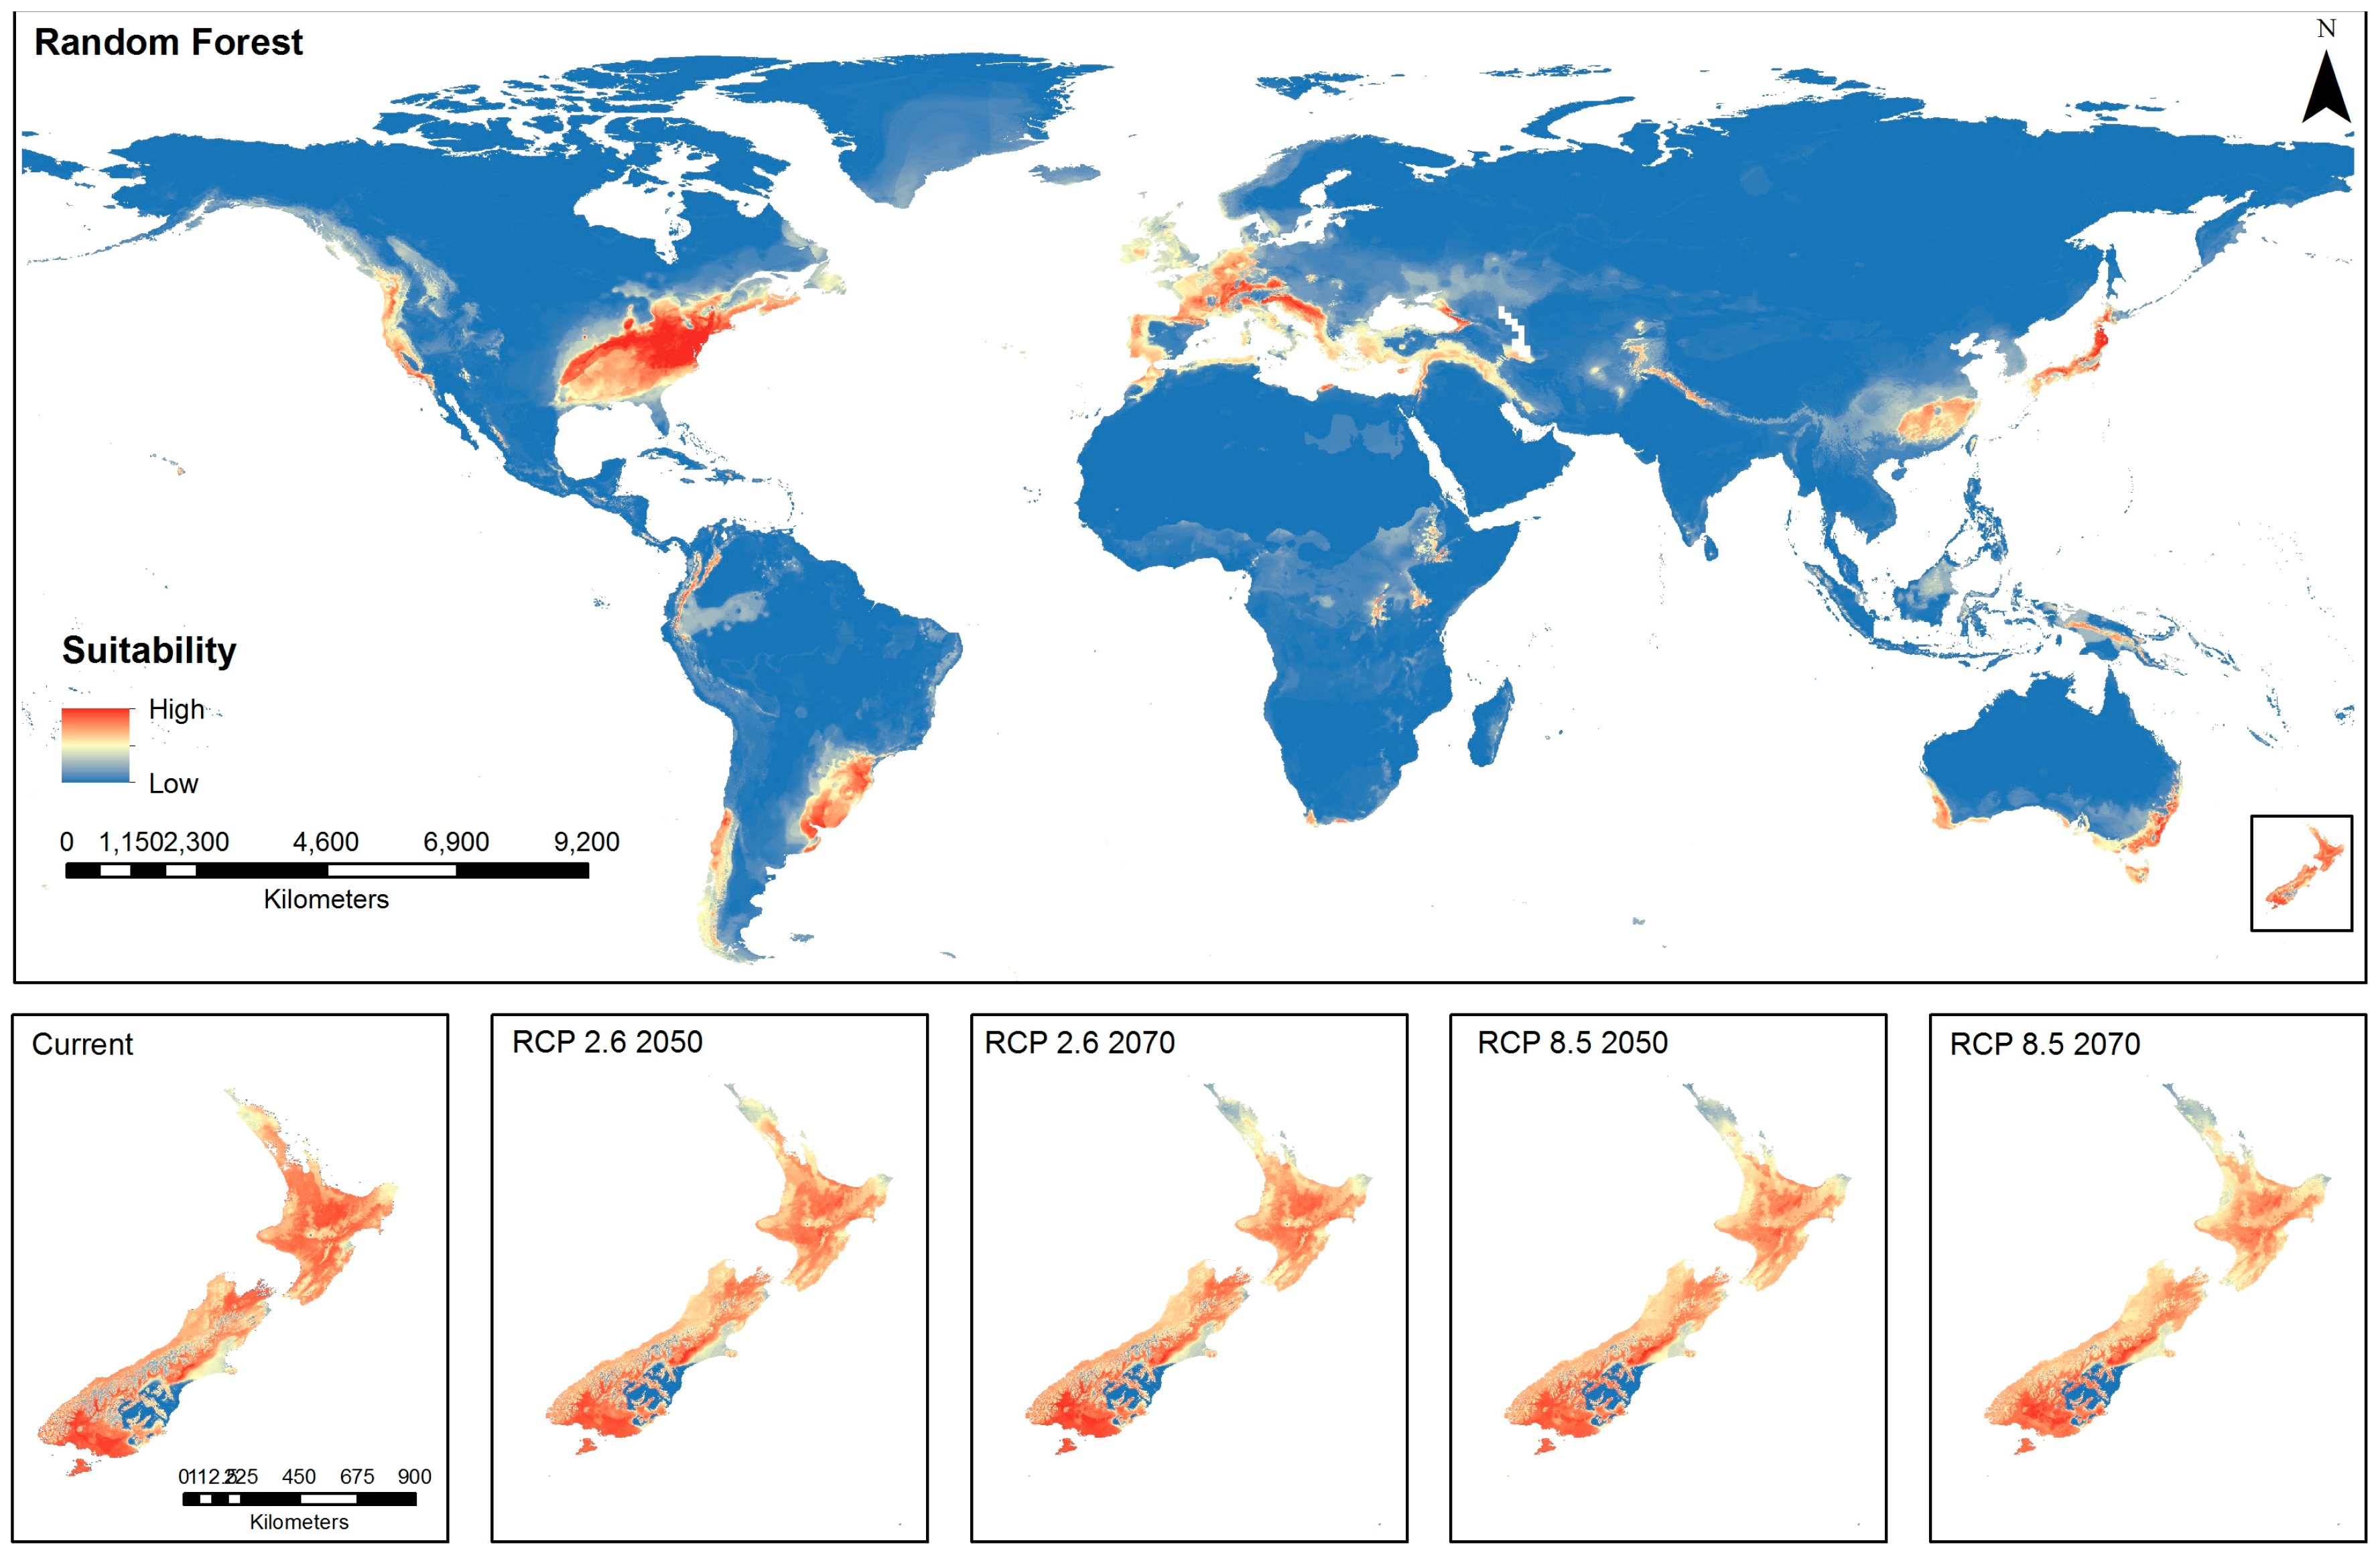
3.3. Spatial Distribution Using Random Forest (RF) Model
The current spatial distribution model using RF (Figure 2) shows high environmental suitability in the eastern states and West Coast USA, coastal regions of southern South America, Western Europe, Japan and eastern China, the southeast and southwest coasts of Australia and considerable parts of New Zealand. The New Zealand distribution under current environmental conditions shows moderate to high environmental suitability for BMSB across the majority of New Zealand, particularly North Island, Nelson/Marlborough, coastal Canterbury and Southland regions (Figure 2). Due to the widespread environmental suitability under current conditions, there appears to be little change under predictions for low emissions trajectory for 2050. However, there is an indication of reduced environmental suitability at the top of North Island and an apparent reduced intensity of suitability over the whole of North Island associated with low emissions trajectories for 2070 and high emissions trajectories for both 2050 and 2070 (Figure 2).
3.4. Spatial Distribution Using Support Vector Machine (SVM) Model
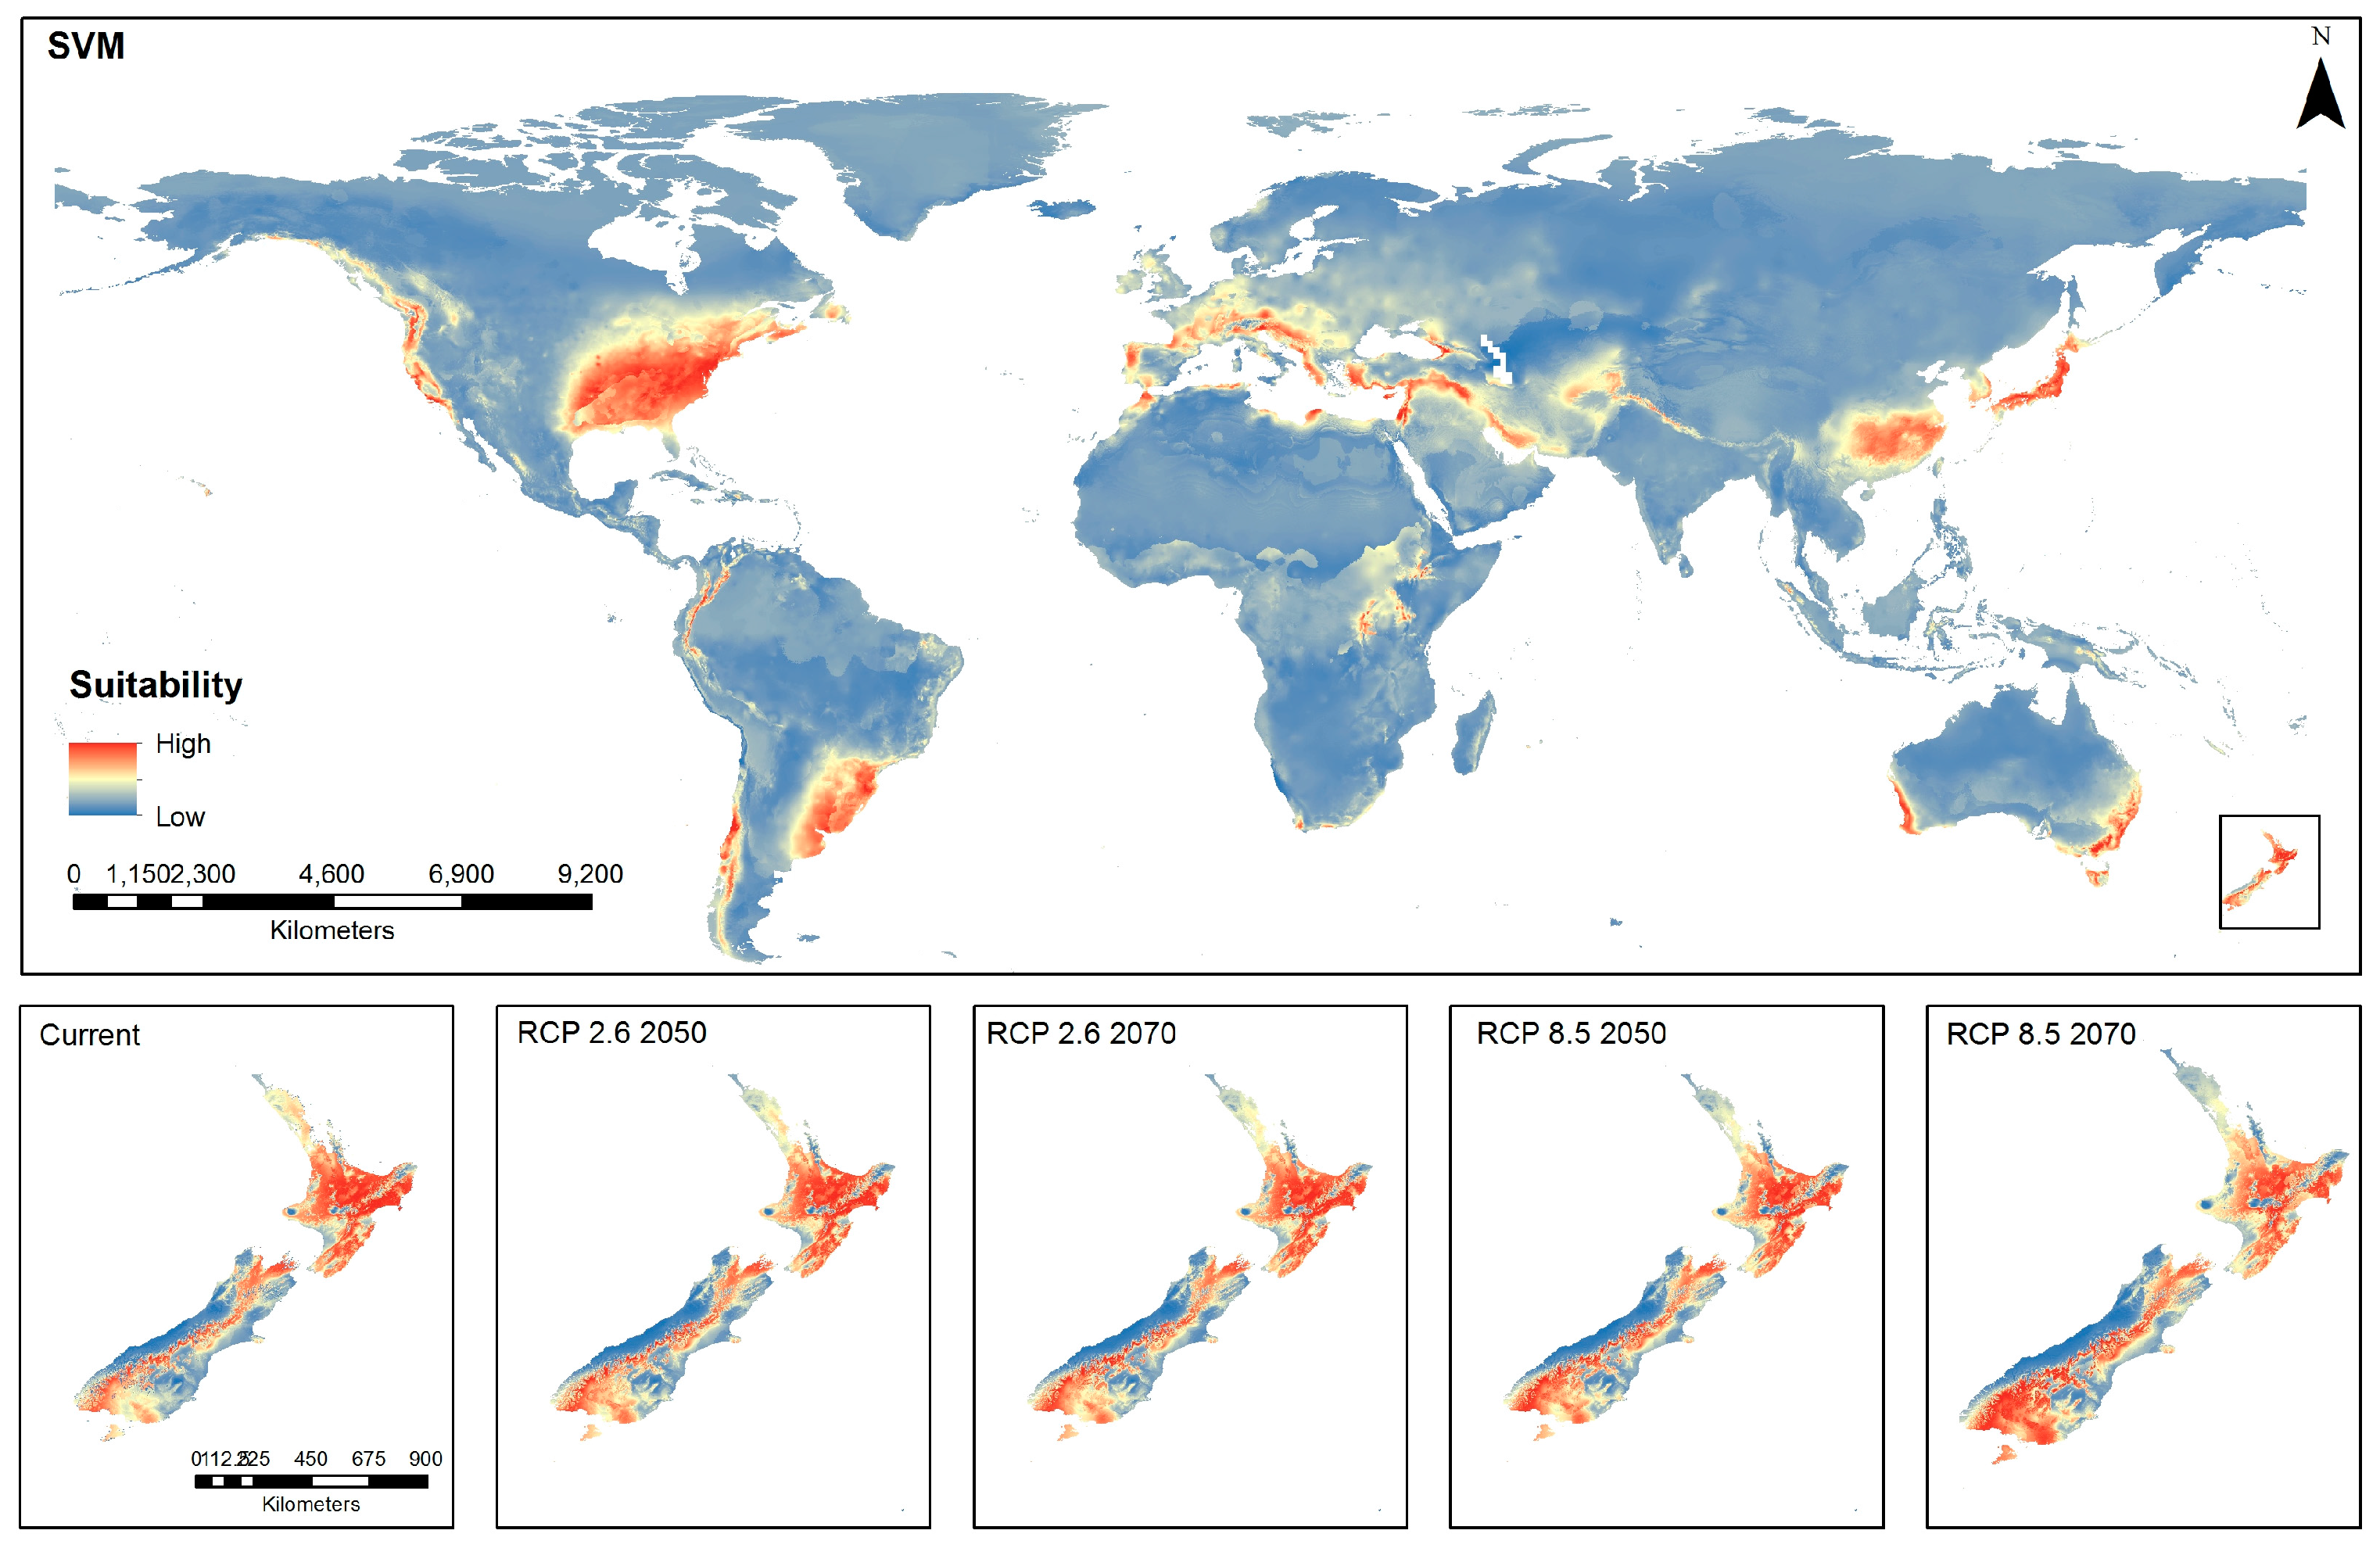
The spatial distribution model using SVM for the current global distribution (Figure 3) shows similar areas of high suitability as those shown by the RF model (Figure 2), although there appears to be the presence of a diffuse pattern of moderate suitability across much of the globe with this SVM model. In New Zealand, under current conditions, high environmental suitability for BMSB is shown over a considerable proportion of North Island and a band running down the center of South Island. Projections for low and high emissions appear to show a reduction in suitability of the top of North Island and an intensification and increase in suitability in South Island over time (Figure 3).
3.5. Spatial Distribution Using Maxent Model
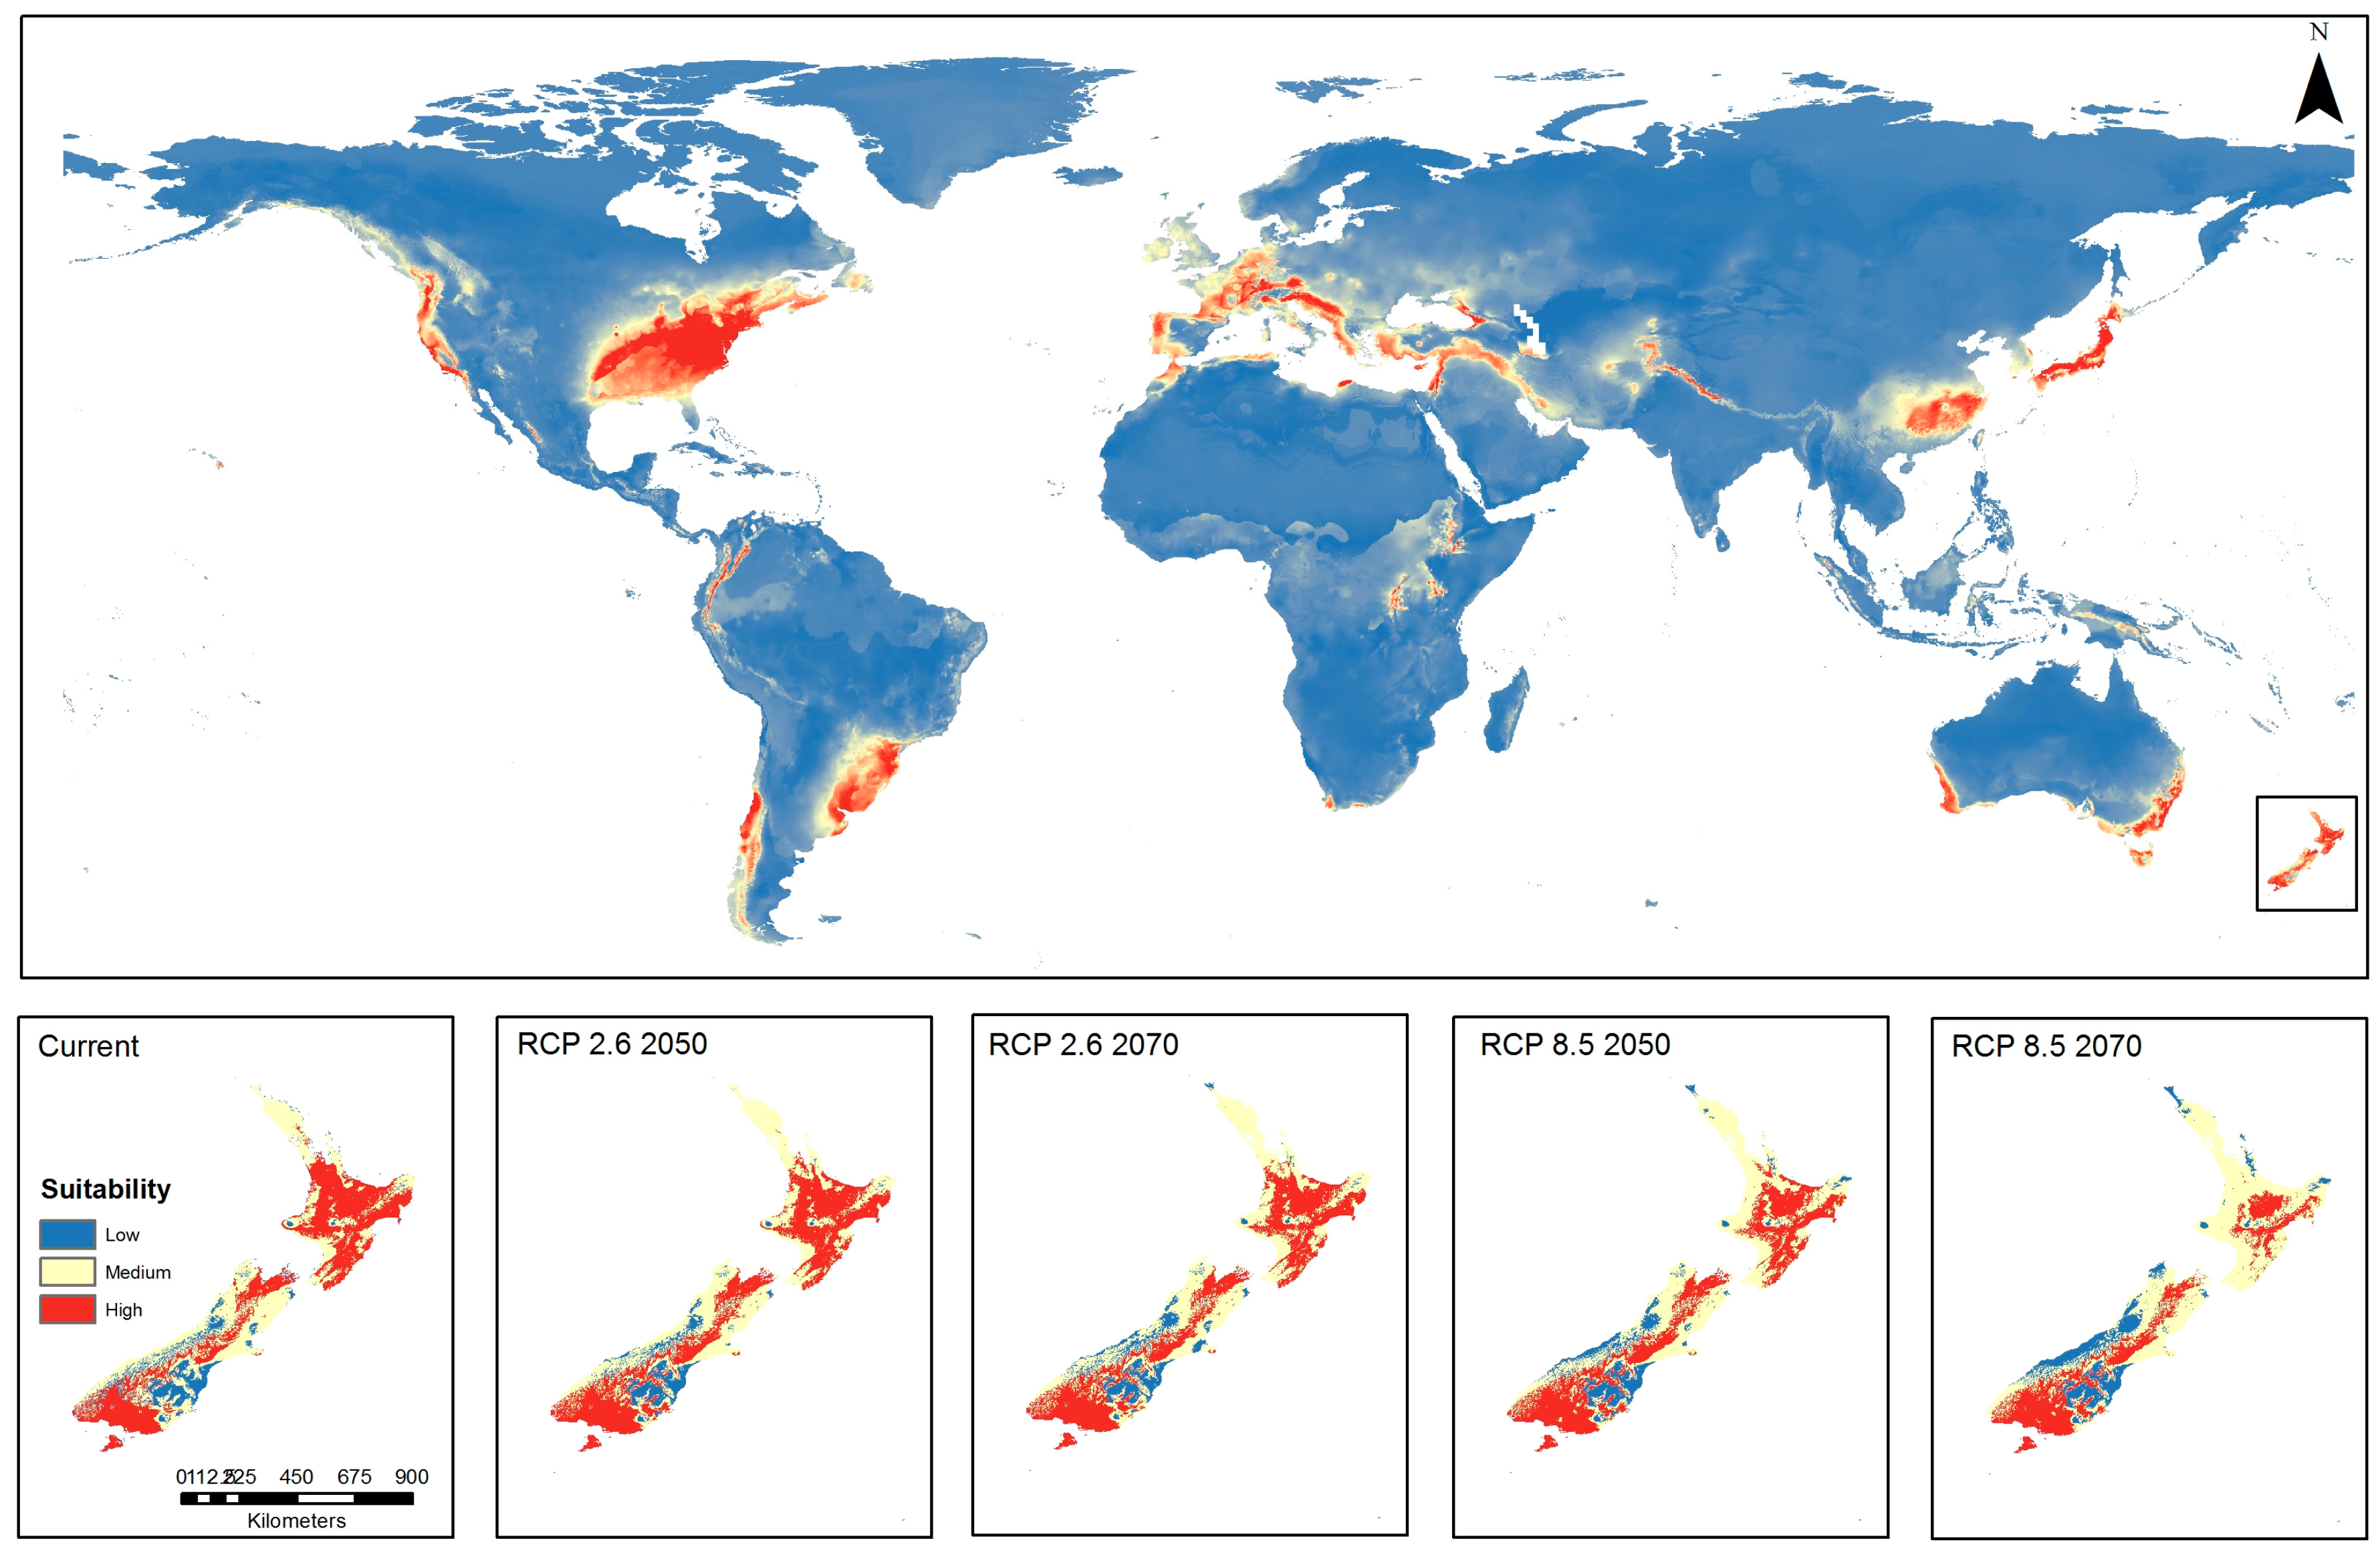
The spatial distribution model using Maxent for current global distribution (Figure 4) shows similar regional distribution of high suitability but a reduced global range of suitability compared with the RF and SVM models (Figure 2 and Figure 3). Similarly, with New Zealand, this model under current conditions appears to show marked reduction on environmental suitability with only areas in South Island showing high suitability compared with the other two models (Figure 4). Addition of climate change projections appear to reduce environmental suitability in North Island and increase suitability in South Island, particularly Southland, with increasing emissions projection and time (Figure 4).
3.6. Ensemble Prediction
The results of models were combined to produce an ensemble model (Figure 5), which was weighted by the AUC, Kappa and TSS (Table 2). In terms of current global suitability, predominance of high suitability is shown across the globe in a latitude range of approximately 25–50° N, east and west coasts of both southern South America and Australia, and large parts of both the North and South Islands of New Zealand. Under current climate conditions, most of the North Island appears to be highly suitable for BMSB, while the Nelson/Marlborough, Canterbury and southwest regions of the South Island show high suitability. It appears from the combined models that the suitability in North Island reduces from high to predominately moderate, while suitability increases in South Island under low and high emissions trajectory for both 2050 and 2070 (Figure 5). It appears that the impacts of climate change over time will result in an overall shift of suitable environment in a southerly direction across New Zealand.
3.7. Centroid Shift of Environmental Suitability for BMSB in New Zealand as Determined Using the Ensemble Model
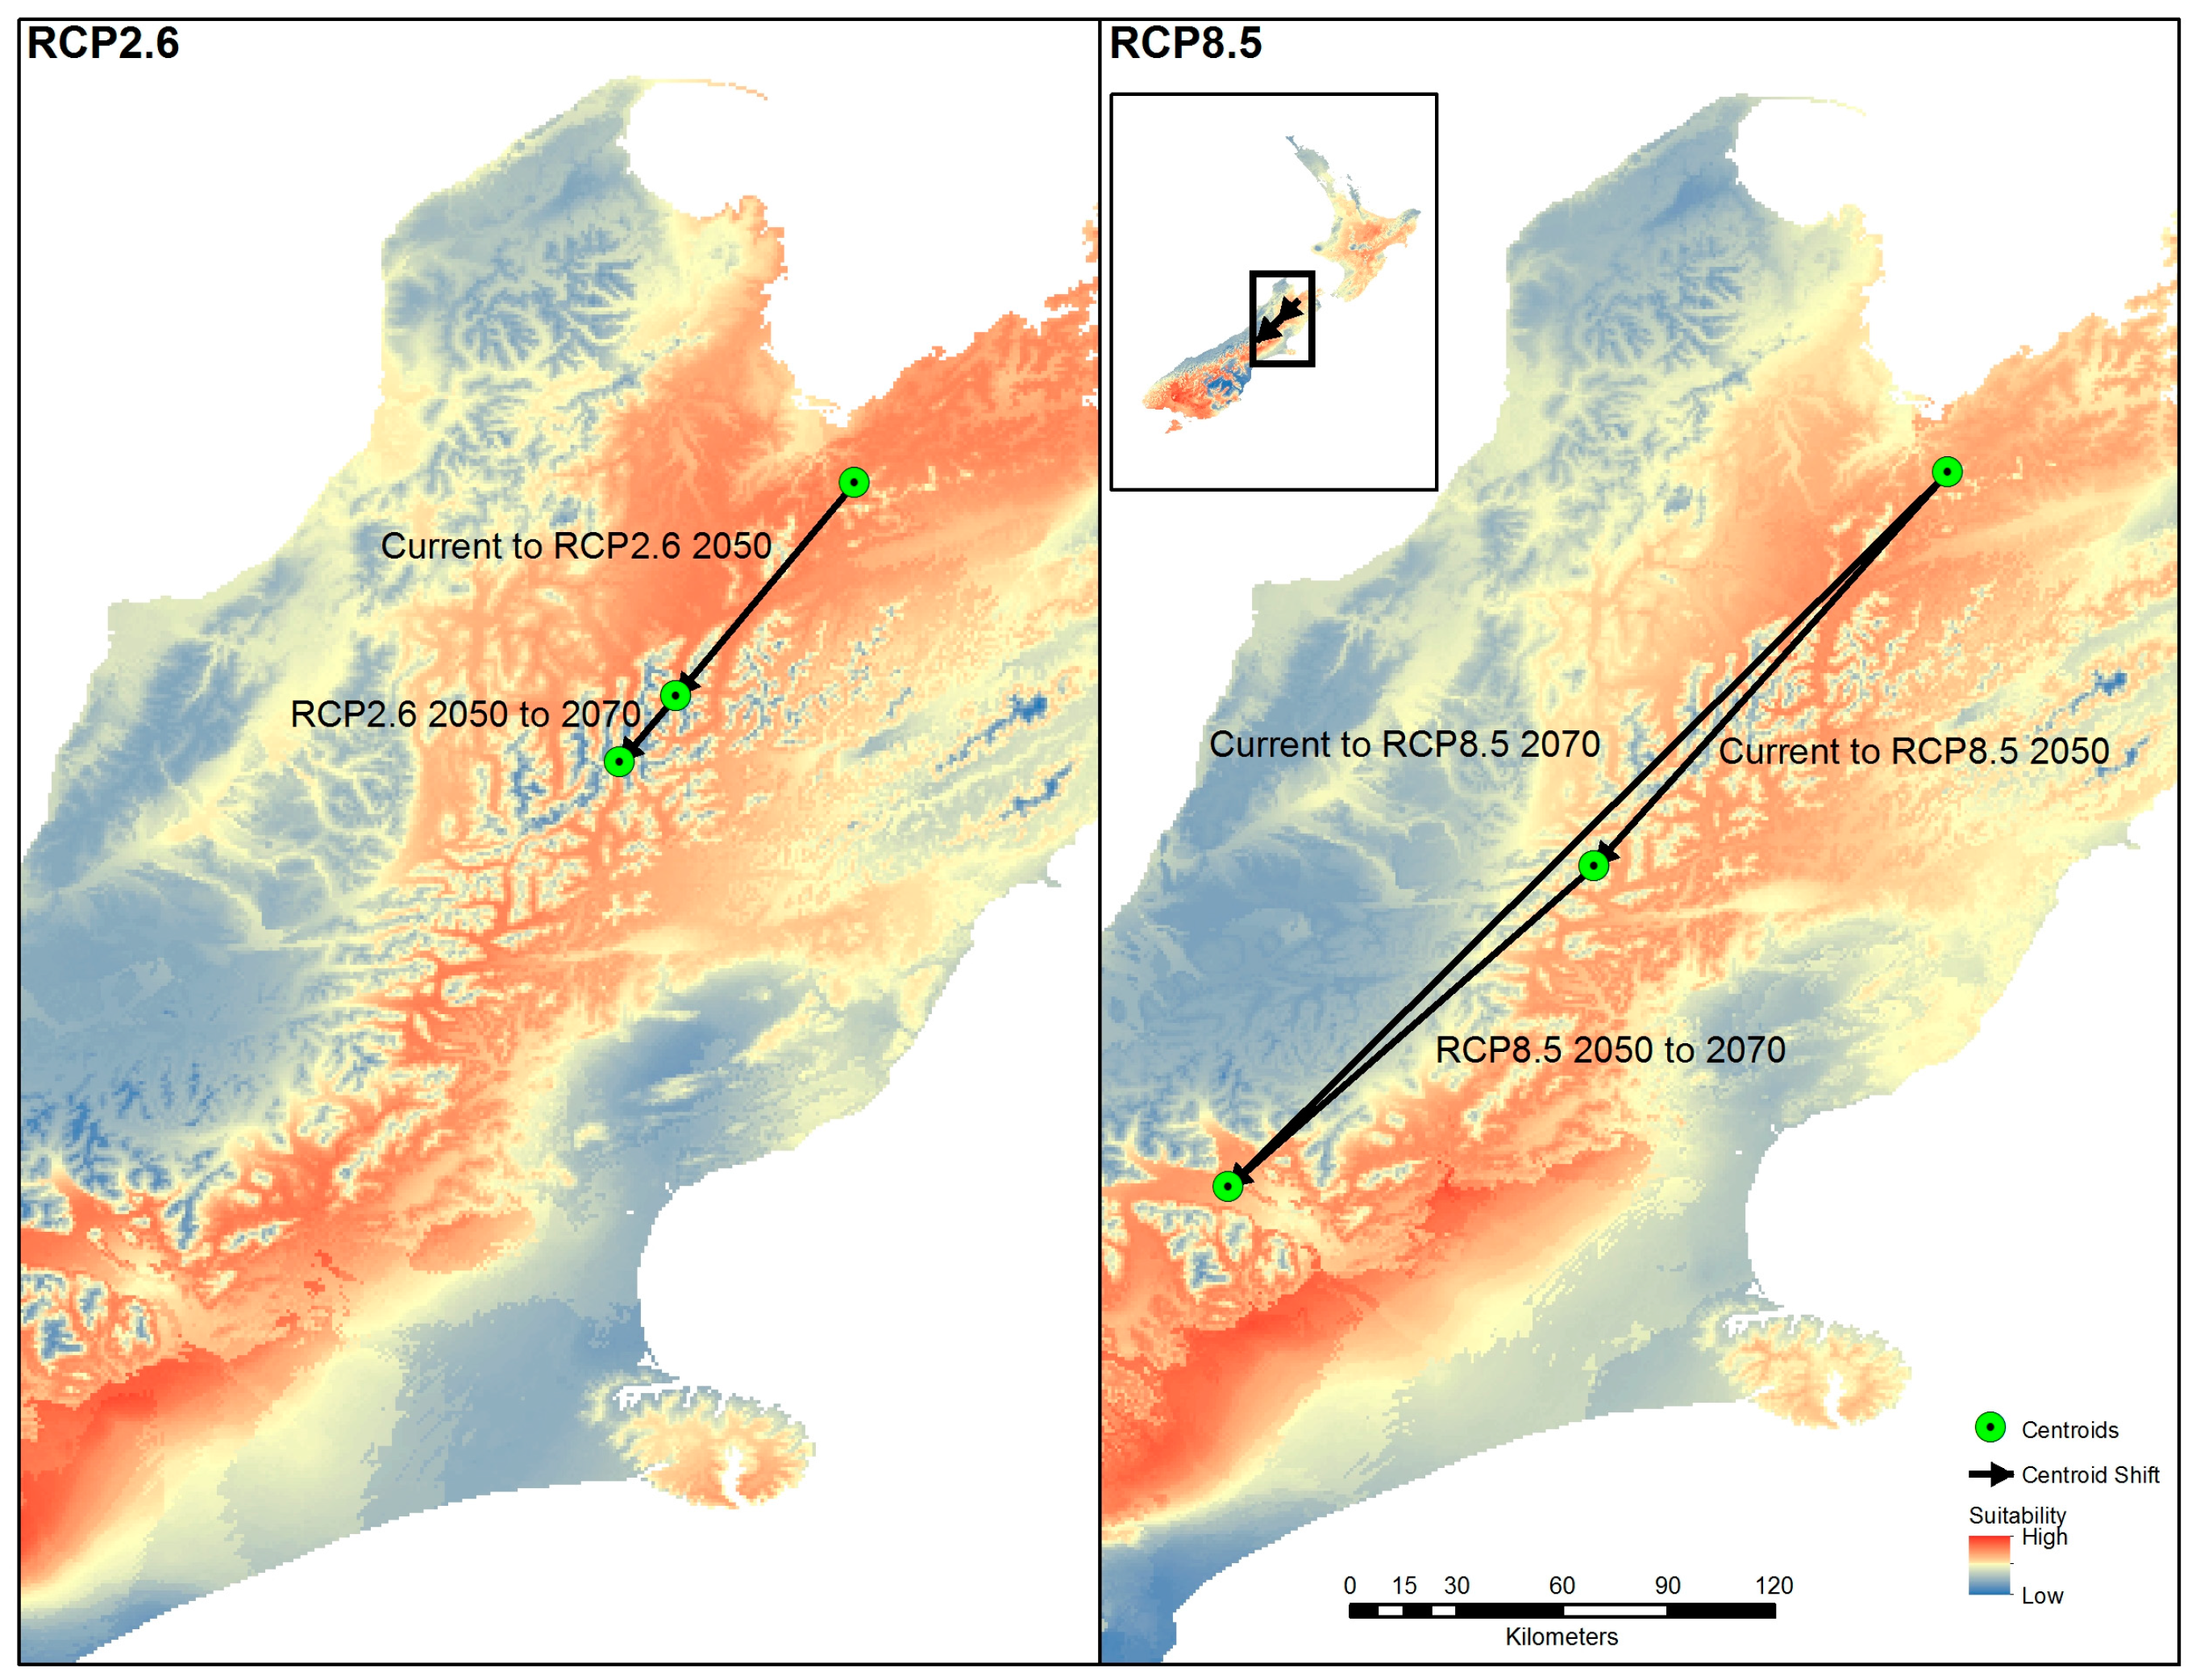
When the high suitability category centroid was determined for all projections, there is an distinct movement to the south for all trajectories for 2050 and 2070 (Figure 6). The higher scenario RCP 8.5 showed greater magnitude of movement for the high suitability category compared to RCP 2.6. The rate of movement was estimated at 1.03 km/year for RCP 2.6 and 5.9 km/year for RCP 8.5 when measured for 2050 and 2070.
3.8. Ensembled Model Prediction Map Combined with New Zealand Official Territories
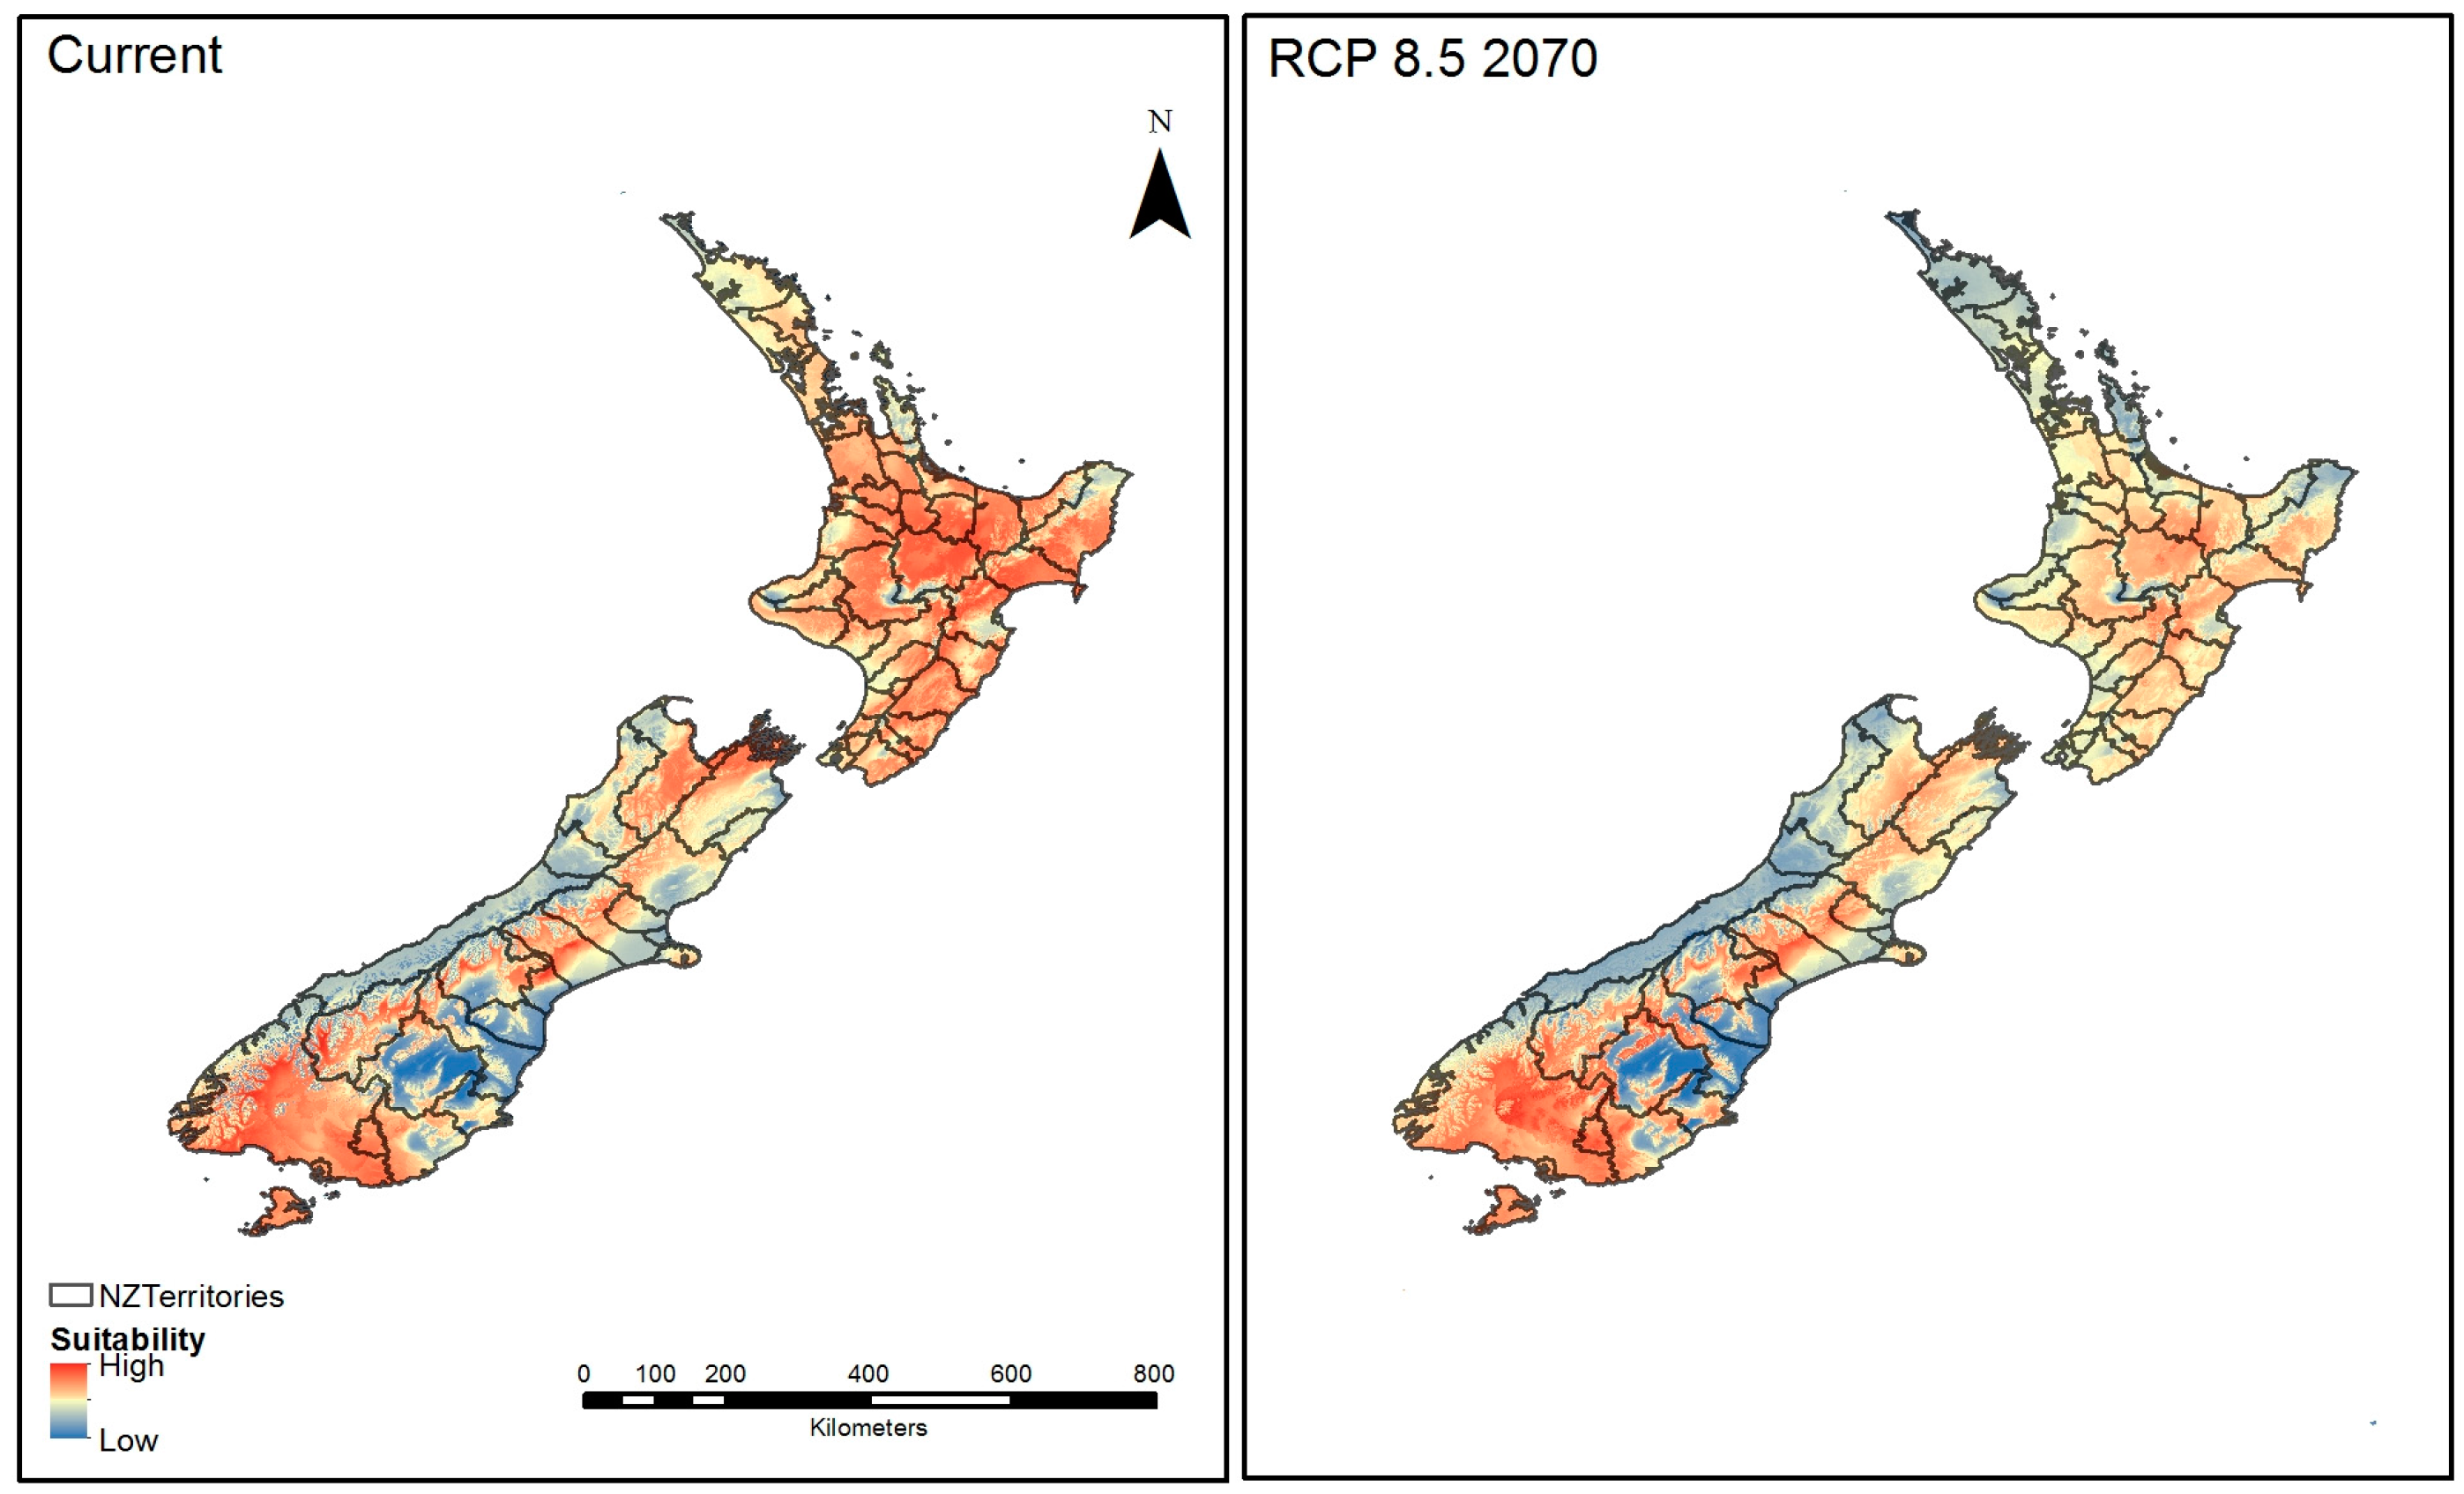
When the ensembled predictive maps were combined with the New Zealand official territories under current conditions, they show high suitability across most of North Island territories except the upper Northland region and the Nelson/Marlbourgh, Canterbury and Southlanbd regions of South Island (Figure 7, left). Under conditions of high emissions output projected for 2070, suitable environmental range shows a southward shift in both the North and South Islands (Figure 7, right). The suitability in the Northland and Auckland regions under these conditions appears to reduce markedly.
4. Discussion
Modeling techniques have frequently been used to determine the spread of invasive insects under current environmental conditions [59,60] and under the influence of climate change [32,61,62]. The current study has shown that the use of modeling techniques, particularly combined methods, allows the prediction of potential current and future environmental suitability for an invasive insect, BMSB, in a novel environment, i.e., New Zealand. The process of checking of occurrence data, cross correlation, co-linearity and selection of environmental variables, performance evaluation and combining of modeling methods contributes to confidence in the model outputs within this study, particularly the ensembled model.
The results of this study support the findings of Zhu et al. [28], who modeled the potential global distribution of BMSB. These authors predicted high global environmental suitability between the latitudes of 30–50° N, which is a close match to the predictions from the ensembled model in this study (Figure 5), indicating high global suitability within latitudes 25–50° N. Both studies predict areas of suitability in southern latitudes, including southern South America, southeast and southwest regions of Australia, and large areas of New Zealand. The potential suitability, and hence, vulnerability of New Zealand to this arthropod as indicated by Zhu et al. [28], is confirmed by the current study in the prediction of current suitability using RF, SVM, Maxent and ensembled models (Figure 2, Figure 3, Figure 4 and Figure 5).
Under current climatic conditions, the models show a moderate to high general suitability for BMSB across most of the North Island and considerable areas of the South Island of New Zealand (Figure 2, Figure 3, Figure 4 and Figure 5). Horticultural, orchard and viticulture production is predominant in the Auckland, Bay of Plenty, and Hawke’s Bay regions in the North Island [63], all of which show moderate to high suitability for BMSB. The high producing areas of the Nelson/Marlborough and Canterbury regions of the South Island predominantly show moderate to high suitability under current climate conditions. However, future climate change predictions result in a general southerly movement of suitability for BMSB across the country (Figure 2, Figure 3, Figure 4, Figure 5, Figure 6 and Figure 7), increasing the likelihood of establishment of this pest and significant impact in the future. The magnitude of shift is dependent on the emission trajectory with a higher magnitude for the higher emission trajectory. This shift in range of suitable environment is not unexpected, as species range shift has been shown to reflect predictions of climate change [29,30,32,64].
The potential negative impact of this arthropod to New Zealand’s economic export earnings from fruits, vegetables, wine and seed is significant. The current export value of horticultural products (kiwifruit, wine, apples and pears, fresh and processed vegetables, other horticultural products and grains and seeds) totaled NZ$5187 million in the year ending 30 June 2016 [65]. Even with conservative production losses, the severe potential economic and social impact of this organism to New Zealand is obvious. The BMSB is known to utilize a range of woody ornamental and herbaceous species [17,20] and, as such, has the potential for significant impact in the garden trade industries.
Having focused on the economic impacts of this pest, the social impacts must also be addressed. Not only will crop damage and increased pest control cost reduce profitability for producers, this arthropod is also known as a nuisance to humans, due to its overwintering behavior in cool dry refuges in human habitation, such as wall cavities, attics and garages, and its production of a characteristic unpleasant odor when crushed [17,22]. Establishment of the BMSB in New Zealand will result in both economic and social impacts.
To successfully establish and spread in a novel environment, invasive species must overcome several abiotic and biotic barriers [66,67]. In particular, climate/environmental matching has been an important predictor of invasive insect range expansion [31,32]. Examination of the climate/environmental suitability, recorded invasion success, biological characteristics, and the impacts demonstrated by this species indicates that there is a high likelihood of establishment of the BMSB in New Zealand. Entry of BMSB to New Zealand, as predicted by Landcare Research [14], is most likely via unintentional transport in personal or commercial baggage, freight and loaded containers. Air and seaports, particularly with the current increase in visitor and immigrant numbers [68] and trade statistics [69], are, therefore, the most likely point of entry to New Zealand. Due to the characteristics of this species, such as being multivoltine (4–6 generations in southern China, 1–2 in the USA) [16], good fliers, generalist feeders [14], wide temperature tolerance (Figure 1) and the climatic suitability shown in this study, the entry at air- and seaports and the establishment of this species in New Zealand is highly likely. Furthermore, its predominant association with urban environments during establishment in new areas and likely spread by road and rail [70] support the probable ease of invasion of this species in New Zealand. As such, it can be confidently predicted that the BMSB is a significant risk to New Zealand horticultural production and as a nuisance to humans.
MPI reported that BMSB interception events in the summers of 2014/2015 and 2015/2016 were similar, but increased in winter in the 2015/2016 period [13]. If these reported interception rates are calculated on an annual calendar year basis (January–December), the rates were 17 in 2014 and 65 in 2015, an increase of approximately 280%. This increase in detection may have been due to increased awareness of the threat of this organism and, therefore, increased detection effort. However, it has been reported that border interception in the summer of 2016/2017 was more than 500 incidents [71], which is significantly above detection rates in previous periods. In addition, two post-border identifications demonstrate that the arthropod is escaping border control measures [71]. The resulting prediction clearly indicates that the risk of establishment of BMSB in New Zealand is increasingly alarmingly, with subsequent significant concern for the economic impacts on New Zealand agricultural and horticultural industries and potential nation-wide social impacts.
It is known that the likelihood of establishment and rate of spread of an invasive species relates to propagule pressure (propagule number and propagule size) [67,72,73,74]. Therefore, the increase in interceptions reported by MPI suggests an increased likelihood of border slippage and establishment. MPI also reported a change in origin of the interceptions with a reduction in those originating from the USA (−53%) and an increase in interceptions from Europe (+900%) and Asia (40%) in the 2014/2015 and 2015/2016 periods [13]. An increase in propagule pressure, in both numbers and range of origins is likely to increase the success of establishment [72] and, therefore, increases the risk of invasion to New Zealand.
The transfer of BMSB to New Zealand native plant species is unknown. However, with evidence of an ever-increasing host species plant list [20] there is potential significant concern for the possibility that BMSB may transfer to New Zealand native woody and herbaceous plant species with unknown future impacts. If this is the case, particularly under future climate predictions, native New Zealand species may be at risk.
This modeling exercise has provided information on the environmental suitability of New Zealand under current and future projected environmental conditions. As such, it provides both national and regional authorities an indication as to the severity and impact that could be expected in their respective areas (Figure 7). This will be an important factor in the consideration of spread and management should this arthropod become established in New Zealand. This modeling exercise was focused on the effects of climate change in the New Zealand situation. However, it is realized that other important environmental variables, such as vegetation, needs to be addressed in future studies.
It is evident that New Zealand is highly susceptible to the establishment of the BMSB and, with current knowledge of its invasive impact, is extremely likely to cause significant damage to a range of productions crops, ornamental woody and herbaceous plants and potentially native species, as well as resulting in significant social impact. Due to increasing interception rates and probable border leakage, MPI is implementing significant pre-border and border strategies to minimize the risk of invasion by this species [75]. However, it may be inevitable that this arthropod pest becomes established in New Zealand. The battle continues.
Acknowledgments
Funding to publish this work in open access was provided by the Research and Enterprise Office, Unitec. No other funding was received for this project.
Author Contributions
Diane Fraser conceived the project; Glenn Aguilar designed the modeling; Shivani Kumar and Glenn Aguilar conducted the modeling; and Diane Fraser and Glenn Aguilar interpreted the results and wrote the paper.
Conflicts of Interest
The authors declare no conflict of interest.
References
- Ministry of Primary Industries (MPI). Protection and Response: Brown Marmorated Stink Bug. 2017. Available online: https://www.mpi.govt.nz/protection-and-response/responding/alerts/brown-marmorated-stink-bug/ (accessed on 6 March 2017).
- The Pennsylvanian State University. PennState College of Agriculture Insect Advice from Extension: Brown Marmorated Stink Bug, Halyomorpha halys. 2017. Available online: http://ento.psu.edu/extension/factsheets/brown-marmorated-stink-bug (accessed on 19 September 2017).
- Hoebeke, E.R.; Carter, M.E. Halyomorpha halys (Stål) (Heteroptera: Pentatomidea): A polyphagous plant pest from Asia newly detected in North America. Proc. Entomol. Soc. Wash. 2003, 105, 225–237. [Google Scholar]
- Northern Invasive Pest Management Center. Where is BMSB? State-By-State. 2017. Available online: http://www.stopbmsb.org/where-is-bmsb/ (accessed on 27 March 2017).
- Xu, J.; Fonseca, D.M.; Hamilton, G.C.; Hoelmer, K.A.; Nielsen, A.L. Tracing the origin of US brown marmorated stink bugs. Halyomorpha halys. Biol. Invasions 2014, 16, 153–166. [Google Scholar] [CrossRef]
- Arnold, K. Halyomorpha halys (Stål, 1855) a stink bug species newly detected among the European fauna (Insecta: Heteroptera, Pentatomidae, Pentatominae, cappaeini). Mitteilungen Thuringer Entomol. 2009, 16, 19. [Google Scholar]
- Wermelinger, B.; Wyniger, D.; Forster, B. First records of an invasive bug in Europe: Halyomorpha halys (Heteroptera: Pentatomidae), a new pest on woody ornamentals and fruit trees? Mitteilungen Schweizerischen Entomol. Gesellschaft 2008, 81, 1–8. [Google Scholar]
- Heckmann, R. First evidence of Halyomorpha halys (Stål, 1855) (Heteroptera: Pentatomidae) in Germany. Heteropteron H 2012, 36, 17–18. [Google Scholar]
- Callot, H.; Brua, C. Halyomorpha halys (Stål, 1855), the marmorated stink bug, new species for the fauna of France (Heteroptera: Pentatomidae). LÕEntomologiste 2013, 69, 69–71. [Google Scholar]
- Pansa, M.G.; Asteggiano, L.; Costamagna, C.; Vittone, G.; Tavella, L. First discovery of Halyomorpha halys in peach orchards in Piedmont. (Primo ritrovamento di Halyomorpha halys nei pescheti piemontesi.). Informatore Agrario 2013, 69, 60–61. [Google Scholar]
- Vétek, G.; Papp, V.; Haltrich, A.; Rédei, D. First record of the brown marmorated stink bug, Halyomorpha halys (Hemiptera: Heteroptera: Pentatomidae), in Hungary, with description of the genitalia of both sexes. Zootaxa 2014, 3780, 194–200. [Google Scholar] [CrossRef] [PubMed]
- Harris, A.C. Halyomorpha halys (Hemiptera: Pentomidae) and Protaetia brevitaris (Coleoptera: Scarabaeidae: Cetoniinae) intercepted in Dunedin. Weta 2010, 40, 42–44. [Google Scholar]
- Kiwi Fruit Vine Health (KVH). Brown Marmorated Stink Bug—KVH Activity Update, March 2016. Available online: http://www.kvh.org.nz/vdb/document/102656 (accessed on 29 March 2017).
- Landcare Research. Brown Marmorated Stink Bug—Halyomorpha halys (Stål, 1855). 2017. Available online: https://www.landcareresearch.co.nz/resources/identification/animals/pentatomidae/factsheets/halyomorpha-halys (accessed on 15 August 2017).
- Funayama, K. Importance of apple fruits as food for the brown marmorated stink bug, Halyomorpha halys (Stål) (Heteroptera: Pentatomidae). Appl. Entomol. Zool. 2004, 39, 617–623. [Google Scholar] [CrossRef]
- Rice, K.B.; Bergh, C.J.; Bergmann, E.J.; Biddinger, D.J.; Dieckhoff, C.; Dively, G.; Fraser, H.; Gariepy, T.; Hamilton, G.; Haye, T.; et al. Biology, ecology, and management of brown marmorated stink bug (Hemiptera: Pentatomidae). J. Integr. Pest Manag. 2014, 5, A1–A13. [Google Scholar] [CrossRef]
- Leskey, T.C.; Hamilton, G.C.; Nielsen, A.L.; Olk, D.F.; Rodriguez-Saona, C.; Bergh, J.C.; Herbert, D.A.; Kuhar, T.P.; Pfeiffer, D.; Dively, G.P.; et al. Pest status of the brown marmorated stink bug, Halyomorpha halys in the USA. Outlooks Pest Manag. 2012, 23, 218–226. [Google Scholar] [CrossRef]
- Minnesota Department of Agriculture. Brown Marmorated Stink Bug. 2017. Available online: https://www.mda.state.mn.us/plants/insects/stinkbug.aspx (accessed on 3 April 2017).
- Leskey, T.; Hamilton, G.C. Brown Marmorated Stink Bug Working Group Meeting. 2010. Available online: https://projects.ipmcenters.org/Northeastern/FundedProjects/ReportFiles/Pship2010/Pship2010-Leskey-ProgressReport-237195-Meeting-2010_11_17.pdf (accessed on 4 April 2017).
- Bergmann, E.; Bernhard, K.M.; Bernon, G.; Bickerton, M.; Gill, S.; Gonzales, C.; Hamilton, G.C.; Hedstrom, C.; Kamminga, K.; Koplinka-Loehr, C.; et al. Host Plants of the Brown Marmorated Stink Bug in the U.S. 2016. Available online: http://www.stopbmsb.org/where-is-bmsb/host-plants/ (accessed on 3 April 2017).
- Martinson, H.M.; Raupp, M.J.; Shrewsbury, P.M. Invasive stink bug wounds trees, liberates sugars, and facilitates native Hymenoptera. Ann. Entomol. Soc. Am. 2013, 106, 47–52. [Google Scholar] [CrossRef]
- Inkley, D.B. Characteristics of home invasion by the brown marmorated stink bug (Hemiptera: Pentatomidae). J. Entomol. Sci. 2012, 47, 125–130. [Google Scholar] [CrossRef]
- United States Environmental Protection Agency. Brown Marmorated Stink Bug. 2017. Available online: https://www.epa.gov/safepestcontrol/brown-marmorated-stink-bug#agriculture (accessed on 3 April 2017).
- Penn State University. Insect Advice from Extension: Brown Marmorated Stink Bug. 2017. Available online: http://ento.psu.edu/extension/factsheets/brown-marmorated-stink-bug (accessed on 3 April 2017).
- Peterson, A.T.; Nakazawa, Y. Environmental data sets matter in ecological niche modelling: An example with Solenopsis Invicta and Solenopsis richteri. Glob. Ecol. Biogeogr. 2008, 17, 135–144. [Google Scholar] [CrossRef]
- Kulhanek, S.A.; Leung, B.; Ricciardi, A. Using ecological niche models to predict the abundance and impact of invasive species: Application to the common carp. Ecol. Appl. 2011, 21, 203–213. [Google Scholar] [CrossRef] [PubMed]
- Fraser, D.L.; Aguilar, G.; Nagle, W.; Galbraith, M.; Ryall, C. The house crow (Corvus splendens): A threat to New Zealand? Int. J. Geo-Inf. 2015, 4, 725–740. [Google Scholar] [CrossRef]
- Zhu, G.; Bu, W.; Gao, Y.; Liu, G. Potential geographic distribution of brown marmorated stink bug invasion (Halyomorpha halys). PLoS ONE 2012, 7, e31246. [Google Scholar] [CrossRef] [PubMed]
- Hellmann, J.J.; Byers, J.E.; Bierwagen, B.G.; Dukes, J.S. Five potential consequences of climate change in invasive species. Conserv. Biol. 2008, 22, 534–543. [Google Scholar] [CrossRef] [PubMed]
- Thomas, C.D. Climate, climate change and range boundaries. Divers. Distrib. 2010, 16, 488–495. [Google Scholar] [CrossRef]
- Rochlin, I.; Ninivaggi, D.V.; Hutchinson, M.L.; Farajollahi, A. Climate change and range expansion of the Asian tiger mosquito (Aedes albopictus) in northeastern USA: Implications for public health practitioners. PLoS ONE 2013, 8, e60874. [Google Scholar] [CrossRef] [PubMed]
- Aguilar, G.; Blanchon, D.; Foote, H.; Pollonais, C.; Mosee, A. Queensland Fruit Fly Invasion of New Zealand: Predicting Area Suitability Under Future Climate Change Scenarios; Unitec e-Press Perspectives in Biosecurity Research Series, 2: Auckland, New Zealand, 2015; pp. 1–15. Available online: http://www.unitec.ac.nz/epress/index.php/queensland-fruit-fly-invasion-of-new-zealand-predicting-area-suitability-under-future-climate-change-scenarios/ (accessed on 24 April 2017).
- CERIS. Survey Status of Brown Marmorated Stink Bug—Halyomorpha halys (2016); Center for Environmental and Research Information Systems Purdue University: West Lafayette, IN, USA, 4 April 2016. Available online: http://pest.ceris.purdue.edu/map.php?code=IQAQQKA&year=2016 (accessed on 4 May 2016).
- Brown, J.L. SDMtoolbox: A python-based GIS toolkit for landscape genetic, biogeographic, and species distribution model analyses. Methods Ecol. Evol. 2014, 5, 694–700. [Google Scholar] [CrossRef]
- Syfert, M.M.; Smith, M.J.; Coomes, D. The effects of sampling bias and model complexity on the predictive performance of Maxent species distribution models. PLoS ONE 2013, 8, e55158. [Google Scholar] [CrossRef]
- Boria, R.A.; Olson, L.E.; Goodman, S.M.; Anderson, R.P. Spatial filtering to reduce sampling bias can improve the performance of ecological niche models. Ecol. Model. 2014, 275, 73–77. [Google Scholar] [CrossRef]
- Nazeri, M.; Kumar, L.; Jusoff, K.; Bahaman, A.R. Modelling the potential distribution of sun bear in krau wildlife reserve, Malaysia. Ecol. Inf. 2014, 20, 27–32. [Google Scholar] [CrossRef]
- Carraro, C.; Lanza, A.; Tavoni, M. All You Need to Know about the IPCC 5th Assessment Report. Mitigation of Climate Change. Review of Environment, Energy and Economics-Re3. 2014. Available online: http://www.feem.it/getpage.aspx?id=6312 (accessed on 25 March 2017).
- Dormann, C.F.; Elith, J.; Bacher, S.; Buchmann, C.; Carl, G.; Carré, G.; Münkemüller, T. Collinearity: A review of methods to deal with it and a simulation study evaluating their performance. Ecography 2013, 36, 27–46. [Google Scholar] [CrossRef]
- Peterson, A.T. Ecological niche conservatism: A time-structured review of evidence. J. Biogeogr. 2011, 38, 817–828. [Google Scholar] [CrossRef]
- Rödder, D.; Lötters, S. Niche shift versus niche conservatism? Climatic characteristics of the native and invasive ranges of the Mediterranean house gecko (Hemidactylus turcicus). Glob. Ecol. Biogeogr. 2009, 18, 674–687. [Google Scholar] [CrossRef]
- Naimi, B. usdm: Uncertainty Analysis for Species Distribution Models. R Package Version 1.1-15. 2015. Available online: https://cran.r-project.org/web/packages/usdm/usdm.pdf (accessed on 23 June 2017).
- Aguilar, G.D.; Farnworth, M.J.; Winder, L. Mapping the stray domestic cat (Felis catus) population in New Zealand: Species distribution modelling with a climate change scenario and implications for protected areas. Appl. Geogr. 2015, 63, 146–154. [Google Scholar] [CrossRef]
- Aguilar, G.D.; Blanchon, D.J.; Foote, H.; Pollonais, C.W.; Mosee, A.N. A performance based consensus approach for predicting spatial extent of the Chinese windmill palm (Trachycarpus fortunei) in New Zealand under climate change. Ecol. Inf. 2017, 39, 130–139. [Google Scholar] [CrossRef]
- Duan, R.Y.; Kong, X.Q.; Huang, M.Y.; Fan, W.Y.; Wang, Z.G. The predictive performance and stability of six species distribution models. PLoS ONE 2014, 9, e112764. [Google Scholar] [CrossRef] [PubMed]
- Swets, J.A. Measuring the accuracy of diagnostic systems. Science 1988, 240, 1285–1293. [Google Scholar] [CrossRef] [PubMed]
- Peterson, A.T.; Soberon, J.; Pearson, R.G.; Anderson, R.P.; Martinez-Meyer, E.; Nakamura, M.; Araujo, M.B. Ecological Niches and Geographic Distributions; Princeton University Press: Princeton, NJ, USA, 2011; ISBN 978-0691136882. [Google Scholar]
- Cohen, E.J.M. Conceptual design and feasibility study of navy deep submergence vehicles. Nav. Eng. J. 1968, 80, 875–887. [Google Scholar] [CrossRef]
- Pearson, R.G.; Dawson, T.P.; Liu, C. Modelling species distributions in Britain: A hierarchical integration of climate and land-cover data. Ecography 2004, 27, 285–298. [Google Scholar] [CrossRef]
- Allouche, O.; Tsoar, A.; Kadmon, R. Assessing the accuracy of species distribution models: Prevalence, kappa and the true skill statistics (TSS). J. Appl. Ecol. 2006, 43, 1223–1232. [Google Scholar] [CrossRef]
- Araújo, M.B.; Guisan, A. Five (or so) challenges for species distribution modelling. J. Biogeogr. 2006, 33, 1677–1688. [Google Scholar] [CrossRef]
- Marmion, M.; Parviainen, M.; Luoto, M.; Heikkinen, R.K.; Thuiller, W. Evaluation of consensus methods in predictive species distribution modelling. Divers. Distrib. 2009, 5, 59–69. [Google Scholar] [CrossRef]
- Roura-Pascual, N.; Brotons, L.; Peterson, A.T.; Thuiller, W. Consensual predictions of potential distributional areas for invasive species: A case study of Argentine ants in the Iberian Peninsula. Biol. Invasions 2008, 11, 1017–1031. [Google Scholar] [CrossRef]
- Poulos, H.; Chernoff, B.; Fuller, P.; Butman, D. Ensemble forecasting of potential habitat for three invasive fishes. Aquat. Invasions 2012, 7, 59–72. [Google Scholar] [CrossRef]
- Zhang, L.; Liu, S.; Sun, P.; Wang, T.; Wang, G.; Zhang, X.; Wang, L. Consensus forecasting of species distributions: The effects of niche model performance and niche properties. PLoS ONE 2015, 10, 1–18. [Google Scholar] [CrossRef] [PubMed]
- Hijmans, R.J.; Elith, J. Species Distribution Modeling with R. 2016. Available online: https://cran.r-project.org/web/packages/dismo/vignettes/sdm.pdf (accessed on 25 February 2017).
- Jarnevich, C.S.; Stohlgren, T.J.; Kumar, S.; Morisette, J.T.; Holcombe, T.R. Caveats for correlative species distribution modeling. Ecol. Inf. 2015, 29, 6–15. [Google Scholar] [CrossRef]
- Liu, C.; White, M.; Newell, G. Selecting thresholds for the prediction of species occurrence with presence-only data. J. Biogeogr. 2013, 40, 778–789. [Google Scholar] [CrossRef]
- Muirhead, J.R.; Leug, B.; van Overdyk, C.; Kelly, D.W.; Nanda Kumar, K.; Marchant, K.R.; MacIsaac, H.J. Modelling local and long-distance dispersal of invasive emerald ash borer Agrilus planipennis (Coleoptera) in North America. Divers. Distrib. 2006, 12, 71–79. [Google Scholar] [CrossRef]
- Hartley, S.; Krushelnycky, P.D.; Lester, P.J. Integrated physiology, population dynamics and climate to make multi-scale predictions for the spread of an invasive insect: The Argentine ant at Haleakala National Park, Hawaii. Ecography 2010, 33, 83–94. [Google Scholar] [CrossRef]
- Dukes, J.S.; Pontius, J.; Orwig, D.; Garnas, J.R.; Rodgers, V.L.; Brazee, N.; Cooke, B.; Theoharides, K.A.; Stange, E.E.; Harrington, R.; et al. Responses of insect pests, pathogens, and invasive plant species to climate change in forests of northeastern North America: What can we predict? Can. J. For. Res. 2009, 39, 231–248. [Google Scholar] [CrossRef]
- Estay, S.A.; Lima, M.; Labra, F.A. Predicting insect pest status under climate change scenarios: Combining experimental data and population dynamics modelling. J. Appl. Entomol. 2009, 133, 491–499. [Google Scholar] [CrossRef]
- Ministry of the Environment and Statistics New Zealand. Environmental Report Series. Environment Aoteoroa; 2015. Available online: http://www.mfe.govt.nz/sites/default/files/media/Environmental%20reporting/Environment-Aotearoa-2015.pdf (accessed on 25 April 2017).
- Chen, I.-C.; Hill, J.K.; Ohlemüller, R.; Roy, D.B.; Thomas, C.D. Rapid range shifts of species associated with high levels of climate warming. Science 2011, 333, 1024–1026. [Google Scholar]
- Ministry of Primary Industries, New Zealand. Situations and Outlook for Primary Industries, December 2016. Available online: https://www.mpi.govt.nz/ (accessed on 4 April 2017).
- Sakai, A.K.; Allendorf, F.W.; Holt, J.S.; Lodge, D.M.; Molofsky, J.; With, K.A.; Baughman, S.; Cabin, R.J.; Cohen, J.E.; Ellstrand, N.C.; et al. The population biology of invasive species. Ann. Rev. Ecol. Syst. 2001, 32, 305–332. [Google Scholar] [CrossRef]
- Lockwood, J.L.; Cassey, P.; Blackburn, T. The role of propagule pressure in explaining species invasions. Trends Ecol. Evol. 2005, 20, 223–228. [Google Scholar] [CrossRef] [PubMed]
- StatsNZ. International Travel and Migration: July 2017. Available online: http://www.stats.govt.nz/browse_for_stats/population/Migration/IntTravelAndMigration_HOTPJul17.aspx (accessed on 22 August 2017).
- StatsNZ. Overseas Merchandise Trade: June 2017. Available online: http://www.stats.govt.nz/browse_for_stats/industry_sectors/imports_and_exports/OverseasMerchandiseTrade_HOTPJun17.aspx (accessed on 22 August 2017).
- Wallner, A.M.; Hamilton, G.C.; Nielsen, A.L.; Hahn, N.; Green, E.J.; Rodriguez-Saona, C.R. Landscape factors facilitating the invasive dynamics and distribution of the brown marmorated stink bug, Halyomorpha halys (Hemiptera: Pentatomidae), after arrival in the United States. PLoS ONE 2014, 9, e95691. [Google Scholar] [CrossRef] [PubMed]
- New Zealand Department of Conservation (DOC) Whakawhiti Korero: Working Better by Working Together. March 2017. Available online: http://us8.campaign-archive2.com/?u=2956fc2bebc9e28a4cf526b4e&id=fe87d0f26a&e=d06cc1b4d9 (accessed on 10 April 2017).
- Simberloff, D. The role of propagule pressure in biological invasions. Ann. Rev. Ecol. Evol. Syst. 2009, 40, 81–102. [Google Scholar] [CrossRef]
- Brockerhoff, E.G.; Kimberley, H.; Liebhold, A.M.; Haack, R.A.; Carey, J.F. Predicting how altering the propagule pressure changes establishment rates of biological invaders across species pool. Ecology 2014, 95, 594–601. [Google Scholar] [CrossRef] [PubMed]
- Fraser, D.; Galbraith, M.; Adams, N.; Blanchon, D. Range expansion in the spur-winged plover (Vanellus miles novaehollandiae) in New Zealand. Notornis 2014, 61, 43–47. [Google Scholar]
- Ministry of Primary Industries. Brown Marmorated Stink Bug Risk Management—2016/17 Season (as at 20th March 2017). Available online: http://www.kvh.org.nz/vdb/document/103524 (accessed on 19 September 2017).
Figure 1.
Global spatially rarified occurrence used in the model (n = 125).

Figure 2.
Global and New Zealand predictions of brown marmorated stink bug habitat suitability under current conditions and emissions trajectories of Representative Concentration Pathways (RCP) 2.6 and RCP 8.5 for the years 2050 and 2070 using Random Forest algorithm.
Figure 2.
Global and New Zealand predictions of brown marmorated stink bug habitat suitability under current conditions and emissions trajectories of Representative Concentration Pathways (RCP) 2.6 and RCP 8.5 for the years 2050 and 2070 using Random Forest algorithm.

Figure 3.
Global and New Zealand predictions of brown marmorated stink bug habitat suitability under current conditions and emissions trajectories of Representative Concentration Pathways (RCP) 2.6 and RCP 8.5 for the years 2050 and 2070 using Support Vector Machine (SVM) algorithm.
Figure 3.
Global and New Zealand predictions of brown marmorated stink bug habitat suitability under current conditions and emissions trajectories of Representative Concentration Pathways (RCP) 2.6 and RCP 8.5 for the years 2050 and 2070 using Support Vector Machine (SVM) algorithm.

Figure 4.
Global and New Zealand predictions of brown marmorated stink bug habitat suitability under current conditions and emissions trajectories of Representative Concentration Pathways (RCP) 2.6 and RCP 8.5 for the years 2050 and 2070 using Maxent algorithm.
Figure 4.
Global and New Zealand predictions of brown marmorated stink bug habitat suitability under current conditions and emissions trajectories of Representative Concentration Pathways (RCP) 2.6 and RCP 8.5 for the years 2050 and 2070 using Maxent algorithm.

Figure 5.
Global and New Zealand predictions of brown marmorated stink bug habitat suitability under current conditions and emissions trajectories of Representative Concentration Pathways (RCP) 2.6 and RCP 8.5 for the years 2050 and 2070 using combined ensemble algorithm (Random Forest, Support Vector Machine and Maxent).

Figure 6.
Centroid shift for Representative Concentration Pathways (RCP) 2.5 and RCP 8.5 from current times to the years 2050 and 2070 using the centroid of reclassified High suitability category areas.
Figure 6.
Centroid shift for Representative Concentration Pathways (RCP) 2.5 and RCP 8.5 from current times to the years 2050 and 2070 using the centroid of reclassified High suitability category areas.

Figure 7.
Ensembled suitability mapped into the official territories of New Zealand for: current conditions (left); and future climatic conditions (right), for Representative Concentration Pathways (RCP) 8.5 year 2070.
Figure 7.
Ensembled suitability mapped into the official territories of New Zealand for: current conditions (left); and future climatic conditions (right), for Representative Concentration Pathways (RCP) 8.5 year 2070.


Table 1.
Environmental variables at occurrence points used in the model with final selected variables after checking for cross correlation.
Table 1.
Environmental variables at occurrence points used in the model with final selected variables after checking for cross correlation.
| Layer | Climatic Variable | Mean | Standard Error | Max | Min |
|---|---|---|---|---|---|
| * BIO1 | Annual Mean Temperature | 11.58 | 2.01 | 19.60 | 1.20 |
| * BIO2 | Mean Diurnal Range (Mean of monthly (max temp—min temp)) | 10.98 | 7.50 | 14.10 | 7.70 |
| BIO3 | Isothermality (BIO2/BIO7) (* 100) | 3.32 | 5.38 | 5.50 | 2.30 |
| BIO4 | Temperature Seasonality (standard deviation * 100) | 791.09 | 3.96 | 1000.20 | 303.20 |
| BIO5 | Max Temperature of Warmest Month | 28.65 | 4.32 | 35.20 | 16.90 |
| BIO6 | Min Temperature of Coldest Month | 4.54 | 2.11 | 8.60 | −15.50 |
| BIO7 | Temperature Annual Range (BIO5-BIO6) | 33.19 | 145.25 | 41.20 | 19.10 |
| * BIO8 | Mean Temperature of Wettest Quarter | 18.11 | 0.72 | 24.70 | −1.50 |
| * BIO9 | Mean Temperature of Driest Quarter | 4.83 | 1.56 | 22.70 | −7.10 |
| BIO10 | Mean Temperature of Warmest Quarter | 21.64 | 2.79 | 28.00 | 11.00 |
| BIO11 | Mean Temperature of Coldest Quarter | 1.30 | 7.85 | 14.30 | −8.70 |
| * BIO12 | Annual Precipitation | 1125.71 | 13.20 | 1928.00 | 315.00 |
| BIO13 | Precipitation of Wettest Month | 132.11 | 7.45 | 257.00 | 68.00 |
| BIO14 | Precipitation of Driest Month | 63.00 | 9.79 | 106.00 | 0.00 |
| * BIO15 | Precipitation Seasonality (Coefficient of Variation) | 27.40 | 2.24 | 101.00 | 7.00 |
| BIO16 | Precipitation of Wettest Quarter | 367.72 | 2.40 | 739.00 | 184.00 |
| BIO17 | Precipitation of Driest Quarter | 207.45 | 3.56 | 344.00 | 4.00 |
| BIO18 | Precipitation of Warmest Quarter | 315.41 | 28.72 | 589.00 | 9.00 |
| * BIO19 | Precipitation of Coldest Quarter | 259.65 | 4.41 | 685.00 | 105.00 |
* Environmental variables selected for use in the final model.
Table 2.
Evaluation of prediction using Random Forest (RF), Support Vector Machine (SVM) and Maxent models.
Table 2.
Evaluation of prediction using Random Forest (RF), Support Vector Machine (SVM) and Maxent models.
| Algorithm | AUC | Kappa | TSS |
|---|---|---|---|
| RF | 0.98739 | 0.51379 | 0.59695 |
| SVM | 0.98488 | 0.45132 | 0.58917 |
| Maxent | 0.98970 | 0.39969 | 0.18408 |
© 2017 by the authors. Licensee MDPI, Basel, Switzerland. This article is an open access article distributed under the terms and conditions of the Creative Commons Attribution (CC BY) license (http://creativecommons.org/licenses/by/4.0/).
Share and Cite
MDPI and ACS Style
Fraser, D.; Kumar, S.; Aguilar, G. Mapping the Potential Global Range of the Brown Marmorated Stink Bug, Halyomorpha halys, with Particular Reference to New Zealand. Climate 2017, 5, 75. https://0-doi-org.brum.beds.ac.uk/10.3390/cli5030075
AMA Style
Fraser D, Kumar S, Aguilar G. Mapping the Potential Global Range of the Brown Marmorated Stink Bug, Halyomorpha halys, with Particular Reference to New Zealand. Climate. 2017; 5(3):75. https://0-doi-org.brum.beds.ac.uk/10.3390/cli5030075
Chicago/Turabian StyleFraser, Diane, Shivani Kumar, and Glenn Aguilar. 2017. "Mapping the Potential Global Range of the Brown Marmorated Stink Bug, Halyomorpha halys, with Particular Reference to New Zealand" Climate 5, no. 3: 75. https://0-doi-org.brum.beds.ac.uk/10.3390/cli5030075
Note that from the first issue of 2016, this journal uses article numbers instead of page numbers. See further details here.