4.1. Comparison of Income Levels Among Regions
Agricultural income is a key driver in reducing poverty in Bangladesh, where it accounted for 90% of all poverty alleviation between 2005 and 2010 [
81]. In terms of employment, Bangladesh’s economy is primarily dependent on agriculture. Approximately 85% of the population is directly or indirectly attached to the agriculture sector [
38,
69].
Agriculture continues to be the main source of income in the sample households in all regions (
Table 1) and this result is consistent with Hossain and Silva (2013) [
5]. However, in all regions, nonagricultural profit and employment are important income sources and these results are consistent with Bangladesh Economic Review [
45]. The amount of remittances varies by region: that in Sylhet is not the highest nationally but the people there do consider remittances to be the main income source in the region. The agricultural income is higher in Rajshahi than in other regions and the per capita income of this region per the study sample is US
$ 423.6 (
Table 2). Diversification of agricultural crops results in this region having highest income from agriculture.
Table 1 shows significant differences in main income sources among farmers in various regions in Bangladesh. Employment is the predominant income source in most regions, followed by nonagricultural profits and agriculture. The share of agriculture in total income varies by region. Among Bangladeshi farming households, the employment share is 40.10%, although the overall share of agriculture in total income is 14.32%. Rangpur has the highest share of agricultural income in total annual income (21.41%), followed by the Mymensingh region (20.15%). Comilla’s share of remittances in total annual income was highest (41.48% of total income); in comparison, the share generated by agricultural crops in Comilla was only 5.50%. Currently, overseas workers are more often from the Comilla region than other regions in Bangladesh, with a significant proportion of them sending remittances, becoming a vital source of income in the Comilla region. Rice and other crops were the main sources of income among the sampled farm households in the study areas (
Appendix C). Incomes from maize and potato appear to be growing but their respective shares remain small. There are regional land conditions and climate differences among Bangladesh’s regions, so wheat, maize, onion and potato production is not familiar to all farmers. Consequently, farmers in all areas of Bangladesh tend to focus on rice cultivation.
Table 2 shows descriptive statistics of income status by region. Poverty rates were estimated by applying the poverty line and the purchasing power parity from the World Bank [
22] to log-normal income distributions. The findings presented in
Table 2 indicate differences in mean, median and standard deviation of net incomes among the nine regions in Bangladesh; using these findings, one can pinpoint relatively rich and poor regions.
In terms of mean net income, incomes of sampled farm households in Rajshahi are the highest, while those of Barisal, Mymensingh, Rangpur and Sylhet are lower. As some farmers had negative or zero per-capita income, the standard deviation is relatively large in certain regions. The highest standard deviation value is found in Chittagong (US$ 418.1), reflecting a large income gap among the farmers there.
The highest poverty rate (i.e., 0.51) was found in Mymensingh and Barisal (
Table 2), while the lowest (i.e., 0.33) was in Rajshahi; overall, the country’s upper poverty rate is 0.46. The rates in Chittagong and Sylhet were also relatively low (i.e., 0.49). The officially estimated upper poverty rate and national average poverty rate are both in the vicinity of 0.35 [
12,
82], which makes sense because the original data were collected from rural, farming-engaged people and excluded affluent or single urban people.
Among regions where the poverty rates were high, Barisal, Mymensingh and Sylhet had the lower mean incomes. In contrast, Chittagong had the highest standard deviation, compared to the other regions. In the regions of Barisal, Mymensingh and Sylhet, it appeared that the mean income level was low; however, in the other regions, the mean income was large. These results show that these low-income regions are vulnerable regions and should be the targets of farmers’ support policies.
From results of
Table 2, this study found that there are differences in mean, median and standard deviation of net incomes among the nine regions in Bangladesh and for validation of this difference, we perform ANOVA and report the results in
Table 3. Analysis of variance (ANOVA) is a statistical test designed to examine means across more than two groups by comparing variances, based upon the variability in each sample and in the combined samples. We analyzed the variance within and between the sample farmers to determine the significance of any differences in per capita income of farm household members among the regions of Bangladesh. The results of the overall F test in the ANOVA summary shows the results regarding the variability of means between groups and within groups. As indicated, the overall F test is significant (i.e.,
p-value < 0.05), indicating that means between groups are not equal and it is statistically concluded that there have been significant differences among the regions in terms of mean per-capita income.
The first column in ANOVA provides us with the sum of squares between and within the groups and for the total sample farmers. The total sum of squares represents the complete variance on the dependent variable for the total sample. The second column represents the degrees of freedom, (
n − 1). The total degrees of freedom represent 13,006 − 1 = 13,005; degrees of freedom between groups equals the number of groups minus one (10 − 1 = 9). The within groups degrees of freedom equals 13,005 − 9 = 12,996. The third (mean square) column contains the estimates of variability between and within the groups. The mean square estimate is equal to the sum of the squares divided by the degrees of freedom. The between groups mean square is
; the within-groups mean square is
. The fourth column, the F ratio, is calculated by dividing the mean square between groups by the mean square within the groups. The F ratio should be one if the null hypothesis is true, while both mean square estimates are equal. However, as shown in
Table 3, larger F values (4.757462) imply that the means of the per capita income groups are greatly different from each other, compared to the variation in the individual sample farmers in each group. The next column is the significance level (
p-value) and it indicates that the value of F ratio is sufficiently large to reject the null hypothesis. The significance level is
, which is less than 0.05. Therefore, the mean per capita incomes of sample households among the regions of the country were significantly different in the study year.
4.2. Regional Characteristics on Income Source
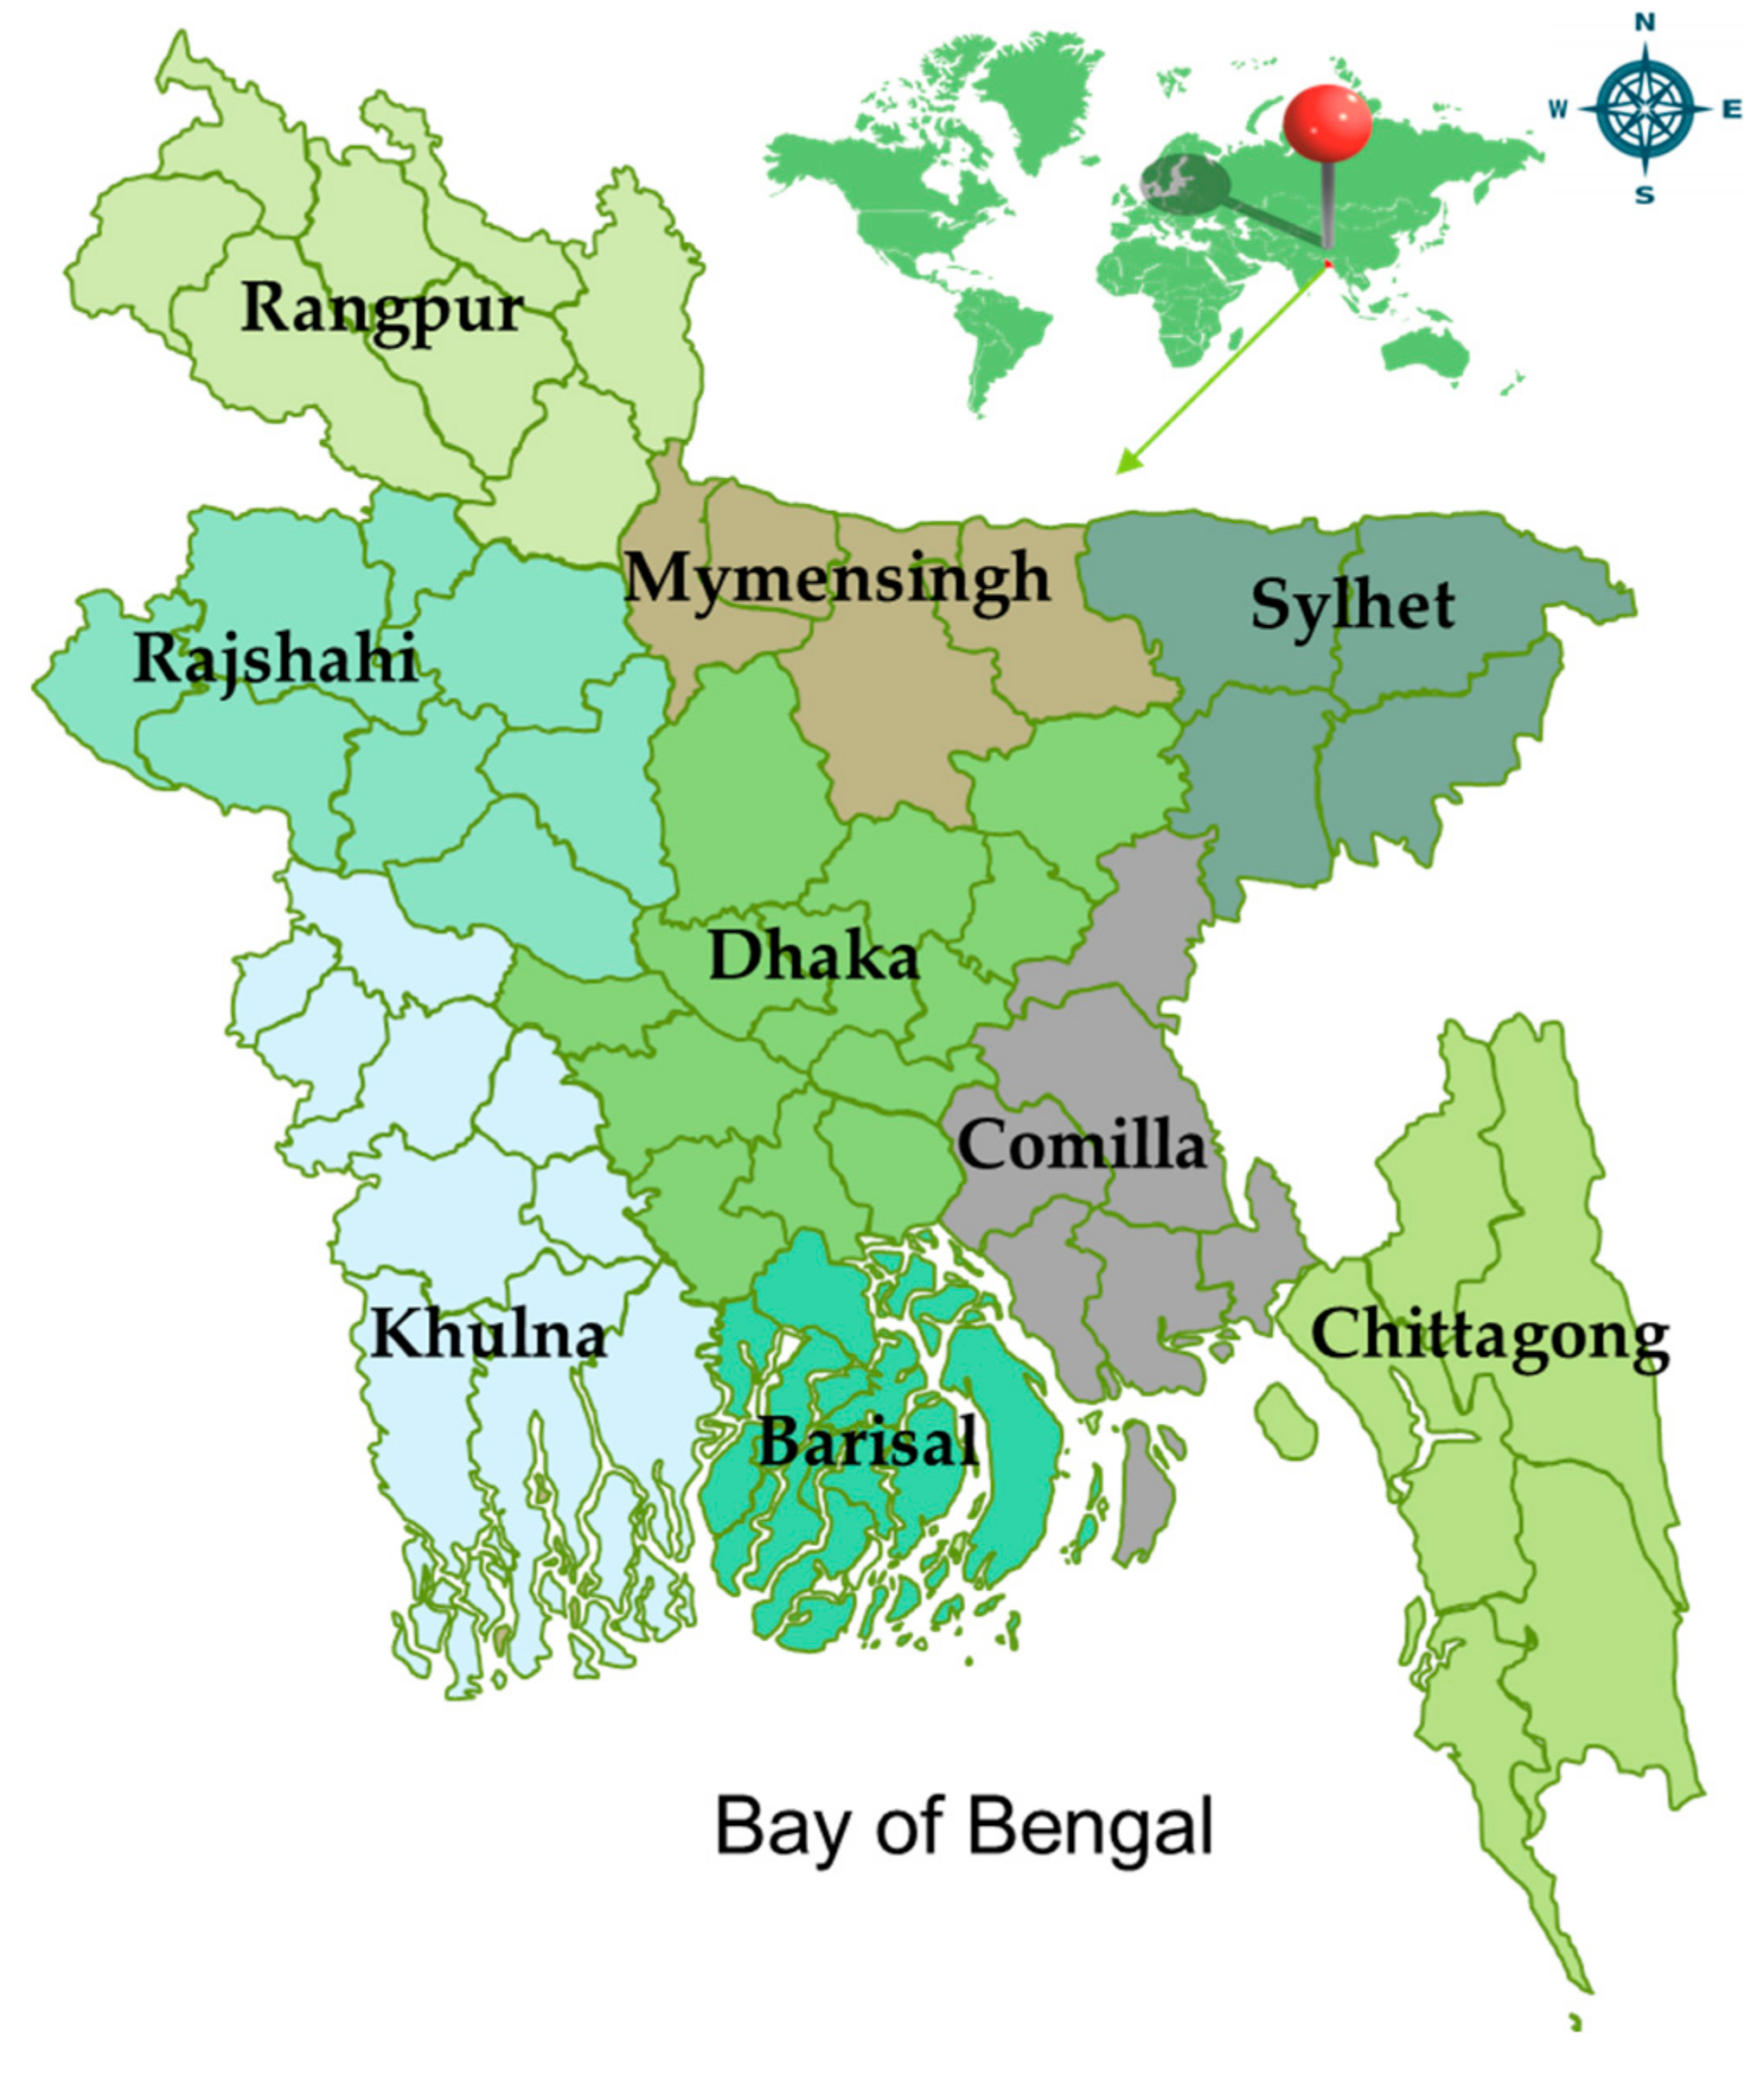
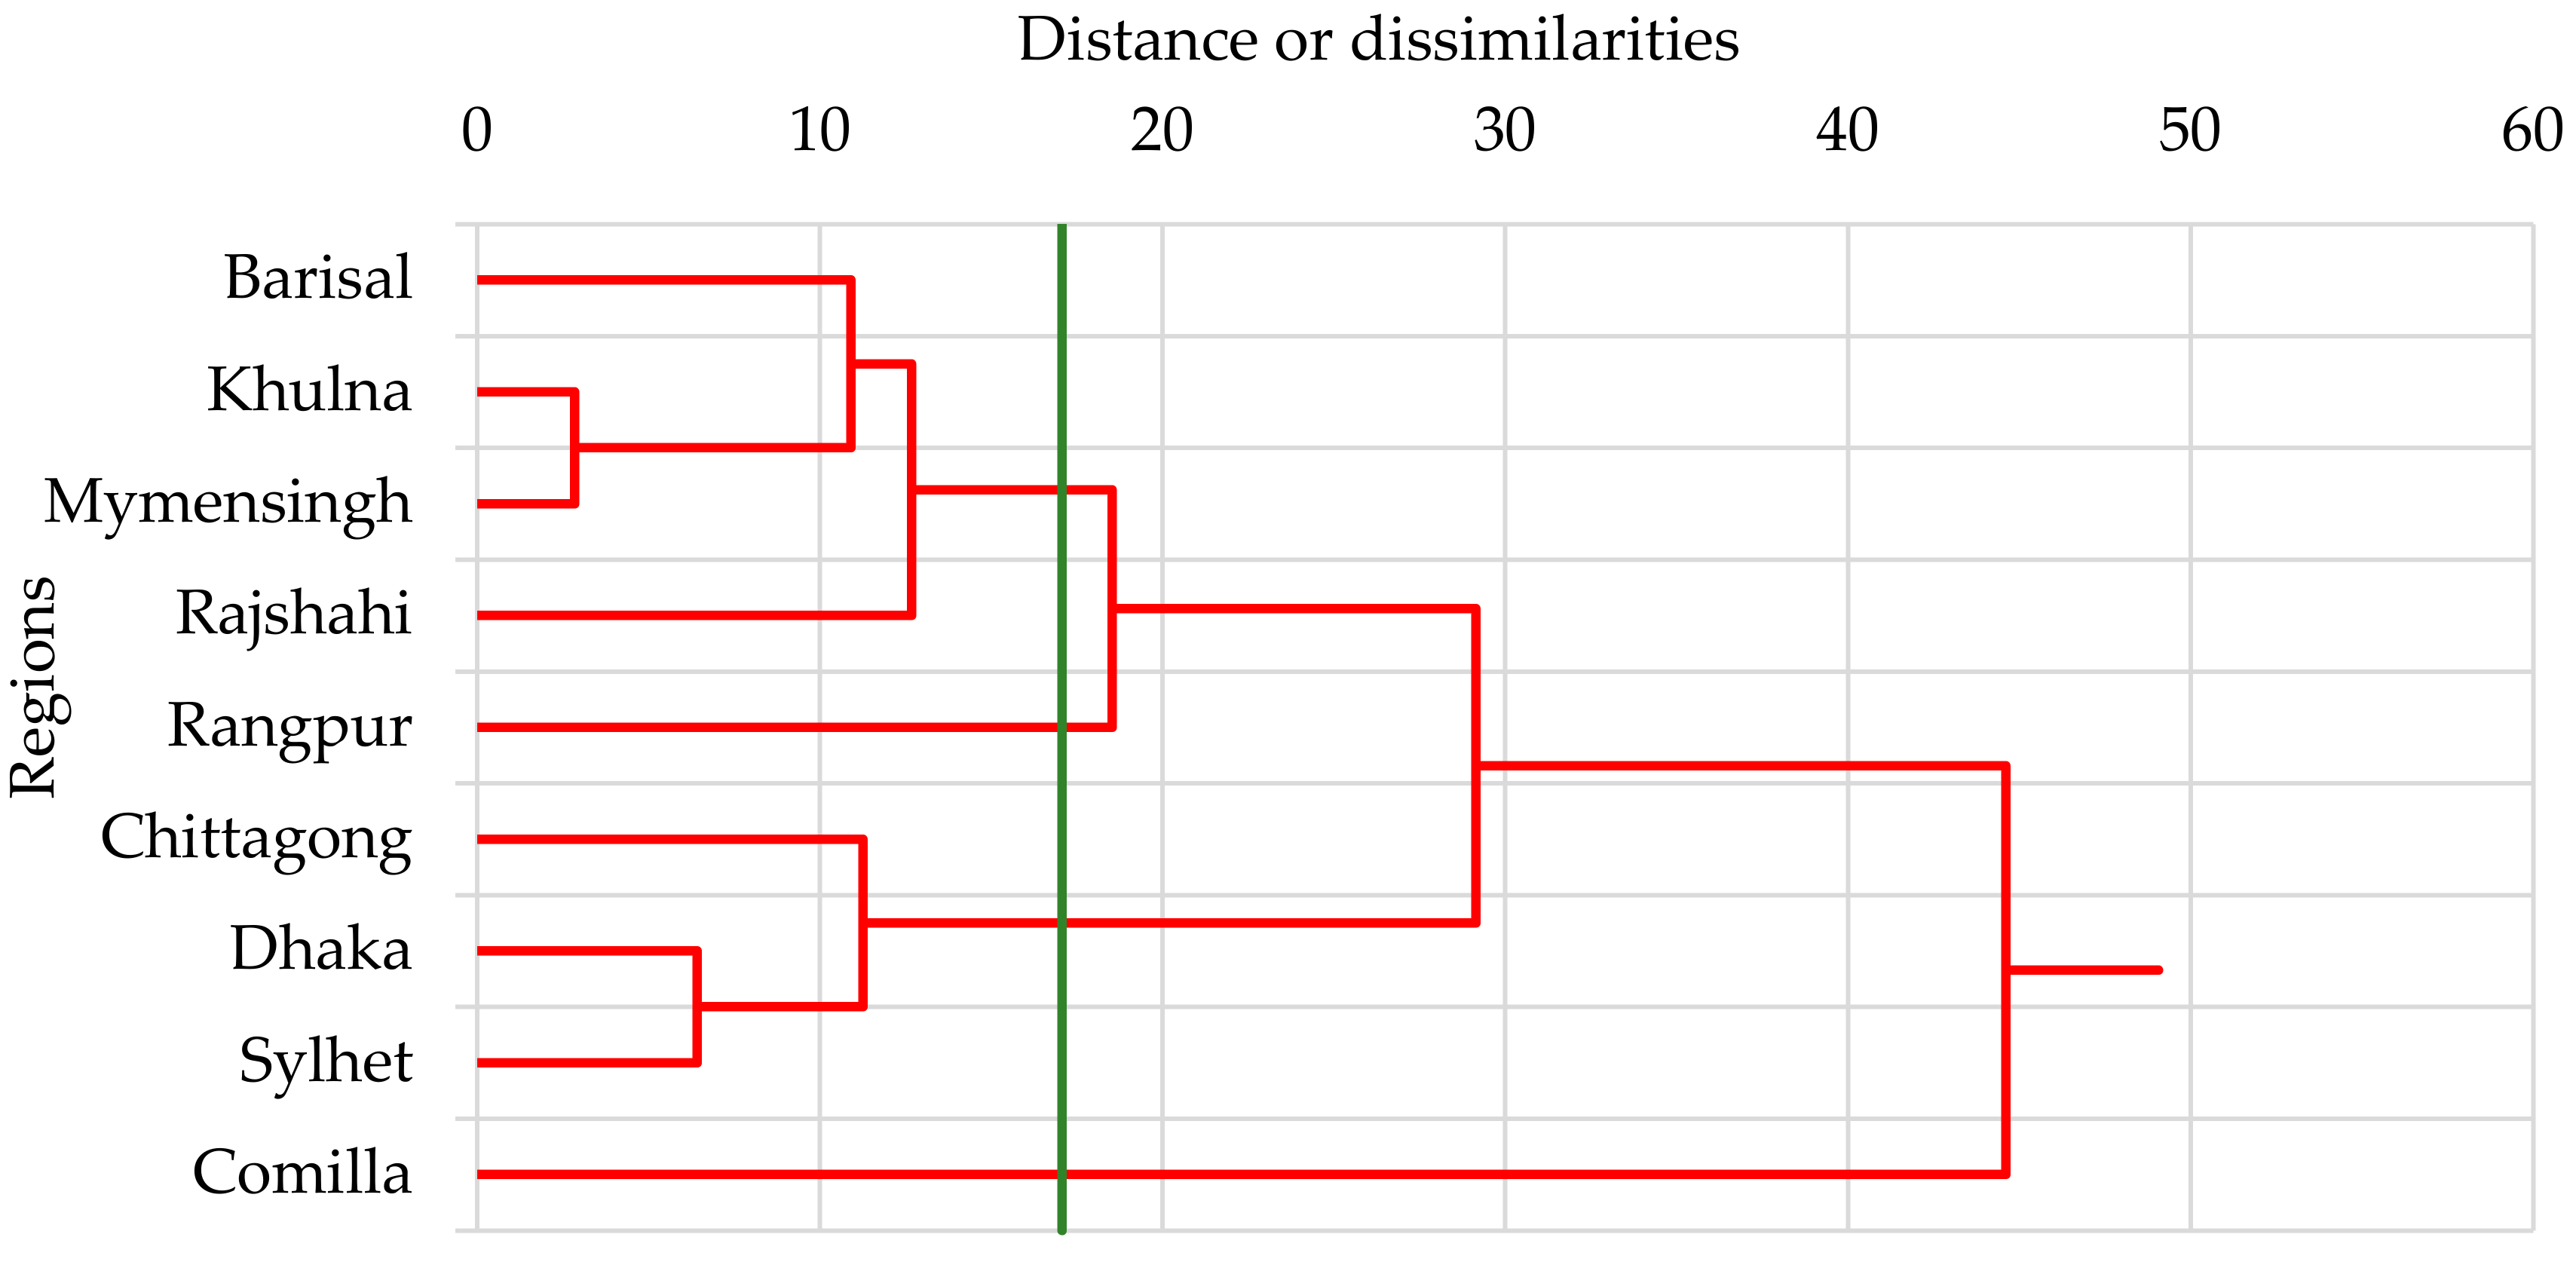
This section intends to classify regions of Bangladesh to determine the regional characteristics of income sources in each administrative region. Sectoral income shares from
Table 1 are analyzed by cluster analysis and are shown in
Figure 2. Here, a dendrogram depicts the income source relationships among the regions. The horizontal axis of the dendrogram (in
Figure 2) represents the distance or dissimilarity between clusters and the vertical axis represents the objects (regions) of clusters. From the cluster analysis, this study attempted to find the similarity and clustering with the dendrogram, which visually displays a certain cluster shape. Regions that are close to each other (have small dissimilarities) are linked near the right side of the plot. In
Figure 2, we note that Khulna and Mymensingh are very similar compared to the regions that link up near the left side, which are very different. For example, Comilla appears to be quite different from any of the other regions. The number of clusters formed at a particular cluster cutoff value can be quickly determined from this plot by drawing a vertical line at this value and counting the number of lines that the vertical line intersects. In this study, we can see that, if we draw a vertical line at the value of 18.0, four clusters will result. One cluster contains four regions, one contains three regions and two clusters each contain only one region, as shown in
Figure 2, in which Barisal, Mymensingh, Khulna and Rajshahi are more alike than resembling Rangpur. In addition, Chittagong, Dhaka and Sylhet are more alike than resembling Comilla.
Table 4 summarizes regional characteristics of income sources. Clusters 1 and 2 are largely dependent on agriculture. Clusters 3 and 4 are not largely dependent on agriculture. This result indicates the importance of agricultural research for clusters 1 and 2.
Using the dendrogram in
Figure 3 (agricultural crop share in total agricultural income analyzed by cluster analysis), four clusters were determined (
Table 5) as the clusters suitable for representing agricultural crop income sources among the regions. We followed the same procedure for this dendrogram (
Figure 3) that we followed in
Figure 2.
The selected clusters show significant differences among the regions. Rice and other crops were identified as the main agricultural income sources of clusters 1–3, whereas rice, jute, chili, onion and other crops were those of cluster 4. The selected clusters produced the significant differences among the regions. In addition, rice predominated in cluster 2, while other crops predominated in cluster 3. These findings imply, for example, that rice is the main agricultural income source in Rangpur and Sylhet, while other crops are those in Chittagong and Comilla.
4.3. Reasons for Broad Income Distribution within a Region
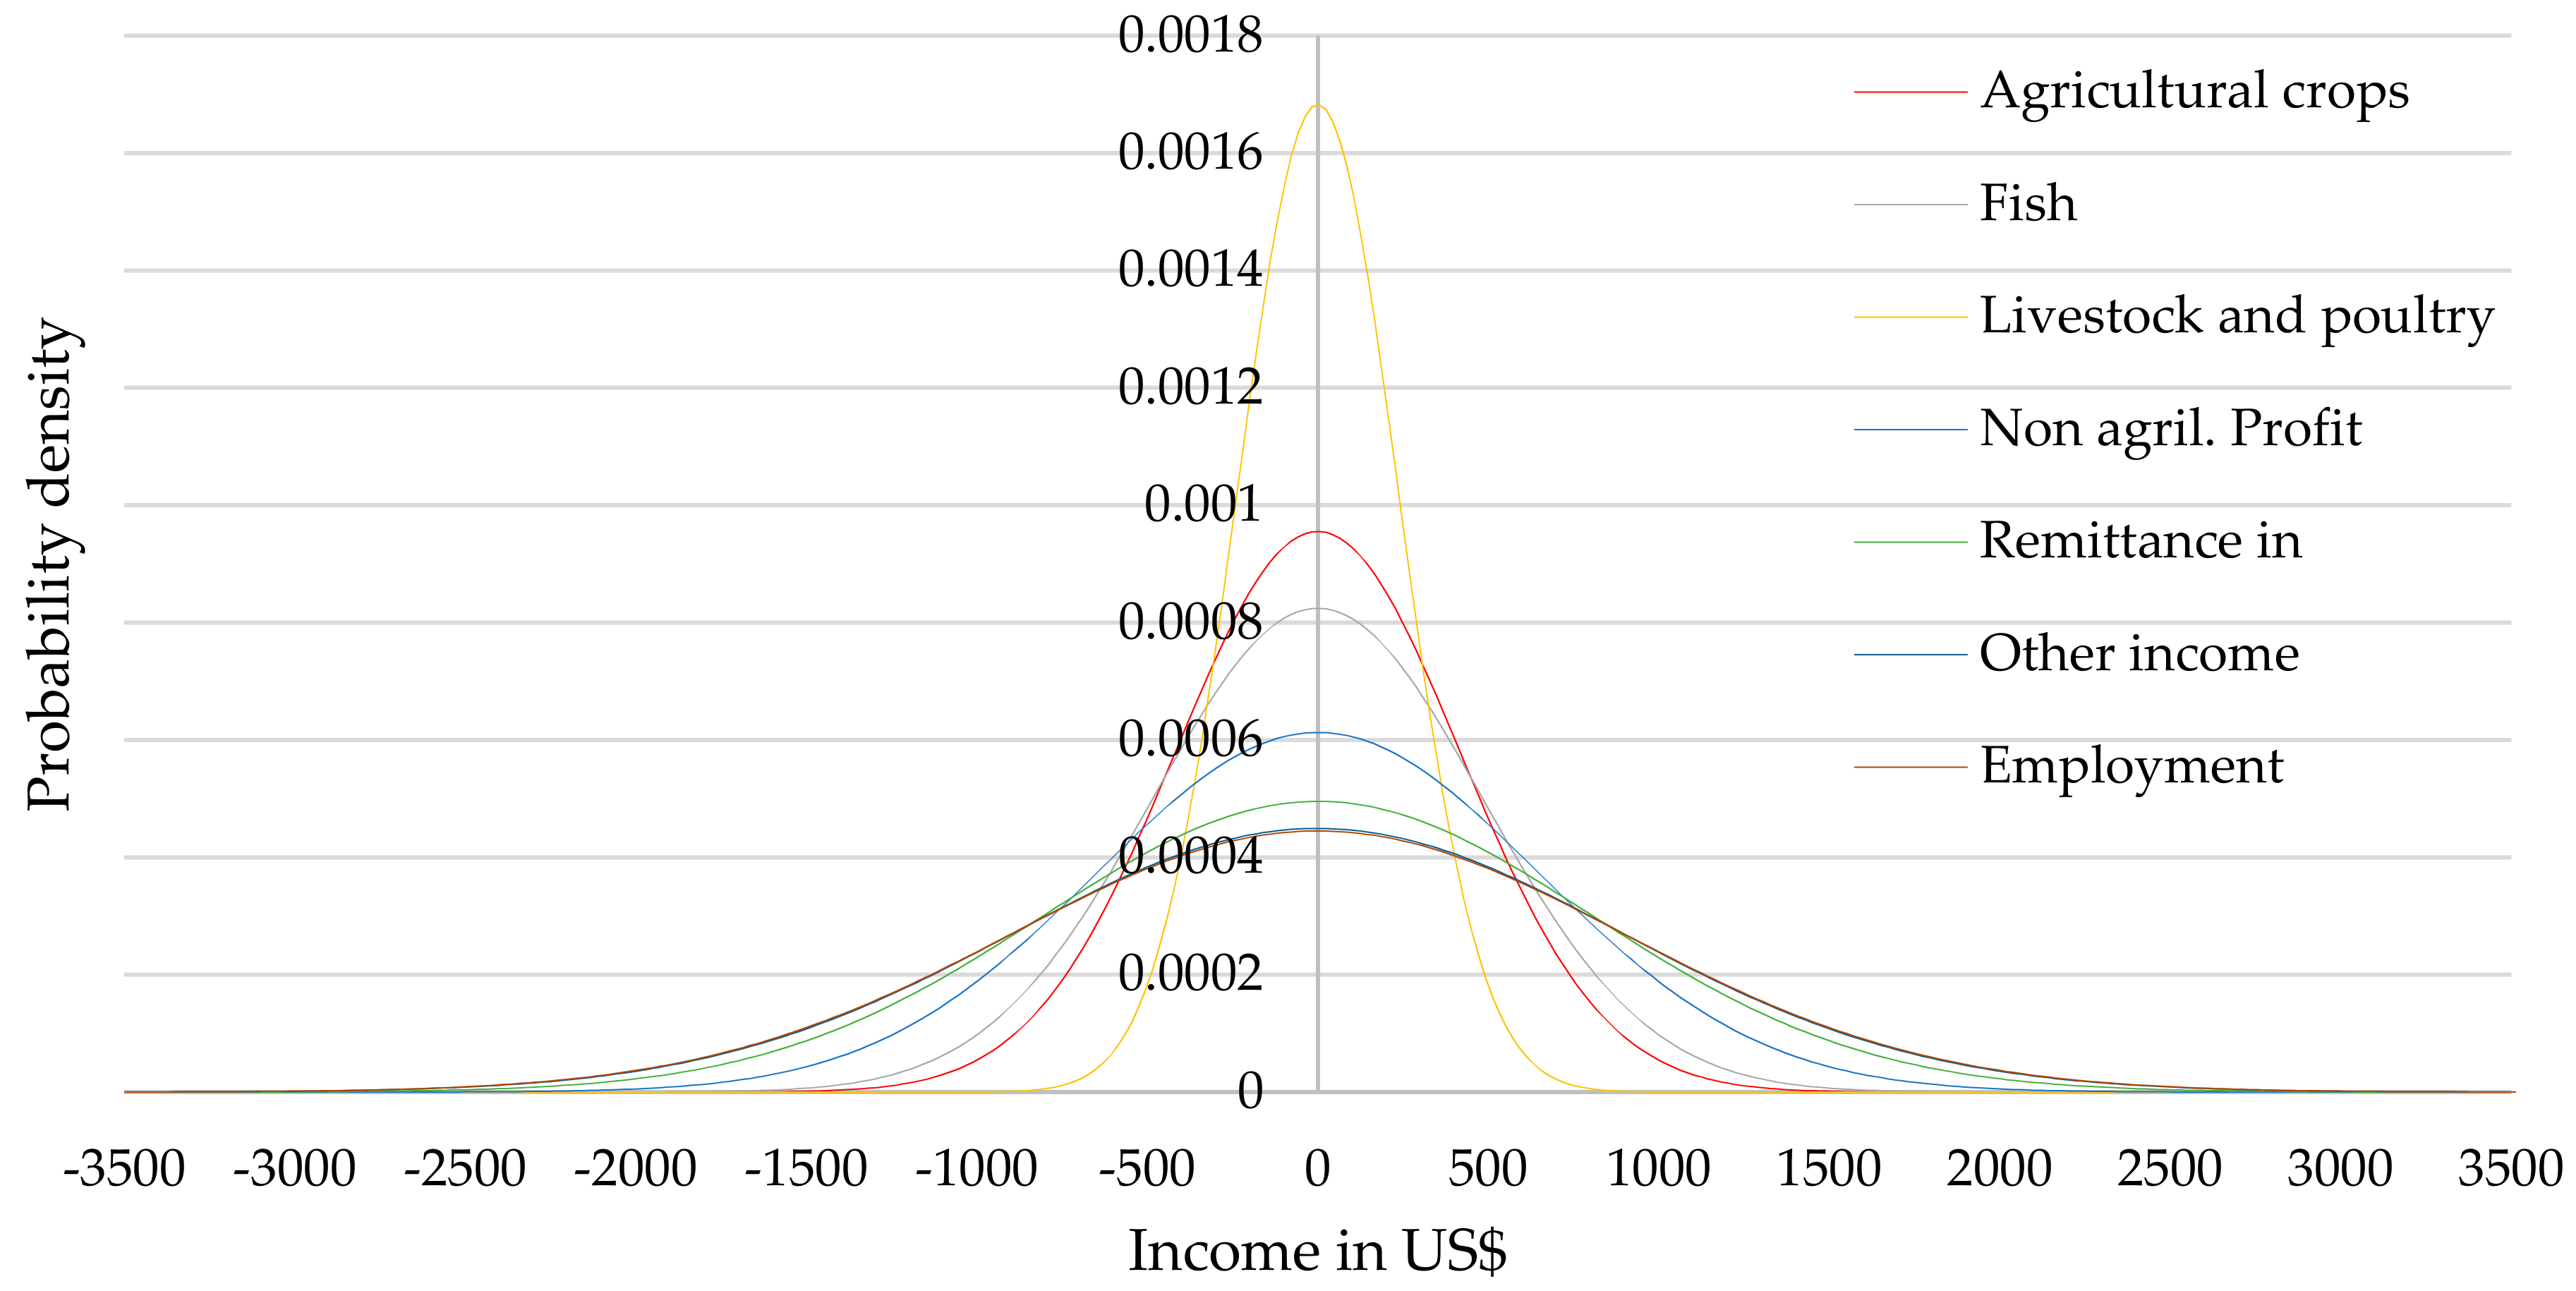
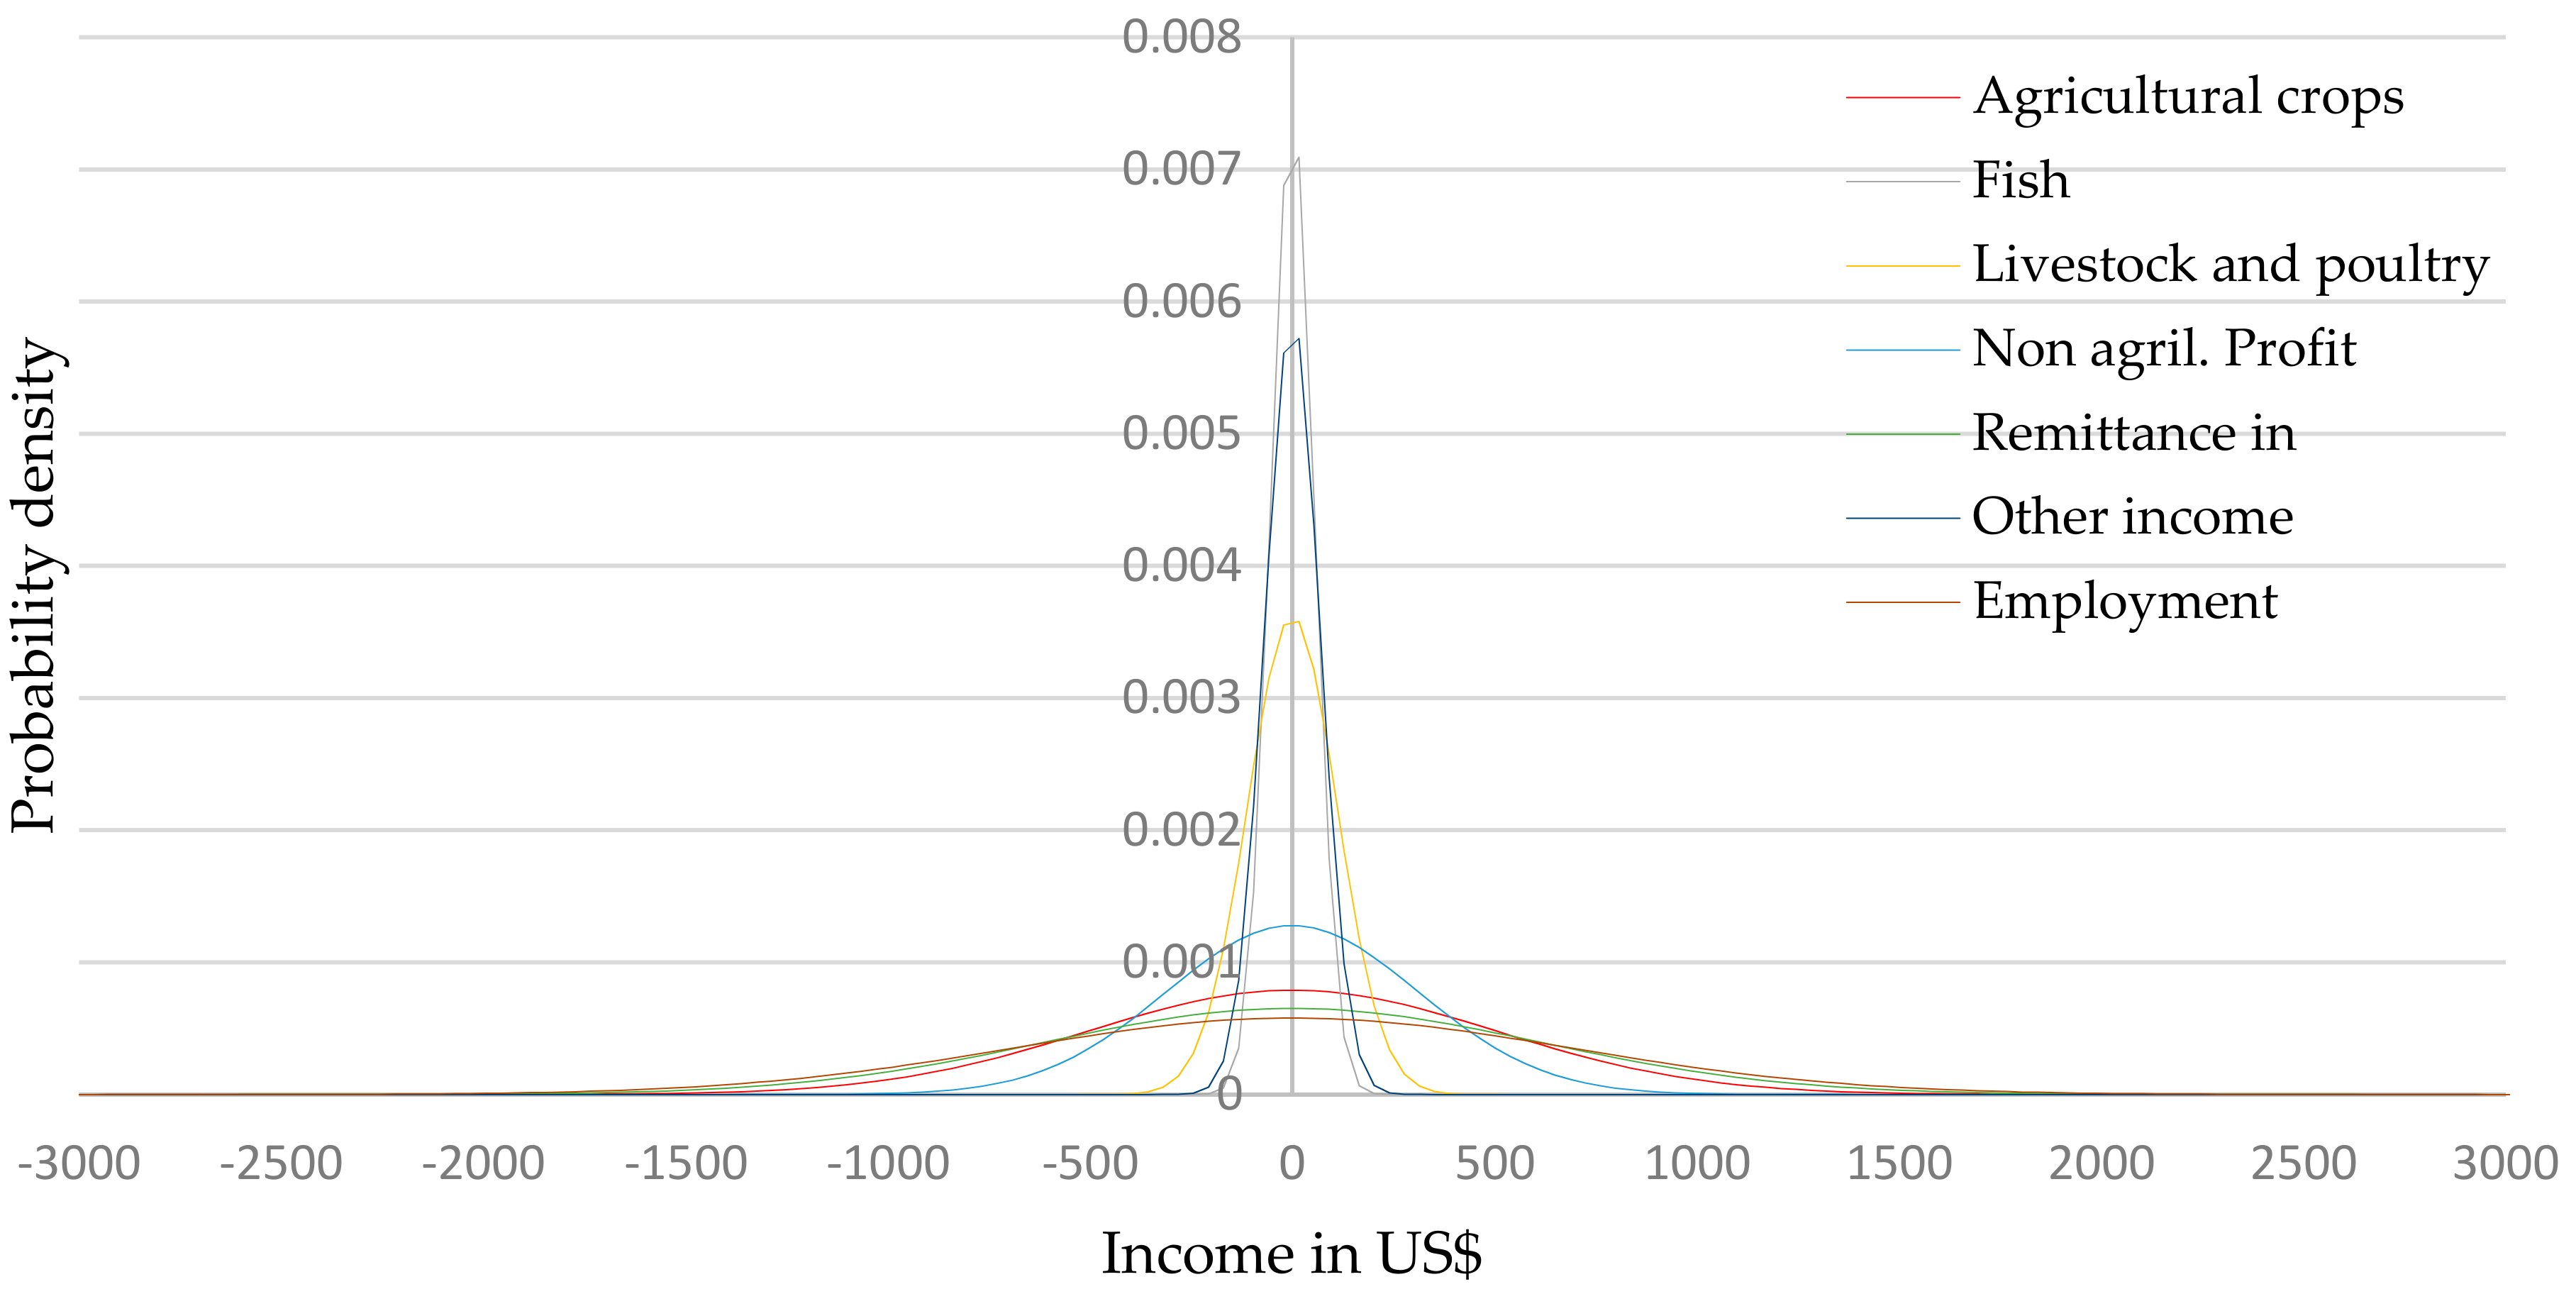
To grasp the diversity of income for sampled farm households, the income can be decomposed into seven broad components, such as Agriculture, Fish, Livestock and poultry, Nonagricultural enterprise profit, Remittance, Other income and Employment income, in each region. We applied decomposition of variances and the results are shown in
Table 6. The decomposition of variances is useful in evaluating how much each source of income contributes to total income variation of farm households. The decomposed variance share was derived from annual per capita income from the seven aforementioned broad income source sectors. Across Bangladesh, differences in remittances, other income and employment are important factors that all contribute the largest share of variation in total income. If a family can find good employment both inside and outside its region, it can become relatively wealthy, although income share from employment does not significantly more contribute in all regions (
Table 6).
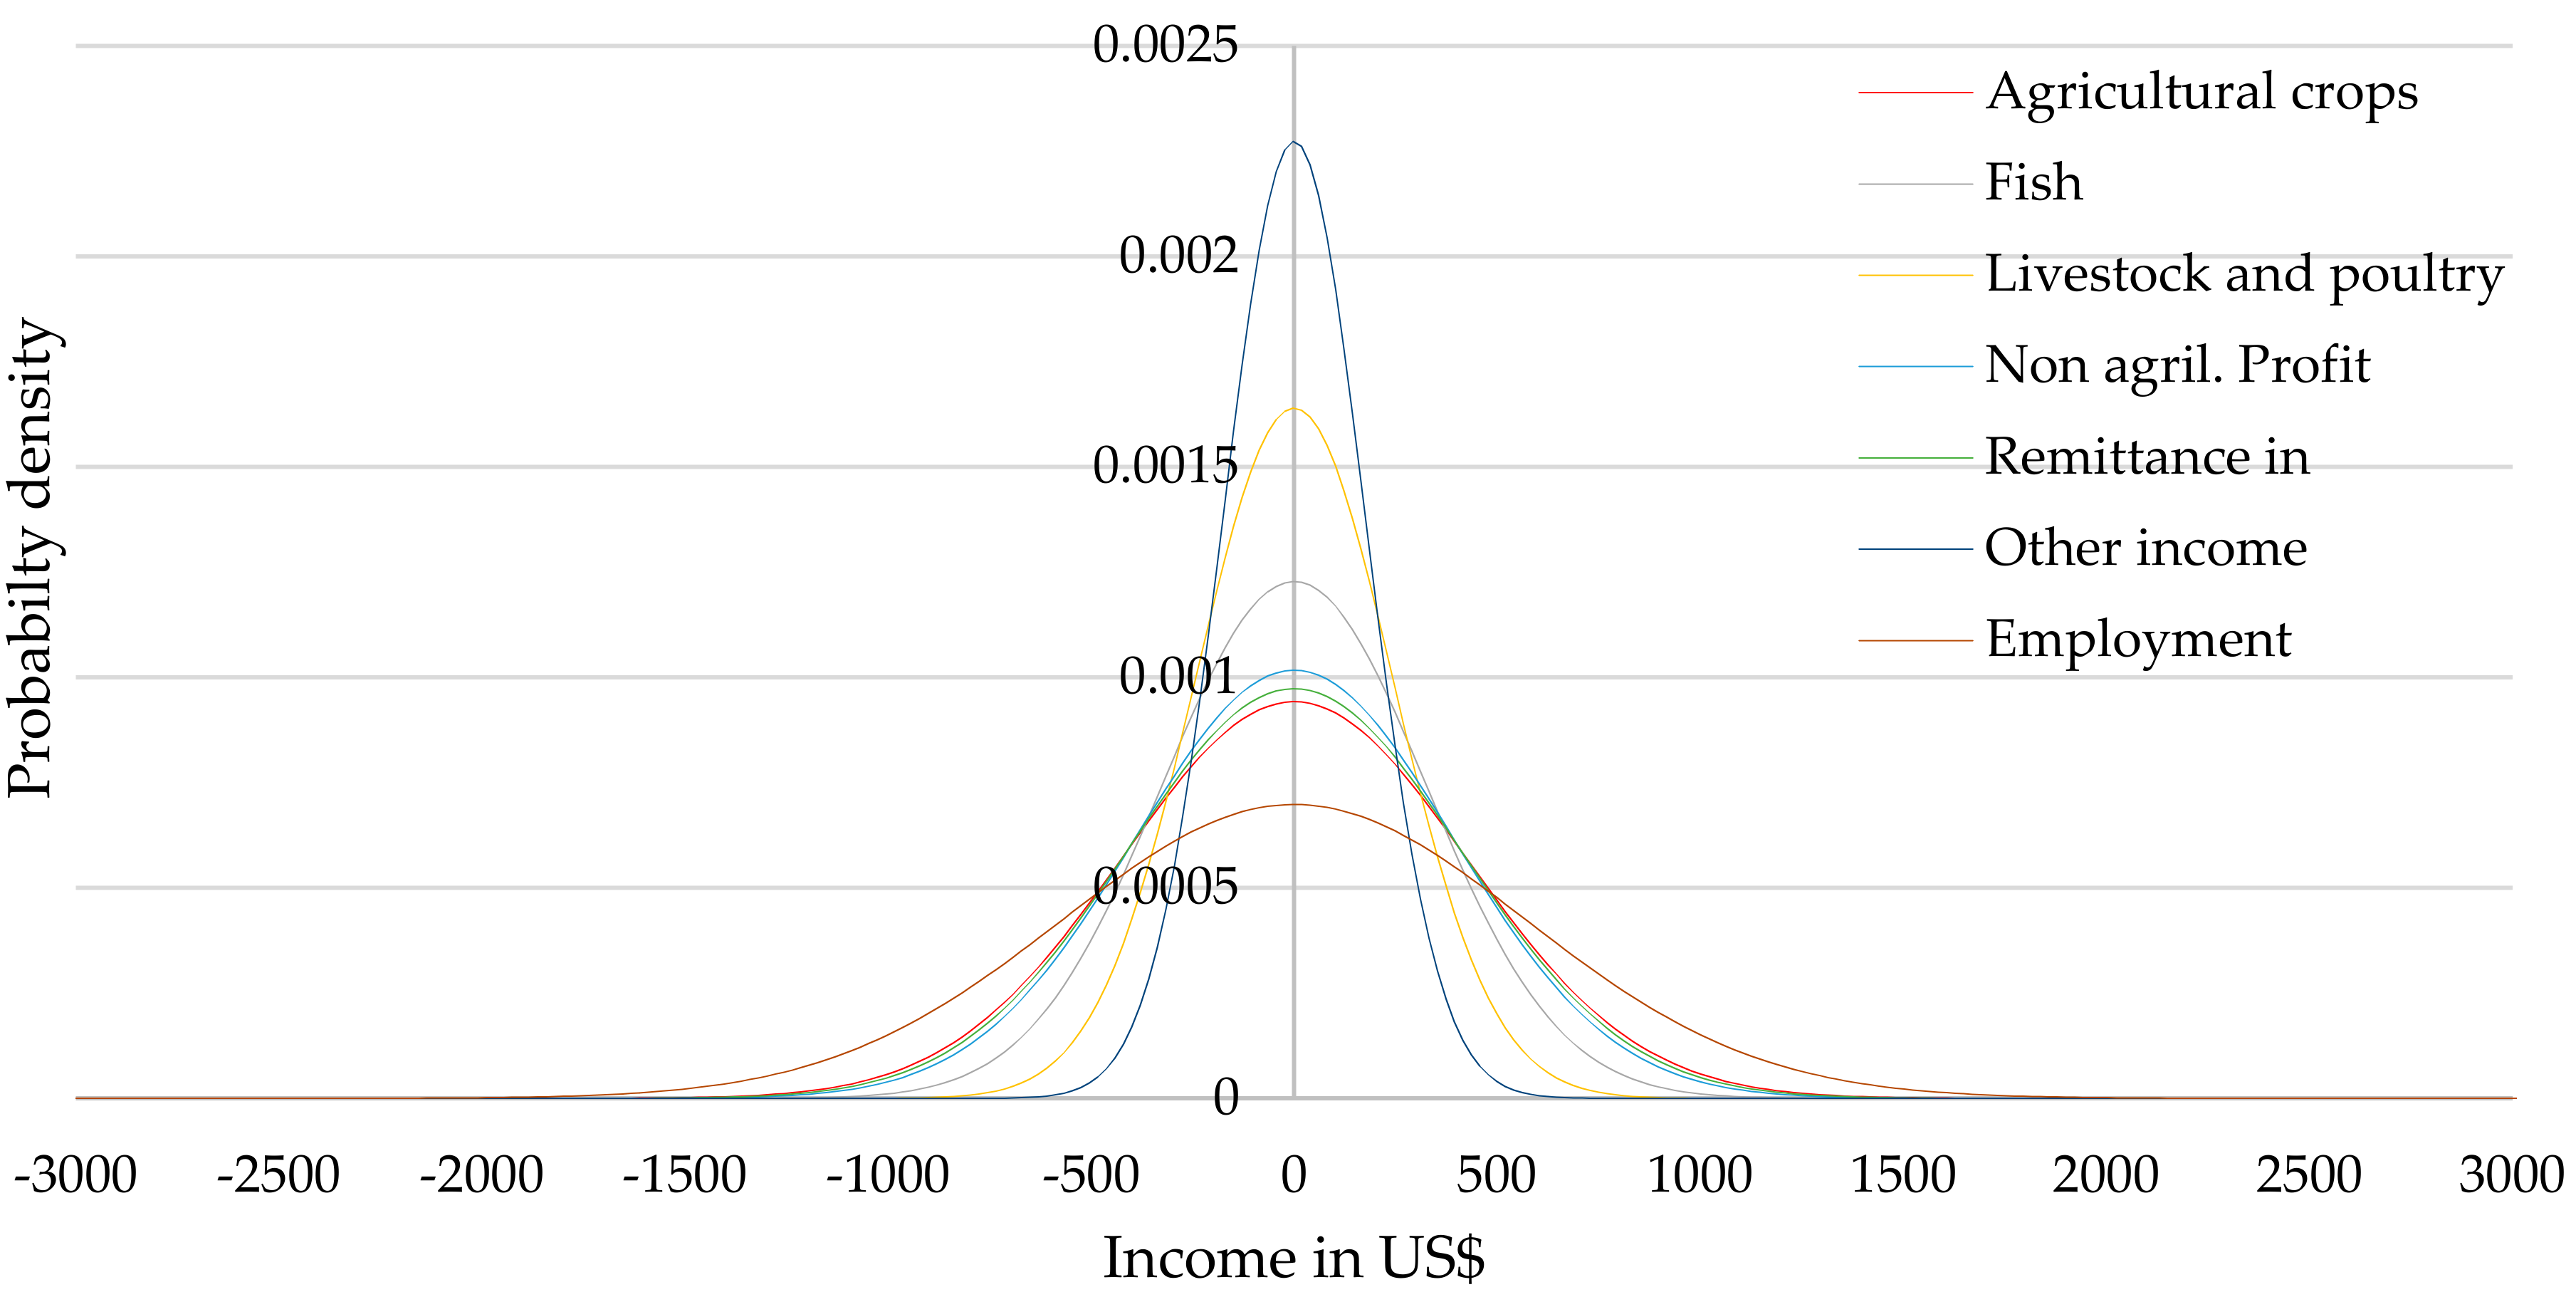
We found in
Table 6 that agriculture is one of the main contributors to income differences in Mymensingh and Rangpur regions.
Figure 4 shows total income distribution by income sources for the whole country, of which 22% of income inequality of total income is explained by inequality of employment income, while 13.87% and 20.59% of income inequality of total income explained by agriculture in Mynemnsingh and Rangpur respectively (
Figure 5 and
Figure 6). Furthermore, this result indicates that remittance is the most important sector inducing income disparity in Comilla, compared to employment in Dhaka and Rangpur. In addition, other income sources are significant sources of income to confirm the total income disparity in Rajshahi. This finding likely explains that the income inequality of total income makes the larger contribution of inequality in agricultural income for crop farm households in Bangladesh.
4.4. Factors in Agricultural Income Differences
The main factors of agricultural income differences are shown in
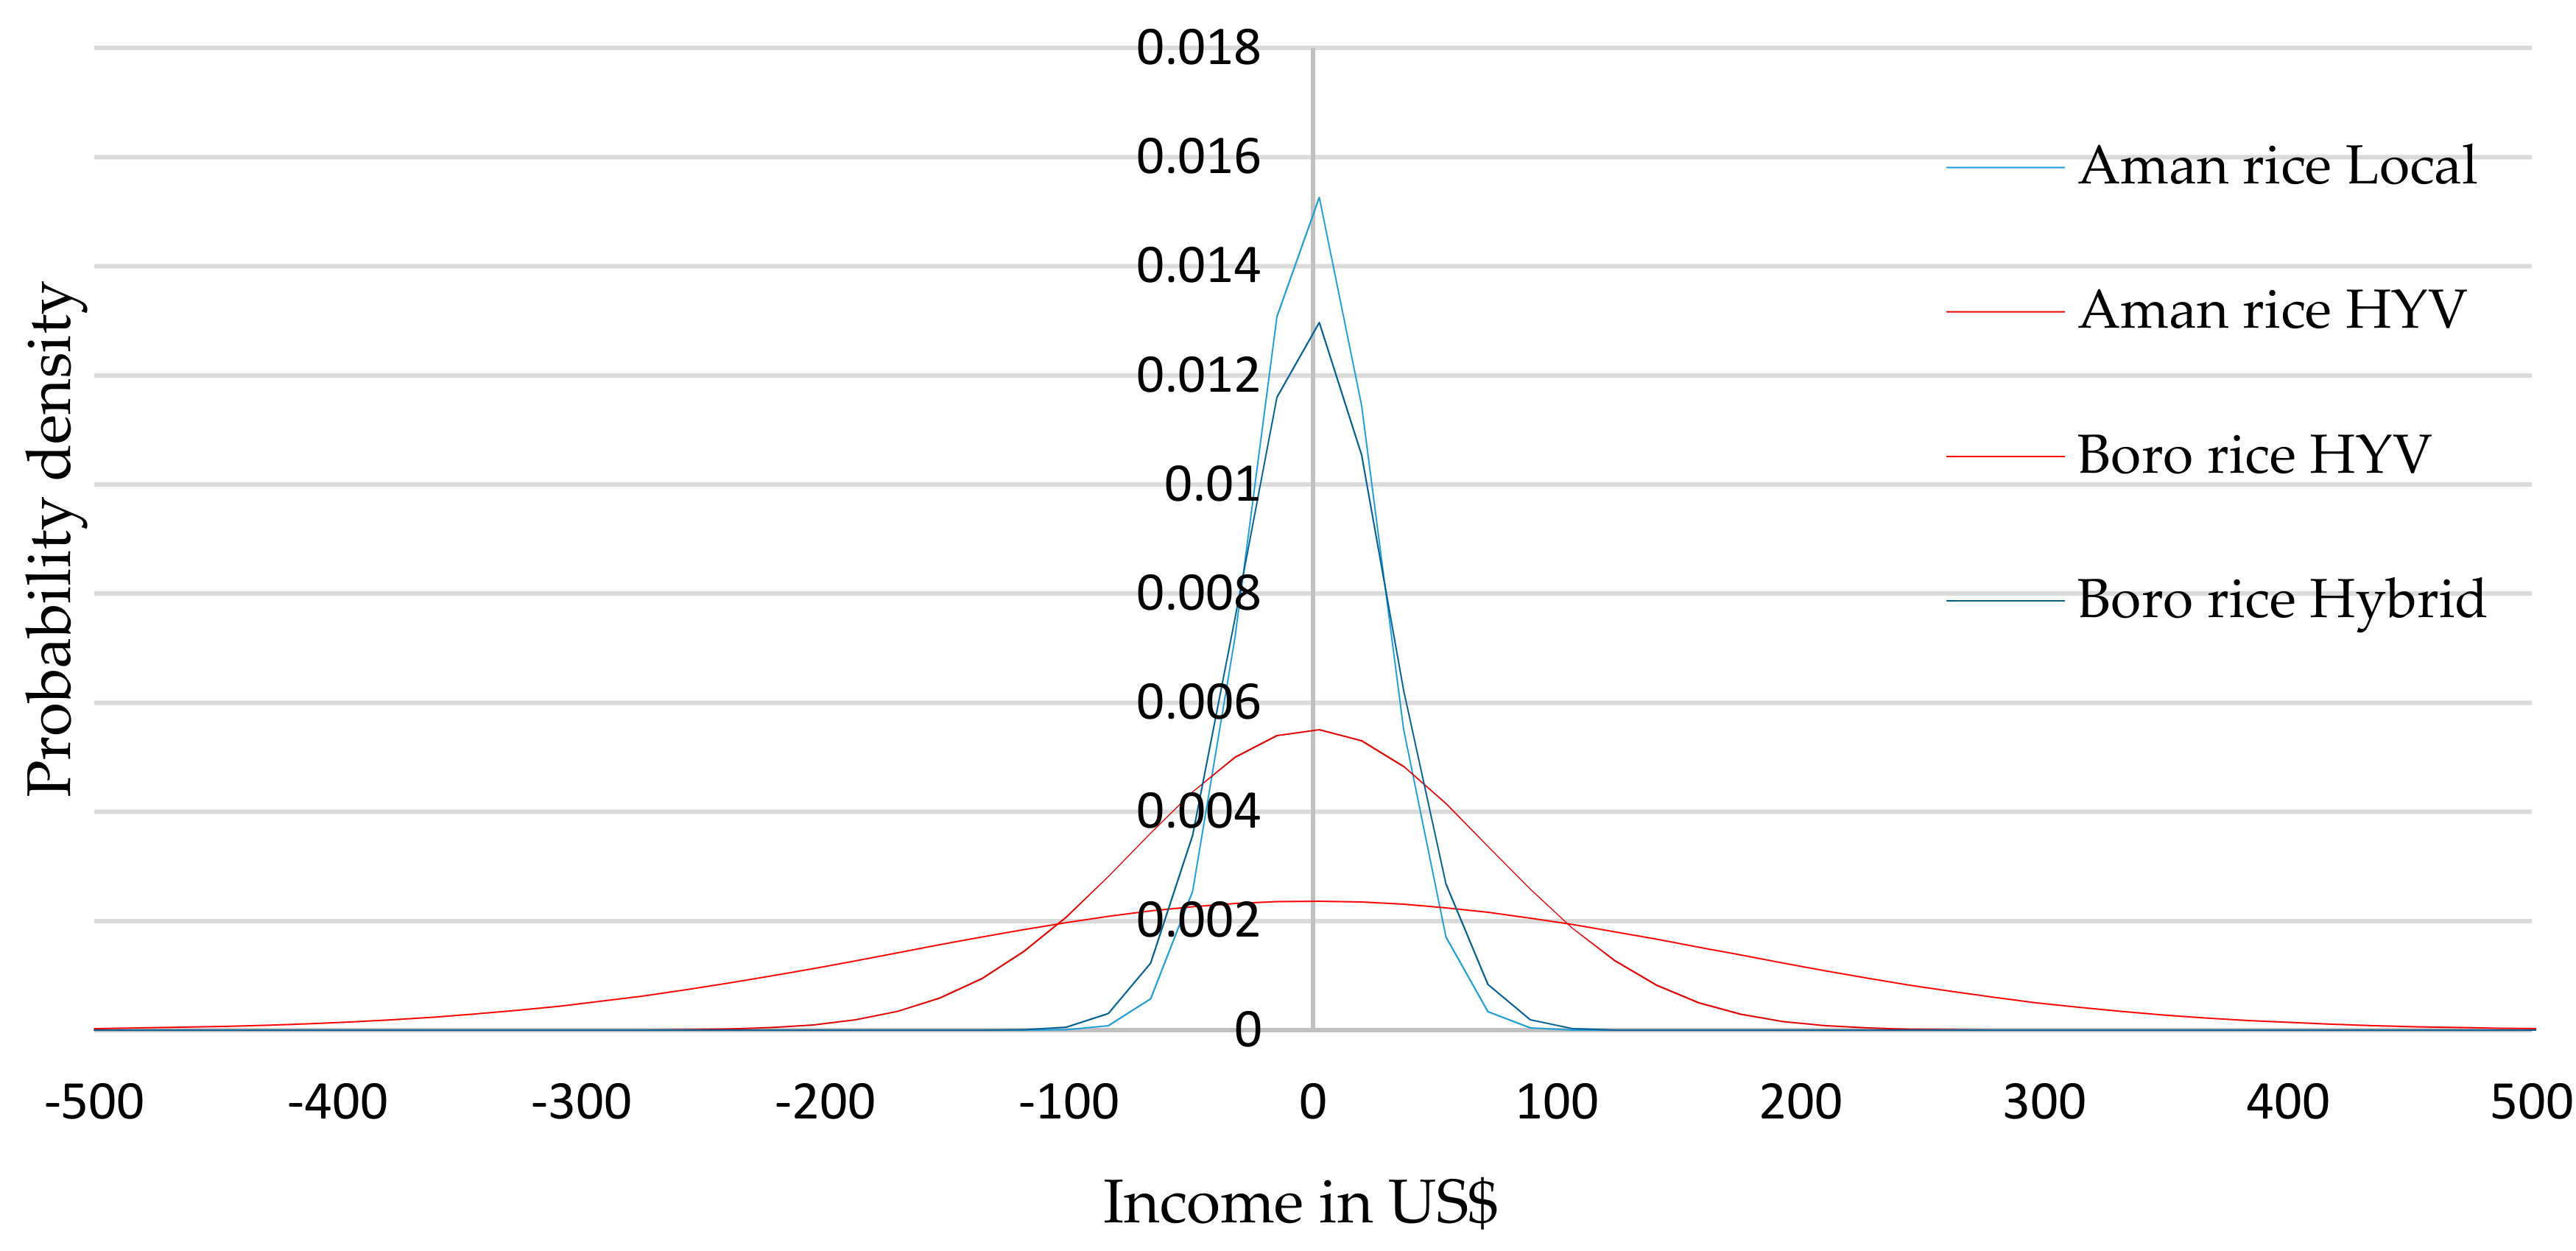
Table 7 obtained by the decomposed variance method. We estimate the variance component shares of crops for all farms across nine regions. From
Table 6, we identify that agriculture is one of the main reasons for income differences in Mymensingh, Rangpur, Barisal, Khulna and Rajshahi. The empirical estimates of
Table 7 indicate that the main variation in agricultural income comes from
aman HYV (g) and
boro HYV (j) rice. However, the results also display the contributions of other crop income to total agricultural income variation.
Rice is the leading crop in Bangladesh, accounting for more than 90% of total cereal production covering 75% of Bangladesh’s total cropped area [
45,
69]. For Mymensingh and Rangpur, variances in both
aman HYV and
boro HYV rice are high. For other regions, variances in
boro HYV are high.
All other crops(s) are among the main causes (44% variance share) of income differences for all of Bangladesh since all types of pulses, oil seeds, spices, vegetable, leafy vegetables and fruits are included in the group of “all other crops.” Moreover, all other crops(s) explain the larger contribution to total agricultural income variation because, in some regions, vegetables and fruits, among others, excluding rice, are important agricultural income sources.
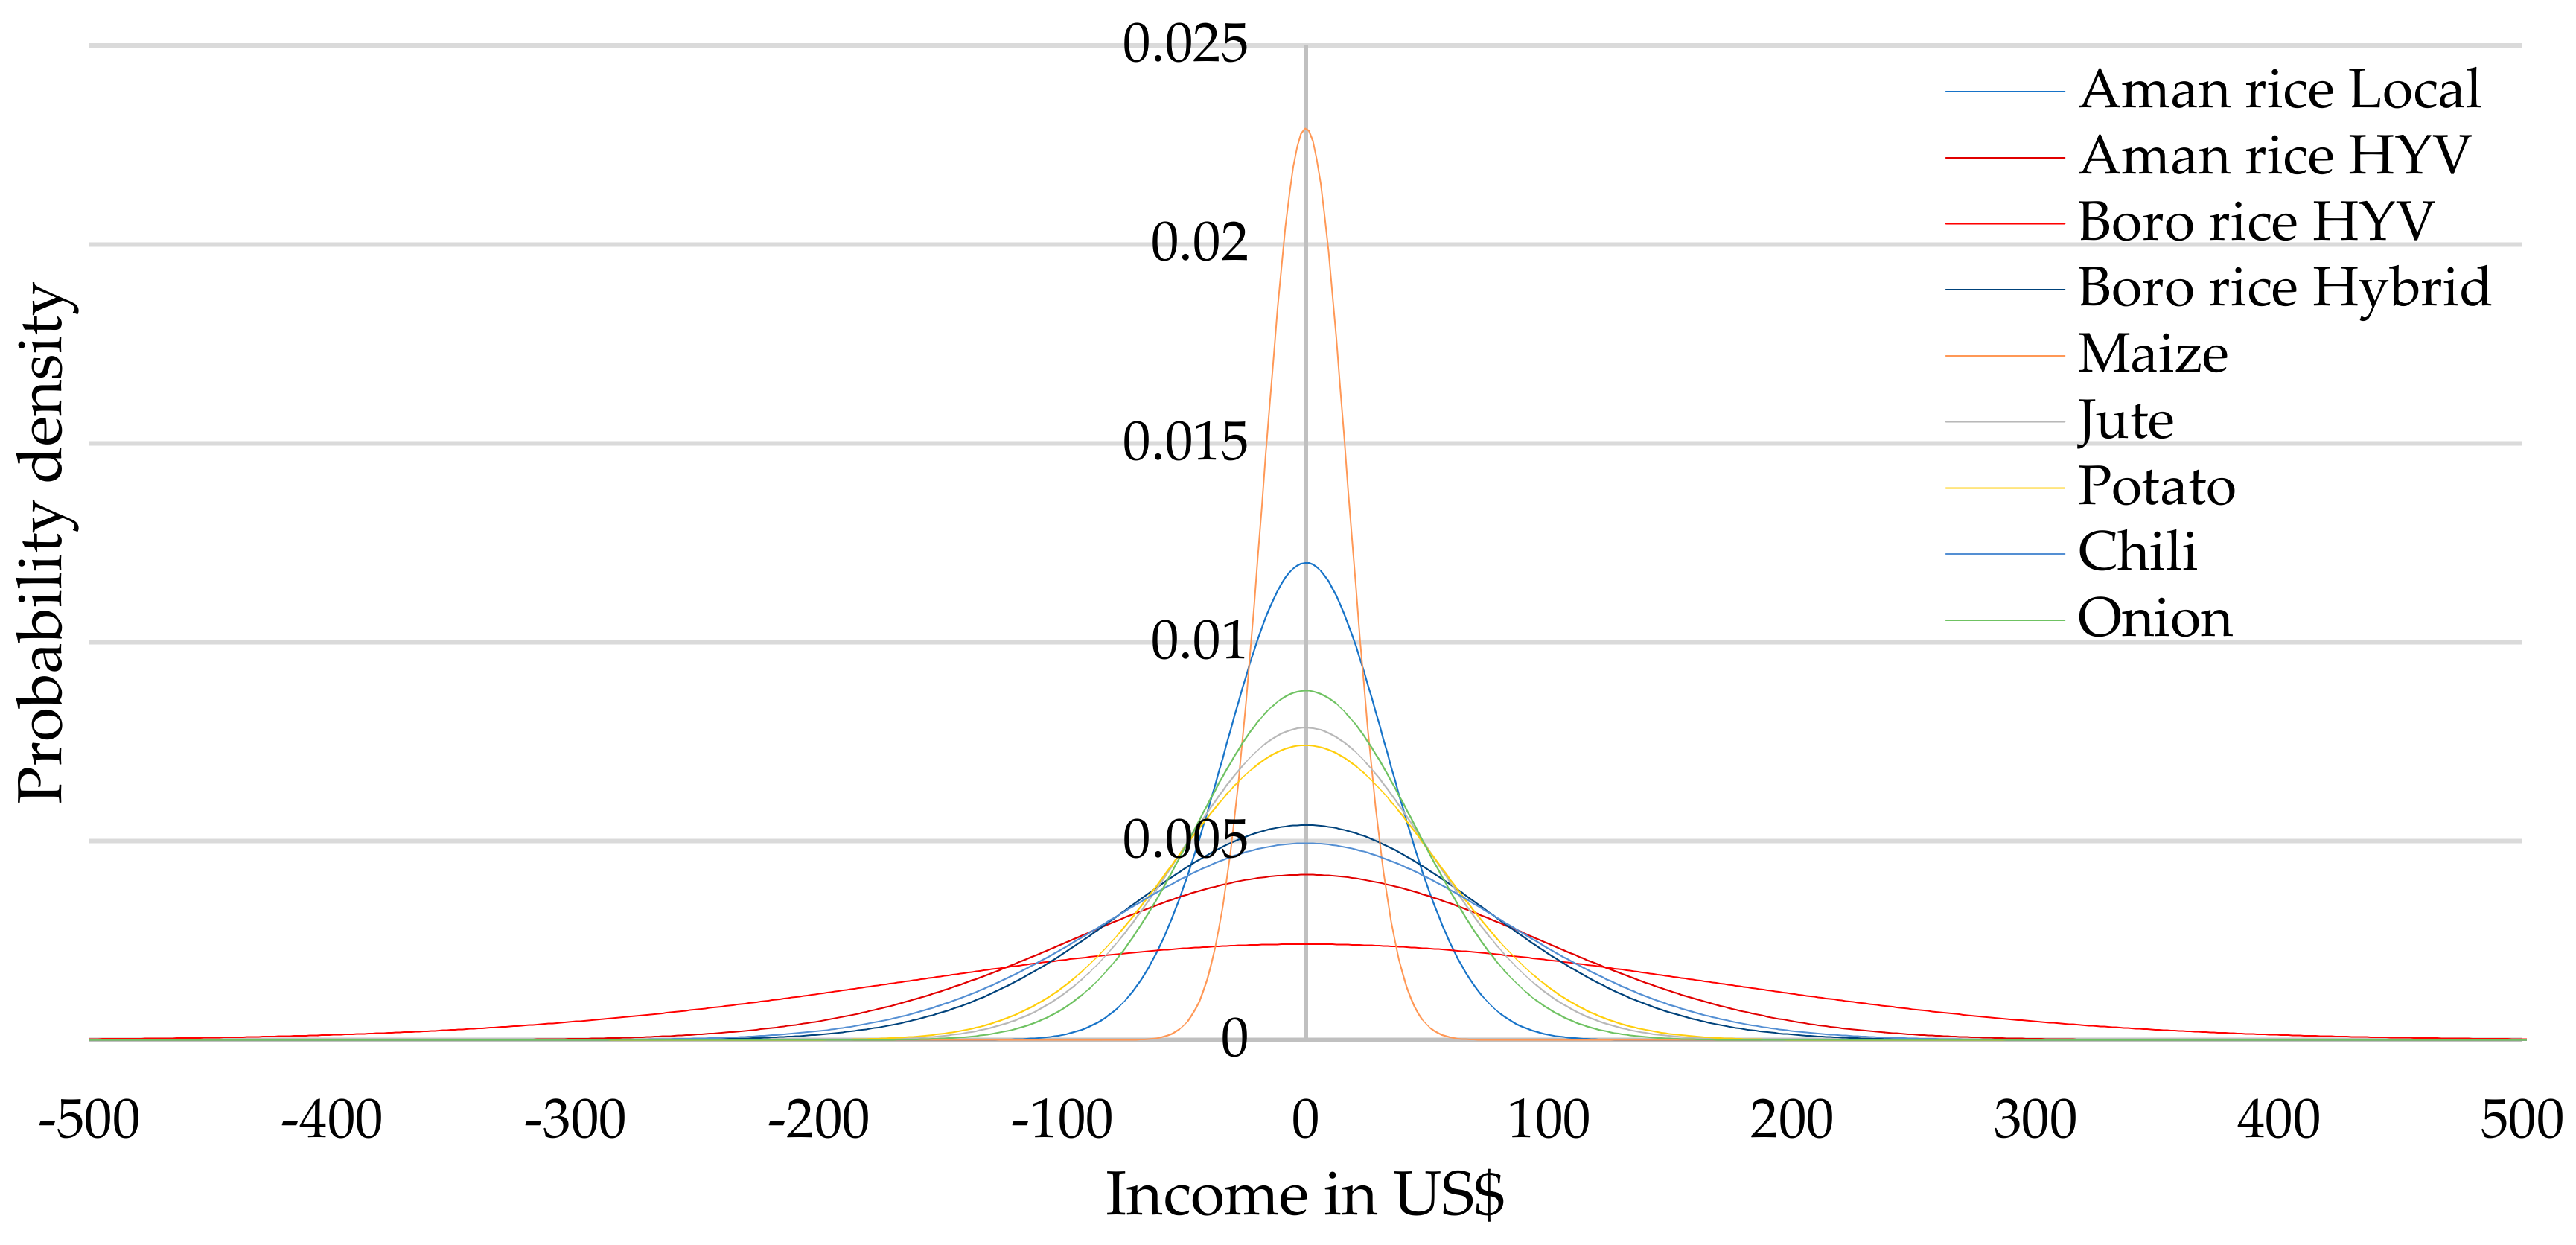
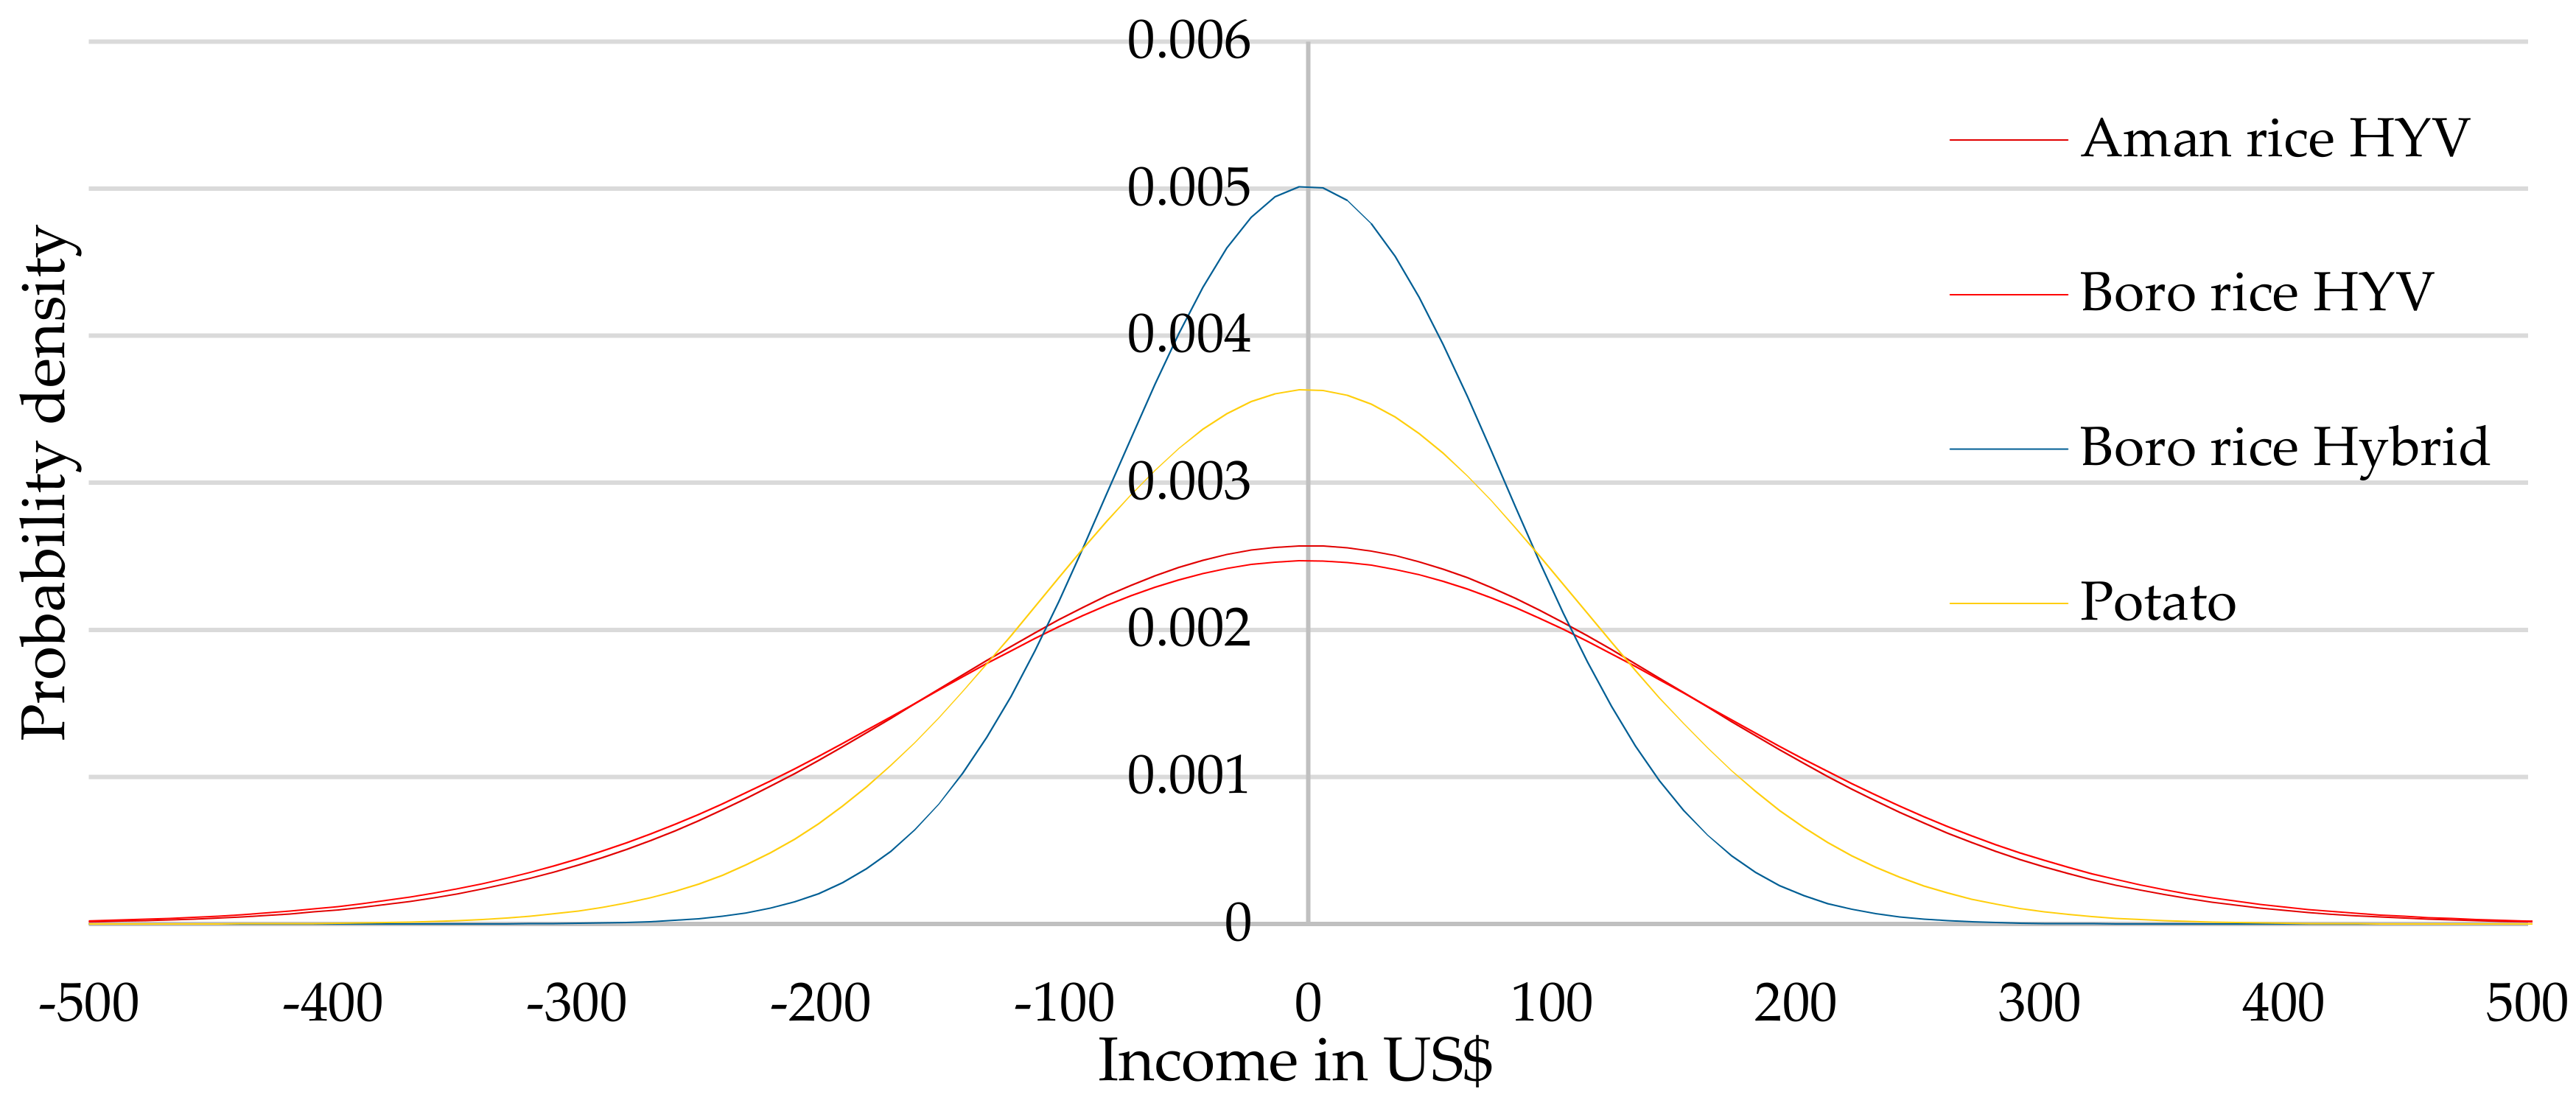
The distribution of crop income among total agricultural income for the whole country is shown in
Figure 7, which follows in
Figure 8 and
Figure 9 for Mymensingh and Rangpur, respectively, with selected crops mainly produced by farmers in these regions. We found that
boro rice has the widest variation in both the region and the highest inequality of total agricultural income, explained by the inequality of
boro HYV income.
4.5. Factors Contributing to Variations in Income from Aman HYV and Boro HYV Rice Production
According to the results of
Table 7, it is important to determine the factor causing the net income differences in
aman HYV production. From decomposed variance of gross income and gross cost, we find in
Table 8 that gross income is the main factor in net income difference, indicating that, although farmers in same region cultivated
aman HYV rice, their gross incomes were different.
These gross income differences mainly induce the net income disparities in Comilla, Khulna, Chittagong and Rangpur, while gross cost induces the income disparities in Dhaka and Barisal for
aman HYV rice. Additionally, gross cost also contributes to the total net income disparity of
aman HYV rice production. To determine the variance in gross cost for
aman HYV rice production, we estimate the variance component shares of all costs contributing to gross cost and present them in
Table 9.
The results show the factors responsible for large variations in cost from
aman HYV rice production. As shown in
Table 9, variances in seed (c) shows in third row, chemical fertilizer (g) in row seven and hired labor costs (k) in row eleven, are high across all regions. In Dhaka, the highest 80% of inequality of gross cost for
aman HYV rice production is explained by the inequality of hired labor cost (k), while in Barisal, the highest 25% inequality of gross cost is explained by inequality of seed cost. These costs were the main factors inducing the income differences in
aman HYV rice production. This result indicates the importance of farming knowledge and easy input access to rice cultivation.
In
Table 7, we note that
boro HYV also had an influence on agricultural income. It is essential to determine the factors affecting the net income variation for
boro HYV rice cultivation.
Table 10 summarizes the decomposed variance of gross income and gross cost from
boro HYV rice production and shows that gross income is the main factor in net income differences for
boro HYV rice production, except for in Chittagong and Sylhet. However, gross cost also contributes to the total net income disparity of
boro HYV rice production.
Next, we want to know which costs are the main factors in income differences in
boro HYV rice production. To know the variance in gross costs for
boro HYV rice production, we estimate the variance component shares of all cost expenditures contributing to gross cost and present them in
Table 11. We found that the variances in seed (c) shows in third row, irrigation (d) in row four, chemical fertilizer (g) in row seven and hired labor cost (k) in row eleven, are high in all regions, indicating that adaptation strategies, such as low input costs, have priorities for the large gross income variances of
boro rice cultivation.
These input costs were made the net income differences in this rice production for sample farmers. Based on the findings in
Table 11, it is also important to note that, in Chittagong region, the variance in hired labor cost (k) is highest (69.84%) while it is lowest in Comilla region (27.25%). This result implies that 69.84% of inequality of gross cost is elucidated by the inequality of hired labor cost in Chittagong region. As shown in the fourth row, irrigation cost (d) contributes a significant share of the variation of gross cost; the highest 22.93% of inequality of gross cost is explained by the inequality of irrigation cost in Dhaka, compared to the lowest in Chittagong. This result implies that reduction of input cost variances will ensure the low net income differences for this rice production. Farm households are not entirely self-sufficient regard the labor supply for their farming. In peak times of agricultural production, such as transplanting, weeding and harvesting, hired labor demand occurs. However, the labor supply is low in Chittagong due to hill tract areas of Bangladesh [
69], resulting in the higher costs of labor.
4.6. Future Projections
Production levels in agriculture, fishery and livestock raising are projected to change due to climate change [
39,
83]. We therefore sought to project the impact of rice yield change on the state of poverty in Bangladesh. If rice is a commercial crop, a price hike due to any damage from climate change could increase Bangladeshi farmers’ living standards. However, rice remains a subsistence crop among most Bangladeshi farmers; therefore, we assume that rice yield reduction will lead to a rice consumption reduction.
The effects of climate change on rice yields, as has been estimated and shown by International Food Policy Research Institute [
37], are such that, without adaptation to climate change impacts,
aman HYV and
boro HYV rice yields will decline by 3.5% and 10.2%, respectively, in Bangladesh. According to the Geophysical Fluid Dynamics Laboratory (GFDL) scenarios, if temperature changes by 4.0 °C, then 17% decline in overall rice will occur in Bangladesh [
84].
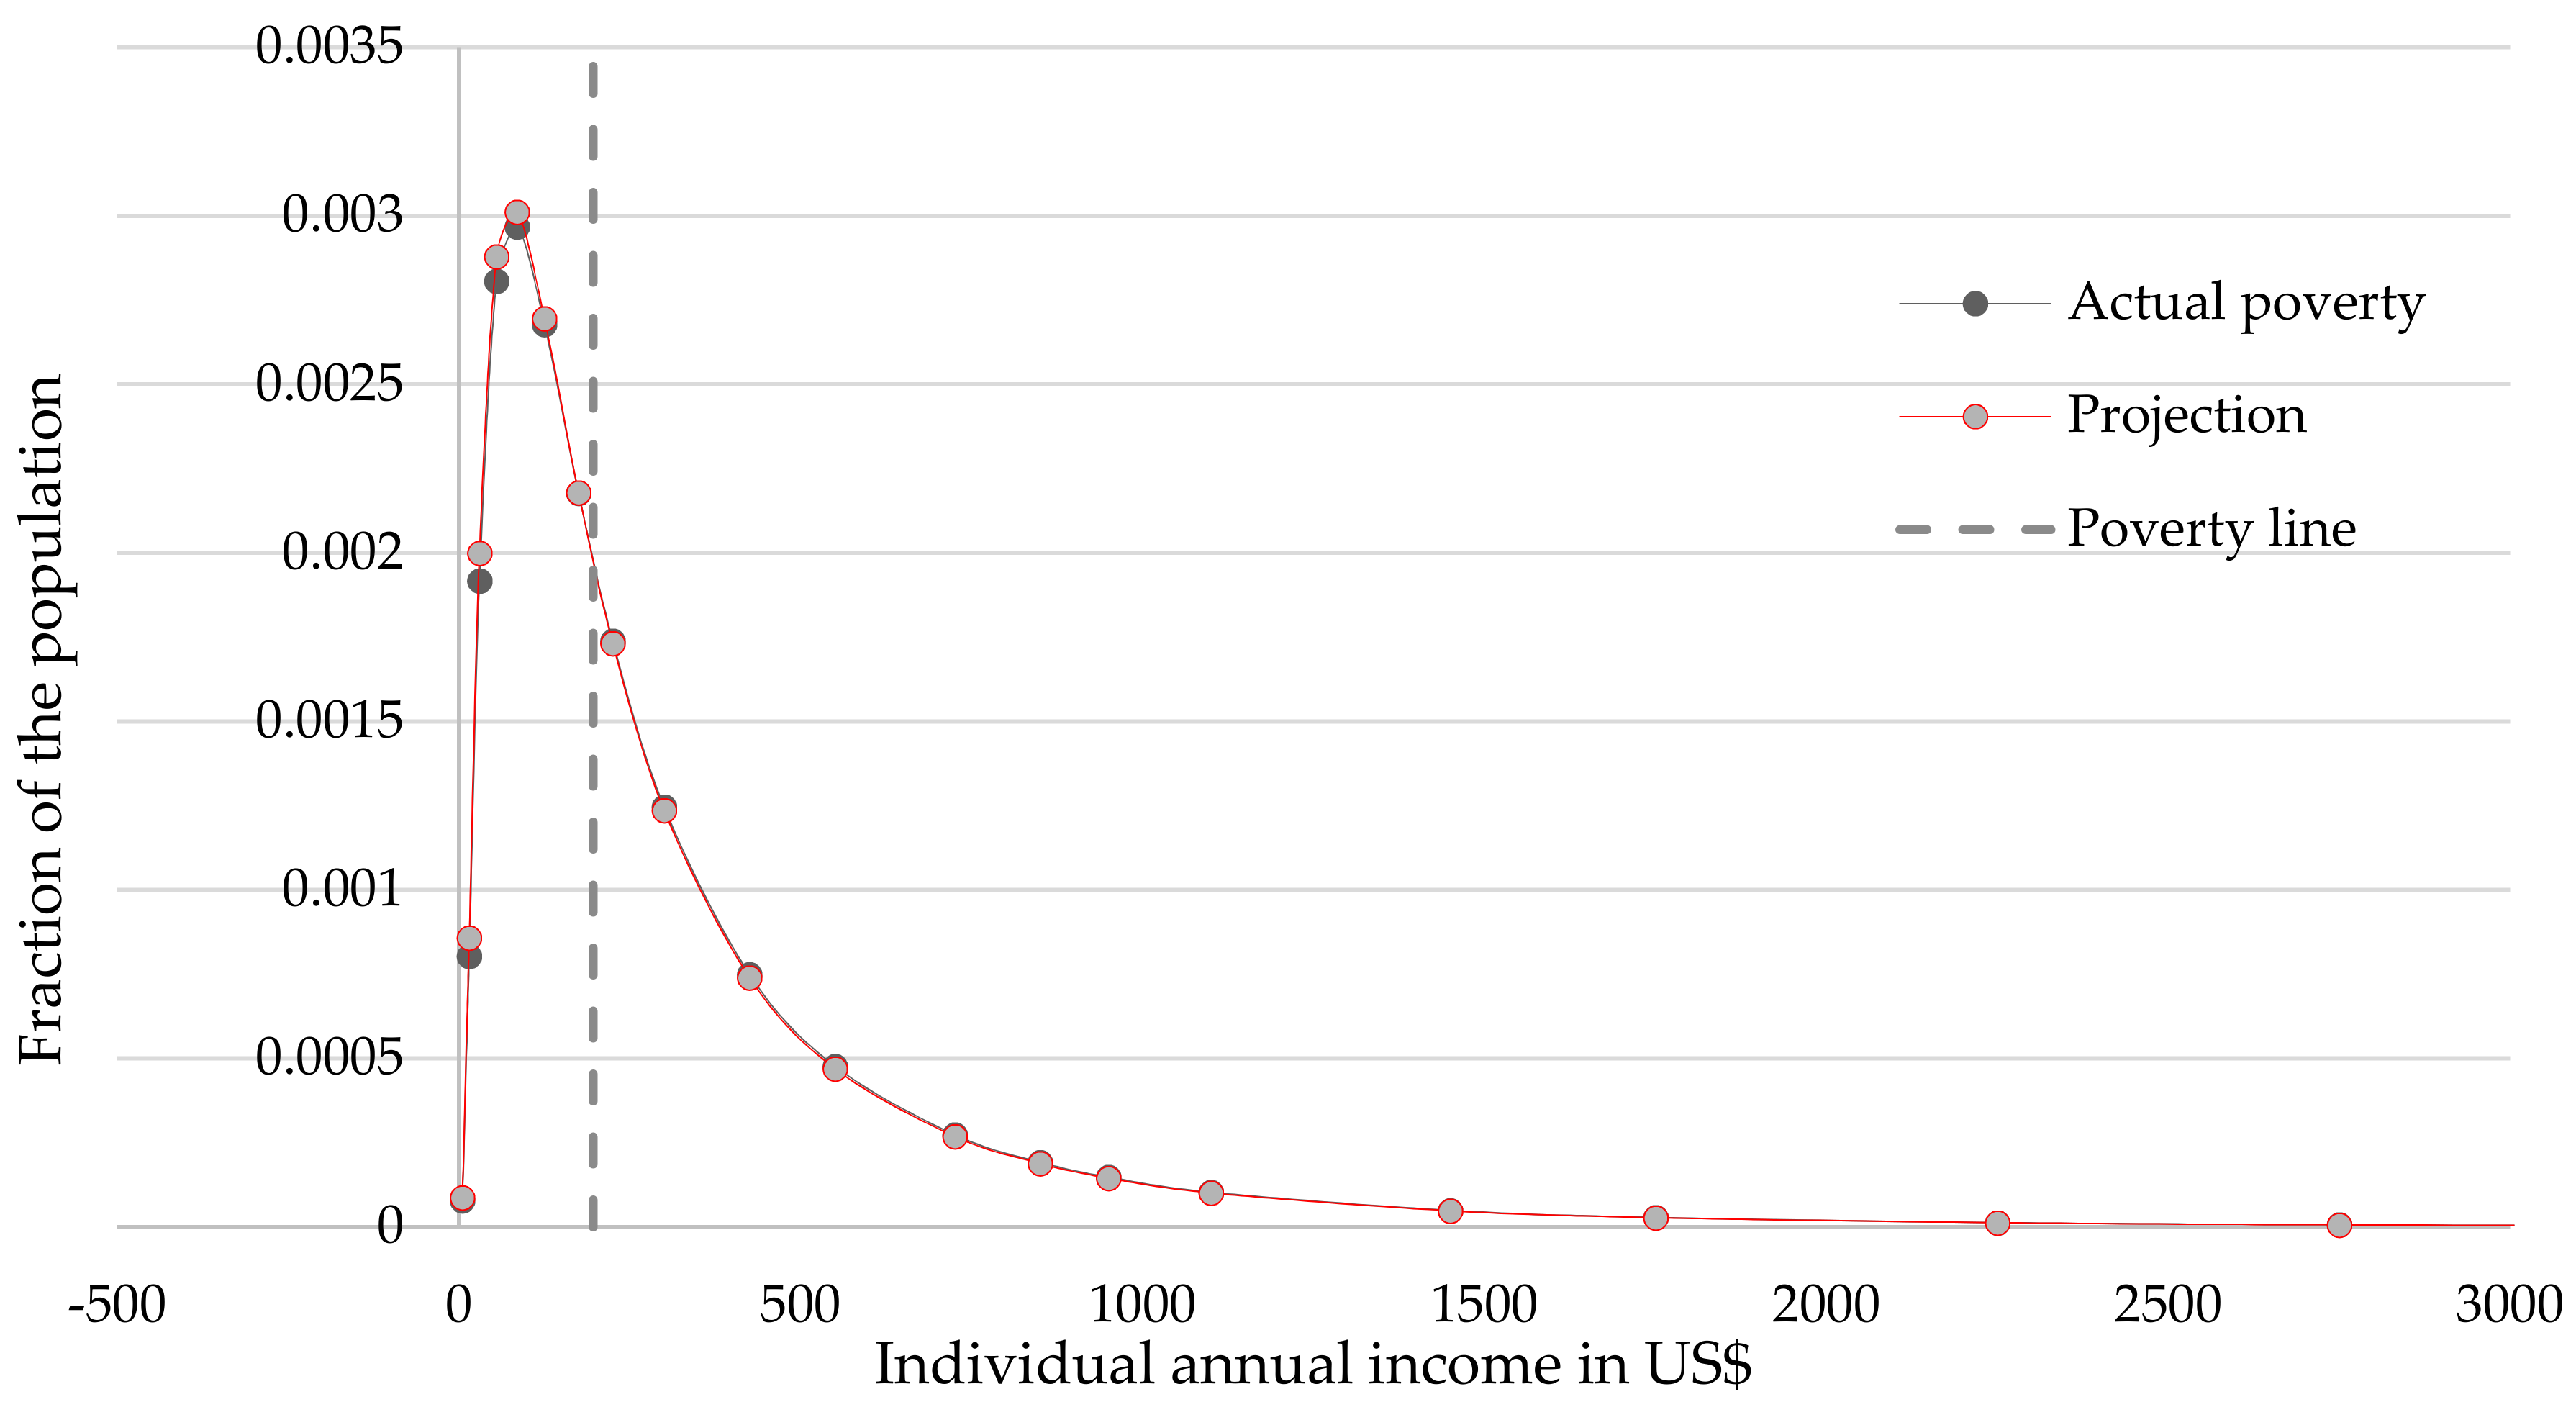
According to this projection, we assumed that, due to climate change effects on boro HYV and aman HYV, rice yields will be reduced by 10% and 4%, respectively, as well as a 17% reduction in overall rice among the sample households. We applied log-normal distribution to project the poverty rate due to income reduction by yield loss on the effects of climate change.
Figure 10 shows the annual per-capita income (actual and projected) in US
$ of the sample households across Bangladesh. In general, one can see from this figure that the sample population density (i.e., probability density) mostly lies within the low annual per-capita income range, which is less than the poverty line. Additionally, the probability density of the low-income range increases in the projected income distribution when one considers rice yield loss due to climate change.
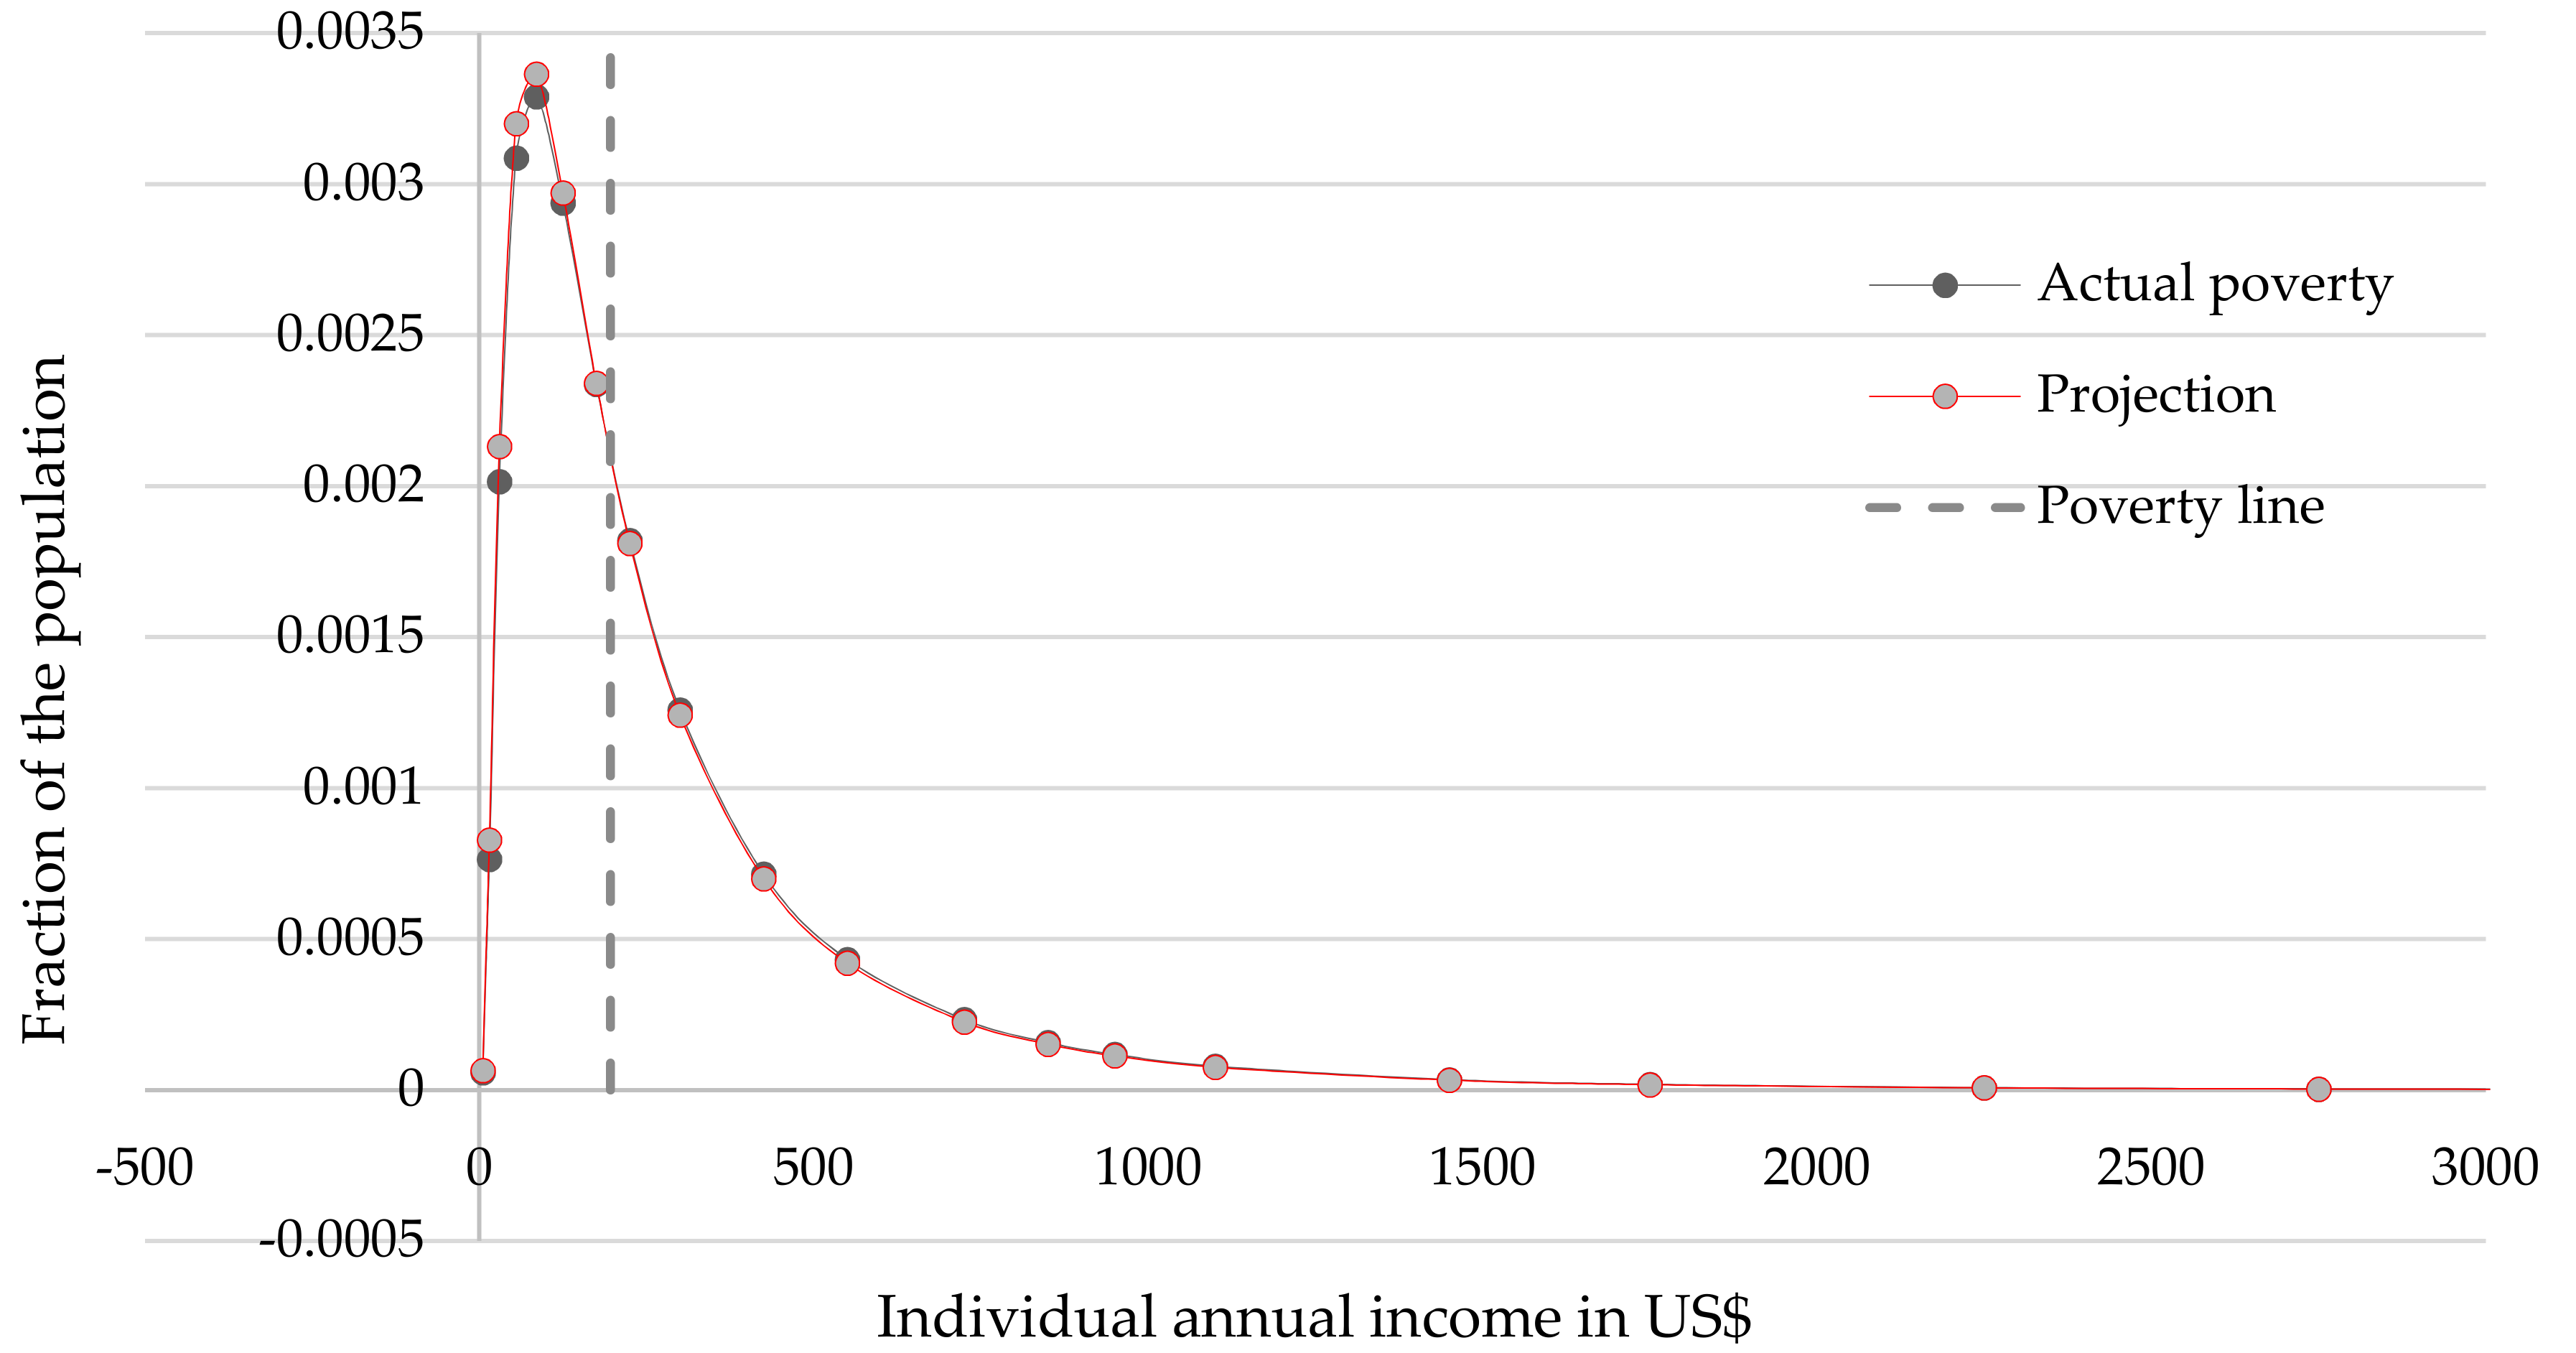
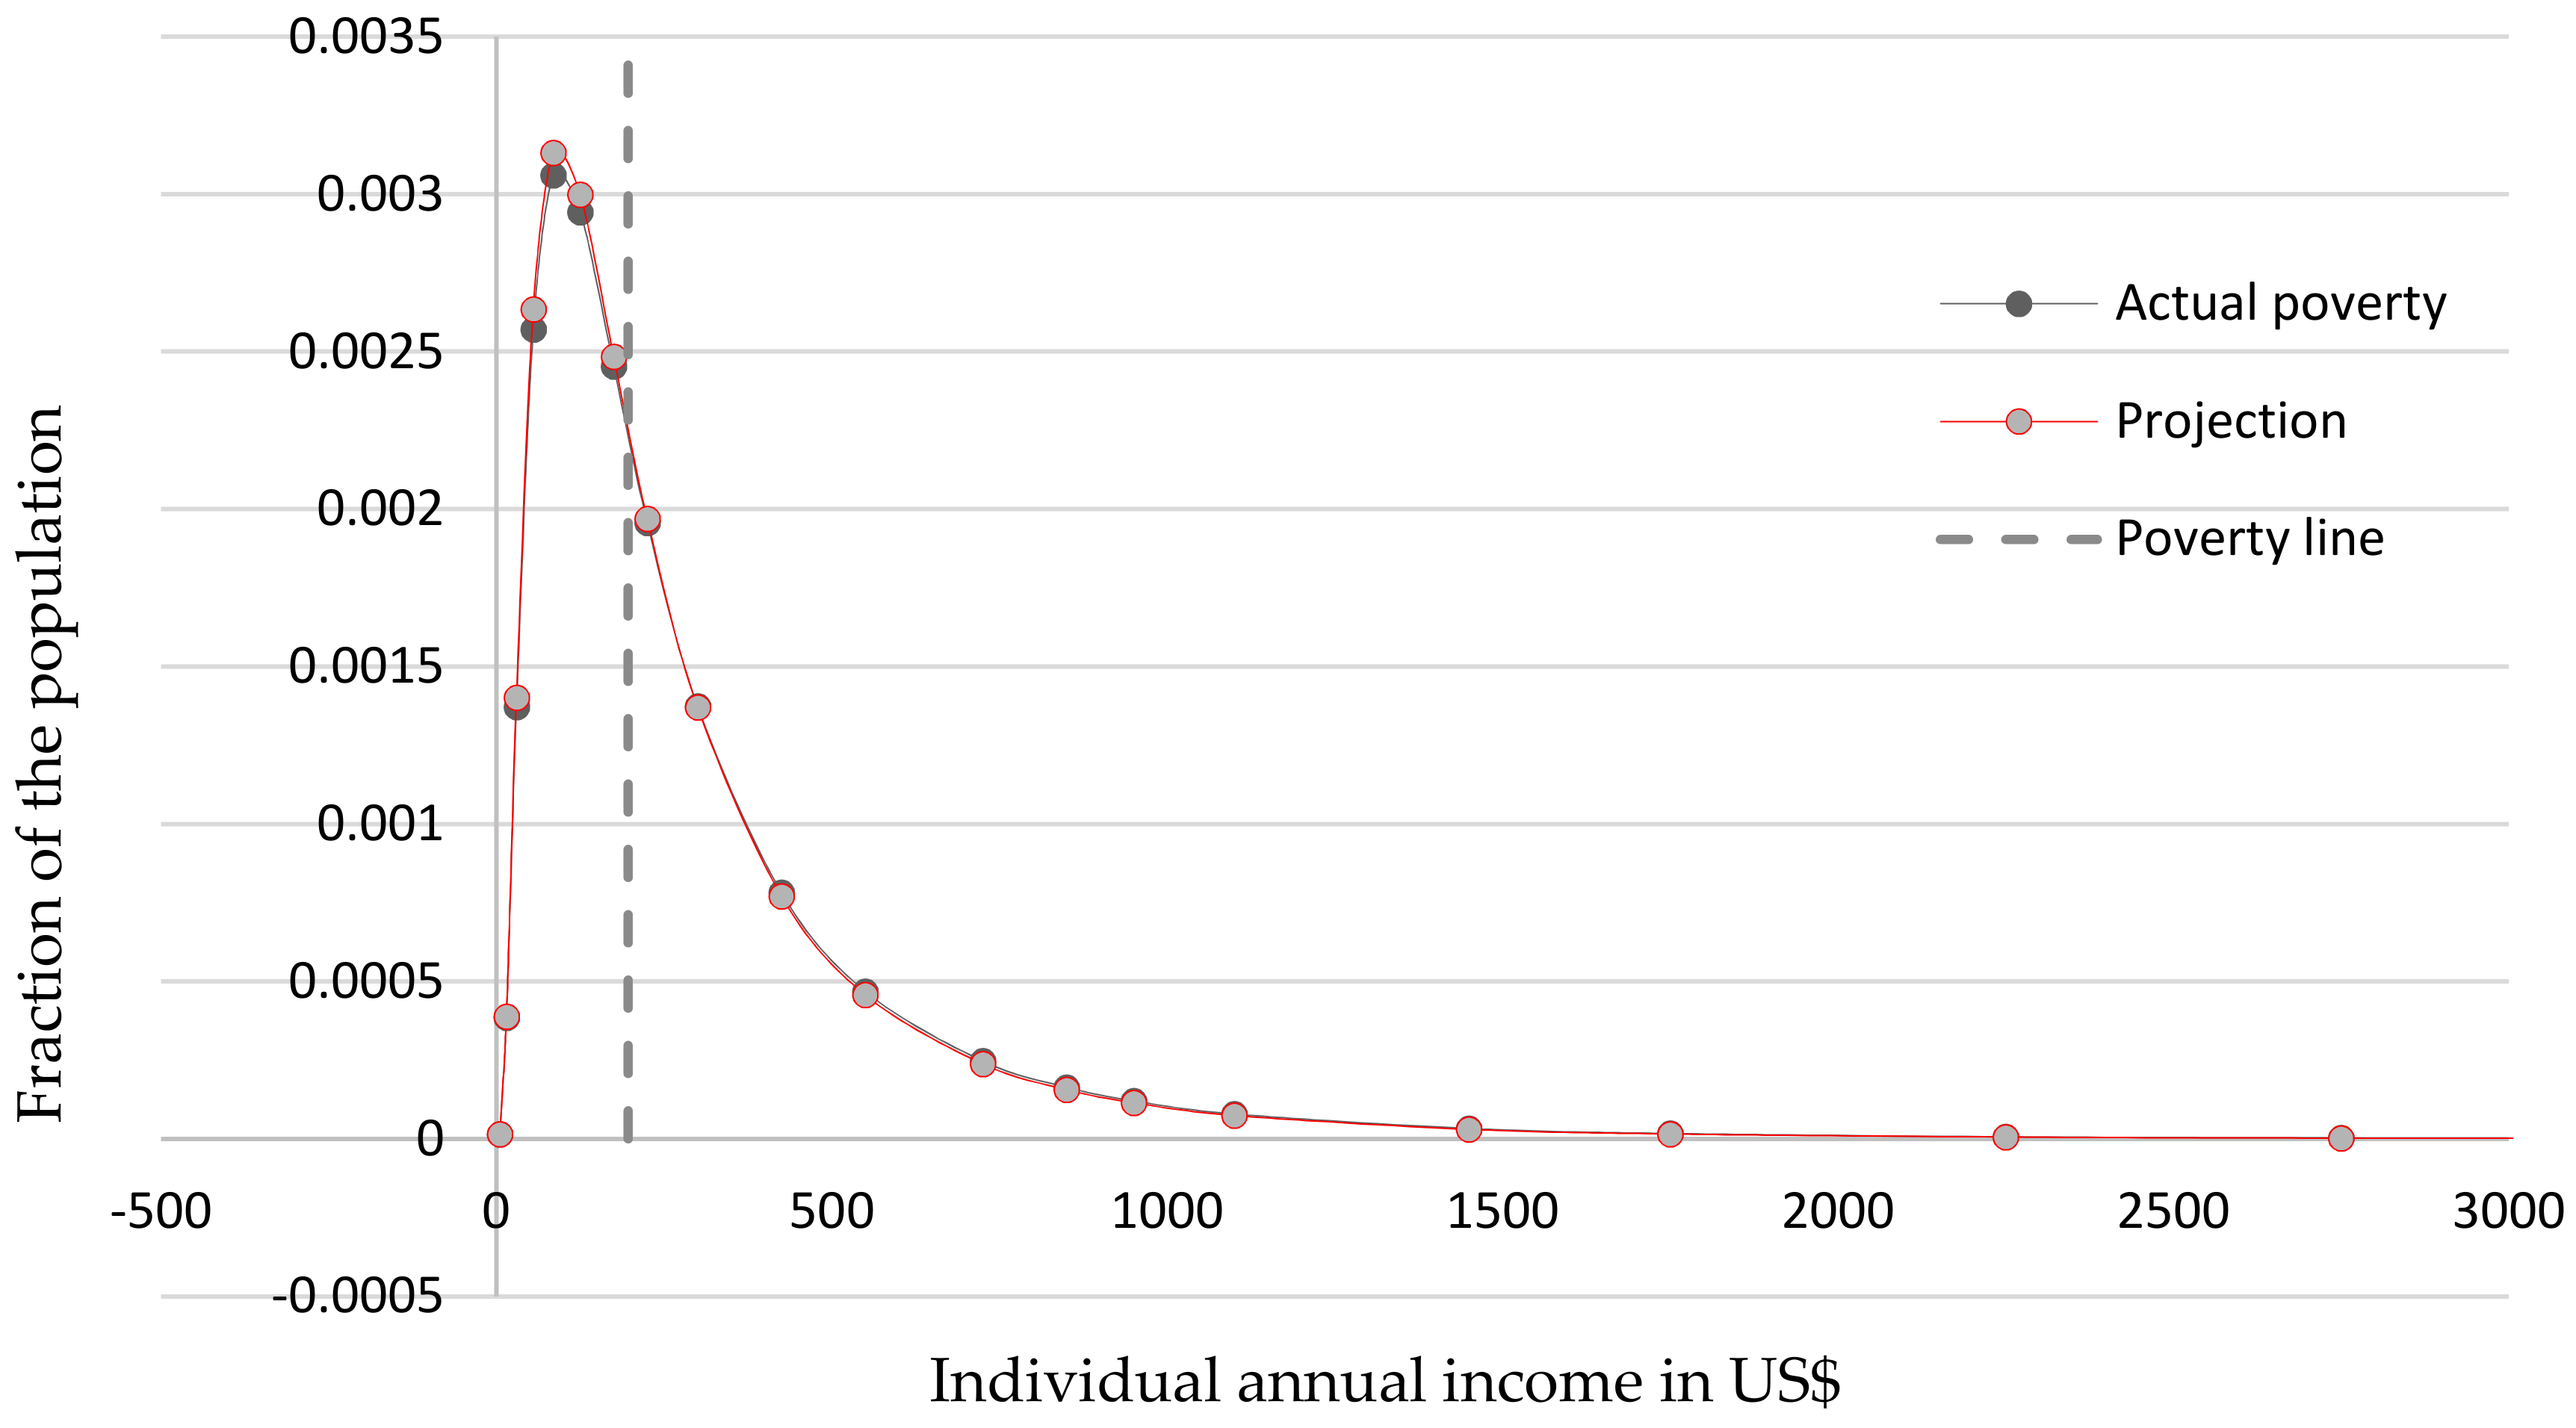
From the decomposed variance share of income sources in
Table 9, we found that agriculture was the main reason for income differences in Mymensingh and Rangpur. Now, we can examine the effects of climate change on rice production (10% and 17% losses) in these two regions by log-normal distribution.
We analyzed and found that constant reduction of rice yield (10% loss) by climate change in Bangladesh is not such a severe problem for farmers. Because the change in net per-capita income is very small, there is not a dramatic change of poverty rate. However, if unexpected extreme events, such as floods, flash floods, droughts and sea level rise, occur in specific areas of Bangladesh, they create a more vulnerable situation for the farmers’ livelihood. In addition, the probability density of low-income range increases (
Figure 11 and
Figure 12) in both Mymensingh and Rangpur districts, where rice income decreases due to climate change.
We also applied the same analysis in
Figure 10,
Figure 11 and
Figure 12 to all of the regions and
Table 12 shows the results of the poverty rate after income changes due to assumed yield losses of
aman HYV,
boro HYV rice and overall rice.
The estimated results suggest that rice yield loss would reduce the annual per-capita income of the sample farm households and increase the poverty rate in various regions across Bangladesh. It was found that the highest poverty rate increase (3.024%) would occur in Mymensingh, Rajshahi (3.715%) and Rangpur (2.381%). Rajshahi and Rangpur are in northwestern Bangladesh and are prone to drought; climate change would affect rice production specifically in the summer, when boro rice is being produced. Mymensingh is affected by floods, flash floods and heavy rainfall each year, owing to the effects of climate change on aman and boro harvests.
Climate Change Impact Scenario
Extreme events, such as floods, droughts and changes in seasonal rainfall patterns, negatively impact crop yields in vulnerable areas [
85,
86,
87]. In Bangladesh, the rural poverty rate would be exacerbated [
88] as a result of the impacts of extreme events on the yield of rice crop and increases in food prices and the cost of living [
89,
90]. The impacts of climate change on poverty would be heterogeneous among countries [
91]. Due to the impact of climate change, rice production would decrease and some rice exporting countries, such as Indonesia, the Philippines and Thailand, would benefit from global food price rises and reduced poverty, while Bangladesh would experience a net increase in poverty of approximately 15% by 2030 [
89,
91].
Climate change refers to changes in climate attributed directly as temperature, precipitation, CO
2 concentrations and solar radiation or indirectly as river floods, flash floods and sea level rise that alter the composition of the global atmosphere, as well as to natural climate variability observed over comparable time periods [
33,
50].
Temperature Increase
Temperature is an important factor for
boro rice production and the maximum temperature is always more vulnerable with a negative impact on rice yields. In Bangladesh, seasonal temperature suddenly fluctuates, causing drastically declines in the yield of
boro rice.
Boro rice yields decrease by a maximum of 18.7% due to an increase in minimum temperature of 2.0 °C–4.0 °C and by 36.0% for 2.0 °C–4.0 °C maximum temperature increases in different location of Bangladesh in 2008 [
92]. According to the Intergovernmental Panel on Climate Change (IPCC), SRES emissions scenarios and climate models being considered, global mean surface temperature is projected to rise in the range of 1.8 to 4.0 °C by 2100 [
93]. Following the previous assessment, the IPCC concludes in their fifth assessment report (AR5) that it will be difficult to adapt with large-scale warming of approximately 4°C or more, which will increase the likelihood of severe, pervasive and irreversible impacts [
91,
94,
95].
According to the previous projection of temperature fluctuations in Bangladesh, we assume that, due to the maximum and minimum temperature fluctuations, in the future, the overall rice production will decrease by approximately 17% of the sample farmers and results are shown in
Table 12. The table shows that maximum 3.7% poverty will increase in Rajshahi and second highest (3.0%) in Mymensingh region and this implies that it is important to adaptation strategies for Rajshahi and Mymensingh for high temperature.
Rainfall Decreases (Drought)
Inadequate rainfall leads to greater drought frequency and intensity, while increased evaporation increases the chance of complete crop failure [
96,
97]. Drought is the most widespread and damaging of all environmental stresses [
35,
98]. In South and Southeast Asia, including some states of India, severe drought affects rain-fed rice and yield, with losses as high as 40% and the total area affected measuring 23 million hectares, amounting to
$800 million [
99]. Bangladesh experienced severe drought in different years and locations in the districts of the northwestern border [
100]. Erratic rainfall and drought reduce crop production by 30% and 40%, respectively [
84].
Boro rice production will decrease due to rainfall in winter [
92]. This study noted that, with 5-mm and 10-mm rainfall reductions in the future,
boro rice will decrease by a maximum of 16.6% and 24.2%, respectively, in the winter. Drought caused 25% to 30% crop reduction in the northwestern part of Bangladesh based on from 2008 [
101]. Due to the high rainfall variability and dryness, the northwestern region is the most drought-prone area in Bangladesh [
102,
103]. Rajshahi, Chapai-Nawabganj, Naogaon, Natore, Bogra, Joypurhat, Dinajpur and Kustia districts are drought prone areas in Bangladesh because of their moisture-retention capacity and infiltration rate characteristics [
104].
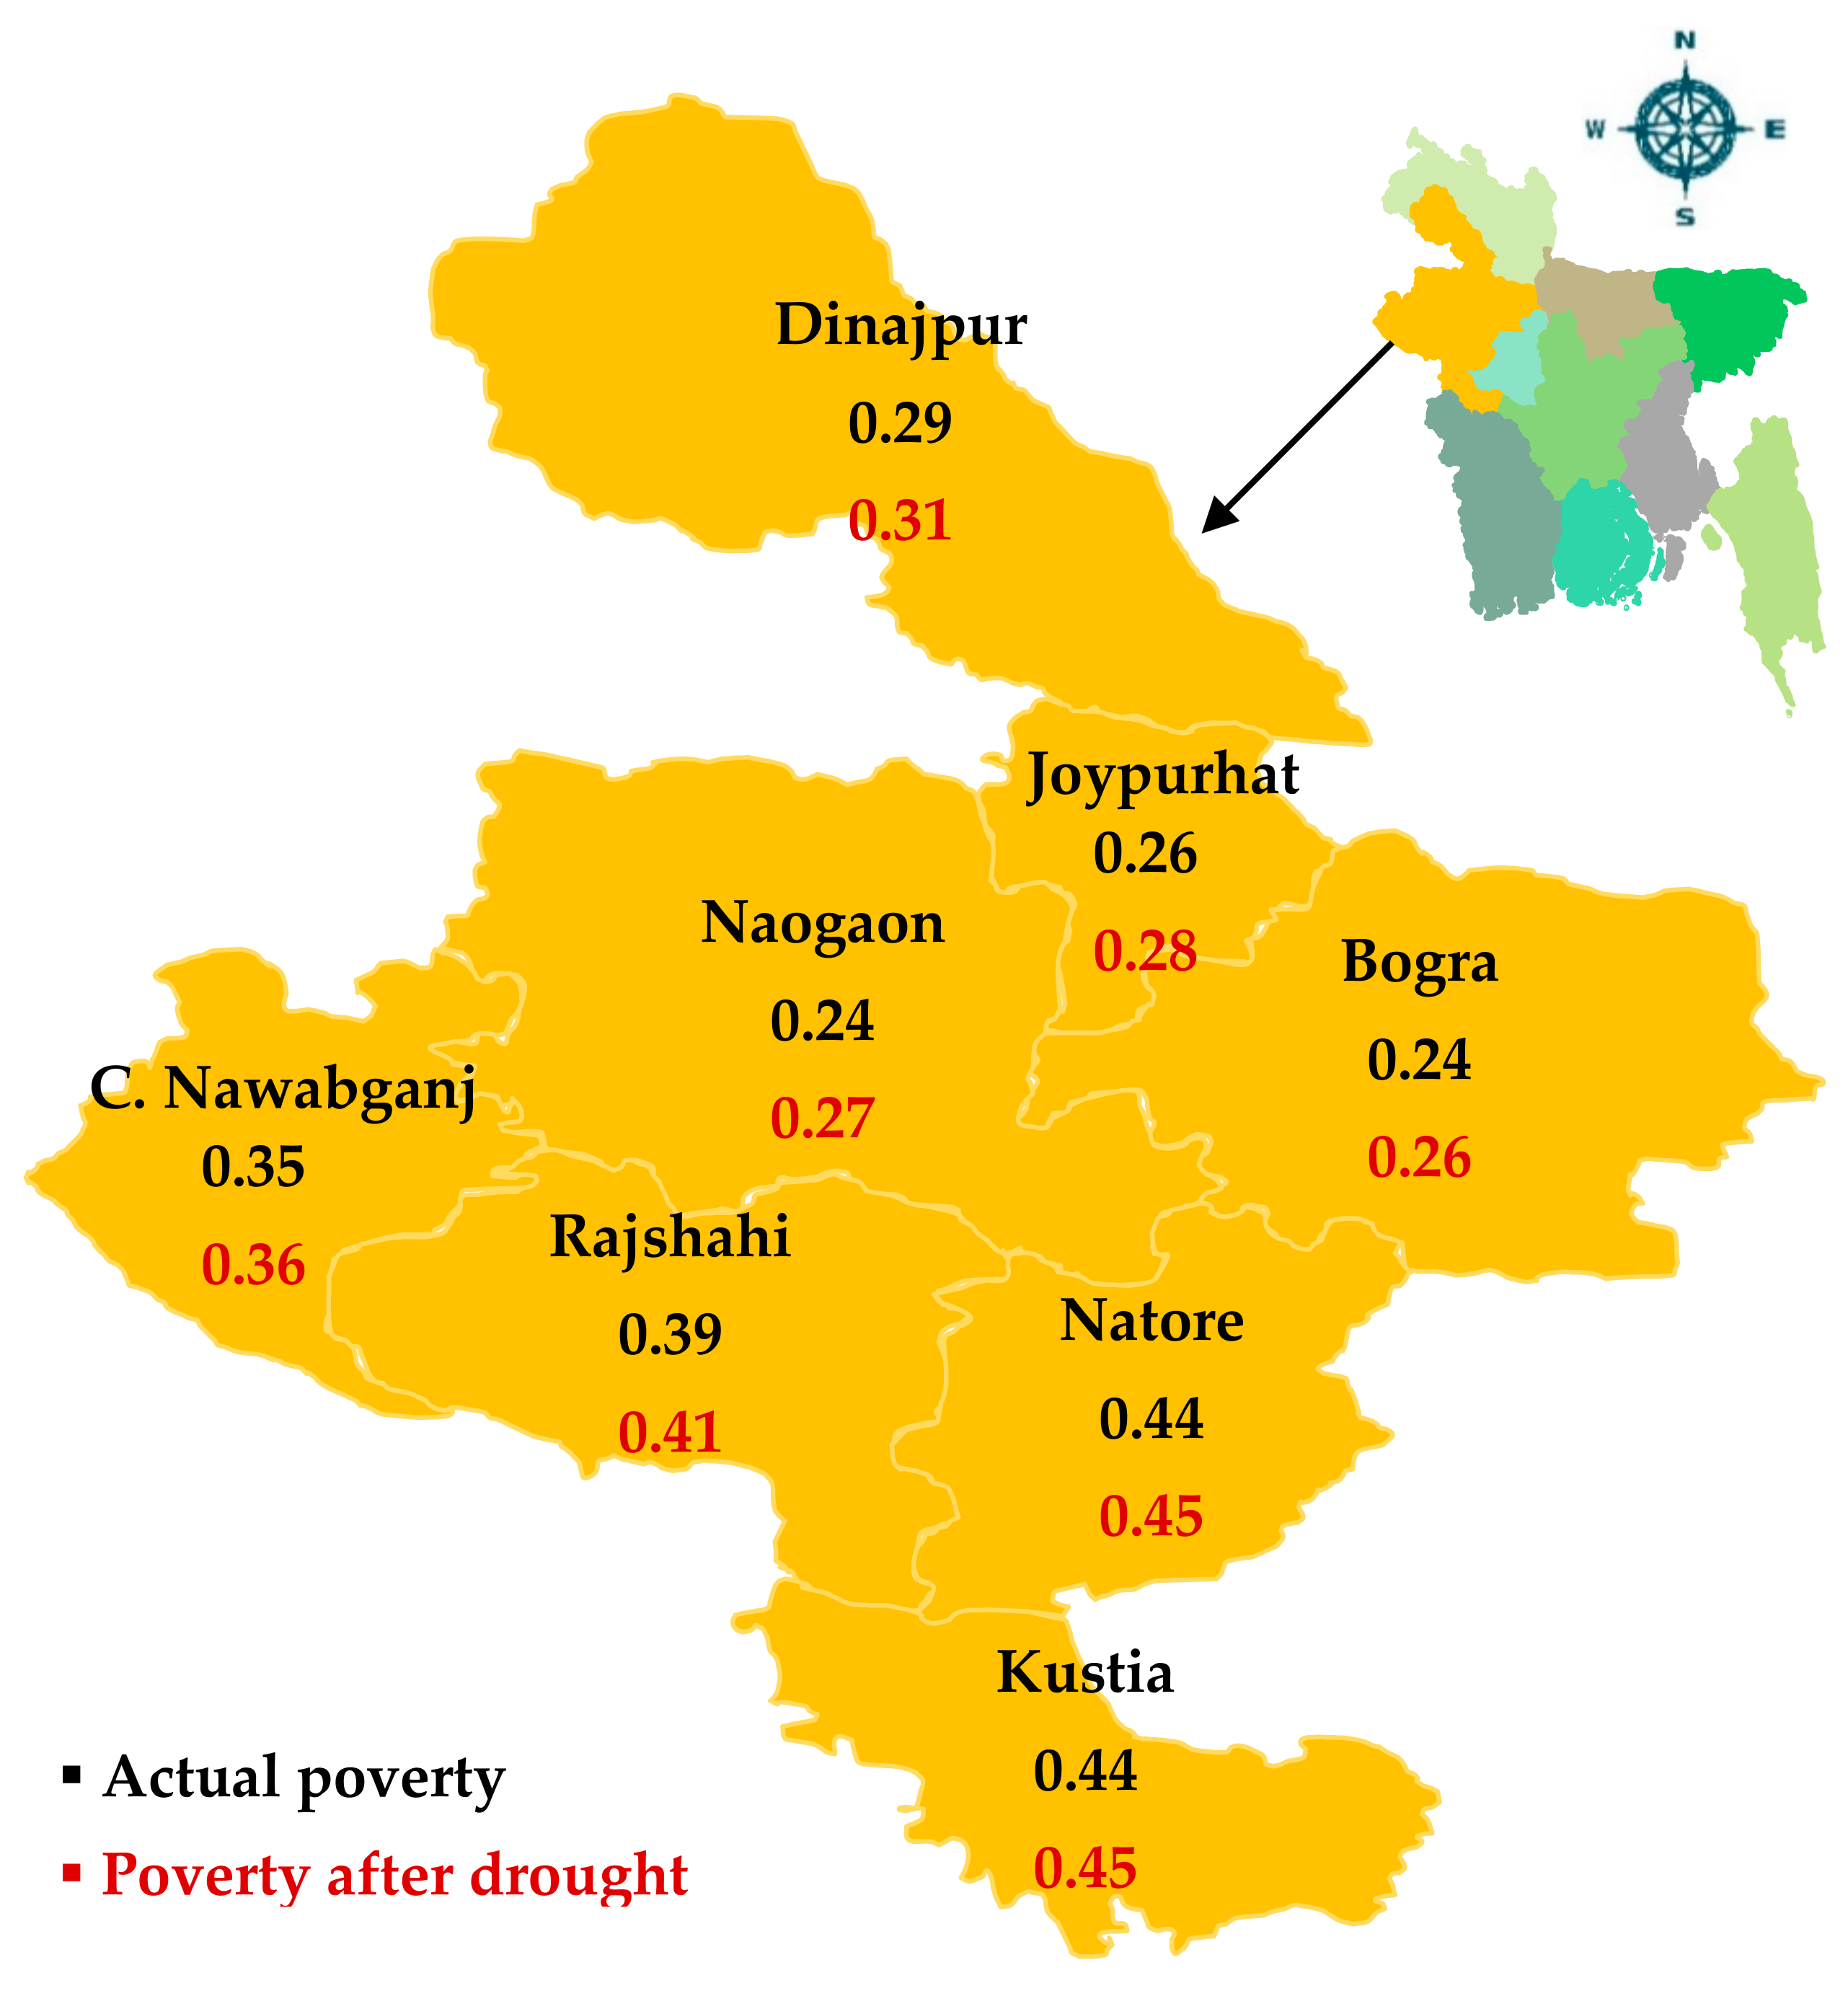
According to the previous projection of drought, we assume that, if rainfall decreases and drought occur in the future, the overall rice production will decrease by approximately 20% of the sample farmers in northwestern districts of Bangladesh. By using log-normal distribution, we project the poverty rate due to income reduction by yield loss because of drought.
Table 13 shows the results of the poverty rate (
Figure 13) after income changes due to assumed yield losses of overall rice by drought in the northwestern region in Bangladesh, while the Dinajpur (10.175% poverty increase), Rajshahi (5.670% poverty increase) and Naogaon (11.245% poverty increase) districts are most vulnerable to poverty. Dependency on agriculture with high variability of annual rainfall has made the northwestern regions highly susceptible to droughts and high poverty rates, compared to other parts of the country. Conservation of water could play an important role in reducing the impact of drought and alleviating poverty in this area [
103].
Flood
From the GBM basins, the monsoonal discharge of water causes seasonal floods and affects most of the areas of Bangladesh, with extent varying by year [
50]. Floods occur almost every year and in 1998, floods covered almost 70% of total land area in Bangladesh, causing the maximum damage by floods in Bangladesh [
105]. According to the IPCC’s fourth assessment report, the intensity and frequency of floods and cyclones will increase in the near future [
33]. Moreover, the IPCC’s fifth assessment report (AR5) predicts that greater risks of flooding will increase on the regional scale [
91,
94,
95,
96,
97,
98,
99]. In addition, extreme flood events will reduce crop production by 80% in Bangladesh [
37,
84].
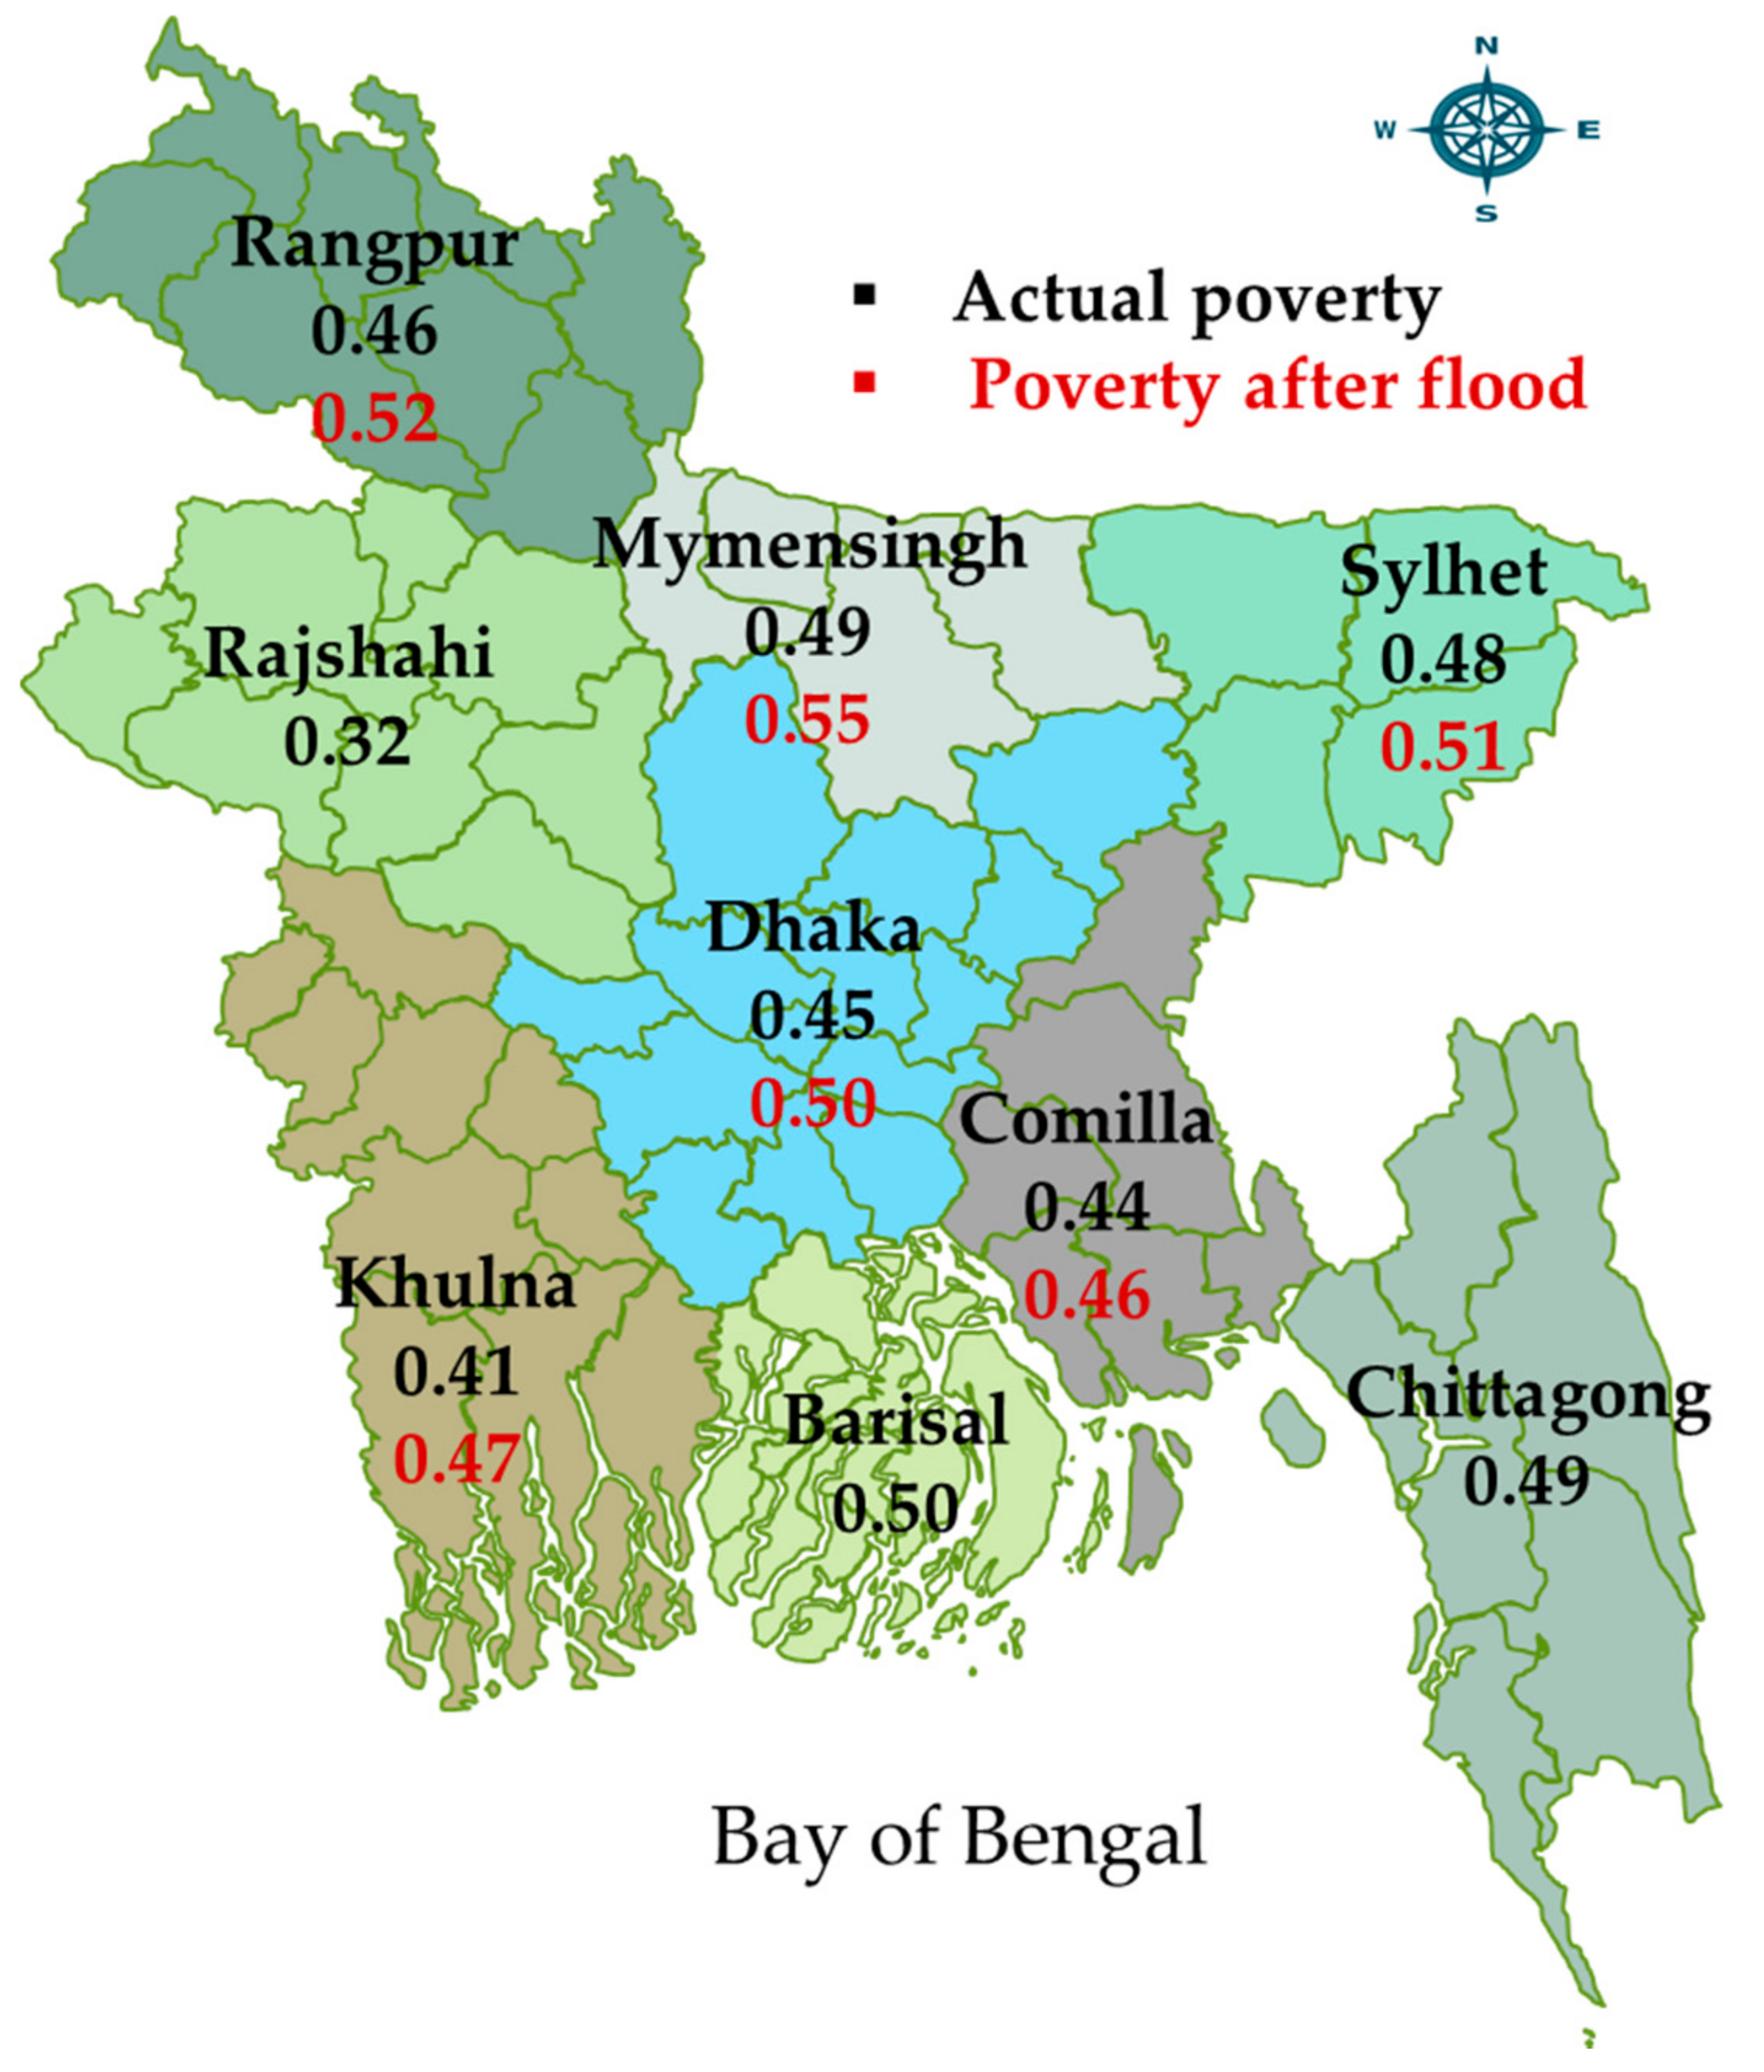
Mymensingh, Sylhet, Dhaka, Comilla, some parts of Rangpur and Khulna regions are the mainly river-flooded areas in Bangladesh [
50]. We assume that, if extreme floods, as in 1998 (the magnitude of the 1998 flood was the maximum in Bangladesh), occur, farm production will decrease by 80% in the flood-prone regions of Bangladesh. By log-normal distribution we project the poverty rate due to income reduction by yield loss due to the effects of extreme floods. The results are shown in
Table 14.
The estimated results in
Table 14 suggest that rice yield loss would reduce the annual per-capita income of the sample farm households and increase the poverty rate in various regions across Bangladesh (
Figure 14). It was found that the highest poverty rate increases would occur in Rangpur (14.502%) and Khulna (15.422%). This result implies that coping strategies to highly flood affected areas of crops loss should have priority.
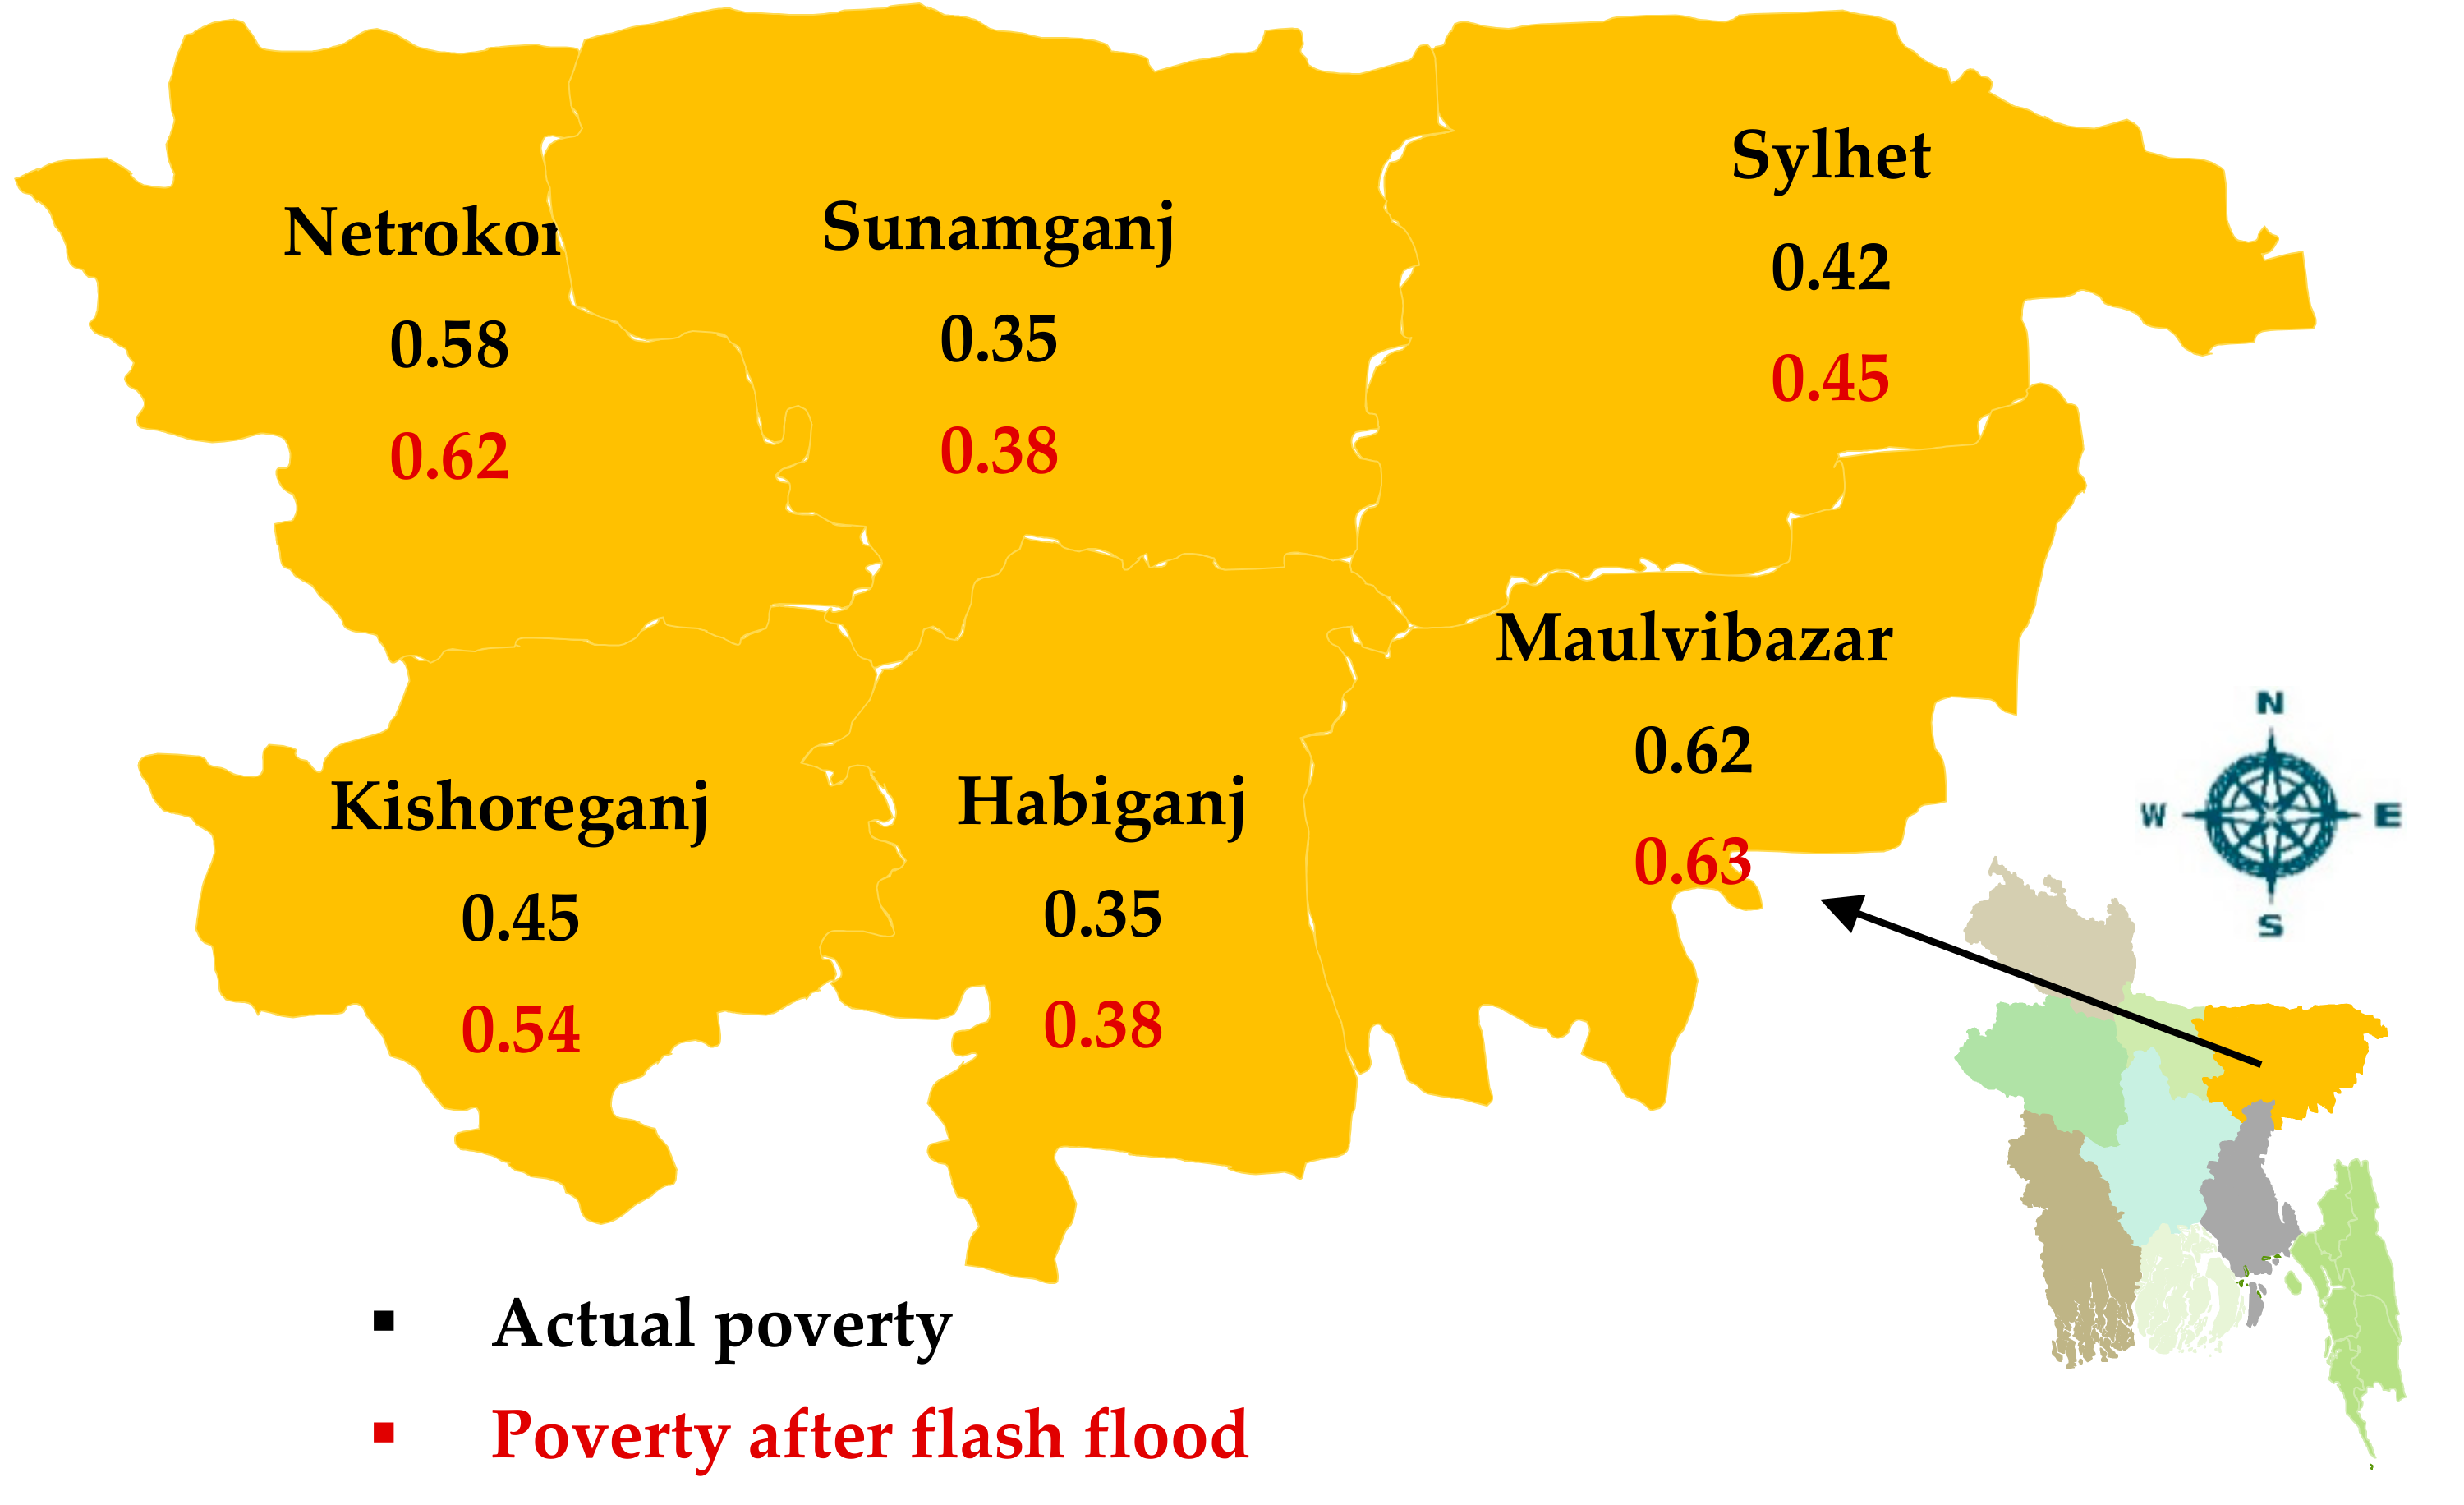
Flash Floods
The northeastern parts of Bangladesh—mostly Sunamganj, Kishorganj, Netrokona, Sylhet, Habiganj and Maulvibazar—are prone to flash floods during the months of April to November and these areas are covered by many haors, where water remains stagnant [
106]. Farmers of these districts produced
boro rice in almost 80% of their land, while only approximately 10% of the area is covered by transplanted
aman production [
107]. In 2017, flash floods affected these areas and damaged almost 90% (maximum) of
boro rice [
108]. According to this scenario, we assumed that if in the future this extreme event occurs in haor areas,
boro rice yields will be reduced by a maximum of 90% of the sample households. We applied log-normal distribution to project the poverty rate due to income reduction by yield loss due to the effects of flash floods on
boro rice yields by a maximum of 90%.
Table 15 shows the results of the poverty rate after incomes changed due to assumed yield loss of
boro rice in flash flood regions in Bangladesh, while Kishorganj district is most vulnerable to poverty (19.214% increase) if flash floods occur (
Figure 15). The projected results are treated as flash flood to be changed the poverty in northern-eastern parts of Bangladesh and this region are vulnerable on flash flood. Therefore, ex-ante coping strategies are important to the damages of flash flood.
Sea Level Rise
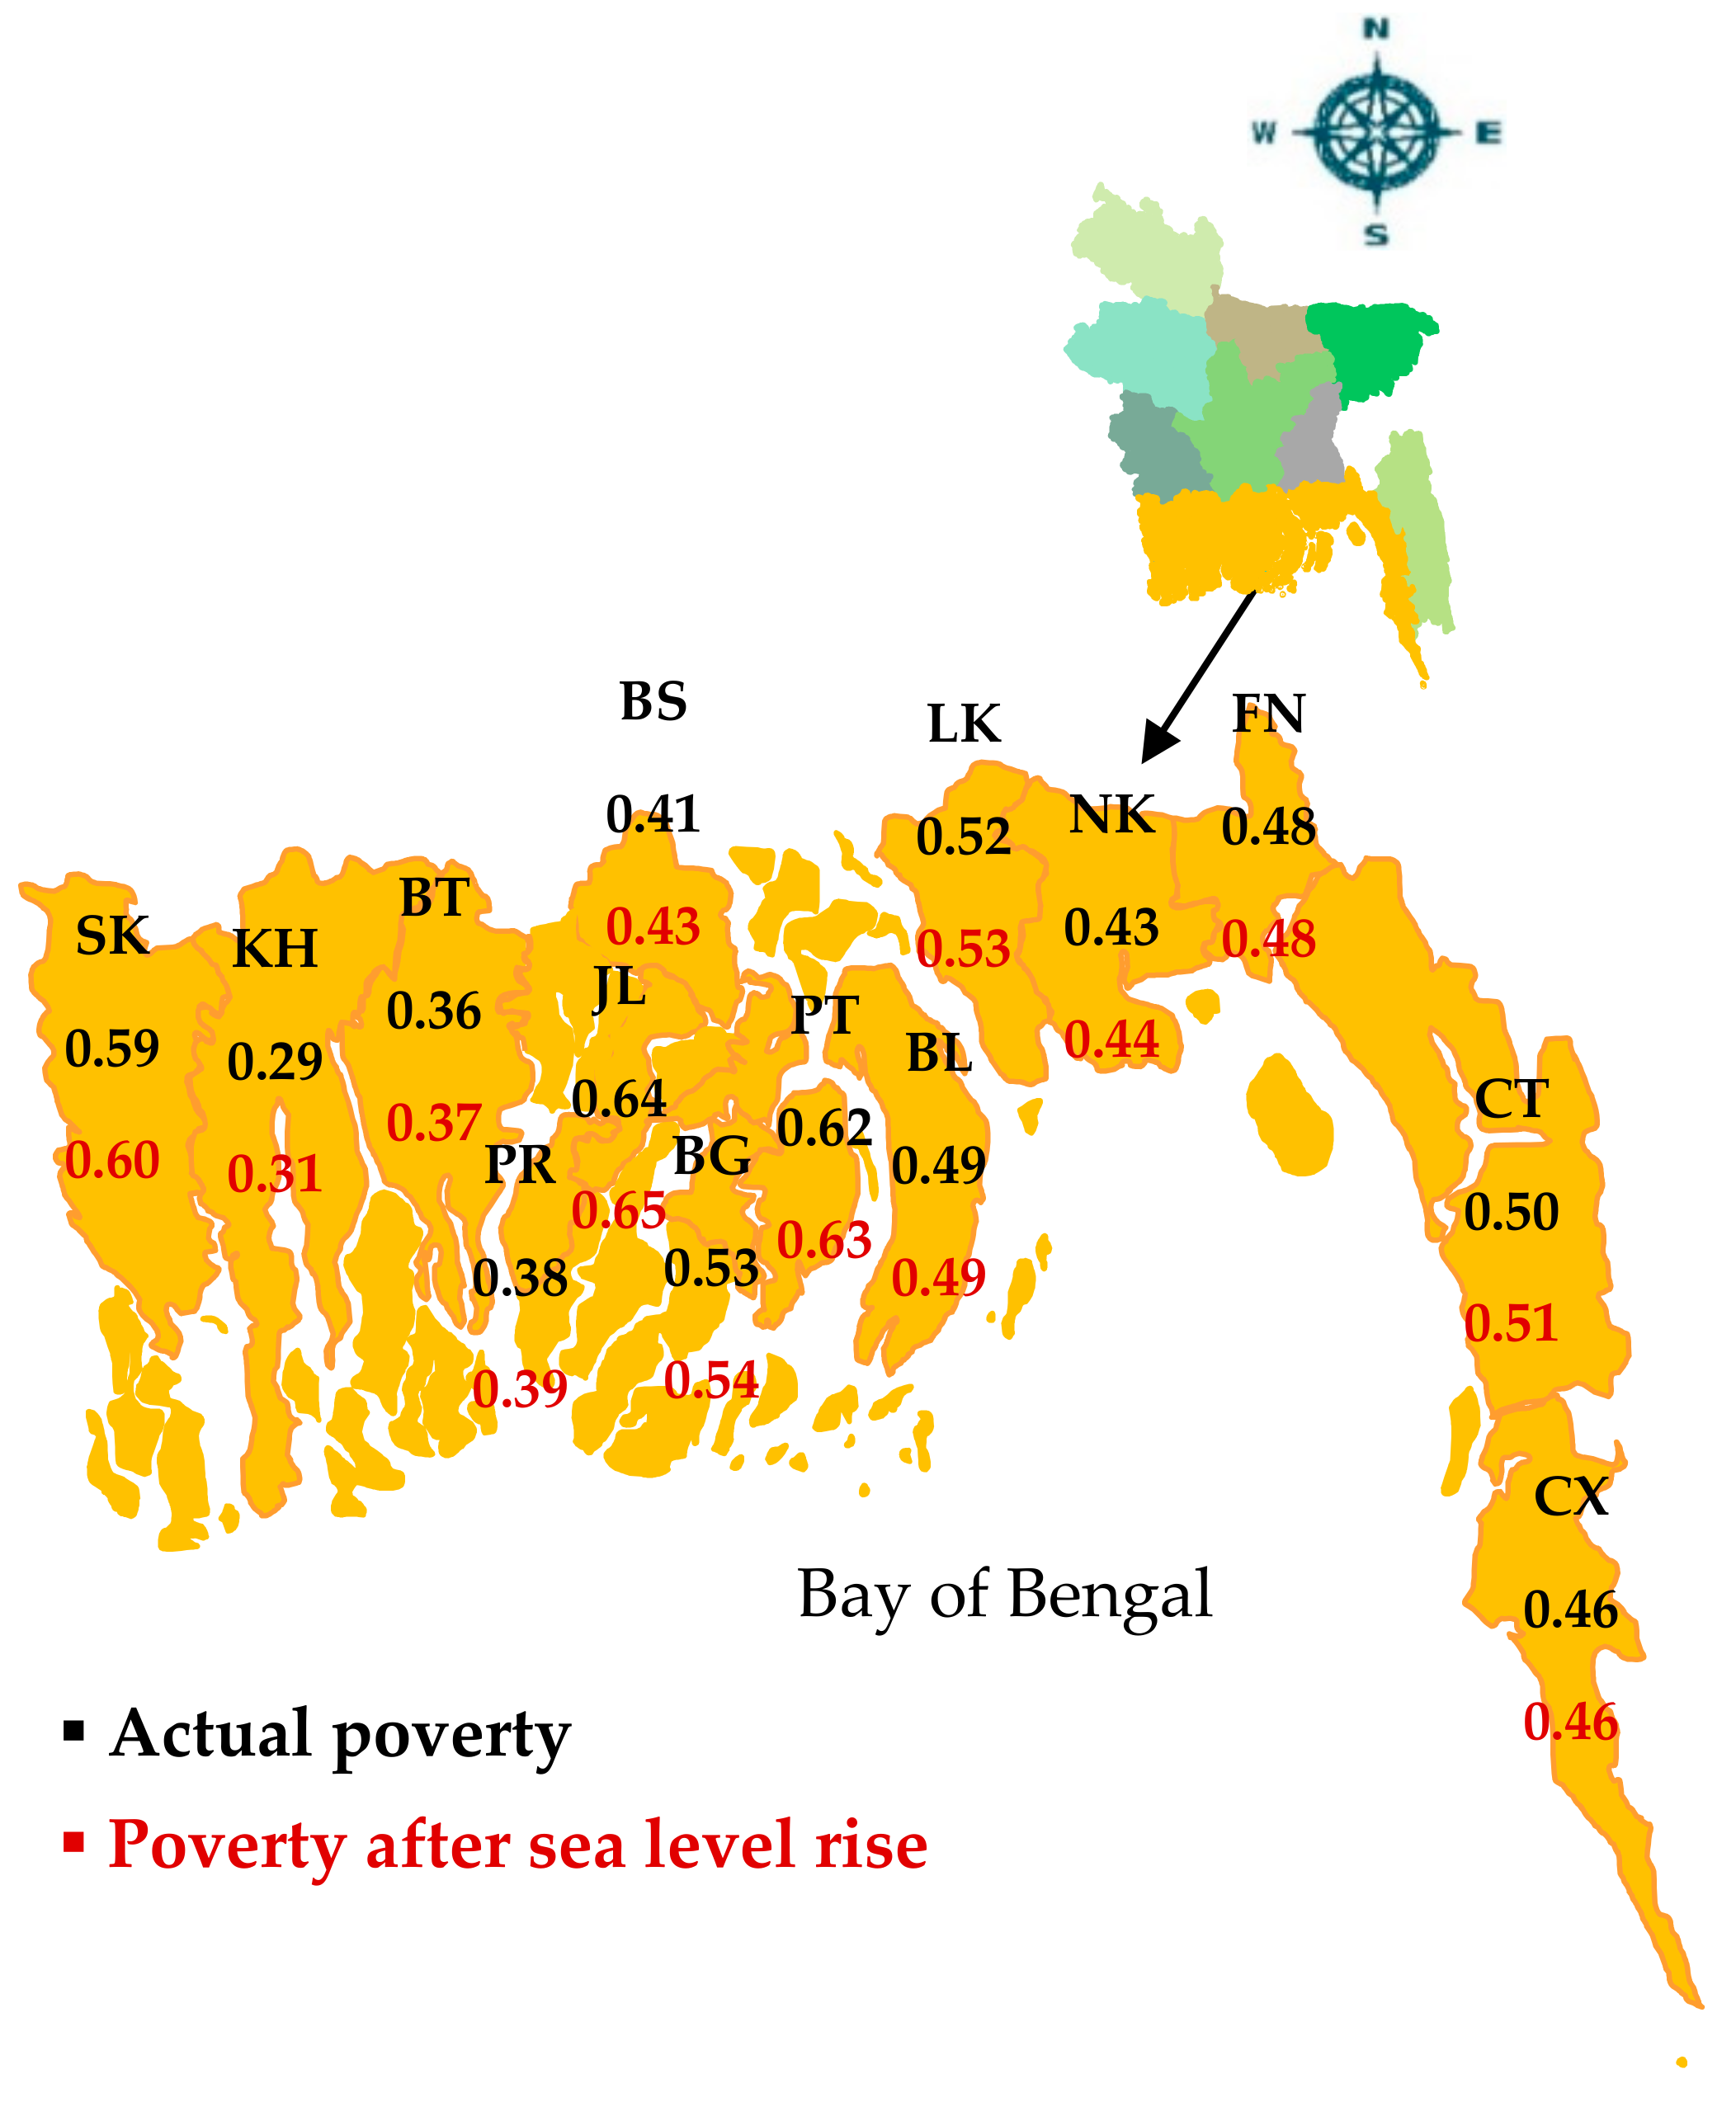
Approximately 80% of the land of Bangladesh is flatlands, while 20% is 1 m or less above sea level, which is the coastal area (southern 19 districts beside the Bay of Bengal) and particularly vulnerable to sea level rise [
109]. The coastal area covers approximately 20% of the country (including 19 districts beside the Bay of Bengal), which is approximately 30% of the net cultivable area and 25.7% of the population of Bangladesh [
110,
111]. Sea level rise will directly result in increased coastal flooding, which will increase in the event of storm surges. IPCC’s fourth assessment report [
33] reports that a 1-m sea level rise will displace approximately 14,800,000 people by inundating a 29,846-sq. km. coastal area [
112]. Nicholls and Leatherman in 1995 [
113] predicted that a 1-m sea level rise would result in a 16% of national rice production loss in Bangladesh [
114].
In terms of number of people affected with respect to sea level rise, Bangladesh has been rated as the third most vulnerable country in the world. By 2050, approximately 33 million people would be suffering from surging, assuming a sea level rise of 27 cm. A full 18% of the total land area in Bangladesh would submerge with a 1-m rise in sea level [
115]. Based on the IPCC fifth annual report (AR5), across all representative concentration pathways (RCPs), global mean temperature (°C) is projected to rise by 0.3 to 4.8 °C by the late-21st century and global mean sea level (m) is projected to increase by 0.26 to 0.82 m [
91]. The Global Circulation Model (GCM) predicts an average temperature increase of 1.0 °C by 2030, 1.4 °C by 2050 and 2.4 °C by 2100; the study revealed that the sea level will rise by 14 cm, 32 cm and 62 cm, respectively. A rise in temperature would cause significant decreases in production of 28 % and 68 % for rice and wheat, respectively [
84].
According to this scenario, we assumed that, due to sea level rise in the southern part of Bangladesh, boro rice yields will be reduced by 30% of the sample households. We applied log-normal distribution to project the poverty rate due to income reduction with yield loss based on the effects of sea level rise.
Table 16 shows the results of the poverty rate after income changes due to assumed yield loss of rice in coastal regions due to sea level rise, while Khulna district is the most vulnerable to poverty and poverty will increase by 6.752% (
Figure 16). Changing continuous sea level rise in the coastal region result in no significant loss reduction for rice.
Representative Concentration Pathways (RCPs)
In assessing future climate change, the fifth assessment report (AR5) of the IPCC selected four RCPs, --RCP 2.6, RCP 4.5, RCP 6.0 and RCP 8.5 [
91], with RCP 4.5 and RCP 8.5 covering both medium and extreme scenarios. These four RCPs describe four probable climate futures depending on how much greenhouse gasses are emitted over the next 85 years.
According to the IPCC’s fifth annual report (AR5), across all representative concentration pathways (RCPs), global mean temperature (°C) is projected to rise by 0.3 to 4.8 °C by the late-21st century [
68]. Increasing temperatures will increase the number of growing days over time. Heat stress is a major issue for crop production and reduces yields.
Climate change will certainly continue in coming decades and affect agricultural production. Yamei Li et al. worked on simulating total climate change impacts on rice production under RCP scenarios and projected that average rice yields during the 2020s, 2050s and 2080s would decrease by 12.3%, 17.2% and 24.5% under RCP 4.5 and by 14.7%, 27.5% and 47.1% under RCP 8.5, respectively [
67].
According to this scenario, we assumed that, due to total climate change impacts, rice yields would be reduced by a maximum of 47% based on RCP 8.5 among the sample households. We applied log-normal distribution to project the poverty rate due to income reduction by yield loss.
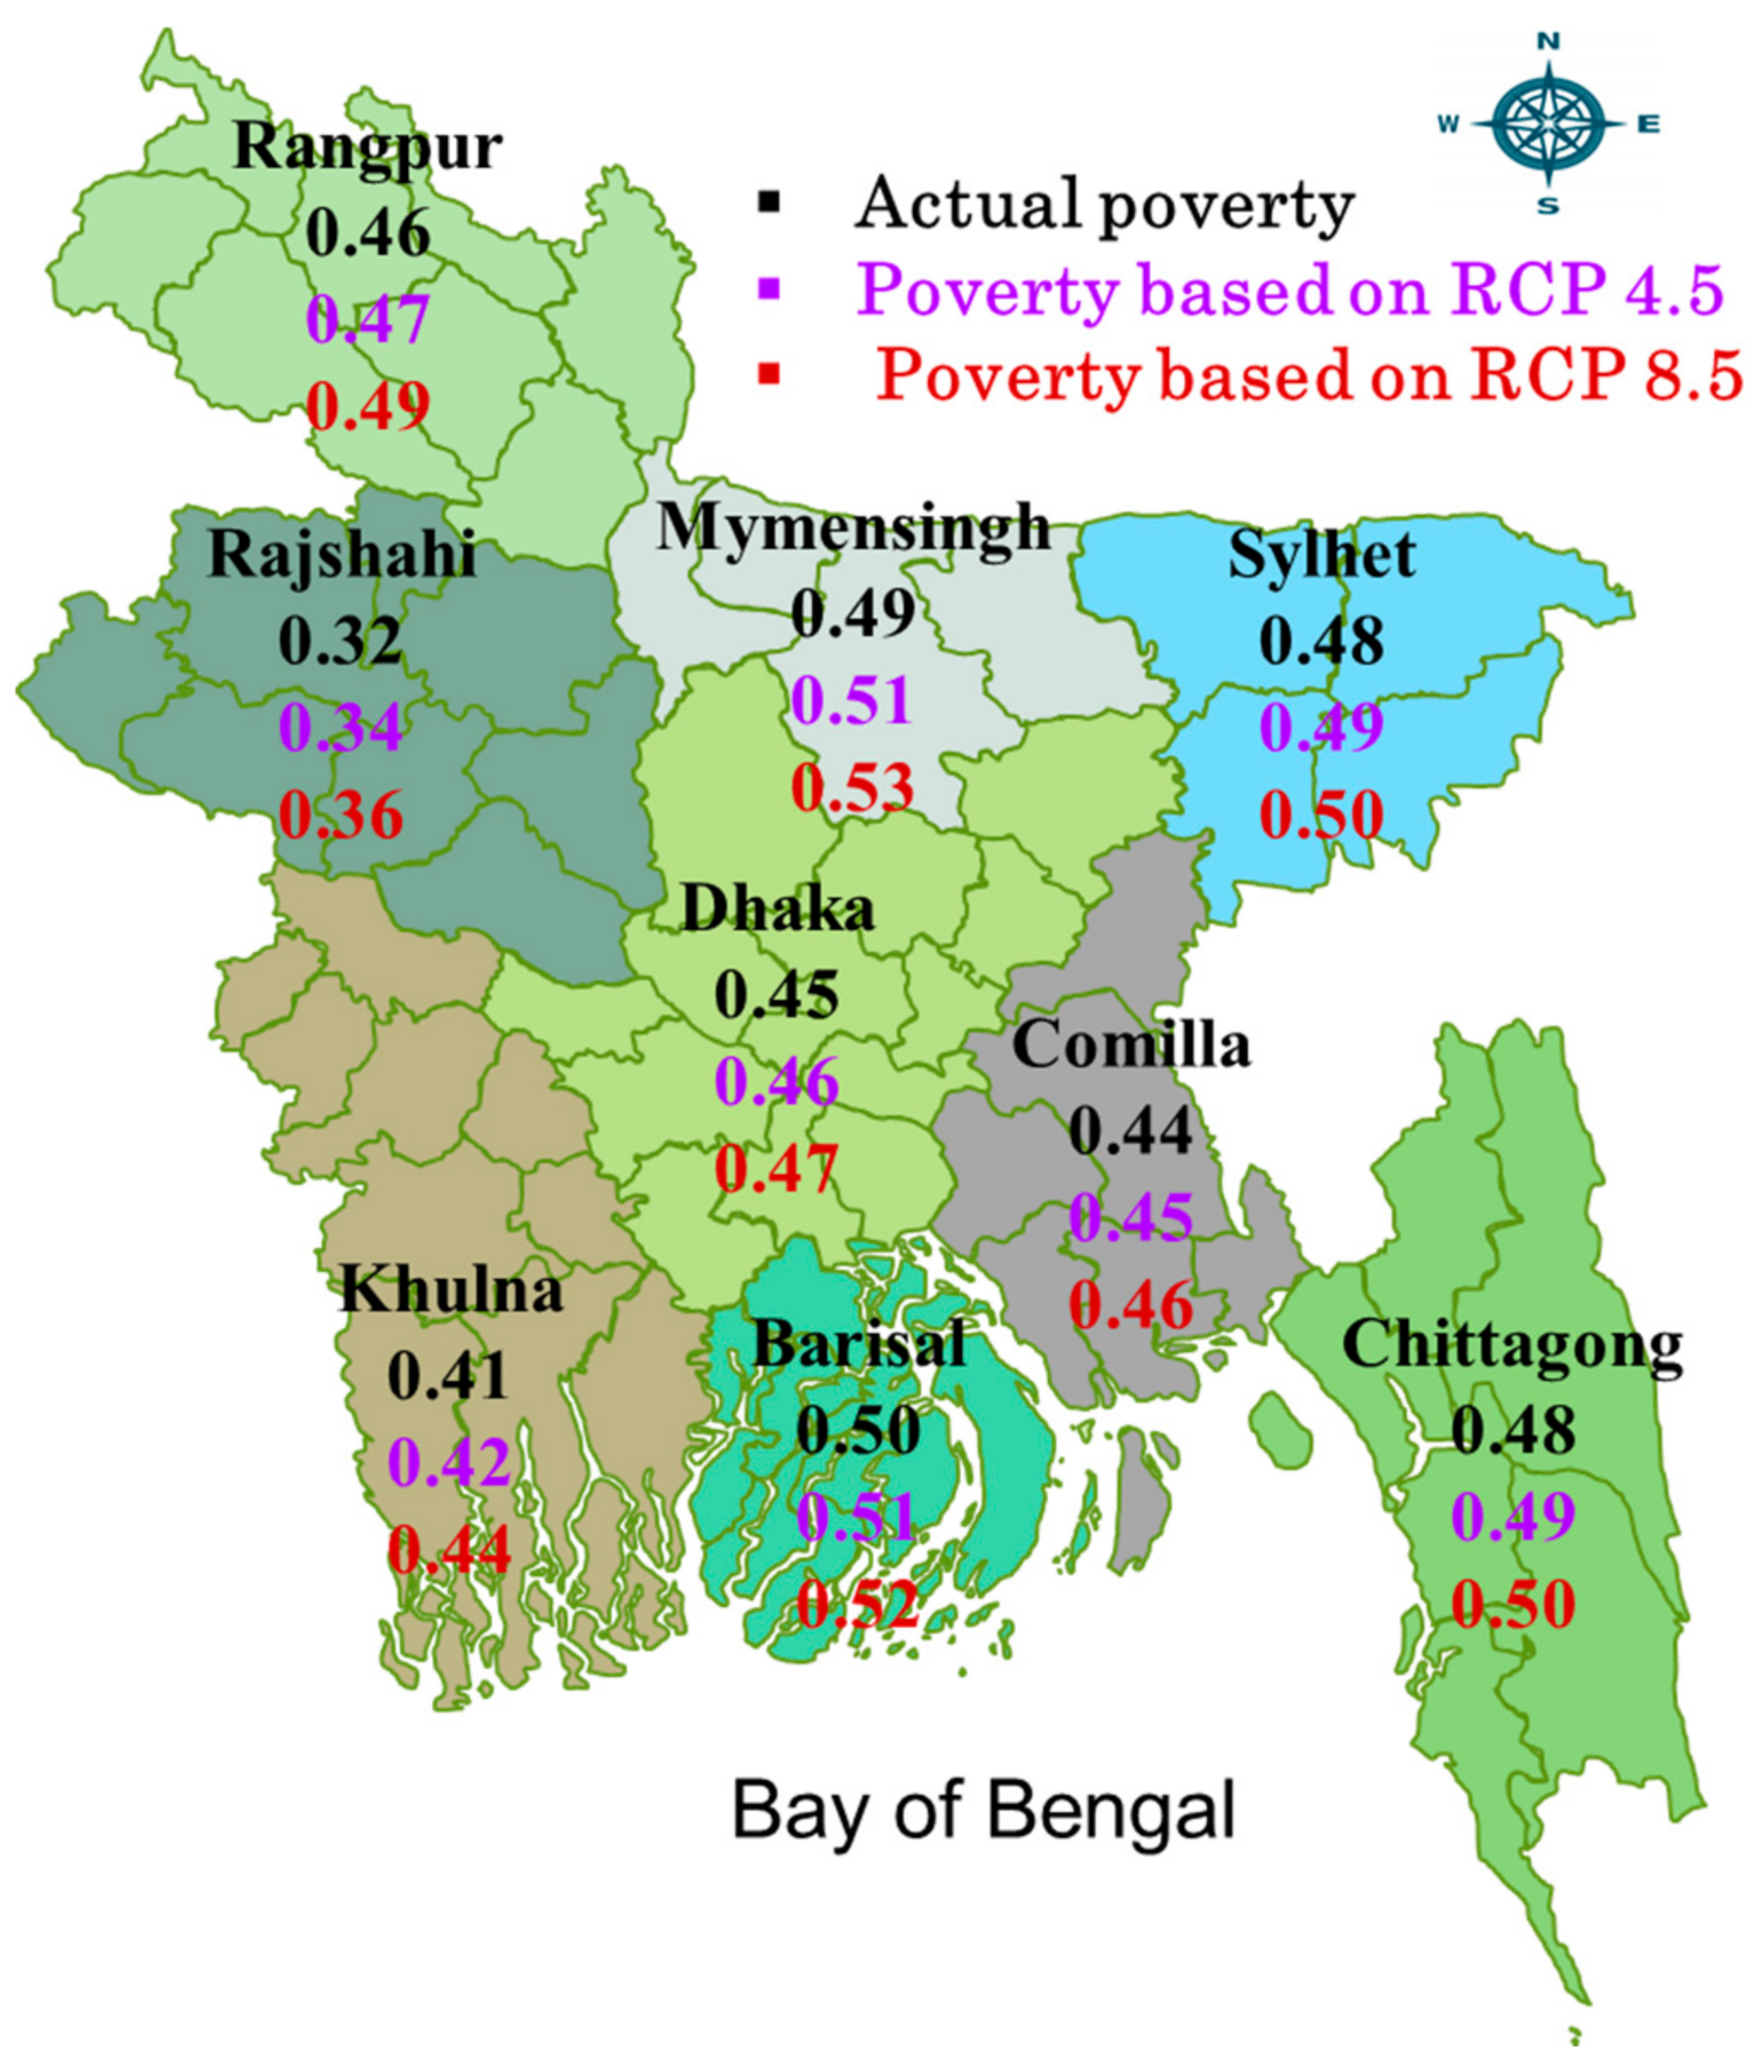
Table 17 shows that, under RCP 4.5 and RCP 8.5, the poverty rate will increase in all of the regions because of rice income reductions.
Additional increases in average poverty occur in Rajshahi, Mymensingh, Rangpur, Khulna and Sylhet region under both RCP 4.5 and RCP 8.5 with variations in the total climate change impacts on rice production. The yield of rice is predicted to decrease more under RCP 8.5 than RCP 4.5, resulting in per-capita income decreases. Under RCP 8.5, this study predicts a maximum increase in poverty of 10.526% in Rajshahi and the lowest of 3.139% in Comilla (
Table 17). It is possible that our predicted rice yield declines by RCP scenario and relatively drought prone areas, such as Rajshahi, will be more vulnerable (
Figure 17). The results from our drought scenarios are comparable to the results for RCP 8.5 and it is consistent that Rajshahi region is more vulnerable under climate change impacts. In both scenarios, our predicted yield decline and resulting per-capita income decline increase poverty. Climate change forces a decline in rice yield [
116], suggesting that the predicted decreases in heat stress yield can be mostly attributed to an increased drought tolerant variety.

 ,
, 


