Past and Future Precipitation Trend Analysis for the City of Niamey (Niger): An Overview


1
DIST, Politecnico di Torino & Università di Torino, 10129 Torino, Italy
2
Responsible Risk Resilience Centre—R3C, Politecnico di Torino, 10129 Torino, Italy
3
DIATI, Politecnico di Torino, 10129 Torino, Italy
*
Author to whom correspondence should be addressed.
Climate 2018, 6(3), 73; https://0-doi-org.brum.beds.ac.uk/10.3390/cli6030073
Submission received: 27 August 2018
/
Revised: 31 August 2018
/
Accepted: 2 September 2018
/
Published: 5 September 2018
(This article belongs to the Special Issue Climate Services for Local Disaster Risk Reduction in Africa)
Abstract
:Despite the interest in detecting the extremes of climate in the West African Sahel, few studies have been specifically conducted on the Republic of Niger. This research focuses on past, present, and future precipitation trends for the city of Niamey through the combined assessment of WMO precipitation indices using RClimDex and the Standardized Precipitation Index. Past daily precipitation data were derived from a 60-year reconstructed meteorological dataset for the Niamey airport station for the period of 1950–2009 and validated through comparison with an observed time series at Niamey airport (1980–2012). Precipitation analysis confirms the literature’s findings, in particular, a decreasing trend in total precipitation over the period of 1950–2009, and a positive trend for data that spans over the period of 1980–2009, suggesting a precipitation recovery after the dry epoch (1968–1985), even if the deficit with the wettest years in the period of 1950–1968 has not been made up. Furthermore, WATCH-Forcing-Data-ERA-Interim projections, elaborated under RCP 4.5 and RCP 8.5 socio-economic conditions, show that precipitation will increase in the future. Therefore, the Nigerien population will benefit from increased rainfall, but will also have to cope with the exacerbation of both flood and drought risks due to a great interannual variability that can positively or negatively influence water availability.
1. Introduction
Since 1950, the West African Sahel has experienced three cycles: a wet epoch, a dry epoch and, finally, a moderate recovery [1,2,3]. The dry epoch (1968–1985), coincides with a period of severe drought, remembered locally as the Great Drought. In this period, the rainfall average annual was 200 mm lower than in the previous 20 years [4]. After the drought, the rainfall trend reversed again. In fact, since 1990, the rainfall increase can be considered as a basis for wetter conditions in the West Sahel [5], even if it was not possible to make up the deficit with the wettest years in the period of 1950–1969 [4,6]. Indeed, a decrease in mean annual rainfall was observed [7,8,9]. However, the 1990s witnessed a change in rainfall pattern compared to the period prior to the drought with an increase of inter-annual variability [10]. The irregular inter-annual pattern creates conditions for multi-annual anomalies and changes in rainfall magnitude; together, these are a great influence and major contribution to the two single months of the wet season (July and August) [11]. The rainfall’s anomaly, in particular, is observed as variability in the frequency of extremely heavy rainfall events and recognised as the factor that relates to the occurrence of dry or wet seasons [7]. Thus, the higher the number of extreme events in a year, the greater the total precipitation [2,3,4,5,6,7,8,9,10,11,12,13]. Reasonable expectations suggest a return to wetter conditions as result of more frequent high-intensity rainfalls [14,15,16] and a higher precipitation intensity. Changes in the occurrence and intensity of extreme precipitation events are likely to worsen other climate change impacts on local societies. In this context, despite the interest in detection of climate extremes in the West African Sahel, few studies have been conducted in the Republic of Niger. Ozer et al. [17] by analysing rainfall trends across four stations in the East Niger (Zinder, Magaria, Maine-Soroa and Goure) found a decreasing trend in total precipitation over the period 1940–2007, as well as a decreasing trend in extreme precipitations (here referred to as annual total precipitation when precipitation exceeds the 99th percentile; see climate index R99p). However, the existence of an east-west gradient is probable, as reported by studies which found that a higher proportion of wet days are observed for the East Niger region and a higher proportion of dry days in the West Niger region, while computing the SPI index for the Republic of Niger over the period 1993–2006 [18]. A decrease in total precipitation over Niger was also found by Barry et al. [19], but in the recent period, the trend is increasing. In fact, there is general evidence over the West Sahel of an increased number of heavy and very heavy events (climate indices R10 and R20, respectively, count the number of days with precipitation above 10 and 20 mm), confirming the slight recovery of wetness [20].
Focusing on the Niamey region, the deepest climatic analyses were developed by Lebel et al. [21], Le Barbé and Lebel [7], Shinoda et al. [22]. In [21], rainfall and climatic conditions of Niamey were studied during the years of the Hydrologic-Atmospheric Pilot Experiment in the Sahel, called HAPEX (1990–1993), whereas in [7] a deeper analysis of Niamey rainfall patterns was developed comparing the 40-years series (1950–1990 for the HAPEX-Sahel experiment) with a longer period from 1905 to 1989. In [22], a comparative study of the diurnal variations of three-hourly rainfall was conducted for Niamey in the West African Sahel among four periods of extreme precipitation: the wet periods of the 1950s and late 1980s to early 1990s, versus the drought periods of the early 1970s and 1980s. Finally, it is important to remember that investigating climate variability and climate change would firstly support the decision process in choice of adaptive strategies, in particular flood and drought risk prevention [23,24], since both hazards will affect the Sahel region, as well as assist long-term planning in the agricultural sector with important impacts on local food security and food sovereignty.
Compared to previous studies (Table 1), this study focuses on total precipitation trends and precipitation extremes over the period of 1950–2009. Throughout, the combined assessment of WMO (World Meteorological Organization) precipitation indices [25,26], using RClimdex Version 1.1 (a software for indices calculation running on R), and the Standardized Precipitation Index (SPI) [27,28,29] on the specific case of Niamey, updating analyses previously made in the 90s. Moreover, it examines future projections in order to recognize future precipitation trends, a novelty in the climatic study of Niger and Niamey.
Daily precipitation was derived from a 60-year reconstructed meteorological dataset for Niamey airport station for the period of 1950–2009 [30,31] and validated through comparison with an observed time series at Niamey airport (1980–2012). The reconstructed dataset for Niamey has previously been used by Barbier et al. [32]; the study of which compared BEST (Berkeley Earth Surface Temperature) and three re-analyses to two surface synoptic observation station series. In this case, the comparison’s purpose relies only on the validation of BEST, whereas this study aims to use the simulated dataset in order to analyse it and compare it to WATCH-Forcing-Data-ERA-Interim data (WFDEI). Furthermore, the WFDEI was also used to analyse future precipitation projection, adding a novelty in the climatic researches in Niamey urban area and Sahel region.
Due to scarcity of data and analysis in the Region of Niamey, the study takes advantage of three precipitation datasets in order to calculate both indices on past data—climate indices and SPI—and future projections. Thus, existing methodology was applied in a region not commonly referenced in West African studies.
The work is structured as follows: Section 2 presents the materials, in particular the study area and the climatological datasets used in the research, as well as the methods, namely the analysis through the use of WMO indices and the Standardized Precipitation Index. Section 3 sets out results and the discussion of the results in addition to the analysis of future precipitation projections. Section 4 contains the conclusions.
2. Materials and Method
2.1. Study Area
For this study, climate trend analysis was conducted in the West African Sahel, in particular in the Republic of Niger, on which few previous studies have focused due to scarcity and unreliability of data. More specifically, this study is valid for the Niamey airport climatological station (LAT 13.4833, LONG 2.1667, ELEV 222—Figure 1). The Republic of Niger is located in the tropical zone: in the north, the climate type is Saharan—a warm desert climate according to Köppen’s classification [33]—as the desert spans about two-thirds of the country’s area, while in the south, a warm semi-arid climate creates a prevalence for Sahelian savannah. The latter zone is situated between isohyets 200 and 600 mm in the Inter Tropical Convergence Zone (ITCZ), resulting in the division of the climatic year into two seasons—wet and dry—where the dry season prevails for almost eight months.
2.2. Climatological Dataset
The analysis conducted in this study is based on three different precipitation time series. The first is an observed precipitation dataset (1980–2012) measured at the Niamey airport station, made available by the Direction de la Météorologie Nationale (DMN) of the Republic of Niger. The second dataset is a simulated precipitation series (1950–2009) for Niamey Airport (NAD). Simulated precipitation data are obtained from a 60-year reconstructed high-resolution meteorological dataset, which includes meteorological variables (NAD-M), including precipitation, as well as process-modelled surface fluxes (NAD-S). The dataset is available through the African Monsoon Multidisciplinary Analysis—Coupling the Tropical Atmosphere and the Hydrological Cycle (AMMA-CATCH) website [30,31], which from now on, will be denoted as the NAD dataset (Niamey Airport-derived dataset).
The third dataset used for this study is the WFDEI, produced in the context of the Integrated Project Water and Global Change (WATCH) using WATCH Forcing Data (WFD) methodology applied to ERA-Interim data, which is a meteorological forcing dataset of eight meteorological variables at 3-hourly time steps covering the period of 1979–2012 [34], including rainfall measurements.
2.3. Methods
In order to establish the presence of trend patterns in precipitation series belonging to the Niamey airport station, the authors decided to conduct the assessment with the use of the World Meteorological Organization’s indices, calculated using the RClimdex software, and the Standardized Precipitation Index (SPI).
2.3.1. RClimdex
The RClimDex [35] provides a friendly graphical user interface to compute 27 core indices (11 for precipitation and 16 for temperature) recommended by the Commission for Climatology (CCl), World Climate Research Programme (WCRP) of the Climate Variability and Predictability Component (CLIVAR) project and Expert Team for Climate Change Detection and Indices (ETCCDI). This research refers only to precipitation indices (Table 2).
2.3.2. Standardized Precipitation Index
The SPI [27,28,29] is widely used to detect precipitation deficit—drought—or precipitation excess—wetter periods. The SPI values (Table 3) can be interpreted as the number of standard deviations by which the observed anomaly deviates from the long-term mean. In this sense, the SPI can be computed for different periods from 1 to 36 months, using monthly input data. This study used 6-month and 12-month SPI indexes, since the area of interest focuses on seasonal and long-term changes in precipitation patterns. In fact, a 6-month SPI can be very helpful in showing precipitation over distinct seasons. On the contrary, with regard to long-term precipitation patterns, a 12-month SPI is a comparison of the precipitation for 12 consecutive months with that recorded in the same 12 consecutive month period. Because this timescale is the cumulative result of a shorter period that may be above or below normal, the longer SPI tends to gravitate toward zero, unless a distinctive wet or dry trend is taking place [27]. For the 12-month SPI, the month of January was used as the reference month in order to consider the trend that occurred in the previous calendar year.
3. Results and Discussion
3.1. Choice of the NAD-M Ensemble
The DMN dataset is used for assessing the validity of the NAD dataset. In this regard, since the standard requirement for detecting changes of climate is a homogeneous period of at least 30 years of records [36], the climatological station located at Niamey Airport has been selected as suitable for the purposes of this research, as well as for the correspondence of the station’s location. The choice of using the NAD dataset is based on its temporal extent (1950–2009), which is longer than the observed period (1980–2012). The temporal mismatch problem at the end of the time series is addressed by cutting the DMN dataset to the year 2009. Thus, assuming that the NAD dataset is a continuous and consistent dataset [30], the first issue to be addressed is the choice of one of the 10 ensemble NAD-M series based on precipitation characteristics. The assessment is based on the use of forecast verification measures, which in this application can be better termed as diagnostic verification [37]. The diagnostic verification’s method of joint distribution for continuous atmospheric variables, as precipitation data, suggests that association and accuracy measures be detected such as, respectively, the correlation coefficient (CORRELATION) and the Mean Square Error (MSE) plus the Root Mean Squared Error (RMSE) in order to determine the quality of simulated data, as reported by Wilks [38]. In addition to those diagnostic measures, the study takes into account a correspondence measure that is the identity measure (IDENTITY), which counts how many times an identical (TRUE) or non-identical (FALSE) correspondence of values between the DMN dataset and the NAD dataset occur. These operations are repeated for each of the 10 NAD ensemble.
The diagnostic verification method has been applied to the period of 1980–2009 that is common to both datasets.
Based on those diagnostic verification measures (Table 4), each of the 10 ensemble series has a correlation coefficient greater than 60% and an identity measure of about 85%. In absolute terms, the CORRELATION and the IDENTITY plus the accuracy measures (MSE and RMSE) lead to the conclusion that the NAD-M_9 ensemble contains the precipitation data series that fits better with the DMN dataset.
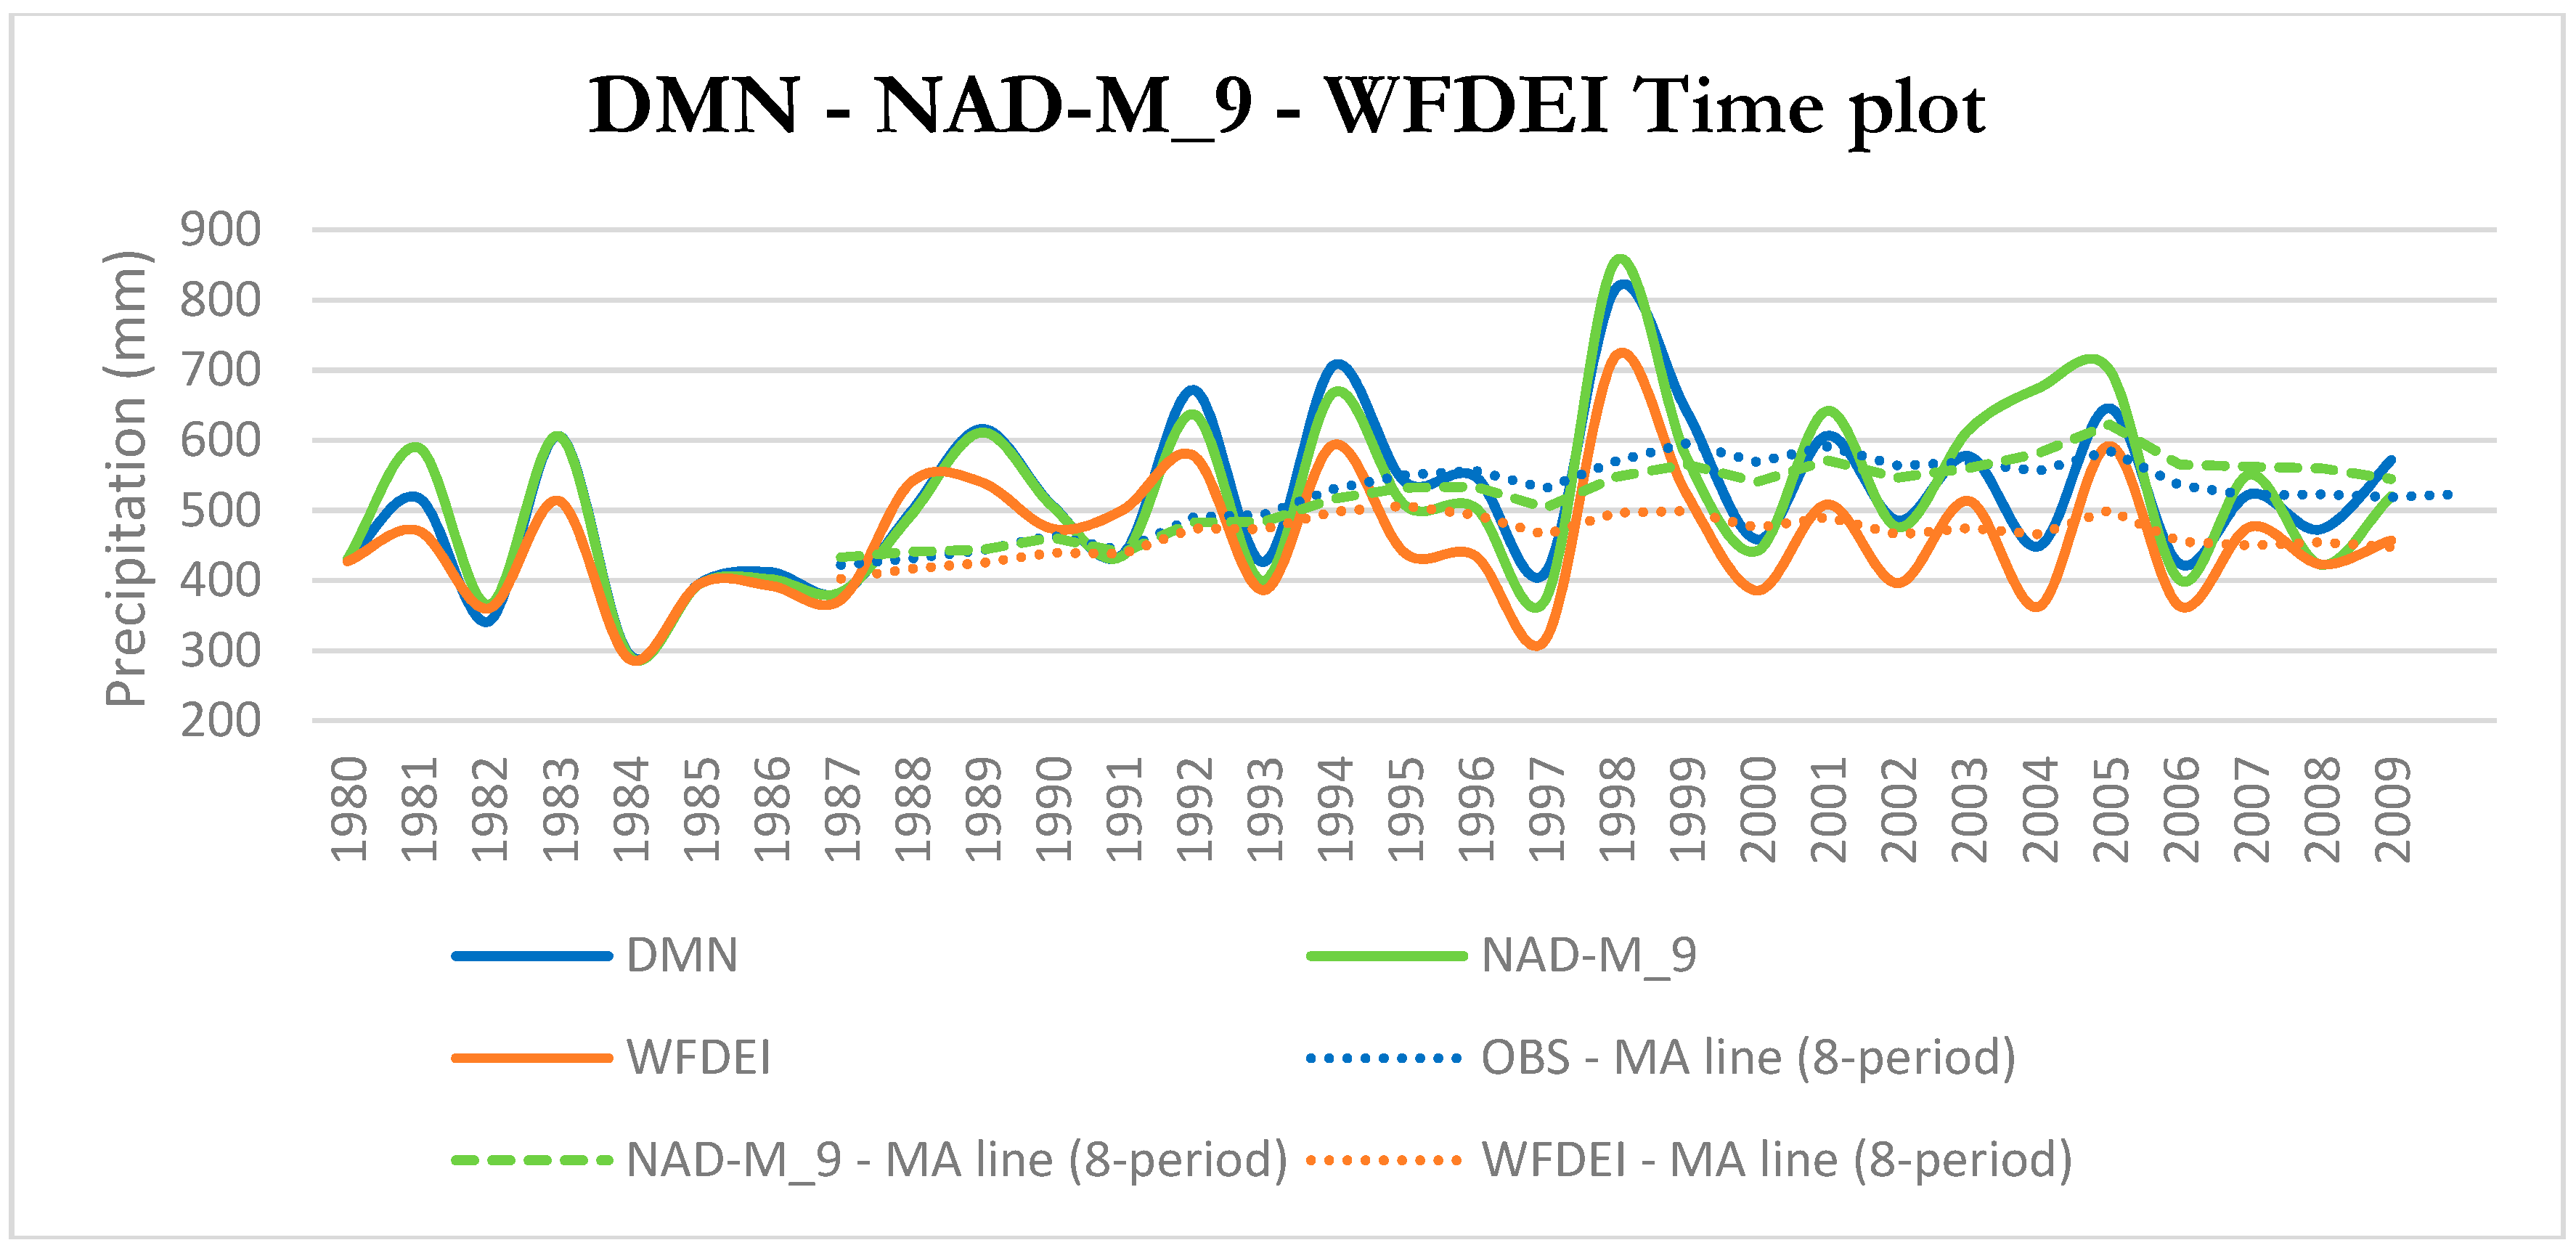
Comparison of the three datasets (Figure 2) for the common period 1980–2009, in particular their 8-period Moving Average (MA)—which corresponds to eight years—shows that they are consistent with each other, especially the DMN and NAD-M_9 datasets. This is corroborated by the descriptive statistics contained in Table 5, except for the correlation coefficient. In fact, the correlation coefficients are influenced by the different deviation values in 2004. Despite that, the other statistics are in favor of the NAD-M_9 dataset.
According to these results, computations and analyses of past precipitation patterns will be conducted on NAD-M_9 dataset considering the entire dataset from 1950 to 2009. However, WFDEI will be used for considerations on future projections, which will be evaluated using the annual estimate of precipitation simulated over Niamey from an ensemble of 20 CMIP5 (Coupled Model Intercomparison Project Phase 5) models’ projections under historical conditions, with moderate (RCP4.5) and rising pathways (RCP8.5) processed by The Climate Data Factory [39].
3.2. RClimdex
In order to assess the presence of precipitation trends, two cases were analysed: case A from 1950 to 2009, and case B from 1980 to 2009. It is well established that after the Great Drought in the 1980s, the Sahel region witnessed a partial recovery in precipitation, but not enough to fill the gap with the period prior to the drought. It is self-evident that the precipitation trend from 1950 will be negative. Splitting into two cases, it is possible to have another point of view on the last three decades, getting the chance to glimpse future trends based on case B tendency. Actually, Table 6 shows a contrasting trend between case A and B. While for case A indices, trends are all negative, for case B, all trends are positive; whereas CDD and CWD are the only indices with the same sign between case A and case B. Moreover, CDD and CWD have opposite signs, which is coherent since they measure opposite phenomena. Therefore, it is reasonable to affirm that the dry season is becoming longer, while the wet season is shortening (case A: CDD and CWD statistically significant at 5%). The first thing to remark is the annual total precipitation (PTOT) in wet days, which is pronouncedly increasing for case B (slope estimate 4.316), but, at the same time, pronouncedly decreasing for case A (slope estimate −2.29. Once again, this is coherent with literature’s finding. Since the 1950s, total precipitation has decreased, while from the 1980s it is increasing at a higher rate than the rate at which it decreased, which means that the gap will probably be closed shortly. In terms of precipitation intensity, represented by the SDII index, there is almost constancy in the 1950–2009s trend, while it is increasing for the period 1980–2009. In this context, it is important to look at RX1day and RX5days, which represent the 1-day and 5-day precipitation quantity, rather than at R10, R20, R30, R40, R50. In fact, the former has a greater magnitude than the latter and they are proportionally responsible for precipitation intensity. For the same reasons, it is better to look at R95p and R99p indices to identify changes in precipitation patterns; in particular, for the period 1980–2009 there seems to be a net increase of very wet and extremely wet precipitation days. Besides that, looking at the number of heavy precipitation days, when precipitation is above different thresholds (10–20–30–40–50 mm), only heavy precipitation above 20 mm (slope estimate 0.127) generates an effect on the increase of annual total precipitation.
3.3. SPI
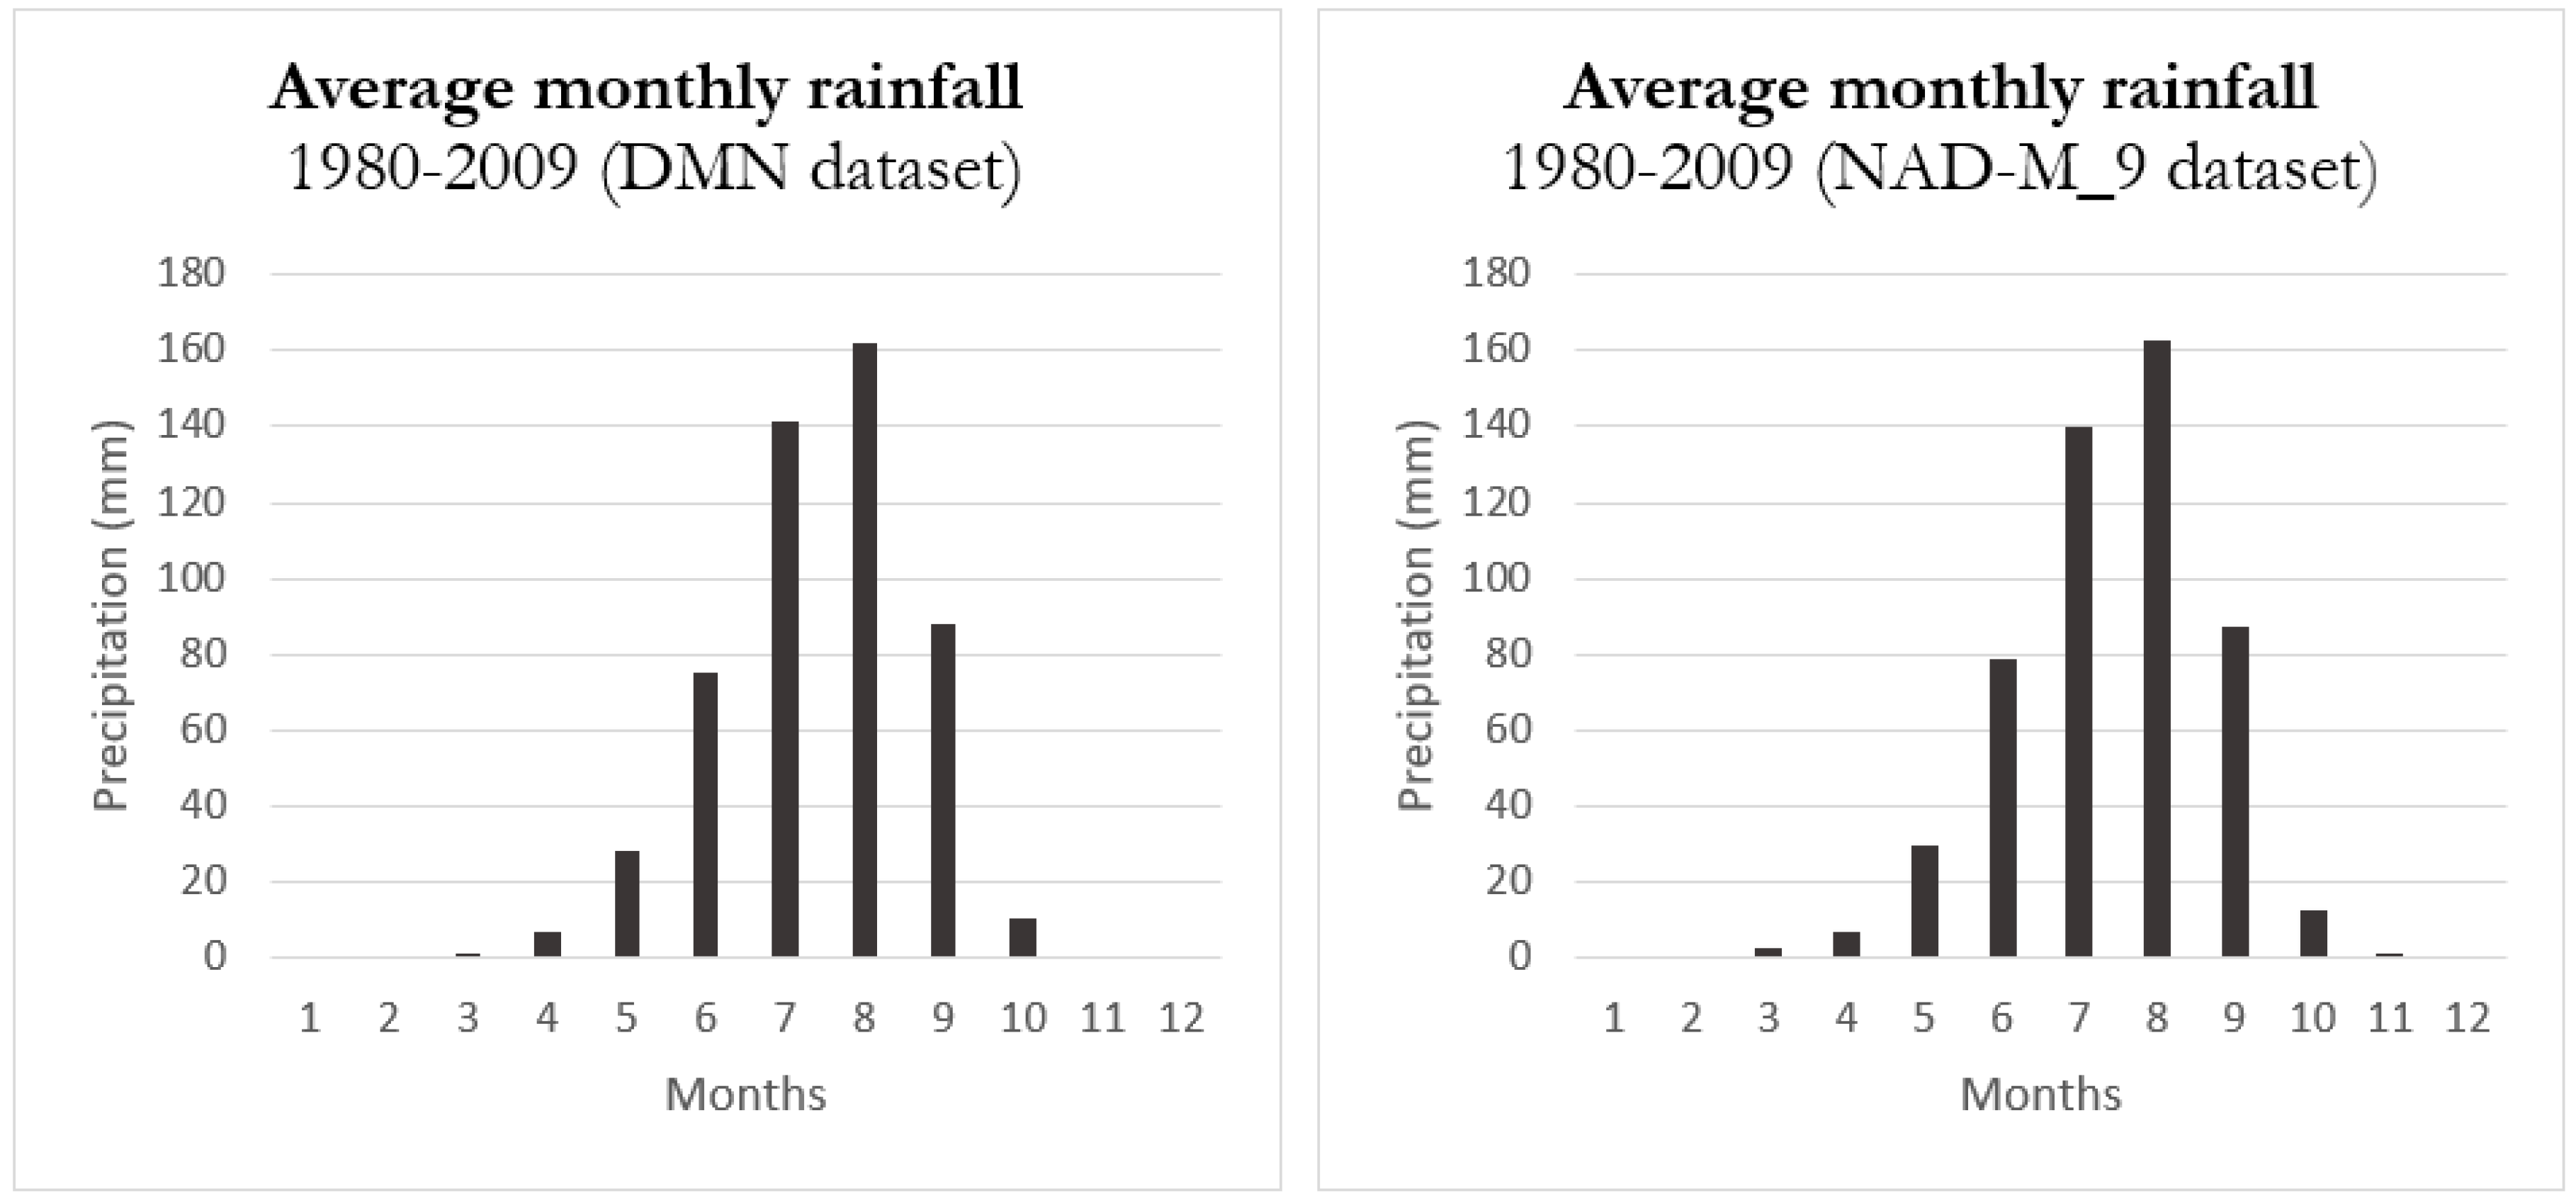
The SPI has been computed for two different periods—6 and 12 months—based on the NAD dataset from 1950 to 2009. Shorter periods would not make sense, since Nigerien climate is seasonal and precipitation is concentrated in a period of 3–4 months. Thus, as said, a 6- and 12-month SPI has a better fit to the analysed time series as they reveal precipitation over distinct seasons. For this purpose, the average monthly rainfall has been analysed, both for observed and simulated data, in order to assess the precipitation seasonality (Figure 3). Based on Figure 3, two distinct periods were considered from May to October (corresponds more or less to the wet season) and from November to April (corresponds more or less to the dry season), and with respect to that, the last months considered for the 6-month SPI are October and April.
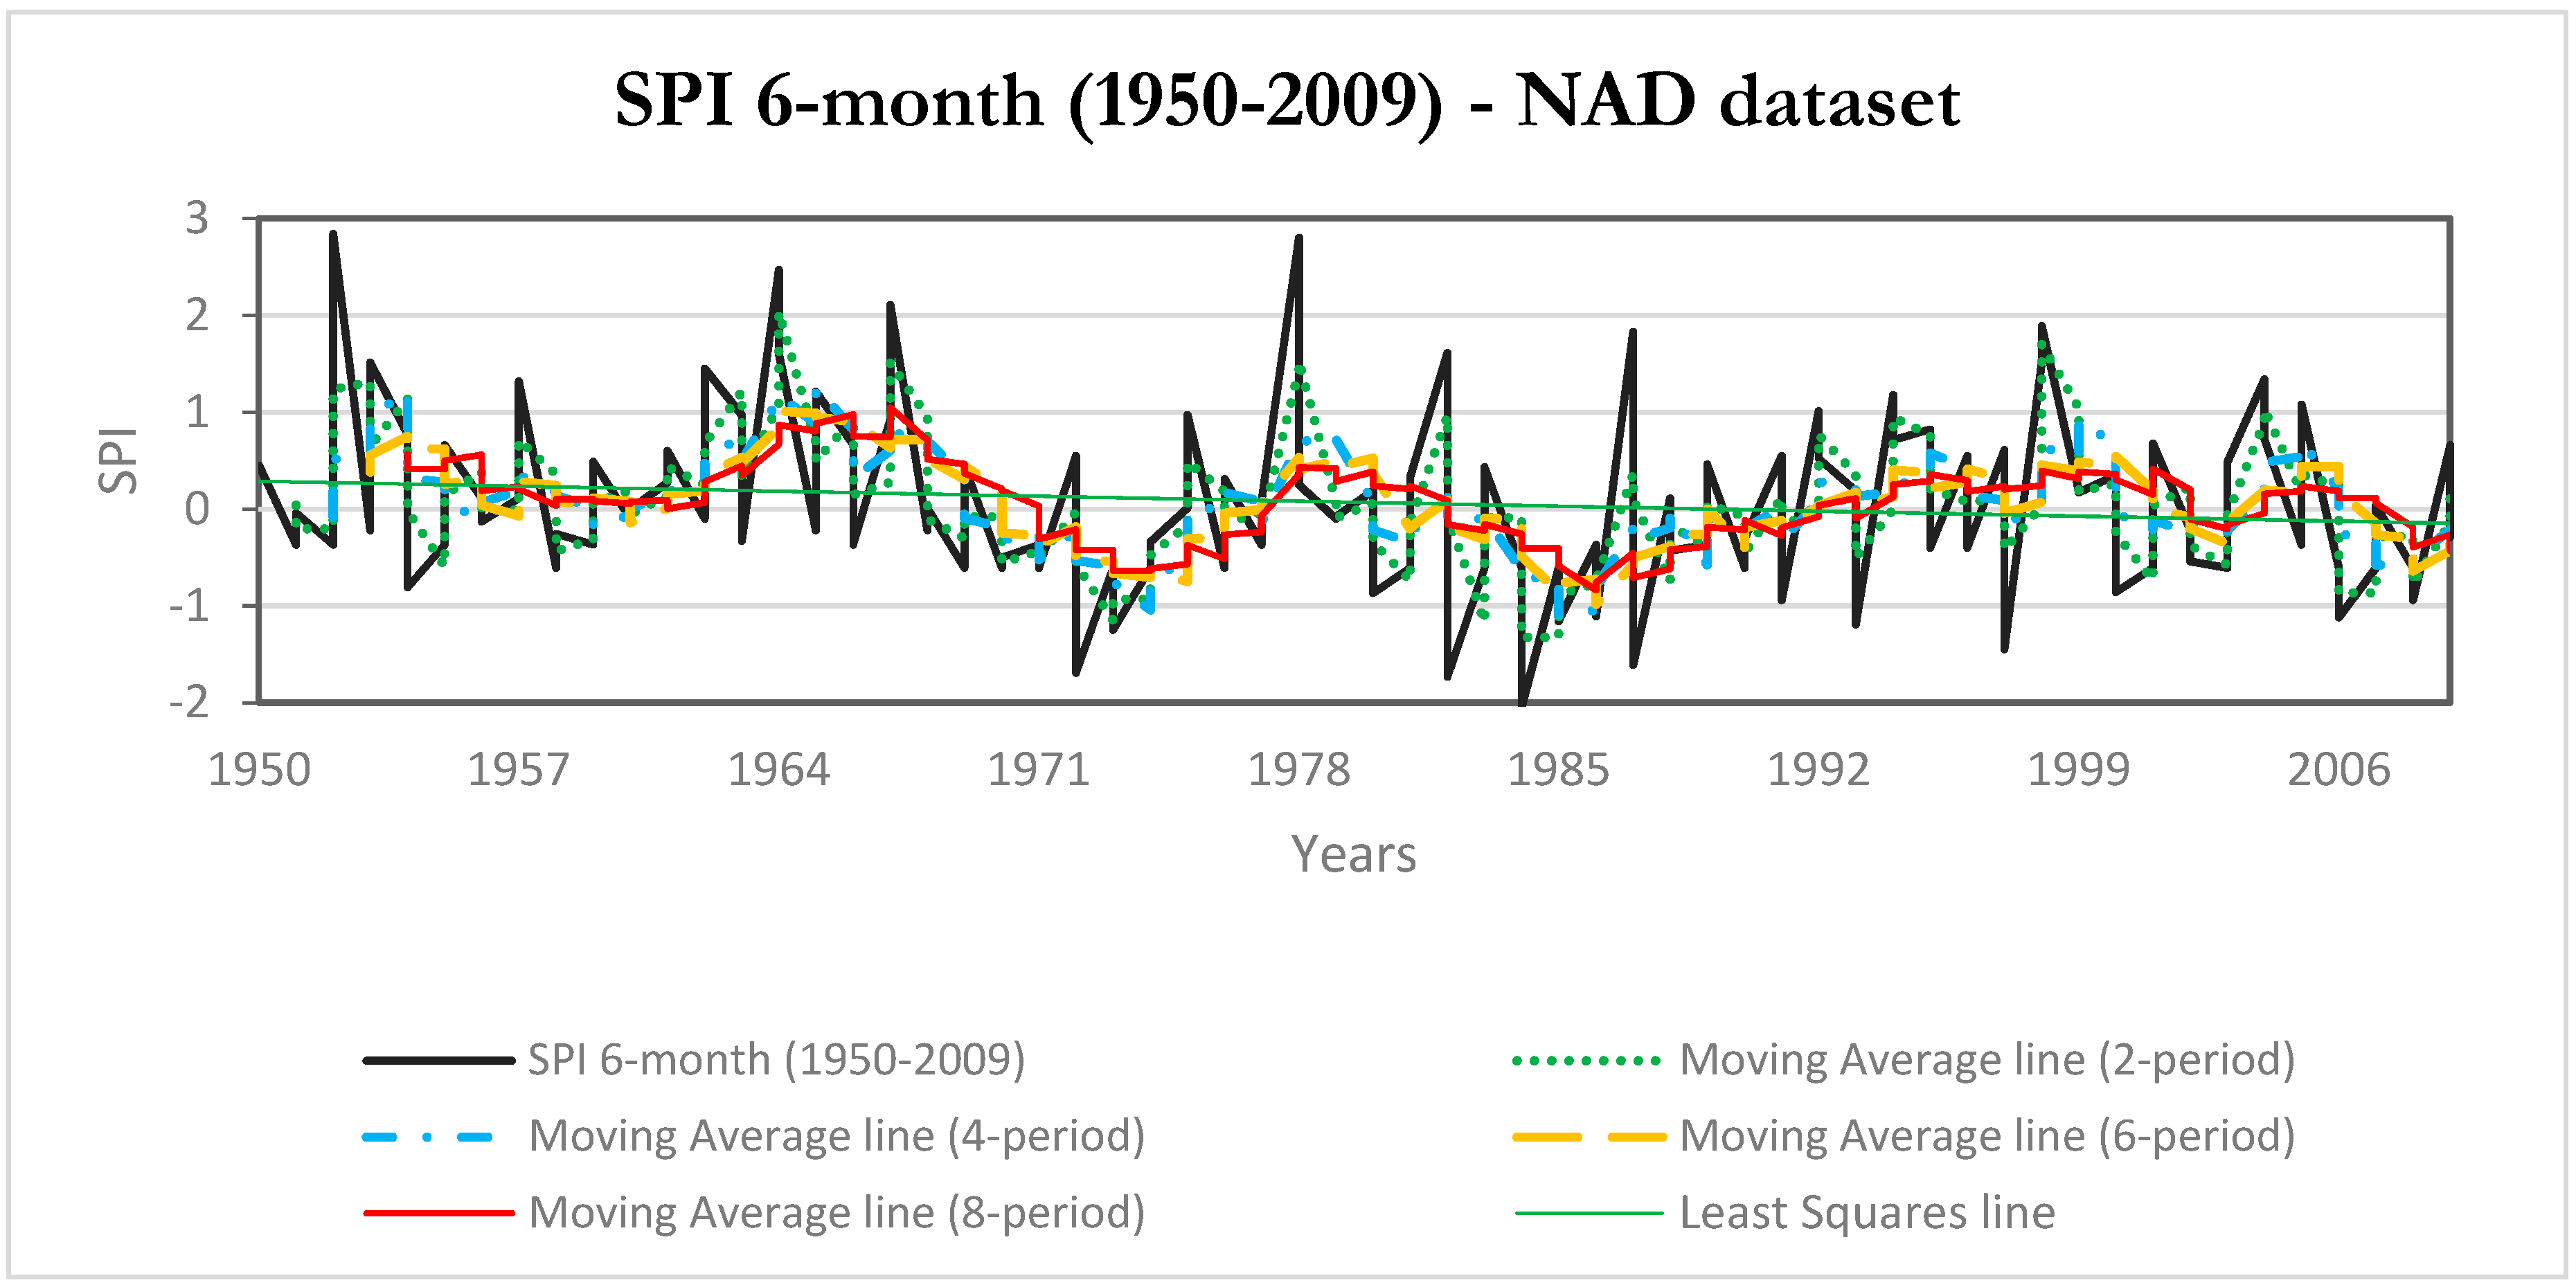
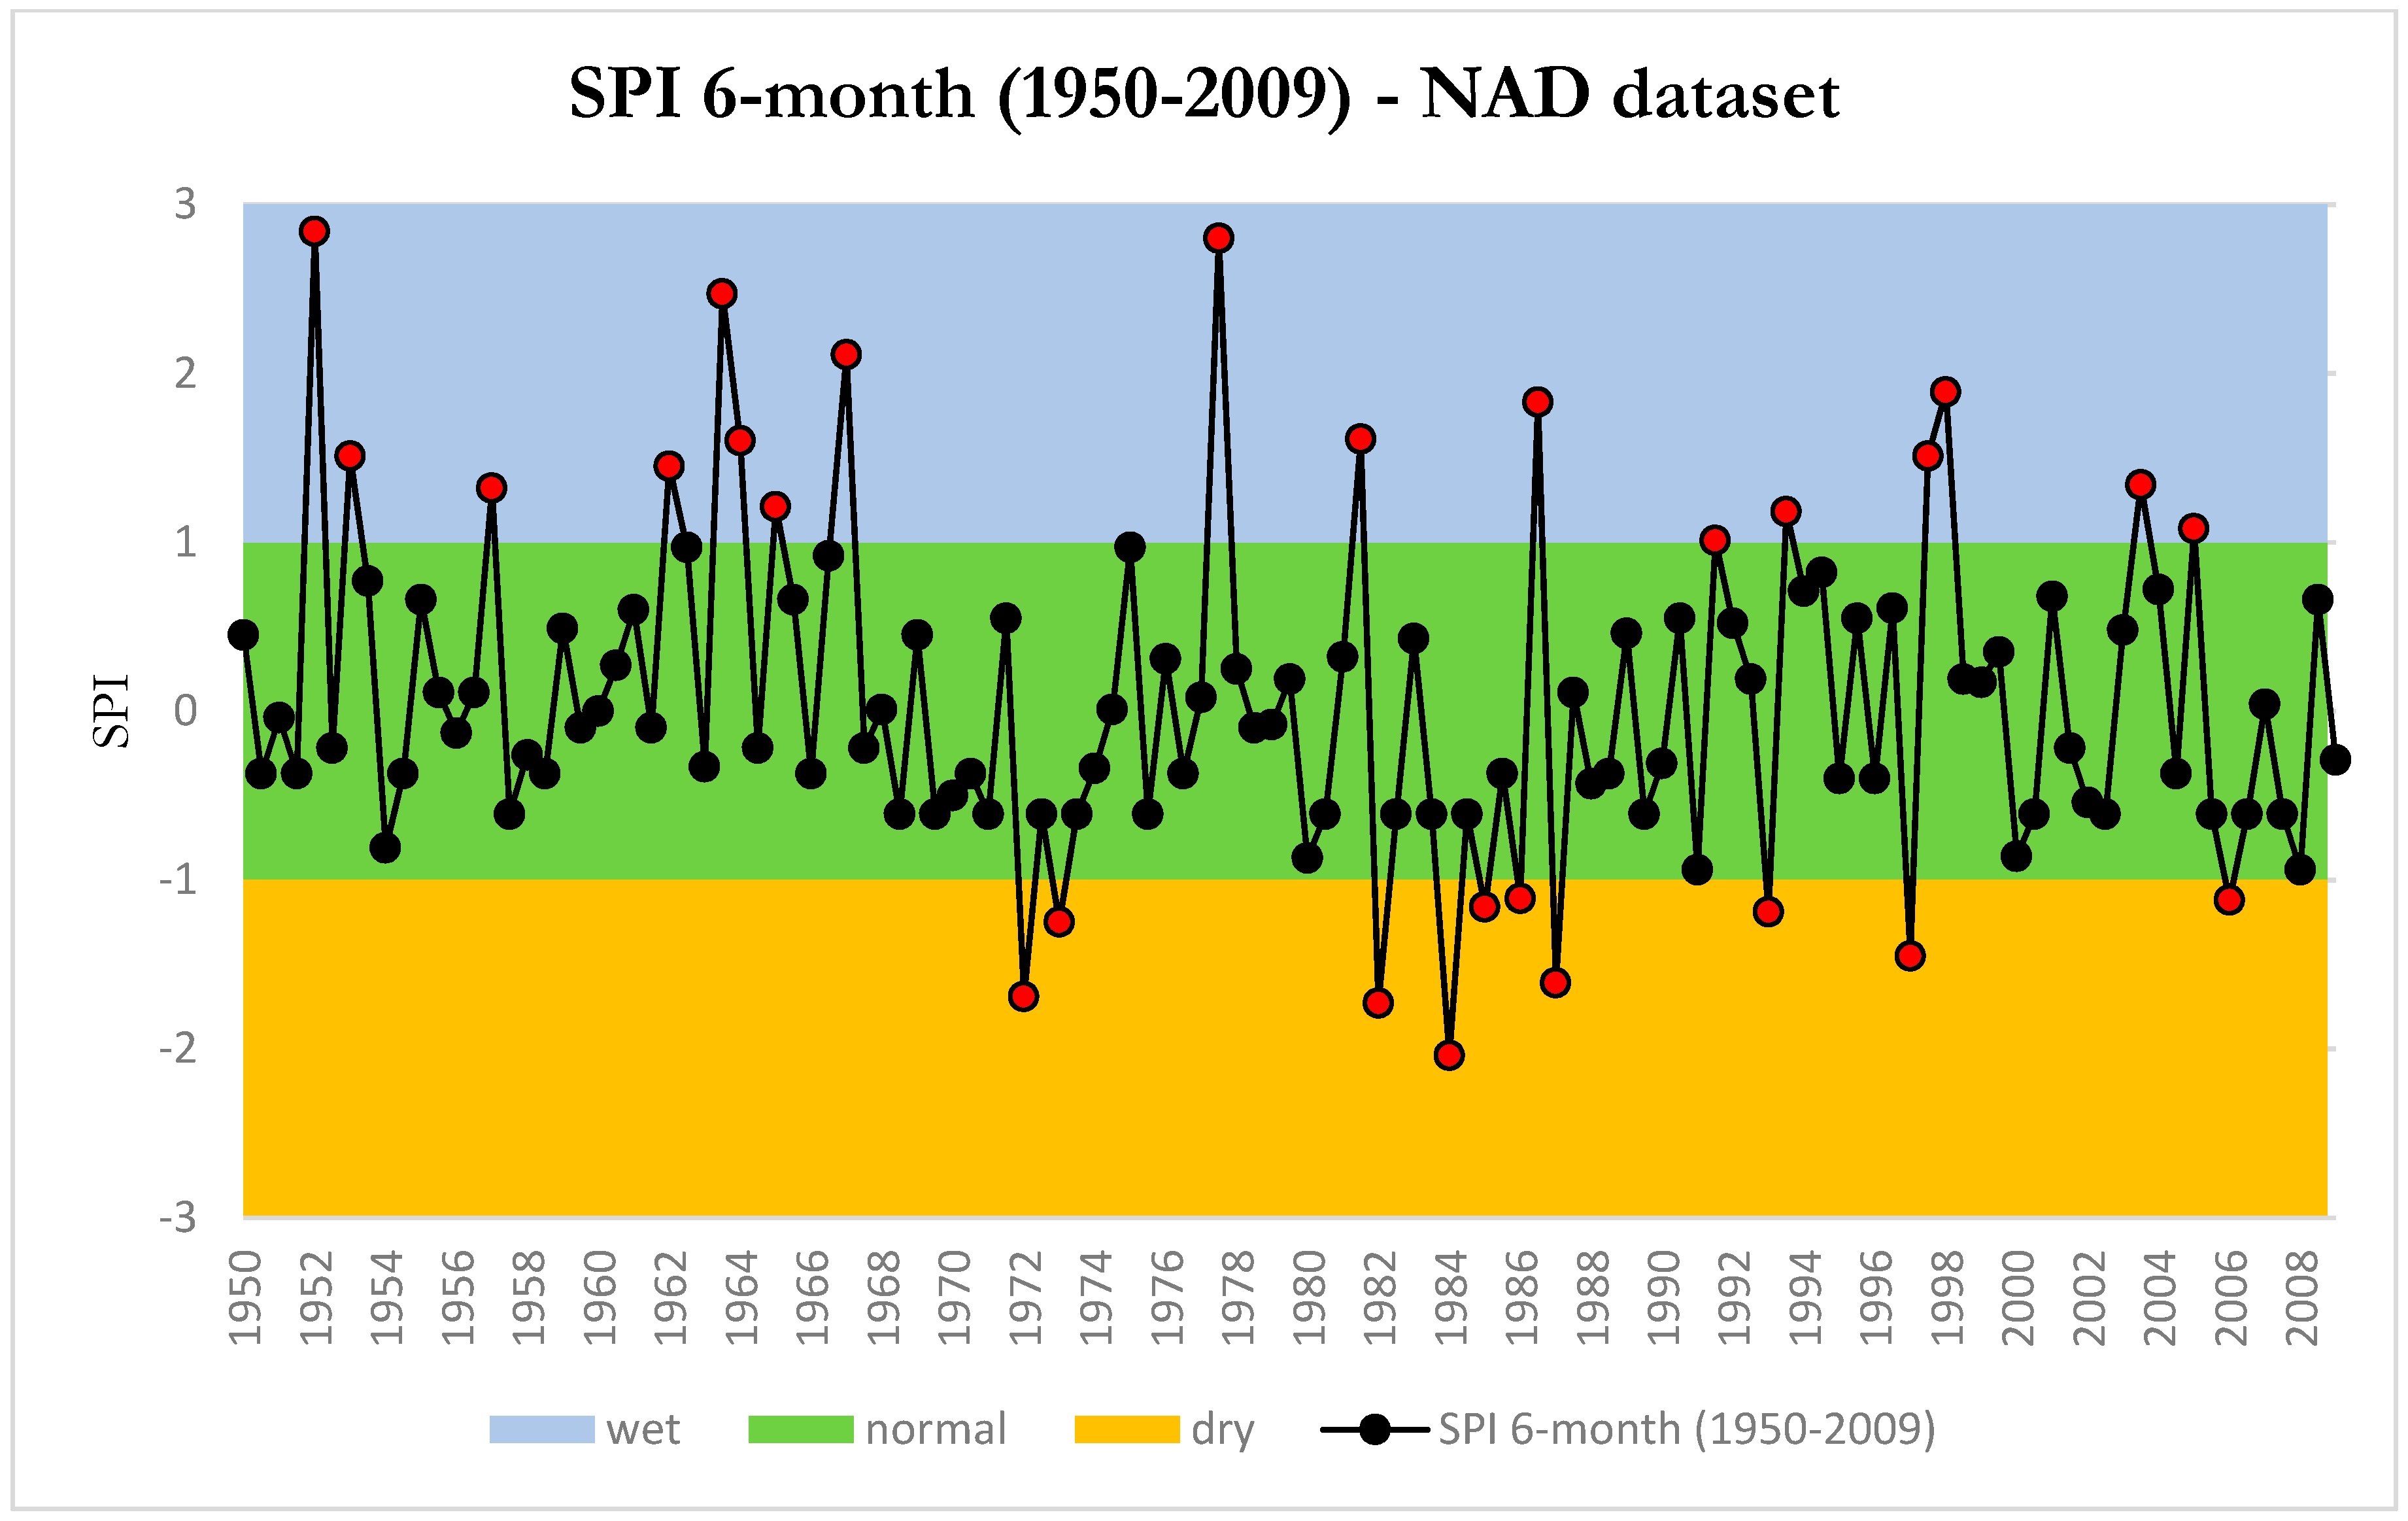
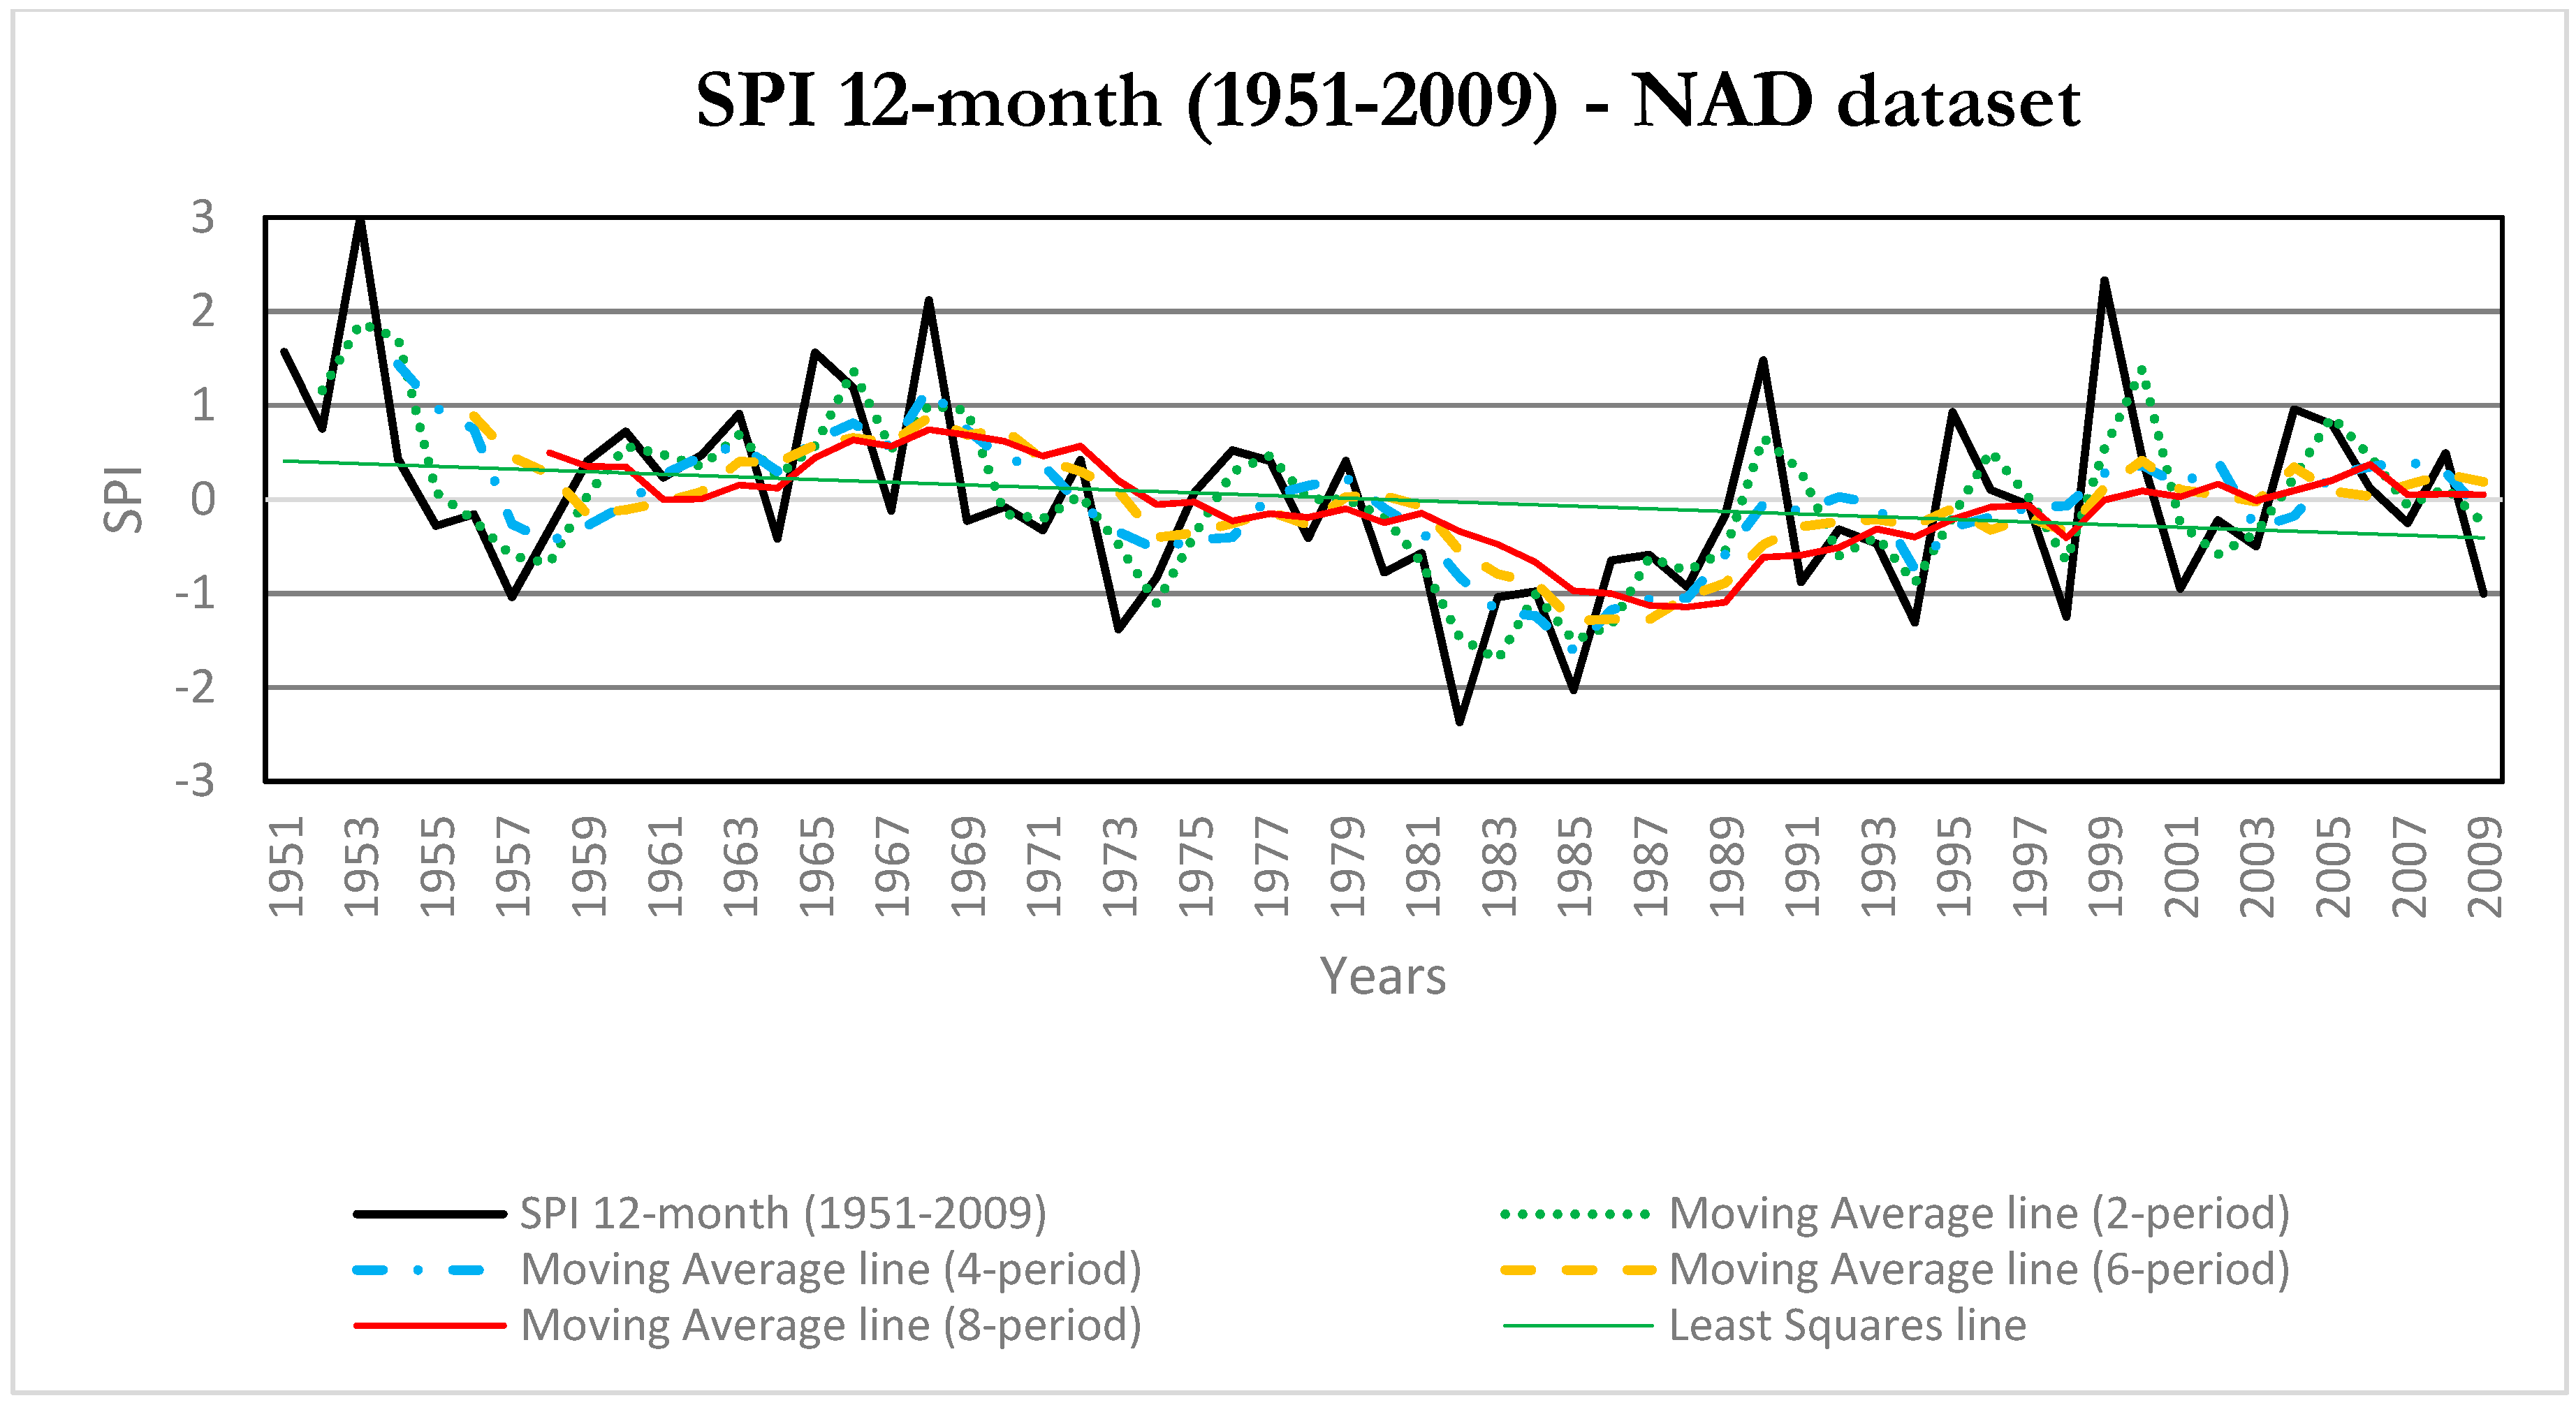
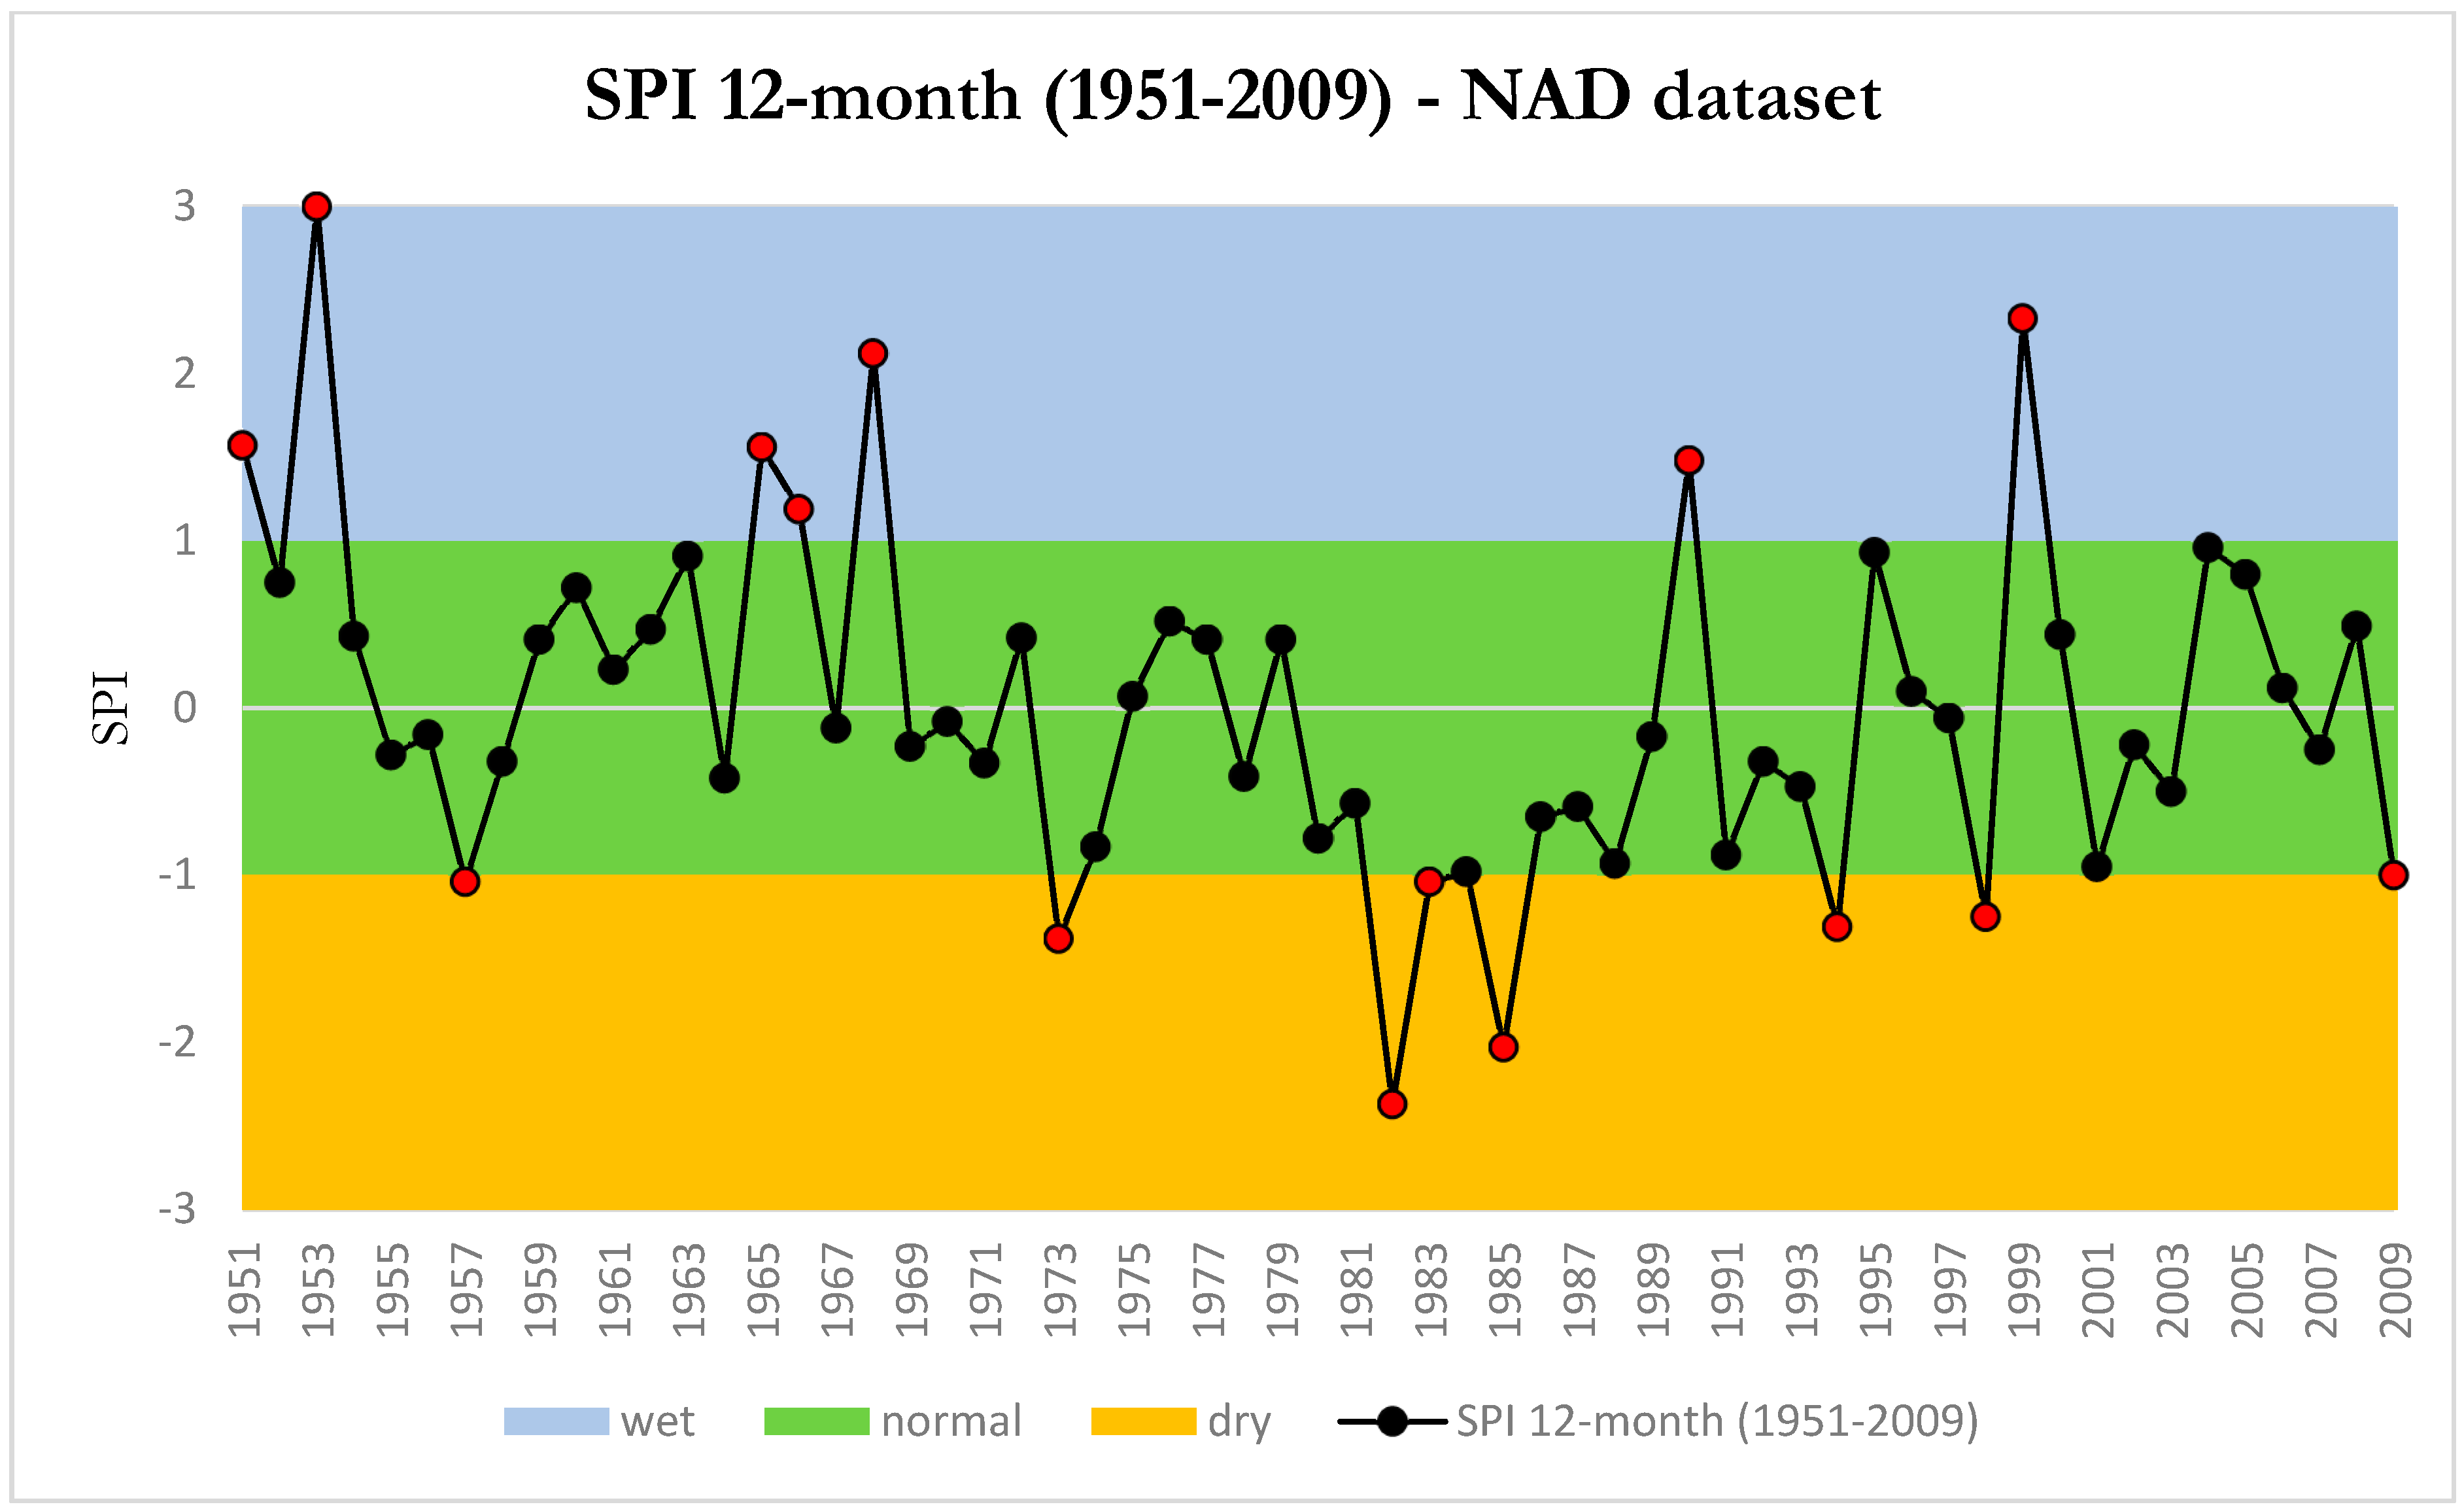
In order to help the understanding of precipitation patterns, the Least Squares regression and the Moving Average were used. The Least Squares regression identifies a downward trend, but this type of regression doesn’t represent the best fit for the data (R-squared = 0.0193). In fact, looking at Figure 4, representing SPI 6-month for the time series from 1950–2009, there is a cyclical component due to the passing of the seasons. The addition of the Moving Average lines (each period corresponds to one year) helps determine a trend which fits the data; four types of Moving Average were added in order to visualise that by increasing the period taken into consideration, the trend smoothens and becomes more defined. In particular, because of the 8-period Moving Average, it is possible to observe three cycles that occur over about 25 years and then another single cycle from 1986 to 2009. The central cycle is the main interesting one as it corresponds to the Great Drought; in effect, SPI’s values are lower than in the rest of the series, especially at the end of the cycle—early 1980s—when the drought was at its maximum. Besides the evidence, concerns may be shown related to the scarcity of number of SPI values suggesting dry periods. In fact, there is an effect due to the base period choice (containing a wet period 1950–1968) and the boundaries choice discussed also by Agnew [40]. Despite this, the drought period is still identifiable. Then, a slight upward trend is observed. Compared to Figure 5, which clearly explain the belonging of SPI values to wet, normal and dry periods, it was more common to have wetter years in the past than in the last 30 years where, at the contrary, especially in the first part, extremely negative SPI’s values were more frequent for the effect of the drought. What has been argued so far is true but less pronounced for SPI 12-month (Figure 6). In effect, two smoothed cycles are observed, the first of which ends in the early 1980s with a dry period. Cycles alternation is more visible looking at the 8-period Moving Average line. In particular, the first peak is higher than the second, confirming that the gap with the first cycle hasn’t been closed yet. Nevertheless, the trend is upward, suggesting a future increase of total precipitation. Looking at Figure 7, it is possible to identify the years when SPI deviate from the normal range.
3.4. Future Projections
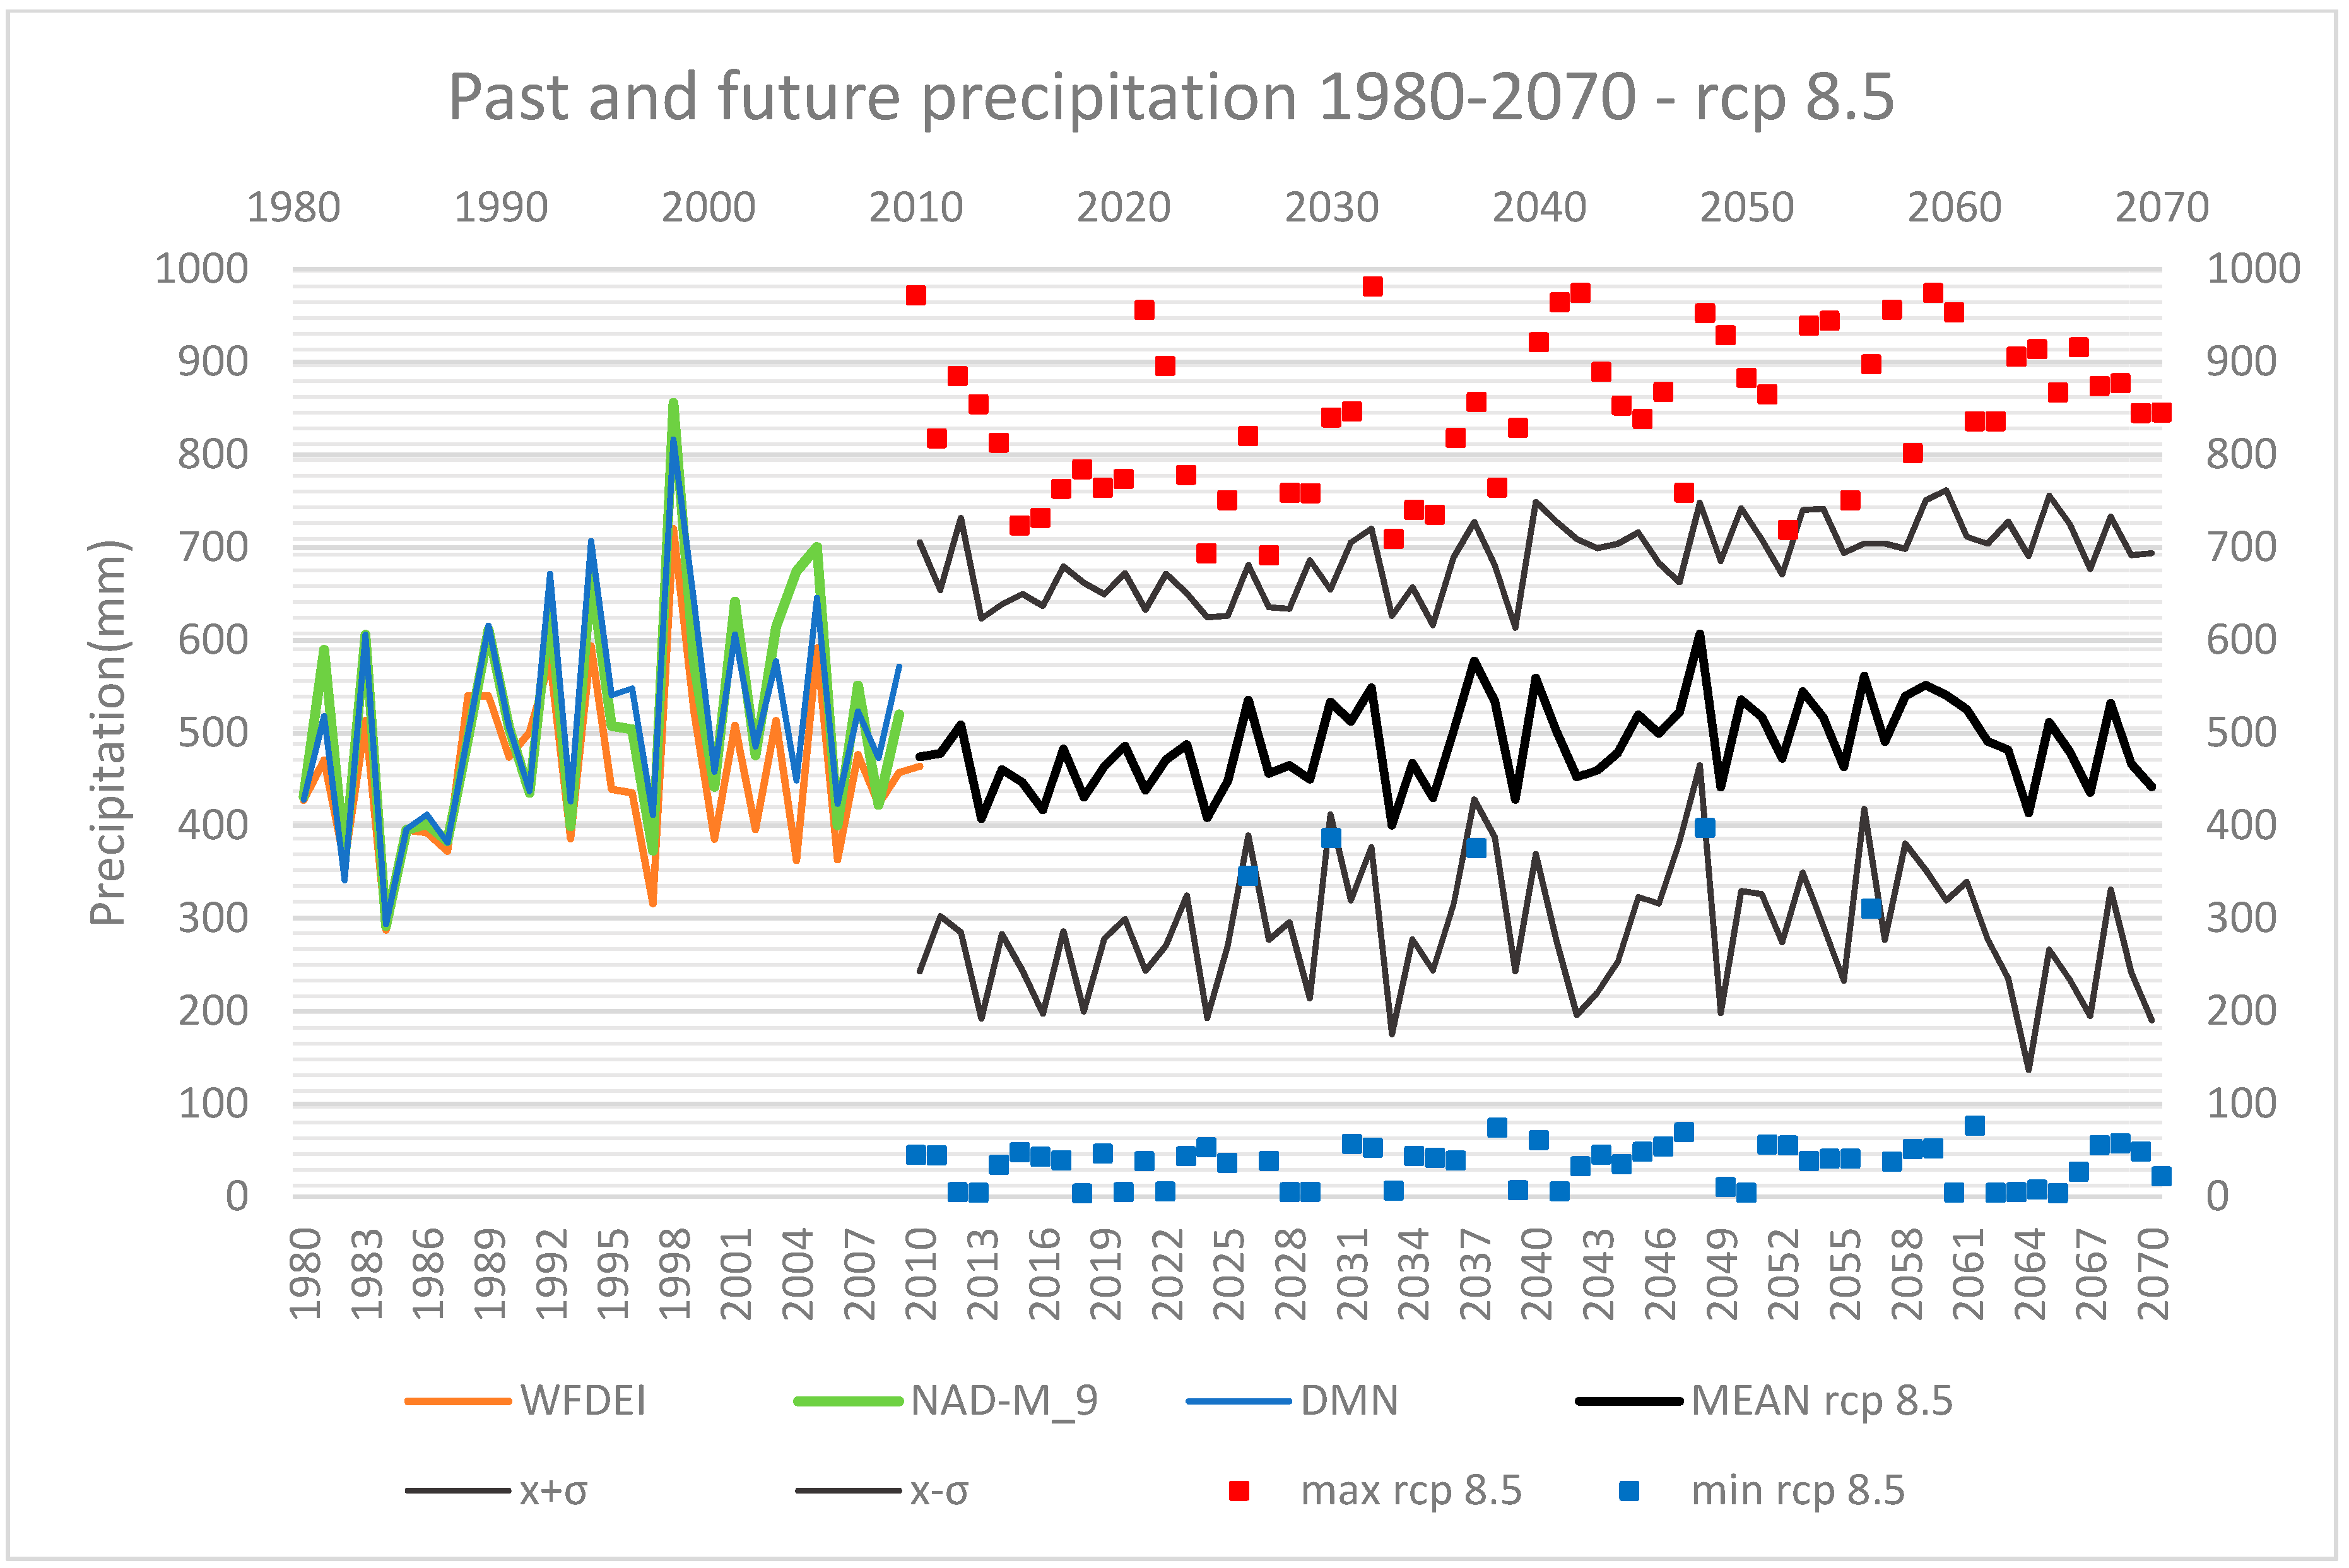
Climate projections data are adjusted with the CDFt method (Cumulative Distribution Function transformation) [41] and WATCH Forcing Data ERA Interim gridded observations between 1979 and 2005, as reference period, at a 0.5 degrees (~50 km) spatial resolution from 2006 to 2100 (projections are cut at 2070 in order to have 50 years of forecast). Among the four Representative Concentration Pathways (RCPs), this study refers to the most used scenario of future climate RCP 4.5 and RCP 8.5, which are, respectively, an intermediate scenario and a scenario with very high GHG emissions [42]. In the first scenario (RCP 4.5), the future precipitation trend (Figure 8—see MEAN rcp 4.5) is increasing; in fact, the linear regression highlights a continuous growing trend (slope coefficient = 0.4783) from 2010 to 2070. In the second scenario (RCP 8.5), the future precipitation trend (Figure 9—see MEAN rcp 8.5) increases as well (slope coefficient = 0.6474). Nevertheless, variability in simulated data, set out as x ± σ lines (where σ is the standard deviation) and as maximum and minimum values, is high, adding uncertainty in data interpretation. In this regard, x ± σ lines contain within their threshold 68.72% of events’ variability, while maximum and minimum values represent the range of variability simulated by climate models within which every possible event is represented. However, under both RCP 4.5 and RCP 8.5 conditions, future projections show an average increase of about 5–6% in the decade 2060–2070, compared with the average of the 1980s (choosing a period longer than a decade in order to identify the percentage increase would not be satisfying from the statistical significance point of view).
Future projections’ results are in accordance with results valid for west Africa and the Sahel assessed in the Fifth Assessment Report (AR5) [43] of the Intergovernmental Panel on Climate Change (IPCC). In fact, despite inter-model variation, CMIP5 models indicate a wetter core rainfall season with a small delay to rainy season by the end of the 21st century. Moreover, other regional model studies project an increase in the number of extreme rainfall days over West Africa and the Sahel during May and July [44].
4. Conclusions
This study aimed at finding long-term patterns in past precipitation time series in order to recognise future trends in precipitation projections, with particular reference to climate pathways RCP 4.5 and RCP 8.5. There is a clear pattern in past data, whether observed (DMN dataset) or simulated data (NAD-M_9 and WFDEI dataset). In fact, as reported in West Sahel’s climate trend literature, from 1950 to 2009, there was a decrease in total precipitation, mainly due to a severe drought, remembered as the Great Drought, in 1968–1985. Analysing data from 1980 to 2009, the trend is reversed and becomes an increasing one, suggesting a return to wetter condition in the West Sahel. The WMO indices and SPI index enable an in-depth trend analysis to detect climate variability and precipitation deficit/excess, respectively. RClimdex results confirm contrasting trend between 1950–2009 and 1980–2009. The former shows a decreasing trend, while in the latter, it is increasing. In particular, among WMO indices, there is a single coherence between the two periods relying on the CDD and CWD indices, confirming a shortening of the wet season in favour of the dry one. The increase in the number of consecutive dry days is greater in magnitude in the period of 1950–2009 than in the period of 1980–2009. This information may be relevant for future planning by decision makers on local food security, as not all crops are suitable to adapt to those changes. The other indices, in particular those calculated for 1980–2009, help in assessing an increase in precipitation intensity; very wet and extremely wet precipitation (R95p and R99p indices) may be identified as possible responsibles. The SPI index computed for the two different periods—6 months and 12 months—are shown in Figure 4 and Figure 6, studying in particular the Moving Average line, highlight the presence of the three cycles (wet epoch, dry epoch, moderate recovery). Furthermore, looking at precipitation projections simulated by climate models, the trend keeps growing, under the socio-economic conditions of both RCP 4.5 and RCP 8.5. Nevertheless, variability in future projections is evident (Figure 8 and Figure 9), making it difficult to identify a definitive path for future precipitation.
However, expectations in future precipitation trends foresee an average increase of about 5–6% in 2060–2070, compared with the average of the 1980s—which corresponds to an average increase of 20 mm in 50 years—both under RCP 4.5 and RCP 8.5 conditions.
Consequently, along with an increase in total precipitation and precipitation intensity, it is reasonable to expect an increase in discharge and therefore an increase in flood events. As a matter of fact, an increase in discharge of Sahelian rivers has already been observed [6,45].This observation coupled with the decrease in total precipitation after the 1950s is referred to as the Sahel Paradox [46], a phenomenon whose climatic changes and Land Use/Land Change (LULC) are deemed as drivers for increase in floods [47]. Even more so, due to the increase in total precipitation, a further increment in discharge is expected.
Thus, results of this study should raise decision makers’ awareness towards a new precipitation pattern, in particular, a greater interannual precipitation variability that can positively or negatively influence water availability, which in the future will change their approach to flood and drought risk prevention in the Niamey region.
Author Contributions
V.B.: Methodology, Formal analysis, Writing—original draft; A..: Conceptualisation, Funding acquisition, Methodology, Supervision, Validation, Writing—review & editing; M.R.: Supervision, Validation, Writing—review & editing.
Funding
This research received no external funding.
Acknowledgments
This study was undertaken in the framework of the International Cooperation Project ANADIA 2.0 financed by the Italian Ministry of Foreign Affairs and Italian Agency for Cooperation and Development. The authors would like to thank project partners and, in particular, the Direction de la Météorologie Nationale (DMN) of the Republic of Niger which provided Niamey precipitation data.
Conflicts of Interest
The authors declare no conflicts of interest.
References
- Le Barbé, L.; Lebel, T.; Tapsoba, D. Rainfall variability in West Africa during the years 1950–1990. J. Clim. 2002, 15, 187–202. [Google Scholar] [CrossRef]
- Lebel, T.; Ali, A. Recent trends in the Central and Western Sahel rainfall regime (1990–2007). J. Hydrol. 2009, 375, 52–64. [Google Scholar] [CrossRef]
- Siebert, A.; Ward, M.N. Exploring the frequency of hydroclimate extremes on the River Niger using historical data analysis and Monte Carlo methods. Afr. Geogr. Rev. 2013, 33, 124–149. [Google Scholar] [CrossRef]
- Lebel, T.; Cappelaere, B.; Galle, S.; Hanan, N.; Kergoat, L.; Levis, S.; Vieux, B.; Descroix, L.; Gosset, M.; Mougin, E.; et al. AMMA-CATCH studies in the Sahelian region of West-Africa: An overview. J. Hydrol. 2009, 375, 3–13. [Google Scholar] [CrossRef] [Green Version]
- Nicholson, S.E. On the question of the “recovery” of the rains in the West African Sahel. J. Arid Environ. 2005, 63, 615–641. [Google Scholar] [CrossRef]
- Descroix, L.; Mahé, G.; Lebel, T.; Favreau, G.; Galle, S.; Gautier, E.; Olivry, J.C.; Albergel, J.; Amogu, O.; Cappelaere, B.; et al. Spatio-temporal variability of hydrological regimes around the boundaries between Sahelian and Sudanian areas of West Africa: A synthesis. J. Hydrol. 2009, 375, 90–102. [Google Scholar] [CrossRef]
- Le Barbé, L.; Lebel, T. Rainfall climatology of the HAPEX-Sahel region during the years 1950–1990. J. Hydrol. 1997, 188, 43–73. [Google Scholar] [CrossRef]
- L’Hote, Y.; Mahe, G.; Some, B. The 1990s rainfall in the Sahel: The third driest decade since the beginning of the century. Hydrol. Sci. J. 2003, 48, 493–496. [Google Scholar] [CrossRef]
- L’Hôte, Y.; Mahé, G.; Somé, B.; Triboulet, J.P. Analysis of a Sahelian annual rainfall index from 1896 to 2000; the drought continues. Hydrol. Sci. J. 2002, 47, 563–572. [Google Scholar] [CrossRef] [Green Version]
- Mahé, G.; Paturel, J.E. 1896–2006 Sahelian annual rainfall variability and runoff increase of Sahelian Rivers. C. R. Geosci. 2009, 341, 538–546. [Google Scholar] [CrossRef]
- Nicholson, S.E. The West African Sahel: A review of recent studies on the rainfall regime and its interannual variability. ISRN Meteorol. 2013, 2013. [Google Scholar] [CrossRef]
- Messager, C.; Gallée, H.; Brasseur, O.; Cappelaere, B.; Peugeot, C.; Séguis, L.; Vauclin, M.; Ramel, R.; Grasseau, G.; Léger, L.; et al. Influence of observed and RCM-simulated precipitation on the water discharge over the Sirba basin, Burkina Faso/Niger. Clim. Dyn. 2006, 27, 199–214. [Google Scholar] [CrossRef]
- Ali, A.; Amani, A.; Diedhiou, A.; Lebel, T. Rainfall estimation in the Sahel. Part II: Evaluation of rain gauge networks in the CILSS countries and objective intercomparison of rainfall products. J. Appl. Meteorol. 2005, 44, 1707–1722. [Google Scholar] [CrossRef]
- Terhune, A. Damaging rainfall and flooding: The other Sahel Hazards. Clim. Chang. 2005, 72, 355–377. [Google Scholar] [CrossRef]
- Panthou, G.; Vischel, T.; Lebel, T. Recent trends in the regime of extreme rainfall in the Central Sahel. Int. J. Climatol. 2014, 34, 3998–4006. [Google Scholar] [CrossRef] [Green Version]
- Mouhamed, L.; Traore, S.B.; Alhassane, A.; Sarr, B. Evolution of some observed climate extremes in the West African Sahel. Weather Clim. Extremes 2013, 1, 19–25. [Google Scholar] [CrossRef]
- Ozer, P.; Houstonian, Y.; Manzo, O.L. Evolution des caractéristiques pluviométriques dans l’est du Niger de 1940 à 2007. Geo-Eco-Trop 2009, 33, 11–30. [Google Scholar]
- Ali, A.; Lebel, T. The Sahelian standardized rainfall index revisited. Int. J. Climatol. 2009, 29, 1705–1714. [Google Scholar] [CrossRef] [Green Version]
- Barry, A.A.; Caesar, J.; Klein Tank, A.M.; Aguilar, E.; McSweeney, C.; Cyrille, A.M.; Nikiema, M.P.; Narcisse, K.B.; Sima, F.; Stafford, G.; et al. West Africa climate extremes and climate change indices. Int. J. Climatol. 2018, 38, 921–938. [Google Scholar] [CrossRef]
- Oguntunde, P.G.; Lischeid, G.; Abiodun, B.J. Impacts of climate variability and change on drought characteristics in the Niger River Basin, West Africa. Stoch. Environ. Res. Risk Assess. 2018, 32, 1017–1034. [Google Scholar] [CrossRef]
- Lebel, T.; Taupin, J.D.; D’Amato, N. Rainfall monitoring during the HAPEX-Sahel. 1. General rainfall conditions and climatology. J. Hydrol. 1997, 188, 74–96. [Google Scholar] [CrossRef]
- Shinoda, M.; Okatani, T.; Salomoun, M. Diurnal variations of rainfall over Niger in the West African Sahel: A comparison between wet and drought years. Int. J. Climatol. 1999, 19, 81–94. [Google Scholar] [CrossRef]
- Casse, C.; Gosset, M.; Peugeot, C.; Pedinotti, V.; Boone, A.; Tanimoun, B.A.; Decharme, B. Potential of satellite rainfall products to predict Niger River flood events in Niamey. Atmos. Res. 2015, 163, 162–176. [Google Scholar] [CrossRef]
- Casse, C.; Gosset, M.; Vischel, T.; Quantin, G.; Tanimoun, B.A. Model-based study of the role of rainfall and land use–land cover in the changes in the occurrence and intensity of Niger red floods in Niamey between 1953 and 2012. Hydrol. Earth Syst. Sci. 2016, 20, 2841–2859. [Google Scholar] [CrossRef] [Green Version]
- Karl, T.R.; Nicholls, N.; Ghazi, A. Clivar/GCOS/WMO workshop on indices and indicators for climate extremes workshop summary in Weather and Climate Extremes. Clim. Chang. 1999, 42, 3–7. [Google Scholar] [CrossRef]
- Peterson, T.; Folland, C.; Gruza, G.; Hogg, W.; Mokssit, A.; Plummer, N. Report on the Activities of the Working Group on Climate Change Detection and Related Rapporteurs; World Meteorological Organization: Geneva, Switzerland, 2001. [Google Scholar]
- Svoboda, M.; Hayes, M.; Wood, D. Standardized Precipitation Index User Guide; World Meteorological Organization: Geneva, Switzerland, 2012. [Google Scholar]
- Guttman, N.B. Accepting the standardized precipitation index: A calculation algorithm. JAWRA J. Am. Water Resour. Assoc. 1999, 35, 311–322. [Google Scholar] [CrossRef]
- McKee, T.B.; Doesken, N.J.; Kleist, J. The relationship of drought frequency and duration to time scale. In Proceedings of the Eighth Conference on Applied Climatology, Anaheim, CA, USA, 17–22 January 1993; American Meteorological Society: Boston, MA, USA, 1993; pp. 179–184. [Google Scholar]
- Leauthaud, C.; Cappelaere, B.; Demarty, J.; Guichard, F.; Velluet, C.; Kergoat, L.; Vischel, T.; Grippa, M.; Mouhaimouni, M.; Bouzou Moussa, I.; et al. A 60-year reconstructed high-resolution local meteorological data set in Central Sahel (1950–2009): Evaluation, analysis and application to land surface modelling. Int. J. Climatol. 2017, 37, 2699–2718. [Google Scholar] [CrossRef]
- A 60-Year Reconstructed High-Resolution Local Meteorological Dataset in Central Sahel (1950–2009). Available online: http://www.amma-catch.org/spip.php?article240&lang=fr (accessed on 30 July 2017).
- Barbier, J.; Guichard, F.; Bouniol, D.; Couvreux, F.; Roehrig, R. Detection of Intraseasonal Large-Scale Heat Waves: Characteristics and Historical Trends during the Sahelian Spring. J. Clim. 2018, 31, 61–80. [Google Scholar] [CrossRef]
- Kottek, M.; Grieser, J.; Beck, C.; Rudolf, B.; Rubel, F. World map of the Köppen-Geiger climate classification updated. Meteorol. Z. 2006, 15, 259–263. [Google Scholar] [CrossRef]
- EU WATCH-Data Availability. Available online: http://www.eu-watch.org/data_availability (accessed on 7 May 2018).
- ETCCDI/CRD Climate Change Indices-Software. Available online: http://etccdi.pacificclimate.org/software.shtml (accessed on 12 October 2017).
- WMO. Technical Regulations, Basic Documents No. 2, Volume I, General Meteorological Standards and Recommended Practices; Updated in 2017; WMO: Geneva, Switzerland, 2015; ISBN 978-92-63-10049-8. [Google Scholar]
- Murphy, A.H.; Brown, B.G.; Chen, Y. Diagnostic verification of temperature forecasts. Weather Forecast. 1989, 4, 485–501. [Google Scholar] [CrossRef]
- Wilks, D.S. Statistical Methods in the Atmospheric Sciences, 1st ed.; Academic Press: San Diego, CA, USA, 1995; ISBN 0-12-751965-3. [Google Scholar]
- Ready to Use Future Climate Information. Available online: https://theclimatedatafactory.com/ (accessed on 30 April 2017).
- Agnew, C.T. Using the SPI to identify drought. Drought Netw. News 2000, 12, 6–12. [Google Scholar]
- Vrac, M.; Noël, T.; Vautard, R. Bias correction of precipitation through Singularity Stochastic Removal: Because occurrences matter. J. Geophys. Res. Atmos. 2016, 121, 5237–5258. [Google Scholar] [CrossRef]
- Pachauri, R.K.; Allen, M.R.; Barros, V.R.; Broome, J.; Cramer, W.; Christ, R.; Church, J.A.; Clarke, L.; Dahe, Q.; Dasgupta, P.; et al. Climate Change 2014: Synthesis Report; Contribution of Working Groups I, II and III to the Fifth Assessment Report of the Intergovernmental Panel on Climate Change; IPCC: Geneva, Switzerland, 2014. [Google Scholar]
- Barros, V.R.; Field, C.B.; Dokken, D.J.; Mastrandrea, M.D.; Mach, K.J.; Bilir, T.E.; Chatterjee, M.; Ebi, K.L.; Estrada, Y.O.; Genova, R.C.; et al. Climate Change 2014: Impacts, Adaptation, and Vulnerability Part. B: Regional Aspects; Contribution of Working Group II to the Fifth Assessment Report of the Intergovernmental Panel on Climate Change; Cambridge University Press: Cambridge, UK; New York, NY, USA, 2014; p. 688. [Google Scholar]
- Vizy, E.K.; Cook, K.H. Mid-twenty-first-century changes in extreme events over northern and tropical Africa. J. Clim. 2012, 25, 5748–5767. [Google Scholar] [CrossRef]
- Mahe, G.; Paturel, J.E.; Servat, E.; Conway, D.; Dezetter, A. The impact of land use change on soil water holding capacity and river flow modelling in the Nakambe River, Burkina-Faso. J. Hydrol. 2005, 300, 33–43. [Google Scholar] [CrossRef]
- Sighomnou, D.; Descroix, L.; Genthon, P.; Mahé, G.; Moussa, I.B.; Gautier, E.; Mamadou, I.; Vandervaere, J.P.; Bachir, T.; Coulibaly, B.; et al. La crue de 2012 à Niamey: Un paroxysme du paradoxe du Sahel? Sécheresse 2013, 24, 3–13. [Google Scholar] [CrossRef]
- Aich, V.; Liersch, S.; Vetter, T.; Andersson, J.; Müller, E.N.; Hattermann, F.F. Climate or land use?—Attribution of changes in river flooding in the Sahel Zone. Water 2015, 7, 2796–2820. [Google Scholar] [CrossRef]
Figure 1.
Location of the Niamey airport station (Republic of Niger).

Figure 2.
Cumulative annual time plot for DMN and NAD-M_9 datasets and WATCH-Forcing-Data-ERA-Interim (solid line) and 8-period (8 year) Moving Average (dashed line).
Figure 2.
Cumulative annual time plot for DMN and NAD-M_9 datasets and WATCH-Forcing-Data-ERA-Interim (solid line) and 8-period (8 year) Moving Average (dashed line).

Figure 3.
Precipitation standard year. DMN dataset: observed precipitation dataset (1980–2012) measured at Niamey airport station made available by the Direction de la Météorologie Nationale (DMN). NAD dataset (Niamey Airport-derived dataset): simulated precipitation series (1950–2009) for Niamey Airport.

Figure 4.
SPI 6-month (1950–2009) with tendency lines (Least Squares line and Moving average: 2-, 4-, 6-, 8-period)—NAD dataset.
Figure 4.
SPI 6-month (1950–2009) with tendency lines (Least Squares line and Moving average: 2-, 4-, 6-, 8-period)—NAD dataset.

Figure 5.
SPI 6-month (1950–2009) with wet, normal and dry bands—NAD dataset (red circles identify the years when SPI deviate from the normal range).
Figure 5.
SPI 6-month (1950–2009) with wet, normal and dry bands—NAD dataset (red circles identify the years when SPI deviate from the normal range).

Figure 6.
SPI 12-month (1950–2009) with tendency lines (Least Squares line and Moving average: 2-, 4-, 6-, 8-period)—NAD dataset.
Figure 6.
SPI 12-month (1950–2009) with tendency lines (Least Squares line and Moving average: 2-, 4-, 6-, 8-period)—NAD dataset.

Figure 7.
SPI 6-month (1950–2009) with wet, normal and dry bands—NAD dataset (red circles identify the years when SPI deviate from the normal range).
Figure 7.
SPI 6-month (1950–2009) with wet, normal and dry bands—NAD dataset (red circles identify the years when SPI deviate from the normal range).

Figure 8.
Past and future precipitation 1980–2070—rcp 4.5.

Figure 9.
Past and future precipitation 1980–2070—rcp 8.5.


Table 1.
Major findings attributable to the study area.
| Year of Publication | Author | Major Findings | Study Area | Study Period |
|---|---|---|---|---|
| 1997 | [21] Lebel et al. | Study of rainfall and climatic conditions | Niamey | 1990–1993 |
| 1997 | [7] Le Barbè and Lebel | Rainfall pattern analysis | Niamey | 1950–1990 |
| 1999 | [22] Shinoda et al. | Comparative study of the diurnal variations of 3-hourly rainfall | Niamey | 1950s–1990s |
| 2003 | [8] L’Hote et al. | Decrease in mean annual rainfall | Sahel | 1970s–1990s |
| 2005 | [5] Nicholson | Rainfall increase, wetter condition in West Sahel | West Sahel | 1998–2003 |
| 2009 | [17] Ozer et al. | Decreasing trend in total precipitation and extreme precipitations | Republic of Niger | 1940–2007 |
| 2009 | [18] Ali and Lebel | Probable existence of an east-west gradient (higher proportion of wet days in East Niger over the period) | Republic of Niger | 1993–2006 |
| 2018 | [19] Barry et al. | Decrease in total precipitation | West Africa | 1960–2010 |
| 2018 | [20] Oguntunde et al. | Increased number of heavy and very heavy events and future projections until 2100 | Niger River Basin | 1986–2005 |
Table 2.
RClimdex precipitation indices.
| ID | Indicator Name | Unit |
|---|---|---|
| RX1day | Max. 1-day precipitation amount. Monthly maximum 1-day precipitation. | mm |
| Rx5day | Max. 5-day precipitation amount. Monthly maximum consecutive 5-day precipitation. | mm |
| SDII | Simple daily intensity index. Annual total precipitation divided by the number of wet days (defined as PRCP ≥ 1.0 mm) in the year. | mm/day |
| R10 | Number of heavy precipitation days. Annual count of days when PRCP ≥ 10 mm. | Days |
| R20 | Number of very heavy precipitation day. Annual count of days when PRCP ≥ 20 mm. | Days |
| Rnn | Number of days above nn (50, 100, 150) mm. Annual count of days when PRCP ≥ nn mm, nn is user defined threshold. | Days |
| CDD | Consecutive dry days. Maximum number of consecutive days with RR < 1 mm. | Days |
| CWD | Consecutive wet days. Maximum number of consecutive days with RR ≥ 1 mm. | Days |
| R95p | Very wet days. Annual total PRCP when RR > 95th percentile. | mm |
| R99p | Extremely wet days. Annual total PRCP when RR > 99th percentile. | mm |
| PRCPTOT | Annual total wet-day precipitation. Annual total PRCP in wet days (RR ≥ 1 mm). | mm |
Table 3.
The SPI value is the number of standard deviations by which the observed anomaly deviates from the long-term mean. SPI values from −2.0 and less to −1.0 identify dry periods, from −0.99 to 0.99 identify near normal periods and from 1.0 to 2.0+ identify wet periods.
Table 3.
The SPI value is the number of standard deviations by which the observed anomaly deviates from the long-term mean. SPI values from −2.0 and less to −1.0 identify dry periods, from −0.99 to 0.99 identify near normal periods and from 1.0 to 2.0+ identify wet periods.
| SPI Values | |
|---|---|
| 2.0+ | Extremely wet |
| 1.5 to 1.99 | Very wet |
| 1.0 to 1.49 | Moderately wet |
| −0.99 to 0.99 | Near normal |
| −1.0 to −1.49 | Moderately dry |
| −1.5 to −1.99 | Very dry |
| −2.0 and less | Extremely dry |
Table 4.
Diagnostic verification for precipitation data for each NAD-M ensemble: correlation, MSE, RMSE and identity. The best ranked ensemble is highlighted in grey.
Table 4.
Diagnostic verification for precipitation data for each NAD-M ensemble: correlation, MSE, RMSE and identity. The best ranked ensemble is highlighted in grey.
| Correlation | MSE | RMSE | Identity | ||||||
|---|---|---|---|---|---|---|---|---|---|
| Rank | Rank | Rank | True | False | Rank | ||||
| NAD-M_1 | 0.6631 | 7 | 25.1712 | 7 | 5.0171 | 7 | 9339 | 1619 | 3 |
| NAD-M_2 | 0.6771 | 4 | 23.9598 | 4 | 4.8949 | 4 | 9340 | 1618 | 2 |
| NAD-M_3 | 0.6411 | 9 | 26.8923 | 9 | 5.1858 | 9 | 9315 | 1643 | 7 |
| NAD-M_4 | 0.6299 | 10 | 28.7196 | 10 | 5.3591 | 10 | 9313 | 1645 | 9 |
| NAD-M_5 | 0.6828 | 2 | 23.4805 | 3 | 4.8457 | 3 | 9309 | 1649 | 10 |
| NAD-M_6 | 0.6717 | 6 | 24.7032 | 6 | 4.9702 | 6 | 9324 | 1634 | 5 |
| NAD-M_7 | 0.6540 | 8 | 25.9240 | 8 | 5.0916 | 8 | 9314 | 1644 | 8 |
| NAD-M_8 | 0.6823 | 3 | 23.3331 | 2 | 4.8304 | 2 | 9320 | 1638 | 6 |
| NAD-M_9 | 0.6844 | 1 | 23.3269 | 1 | 4.8298 | 1 | 9335 | 1623 | 4 |
| NAD-M_10 | 0.6768 | 5 | 24.2649 | 5 | 4.9259 | 5 | 9348 | 1610 | 1 |
Table 5.
Descriptive statistics of DMN, NAD-M_9 datasets and WATCH-Forcing-Data-ERA-Interim.
| DMN | NAD-M_9 | WFDEI | |
|---|---|---|---|
| MEAN VALUE [mm] | 513.8433 | 515.8333 | 458.2303 |
| MAX VALUE [mm] | 816.6 | 855.9 | 720.4756 |
| MIN VALUE [mm] | 293.8 | 292 | 287.6057 |
| 25th PERCENTILE [mm] | 425.775 | 401.55 | 386.1046 |
| 75th PERCENTILE [mm] | 606.125 | 611.85 | 516.0072 |
| 50th PERCENTILE [mm] | 502.8 | 504.8 | 448.3169 |
| STANDARD DEVIATION [mm] | 116.391 | 126.0978 | 94.37051 |
| CORRELATION (with DMN dataset) | 0.905741 | 0.914621 |
Table 6.
Trends in annual precipitation indices at Niamey based on NAD-M_9 dataset (in italic values without statistical significance; in black underlined values with statistical significance at 10%, in bold values with statistical significance at 5%). Positive values report an increasing trend while negative values report a decreasing trend (see Table 2 for the definition of the acronyms).
| RX1day | Rx5day | SDII | R10 | R20 | R30 | R40 | R50 | CDD | CWD | R95p | R99p | PTOT | |
|---|---|---|---|---|---|---|---|---|---|---|---|---|---|
| 1950–2009 (A) | −0.249 | −0.365 | −0.002 | −0.05 | −0.039 | −0.039 | −0.012 | −0.004 | 0.414 | −0.02 | −0.664 | −0.346 | −2.29 |
| 1980–2009 (B) | 0.565 | 1.215 | 0.111 | 0.073 | 0.127 | 0.079 | 0.052 | 0.027 | 0.259 | −0.036 | 2285 | 0.345 | 4.316 |
| Coherent trend between case A and case B | + | - |
© 2018 by the authors. Licensee MDPI, Basel, Switzerland. This article is an open access article distributed under the terms and conditions of the Creative Commons Attribution (CC BY) license (http://creativecommons.org/licenses/by/4.0/).
Share and Cite
MDPI and ACS Style
Bigi, V.; Pezzoli, A.; Rosso, M. Past and Future Precipitation Trend Analysis for the City of Niamey (Niger): An Overview. Climate 2018, 6, 73. https://0-doi-org.brum.beds.ac.uk/10.3390/cli6030073
AMA Style
Bigi V, Pezzoli A, Rosso M. Past and Future Precipitation Trend Analysis for the City of Niamey (Niger): An Overview. Climate. 2018; 6(3):73. https://0-doi-org.brum.beds.ac.uk/10.3390/cli6030073
Chicago/Turabian StyleBigi, Velia, Alessandro Pezzoli, and Maurizio Rosso. 2018. "Past and Future Precipitation Trend Analysis for the City of Niamey (Niger): An Overview" Climate 6, no. 3: 73. https://0-doi-org.brum.beds.ac.uk/10.3390/cli6030073
Note that from the first issue of 2016, this journal uses article numbers instead of page numbers. See further details here.